biosensors and bioelectronics - kaistmintlab1.kaist.ac.kr/paper/(90).pdf · 2019-11-28 ·...
TRANSCRIPT
Biosensors and Bioelectronics 148 (2020) 111822
Available online 24 October 20190956-5663/© 2019 Elsevier B.V. All rights reserved.
Biopsy needle integrated with multi-modal physical/chemical sensor array
Jaeho Park a, Yongrok Jeong a, Jayoung Kim b, Jimin Gu a, Joseph Wang b, Inkyu Park a,c,*
a Department of Mechanical Engineering, Korea Advanced Institute of Science and Technology (KAIST), Daejeon, 34141, South Korea b Department of NanoEngineering, University of California, San Diego, La Jolla, CA, 92093, United States c KI for NanoCentury & Mobile Sensor and IT Convergence (MOSAIC) Center, Korea Advanced Institute of Science and Technology (KAIST), Daejeon, 34141, South Korea
A R T I C L E I N F O
Keywords: Biopsy Real-time cancer discrimination Electrical conductivity sensor pH sensor Glucose sensor
A B S T R A C T
A biopsy needle integrated with a multi-modal physical/chemical sensor array for electrical conductivity, pH, and glucose concentration measurement was developed. A flexible device with an electrical conductivity sensor, a pH sensor, and a glucose sensor was fabricated on a flexible polyimide substrate with thickness less than 20 μm. Then, the sensor was directly integrated onto the surface of biopsy needle by attaching with a pressure sensitive adhesive. The performance factors of the sensor were examined, showing that it could properly measure the parameters in the ranges of human body conditions (conductivity ¼ 0.0265 S/m - 1.027 S/m, pH ¼ 6.6–7.4, and glucose concentration ¼ 2 mM–13 mM). The capabilities of dual-modal and multi-modal sensing were demon-strated by tests with a liver cancer mimicking hydrogel phantom, a solution sample, and porcine liver tissue with exchanged parameters by perfusion of the phosphate buffer saline. Based on these results, we expect that the biopsy needle integrated with the multi-modal sensor array could help to increase the accuracy of the image- guided biopsy process by providing the information of tissue types at the needle tip.
1. Introduction
When there is a suspicious lesion inside a patient, a definite diagnosis is given to the patient after histological assessment with a small amount of extracted specimen of a suspicious lesion. The medical procedure to extract the tissue specimen from the patient’s body is called as a biopsy. In order to minimize an incision to the patient during the biopsy, a needle-like medical tool is utilized, which is known as a biopsy needle. The most important factor in the biopsy is accurate positioning of the biopsy needle because the tissue for histological assessment is collected right in front of the tip of biopsy needle. Therefore, in order to obtain an appropriate tissue specimen, the tip of the biopsy needle should be placed inside the suspicious lesion. Generally, the location of the inserted biopsy needle tip is monitored using conventional medical imaging tools such as ultrasound, computed tomography (CT), and magnetic resonance imaging (MRI). This process is known as the image- guided biopsy process as shown in Fig. 1(a) (Fass, 2008; O’Flynn et al., 2010; Yacoub et al., 2012). However, it occasionally occurs that the location of the suspicious lesion cannot be recognized or distinguished from normal tissue by the medical imaging tools. Therefore, there have been reports about the critical problems of inaccurate image-guided
biopsy process (see Fig. 1(b)) (Chesebro et al., 2017; Verma et al., 2017). One of the most representative examples is prostate cancer. In general, its tissue cannot be distinguished from normal tissue because it can be shown either hypoechoic or isoechoic in an ultrasound imaging depending on its tissue structures (Ellis and Brawer, 1994; Shinohara et al., 1989). Therefore, designated 12 points of the prostate are extracted for accurate histological assessment (Durkan and Greene, 2000; Yacoub et al., 2012).
There have been various reports about the meaningful difference of electrical conductivity between normal and cancerous tissue in the last decade, and the electrical conductivity has been extensively utilized as a way to discriminate cancer due to real-time measurement capability and simplicity of the sensor device (Heileman et al., 2013). The differences of electrical conductivity in breast cancer (da Silva et al., 2000; Guofeng Qiao et al., 2012; Heileman et al., 2013), liver cancer (Haemmerich et al., 2003; Laufer et al., 2010), lung cancer (Kimura et al., 1994), prostate cancer (Halter et al., 2009a, 2009b) and skin cancer (Aberg et al., 2004) have been reported and medical tools based on electrical conductivity for diagnosis of breast cancer, cervical cancer and skin cancer have been utilized in clinical applications.
This electrical characteristic of cancer tissues has been exploited to
* Corresponding author. Department of Mechanical Engineering, Korea Advanced Institute of Science and Technology (KAIST), Daejeon, 34141, South Korea E-mail address: [email protected] (I. Park).
Contents lists available at ScienceDirect
Biosensors and Bioelectronics
journal homepage: http://www.elsevier.com/locate/bios
https://doi.org/10.1016/j.bios.2019.111822 Received 9 August 2019; Received in revised form 16 October 2019; Accepted 23 October 2019

Biosensors and Bioelectronics 148 (2020) 111822
2
discriminate cancer tissues from normal tissues and to overcome the abovementioned limitation of conventional image-guided biopsy pro-cedure using a sensor integrated biopsy needle. (Delgado Alonso et al., 2018; Kalvøy et al., 2009; Kang et al., 2016; Kim et al., 2015; Li et al., 2007; Mishra et al., 2013, 2012; Park et al., 2018; Veal et al., 2014; Yun et al., 2016b, 2016a). However, the integration of sensors onto the bi-opsy needle is difficult due to the small dimensions of the needle (diameter � 1.2 mm). In Mishra et al.’s work, the body of biopsy needle was utilized as a sensor electrode itself and electrical conductivity of the tissue was measured (Mishra et al., 2013, 2012). However, they could use only a 2-electrode sensor configuration, which limited possible sensor types and caused a measurement error from electrode polariza-tion effect. As an alternative approach, the electrode was directly fabricated on the surface of biopsy needle using a conventional micro-fabrication technique (Kang et al., 2016; Yun et al., 2016b, 2016a), a direct patterning method (Kim et al., 2015), and attaching a conven-tional micro-scaled metal wires (Park et al., 2018) in order to measure an electrical conductivity of tissue during the biopsy procedure. How-ever, once sensor electrodes are fabricated on the surface of biopsy needle by the abovementioned method, the integration of additional functional layers for realizing a multiplexed sensor array is extremely difficult due to a small radius of curvature of the needle and limitation of alignment.
In addition to electrical conductivity, differences of pH and glucose concentration between cancer and normal tissues, which originates from the intrinsic metabolism process of cancer, have been reported. In can-cer, most of the glucose molecules are metabolized into lactate mole-cules regardless of oxygen saturation in a micro-environment of cancer, which acidifies the micro-environment of cancer. This phenomenon commonly occurs for all types of cancers and is generally known as Warburg effect and the pH of cancerous tissue is usually smaller than that of normal tissue by pH 0.4–1.0 (Heiden et al., 2009; Helmlinger et al., 1997; Kato et al., 2013; Liberti and Locasale, 2016). Furthermore, an uptake rate of glucose in the cancer tissue is abnormally faster than that of normal tissue. Therefore, it has been reported that the glucose concentration in the micro-environment of cancer tissues ([Glucose]<1.2 mM) is lower than that of normal tissues ([Glucose] � 1.5–3.3 mM) (Walenta et al., 2003). However, there have been no reports about the biopsy needles integrated with pH and glucose sensors for cancer tissue discrimination.
In this paper, we report a biopsy needle integrated with a novel
multi-modal physical/chemical sensor array for electrical conductivity, pH, and glucose concentration measurement as shown in Fig. 1(c). In order to integrate the sensor onto the surface of the small diameter bi-opsy needle with a conformal contact, a flexible sensor with a thickness of less than 20 μm was fabricated using conventional microfabrication techniques and direct patterning of abovementioned sensors onto a polyimide substrate. The fabricated flexible sensor was then mounted on the surface of the biopsy needle using a pressure sensitive adhesive (PSA). This fabrication process allows for the facile fabrication of miniaturized and multiplexed sensor arrays on a small diameter biopsy needle. Because the sensor is ultra-thin, the increase of the diameter of the biopsy needle and tissue damage during needle insertion can be minimized. In this paper, we specifically aimed at the measurement of electrical conductivity, pH, and glucose concentration, which were especially used as indicators for cancer discrimination. The usefulness of the biopsy needle integrated with multi-modal physical/chemical sensor array was verified by experiments on solutions, phantom, and a porcine liver samples that mimic the physiological conditions of cancerous and normal tissues.
2. Material and methods
2.1. Fabrication of biosensor electrodes on flexible polymer substrate
The fabrication process of a multi-modal physical/chemical sensor array is shown in Fig. 2(a) (See the schematic of the fabrication process in Fig. S1 in the Supplementary Information). The electrodes were fabricated on a polyimide (PI) substrate using conventional micro-fabrication process including photolithography, electron beam (e-beam) evaporation, and lift-off process. For handling of a flexible substrate during the fabrication process, a 6-inch silicon wafer was used as a handling substrate. First, a PI film was formed on a silicon wafer by spin- coating of PI varnish (PI-1388, VTEC, USA) at 2000 revolutions per minute (rpm) for 30 s, followed by thermal curing in a convection oven at 150 �C for 30 mins and 250 �C for 3 h, sequentially. Then, titanium and gold (Ti/Au) patterns (thickness of Ti/Au ¼ 30 nm/200 nm) were fabricated by photolithography, e-beam evaporation, and lift-off process on the PI substrate as sensor electrodes for the pH and glucose sensors. Then, the second PI layer was fabricated by spin-coating of PI varnish at 3000 rpm for 30 s for electrical insulation. In this process, a Kapton® tape (Dupont, USA) was attached on both edges of electrodes to open the
Fig. 1. A biopsy needle integrated with a multi-modal physical/chemical sensor array as a method to improve the positioning accuracy of the conventional image- guided biopsy procedure: (a) basic method to confirm the position of the biopsy needle tip; (b) potential problem during conventional image-guided biopsy pro-cedure: (i) correctly positioned biopsy needle to extract the tissue of suspicious lesion; (ii) incorrectly positioned biopsy needle due to lack of image contrast between normal tissue and suspicious lesion or limited spatial resolution of medical imaging tools; (c) biopsy needle integrated with multi-modal sensor array for accurate biopsy procedure: schematic images of (i) the biopsy needle with a physical/chemical sensor array including electrical conductivity, pH and glucose sensors and (ii) the biopsy with real-time tissue characterization by multi-modal physical/chemical sensor array for accurate needle positioning.
J. Park et al.
Biosensors and Bioelectronics 148 (2020) 111822
3
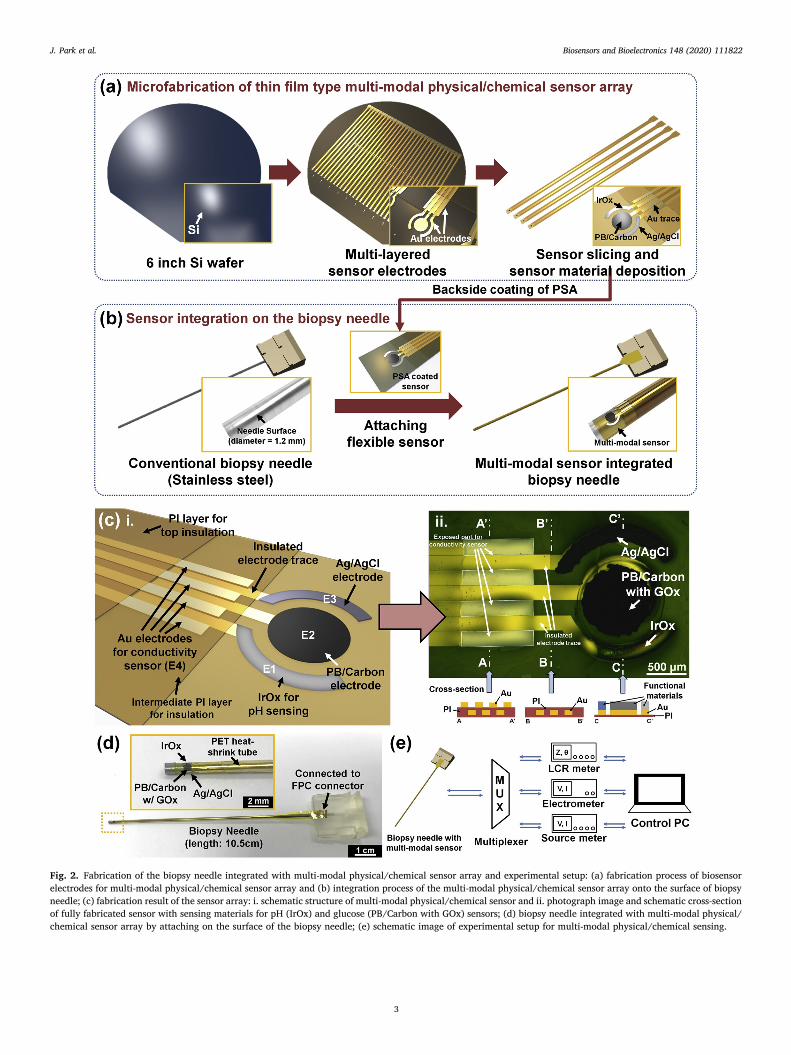
Fig. 2. Fabrication of the biopsy needle integrated with multi-modal physical/chemical sensor array and experimental setup: (a) fabrication process of biosensor electrodes for multi-modal physical/chemical sensor array and (b) integration process of the multi-modal physical/chemical sensor array onto the surface of biopsy needle; (c) fabrication result of the sensor array: i. schematic structure of multi-modal physical/chemical sensor and ii. photograph image and schematic cross-section of fully fabricated sensor with sensing materials for pH (IrOx) and glucose (PB/Carbon with GOx) sensors; (d) biopsy needle integrated with multi-modal physical/ chemical sensor array by attaching on the surface of the biopsy needle; (e) schematic image of experimental setup for multi-modal physical/chemical sensing.
J. Park et al.

Biosensors and Bioelectronics 148 (2020) 111822
4
sensing areas and contact pads. Afterward, another Ti/Au (thickness of Ti/Au ¼ 30 nm/200 nm) electrodes for electrical conductivity sensing were fabricated by the abovementioned method. Finally, a top PI insu-lation layer was fabricated by spin-coating the PI varnish at 3000 rpm for 30 s while Kapton® tape was used again to mask both edges of electrodes. An electrode (E1 in Fig. 2(c–i)) below the circular electrode (E2) was used as a working electrode for pH sensing, and an electrode (E3) above E2 was used as a reference electrode both for pH and glucose sensing. A circular electrode (E2) was utilized as a working electrode for glucose sensing.
2.2. Deposition process of functional layers for pH and glucose sensing on the electrodes
In order to fabricate the pH sensor, an iridium oxide (IrOx) was used as a functional layer since it shows biocompatibility, high sensitivity to proton (Hþ) ions, and excellent stability to a broad range of pH in liquid environments (Huang et al., 2011; Kakooei et al., 2013). An IrOx layer was deposited on the electrode E1 using the electrodeposition method. K. Yamanaka’s work was utilized for the preparation of the solution for the IrOx electrodeposition (Yamanaka, 1989). First, 45 mg of iridium chloride hydrate (IrCl4⋅H2O, Sigma Aldrich, USA) was dissolved into deionized water (DI) and the solution was stirred for 30 mins. Second, 300 μl of hydrogen peroxide solution (H2O2, J. T. Baker, USA) with a concentration of 30 wt% was added into the solution, followed by stir-ring for 10 mins. Then, 150 mg of oxalic acid ((COOH)2⋅2H2O) was added and stirred again for 10 mins. Finally, the pH of the stirred so-lution was tightly adjusted to 10.5 using a commercial pH meter (PHB-550R, Omega, USA). The electrodeposition solution was left in a dark space for at least 2 days for stabilization. After immersing the sensor electrodes inside the electrodeposition solution, 100 cycles of cyclic voltammetry with a voltage range of � 0.8 V–0.7 V with respect to the silver/silver chloride (Ag/AgCl) reference electrode were performed using a commercial electrochemical analyzer (CHI-6016D, CH Instru-ment, USA) with a scan rate of 100 mV/s. As a counter electrode, a platinized electrode was used. As a consequence, a dark blue layer of IrOx was formed on the electrodeposited sensor electrodes (See E1 electrode in Fig. 2(c-ii)).
For the fabrication of additional materials for electrochemical sensing, a screen printing was utilized. Patterns for screen printing were designed in AutoCAD® (Autodesk, USA) and transferred to stainless steel mesh stencil supported by a steel frame (30 cm � 30 cm) (Daeshin Smartech, Korea). As a reference electrode, an Ag/AgCl electrode was fabricated on the electrode E3 using screen printing of a commercial Ag/ AgCl paste (C2130102D1, Gwent Group, UK). The screen-printed Ag/ AgCl electrode was thermally cured in a convection oven at 120 �C for 10 mins. For the fabrication of glucose sensor, a glucose oxidase based glucose sensor was used because of its exceptional selectivity. First, a carbon electrode mediated with a Prussian blue (PB/Carbon), which catalyzes electrochemical redox reaction of hydrogen peroxide, was fabricated on the electrode E2 using screen printing of a carbon paste mediated with a Prussian blue (C2070424P2, Gwent Group, UK). The screen-printed PB/Carbon electrode was thermally cured in a convec-tion oven at 60 �C for 20 mins. The diameter of the working electrode was about 1 mm. In order to deposit a glucose oxidase (GOx) on the working electrode, a GOx solution was prepared. First, 8 mg of GOx powder (Sigma Aldrich, USA) was dissolved in the 200 μl of 0.1 M and pH 7.4 potassium phosphate buffer solution (PBS) in a reaction tube. Then, 2 mg of bovine serum albumin (BSA, Sigma Aldrich, USA) was dissolved in the GOx solution. Afterward, 20 μl of 1 wt% glutaraldehyde solution was mixed with GOx solution right before drop-casting of GOx solution and 0.2 μl of GOx solution was drop-casted on the working electrode. Because the area of the working electrode is too small to drop- cast, local O2 plasma treatment (power ¼ 80 W, duration ¼ 1 min) was performed before drop-casting of GOx solution. In order to make only the PB/Carbon electrode hydrophilic, a polydimethylsiloxane (PDMS)
block with a hole of 1 mm diameter was used for masking the unwanted area. The fabricated sensor was stored in a refrigerator at 4 �C for drying the GOx solution for at least 4 h. Finally, after drying the GOx solution, 0.2 μl of 1 wt% Nafion® solution (Sigma Aldrich, USA) was drop-casted on the PB/Carbon electrode with GOx in order to fix the deposited GOx. The photo of a fully fabricated multi-modal sensor is shown in Fig. 2(c-ii) and sensing materials including electrodeposited IrOx, screen printed PB/Carbon and Ag/AgCl were clearly fabricated on the flexible sensor electrodes.
2.3. Integration of multi-modal physical/chemical sensor array onto biopsy needle
The fabricated multi-modal physical/chemical sensor array was then integrated onto the surface of the biopsy needle as shown in Fig. 2(d). A biopsy needle made of stainless steel 316L with an outer diameter of 1.2 mm, which corresponds to the 18 gauge needle, and length of 10.5 cm (RF Medical, Korea) was prepared. In order to integrate the biosensor, a pressure sensitive adhesive (PSA, MD-7, Dow Corning, USA) was coated on the backside of the sliced biosensor. Because of the sticky nature of PSA, the sensor can be directly attached to the surface of the biopsy needle. Since further electrical insulation and sensor fixation was needed, a heat-shrink tube made of polyethylene terephthalate (PET) was used as an insulating layer. The biopsy needle was inserted into a PET heat-shrink tube (Nordson Medical, USA) and thermal treatment was performed with a heat gun at 150 �C to shrink the heat-shrink tube. The fabricated biopsy needle integrated with a multi-modal sensor array is displayed in Fig. 3(d).
2.4. Sample preparation
2.4.1. Solution sample for sensor characterization and multi-modal sensing experiment
A sodium chloride (NaCl) solution, potassium phosphate buffer so-lution (PBS), and glucose solution were prepared for the characteriza-tion of electrical conductivity, pH, and glucose sensors, respectively. The concentration of each analyte was prepared to match the possible physiological conditions of the human body. As a solution sample for the electrical conductivity sensor, the NaCl (7548-4400, Daejung Chemical & Metals, Korea) was solved in DI water. The conductivities measured by a commercial conductivity meter (Orion™ Star A212, Thermo Fisher Scientific Inc., USA) of solutions were 0.0265 S/m, 0.0660 S/m, 0.1564 S/m, 0.3989 S/m, and 1.027 S/m. As a solution sample for the pH sensor, PBS (0.1 M) was used and pH was adjusted by changing a molar ratio between monopotassium phosphate (KH2PO4, Sigma Aldrich, USA) and dipotassium phosphate (K2HPO4, Sigma Aldrich, USA). The pH of PBS was controlled from 6.6 to 7.4, which is a possible concentration range in both cancerous and normal tissues (Helmlinger et al., 1997). As a solution sample for the characterization of the glucose sensor, a D-(þ)-glucose (Sigma Aldrich, USA) was dissolved in DI water. The concentration of glucose solution was controlled from 2 mM to 13 mM, which can fully cover possible glucose concentration in normal human body environment (normal blood glucose concentration 5–7.75 mM, glucose concentration in tissue < 4 mM) (Makaram et al., 2014; Walenta et al., 2003).
Three types of solution samples were prepared for a multi-modal sensing experiment, which are called as a base solution, a glucose so-lution, and a pH/conductivity solution, respectively. The base solution was 0.1 M PBS with pH ¼ 7.4 and the glucose concentration of 2 mM. Glucose solution was prepared by 0.1 M PBS with pH ¼ 7.4 and the glucose concentration of 100 mM. Finally, the pH/conductivity solution was prepared by making 0.4 M of KH2PO4 solution to change the ratio between KH2PO4 and K2HPO4 and to decrease the electrical conduc-tivity of the solution.
J. Park et al.

Biosensors and Bioelectronics 148 (2020) 111822
5
2.4.2. Preparation of liver cancer mimicking hydrogel phantom For a experiment of dual-modal measurement with pH and electrical
conductivity sensor, liver cancer mimicking hydrogel phantom based on agarose gel was used. First, two PBS were prepared – one solution with pH of 7.4 and conductivity of 0.056 S/m to mimic normal liver tissue, and another solution with pH of 6.9 and conductivity of 0.213 S/m to mimic cancerous liver tissue (Gabriel et al., 1996; Laufer et al., 2010). In the case of inner core mimicking liver cancer, several drops of com-mercial red ink were added into the solution to make visually distin-guishable (see Fig. 5(a)). Then, 1 wt% of agarose powder was added to the solution and solutions were heated up to 95 �C to dissolve the agarose powder completely. The heated solution for cancer mimicking hydrogel was then cooled down to room temperature for gelation. The gelated cancer mimicking hydrogel was cut into a cube with a dimension of 1.5 cm � 1.5 cm x 1.5 cm and wrapped with Parafilm® (Bemis, USA) in order to avoid an ion leakage from the inner core to the outer matrix. Then, hydrogel solution for mimicking normal liver tissue was poured into a separate vial with prepared cancer mimicking hydrogel cube hung in the center. The poured hydrogel solution was cooled down to room temperature for its gelation.
2.4.3. Preparation of porcine liver with exchanged physical/chemical parameters through perfusion
For the experiment of multi-modal measurement in a real biological tissue sample, a porcine liver with internally exchanged physical/ chemical parameters was utilized. It was prepared by the perfusion of phosphate buffer saline (PBS) solution through the blood vessels of the porcine liver. (See Fig. S2 in Supplementary Information for graphical information of the sample preparation step). The porcine liver for table use was utilized for sample preparation within 2 h after slaughter. First, cannularization to blood vessels was performed for perfusion. Then, tap
water was perfused through the cannula and blood vessel for 2 h to wash blood inside the porcine liver tissue and perfusion with PBS solution followed for 1 h to change parameters inside the liver tissue. For making normal liver mimicking part, PBS with the same salinity, pH, and glucose concentration of human blood (σ ¼ 1.82 S/m, pH ¼ 7.4, and glucose concentration ¼ 5 mM) was perfused while higher salinity (σ ¼ 3.24 S/m, 1.78 times higher), acidic pH (pH ¼ 6.83, pH lower by 0.6), and lower glucose concentration (glucose concentration ¼ 2 mM, 2.5 times lower) was perfused in order to make cancer mimicking part according to previously reported parameter differences between normal and cancerous tissues (Gabriel et al., 1996; Helmlinger et al., 1997; Laufer et al., 2010; Makaram et al., 2014; Walenta et al., 2003).
2.4.4. Experimental setup As illustrated in Fig. 2(e), in order to measure the electrical con-
ductivity, pH and glucose concentration, an LCR meter (ZM2410, NF Corp., Japan), electrometer (6517, Keithley, USA) and source meter (2400, Keithley, USA) were utilized, respectively. However, when per-formances of the pH and glucose sensors were evaluated, a commercial electrochemical analyzer (CHI 6016D, CH Instrument, USA) was uti-lized. When dual-modal or multi-modal measurement was carried out, a multiplexer (34904a, 34970a, Keysight, USA) was connected between the sensor and the measurement equipment in order to switch the electrical connection. In multi-modal physical/chemical sensing, the conductivity and pH were measured for 30 s which was followed by glucose measurement for 30 s.
Fig. 3. Characterization of electrical conductivity sensor: (a) schematic image of used electrodes for electrical conductivity measurement and its measurement principle; (b) measured conductance of the saline solution with conductivities from 0.0265 S/m to 1.027 S/m and calibrated conductivities using a cell constant that is a function of the measurement frequency and conductivity of medium; (c) relative error between calibrated conductivity and true conductivity of the saline solutions; (d) cell constant as a function of measurement frequency and conductivity of sample, which verifies the reproducibility between samples (number of samples ¼ 5).
J. Park et al.

Biosensors and Bioelectronics 148 (2020) 111822
6
Fig. 4. Characterization of the iridium oxide (IrOx) based pH sensor and the enzymatic glucose sensor: (a) schematic image of electrodes for pH sensor and measurement principle; (b) cyclic voltammogram of the 1st, 10th, 20th, 50th and 100th cycles during electrodeposition process of IrOx; (c) measured potential at IrOx electrode with respect to Ag/AgCl pseudo reference electrode in the potassium phosphate buffer solutions (PBS) with pH ¼ 6.6–7.4 before (red) and after (blue) electrochemical treatment of IrOx (number of samples ¼ 4); (d) successive measurement of potential at IrOx electrode with a step decrease from pH ¼ 7.4 to pH ¼ 6.6 by pH ¼ 0.2 (e) schematic image of electrode for glucose sensor and measurement principle; (f) amperometry result of glucose sensor for the glucose solution with concentrations of 2–13 mM and (inset) its linear behavior and sensitivity; (g) result of repeated measurements of the same glucose sensor (number of repeated measurement ¼ 3). (For interpretation of the references to color in this figure legend, the reader is referred to the Web version of this article.)
J. Park et al.

Biosensors and Bioelectronics 148 (2020) 111822
7
3. Results and discussion
3.1. Characterization of multi-modal physical/chemical sensor
3.1.1. Electrical conductivity sensor Electrical conductivity data obtained by the LCR meter or impedance
analyzer is not an intrinsic material property of the sample, but dependent on the dimension of the used probe. Therefore, measured conductivity values should be converted into the intrinsic material property. It can be assumed that the measured electrical conductivity is proportional to the intrinsic electrical property with a coefficient k, (cell constant). The admittance (Y), the reciprocal of impedance (Z), is described as below.
Y ¼ 1=Z ¼ Gþ jB ¼ k⋅σ þ jð2πf ⋅ k ⋅ ε0 ⋅ εrÞ (1)
where G, B, σ, j, f, ε0, εr are conductance, susceptance, conductivity, imaginary unit
ffiffiffiffiffiffiffi� 1p
, frequency, vacuum permittivity and relative permittivity, respectively. The cell constant is calculated by measuring the conductance of material with known conductivity. We utilized saline
solution based on NaCl because it can be regarded as a purely resistive component (Laufer et al., 2010).
The Fig. 3(a) shows a schematic image of the electrical conductivity measurement. Four Au electrodes were utilized for the 4-electrode based electrical conductivity measurement and connected to the LCR meter. The measured conductances of the saline solutions with conductivities from 0.0265 S/m to 1.027 S/m are shown in Fig. 3(b). In general, the measured conductance with the saline solution should be constant when the measurement frequency is less than 1 MHz (Laufer et al., 2010; Peyman et al., 2007). However, in our sensor, the measured conduc-tance varied in different measurement frequencies. This result can be attributed to the parasitic component in our sensor because of layered structures of electrodes with a distance of less than 5 μm and floating states of other electrodes during the electrical conductivity measure-ment. According to B. W. Veal et al., these parasitic components can significantly distort the electrical conductivity measurement especially in 4-electrode measurement because of the leakage current between the current injection port and the voltage measurement port in LCR meter or impedance analyzer (Veal et al., 2014). Therefore, the cell constant k is
Fig. 5. Dual-modal real-time measurement with electrical conductivity and pH sensors for tissue discrimination using liver cancer mimicking hydrogel phantom (a–b) and multi-modal measurement with electrical conductivity, pH, and glucose sensors for real-time measurement of changing parameters in the solution sample (c–d): (a) experimental image of prepared hydrogel phantom and the biopsy needle integrated with multi-modal sensor array: conductivities and pH are 0.056 S/m and pH ¼ 7.4 for normal liver mimicking, and 0.21 S/m and pH ¼ 6.9 for liver cancer mimicking hydrogels and respectively; (b) profiles of potential at IrOx and electrical conductivity during needle insertion into the hydrogel phantom; (c) experimental image of multi-modal measurement of changing parameters in the solution sample; (d) the measured conductivity of the electrical conductivity sensor, potential at IrOx of pH sensor and amperometric current of glucose sensor are presented in upper (red), middle (blue), lower (green) sections, respectively. After initial measurement (step I), amperometric current was successively measured with successive addition of 0.5 μL of glucose solution (step II). Then successive measurement of conductivity and pH were performed with successive addition of 2.50 μL of pH/conductivity solution (step III). The black numbers in graph describe the experimentally measured conductivity, pH, and estimated glucose by the molarity calculation. (For interpretation of the references to color in this figure legend, the reader is referred to the Web version of this article.)
J. Park et al.

Biosensors and Bioelectronics 148 (2020) 111822
8
dependent on the measurement frequency and the conductivity of the saline solution. The conductivities of unknown material were calculated by solving an non-linear equation with the relation between obtained cell constant function, measured conductance, and unknown conduc-tivity (See Fig. S3 in Supplementary Information for cell constant function at 100 kHz measurement frequency and more information about conductivity calculation). Using this method, measured conduc-tances of different saline solutions were converted into the conductivity as shown in Fig. 3(b). Finally, the measured conductivities of the saline solutions were almost identical to the actual conductivities with relative error less than �14% as shown in Fig. 3(c). The cell constants of different electrical conductivity sensors were found to be consistent from the measurement with five different sensor samples as shown in Fig. 3 (d). As explained above, the cell constants are influenced by the conductivity of the saline solution as well as the measurement frequency. Because of the difference between sensors during microfabrication and sensor integration process, cell constant curves were found to be slightly different between samples. However, the variation between different samples was found to be reasonably small with a maximum standard deviation of 5.8% of the average values, which shows that a newly fabricated conductivity sensor can be calibrated by pre-obtained cell constant curves.
3.1.2. IrOx based potentiometric pH sensor In the case of pH sensor to measure the possible physiological pH
range in both cancerous and normal tissues (pH ¼ 6.6–7.4) (Helmlinger et al., 1997), the electrodes with the IrOx and the Ag/AgCl layer coating were used as the working and pseudo-reference electrodes, respectively, as shown in Fig. 4(a). The voltammogram during the electrodeposition of the IrOx layer is shown in Fig. 4(b) and there are two clear redox peaks that ensure three different oxidation states of IrOx. (Hu et al., 2009; Petit and Plichon, 1998). The cross-section image of the electro-deposited IrOx layer on the Au electrode is shown in Fig. S4 and the average thickness of IrOx after 100 cycles of cyclic voltammetry was 45.0 nm with a standard deviation of 5.8 nm. However, due to different oxidation states of IrOx, the electrochemical potential of prepared samples is uncontrollable and varies between different samples. Ac-cording to S. Carroll et al.’s report (Carroll and Baldwin, 2010), the electrochemical potential of IrOx based pH sensor can be described by the following Nernst equations in both anhydrous and hydrated IrOx when the oxidation and reduction between Ir3þ and Ir4þ are considered, respectively:
E ¼ E0 � 2:3RT�
2Flog½Ir2O3��½IrO2�
2½Hþ�2
�for anhydrous
�(2)
E ¼ E0 � 2:3RT�
2Flog½Ir2O3��½IrO2�
2½Hþ�3
�for hydrated
�(3)
which reveals that not only the concentration of hydrogen ion (i.e. pH) but also the ratio between Ir3þ and Ir4þ could affect the sensitivity of IrOx based pH sensor. The measured average potential of IrOx based pH sensor with respect to the pseudo Ag/AgCl reference electrode and its standard deviation are depicted as red dots in Fig. 4(c). Because of the abovementioned effect of different oxidation states of the IrOx, the pH of the solution could not be distinguishable by measuring the potential because of its significant variation between pH sensor samples. Thus, an electrical potential of � 0.1 V was provided to the IrOx electrode in order to transform the mixed oxidation states of IrOx to a single oxidation state (Ir3þ) by an electrochemical treatment by following the method in Carroll et al.’s work (Carroll and Baldwin, 2010). The electrochemical treatment was completed within 30 s by observing that the redox current becomes almost negligible and unchanged as shown in Fig. S5. After the electrochemical treatment, the standard deviation of measured potential by four different IrOx electrodes in different pH solutions was signifi-cantly decreased as shown as blue dots in Fig. 4(c). The sensitivity of IrOx based pH sensor was calculated as � 69.3 mV/pH and R2 was 0.999.
The successive pH change with a step of pH ¼ 0.2 could be also moni-tored using the IrOx based pH sensor as shown in Fig. 4(d). Because the pH difference between normal and cancerous tissue is from 0.4 to 1.0 (Helmlinger et al., 1997; Song et al., 2007), fabricated IrOx based pH sensor can discriminate between normal and cancerous tissue during needle insertion.
3.1.3. Enzyme based amperometric glucose sensor For the enzyme-based amperometric glucose sensing to measure the
possible range of physiological glucose concentrations ([Glucose] ¼ 0–7.7 mM) (Makaram et al., 2014; Walenta et al., 2003), a PB/carbon with glucose oxidase, one of Au electrodes for the electrical conductivity sensor and the Ag/AgCl electrode were used as a working, counter, and reference electrode, respectively, as shown in Fig. 4(e). The glucose in the medium is oxidized into gluconolactone with the help of GOx, and hydrogen peroxide (H2O2) is generated as a by-product of the glucose oxidation. The generated H2O2 can be easily electrochemically reduced with the help of Prussian Blue, which is embedded in the carbon working electrode. More reduction current of H2O2 will be produced if the glucose concentration in the medium is higher because more H2O2 can be generated as a by-product. Therefore, under moderate applied potential (less than � 0.1 V with respect to Ag/AgCl reference electrode) to the working electrode, an amount of measured current due to elec-trochemical redox of H2O2can indicate the glucose concentration in the medium. The amperometry was performed for 30 s with a potential of � 0.1 V between the working and the pseudo reference electrodes, which was identified from the cyclic voltammetry in a PBS. The amperometry results for the glucose concentrations from 2 mM to 13 mM, which thoroughly covers the possible range for glucose concentration in human physiological conditions, is shown in Fig. 4(f). The glucose sensor shows an almost linear response to the concentration of glucose with a sensitivity of � 4.47 nA/mM with R2 ¼ 0.98. In order to verify that the enzyme was fully immobilized on the working electrode of a glucose sensor, successive measurement of glucose concentration was performed by three times. Before each measurement, the glucose sensor was thor-oughly rinsed with a PBS in order to remove the remaining glucose on the working electrode. As shown in Fig. 4(g), there was not a significant change in the sensitivity of glucose sensor between each measurement and the average sensitivity of glucose measurement was � 4.38 nA/mM with a standard deviation of 0.21 nA/mM. The reproducibility of glucose sensor was analyzed by comparing differences of sensitivity in three glucose sensor samples as shown in Fig. S6. Because the ampero-metric response of glucose sensor highly depends on the size of the screen-printed PB/carbon electrode and the amount of manually drop-casted GOx, absolute amperometric currents for the same glucose concentration were different for different samples. However, the sensi-tivities of different glucose sensors were almost similar (average sensi-tivity ¼ � 4.28 nA/mM and standard deviation ¼ 0.17 nA/mM), which verifies that the glucose sensor could be fabricated with sufficient reproducibility and could measure exact glucose concentration with the known sensitivity and further calibration process.
3.2. Multi-modal physical/chemical sensing application
3.2.1. Dual-modal measurement of pH and electrical conductivity in liver cancer mimicking hydrogel phantom
The dual-modal measurement by pH and electrical conductivity sensors was performed in order to verify the feasibility of real-time multi-modal physical/chemical sensing during the needle insertion process. An agarose hydrogel complex with normal liver tissue mimicking hydrogel (matrix hydrogel, σ ¼ 0.056 S/m and pH ¼ 7.4) and liver cancer mimicking hydrogel (core hydrogel, σ ¼ 0.21 S/m and pH ¼ 6.9) was used as a phantom for the dual-modal measurement as shown in Fig. 5(a). The biopsy needle integrated with multi-modal physical/chemical sensor array was inserted to the hydrogel phantom and the potential at IrOx and conductivity were measured as presented
J. Park et al.
Biosensors and Bioelectronics 148 (2020) 111822
9
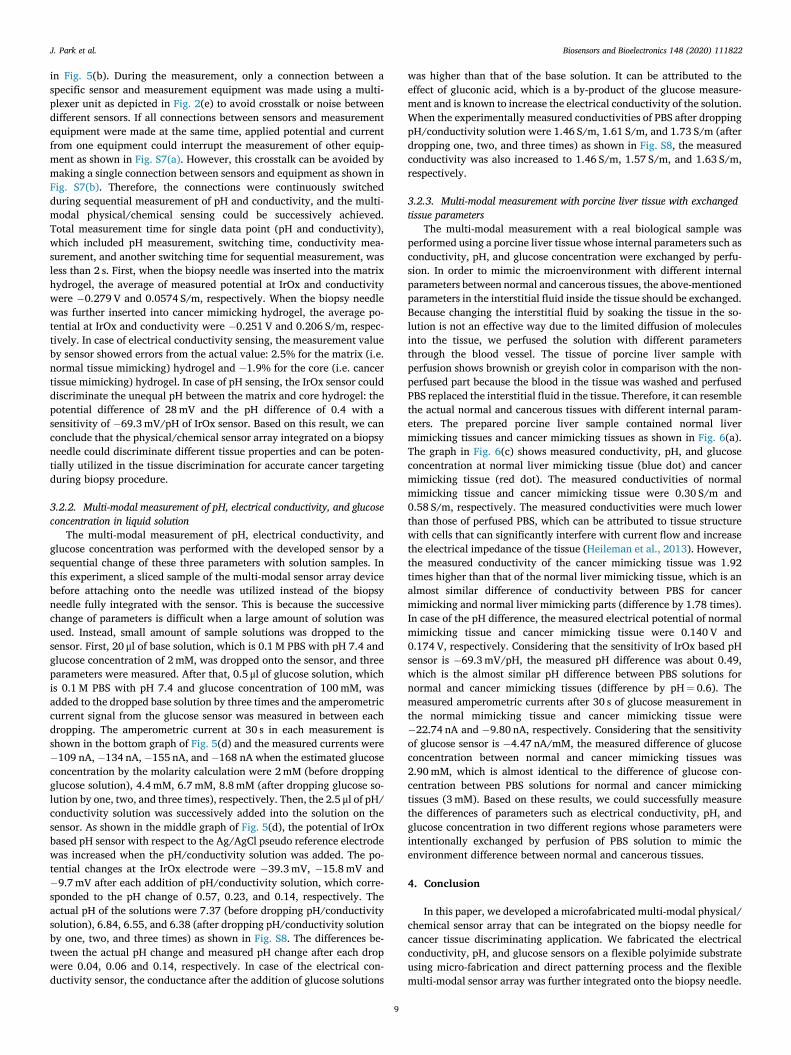
in Fig. 5(b). During the measurement, only a connection between a specific sensor and measurement equipment was made using a multi-plexer unit as depicted in Fig. 2(e) to avoid crosstalk or noise between different sensors. If all connections between sensors and measurement equipment were made at the same time, applied potential and current from one equipment could interrupt the measurement of other equip-ment as shown in Fig. S7(a). However, this crosstalk can be avoided by making a single connection between sensors and equipment as shown in Fig. S7(b). Therefore, the connections were continuously switched during sequential measurement of pH and conductivity, and the multi- modal physical/chemical sensing could be successively achieved. Total measurement time for single data point (pH and conductivity), which included pH measurement, switching time, conductivity mea-surement, and another switching time for sequential measurement, was less than 2 s. First, when the biopsy needle was inserted into the matrix hydrogel, the average of measured potential at IrOx and conductivity were � 0.279 V and 0.0574 S/m, respectively. When the biopsy needle was further inserted into cancer mimicking hydrogel, the average po-tential at IrOx and conductivity were � 0.251 V and 0.206 S/m, respec-tively. In case of electrical conductivity sensing, the measurement value by sensor showed errors from the actual value: 2.5% for the matrix (i.e. normal tissue mimicking) hydrogel and � 1.9% for the core (i.e. cancer tissue mimicking) hydrogel. In case of pH sensing, the IrOx sensor could discriminate the unequal pH between the matrix and core hydrogel: the potential difference of 28 mV and the pH difference of 0.4 with a sensitivity of � 69.3 mV/pH of IrOx sensor. Based on this result, we can conclude that the physical/chemical sensor array integrated on a biopsy needle could discriminate different tissue properties and can be poten-tially utilized in the tissue discrimination for accurate cancer targeting during biopsy procedure.
3.2.2. Multi-modal measurement of pH, electrical conductivity, and glucose concentration in liquid solution
The multi-modal measurement of pH, electrical conductivity, and glucose concentration was performed with the developed sensor by a sequential change of these three parameters with solution samples. In this experiment, a sliced sample of the multi-modal sensor array device before attaching onto the needle was utilized instead of the biopsy needle fully integrated with the sensor. This is because the successive change of parameters is difficult when a large amount of solution was used. Instead, small amount of sample solutions was dropped to the sensor. First, 20 μl of base solution, which is 0.1 M PBS with pH 7.4 and glucose concentration of 2 mM, was dropped onto the sensor, and three parameters were measured. After that, 0.5 μl of glucose solution, which is 0.1 M PBS with pH 7.4 and glucose concentration of 100 mM, was added to the dropped base solution by three times and the amperometric current signal from the glucose sensor was measured in between each dropping. The amperometric current at 30 s in each measurement is shown in the bottom graph of Fig. 5(d) and the measured currents were � 109 nA, � 134 nA, � 155 nA, and � 168 nA when the estimated glucose concentration by the molarity calculation were 2 mM (before dropping glucose solution), 4.4 mM, 6.7 mM, 8.8 mM (after dropping glucose so-lution by one, two, and three times), respectively. Then, the 2.5 μl of pH/ conductivity solution was successively added into the solution on the sensor. As shown in the middle graph of Fig. 5(d), the potential of IrOx based pH sensor with respect to the Ag/AgCl pseudo reference electrode was increased when the pH/conductivity solution was added. The po-tential changes at the IrOx electrode were � 39.3 mV, � 15.8 mV and � 9.7 mV after each addition of pH/conductivity solution, which corre-sponded to the pH change of 0.57, 0.23, and 0.14, respectively. The actual pH of the solutions were 7.37 (before dropping pH/conductivity solution), 6.84, 6.55, and 6.38 (after dropping pH/conductivity solution by one, two, and three times) as shown in Fig. S8. The differences be-tween the actual pH change and measured pH change after each drop were 0.04, 0.06 and 0.14, respectively. In case of the electrical con-ductivity sensor, the conductance after the addition of glucose solutions
was higher than that of the base solution. It can be attributed to the effect of gluconic acid, which is a by-product of the glucose measure-ment and is known to increase the electrical conductivity of the solution. When the experimentally measured conductivities of PBS after dropping pH/conductivity solution were 1.46 S/m, 1.61 S/m, and 1.73 S/m (after dropping one, two, and three times) as shown in Fig. S8, the measured conductivity was also increased to 1.46 S/m, 1.57 S/m, and 1.63 S/m, respectively.
3.2.3. Multi-modal measurement with porcine liver tissue with exchanged tissue parameters
The multi-modal measurement with a real biological sample was performed using a porcine liver tissue whose internal parameters such as conductivity, pH, and glucose concentration were exchanged by perfu-sion. In order to mimic the microenvironment with different internal parameters between normal and cancerous tissues, the above-mentioned parameters in the interstitial fluid inside the tissue should be exchanged. Because changing the interstitial fluid by soaking the tissue in the so-lution is not an effective way due to the limited diffusion of molecules into the tissue, we perfused the solution with different parameters through the blood vessel. The tissue of porcine liver sample with perfusion shows brownish or greyish color in comparison with the non- perfused part because the blood in the tissue was washed and perfused PBS replaced the interstitial fluid in the tissue. Therefore, it can resemble the actual normal and cancerous tissues with different internal param-eters. The prepared porcine liver sample contained normal liver mimicking tissues and cancer mimicking tissues as shown in Fig. 6(a). The graph in Fig. 6(c) shows measured conductivity, pH, and glucose concentration at normal liver mimicking tissue (blue dot) and cancer mimicking tissue (red dot). The measured conductivities of normal mimicking tissue and cancer mimicking tissue were 0.30 S/m and 0.58 S/m, respectively. The measured conductivities were much lower than those of perfused PBS, which can be attributed to tissue structure with cells that can significantly interfere with current flow and increase the electrical impedance of the tissue (Heileman et al., 2013). However, the measured conductivity of the cancer mimicking tissue was 1.92 times higher than that of the normal liver mimicking tissue, which is an almost similar difference of conductivity between PBS for cancer mimicking and normal liver mimicking parts (difference by 1.78 times). In case of the pH difference, the measured electrical potential of normal mimicking tissue and cancer mimicking tissue were 0.140 V and 0.174 V, respectively. Considering that the sensitivity of IrOx based pH sensor is � 69.3 mV/pH, the measured pH difference was about 0.49, which is the almost similar pH difference between PBS solutions for normal and cancer mimicking tissues (difference by pH ¼ 0.6). The measured amperometric currents after 30 s of glucose measurement in the normal mimicking tissue and cancer mimicking tissue were � 22.74 nA and � 9.80 nA, respectively. Considering that the sensitivity of glucose sensor is � 4.47 nA/mM, the measured difference of glucose concentration between normal and cancer mimicking tissues was 2.90 mM, which is almost identical to the difference of glucose con-centration between PBS solutions for normal and cancer mimicking tissues (3 mM). Based on these results, we could successfully measure the differences of parameters such as electrical conductivity, pH, and glucose concentration in two different regions whose parameters were intentionally exchanged by perfusion of PBS solution to mimic the environment difference between normal and cancerous tissues.
4. Conclusion
In this paper, we developed a microfabricated multi-modal physical/ chemical sensor array that can be integrated on the biopsy needle for cancer tissue discriminating application. We fabricated the electrical conductivity, pH, and glucose sensors on a flexible polyimide substrate using micro-fabrication and direct patterning process and the flexible multi-modal sensor array was further integrated onto the biopsy needle.
J. Park et al.

Biosensors and Bioelectronics 148 (2020) 111822
10
We could successfully realize multi-modal physical/chemical sensing performance in physiological condition with the biopsy needle for the first time while previously developed sensor integrated biopsy needle has had only a single sensing capability due to a limited electrode configuration. The multi-modal chemical/physical measurement capa-bility of our sensor was verified by experiments with not only solution samples but also hydrogel-based phantoms and the porcine liver sample mimicking normal and cancer tissues, proving that our device can be potentially utilized to provide essential information about tissues during the image-guided biopsy procedure and to improve its accuracy. Moreover, we believe that other types of parameters such as mechanical properties, optical properties, and other biomarkers (protein, nucleic acid, oxidative stress biomarker, etc) can be further measured by inte-grating appropriate sensors on other medical tools like forceps, a scalpel, a fine needle, a catheter, etc. These sensor-integrated medical tools can provide important information about the type or status of tissue to a surgeon in real-time, which can greatly improve accuracy and safety during medical procedures.
Declaration of competing interest
The authors declare that they have no known competing financial interests or personal relationships that could have appeared to influence the work reported in this paper.
CRediT authorship contribution statement
Jaeho Park: Conceptualization, Methodology, Investigation, Writing - original draft, Visualization. Yongrok Jeong: Methodology, Investigation. Jayoung Kim: Methodology, Writing - review & editing, Visualization. Jimin Gu: Investigation, Resources. Joseph Wang:
Methodology, Writing - review & editing. Inkyu Park: Conceptualiza-tion, Writing - review & editing, Supervision, Project administration.
Acknowledgement
This research was supported by (1) Nano-Convergence Foundation (www.nanotech2020.org, project number: R201603110, project name: Flexible nanosensor integrated RF ablation system for in-vivo tissue pressure measurement) funded by the Ministry of Science and ICT (MSIT, Korea) & the Ministry of Trade, Industry and Energy (MOTIE, Korea) and (2) the National Research Foundation of Korea (NRF) Grant funded by the Ministry of Science and ICT (MSIT, Korea) (No. 2015R1A5A1037668).
Appendix A. Supplementary data
Supplementary data to this article can be found online at https://doi. org/10.1016/j.bios.2019.111822.
References
Aberg, P., Nicander, I., Hansson, J., Geladi, P., Holmgren, U., Ollmar, S., 2004. Skin cancer identification using multifrequency electrical impedance–a potential screening tool. IEEE Trans. Biomed. Eng. 51, 2097–2102. https://doi.org/10.1109/ TBME.2004.836523.
Carroll, S., Baldwin, R.P., 2010. Self-calibrating microfabricated iridium oxide pH electrode array for remote monitoring. Anal. Chem. 82, 878–885. https://doi.org/ 10.1021/ac9020374.
Chesebro, A.L., Chikarmane, S.A., Ritner, J.A., Birdwell, R.L., Giess, C.S., 2017. Troubleshooting to overcome technical challenges in image-guided breast biopsy. RadioGraphics 37, 705–718. https://doi.org/10.1148/rg.2017160117.
da Silva, J.E., de S�a, J.P., Jossinet, J., 2000. Classification of breast tissue by electrical impedance spectroscopy. Med. Biol. Eng. Comput. 38, 26–30.
Fig. 6. Multi-modal measurement of electrical conductivity, pH, and glucose concentration for the porcine liver sample whose internal parameters were exchanged by perfusion of phosphate buffer saline (PBS) solution: (a) photograph of prepared porcine liver sample with normal liver mimicking tissue and cancer mimicking tissue: For normal liver mimicking tissue, a PBS solution similar to the human blood (σ ¼ 1.82 S/m, pH ¼ 7.4, and glucose concentration ¼ 5 mM) was perfused through blood vessel. For cancer liver mimicking tissue, a PBS solution similar to cancer environment (σ ¼ 3.24 S/m, pH ¼ 6.83, and glucose concentration ¼ 2 mM) was perfused; (b) photograph of multi-modal physical/chemical measurement with the porcine liver sample; (c) graph of electrical conductivity, pH, and glucose concentration measurement: The measured values after 30 s were used for the comparison between normal and cancer mimicking tissues.
J. Park et al.

Biosensors and Bioelectronics 148 (2020) 111822
11
Delgado Alonso, J., Lieberman, R.A., DiCarmine, P.M., Berry, D., Guzman, N., Marpu, S. B., 2018. Integrated sensor biopsy device for real time tissue metabolism analysis 24. .
Durkan, G.C., Greene, D.R., 2000. Diagnostic dilemmas in detection of prostate cancer in patients undergoing transrectal ultrasound-guided needle biopsy of the prostate. Prostate Cancer Prostatic Dis. 3, 13–20. https://doi.org/10.1038/sj.pcan.4500398.
Ellis, W.J., Brawer, M.K., 1994. The significance of isoechoic prostatic carcinoma. J. Urol. 152, 2304–2307.
Fass, L., 2008. Imaging and cancer: a review. Mol. Oncol. 2, 115–152. https://doi.org/ 10.1016/j.molonc.2008.04.001.
Gabriel, C., Gabriel, S., Corthout, E., 1996. The dielectric properties of biological tissues: I. Literature survey. Phys. Med. Biol. 41, 2231–2249.
Haemmerich, D., Staelin, S.T., Tsai, J.Z., Tungjitkusolmun, S., Mahvi, D.M., Webster, J. G., 2003. In vivo electrical conductivity of hepatic tumours. Physiol. Meas. 24, 251–260.
Halter, R.J., Schned, A., Heaney, J., Hartov, A., Paulsen, K.D., 2009. Electrical properties of prostatic tissues: II. Spectral admittivity properties. J. Urol. 182, 1608–1613. https://doi.org/10.1016/j.juro.2009.06.013.
Halter, R.J., Schned, A., Heaney, J., Hartov, A., Paulsen, K.D., 2009. Electrical properties of prostatic tissues: I. Single frequency admittivity properties. J. Urol. 182, 1600–1607. https://doi.org/10.1016/j.juro.2009.06.007.
Heiden, M.G. Vander, Cantley, L.C., Thompson, C.B., Mammalian, P., Exhibit, C., Metabolism, A., 2009. Understanding the Warburg Effect : cell proliferation. Science 324, 1029. https://doi.org/10.1126/science.1160809 (80).
Heileman, K., Daoud, J., Tabrizian, M., 2013. Dielectric spectroscopy as a viable biosensing tool for cell and tissue characterization and analysis. Biosens. Bioelectron. 49, 348–359. https://doi.org/10.1016/j.bios.2013.04.017.
Helmlinger, G., Yuan, F., Dellian, M., Jain, R.K., 1997. Interstitial pH and pO 2 gradients in solid tumors in vivo: high-resolution measurements reveal a lack of correlation. Nat. Med. 3, 177–182. https://doi.org/10.1038/nm0297-177.
Hu, J., Abdelsalam, M., Bartlett, P., Cole, R., Sugawara, Y., Baumberg, J., Mahajan, S., Denuault, G., 2009. Electrodeposition of highly ordered macroporous iridium oxide through self-assembled colloidal templates. J. Mater. Chem. 19, 3855–3858. https:// doi.org/10.1039/b900279k.
Huang, W.D., Cao, H., Deb, S., Chiao, M., Chiao, J.C., 2011. A flexible pH sensor based on the iridium oxide sensing film. Sens. Actuators A Phys. 169, 1–11. https://doi.org/ 10.1016/j.sna.2011.05.016.
Kakooei, S., Ismail, C., Ari-Wahjoedi, B., 2013. An overview of pH sensors based on iridium oxide: fabrication and application. Int. J. Mater. Sci. Innov. 1, 62–72.
Kalvøy, H., Frich, L., Grimnes, S., Martinsen, O.G., Hol, P.K., Stubhaug, A., 2009. Impedance-based tissue discrimination for needle guidance. Physiol. Meas. 30, 129–140. https://doi.org/10.1088/0967-3334/30/2/002.
Kang, G., Yun, J., Cho, J.S., Yoon, J., Lee, J.H., 2016. Micro electrical impedance spectroscopy (μEIS) fabricated on the curved surface of a fine needle for biotissue discrimination. Electroanalysis 28, 733–741. https://doi.org/10.1002/ elan.201500591.
Kato, Y., Ozawa, S., Miyamoto, C., Maehata, Y., Suzuki, A., Maeda, T., Baba, Y., 2013. Acidic extracellular microenvironment and cancer. Cancer Cell Int. 13, 1. https:// doi.org/10.1186/1475-2867-13-89.
Kim, S., Park, J.-H., Kang, K., Park, C.-O., Park, I., 2015. Direct metal micropatterning on needle-type structures towards bioimpedance and chemical sensing applications. J. Micromech. Microeng. 25 https://doi.org/10.1088/0960-1317/25/1/015002.
Kimura, S., Morimoto, T., Uyama, T., Monden, Y., Kinouchi, Y., Iritani, T., 1994. Application of electrical impedance analysis for diagnosis of a pulmonary mass. Chest 105, 1679–1682.
Laufer, S., Ivorra, A., Reuter, V.E., Rubinsky, B., Solomon, S.B., 2010. Electrical impedance characterization of normal and cancerous human hepatic tissue. Physiol. Meas. 31, 995–1009. https://doi.org/10.1088/0967-3334/31/7/009.
Li, T., Gianchandani, R.Y., Gianchandani, Y.B., 2007. Micromachined bulk PZT tissue contrast sensor for fine needle aspiration biopsy. Lab Chip 7, 179–185. https://doi. org/10.1039/b611233a.
Liberti, M.V., Locasale, J.W., 2016. The Warburg effect: How does it benefit cancer cells? Trends Biochem. Sci. 41, 211–218. https://doi.org/10.1016/j.tibs.2015.12.001.
Makaram, P., Owens, D., Aceros, J., 2014. Trends in nanomaterial-based non-invasive diabetes sensing technologies. Diagnostics 4, 27–46. https://doi.org/10.3390/ diagnostics4020027.
Mishra, V., Bouayad, H., Schned, A., Hartov, A., Heaney, J., Halter, R.J., 2012. A real- time electrical impedance sensing biopsy needle. IEEE Trans. Biomed. Eng. 59, 3327–3336. https://doi.org/10.1109/TBME.2012.2213599.
Mishra, V., Schned, a R., Hartov, a, Heaney, J. a, Seigne, J., Halter, R.J., 2013. Electrical property sensing biopsy needle for prostate cancer detection. The Prostate 73, 1603–1613. https://doi.org/10.1002/pros.22695.
O’Flynn, E. a M., Wilson, a R.M., Michell, M.J., 2010. Image-guided breast biopsy: state- of-the-art. Clin. Radiol. 65, 259–270. https://doi.org/10.1016/j.crad.2010.01.008.
Park, J., Choi, W.-M., Kim, K., Jeong, W.-I., Seo, J.-B., Park, I., 2018. Biopsy needle integrated with electrical impedance sensing microelectrode array towards real-time needle guidance and tissue discrimination. Sci. Rep. 8 https://doi.org/10.1038/ s41598-017-18360-4.
Petit, M.A., Plichon, V., 1998. Anodic electrodeposition of iridium oxide films. J. Electroanal. Chem. 444, 247–252. https://doi.org/10.1016/S0022-0728(97) 00570-6.
Peyman, a, Gabriel, C., Grant, E.H., 2007. Complex permittivity of sodium chloride solutions at microwave frequencies. Bioelectromagnetics 28, 264–274. https://doi. org/10.1002/bem.20271.
Qiao, Guofeng, Wang, Wei, Duan, Wei, Fan, Zheng, Sinclair, a J., Chatwin, C.R., 2012. Bioimpedance analysis for the characterization of breast cancer cells in suspension. IEEE Trans. Biomed. Eng. 59, 2321–2329. https://doi.org/10.1109/ TBME.2012.2202904.
Shinohara, K., Scardino, P.T., Carter, S.S., Wheeler, T.M., 1989. Pathologic basis of the sonographic appearance of the normal and malignant prostate. Urol. Clin. N. Am. 16, 675–691.
Song, C.W., Griffin, R., Park, H.J., 2007. Influence of tumor pH on therapeutic response. Cancer Drug Resist. 21–42 https://doi.org/10.1007/978-1-59745-035-5_2.
Veal, B.W., Baldo, P.M., Paulikas, A.P., Eastman, J.A., 2014. Understanding artifacts in impedance spectroscopy. J. Electrochem. Soc. 162, H47–H57. https://doi.org/ 10.1149/2.0791501jes.
Verma, S., Choyke, P.L., Eberhardt, S.C., Oto, A., Tempany, C.M., Turkbey, B., Rosenkrantz, A.B., 2017. The current state of MR imaging–targeted biopsy techniques for detection of prostate cancer. Radiology 285, 343–356. https://doi. org/10.1148/radiol.2017161684.
Walenta, S., Chau, T. Van, Schroeder, T., Lehr, H.A., Kunz-Schughart, L.A., Fuerst, A., Mueller-Klieser, W., 2003. Metabolic classification of human rectal adenocarcinomas: a novel guideline for clinical oncologists? J. Cancer Res. Clin. Oncol. 129, 321–326. https://doi.org/10.1007/s00432-003-0450-x.
Yacoub, J.H., Verma, S., Moulton, J.S., Eggener, S., Oto, A., 2012. Imaging-guided Prostate Biopsy : Conventional and.
Yamanaka, K., 1989. Anodically electrodeposited iridium oxide films. Jpn. J. Appl. Phys. 28, 632–637.
Yun, J., Kang, G., Park, Y., Kim, H.W., Cha, J.J., Lee, J.H., 2016. Electrochemical impedance spectroscopy with interdigitated electrodes at the end of hypodermic needle for depth profiling of biotissues. Sens. Actuators B Chem. 237, 984–991. https://doi.org/10.1016/j.snb.2016.07.064.
Yun, J., Kim, H.W., Lee, J.H., 2016. Improvement of depth profiling into biotissues using micro electrical impedance spectroscopy on a needle with selective passivation. Sensors 16. https://doi.org/10.3390/s16122207.
J. Park et al.