biometry of detached emiliania huxleyi coccoliths along the … · of morphotype b/c. white scale...
TRANSCRIPT

MARINE ECOLOGY PROGRESS SERIESMar Ecol Prog Ser
Vol. 443: 1–17, 2011doi: 10.3354/meps09445
Published December 20
INTRODUCTION
The ubiquitous coccolithophorid Emiliania huxleyi(Lohmann) Hay et Mohler is one of the major oceaniccalcium carbonate (CaCO3) producers and exportersin the modern ocean, with an abundant fossil recordover the last 0.3 million yr (Baumann 2004). Cells ofE. huxleyi are composed of an inner organic-richcell covered by an exoskeleton of interlocking cal-cite scales termed coccoliths (Fig. 1A). These cocco -liths are produced within intracellular vesicles andexcreted to the outer surface of the cell to form thecoccosphere (Fig. 1B,C). The rate of formation of
© Inter-Research 2011 · www.int-res.com*Email: [email protected]
FEATURE ARTICLE
Biometry of detached Emiliania huxleyi coccolithsalong the Patagonian Shelf
Alex J. Poulton1,*, Jeremy R. Young2, Nicholas R. Bates3, William M. Balch4
1National Oceanography Centre, Waterfront Campus, Southampton SO14 3ZH, UK2University College London, Gower Street, London WC1E 6BT, UK
3Bermuda Institute of Ocean Sciences, St. George’s GE 01, Bermuda4Bigelow Laboratory for Ocean Sciences, 180 McKown Point Road, PO Box 475, West Boothbay Harbour, Maine 04575-0475, USA
ABSTRACT: The biometry (morphology, size) of coc-coliths of the coccolithophorid Emiliania huxleyi hasimplications for their calcite content and cellularrates of calcification. We investigated the biometry ofdetached coccoliths of E. huxleyi in surface watersduring the December 2008 ‘Coccolithophores of thePatagonian Shelf (COPAS’08)’ expedition. Two mor-photypes of E. huxleyi were abundant along theshelf, although with different distributions: Morpho-type A dominated waters on the shelf and at thenorthern end of the shelf, while Morphotype B/Cdominated offshore and within the main cocco -lithophore bloom. The 2 morphotypes had oppo -site relationships to environmental variables alongthe shelf: Morphotype B/C was abundant in cold(<10°C), nutrient-rich (>10 µmol nitrate kg−1) waterswith calcite saturation states of ~3.5, whereas Mor-photype A was abundant in warm (>10°C), nutrient-poor (0.1 to 10 µmol nitrate kg−1) waters with higher(>4.5) calcite saturation states. These findings sup-port previous suggestions that E. huxleyi morpho-types are distinct ecotypes. Furthermore, we suggestthat Morphotype B/C is a Southern Ocean ecotype.Measurements of coccolith distal shield length (totalrange: 1.8 to 4.4 µm) indicated considerable physio-logical and/or phenotypic variability along the shelfand within each morphotype. Conversion of distalshield length into estimates of coccolith calciteshowed that the E. huxleyi population was producingcoccoliths with low median calcite quotas (overallaverage ± SD, 0.015 ± 0.006 pmol C) relative to otherstudies of field populations.
KEY WORDS: Emiliania huxleyi · Calcification ·Patagonian Shelf · Coccoliths · Morphotypes ·COPAS’08
Resale or republication not permitted without written consent of the publisher
SEM of coccoliths and coccospheres of Emiliania hux leyiMorphotypes A (orange) and B/C (blue), which have differ-ent coccolith calcite contents.
Image: Helen Smith (NOC)
OPENPEN ACCESSCCESS

Mar Ecol Prog Ser 443: 1–17, 2011
coccoliths (i.e. rate of calcification) and the rate ofloss of coccoliths from the coccosphere (coccolithdetachment) are both linked to nutrient and lightavailability (Paasche 2001, Zondervan 2007, Mülleret al. 2008), with sharp increases in coccolith detach-ment rates during nutrient and light stress (Balchet al. 1993, Paasche 2001). In healthy, nutrient-
replete E. huxleyi cells, around 12 to 15 coccolithsform the coccosphere, with this number rising withnutrient depletion so that the cells become covered inmultiple layers of coccoliths (Balch et al. 1993).
Currently, several distinct morphotypes of Emilia-nia huxleyi are recognised (e.g. Young et al. 2003),with additional morphological variation occurringwithin each coccolith morphotype (Young 1994, Bat -vik et al. 1997, Paasche 1998, 2001, Hagino et al.2005, Triantaphyllou et al. 2010). The common mor-photypes are referred to as A (Fig. 1B), B, C and R(e.g. Young et al. 2003) or as distinct E. huxleyi vari-eties (var. huxleyi, var. pujosae, var. kleijniae; Medlinet al. 1996). E. huxleyi cocco liths are attributed to thedifferent morphotypes by their size, shape in profileand central area characteristics (Table 1; see alsoYoung et al. 2003). A fifth morphotype, B/C (Fig. 1C)is observed in the southern hemisphere (Cubillos etal. 2007, Holligan et al. 2010, Cook et al. 2011) andsubpolar waters (Hagino et al. 2005). It is similar tothe B and C morphotypes, but intermediate in sizebetween them (Table 1; see also Young et al. 2003,Hagino et al. 2005). Recently, Cook et al. (2011) pro-posed the B/C morphotype as the variety auroraeafter finding significant genetic and photosyntheticpigment differences between cultures of Morpho-types B/C and A.
Culture experiments have shown that uni-algalstrains do not change morphotype but do show sub-tler variation in aspects of coccolith morphology,especially size and degree of calcification (Young &Westbroek 1991). This morphological variation hasbeen linked to environmental factors, such as salinity(e.g. Paasche et al. 1996, Bollmann et al. 2009), tem-perature (Watabe & Wilbur 1966), temperature andphosphate (Satoh et al. 2009), or nutrient availability(e.g. Young & Westbroek 1991, Young 1994, Paasche1998). However, linking these observations to fieldpopulations is severely hampered by several fac -tors, including a requirement to know which mor-photype(s) is being studied, and there is consider-able intra-strain variability in physiological re sponsesto environmental drivers (e.g. Langer et al. 2009).Natural populations of Emiliania huxleyi are oftena mixture of morphotypes; hence, changes in, forexample, average coccolith size between pop ulationsmay result from changes within a morphotype, orfrom changes in the relative abundance of the different morphotypes. Thus, examining changes inmorphotype abundance in the context of hydro-graphic gradients is a priority for understandingthe factors that control E. huxleyi distribution in theglobal ocean.
2
Fig. 1. Emiliania huxleyi. SEM images of (A) a detached coccolith with distal shield length (DSL) and central area(CA) indicated, (B) coccospheres of Morphotype A, and (C)of Morphotype B/C. White scale bars in Panels A to C:
2 µm

Poulton et al.: Emiliana huxleyi coccolith biometrics
Considerable variability also exists in the calcitecontent of coccoliths of different coccolithophore spe-cies (Young & Ziveri 2000), which has importantimplications for their relative contribution to deep-sea CaCO3 fluxes (Baumann 2004, Ziveri et al. 2007).Such differences in size will also affect coccolith optical properties (Gordon & Du 2001, Gordon et al.2009). The morphotypes of Emiliania huxleyi alsohave different coccolith quotas (Young & Ziveri2000), although how these may equate to differencesin contributions to pelagic calcite production or ex -port is unclear. There are currently 2 main ap -proaches to analysing coccolith mass variations. Thecross-polarised light-microscopy-based technique ofBeaufort (2005) is based on the fact that at low retar-dation values (i.e. first-order greys) the brightness ofa crystal in a given orientation is a near-linear func-tion of its thickness and that coccoliths, since they aremicron-sized objects formed of calcite, produce retar-dations of this magnitude (Young 1993). The advan-tage of this technique is that it can produce measure-ments of the mass of individual coccoliths and, asimplemented by Beaufort et al. (2008), it can produceautomated measurements of both mass and length of100s of coccoliths in a relatively short time. Disad-vantages of the method include that it cannot dif -ferentiate morphotypes and that there are substan-tial errors in the size and mass estimates for eachspecimen.
The alternative Scanning Electron Microscopy(SEM)-based method makes accurate morpho metricmeasurements on electron micrographs. The advan-tage of this is that specimens can be identified tomorphotype level and that there are relatively smallerrors in the measurements (~0.1 to 0.2 µm). How-ever, it is not possible to measure coccolith thick-ness directly, and, hence, it is usually assumed thatthickness co-varies with length. This method wasdescribed in detail by Young & Ziveri (2000), who sug -gested that, for a given coccolith species or morpho-type, the mass of coccolith calcite can be estimated as:
Coccolith calcite (pmol C) = 2.7 × ks × L3 / 100 (1)
where 2.7 is the density of CaCO3 (pg µm3), ks is ashape constant for the different coccolith morpho -logies, L is a characteristic length, in microns, usuallythe distal shield length (DSL; see Fig. 2) (Young &Ziveri 2000) and 100 is the molecular weight of cal-cite. Coccolith shape constants (ks) are derived fromcross-section reconstructions incorporating a rangeof observations and microscopic measurements witha ±20% error associated with ks calculation (Young &Ziveri 2000). The SEM method is most appropriatewhen examining how morphotypes influence calciteproduction and standing stocks, as in the case in thepresent study.
For Emiliania huxleyi, a wide range of calcite con-tent values has been proposed from both, laboratoryand field studies (e.g. Holligan et al. 1993, see refer-ences in Young & Ziveri 2000, Beaufort 2005, Holli-gan et al. 2010). Taking the range of coccolith dimen-sions for each morphotype of E. huxleyi (from Younget al. 2003) and applying Eq. (1) gives a range of esti-mates for coccolith calcite content for the differentmorphotypes (Table 1). Importantly, the rate of indi-vidual coccolith production by an E. huxleyi cell willbe determined by both its cellular calcification rateand its coccolith calcite content: a cell calcifying at arate of 0.3 pmol C d−1 (average value from Poulton etal. 2010 in the Iceland Basin) would be able to pro-duce 12 coccoliths d−1 of Morphotype A (0.8 cocco -liths h−1, assuming a 16 h day) or 16 coccoliths d−1 ofMorphotype B/C (1 coccolith h−1), assuming mediancalcite contents from the values in Table 1. Clearly,coccolith calcite quotas may set the physiologicalboundaries for cellular calcification rates. However,few field studies have examined either cellular calci-fication rates or coccolith calcite content in the con-text of environmental factors for naturally occurringE. huxleyi populations.
Emiliania huxleyi forms large-scale blooms in sev-eral regions of the world ocean (Iglesias-Rodriguez et
3
Morphotype DSL CA morphology ks Calcite content (µm) (pmol C)
A 3−4 DSL elements robust, CA elements curved, DS larger than PS 0.020 0.015−0.035B 3.5−5 DSL elements delicate, CA elements irregular, PS often larger than DS 0.020 0.023−0.068B/C 2−4 DSL elements delicate, CA open or thin plate, PS similar to DS 0.015 0.011−0.026
Table 1. Emiliania huxleyi. Morphotype coccolith characteristics, including distal shield length (DSL), central area (CA) mor-phology, volume (ks) and calcite content per coccolith. The shape constant (ks) values for coccoliths of Morphotypes A and Bwere taken from Young & Ziveri (2000). The ks value for Morphotype B/C was taken from Young (unpubl. data). Information
summarised from Young et al. (2003), see also Hagino et al. (2005). DS: distal shield; PS: proximate shield

Mar Ecol Prog Ser 443: 1–17, 2011
al. 2002a), among which the Patagonian Shelf is oneof the most prominent and largest areas of regularblooms (Tyrrell & Merico 2004, Signorini et al. 2006,Garcia et al. 2011). The Patagonian Shelf is a com-plex hydrographic regime, where warm low-nutrientsubtropical waters from the north mix with cold high-nutrient waters from the Southern Ocean (Painter etal. 2010, Garcia et al. 2011). Hence, the PatagonianShelf is an ideal environment to examine variabilityin E. huxleyi morphotype abundance and coccolithcalcite content in the context of hydrographic vari-ability. Samples for examination of E. huxleyi bio -metry were collected as part of the December 2008United States-led multidisciplinary ‘Coccolitho phoresof the Patagonian Shelf’ (COPAS’08) expedition.During the COPAS’08 cruise a large bloom of E. hux-leyi (>10 × 103 coccoliths ml−1) was present along thesouthern portion of the shelf (Fig. 2, Table 2), withwaters elevated in calcite being carried north via thenorthern flow of the Falklands (Malvinas) current(Painter al. 2010). The bloom developed from north to
south, with the peak of the bloom being about 3 wkearlier to the north of the Falklands Plateau than tothe south (Painter et al. 2010).
MATERIALS AND METHODS
Sampling
Sampling was carried out onboard the RV ‘RogerRevelle’ (Cruise Knox22RR) which sailed from Mon-tevideo, Uruguay (4 December 2008) to Punta Are-nas, Chile (2 January 2009). The COPAS’08 cruisesampled 152 conductivity-temperature-depth (CTD)stations along the Patagonian Shelf, with samples forthe present study being collected from 25 pre-dawnproductivity (00:30 to 08:00 h GMT) CTD deploy-ments (Fig. 2A). Surface water samples (1 to 9 mdepth; ~50% incidental irradiance) were collectedduring deployment of a Seabird SBE 911 CTDequipped with 24 × 20 l Go-Flow Niskin bottles.
4
Fig. 2. (A) Cruise track and sampling stations; (B) the same superimposed on a monthly composite (December 2008) of MODIS-Aqua ocean color measurements, showing the merged 2-band/3-band calcite product. Color bar shown at top for calcite con-centration. Two sets of sampling stations were at or near the same position: Stns 060, 094 and 102 (not shown for clarity); and
Stns 078 and 090. Stn 128, after Stn 122, is close to the Falkland Islands and not labelled for clarity

Poulton et al.: Emiliana huxleyi coccolith biometrics
Water samples (0.2 to 1 l) were collected in 2 lblacked-out polycarbonate bottles and filtered through25 mm diameter 0.2 µm polycarbonate filters underlow vacuum. Filters were oven dried (40 to 50°C, 6 to8 h) and stored on petri-slides until SEM analysis.
SEM analysis
A small portion (~0.5 × 0.5 cm) of the filter was cutfrom the centre, mounted on an aluminium stub andcoated in ~2 nm gold. A Leo 1450VP SEM (CarlZeiss) with SmartSEM (V5.1) software was then usedto automatically capture images of consecutive fieldsof view (FOV) from a 15 × 15 FOV grid at a magnifi-cation of ×5000, providing 225 images for analysis ofthe abundance of coccolithophores and detachedcoccoliths, and coccolith morphometrics. Either all225 FOV or 300 coccospheres and 300 coccoliths(whichever was arrived at first) were counted per fil-ter, with a minimum of 30 FOV for coccospheres and10 FOV for detached coccoliths when these wereabundant. The number of FOVs counted was used to
calculate the area of the filter covered (the size of1 FOV was 4.054 × 10⁻³ mm2). Coccospheres anddetached coccoliths were identified to species and/ormorphotype following Young et al. (2003), and theabundance (ml−1) was calculated as C × (F/A) / V,where C is total number counted, A is the area inves-tigated (mm2), F is the total filter area (mm2) and Vis the volume filtered (ml).
Coccolith measurements
Detached coccoliths (n = 50 per sample) of Emilianiahuxleyi in distal shield view were classified into mor-photypes based on distal shield length (DSL; Fig. 1A)and central area (CA) morphology in accordance withthe criteria found in Young et al. (2003) and which aresummarised in Table 1. DSL was measured on theSEM images using the image processing software Image-J (http://rsbweb.nih.gov/ij/), after scale cali-bration using a 10 µm scale bar pre-set on each SEMimage. DSL was converted to coccolith calcite contentusing Eq. (1) in the present study (Young & Ziveri
5
Station Latitude Longitude Depth Coccosphere Emiliania huxleyi Dominant Hydrographic Relative (°S) (°W) (m) abundance coccoliths species province to ‘bloom’
(×103 ml−1) (×103 ml−1) waters
005 38.07 54.03 1 0.01 0.03 Syracosphaera delicata SW N008 38.46 52.38 9 0.06 0.4 Diverse BC N010 39.23 51.24 1 0.13 0.2 Umbellosphaera tenuis T N014 41.32 55.10 1 0.09 0.2 Syracosphaera marginaporata T N017 43.22 58.27 1 0.20 4.0 Emiliania huxleyi NFC O020 45.00 61.29 3 0.05 1.1 S. marginaporata SW N025 45.00 58.43 1 0.41 13.0 E. huxleyi NFC C032 46.15 57.00 1 0.19 2.3 E. huxleyi, diverse NFC O040 46.15 61.29 3 0.01 0.7 Diverse ASW N047 47.29 60.13 1 0.45 23.4 E. huxleyi ASW C052 47.30 57.00 1 0.18 1.8 E. huxleyi, diverse NFC O060 48.45 59.09 3 0.80 14.8 E. huxleyi NFC C068 49.38 62.47 1 0.79 19.7 E. huxleyi SW C072 49.45 60.28 2 0.11 2.8 E. huxleyi ASW O078 49.45 57.12 1 3.06 39.8 E. huxleyi ASW C086 50.58 54.46 1 0.13 7.5 E. huxleyi SFC O090 49.45 57.39 1 1.38 33.9 E. huxleyi ASW C094 48.45 59.09 3 0.36 19.4 E. huxleyi NFC C102 48.45 59.14 3 0.32 14.8 E. huxleyi NFC C108 50.22 56.13 4 0.38 23.1 E. huxleyi NFC C116 51.58 57.37 3 0.48 14.5 E. huxleyi ASW C122 55.24 55.20 3 0.16 8.5 E. huxleyi SFC O128 52.23 58.19 3 0.17 12.5 E. huxleyi ASW C134 54.06 58.18 1 0.58 20.6 E. huxleyi SFC C142 52.36 60.17 2 0.25 6.9 E. huxleyi ASW O
Table 2. Summary of sampling stations and characteristics of the coccolithophore community from the COPAS’08 cruise. Dominantspecies is the species which represents >30% of total coccosphere numbers alone. Hydrographic provinces are classified based after Painter et al. (2010), using abbreviations for the major provinces given in Fig. 4. Station classification relative to ‘bloom’ waters is based on threshold values for coccolith abundances—N: non-bloom, <1 × 10³ coccoliths ml−1; O: outer bloom, 1 × 10³ to
10 × 103 coccoliths ml−1; C: central bloom, >10 × 103 coccoliths ml−1

Mar Ecol Prog Ser 443: 1–17, 2011
2000). Potential errors associated with this method ofestimating coccolith calcite from DSL measurementsare associated with the constant value of ks, the errorof which is estimated to be ±20%, and potential SEMmeasurement errors, which we assumed to be <5%.This total error of ±30% compares well with othertechniques for weighing coccoliths, for example, vari-ability in the orientation of E. huxleyi coccoliths cancause errors up to ~28% in estimates based on bire-fringence (Beaufort 2005).
Seawater carbonate chemistry
Samples for dissolved inorganic carbon (DIC) andtotal alkalinity (TA) were collected from each hydro-cast station and also opportunistically from theunderway seawater supply (surface water from anintake at depth of ~5 m). Both hydrocast and under-way surface samples were sampled into ~300 mlPyrex bottles, poisoned with HgCl2, sealed, andreturned to the Bermuda Institute of Ocean Sciences(BIOS) for analysis. DIC sample analyses were madeusing coulometric methods (Bates et al. 1996, Dick-son et al. 2007) and a VINDTA DIC system. TA sam-ple analyses were made using potentiometric meth-ods (Bates et al. 1996, Dickson et al. 2007) and aVINDTA TA system. Certified reference materials(CRMs) were routinely used for both DIC and TAanalyses, with the precision and accuracy of bothmeasurements <0.1% or ~2 µmol kg−1. Calcite satu-ration state (Ωcalcite), pH and pCO2 were calculatedfrom DIC, TA, temperature, salinity, nutrient andpressure data using the CO2Sys program (Pierrot etal. 2006) and the pK values by Mehrbach et al. (1973)as refit by Dickson & Millero (1987). The error associ-ated with these calculations was typically ±0.01 pHunits and 10 µmol kg–1 for pH and pCO2, respectively.
Ancillary variables
Surface temperature and salinity were takendirectly from the CTD data for the sampling depth.Surface macronutrient (nitrate and phosphate) con-centrations were determined using an auto-analyserfollowing standard protocols (Grasshoff et al. 1983).Mixed-layer depths (MLD) were calculated from atemperature threshold difference of 0.5°C relative tosurface data (Painter et al. 2010). Daily incidentalirradiance (Ed[0-]), in terms of photosyntheticallyactive radiation (PAR), was integrated from dawn todusk (mol PAR m−2 d−1) from the PAR sensor on the
RV ‘Roger Revelle’. Problems with the calibration ofthe PAR sensor aboard resulted in the ship’s mea-surements being calibrated against satellite-derivedvalues (MODIS, average of 9 pixels, ~27 × 27 km,with individual sampling stations closest to the cen-tral pixel), so that the relationship between the ship’sand satellite’s PAR values had a slope of 1 (i.e. usingthe equation: PARship = PARsatellite × 0.569 + 8.78, r =0.77, p < 0.001, n = 19). The vertical diffuse attenua-tion coefficient of PAR (Kd) in the water column wascalculated for pre-dawn CTD stations following themethodology of Balch et al. (2011), where a relation-ship between beam transmittance and Kd is estab-lished from midday CTD casts and used to predict Kd
during pre-dawn casts. The average mixed-layerPAR irradiance (
–Ed[ML]) was calculated following Kirk
(1994) using a combination of Ed[0-], Kd and themixed-layer depth (MLD) as:–Ed[ML] (mol PAR m−2 d−1) = Ed[0-] × (1 − exp−Kz)/Kz (2)
where Kz = Kd × MLD. The variable –Ed[ML] describes
the mean light experienced by a particle being mixedfrom the surface to the base of the mixed layer. Theeuphotic zone depth was defined as the depth whereirradiance was 1% of near-surface values, with anoptical depth of 4.6 (Kirk 1994).
Statistical analysis
For the statistical analysis of environmental vari-ables, Stn 005 was removed due to <50 detached coc-coliths being observed, and Stn 025 was removeddue to a lack of seawater carbonate chemistry data.Principal component analysis (PCA) of normalisedenvironmental variables was performed using E-PRIMER (V6.1.1), and Pearson product-moment correlations (r) were performed in Excel 2007 todescribe the correlations between ecological andenvironmental variables.
RESULTS
General oceanography
Sea-surface temperature (SST) decreased from17–18°C at the first 3 stations to 10−15°C for stationsdown to Stn 078, with temperatures generally <10°Cfor stations south of Stn 078 (Fig. 3A). Sea-surfacesalinity was relatively high at the first few stationsand decreased to <34.5 from Stn 017 onwards, withStns 020 and 068 having low salinities of <33.5
6

Poulton et al.: Emiliana huxleyi coccolith biometrics 7
Fig. 3. Surface hydrography and Emiliania huxleyi abundance. (A) Sea-surface temperature (SST) and salinity, (B) surface ni-trate and phosphate concentrations, (C) surface water pH and calcite saturation state (Ωcalcite), (D) mixed-layer and euphoticzone depths, (E) average mixed-layer irradiance (
–Ed[ML]), and (F) abundance of E. huxleyi coccospheres (cells) and detached
coccoliths (coccoliths)

Mar Ecol Prog Ser 443: 1–17, 2011
(Fig. 3A). A temperature versus salinity plot for thefull-depth CTD data (Fig. 4) showed the presence ofseveral water masses along the Patagonian Shelf (seealso Painter et al. 2010, Garcia et al. 2011), so thateach sampling station could be classified within awater mass (Table 2): warm and high saline BrazilCurrent water (Stn 008); subtropical/temperate tran-sitional warm and saline water (Stns 010, 014);Northern Falklands Current water with salinities of~34 and SST > 8°C (Stns 017, 025, 032, 052, 060, 094,102, 108); Southern Falklands Current water with sal -inities of ~34 and SST < 8°C (Stns 086, 122, 134); lowsalinity (<34) shelf waters (Stns 005, 020, 068); andAntarctic shelf waters (Stns 040, 047, 072, 078, 090,116, 128, 142) with salinities between 33.6 and 33.9.
Surface macronutrient concentrations showed com-plex patterns over the Patagonian Shelf and in thesurrounding waters (Fig. 3B). Surface nitrate was low(<1 µmol N kg−1) in association with the BrazilCurrent and transitional subtropical waters (Stns 005,008, 010) and at on-shelf stations north of 47° S (Stns020, 040) (Fig. 3B). Offshore stations north of 47° S(Stns 014, 017, 025, 032, 047, 052) had surface nitrateconcentrations between 5 and 10 µmol N kg−1. Southof 47° S all stations except for Stn 072 had surface ni-
trate concentrations >10 µmol N kg−1, independent ofwhether they were on or off-shelf (Fig. 3B). The high-est surface nitrate concentration (17 µmol N kg−1) wasmeasured on Burwood Bank to the south of the Falkland Islands (Stn 134). Surface phosphate con-centrations followed a very similar pattern to nitrate(Fig. 3B) with nitrate to phosphate (N:P) ratios <16:1for almost all stations, apart from Stn 014 (N:P = 28). Anotable trend in N:P ratios was ob served along theshelf, with northern stations (005, 008, 010) and shelfsta tions (020, 040) having N:P ratios <3, while off -shore stations had ratios between 10 and 14.3.
Along the cruise track, pH showed little variability,with most sampling stations having values from ~8.1to 8.2 (Fig. 3C). Two stations (Stns 072, 086) hadpH values >8.2, and these were associated with highchlorophyll waters (52.2 and 69.4 mg m−2, respec-tively; data not shown), although there was no over-all relationship between pH and integrated watercolumn chlorophyll concentrations (W. M. Balch un -publ. data). To the south of the shelf (Stns >090), vari-ability in pH between sampling stations was muchreduced (Fig. 3C). Calcite saturation states (i.e. Ωcal-
cite) generally decreased along the shelf, from values>4 in northern waters to values between 3.5 and 4 tothe south of the Falkland Islands (Fig. 3C). Severalstations had Ωcalcite values >4.5, and these were asso-ciated with warm subtropical and transitional waters(Stns 008, 010, 014) and shelf waters (Stns 020, 040)at the northern end of the transect.
Mixed-layer depths varied from 7 to 61 m, withdepths mostly <20 m until Stn 086 and then they progressively deepened to >50 m to the south ofthe Falklands Plateau (Fig. 3D). Euphotic zonedepth closely followed the depth of the mixed layer(Fig. 3D) and was consistently from 5 to 20 m deeperthan the mixed layer or at a similar depth until southof the Falklands Plateau, where the MLD was from10 to 20 m deeper than the euphotic zone. Averagemean mixed-layer irradiance (
–Ed[ML]) was generally
high (>25 mol PAR m−2 d−1) in the northern sectionof the shelf, dropping to ~15 to 30 mol PAR m−2 d−1
between Stns 047 and 108, and then to <15 mol PARm−2 d−1 to the south of Stn 108 (Fig. 3E).
Coccolithophore community dynamics
The coccolithophore community of the PatagonianShelf was formed of several distinct communities(Table 2, see also Fig. 3F): north of 47°S there were 2main coccolithophore communities, one with stationsdominated by species other than Emiliania huxleyi
8
Fig. 4. Temperature versus salinity plot (full-depth CTDdata). Stations are colour coded based on the analysis byPainter et al. (2010) of the major hydrographic provinces—BC: Brazil Current; T: transitional; NFC: Northern FalklandsCurrent; SFC: Southern Falklands Current; ASW: Antarcticshelf water; SW: shelf water. Vertical dashed lines indicatesalinities of shelf waters, horizontal dashed lines separatewarm subtropical and transitional waters, and Northern and
Southern Falklands Current waters
Poulton et al.: Emiliana huxleyi coccolith biometrics
(i.e. Umbellosphaera tenuis, Syracosphaera delicata,S. marginaporata) and with cell densities <0.2 ×10³ cells ml−1 and another dominated by E. huxleyi,with cell densities ranging from 0.2 × 10³ to 0.4 ×10³ cells ml−1. The latter represented the northwardextension of the coccolithophore bloom: south of47° S, E. huxleyi dominated the community with cellabundances ranging from 0.18 × 10³ to 3.06 × 10³ cellsml−1 (Fig. 3F). E. huxleyi coccolith densities showed aclearer picture of the extent of the Patagonian Shelfbloom, with stations in the northern tail of the bloomhaving coccolith densities ~2 × 10³ ml−1 and higher,while in the central part of the bloom detached coccoliths were in excess of 10 × 103 ml−1 (Table 2,Fig. 3F). We have used thresholds in the detached E.huxleyi coccolith counts to classify stations into non-bloom (<1 × 10³ coccoliths ml−1), outer bloom (1 × 10³
to 10 × 103 coccoliths ml−1) and central bloom (>10 ×103 coccoliths ml−1) communities in Table 2.
Emiliania huxleyi morphotype distribution
Generally, E. huxleyi coccoliths of Morphotype B/Crepresented the dominant morphotype along most ofthe Patagonian Shelf (10 to 100% of the total at eachstation), although the A morphotype (0 to 90%) wasalso present at some stations (Fig. 5A). Morphotype Acoccoliths appeared dominant (>50 to 70%)at several stations, including those associatedwith the Brazil Current and the subtropicaltransitional zone (Stns 008, 010, 014), as wellas those associated with shelf waters both tothe north of the Falklands (Stns 005, 020, 040,068, 072) and to the south (Stns 128, 142)(Fig. 5B). Several important observationsshould be noted: (1) Morphotype B/C domi-nated the community at several stationsalong the shelf (Stns 017, 025, 032, 060, 078,090, 122), (2) at several stations the com -munity was almost evenly split between the2 mor photypes (Stns 040, 128, 142), (3) Mor-photype B/C was present at all stations, whileMorphotype A was absent from several, and(4) the offshore Patagonian Shelf bloom wascharacterised by Morphotype B/C.
Emiliania huxleyi morphotypes and envi-ronmental variables
In order to explore the relationship be -tween the environmental variables and the
abundance of the E. huxleyi morphotypes, a PCAwas carried out using normalised environmentalvariables (Fig. 3; SST, salinity, nitrate and phosphateconcentrations, pH, Ωcalcite, and
–Ed[ML]). The first PC
(PC-1) ex plained 60.5% of the variance between sta-tions in terms of the selected environmental vari-ables, with PC-2 explaining another 17.7% of thevariance. PC-3, PC-4 and PC-5 explained another13.6, 6.4 and 1.4% of the variance, respectively,between stations. Hence, when combined PC-1 andPC-2 explained 78.2% of the variance, with the com-bination of all 5 PCs explaining 99.5%. A plot of PC-1 and PC-2 scores (Fig. 6A) shows how the samplingstations differed with re spect to one another. Stationsat the northern end of the transect (Stns 008, 010,014) were clearly separate from the main trend forthe other sampling stations.
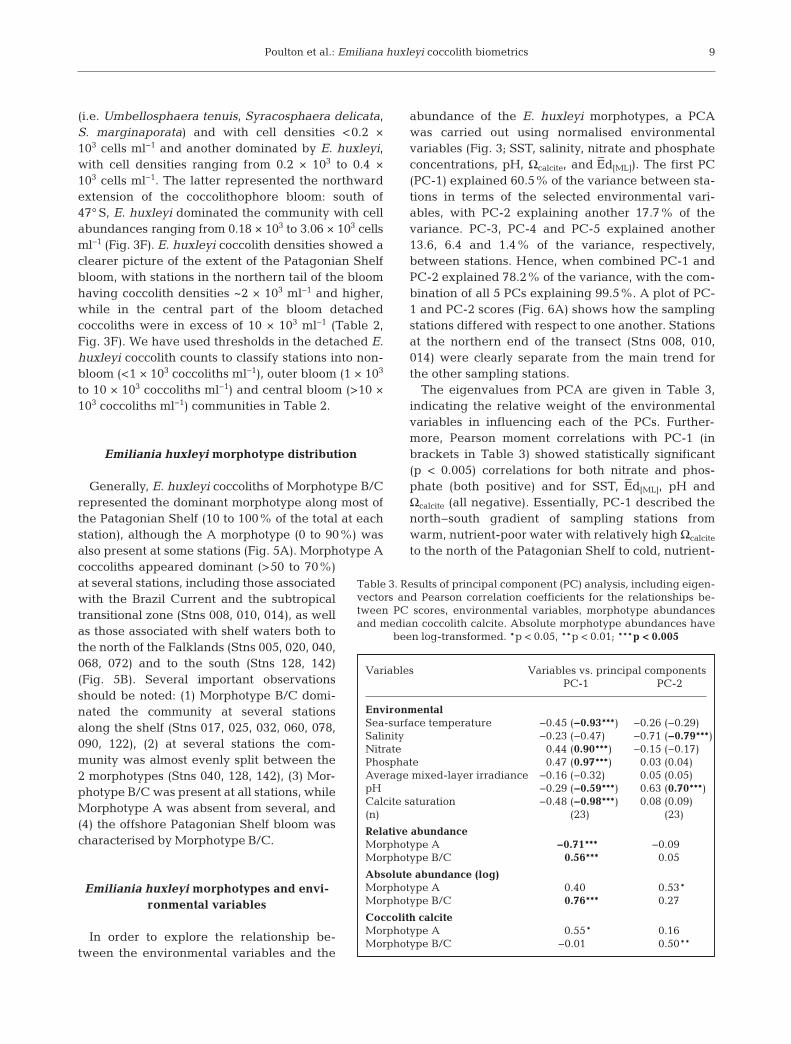
The eigenvalues from PCA are given in Table 3,indicating the relative weight of the environmentalvariables in influencing each of the PCs. Further-more, Pearson moment correlations with PC-1 (inbrackets in Table 3) showed statistically significant(p < 0.005) correlations for both nitrate and phos-phate (both positive) and for SST,
–Ed[ML], pH and
Ωcalcite (all negative). Essentially, PC-1 described thenorth− south gradient of sampling stations fromwarm, nutrient-poor water with relatively high Ωcalcite
to the north of the Patagonian Shelf to cold, nutrient-
9
Variables Variables vs. principal componentsPC-1 PC-2
EnvironmentalSea-surface temperature −0.45 (−0.93***) −0.26 (−0.29)Salinity −0.23 (−0.47) −0.71 (−0.79***)Nitrate 0.44 (0.90***) −0.15 (−0.17)Phosphate 0.47 (0.97***) 0.03 (0.04)Average mixed-layer irradiance −0.16 (−0.32) 0.05 (0.05)pH −0.29 (−0.59***) 0.63 (0.70***)Calcite saturation −0.48 (−0.98***) 0.08 (0.09)(n) (23) (23)
Relative abundanceMorphotype A *−0.71*** −0.09–Morphotype B/C ***0.56*** 0.05
Absolute abundance (log)Morphotype A 0.40 *0.53*Morphotype B/C ***0.76*** 0.27
Coccolith calciteMorphotype A *0.55* 0.16Morphotype B/C −0.01– **0.50**
Table 3. Results of principal component (PC) analysis, including eigen-vectors and Pearson correlation coefficients for the relationships be-tween PC scores, environmental variables, morphotype abundancesand median coccolith calcite. Absolute morphotype abundances have
been log-transformed. *p < 0.05, **p < 0.01; ***p < 0.005

Mar Ecol Prog Ser 443: 1–17, 2011
rich waters with lower Ωcalcite to the south of the Falk-lands Plateau (Fig. 3). Pearson moment correlationswith PC-2 (Table 3) showed statistically significant(p < 0.005) correlations with salinity (negative) andpH (positive), with PC-2 partly explaining theinshore− offshore gradient in salinity and the slightgradient in pH down the cruise transect (Fig. 3).
Fig. 6B shows how the relative abundance of the 2morphotypes changes along the first 2 PCs, withthese relationships being further explored throughPearson moment correlations (Table 3). Pearsonmoment cor relations between PC-1 and the relativeabundance of each morphotype showed a significant(p < 0.005) anti-correlation with Morphotype A and asignificant (p < 0.005) correlation with MorphotypeB/C (Table 3). No significant correlations were evi-dent between PC-2 and the different morphotypes.These relationships highlight how the relative abun-dance of Morphotype B/C increased to wards the
10
Fig. 6. Scatter plots of the first 2 principal components fromPCA of the environmental variables. In Panel A, samplingstations are identified, while in Panel B, the percentageabundance of each morphotype is indicated (same shading
as in Fig. 5)Fig. 5. Emiliania huxleyi. Percentage morphotype distribu-tion along the cruise transect in terms of (A) sampling stations and (B) location along the Patagonian Shelf. Mor-photypes are shaded identically in Panels A and B. Pie-charts in (B) for sampling stations in similar geographicalpositions (i.e. Stns 060, 094 and 102; Stns 078 and 090) have
been moved for clarity

Poulton et al.: Emiliana huxleyi coccolith biometrics
southern end of the transect, with decreasing SSTand Ωcalcite and increasing ni trate and phosphate con-centrations. Conversely, the rel ative abundance ofMor photype A increased towards the northern endof the transect with increasing SST and Ωcalcite anddecreasing nitrate and phosphate concentrations.Examination of the relationship between the nitrate:phosphate ratio and mor photype relative abundanceshowed a significant anti-correlation with the A mor-photype (r = −0.72, p < 0.005, n = 16) and a significantcorrelation with Morphotype B/C (r = 0.57, p < 0.005,n = 16).
Clearly, the relative abundance of the 2 morpho-types will have an anti-correlation; hence, it is appro-priate to also examine the trends in absolute abun-dances in relation to the environmental parameters,PC-1 and PC-2. Pearson moment correlations be -tween PC-1 and the absolute abundance of Morpho-type B/C showed a significant (p < 0.005) correlation(Table 3), emphasising the increased abundance ofB/C in the cold, nutrient-rich waters with lower Ωcal-
cite to the south of the Patagonian Shelf. A correlationwas also present between the absolute abundance ofMorphotype A and PC-2, although at a lower level of
11
Fig. 7. Emiliania huxleyi. Frequencyhistograms of distal shield length at
each station

Mar Ecol Prog Ser 443: 1–17, 2011
significance (p < 0.05). The absolute abundance ofMorphotype B/C and the nitrate:phosphate ratio alsoshowed a statistically significant positive relationship(r = 0.57, p < 0.005, n = 23).
Variability in Emiliania huxleyi coccolith dimensions and calcite content
Frequency histograms of the DSL for the differentstations and different morphotypes (Fig. 7) weregenerally unimodal (see also Triantaphyllou et al.2010). The lack of obvious bimodality, despite thevarying dominance of 2 distinct morphotypes, re -flects the fact that A and B/C produce coccoliths ofsimilar size ranges (Fig. 7). There was also no clearrelationship between DSL frequency for either mor-photype and the sampling stations in terms of lati-
tude, inshore/ offshore, or hydrographic province.For stations with Morphotype A present, 83% hada median DSL of 3.01 to 3.5 µm and 17% had amedian DSL of 2.51 to 3.0 µm. For stations withMorphotype B/C, 75% of stations had a medianDSL of 3.01 to 3.5 µm and 25% had a medianDSL of 2.51 to 3.0 µm. Overall, the ma jority of thedetached cocco liths in the waters of the PatagonianShelf had a DSL between 3.01 and 3.5 µm.
The calcite content of individual coccoliths is afunction of volume and so of length (DSL) cubed(Young & Ziveri 2000; Table 1). Hence, knowing thespecies’ or population’s DSL frequency and the rela-tive morphotype abundance (i.e. ks values for thepopulation) it is possible to convert DSL into coccolithcalcite content (see Eq. 1) and plot the values for eachmorphotype at each of the sampling stations alongthe Patagonian Shelf.
12
Fig. 8. Emiliania huxleyi. Box-whisker plots of estimated coccolith calcite for (A) Morphotype A and (B) Morphotype B/C.Dashed lines indicate the median values for all coccoliths of each morphotype. Box-whisker plots include the minimum value,
lower quartile, median, upper quartile and maximum value, as well as possible outliers (black dots)

Poulton et al.: Emiliana huxleyi coccolith biometrics
Fig. 8 presents the coccolith calcite contents for thedetached coccoliths of Morphotypes A (Fig. 8A) andB/C (Fig. 8B) in the form of box-whisker plots (i.e. in -cluding the minimum value, lower quartile, median,upper quartile and maximum value, as well as possi-ble outliers). Clearly there is variability in mediancoccolith calcite quotas between stations and betweenmorphotypes, with coccoliths of the A morphotypehaving higher values (Fig. 8A) than those for B/C(Fig. 8B). The average (±SD) calcite quota for allMorphotype A coccoliths from the Patagonian Shelfwas 0.019 (±0.007) pmol C coccolith−1 and the aver-age (±SD) for all Morphotype B/C coccoliths was0.014 (±0.005) pmol C coccolith−1. The average (±SD)for the combination of coccoliths from both morpho-types was 0.015 (±0.006) pmol C coccolith−1. The dif-ference in calcite quotas between the morphotypes isdue to the higher ks value used for A than for B/C(see Table 1), reflecting the fact that it is characteris-tically more heavily calcified, rather than differencesin DSL (Fig. 7).
Comparison of median coccolith calcite values forboth Morphotypes A and B/C, with the PCs describ-ing the variability in the environmental conditionsalong the shelf, showed correlations between Type Acoccolith calcite and PC-1 and between B/C coccolithcalcite and PC-2 (Table 3). Both correlations were atweaker levels of significant (p < 0.05 for MorphotypeA and p < 0.01 for Morphotype B/C) than for those ofthe relationships observed between morphotype rel-ative abundance and the PCs (p < 0.005).
DISCUSSION
Morphotype distribution along the PatagonianShelf
The 2 morphotypes of Emiliania huxleyi presentalong the Patagonian Shelf (A and B/C) had distinctlydifferent spatial distributions (Fig. 5B). MorphotypeA was relatively more abundant in warm waters withlow nitrate and phosphate concentrations and highersaturation states, as found at the northern end of theshelf and in some shelf waters. Morphotype B/C wasrelatively more abundant in cold waters with highnitrate and phosphate concentrations and lower satu-ration states, as found towards the southern end ofthe shelf. These differences are clear from the PCAand Pearson product-moment correlations betweenPC-1, the environmental variables and the relativeabundance of each morphotype (Table 3). The ab -solute abundance of Morphotype B/C coccoliths was
also significantly related to the strong gradient inenvironmental variables along the shelf, indicatingthat the offshore coccolithophore bloom in 2008occurred in cold, nutrient-rich waters with lower calcite saturation states than at the northern end ofthe transect. Correlations do not necessarily meancausation; hence, it is unclear whether the formationand maintenance of the 2008 bloom, dominated byMorphotype B/C, was linked to these conditions, orrather if these conditions only characterised thehydrographic province in which the bloom occurred.
Painter et al. (2010) recently concluded for theCOPAS’08 bloom that the combination of factorsfavourable for bloom formation (e.g. high N:Si, shal-low MLD; see Tyrrell & Merico 2004; see also Garciaet al. 2011) were found to be relatively more stable inthe Antarctic shelf water mass than in other watermasses along the Patagonian Shelf. These authorsconcluded this from examination of satellite data andin situ hydrographic and current data. Our study sup-ports the conclusions of Painter et al. (2010) in that(1) the morphotype relative and absolute abundancewas strongly linked to the hydrographic drivers alongthe shelf, and (2) the absolute abundance of the morphotype dominating the bloom (B/C) was stronglylinked to factors previously associated with bloomformation (nitrate concentration and N:P ratio; Tyrrell& Merico 2004). Importantly, the Patagonian Shelfbloom differs from many blooms in that the abun-dance of Morphotype B/C was positively correlatedwith N:P; hence, the bloom appears to favour ele-vated N:P ratios rather than low N:P (see also Lessardet al. 2005). However, both nitrate and phosphatewere in concentrations (>8 µmol N kg −1 and 0.5 µmolP kg−1, respectively) not likely to be limiting, ratherthan the low concentrations (<3 µmol N kg−1) foundin bloom waters in the North Atlantic Ocean (e.g.Fernandez et al. 1993).
In summary, the strong hydrographic differencesalong the Patagonian Shelf resulted in strong differ-ences in the composition of the Emiliania huxleyicommunity in terms of morphotypes. Although ourstudy of the Patagonian Shelf found Morphotype A tobe restricted to low-salinity shelf waters and warm(>10°C) subtropical transitional waters to the north ofthe shelf (Fig. 5B), other studies have found Morpho-type A both in coastal environments, such as Nor -wegian fjords (e.g. Batvik et al. 1997), and in moreoffshore environments, such as the equatorial Pacific(Hagino & Okada 2006) and central Iceland Basin,during both bloom (Holligan et al. 1993) and non-bloom (Poulton et al. 2010) con ditions. MorphotypeB/C, in contrast, appears to be more common in
13

Mar Ecol Prog Ser 443: 1–17, 2011
cold (<10°C), nutrient-rich southern waters (Findlay& Giraudeau 2000, Cubillos et al. 2007, Holliganet al. 2010, present study). Dominance of the 2008 Pata gonian Shelf coccolithophore bloom by the B/C morphotype supports the con clusion that this mor-photype dominates subpolar communities in theSouthern Ocean (Findlay & Giraudeau 2000, Cubilloset al. 2007) and implies that blooms observed inreflectance data around the Scotia Sea (Holligan etal. 2010) may also be of this morphotype.
Coccolith calcite quotas
Previous field-based estimates of coccolith calcitehave used the slope of the regression between partic-ulate calcium (particulate inorganic calcite, PIC) mea-surements and the sum of detached and cell-attachedcoccoliths to derive a per coccolith calcite quota (e.g.Fernandez et al. 1993, Poulton et al. 2010). These haveled to estimates of coccolith calcite of ~0.035 pmol C,with differences in studies being explained by the in-fluence of aggregates (e.g. faecal pellets). Birefrin-gence-based estimates of Emiliania huxleyi coccolithcalcite give values of ~0.050 to 0.070 pmol C (Beaufort2005), considerably higher than other estimates. Infact, a regression of particulate calcite measurementsand total coccoliths de rived from SEM counts for theCOPAS’08 surface measurements gives a coccolithcalcite value of 0.033 pmol C (r2 = 0.89, n = 24, p <0.001). This is sig nificantly higher than our estimatesbased on DSL (Fig. 8). Differences in coccolith calcitebetween the present study and those in the North At-lantic (Fernandez et al. 1993, Poulton et al. 2010) maybe related to the dominant morphotype of E. huxleyipresent (A in North Atlantic) or to the method of esti-mating the coccolith calcite. However, Holligan et al.(2010), working in the Scotia Sea to the south of thePatagonian Shelf, found a relatively low mean valueof coccolith calcite (0.022 pmol C), similar to our esti-mates from DSL (0.015 pmol C), based on the slope ofthe regression line between total cocco liths and PICmeasurements. Another significant source of errormay be in the constant ks value assumed for each mor -photype (Table 1), with much more work required onthe magnitude of variability in ks in both culture andfield populations. Furthermore, intercomparison ofthe different methods for estimating coccolith calcitecontent (regression, birefringence, morphometrics) isneeded.
Differences in coccolith calcite between morpho-types of Emiliania huxleyi potentially drive the differ-ences in calcite production among the different com-
munities (Cubillos et al. 2007). However, this largelydepends on whether or not the different morpho-types are producing the same number of coccolithsper unit time or fixing the same amount of carbonvia calcification per unit time. Laboratory studiesaddressing this issue are currently unavailable, al -though clearly of relevance to the interpretation offield data. The results from the Patagonian Shelf alsohighlight the fact that natural field populations of E.huxleyi are producing coccoliths with a wide rangeof DSL and hence coccolith calcite. For the Patagon-ian Shelf, this is true for each individual morphotypeand the combination of the 2 (Figs. 7 & 8). In fact,despite strong patterns in the relative abundance ofE. huxleyi morphotypes along the shelf (Fig. 5), thereis considerable overlap in the range of coccolith sizesand calcite quotas for these populations (Figs. 7 & 8).Although the morphotypes have distinctly different-sized coccoliths, with different calcite quotas, the sizerange over which these morphotypes are producingcoccoliths is similar and acts to mask their distribu-tion patterns.
Genotypic variability
Although Emiliania huxleyi is often regarded as aglobally ubiquitous species, the truth appears to berather that it has a variety of morphotypes and geno-types able to exist successfully in a wide varietyof marine environments (Young & Westbroek 1991,Paasche 2001). These different morphotypes appearto be biochemically and genetically distinct (VanBleijkswijk et al. 1994, Young & Westbroek 1991,Medlin et al. 1996, Schroeder et al. 2005, Iglesias-Rodriguez et al. 2006, Cook et al. 2011), with clonalcultures retaining their characteristic morphotype formultiple generations (Young & Westbroek 1991, Cu -billos et al. 2007, Cook et al. 2011). However, there isalso a high degree of intra-population genetic diver-sity, with geographically distinct populations appear-ing to be non-clonal (Medlin et al. 1996, Iglesias-Rodriguez et al. 2002b, 2006, Cook et al. 2011). Hence,mono-specific blooms of E. huxleyi are actually com-posed of an array of coexisting genotypes or clones(i.e. strains of E. huxleyi with distinct genotypes)(Medlin et al. 1996, Paasche 2001, Iglesias-Rodriguezet al. 2002b, 2006). Few laboratory studies have ad -dressed whether the different morphotypes are phys-iologically different, although Van Bleijswijk et al.(1994) did find physiological differences betweenclonal strains of Morphotypes A and B, including dif-ferences in growth rates, cell size, chlorophyll fluo-
14

Poulton et al.: Emiliana huxleyi coccolith biometrics
rescence, rates of calcification and photosynthesis,and response to irradiance. A recent study by Cooket al. (2011) found significant differences in the pho-tosynthetic pigments present in strains of Morpho-types A and B/C isolated from the Southern Ocean.
Clearly, the field data collected from the Pata -gonian Shelf show the presence of 2 morphotypes,each with a slightly different distribution (Fig. 5)and unique responses to environmental gradients(Table 3). These differences imply that the morpho-types can be viewed as distinctive ecotypes, eachsuited to a different environment (see also Cook et al.2011). How genetically similar the station popula-tions are to one another, either between morphotypesor within morphotypes, is unclear but warrants futureattention. Dominance of the different blooms (shelfvs. offshore) by the different morphotypes, within arelatively small area and occurring at the same time,indicates that genetically, and potentially physiologi-cally, distinct blooms can occur within relativelysmall spatial, temporal and ecological scales. Hence,large-scale Emiliania huxleyi blooms occurring alongstrong hydrographic gradients may actually be com-posed of morphologically, genetically and physiolog-ically distinct populations, which have distinct envi-ronmental drivers. More in situ sampling of theselarge-scale features and further comparative studiesbetween morphotypes are both required.
Future directions
In light of the potential differences in morphotypeecology and physiology, it seems apparent that thefactors driving coccolithophore blooms and open-ocean dynamics should be widened from those cur-rently associated with blooms in the North AtlanticOcean. For example, salinity and temperature appearto be important factors regulating morphotype abun-dance along the Patagonian Shelf. Examining mor-photype abundance (absolute and relative) at thebasin scale, and in the context of hydrographic para-meters, would help to clarify the factors, and their relative influence, which regulate coccolithophorecalcite production. Coupling genotypic and biometriclaboratory and field studies should also provide con-siderable insight into the population dynamics ofoceanic coccolithophore populations. Importantly, 2points with global significance come out of the ob -servations of the Patagonian Shelf Emiliania huxleyipopulation: (1) different morphotypes of E. huxleyimay dominate blooms in different geographical areasand (2) morphotype biogeography may not be rigid.
In the context of the current research focus on theeffects of ocean acidification (e.g. Doney et al. 2009),it should be clear that any field study must considerchanges in cellular calcification both in absolute andcell-normalised terms, and also in the context ofchanges in either the coccolith dimensions and/orrelative morphotype abundances. Inter-strain vari-ability in the response of coccolithophores to manip-ulations of the carbonate chemistry (e.g. Langer et al.2009) are now being recognised as important forunderstanding the effects of ocean acidification oncoccolithophores. Our study highlights that there isalso the potential for inter-strain and inter-type vari-ability in the response of Emiliania huxleyi to physio-logical drivers (e.g. light, nutrient concentrations).Overcoming such intra-species variability, so that re -sults from laboratory and field studies can be extrap-olated to ecological and global modelling studies,will require that 2 key questions are addressed: (1)Are there ecophysiological models (ecotypes) withinor between strains? (2) How definitive are these eco-types in terms of predicting their response to envi-ronmental conditions?
Acknowledgements. We thank Stuart Painter (NOCS) forassistance with satellite imagery and interpretation of thephysical environment, Stephanie Henson (NOCS) for assis-tance with satellite PAR data, Bruce Bowler (BLOS) for assis-tance with field sampling and filtering, Marlene Jeffries,Keven Neely, Rebecca Garley (BIOS) and Nicole Beniot(WHOI) for seawater carbonate chemistry sampling, DanShultz (SCRIPPS) for macronutrient data, and RichardPearce (NOCS) for assistance with SEM preparation. We arealso very grateful to 4 anonymous reviewers for their sug-gestions and comments on an early version of the paper.MODIS Aqua data were obtained from the NASA OceanColour distributed archive (http:// oceancolor. gsfc. nasa. gov/).Participation of A.J.P. was supported by Oceans 2025 fund-ing, with further financial support from the Natural Environ-mental Research Council via a postdoctoral fellowship(NE/F015054/1). W.M.B. was supported by NSF (OCE-0728582 and OCE-0961660) and NASA (NNX08AJ88A andNNX08AAB10G).
LITERATURE CITED
Balch WM, Kilpatrick K, Holligan PM, Cucci T (1993) Coc-colith production and detachment by Emiliania huxleyi(Prymnesiophyceae). J Phycol 29:566−575
Balch WM, Poulton AJ, Drapeau DT, Bowler BC, WindeckerLA, Booth ES (2011) Zonal and meridional patterns ofphytoplankton biomass and carbon fixation in the Equa-torial Pacific Ocean, between 110° W and 140° W. Deep-Sea Res II 58:400−416
Bates NR, Michaels AF, Knap AH (1996) Seasonal and inter-annual variability of oceanic carbon dioxide species atthe US JGOFS Bermuda Atlantic time-series study(BATS) site. Deep-Sea Res II 43:347−383
15

Mar Ecol Prog Ser 443: 1–17, 2011
Batvik H, Heimdal BR, Fagerbakke KM, Green JC (1997)Effects of unbalanced nutrient regime on coccolith morphology and size in Emiliania huxleyi (Prymnesio-phyceae). Eur J Phycol 32:155−165
Baumann KH (2004) Importance of size measurements oncoccolith carbonate flux estimates. Micropaleontology50:35−43
Beaufort L (2005) Weight estimates of coccoliths using theoptical properties (birefringence) of calcite. Micropale-ontology 51:289−298
Beaufort L, Couapel M, Buchet N, Claustre N, Goyet C(2008) Calcite production by coccolithophores in the southeast Pacific Ocean. Biogeosciences 5:1101−1117
Bollmann J, Herrle JO, Cortés MY, Fielding SR (2009) Theeffect of sea water salinity on the morphology of Emilia-nia huxleyi in plankton and sediment samples. EarthPlanet Sci Lett 284:320−328
Cook SS, Whittock L, Wright SW, Hallegraeff GM (2011)Photosynthetic pigment and genetic differences betweentwo Southern Ocean morphotypes of Emiliania huxleyi(Haptophyta). J Phycol 47:615−626
Cubillos J, Wright S, Nash G, de Salas M and others (2007)Calcification morphotypes of the coccolithophorid Emil-iania huxleyi in the Southern Ocean: changes in 2001 to2006 compared to historical data. Mar Ecol Prog Ser 348:47−54
Dickson AG, Millero FJ (1987) A comparison of the equilib-rium constants for the dissociation of carbonic acid inseawater media. Deep-Sea Res Part A 34:1733−1743
Dickson AG, Sabine CL, Christian JR (2007) Guide to bestpractices for ocean CO2 measurements. PICES SpecialPublication Vol 3, IOCCP report no. 8
Doney SC, Balch WM, Fabry VJ, Feely RA (2009) Oceanacidification: a critical emerging problem for the oceansciences. Oceanography 22:16−26
Fernandez E, Boyd P, Holligan PM, Harbour DS (1993) Pro-duction of organic and inorganic carbon within a large-scale coccolithophore bloom in the northeast AtlanticOcean. Mar Ecol Prog Ser 97:271−285
Findlay CS, Giraudeau J (2000) Extant calcareous nano -plankton in the Australian Sector of the Southern Ocean(austral summers 1994 and 1995). Mar Micropaleontol40:417−439
Garcia CAE, Garcia VMT, Dogliotti AI, Ferreira A and others (2011) Environmental conditions and bio-opticalsignature of a coccolithophorid bloom in the PatagonianShelf. J Geophys Res 116:C03025, doi:10.1029/2010JC006595
Gordon HR, Du T (2001) Light scattering by nonsphericalparticles: application to coccoliths detached from Emilia-nia huxleyi. Limnol Oceanogr 46:1438−1454
Gordon HR, Smyth TJ, Balch WM, Boynton GC, Tarran GA(2009) Light scattering by coccoliths detached from Emil-iania huxleyi. Appl Opt 48:6059−6073
Grasshoff K, Ehrhardt M, Kremling K (1983) Methods of sea-water analysis. Verlag Chemie, Weinheim
Hagino K, Okada H (2006) Intra- and infra-specific morpho-logical variation in selected coccolithophore species inthe equatorial and subequatorial Pacific Ocean. MarMicropaleontol 58:184−206
Hagino K, Okada H, Matsuoka H (2005) Coccolithophoreassemblages and morphotypes of Emiliania huxleyi inthe boundary zone between the cold Oyashio and warmKuroshio currents off the coast of Japan. Mar Micropale-ontol 55:19−47
Holligan P, Fernandez E, Aiken J, Balch WM and others(1993) A biogeochemical study of the coccolithophore,Emiliania huxleyi, in the North Atlantic. Global Bio-geochem Cycles 7:879−900
Holligan PM, Charalampopoulou A, Hutson R (2010) Sea-sonal distributions of the coccolithophore, Emiliania hux-leyi, and of particulate inorganic carbon in surfacewaters of the Scotia Sea. J Mar Syst 82:195−205
Iglesias-Rodriguez MD, Brown C, Doney S, Kleypas J andothers (2002a) Representing key phytoplankton func-tional groups in ocean carbon cycle models: cocco -lithophorids. Global Biogeochem Cycles 16:47-1−47-20
Iglesias-Rodriguez MD, Saez AG, Groben R, Edwards KJ,Batley J, Medlin L, Hayes P (2002b) Polymorphic micro -satellites in global populations of the marine cocco -lithophorid Emiliania huxleyi. Mol Ecol Notes 2:495−497
Iglesias-Rodriguez MD, Schofield OM, Batley J, Medlin LK,Hayes PK (2006) Intraspecific genetic diversity in themarine coccolithophore Emiliania huxleyi (Prymnesio-phyceae): the use of microsatellite analysis in marinephytoplankton population studies. J Phycol 42:526−536
Kirk JTO (1994) Light and photosynthesis in aquatic ecosys-tems, 2nd edn. Cambridge University Press, Cambridge
Langer G, Nehrke G, Probert I, Ly J, Ziveri P (2009) Strain-specific responses of Emiliania huxleyi to changing sea-water carbonate chemistry. Biogeosciences 6:2637−2646
Lessard EJ, Merico A, Tyrrell T (2005) Nitrate:phosphateratios and Emiliania huxleyi blooms. Limnol Oceanogr50:1020−1024
Medlin LK, Barker GLA, Campbell L, Green JC and others(1996) Genetic characterisation of Emiliania huxleyi(Haptophyta). J Mar Syst 9:13−32
Mehrbach C, Culberson CH, Hawley JE, Pytkowicz RM(1973) Measurement of the apparent dissociation con-stants of carbonic acid in seawater at atmospheric pres-sure. Limnol Oceanogr 18:897−907
Müller M, Antia A, Laroche J (2008) Influence of cell cyclephase on calcification in the coccolithophore Emilianiahuxleyi. Limnol Oceanogr 53:506−512
Paasche E (1998) Roles of nitrogen and phosphorus in coc-colith formation in Emiliania huxleyi (Prumnesio-phyceae). Eur J Phycol 33:33−42
Paasche E (2001) A review of the coccolithophorid Emilianiahuxleyi (Prymnesiophyceae), with particular reference togrowth, coccolith formation, and calcification−photosyn-thesis interactions. Phycologia 40:503−529
Paasche E, Brubak S, Skattebøl S, Young JR, Green JC(1996) Growth and calcification in the coccolithophoridEmiliania huxleyi (Haptophyceae) at low salinities. Phyco logia 35:394−403
Painter SC, Poulton AJ, Allen JT, Pidcock R, Balch WM(2010) The COPAS’08 expedition to the PatagonianShelf: physical and environmental conditions duringthe 2008 coccolithophore bloom. Cont Shelf Res 30:1907−1923
Pierrot DE, Lewis E, Wallace DWR (2006) MS Excel programdeveloped for CO2 system calculations. ORNL/CDIAC-105a, Carbon Dioxide Information Analysis Centre, OakRidge National Laboratory, US Department of Energy,Oak Ridge, TN
Poulton AJ, Charalampopoulou A, Young J, Tarran G, LucasMI, Quartly GD (2010) Coccolithophore dynamics innon-bloom conditions during late summer in the centralIceland Basin (July−August, 2007). Limnol Oceanogr 55:1601−1613
16

Poulton et al.: Emiliana huxleyi coccolith biometrics
Satoh M, Iwamoto K, Suzuki I, Shiraiwa Y (2009) Cold stressstimulates intracellular calcification by the coccolitho -phore Emiliania huxleyi (Haptophyceae) under phos-phate-deficient conditions. Mar Biotechnol (NY) 11:327−333
Schroeder D, Biggi G, Hall M, Davy J and others (2005) Agenetic marker to separate Emiliania huxleyi (Prymne-siophyceae) morphotypes. J Phycol 41:874−879
Signorini S, Garcia VMT, Piola AR, Garcia CAE, Mata MM,McClain CR (2006) Seasonal and interannual variabilityof calcite in the vicinity of the Patagonian shelf break(38° S−52° S). Geophys Res Lett 33:L16610. doi:10.1029/2006GL026592
Triantaphyllou M, Dimiz M, Krasakpoulou E, Malinverno E,Lianou V, Souvermezoglou E (2010) Seasonal variation inEmiliania huxleyi coccolith morphology and calcificationin the Aegean Sea (eastern Mediterranean). Geobios43:99−110
Tyrrell T, Merico A (2004) Emiliania huxleyi: bloom observa-tions and the conditions that induce them. In: ThiersteinHR, Young JR (eds) Coccolithophores: from molecularprocesses to global impact. Springer-Verlag, Heidelberg,p 75−97
Van Bleijswijk J, Kempers R, Veldhuis M, Westbroek P(1994) Cell and growth characteristics of types A and Bof Emiliania huxleyi (Prymnesiophyceae) as determinedby flow cytometry and chemical analyses. J Phycol 30:
230−241Watabe N, Wilbur K (1966) Effects of temperature on
growth, calcification and coccolith formation in Cocco -lithus huxleyi (Coccolithineae). Limnol Oceanogr 11:567−575
Young JR (1993) The description and analysis of coccolithstructure. Knihovnicha ZPN 1:35−71
Young JR (1994) Variation in Emiliania huxleyi coccolithmorphology in samples from the Norwegian EHUXexperiment, 1992. Sarsia 79:417−425
Young JR, Westbroek P (1991) Genotypic variation in thecoccolithophorid species Emiliania huxleyi. Mar Micro -paleontol 18:5−23
Young JR, Ziveri P (2000) Calculation of coccolith volumeand its use in calibration of carbonate flux estimates.Deep-Sea Res II 47:1679−1700
Young JR, Geisen M, Cros L, Kleijne A, Sprengel C, ProbertI, Østergaard JB (2003) A guide to extant calcareousnannoplankton taxonomy. J Nanno Res (Sp 1) :1−125
Ziveri P, de Bernardi B, Baumann KH, Stoll H, Mortyn P(2007) Sinking of coccolith carbonate and potential con-tribution to organic carbon ballasting in the deep ocean.Deep-Sea Res II 54:659−675
Zondervan I (2007) The effects of light, macronutrients,trace metals and CO2 on the production of calcium carbonate and organic carbon in coccolithophores—A review. Deep-Sea Res II 54:521−537
17
Editorial responsibility: Katherine Richardson, Copenhagen, Denmark
Submitted: May 11, 2011; Accepted: October 10, 2011Proofs received from author(s): November 28, 2011