biometric authentication using mouse gesture dynamics
TRANSCRIPT

262 IEEE SYSTEMS JOURNAL, VOL. 7, NO. 2, JUNE 2013
Biometric Authentication Using MouseGesture Dynamics
Bassam Sayed, Issa Traore, Isaac Woungang, and Mohammad S. Obaidat, Fellow, IEEE
Abstract—The mouse dynamics biometric is a behavioralbiometric technology that extracts and analyzes the movementcharacteristics of the mouse input device when a computeruser interacts with a graphical user interface for identificationpurposes. Most of the existing studies on mouse dynamics anal-ysis have targeted primarily continuous authentication or userreauthentication for which promising results have been achieved.Static authentication (at login time) using mouse dynamics,however, appears to face some challenges due to the limitedamount of data that can reasonably be captured during sucha process. In this paper, we present a new mouse dynamicsanalysis framework that uses mouse gesture dynamics for staticauthentication. The captured gestures are analyzed using a learn-ing vector quantization neural network classifier. We conduct anexperimental evaluation of our framework with 39 users, in whichwe achieve a false acceptance ratio of 5.26% and a false rejectionratio of 4.59% when four gestures were combined, with a testsession length of 26.9 s. This is an improvement both in theaccuracy and validation sample, compared to the existing mousedynamics approaches that could be considered adequate for staticauthentication. Furthermore, to our knowledge, our work is thefirst to present a relatively accurate static authentication schemebased on mouse gesture dynamics.
Index Terms—Behavioral biometrics, biometric authentication,computer security, identity verification, mouse dynamics.
I. Introduction
WHILE THE primary focus in the design of biometricsystems has been on improving their accuracy, the
integration of such systems in existing information systemsrequires addressing additional considerations. Existing infor-mation systems rely on globally distributed networked infras-tructures, involving a diversity of systems that collaborate indelivering a specific set of services. The inherent heterogeneityof these systems creates a layer of complexity that makes theirdesign and operation a difficult undertaking. The integrationof a biometric subsystem in such a complex system envi-ronment requires taking into account concerns such as socialimpact, usability, interoperability, resilience, and scalability.
Manuscript received October 4, 2011; revised March 14, 2012; acceptedJuly, 26, 2012. Date of publication January 22, 2013; date of current versionApril 17, 2013.
B. Sayed and I. Traore are with the Department of Electrical and ComputerEngineering, University of Victoria, Victoria, BC V8W 3P6, Canada (e-mail:[email protected]; [email protected]).
I. Woungang is with the Department of Computer Science, Ryerson Uni-versity, Toronto, ON M5B 2K3, Canada (e-mail: [email protected]).
M. S. Obaidat is with the Department of Computer Science, Monmouth Uni-versity, West Long Branch, NJ 07764 USA (e-mail: [email protected]).
Color versions of one or more of the figures in this paper are availableonline at http://ieeexplore.ieee.org.
Digital Object Identifier 10.1109/JSYST.2012.2221932
For instance, biometric systems carry private user informationthat could be misused if accessed by intruders, although sucha threat could be mitigated using privacy-aware biometriccryptographic techniques [1]. Biometric systems could be thetarget of attacks, for instance, through forgeries [2]. Manybiometric systems rely on complex data processing algorithmsthat may not scale when deployed in globally distributednetwork environments.
As a result, despite the wide usage of biometric technologyfor physical security, the adoption of biometrics in day-to-day use of computer systems has been slow [3]. Anotherreason for this limited usage of biometrics is the reliance onspecial-purpose hardware devices for biometric data collection.Although some computer vendors have started integratingthe needed hardware into their products, the vast majorityof machines currently available lack such special hardwaredevices. This limits the scope of where biometric technologycan be used, as it will only be available for organizations thatcan buy the required additional hardware.
A new category of biometrics that is gaining in popularity isreferred to in the literature as behaviometrics (for behavioralbiometrics), where analysis focuses on studying the user’sbehavior while he interacts with a computing system forthe purpose of identification [4]–[6]. One interesting exam-ple of behaviometrics is mouse dynamics biometrics [5]–[8].Mouse dynamics biometric recognition involves extractingthe behavioral features related to the mouse movements andanalyzing them to extract a signature, which is unique forevery individual, and as such can be used to discriminatedifferent individuals. The main strength of mouse dynamicsbiometric technology is in its ability to continuously monitorthe legitimate and illegitimate users based on their sessionalusage of a computer system. This is referred to as contin-uous authentication. Continuous authentication, or identityconfirmation based on mouse dynamics, is very useful forcontinuous monitoring applications such as intrusion detection.
However, unlike traditional biometric systems, mouse dy-namics biometric technology may face some challenges whenapplied to static authentication, which consists of checkingthe user’s identity at login time. The key challenge is thedata capture process, which requires more time to collectsufficient amount of mouse movements for accurate useridentity verification [9] than can reasonably be tolerated, orafforded, in a realistic login process.
We tackle this challenge by proposing, in this paper,a new mouse dynamics recognition framework that allows
1932-8184/$31.00 c© 2013 IEEE

SAYED et al.: BIOMETRIC AUTHENTICATION USING MOUSE GESTURE DYNAMICS 263
performing the authentication in a short time and as such maybe used for static authentication (at login time). We use mousegestures to achieve our goal. A mouse gesture results from thecombination of computer mouse movements and clicks in away that the software recognizes as a specific command. Inour work, during the enrollment phase the user draws a set ofgestures several times on a computer monitor using a mouse.We extract features from the captured data, analyze them, andthen train a neural network that is later used for identification.In the verification phase, the user will be asked to replicate asubset of the gestures drawn by her in the enrollment phaseto test against her stored profile. Experimental evaluation ofthe proposed approach with 39 users yields false acceptancerate (FAR) of 5.26% and false rejection rate (FRR) of 4.59%with a test session length of 26.9 s.
The remainder of this paper is organized as follows. InSection II, we summarize and discuss related work. In SectionIII, we give an overview of mouse gesture dynamics andpresent the design of our detection system. In Section IV, wepresent the classification technique used to analyze the mousegestures. In Section V, we present our experimental evaluationprocess and results. In Section VI, we give conclusions andsummarize our future work.
II. Related Work
There is extensive research literature on the use of thecomputer mouse as an input device in the human computerinteraction field for the purpose of user interface design im-provement [10]. It was not until recently, however, that mousedynamics emerged as a behavioral biometric technology.
In [11], it was established that the actions recordedfor a specific user while interacting with a graphical userinterface are intrinsic to that user. These actions are recordedpassively and validated throughout the session. The authorsinitially evaluated their model by collecting data from 22participants. Then, using a one-hold-out cross validation testto compute the performance of the proposed system, an FARof 2.4649% and an FRR of 2.4614% were obtained [6].These results were later confirmed by increasing the overallnumber of participants to 48 users [12]. Although the workaccomplished in this research may potentially be used bothfor static and dynamic authentication systems, the primaryfocus of the study was initially on continuous authenticationthat requires the user to be logged into the system to startthe monitoring. Static authentication will require the designof a special-purpose GUI and asking the user to performpredefined actions to login. The new interface, and set ofactions, could present some challenges related to the lengthof time required to capture enough data for user recognition.
Gamboa et al. [5] performed similar research by conductingan experiment to capture user interaction based on the mousewhile playing a memory game. Fifty volunteers participatedin the experiment. A sequential forward selection techniquebased on the greedy algorithm was used to select the bestsingle feature and then add one feature at a time to the featurevector.
Gamboa et al. [5] showed that the equal error rate (EER)progressively tends to zero as more strokes are recorded. This
means that the more interaction data the system records, themore accurate the system should be. But, as we commentedearlier, it might be difficult to use such a method for staticauthentication at login time since the authors reported that thememory game took from 10–15 min to complete on average.
In [7], the authors proposed an approach for user reauthen-tication based on the data captured from the mouse device. Asystem was implemented that continuously monitored the user-invoked mouse events and movements, and raised an alarmwhen the user behavior deviated from the learned normalbehavior. A decision tree classifier was used in the decisionprocess. An experiment was conducted with 11 users, in whicha false positive rate of 0.43% and a false negative rate of1.75% were obtained. The authors, however, mentioned thattheir method would fail if the user did not generate enoughmouse movements and events. In a static authentication settingwhere a limited amount of data is available, their approachmay also be ineffective.
The main issues with the above works on mouse dynamicare that the minimum amount of data required to achievemeaningful user identification is impossible to obtain withinthe time constraint of a typical login process. As such, theproposed approaches may be used for user reauthentication(after login) or for continuous authentication, but they maynot be suitable for static authentication (at login time). To ourknowledge, so far only two papers in the literature, publishedby Syukri et al. [13] and Revett et al. [9] have targeted theuse of mouse dynamics for static authentication.
A system that may potentially be used for static authentica-tion, proposed by Syukri et al. [13], utilizes signatures drawnusing a mouse for user identification. The extracted featureswere analyzed using geometric average means. The authorsconducted two experiments involving 21 users, in the first ofwhich a static database was used, and in the second a dynam-ically updated database was used. The performance achievedconsisted of FRR = 9% and FAR = 8% for the static database,and FRR = 7% and FAR = 4% for the dynamic database.
More recently, Revett et al. [9] proposed a new mousedynamic analysis approach for static authentication, namedmouse lock, which exploits the analogy of a safe, in whichthe numbers are replaced with graphic thumbnail images.To login, using a mouse, the user is required to click in apassword that consists of five images. Experimental evaluationconducted with six participants yielded, according to the typeof images, FAR and FRR values of approximately 2%–5%.Although these results represent significant improvement interms of performance, they are still preliminary, as indicatedby the authors. It should also be noted that only six users wereinvolved in the experimental evaluation, which is a very lownumber.
In this context, we propose a new approach in which theuser draws, at login time, a few gestures (in a relatively shorttime) from which the dynamics are collected and analyzedfor authentication purposes. To our knowledge, our work isthe first to present a relatively accurate static authenticationscheme based on mouse gesture dynamics. Existing gesture-based authentication schemes use other input devices (typicallya stylus) [14].

264 IEEE SYSTEMS JOURNAL, VOL. 7, NO. 2, JUNE 2013
Our work relates to the general field of identifying usersbased on their handwriting. A rich body of research hasbeen produced on discriminating users based on their naturalhandwriting [15], [16]. This research is articulated in twomain directions: signature verification and writer identification.While most of the prior work has focused on natural handwrit-ing, there has recently been some interest in discriminatingusers based on their handwriting in a structured input language(such as Graffiti). Under this perspective, our work is closelyrelated to the study conducted by Roberts et al. [17] ondiscriminating users based on their handwriting characteristicsin Graffiti while using PDAs. The goal of the authors wasto confirm or deny a claimed identity based on how theuser reproduces a nonsecret challenge string. Evaluation ofthe proposed approach with 52 participants yielded FAR =0.04% and FRR = 0.64% for strings of four characters, andEER=0% for 16-character strings. These results are extremelyencouraging, although it must be noted that they were obtainedin closed settings, under the assumption that no outsider canaccess the biometric system. This is an important differencewith our work, in which no restriction is made on the typesof users accessing the system. An obvious difference is theinput device used for data collection; while, in the above work,Graffiti characters are drawn using a stylus, our focus is ongestures produced using the computer mouse.
Our work also relates to the general field of graphicalpasswords that have gained interest in the last few years [18],[19]. Similar to traditional passwords, in the existing graphicalpassword schemes, the user is not only expected to memorizeand remember the graphical passwords, he is supposed to hideit during the login process to mitigate possible shoulder surfingattacks. In contrast, our proposed scheme relies solely on theuser biometric information; there is no need for the user tomemorize or hide the gesture.
III. Mouse Gesture Detection
In this section, we give an overview of mouse gestures andpresent the design of our gesture detection system.
A. System Design and Pilot Experiment
Our approach to user authentication based on mouse ges-tures consists of presenting to the user one or several gesturesdrawn from an existing gesture set and asking him to replicatethe gestures a certain number of times. The produced repli-cations are then compared against templates produced by theuser during the enrollment phase.
The raw data collected from the drawing area consist of thehorizontal coordinate (x-axis), vertical coordinate (y-axis), andthe elapsed time in milliseconds at each pixel. Each gesturereplication for a given gesture can be defined as a sequence ofdata points and each data point can be represented by a triple< x, y, t > consisting of the X-coordinate, Y-coordinate, andelapsed time, respectively. The jth replication of a gesture G
can be represented as a sequence Gj = {< x1j, y1j, t1j >,
< x2j, y2j, t2j >, . . . < xnj, ynj, tnj >}, where n is referredto as the gesture size (GS) and each < xij, yij, tij > where(1 ≤ i ≤ n) is a data point. The size of a gesture is the number
Fig. 1. Example of a drawn gesture involving n = 14 data points.
of data points recorded for it. Fig. 1 illustrates an example ofa drawn gesture.
In order to design our system we conducted, in the earlystages of our research, a pilot experiment that involved sixusers. The main purpose of the experiment was to explorewhether it is possible to differentiate between individualsbased on their behavioral biometrics while drawing mousegestures. The participants in the pilot experiment were askedto replicate eight different types of gestures by drawingeach gesture 20 times. The same eight gestures were usedconsistently for all the participants and the only requirementwas to draw them in one stroke.
Based on the pilot experiment, we observed the following.1) The average gesture size drawn in one stroke was 64
data points.2) Some participants started to get used to the experiment
and started to draw the gesture faster, which is a depar-ture from their normal behavior.
3) The raw data contained some noise, such as data pointswith the same time stamp that must be filtered.
4) Although the users were told to be as consistent aspossible while drawing the gestures, as expected, thevariability in shape and size were clearly a major sourceof inconsistency.
Based on the data collected in the pilot study, we were ableto design our gesture data acquisition and analysis framework.Our framework consists of four modules:
1) gesture creation module;2) data acquisition and preparation module;3) feature extraction module;4) classification module.We describe modules 1–3 in the subsequent subsections,
and module 4 in Section IV.
B. Gesture Creation
The gesture creation module is a simple drawing applicationused to ask the participant to freely draw a predefined set ofgestures. The main purpose of this module is to make theparticipant draw the gestures in his own way to replicate themlater on. It is important to note here that the gestures arenot tied to any language and they do not necessarily havea meaning. They can be any drawing that can be producedin a uni-stroke. Also, the gesture creation module serves as a

SAYED et al.: BIOMETRIC AUTHENTICATION USING MOUSE GESTURE DYNAMICS 265
practice step for the participants to get familiar with the ideaof drawing mouse gestures.
The gesture creation module assists the user in two differentways. First, it normalizes the input to the center of the drawingarea. Even though the shifting of the drawn gesture is done,the data is stored without saving these changes.
Second, the module normalizes the gesture spacing toachieve a size of 64 data points. The 64 data points werebased on the pilot experiment that we did in the early stagesof our research. As mentioned earlier, we were able todetermine the average size of drawing the predefined set ofgestures in one stroke.
C. Data Acquisition and Preparation
The data acquisition and preparation module involves threemain components, namely, data acquisition, data preparation,and data smoothing.
1) Data Acquisition: The data acquisition component loadsthe gestures, created initially by the user using the gesturecreation module, and presents them to the user to replicate.The data acquisition module records the user interactionwhile drawing the gesture. The module essentially recordsthe horizontal coordinates denoted by xij , vertical coordinatesdenoted by yij , and the elapsed time in milliseconds startingfrom the origin of the gesture tij , where n is the gesture size,1 ≤ i ≤ n, and j is the gesture replication number. For eachuser, the program creates a directory that will contain the userreplications for the different gestures. Each gesture must bereplicated a specific number of times (e.g., 20 times). Theuser has to wait 3 s between consecutive replications. The ideabehind this waiting time is to prevent the user from drawingthe gesture too fast. The module asks the user to release themouse between each successful replication during the waittime. The main reason why we implemented the wait timeand mouse release is based on one of the observations madein the pilot experiment. We assumed that the wait time andmouse release will force the users to maintain their normalbehavior each time they replicate the gesture.
2) Data Preprocessing: The data acquisition module pre-processes the collected raw data from the computer mouse insuch a way that some noise patterns are ignored or dropped.This is required since the data produced by the pointingdevices is usually jagged and irregular. This kind of prepro-cessing will filter data resulting from a common problem ofthe pointing devices, specifically data points generated withthe same timestamp where ti = ti+1.
After preprocessing the raw data, the data acquisition mod-ule applies two types of normalizations to the input data.The first is center normalization and the second is sizenormalization. The center normalization shifts the gesture tothe center of the drawing area as implemented in the gesturecreation module. We have also to normalize the size so thatthe final size of the gesture is equal to the size of the templategesture in order to compare the two gestures as explained later.We accomplish the normalization by only accepting gesturesdrawn by the participant whose size is greater than or equalto the size of the template gesture. If the gesture size isbigger than the template size, we apply the k-means algorithm
[20] to cluster the data points into 64 clusters. We use thestandard Euclidean distance as the distance measure betweenthe data points in three dimensions < x, y, t >. Afterward, thecentroids of the 64 clusters are used to form the new gesture.
3) Outlier Removal and Data Smoothing: To build theuser profile, we remove outliers from the data and thensmooth it. Data smoothing is generally used to eliminatenoise and extract real patterns from data. In our framework,we use smoothing to smooth the data among the differentreplications obtained for each user. Generally, humans cannotdraw the same gesture with the same exact detail twice underthe same conditions. This will result in some variability inthe replicas produced by the same individual for the samegesture. Data smoothing allows us to smooth such variabilityand minimize its effect on the learning process. We usethe robust version of the standard weighted least-squaresregression (WLSR) method to smooth the data.
We use Peirce’s criterion [21] to eliminate the outliers.Peirce’s criterion method is a robust statistical based methodthat does not make any assumptions about the data. Peirce’scriterion can also deal with the case where the data haveseveral suspicious values.
Peirce’s criterion determines outliers by computingempirically the maximum allowable deviation from thesample mean. Given m the sample size and n the numberof outliers, the ratio R between the maximum allowabledeviation to the standard deviation of the sample is obtainedfrom Peirce’s criterion table. The maximum allowabledeviation is computed as dmax = R × σ, where σ is thestandard deviation of the sample. A data item xi is consideredan outlier if | xi − xm |> dmax, where xm is the sample mean.
Using the above method and starting from n = 1, outliers areremoved sequentially by incrementing the number of possibleoutliers, while keeping the original values of the mean, stan-dard deviation, and sample size. The process is repeated untilno other data item needs to be eliminated. We refer interestedreaders to [21] for more details about the Peirce’s criterion.
We apply the outlier removal and data smoothing stepsonly to the horizontal (x-axis) and vertical (y-axis) coordinatesdata (excluding time). We construct a vector that aggregatesthe same occurrence of the first data point from each of thedifferent replications. Then, we apply the Peirce’s criterionand WLSR method to the data in the vector to produce cleanand smoothed data. We repeat the process for each of theremaining data points of the gesture. Note that the smoothingoccurs only on the training samples (while building the userprofile) and not on the test data.
Algorithm 1 is implemented by the outlier removal and datasmoothing module and assumes the following.
1) Let m be the number of replications.2) Let n be the size of the gesture.3) Let pij = (xij, yij) be a data point, where 1 ≤ j ≤ m,
1 ≤ i ≤ n.4) Given a gesture G, we denote by Gj the jth replica
Gj = (p1j, p2j, . . . , pnj).5) Let Pi denote a vector containing the ith data point from
each of the different replications, where i = 1, 2, . . . , n:Pi = (pi1, pi2, . . . , pim).
266 IEEE SYSTEMS JOURNAL, VOL. 7, NO. 2, JUNE 2013
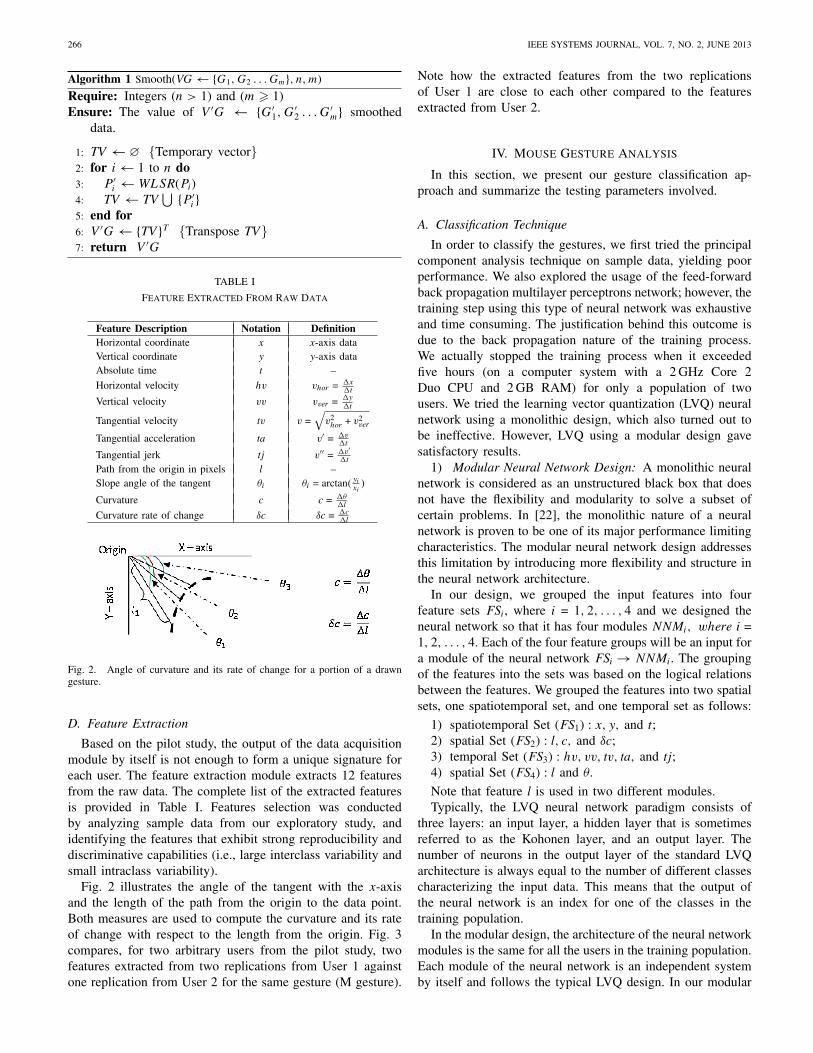
Algorithm 1 Smooth(VG ← {G1, G2 . . . Gm}, n, m)
Require: Integers (n > 1) and (m � 1)Ensure: The value of V ′G ← {G′
1, G′2 . . . G′
m} smootheddata.
1: TV ← ∅ {Temporary vector}2: for i ← 1 to n do3: P ′
i ← WLSR(Pi)4: TV ← TV
⋃ {P ′i }
5: end for6: V ′G ← {TV }T {Transpose TV}7: return V ′G
TABLE I
Feature Extracted From Raw Data
Feature Description Notation DefinitionHorizontal coordinate x x-axis dataVertical coordinate y y-axis dataAbsolute time t –
Horizontal velocity hv vhor = �x�t
Vertical velocity vv vver = �y�t
Tangential velocity tv v =√
v2hor + v2
ver
Tangential acceleration ta v′ = �v�t
Tangential jerk tj v′′ = �v′�t
Path from the origin in pixels l –Slope angle of the tangent θi θi = arctan( yi
xi)
Curvature c c = �θ�l
Curvature rate of change δc δc = �c�l
Fig. 2. Angle of curvature and its rate of change for a portion of a drawngesture.
D. Feature Extraction
Based on the pilot study, the output of the data acquisitionmodule by itself is not enough to form a unique signature foreach user. The feature extraction module extracts 12 featuresfrom the raw data. The complete list of the extracted featuresis provided in Table I. Features selection was conductedby analyzing sample data from our exploratory study, andidentifying the features that exhibit strong reproducibility anddiscriminative capabilities (i.e., large interclass variability andsmall intraclass variability).
Fig. 2 illustrates the angle of the tangent with the x-axisand the length of the path from the origin to the data point.Both measures are used to compute the curvature and its rateof change with respect to the length from the origin. Fig. 3compares, for two arbitrary users from the pilot study, twofeatures extracted from two replications from User 1 againstone replication from User 2 for the same gesture (M gesture).
Note how the extracted features from the two replicationsof User 1 are close to each other compared to the featuresextracted from User 2.
IV. Mouse Gesture Analysis
In this section, we present our gesture classification ap-proach and summarize the testing parameters involved.
A. Classification Technique
In order to classify the gestures, we first tried the principalcomponent analysis technique on sample data, yielding poorperformance. We also explored the usage of the feed-forwardback propagation multilayer perceptrons network; however, thetraining step using this type of neural network was exhaustiveand time consuming. The justification behind this outcome isdue to the back propagation nature of the training process.We actually stopped the training process when it exceededfive hours (on a computer system with a 2 GHz Core 2Duo CPU and 2 GB RAM) for only a population of twousers. We tried the learning vector quantization (LVQ) neuralnetwork using a monolithic design, which also turned out tobe ineffective. However, LVQ using a modular design gavesatisfactory results.
1) Modular Neural Network Design: A monolithic neuralnetwork is considered as an unstructured black box that doesnot have the flexibility and modularity to solve a subset ofcertain problems. In [22], the monolithic nature of a neuralnetwork is proven to be one of its major performance limitingcharacteristics. The modular neural network design addressesthis limitation by introducing more flexibility and structure inthe neural network architecture.
In our design, we grouped the input features into fourfeature sets FSi, where i = 1, 2, . . . , 4 and we designed theneural network so that it has four modules NNMi, where i =1, 2, . . . , 4. Each of the four feature groups will be an input fora module of the neural network FSi → NNMi. The groupingof the features into the sets was based on the logical relationsbetween the features. We grouped the features into two spatialsets, one spatiotemporal set, and one temporal set as follows:
1) spatiotemporal Set (FS1) : x, y, and t;2) spatial Set (FS2) : l, c, and δc;3) temporal Set (FS3) : hv, vv, tv, ta, and tj;4) spatial Set (FS4) : l and θ.
Note that feature l is used in two different modules.Typically, the LVQ neural network paradigm consists of
three layers: an input layer, a hidden layer that is sometimesreferred to as the Kohonen layer, and an output layer. Thenumber of neurons in the output layer of the standard LVQarchitecture is always equal to the number of different classescharacterizing the input data. This means that the output ofthe neural network is an index for one of the classes in thetraining population.
In the modular design, the architecture of the neural networkmodules is the same for all the users in the training population.Each module of the neural network is an independent systemby itself and follows the typical LVQ design. In our modular

SAYED et al.: BIOMETRIC AUTHENTICATION USING MOUSE GESTURE DYNAMICS 267
Fig. 3. Comparing angle of curvature and distance from original features of two replicas belonging to User 1 and one replica belonging to User 2 for thesame gesture.
neural network design the output layer has two neurons, as thenetwork is classifying two classes. The first class is the currentuser class index (i.e., self), and the second class represents theremaining users in the training population (i.e., nonself). Wewill explain in a later section how the training of the neuralnetwork works.
The number of neurons in the hidden layer was determinedthrough trial and error, starting with a small number of neuronsand increasing the number of neurons until no improvementin performance was observed. Based on the data collectedin the pilot study and different setups of the neural networkarchitecture, we came to the conclusion that 72 neurons inthe hidden layer were acceptable for each of the modules.Hence, the number of neurons in the hidden layer is exactlythe same for all the modules. While the hidden layer and theoutput layer designs are the same for all the modules in thenetwork, the input layer is an exception. In the standard LVQinput layer design, each sample must be paired with its label(i.e., self or nonself) and then presented to the LVQ neuralnetwork. In our case, the sample is a particular gesture replicarepresented by a set of features. Since the feature values arecomputed for each data point in the drawn gesture, the totalnumber of input values for a given neural network module isequal to the number of features in the corresponding feature setmultiplied by the gesture size. Hence, the number of neuronsfor the input layer is expressed mathematically as follows:Ninput(NNMi) = Fi × GS, where Fi is the number of featuresin feature set FSi, (1 ≤ i ≤ 4) and GS is the gesture size.Every module in the neural network is considered a separateclassifier. The decision of each module does not affect theother modules. That being said, the final decision is based onthe aggregated output of the four modules. The output of eachmodule is aggregated through a voting scheme yielding thefinal decision.
Any of the four modules has only one of two possibleoutput values: self (i.e., user recognized) or nonself (user notrecognized). Let λ denote a decision threshold correspondingto the minimum number of modules that must classify a givensample as self for the user to be recognized as genuine. Theselection of a specific value of λ is a design decision. For
instance, a value of λ = 3 means that at least three modulesmust classify the sample as self for the user to be recognizedas genuine; a value of λ = 4 means that all four modules mustclassify the sample as self for the user to be recognized asgenuine. Therefore, even if three modules classify the sampleas self, the user will still be rejected. Cases where λ ≤ 1are excluded for obvious reasons, because they could lead toscenarios where a sample would be classified as genuine whilenone or only one of the modules has classified it as such.When λ = 2, at least two modules must classify the sampleas self for the sample to be accepted, which means that in thecase where exactly two modules classify the sample as self theoverall decision will be to accept the user as genuine. A morerestrictive design could be adopted by rejecting cases whereexactly two modules would classify the sample as self (whilethe other two classify it as nonself); such cases are alreadycovered by having λ = 3. Therefore, the value of λ must beselected in the range [2, 4].
2) Neural Network Training: Using the LVQ2 algorithmdeveloped by Kohonen for training [23], we follow the regularprocedure of training the LVQ neural network by presentingthe sample data along with its labels. In our framework,there is a separate profile for each gesture for each user.It is important to note that while all the gestures share thesame modular neural network architecture, explained in theprevious section, each gesture for each user is associated witha separate set of weights derived through training. For eachgesture for each user, the associated weights will represent thecorresponding profile.
In our pilot study, all the gesture replications drawn by eachuser were divided into two separate sets, a training set and avalidation set. We apply a hierarchical training procedure totrain the neural network. The main objective of the hierarchicaltraining is to improve the performance of the network. Weform a three-level tree-like hierarchy from the training set byaveraging the different replications drawn by the user. Theaveraging of the replications follows a specific procedure. Theprocedure starts by dividing the replications in the training setinto groups of equal size that form the bottom most level.The size of each group must be less than the size of the
268 IEEE SYSTEMS JOURNAL, VOL. 7, NO. 2, JUNE 2013
training set. The average of each group is calculated to formthe second level of the hierarchy. We call the second level, thelevel of the sub-means. The root of the hierarchy, which is theoverall mean of the replications, is formed by calculating theaverage of the sub-means in the second level that forms thetop most level. After constructing such a hierarchy, the trainingof the modular neural network proceeds from the root to thebottom level of the hierarchy. In other words, we construct thehierarchy in a bottom-up approach and then train the networkin a top-down manner.
The rationale behind such a technique is that starting thetraining of the neural network with the overall mean of thereplication allows the weights of the neural network to getquickly adjusted to the center of the current user cluster ofreplications. Then, the weights get adjusted to the sub-meansin the second level until reaching the actual replications of theuser in the bottom level. In the pilot experiment, we noticedthat by applying the hierarchical training technique, the train-ing error in some cases converged to zero, which is optimal.
We train the neural network through both positive and nega-tive training. Positive training is based on the set of replicationsdrawn by user X. However, the selection of the negativetraining set is not straightforward. One way of conductingthe negative training is by considering all, or a subset of thereplications of the remaining users in the training populationas the negative training set. For instance, if we have n users inthe training population the negative training set for each usermay be the replications of the remaining n − 1 users. Clearly,this is not the optimal solution from a scalability perspective.Ideally, the negative training set should contain the replicationsof the nearest subject to the current user. This should be goodenough for the neural network to draw the decision boundarybetween the current user and the closest subject, which, inturn, allows the network to discriminate between the currentuser and all the subjects in the training population. In ourimplementation, we used (1) (see below) to pick the nearestand the second nearest users to conduct the negative training.The same formula was used by Lee et al. [15] to measure thedistance between the feature vectors in their proposed systemfor online human signature verification. Let m(a, i) and σ2(a, i)be the sample mean and the sample variance of feature i
computed from a specific set of gesture replications for user a,respectively. Then, the distance measure for feature i betweenusers a and b for a specific gesture is defined as follows:
di(a, b) =|m(a, i) − m(b, i)|√
σ2(a, i) + σ2(b, i). (1)
Based on the above formula, the distance between user a
and user b is defined as follows:
d(a, b) =n∑
i=1
di(a, b). (2)
We say that user b is the nearest subject to user a inpopulation P if
d(a, b) = minx∈P and x �=ad(a, x).
We take the gesture replications of the nearest and secondnearest users in population P as the negative training samples.
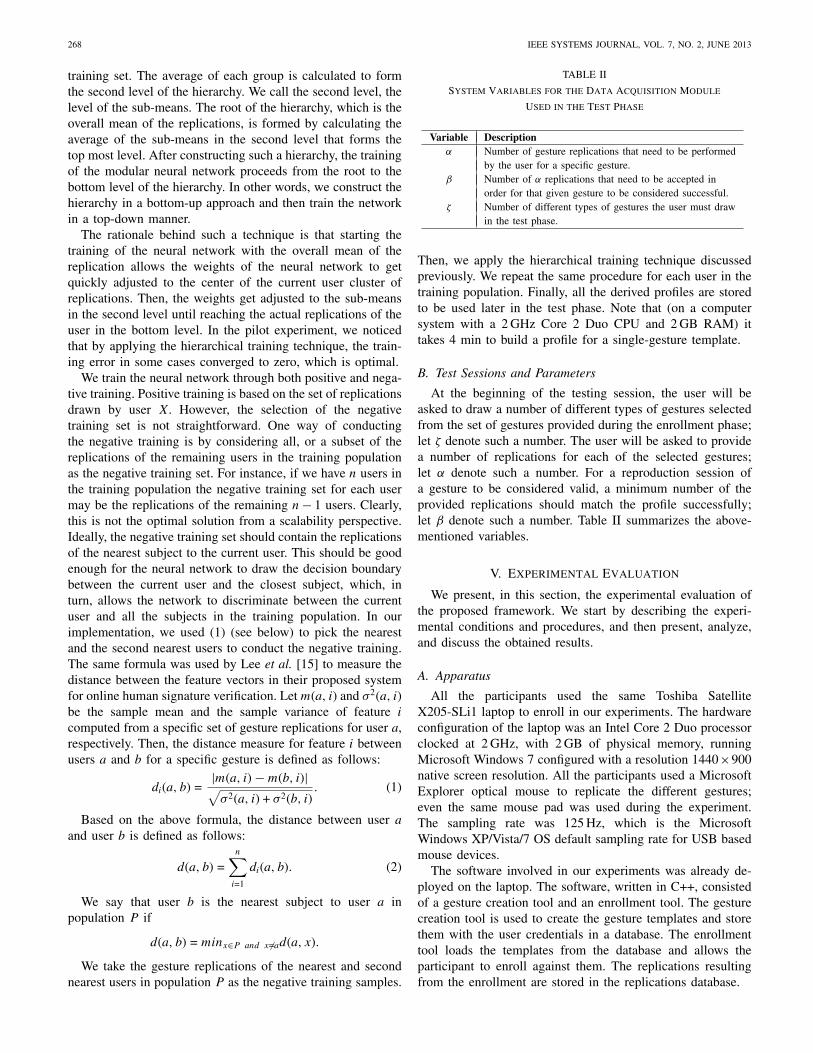
TABLE II
System Variables for the Data Acquisition Module
Used in the Test Phase
Variable Descriptionα Number of gesture replications that need to be performed
by the user for a specific gesture.β Number of α replications that need to be accepted in
order for that given gesture to be considered successful.ζ Number of different types of gestures the user must draw
in the test phase.
Then, we apply the hierarchical training technique discussedpreviously. We repeat the same procedure for each user in thetraining population. Finally, all the derived profiles are storedto be used later in the test phase. Note that (on a computersystem with a 2 GHz Core 2 Duo CPU and 2 GB RAM) ittakes 4 min to build a profile for a single-gesture template.
B. Test Sessions and Parameters
At the beginning of the testing session, the user will beasked to draw a number of different types of gestures selectedfrom the set of gestures provided during the enrollment phase;let ζ denote such a number. The user will be asked to providea number of replications for each of the selected gestures;let α denote such a number. For a reproduction session ofa gesture to be considered valid, a minimum number of theprovided replications should match the profile successfully;let β denote such a number. Table II summarizes the above-mentioned variables.
V. Experimental Evaluation
We present, in this section, the experimental evaluation ofthe proposed framework. We start by describing the experi-mental conditions and procedures, and then present, analyze,and discuss the obtained results.
A. Apparatus
All the participants used the same Toshiba SatelliteX205-SLi1 laptop to enroll in our experiments. The hardwareconfiguration of the laptop was an Intel Core 2 Duo processorclocked at 2 GHz, with 2 GB of physical memory, runningMicrosoft Windows 7 configured with a resolution 1440×900native screen resolution. All the participants used a MicrosoftExplorer optical mouse to replicate the different gestures;even the same mouse pad was used during the experiment.The sampling rate was 125 Hz, which is the MicrosoftWindows XP/Vista/7 OS default sampling rate for USB basedmouse devices.
The software involved in our experiments was already de-ployed on the laptop. The software, written in C++, consistedof a gesture creation tool and an enrollment tool. The gesturecreation tool is used to create the gesture templates and storethem with the user credentials in a database. The enrollmenttool loads the templates from the database and allows theparticipant to enroll against them. The replications resultingfrom the enrollment are stored in the replications database.

SAYED et al.: BIOMETRIC AUTHENTICATION USING MOUSE GESTURE DYNAMICS 269
B. Participants
The main objective of our experiment was to be able torecognize individuals based on their mouse gestures. Ideally,the system should be able to recognize, with a high degreeof accuracy, the behavior of each user while replicatinga specific gesture. To achieve such a goal, 39 volunteerswere involved in our experiment. The participants were fromvarious backgrounds, with ages ranging from 19 to 54 yearsold. Participants’ skill levels ranged from novice users usingcomputers only occasionally to individuals using computerson a regular basis as part of their professions (e.g., universityfaculty members, students, engineers).
Participants in the experiment were divided into two groups:a group of 29 individuals representing legal users and a groupof ten individuals representing impostors.
C. Method and Data
Before starting the experiment, the participants were showna sample gesture set as an example of uni-stroke gestures. Theidea was to get the participants familiar with drawing gestures.All the legal participants used the same laptop to draw thesame set of prechosen gestures. The gestures replicationsalong with the participants’ credentials were stored in a userdatabase. There was only one requirement that was to drawsuch gestures in one stroke, as in practice, programs that makeuse of mouse gestures typically implement them in a uni-strokeform.
The legal participants in the experiments were asked to drawthe following five gesture templates: G, Y, M, Z, and 5. Thegestures were chosen to include combinations of lines, anglesand curves. The main reasoning for this choice was, the moreangles and curves the gesture has, the more it will requiremuscle tension and concentration from the users. This, in turn,imposes the intrinsic behavior of the human motor controlwhile drawing such gestures.
Each of the 29 legal users was asked to draw the gesturetemplates first and then replicate each gesture template 30times. The 30 replications were provided over six sessions,each involving exactly five replicas, with an average of oneday interval between consecutive sessions. In a session, eachgesture was replicated five times in sequence. For each (of thefive) gesture templates, 150 replications per participant werecollected, giving in total 4350 genuine replications spread over174 legal sessions.
Each of the ten impostors was asked to forge the (five)gesture templates of at least five legitimate users selectedrandomly from the above 29 legal users. Care was taken toensure that each legal user would be targeted by exactly fivedifferent impostors. An impostor was shown a sample gesturefor a given legitimate user and asked to forge it by providingfive replicas. This resulted in 3625 forged replications spreadover 725 impostor sessions.
D. Evaluation Process
During a test session, the impostor is asked to replicate eachgesture a certain number of times; for this evaluation, we usedα = 5. For each of the legal users, we selected five sessions
out of the six sessions for training purposes and the remainingone was used for testing. This means that α = 5 and β canrange between (1 ≤ β ≤ 5). Both α and β were explainedpreviously in Table II. It is important to note that while boththe test and training data undergo the same preprocessing stepby the data acquisition module (see Section III-C2), only thetraining data undergo the smoothing step (see Section III-C3).
We start by building a reference profile (per gesture tem-plate) for each of the n legitimate users, using 25 replicas fromeach user as the enrollment samples (n = 29). Note that noneof the replicas from the impostors will be used in this process.
To calculate the FRR, the remaining five replicas (notinvolved in the enrollment) of each of the legal users Uj, 1 ≤j ≤ n, is tested against their own reference profile. Thiscorresponds to a total number of n trials. A false rejectionFR will occur if the number of matching replicas is below thethreshold β
FR =
{1, if number of matching replicas < β
0, otherwise.
The global FRR is computed as the ratio between the totalnumber of false rejections over all the test trials and the totalnumber of test trials n
FRR =
n∑j=1
count({FR}j)
n× 100
where j (1 ≤ j ≤ n) is the test trial index.
During the experiments, each of the legal users was attackedby five different impostors; the impostors attempted to forgeeach legal user’s (five) gestures five times; this corresponds tofive attack sets per legal user a = 5.
To calculate the FAR, each of the impostor samples wascompared against the profile of the corresponding legal userbeing targeted in the forgery. The total number of test trials inthis case is N = 5 × a × n. A false acceptance FA will occurif the number of matching replicas is above the threshold β
FA =
{1, if number of matching replicas ≥ β
0, otherwise.
The global FAR is computed as the ratio between the totalnumber of false acceptances over all the test trials and thetotal number of test trials N
FAR =
N∑j=1
count({FA}j)
N× 100
where j (1 ≤ j ≤ N) is the test trial index.
As mentioned before, the system variable α was selected andfixed to equal five replicas; however, we varied the values ofthe other two system variables to measure their impact on theframework performance. Namely, the voting system variableλ that ranged from (2 ≤ λ ≤ 4) and β that ranged from(1 ≤ β ≤ α). The global FARβ,λ and FRRβ,λ were calculatedaccordingly for each system variable value.

270 IEEE SYSTEMS JOURNAL, VOL. 7, NO. 2, JUNE 2013
TABLE III
Recognition Performance for G Gesture
λ β = 1 β = 2 β = 3 β = 4 β = 5
λ = 2FAR 16.83 10.98 6.84 4.11 1.40FRR 0 3.44 17.24 39.65 72.98
λ = 3FAR 8.44 3.54 1.64 0.66 0.07FRR 50 65.51 74.13 83.33 93.67
λ = 4FAR 2.18 0.54 0.16 0 0FRR 89.08 93.67 97.12 99.42 100
Fig. 4. ROC curves of G, Y, Five, M, and Z gestures. λ is the minimumnumber of modules that need to agree for voting in the neural networkclassifier. (a) ROC curve for the G gesture. (b) ROC curve for the Y gesture.(c) ROC curve for the Five gesture. (d) ROC curve for the M gesture.(e) ROC curve for the Z gesture.
E. Evaluation Results
We applied the above-mentioned evaluation method sixtimes separately for each of the five gestures (ζ = 1) involvedin our experiment, and computed global FRR and FAR whilevarying α and β. Each time one session was used as the testsession exactly once and the remaining five sessions were usedto build the user profile. The obtained results were averagedand are shown in Tables III–VII and depicted using receiveroperating characteristic (ROC) curves in Fig. 4.
As we can see from the results, all the gestures are close toeach other in performance. Some of the best operating points
TABLE IV
Recognition Performance for Y Gesture
λ β = 1 β = 2 β = 3 β = 4 β = 5
λ = 2FAR 15.83 10.20 6.73 4.25 2.11FRR 1.72 4.59 14.36 35.63 74.13
λ = 3FAR 8.44 3.73 2.21 1.18 0.33FRR 47.70 64.36 77.01 85.63 94.82
λ = 4FAR 2.85 0.61 0.26 0 0FRR 83.90 90.22 92.52 94.82 97.70
TABLE V
Recognition Performance for Number Five Gesture
λ β = 1 β = 2 β = 3 β = 4 β = 5
λ = 2FAR 14.74 9.01 5.63 3.11 1.18FRR 1.72 11.49 22.41 45.40 77.01
λ = 3FAR 6.80 2.16 0.61 0.21 0FRR 39.08 61.49 72.98 84.48 94.82
λ = 4FAR 1.18 0.11 0 0 0FRR 93.67 98.27 98.85 99.42 100
TABLE VI
Recognition Performance for the M Gesture
λ β = 1 β = 2 β = 3 β = 4 β = 5
λ = 2FAR 16.81 11.17 6.65 3.44 0.61FRR 1.14 5.17 17.81 37.93 75.86
λ = 3FAR 8.89 2.99 1.16 0.28 0FRR 41.37 52.87 63.79 79.31 96.55
λ = 4FAR 2.23 0.23 0.09 0 0FRR 86.20 92.52 96.55 99.42 99.42
obtained in those cases vary for the FAR between 8.65% and11.17%, while the FRR stand between 3.44% and 11.49%,when β = 2 and λ = 2.
In any case, it appears from the above results that usinga single gesture may not be very effective on its own. Inthis regard, we modified our evaluation method so that itincludes two gestures in the test session (ζ = 2) as opposedto only one gesture (ζ = 1) in the previous evaluation.The number of replicas drawn by the individuals remainedfixed at α = 5 for each gesture; however, we varied the β
system variable. This means that the user will be requiredto draw in total ten replicas in the test session. Let β1 bethe number of accepted replicas from the first gesture and β2
be the number of accepted replicas from the second gesture.A false acceptance will occur if any combination of β1 andβ2 satisfies
(β1 + β2 ≥ β, where β1, β2 ≤ α
), and false
rejection will occur if any combination of β1 and β2 satisfies(β1 + β2 < β, where β1, β2 ≤ α
). Tables VIII, IX, and
Fig. 5(a), (b) illustrate the performance results and ROC curvesobtained for the combination of the Z gesture with G gestureat one time and Five gesture with M gesture at a second time.We observed an improvement in performance with (FAR =5.93%, FRR = 8.62%) for (Z, G) combination, and (FAR =6.04%, FRR = 10.91%) for (Five, M) combination, when β = 5and λ = 2.
Furthermore, we studied the combination of three and fourgestures (ζ = 3, 4). The previously mentioned method forcombining the results of two gestures is applied with the

SAYED et al.: BIOMETRIC AUTHENTICATION USING MOUSE GESTURE DYNAMICS 271
TABLE VII
Recognition Performance for Z Gesture
λ β = 1 β = 2 β = 3 β = 4 β = 5
λ = 2FAR 14.91 8.65 5.42 3.21 0.87FRR 1.14 5.17 21.26 50.57 84.48
λ = 3FAR 6.06 2.02 1.04 0.42 0FRR 49.42 67.24 78.73 88.50 97.70
λ = 4FAR 1.18 0.09 0 0 0FRR 87.93 94.25 98.27 99.42 100
TABLE VIII
Recognition Performance for Z Gesture and
G Gesture Combined
λ β = 3 β = 4 β = 5 β = 6 β = 7
λ = 2FAR 12.22 8.57 5.93 3.95 2.57FRR 1.14 2.29 8.62 18.96 35.05
λ = 3FAR 3.17 1.93 1.08 0.41 0.20FRR 54.59 66.09 76.43 83.90 90.22
λ = 4FAR 0.25 0 0 0 0FRR 95.40 98.85 100 100 100
TABLE IX
Recognition Performance for Five Gesture and
M Gesture Combined
λ β = 3 β = 4 β = 5 β = 6 β = 7
λ = 2FAR 12.52 9.44 6.04 3.94 1.97FRR 1.14 3.44 10.91 21.83 35.63
λ = 3FAR 2.64 1.21 0.41 0.16 0.11FRR 41.95 50.57 69.54 83.33 91.37
λ = 4FAR 0.13 0.09 0.02 0 0FRR 95.40 98.85 78.71 100 100
addition of a third and a fourth gesture. Let β3 correspondto the number of accepted replicas of the third gesture, and β4
correspond to the number of accepted replicas of the fourthgesture. Tables X and XI and Fig. 5(c) and (d) illustrate theperformance results and ROC curves obtained for combiningthe Z, G, and M gestures for the first test, and Z, G, M, andY gestures for the second test. When β = 7 and λ = 2, weobtain for the (Z, G, M) combination FAR = 6.39% and FRR= 4.59%. We obtain for the (Z, G, M, Y) combination FAR =5.26% and FRR = 4.59% with ERR=5.11% when β = 10 andλ = 2, which is a net improvement in the system performanceas the number of gestures increase. We excluded gesture Fivefrom the above combination because it achieves the worstperformance compared to the other gestures. For instance, bycomputing the half total error rate (HTER) (i.e., the sum of theFAR and FRR divided by two), we can notice that the HTERfor the gesture Five is 10.25%, while for the other gestures itranges between 6.91% and 8.17%.
By analyzing the curves provided in Figs. 4 and 5 andthe performance results provided in Tables III–XI, we cannotice that as λ increases the FRR increases while the FARdecreases, regardless of the number of gestures combined.Similarly, as β increases the FRR increases while the FARdecreases. Intuitively, this can be explained by the fact thathigh values of λ or β lead to more restriction, which meansgreater possibility for false rejections. In contrast, lower values
TABLE X
Recognition Performance for Z, G, and M Gestures Combined
λ β = 6 β = 7 β = 8 β = 9 β = 10
λ = 2FAR 8.55 6.39 4.68 3.47 2.43FRR 1.72 4.59 8.62 16.66 31.03
λ = 3FAR 1.28 0.68 0.36 0.18 0.09FRR 62.64 67.24 75.28 83.33 89.65
λ = 4FAR 0 0 0 0 0FRR 99.42 100 100 100 100
TABLE XI
Recognition Performance for Z, G, M, and Y Gestures Combined
λ β = 8 β = 9 β = 10 β = 11 β = 12
λ = 2FAR 8.45 6.71 5.26 4.32 3.40FRR 1.14 1.72 4.59 9.77 14.36
λ = 3FAR 1.40 1 0.64 0.32 0.20FRR 60.91 66.66 72.98 79.31 87.35
λ = 4FAR 0.02 0 0 0 0FRR 99.42 100 100 100 100
TABLE XII
Margin of Error for the CI Around the HTER Result of Z, G, M,
and Y Gestures Combined
δ Z
90% 1.44%95% 1.72%99% 2.26%
of β or λ will lead to a more permissive design, which meansgreater possibility for false acceptances. We can also notice insome cases where λ = 4 (and β is greater than some value), thesystem is so restrictive that all samples are rejected regardlessof whether these samples are from genuine users or impostors.Such exterme cases yield FRR = 100% and FAR = 0% asperformances.
The assessment of confidence of the accuracy of biometricsystems is not straightforward. Likewise, Gamassi et al. [24]presented a thorough discussion of the challenges surroundingthe estimation of confidence of the accuracy of biometricsystems. According to Bengio and Mariethoz [25], standardstatistical tests cannot be used “as is” to measure the statisticalsignificance of person authentication models, because severalof the performance metrics used to assess those models, suchas EER or HTER, are aggregates of two measures (e.g., FARand FRR). We calculated the confidence interval (CI) for thecombination of four gestures using the method proposed in[25]. In the proposed method, the distribution of the number oferrors is approximated to a normal distribution with standarddeviation σ. We used the HTER formula to calculate the CIaround the result of the combined four gestures. Based on ourexperiments, we have HTER=4.93% and σ = 0.0088. The CIaround an HTER is HTER±Z, where Z is the margin of error.Table XII depicts the margin of error at a different confidencelevel δ.
It must be noted that increasing the number of gesturescomes at the expense of usability. As is often expected, atradeoff must be made between security and usability.

272 IEEE SYSTEMS JOURNAL, VOL. 7, NO. 2, JUNE 2013
Fig. 5. ROC curves for combined gestures. (a) ROC curve for the Z and Ggestures combined. (b) ROC curve for the Five and M gestures combined.(c) ROC curve for the Z, G, and M gestures combined. (d) ROC curve forthe Z, G, M, and Y gesture combined with ERR = 5.11%.
TABLE XIII
Length of Test Session for Different Gesture Combinations
Number of Gesture Time Gesture TotalGestures Production between Verification Time
Combined Time Gestures Time (s)(s) (s)a (s)b
1 5 0.4 1.25 6.652 10 0.9 2.5 13.43 15 1.4 3.75 20.154 20 1.9 5 26.9
a Pause time performed by the data capture module between eachgesture replication drawn by the user.b Time taken by the modular neural network to recognize the gest-ure and output decision.
From the above results, it can be observed that althoughcombining several gestures increases the challenge of the testsession on both the legitimate and nonlegitimate users, both theFAR and FRR tend to decrease. On the other hand, combininggestures increases the length of the test session, as the averageproduction time of a gesture is 1 s. Table XIII provides abreakdown of the duration of the different components of atest session according to the number of gestures combined.The time between gestures during verification that is set to 100ms can be lowered if necessary; note that the time betweeneach gesture replication during enrollment was set to 3 sfor the reasons explained earlier. The session length for fourgestures is 26.9 s, which, in relative terms, is not too longa time when compared to performance results obtained forsome existing graphical password schemes proposed in theliterature. Likewise, a recent survey by Briddle et al. coveringseveral existing graphical password schemes shows that theirlogin times vary from 6 to 180 s [26].
VI. Conclusion
In this paper, we highlighted the challenges faced by mousedynamics biometric technology when it is applied to staticauthentication and proposed a new framework based on mousegesture dynamics that achieves encouraging results towardaddressing those challenges. The proposed framework uses amodular design of the LVQ neural network for classification.We conducted an experimental evaluation of the frameworkinvolving 39 users, yielding FAR = 8.65%, FRR = 5.17% whenonly one gesture was used, FAR = 8.57%, FRR = 2.29% whentwo gestures were combined, FAR = 6.39%, FRR = 4.59%when three gestures were combined, and FAR = 5.26%, FRR= 4.59% when four gestures were combined. Our study clearlyindicated that the combination of several gestures be used toachieve acceptable performance in static user authentication.A tradeoff, however, must be made between usability andsecurity, which necessarily indicates some limitations in themaximum number of gestures that could be used. The resultsobtained in our study are encouraging and highlight thepromise of mouse dynamics for static authentication. However,the results obtained with four gestures show that more workmust be done to increase the accuracy of our proposedscheme before it can be used in practice for static authenti-cation.
As mentioned earlier in the related work section, whilethere are a few promising works on mouse dynamics biometricanalysis, most of these proposals require a significant amountof data for authentication, and as such may be used forcontinuous authentication or user reauthentication, but are notadequate for static authentication at login time. Among thefew proposals that can be used for static authentication, eitherrelatively low accuracy was achieved, as in the work of Syukriet al. [13], or a relatively small sample size was used, asin the work of Revett et al. [9]. In this paper, we addressedthe above issues by improving accuracy and using a greatersample size. On one hand, while Syukri et al. obtained (FAR= 8%, FRR = 9%) with a static database, we achieved abouthalf of these error rates using the same type of database (i.e.,withour updating). On the other hand, while our error ratesare comparable to those obtained by Revett et al., our userpopulation is much larger.
In our future work, we intend to enhance the accuracy of ourproposed scheme by revisiting various aspects. For instance,we plan to investigate a different decision scheme other thanthe simple voting used. For example, if we know that oneof the neural network modules is more accurate than theothers, we might investigate a weighted voting scheme. Theinteresting part would be how to scale the weights per useras opposed to a system wide weight. We also plan to extendand strengthen our current feature set by exploring some newfeatures with the purpose of improving ultimately the accuracyof our proposed authentication scheme. In particular, we planto identify relevant features from existing handwriting schemesand investigate how these features can help us achieve betteraccuracy. Furthermore, we plan to investigate new analysistechniques that would allow us reducing the number of gesturereplicas used in our enrollment process, which is currently veryhigh.

SAYED et al.: BIOMETRIC AUTHENTICATION USING MOUSE GESTURE DYNAMICS 273
Since our proposed system is entirely software based, inte-gration in a complex system environment (e.g., e-commerce ore-learning portals) should be straightforward from an imple-mentation perspective. This simply requires exposing, throughan application programming interface, essential functions forenrollment and verification. While the verification is relativelyfast, it takes 20 min, on average, to train the user profile(during enrollment) for the five gesture templates based on ourexperimental platform (i.e., a computer system with a 2 GHzCore 2 Duo CPU and 2 GB RAM). Such a training time can bereduced drastically using a more powerful server and parallelcomputing. Using advanced software middleware technologies(e.g., web services) would allow addressing the interoperabil-ity challenges inherent in complex system enviroments.
However, critical challenges would still remain that shouldbe addressed for our system to be fully operational in acomplex system environment. One of these challenges is theprotection of the proposed system against security attacks.Like many other biometric technologies, mouse dynamicscan be the target of replay attacks. Such threats could bemitigated by strengthening the protection of the biometrictemplates using cryptographic and data shuffling techniques[1]. Mouse dynamics can also be the target of automatedattacks, also referred to as generative attacks, where highquality forgeries can be generated automatically using a smallset of genuine samples [2]. We plan, in our future work, tostrengthen our system by investigating the impact of generativeattacks against it.
References
[1] S. Cimato, M. Gamassi, V. Piuri, R. Sassi, and F. Scotti, “Privacy-awarebiometrics: design and implementation of a multimodal verificationsystem,” in Proc. Annu. Comp. Sec. Apps. Conf., 2008, pp. 130–138.
[2] D. Lopresti, F. Monrose., and L. Ballard, “Biometric authenticationrevisited: Understanding the impact of wolves in sheep’s clothing,” inProc. 15th USENIX Sec. Symp., 2006.
[3] M. S. Obaidat and N. Boudriga, Sec of e-Sys and Comp Networks.Cambridge, MA: Cambridge Univ. Press, 2007.
[4] M. Obaidat and B. Sadoun, “Verification of comp. users using keystrokedynamics,” IEEE Trans. Syst., Man, Cybern., vol. 27, no. 2, pp. 261–269,Apr. 1997.
[5] H. Gamboa and A. Fred, “A behavioral biometric system based onhuman-comp. inter,” in Proc. Conf. Biometric Tech. Human Identifica-tion, vol. 5404. 2004, pp. 381–392.
[6] A. A. E. Ahmed and I. Traore, “A new biometric tech. based on mousedynamics,” IEEE Trans. Dependable Secure Comput., vol. 4, no. 3, pp.165–179, Jul.–Sep. 2007.
[7] M. Pusara and C. E. Brodley, “User reauthentication via mouse move-ments,” in Proc. ACM Workshop Visualization Data Mining Comp. Sec.(VizSEC/DMSEC), 2004, pp. 1–8.
[8] N. Zheng, A. Paloski, and H. Wang, “An efficient user verification sys-tem via mouse movements,” in Proc. 18th ACM Conf. Comp. Commun.Sec., 2011, pp. 139–150.
[9] K. Revett, H. Jahankhani, S. de Magalhaes, and H. M. D. Santos,“A survey of user authentication based on mouse dynamics,” in Proc.ICGeS, CCIS’12, 2008, pp. 210–219.
[10] P. Oel, P. Schmidt, and A. Shmitt, “Time prediction of mouse-basedcursor movements,” in Proc. Joint AFIHM-BCS Conf. Human Comp.Inter., vol. 2. Sep. 2001, pp. 37–40.
[11] A. A. E. Ahmed and I. Traore, “System and method for determininga comp. user profile from a motion-based input device,” U.S. patent10/555408, PCT/CA2004/000669, 2003.
[12] A. Nazar, I. Traore, and A. Ahmed, “Inverse biometrics for mousedynamics,” Int. J. Artif. Intell. Pattern Recognit., vol. 22, no. 3, pp.461–495, May 2008.
[13] A. F. Syukri, E. Okamoto, and M. Mambo, “A user identification systemusing signature written with mouse,” in Proc. 3rd Australasian Conf.Inform. Sec. Privacy, 1998, pp. 403–414.
[14] S. Patel, J. Pierce, and G. Abowd, “A gesture-based authenticationscheme for untrusted public terminals,” in Proc. UIST, Oct. 2004.
[15] L. L. Lee, T. Berger, and E. Aviczer, “Reliable online human signatureverification systems,” IEEE Trans. Pattern Anal. Mach. Intell., vol. 18,no. 6, pp. 643–647, Jul. 1996.
[16] R. Plamondon and S. N. Srihari, “Online and off-line handwritingrecognition: A comprehensive survey,” IEEE Trans. Pattern Anal. Mach.Intell., vol. 22, no. 1, pp. 63–84, Jan. 2000.
[17] R. R. M. Roberts, R. A. Maxion, K. S. Killourhy, and F. Arshad, “Userdiscrimination through structured writing on PDAs,” in Proc. 37th Annu.IEEE/IFIP Int. Conf. Dependable Syst. Netw., 2007, pp. 378–388.
[18] I. Jermyn, A. Mayer, F. Monrose, M. K. Reiter, and A. D. Rubin, “Thedesign and analysis of graphical passwords,” in Proc. 8th Conf. USENIXSec. Symp. (SSYM), 1999, p. 1.
[19] C. Varenhorst. (2004). Passdoodles: A Lightweight Authentica-tion Method [Online]. Available: http://people.csail.mit.edu/emax/papers/varenhorst.pdf
[20] S. Lloyd, “Least squares quantization in pcm,” IEEE Trans. Inform.Theory, vol. 28, no. 2, pp. 129–137, Mar. 1982.
[21] S. Ross, “Peirce’s criterion for the elimination of suspect experimentaldata,” J. Eng. Tech., vol. 20, no. 2, 2003.
[22] F. Azam, “Biologically inspired modular neural networks,” Ph.D. dis-sertation, Virginia Polytechnic Instit. State Univ., Blacksburg, 2000.
[23] T. Kohonen, Self-Organizing Maps (Springer Series in InformationSciences, vol. 30), 3rd ed. Berlin, Germany: Springer, 2001.
[24] M. Gamassi, M. Lazzaroni, M. Misino, V. Piuri, D. Sana, and F. Scotti,“Accuracy and performance of biometric systems,” in Proc. Instrum.Meas. Tech. Conf., 2004, pp. 510–515.
[25] S. Bengio and J. Mariethoz, “A statistical significance test for personauthentication,” in Proc. Odyssey: Speaker Language Recognition Work-shop, 2004.
[26] R. Biddle, S. Chiasson, and P. C. V. Oorschot, “Graphical passwords:Learning from the first twelve years,” School Comp. Sci., Carleton Univ.,Ottawa, ON, Canada, Tech. Rep. TR-11-01, Jan. 2011.
Bassam Sayed received the B.Sc. degree in com-puter science from Helwan University, Cairo, Egypt,and the M.A.Sc. degree from the Department ofElectrical and Computer Engineering, University ofVictoria, Victoria, BC, Canada, where he is currentlypursuing the Ph.D. degree.
His current research interests include behavioralbiometrics, Botnet detection, and web-based mal-ware detection.
Issa Traore received the Ph.D. degree in soft-ware engineering from the Institute NationalePolytechnique-LAAS/CNRS, Toulouse, France, in1998.
He has been with the Faculty of the Department ofElectrical and Computer Engineering, University ofVictoria, Victoria, BC, Canada, since 1999, wherehe is currently an Associate Professor and a Co-ordinator with the Information Security and ObjectTechnology Laboratory.
Isaac Woungang received the M.S. and Ph.D.degrees in mathematics from the Universite de laMediterranee-Aix Marseille II, France, and the Uni-versite du Sud, Toulon & Var, France, in 1990 and1994, respectively.
Since 2002, he has been with Ryerson University,Toronto, ON, Canada, where he is currently an Asso-ciate Professor of computer science and a Coordina-tor with the Distributed Applications and BroadbandLaboratory, Department of Computer Science.

274 IEEE SYSTEMS JOURNAL, VOL. 7, NO. 2, JUNE 2013
Mohammad S. Obaidat (F’05) received the M.S.and Ph.D. degrees in computer engineering with aminor in computer science from Ohio State Univer-sity, Columbus.
He is an internationally renowned Academic/Researcher/Scientist. He is currently a Full Professorof computer science with Monmouth University,West Long Branch, NJ. He has previously held thepositions of Chair of the Department of ComputerScience and Director of the Graduate Program, Mon-mouth University. He has published over ten books
and 500 refereed technical articles.Dr. Obaidat has received extensive research funding. He is the Editor-in-
Chief of three scholarly journals and is also an editor and Advisory Editor ofnumerous international journals and transactions, including IEEE journals andtransactions. He is a fellow of SCS. He has chaired numerous internationalconferences and given numerous keynote speeches all over the world.