biomass torrefaction – a promising pt t m fhdtht ... 2009.pdf · biomass torrefaction – a...
TRANSCRIPT

Biomass Torrefaction – A Promising P t t t M th d f Th Ch i l Pretreatment Method for Thermo-Chemical
Conversion Technologies
Sudhagar Mani, Jim , Jim KasterKaster, , & KC Das& KC DasFaculty of Engineering, University of Georgia, Athens, GAFaculty of Engineering, University of Georgia, Athens, GA
Email: Email: [email protected]@engr.uga.edu
IEA Bioenergy ConferenceBiofuels & Bioenergy: A Changing ClimateBiofuels & Bioenergy: A Changing Climate
Vancouver, BC CanadaAug 23-26, 2009

IntroductionIntroductionIntroductionIntroductionIssues with biomass feedstockIssues with biomass feedstock•• Wide range of moisture content (60Wide range of moisture content (60--15% 15% wbwb))
•• Low bulk density (4 Low bulk density (4 –– 8 lbs/ft8 lbs/ft33))
•• Low energy density (4,500Low energy density (4,500--7,500 Btu/lb)7,500 Btu/lb)
•• Uneven particle sizes (no flow)Uneven particle sizes (no flow)
Difficult to handle store and transportDifficult to handle store and transport•• Difficult to handle, store and transportDifficult to handle, store and transport
•• High transport and storage costHigh transport and storage cost
•• Self heating and emission of off gases during Self heating and emission of off gases during Self heating and emission of off gases during Self heating and emission of off gases during storagestorage

IntroductionIntroductionIssues with thermoIssues with thermo--chemical conversion chemical conversion technologiestechnologies•• Combustion:Combustion:
Difficult to coDifficult to co--fire with coalfire with coal
Low energy densityLow energy density
High energy demand for grinding biomassHigh energy demand for grinding biomass
•• GasificationGasification•• GasificationGasification
Tar formation
Low C/H ratio for liquid fuel production/ q p
•• PyrolysisPyrolysis: :
BioBio--oil instability & coke formationoil instability & coke formation
•• Densification: Densification:
Low energy density & self heatingLow energy density & self heating

Biomass Biomass PyrolysisPyrolysis to Liquid Fuelsto Liquid Fuels
PyrolysisUnit
Bio-oil
Critical ProblemsCritical Problems•• LongLong--term storage and stability of biomassterm storage and stability of biomass•• High energy input for grinding to defined particle sizeHigh energy input for grinding to defined particle size•• Formation of high molecular weight compoundsFormation of high molecular weight compounds•• BioBio--oil is unstableoil is unstable
Vi it i ith ti d t tVi it i ith ti d t tViscosity increases with time and temperatureViscosity increases with time and temperatureLow pH, corrosive Low pH, corrosive
•• Catalytic upgrading difficultCatalytic upgrading difficulty pg gy pg gHigh oxygen contentHigh oxygen contentCatalytic deactivation due to coke formationCatalytic deactivation due to coke formation

What is Torrefaction? What is Torrefaction? Solid-state thermal hydrolysis of biomass in an inert of biomass in an inert atmosphere (e.g.,Natmosphere (e.g.,N22))T t T t 180 t 300180 t 300ooCCTemperature range Temperature range –– 180 to 300180 to 300ooCCHemicelluloseHemicellulose is hydrolyzed is hydrolyzed via release of acetic acid via release of acetic acid and subsequent hydrolysis reactionand subsequent hydrolysis reactionand subsequent hydrolysis reactionand subsequent hydrolysis reactionMoisture reduction, oxygen content reducedMoisture reduction, oxygen content reducedSome extractives volatilized, but 70Some extractives volatilized, but 70--80% solids 80% solids recoveredrecoveredMost familiar example Most familiar example –– roasting coffeeroasting coffee
Green chip Torrefied chip

Torrefaction HistoryTorrefaction HistoryTorrefaction HistoryTorrefaction History1930’s 1930’s –– heat treatment of wood for high heat treatment of wood for high ggdurability, structural stability & fungal resistance (wood durability, structural stability & fungal resistance (wood roasting), provides aesthetic valueroasting), provides aesthetic value
1939 1939 US Patent (Be gst om et al) on the mal heating of US Patent (Be gst om et al) on the mal heating of 1939 1939 –– US Patent (Bergstrom et al) on thermal heating of US Patent (Bergstrom et al) on thermal heating of wood >220wood >220ooCC
1976 1976 –– Pyrochar process for solid biomass into Pyrochar process for solid biomass into fuelsfuelsy py p
1980’s 1980’s –– heat treatment of wood logs (180heat treatment of wood logs (180--220220ooC), retifaction/torrefaction process C), retifaction/torrefaction process (Yvan 1985 Bourgeois et al 1988) Torrefaction process (Yvan 1985 Bourgeois et al 1988) Torrefaction process (Yvan, 1985, Bourgeois et al, 1988), Torrefaction process (Yvan, 1985, Bourgeois et al, 1988), Torrefaction process development & reactor design (four patents)development & reactor design (four patents)
2000 2000 -- Significant research & development on biomass Significant research & development on biomass torrefaction processtorrefaction process

Mass & Energy BalancegyCondensable:WaterNon-condensable:
Volatile off gases
WaterOrganic acids, alcoholsFurans, ketonesTerpenes, phenols
l d
H2, CO, CO2, CH4,Toluene, benzene
gases
0.3 m ~0.2 E
Waxes, tannins, lipids
Torrefaction Process
Biomass Torrefied biomass
1 m 0.7 m
1 E 0.9 E
External heat supplyT 180 280 C
~0.1 E
Temp: 180-280oCHeating rate: <50oC/minResidence time: > mins

Research Objectives Research Objectives Bi T f ti ki ti Bi T f ti ki ti Biomass Torrefaction kinetics Biomass Torrefaction kinetics •• Does it improve biomass storability and Does it improve biomass storability and
t t bilit ?t t bilit ?transportability?transportability?
•• Does it improve biomass Does it improve biomass grindabilitygrindability and reduce and reduce i t? i t?energy input?energy input?
•• Effect of torrefaction on, Effect of torrefaction on,
bi il t bilitbio-oil stability
Eliminate or reduce coke forming precursors and improve catalytic upgrading of bio-oil to fuelsimprove catalytic upgrading of bio-oil to fuels
Syngas quality and tar concentration during gasificationg
Pellet quality
Combustion behavior

Mass loss with time for a range of torrefaction conditions – TG-MStorrefaction conditions TG MS
90
100
70
80
90
nin
g
200
50
60
70
s re
main
215
230
245
20
30
40
% m
ass
245
260
275
0
10
20% pyr. @ 700
00 2000 4000 6000 8000
time / s

Proposed Torrefaction Kinetics Proposed Torrefaction Kinetics M d lM d lModelModel
Hemicellulose (A)Depolymerised Intermediate (B) Solid products (C)Intermediate (B)
k1
kv2
k2
Volatile productskv1
Model equations:Model equations:For components a, b and c:For components a, b and c:
a’(t) = a’(t) = --(k1+kv1)*a(t), (k1+kv1)*a(t), a(0) = 1 a(0) = 1 ((normalized vs. starting mass)normalized vs. starting mass)b’(t) = k1*a(t)b’(t) = k1*a(t)--(k2+kv2)*b(t)(k2+kv2)*b(t) b(0) = 0b(0) = 0c’(t) = k2*b(t)c’(t) = k2*b(t) c(0) = 0c(0) = 0

Torrefaction Experiment
Condensed liquids
Torrefaction Reactor
300
Experiment 1.3.2 - Torrefaction - Pine Chips30 minutes - 280oC - 30% Moisture
Non-condensable gasesForest Residue chips
100
150
200
250
mpe
ratu
re (o
C)
0
50
0 15 30 45 60 75 90 105 120
Tem
Time (minutes)
Torrefied biomass
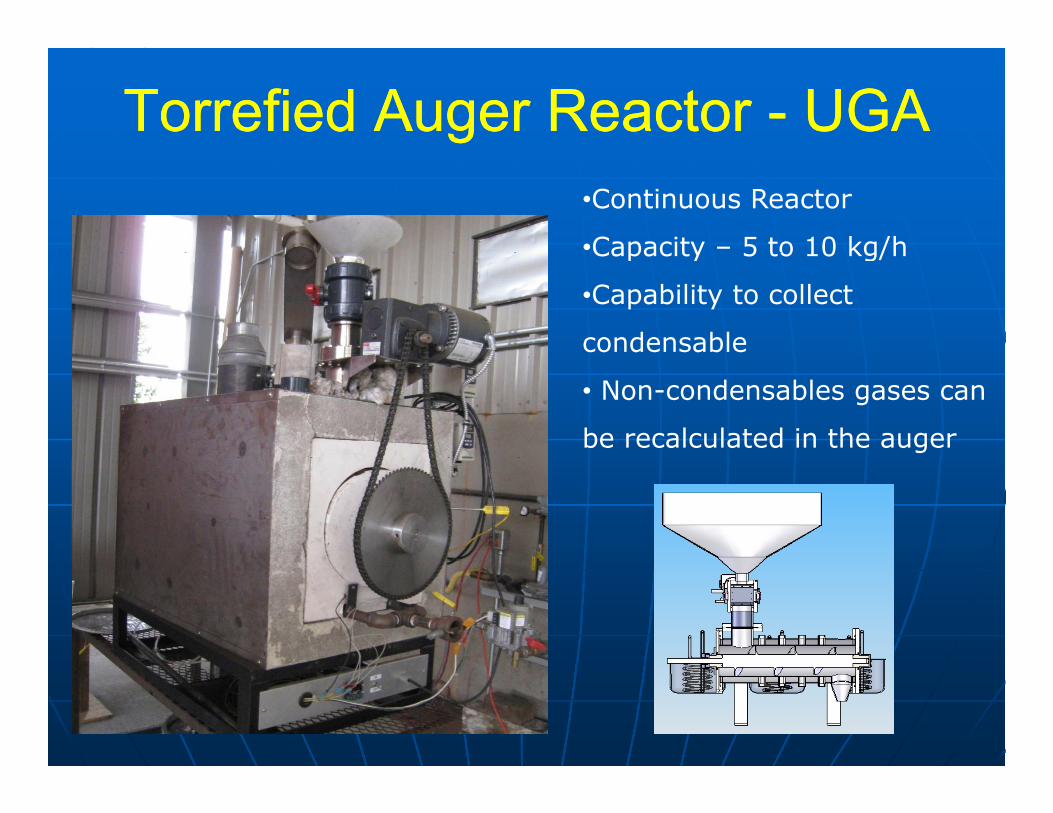
TorrefiedTorrefied Auger Reactor Auger Reactor -- UGAUGA•Continuous Reactor
•Capacity – 5 to 10 kg/hCapacity 5 to 10 kg/h
•Capability to collect
condensable
• Non-condensables gases can
be recalculated in the auger

Rotary drum reactor Rotary drum reactor –– UGAUGA(indirect heating)(indirect heating)
Capacity = 400 lbs/run

Results Results –– TorrefiedTorrefied biomass yieldbiomass yield
100%
Pine Chips30 Minute run
80%
d (%
)
60%
biom
ass
yiel
d
40%
Torr
efie
d b
10%M.C.
30% C
0%
20%30%M.C.
50%M.C.
0%220 250 280
Temperature

Torrefaction of Pine ChipsTorrefaction of Pine Chipspp
Torrefaction Process

Torrefaction ResultsTorrefaction ResultsGC/MS of Non-condensables (gas phase)•• Acetaldehyde, Acetaldehyde, αα--pinenepinene, , ββ--
pinenepinene, camphene, , camphene, phellandrenephellandrene observed at low observed at low temperatures (220C)temperatures (220C)
•• Acetaldehyde evolution increased with timeAcetaldehyde evolution increased with time•• Acetaldehyde evolution increased with timeAcetaldehyde evolution increased with time•• PinenesPinenes decreased with holding timedecreased with holding time•• As temperature increased, acetic acid, As temperature increased, acetic acid, methylestermethylesterp , ,p , , yy
and furans appeared (220 to 250C and above)and furans appeared (220 to 250C and above)Furan, 2Furan, 2--methylfuran, 250Cmethylfuran, 250C2 32 3 dihydrofuran and 2 5dihydrofuran and 2 5 dimethylfuran 280Cdimethylfuran 280C2,32,3--dihydrofuran and 2,5dihydrofuran and 2,5--dimethylfuran, 280Cdimethylfuran, 280C

Results Results –– NonNon--condensable at 280condensable at 280ooCC
9
Non-Condensables vs. Time; Torrefaction at 280oC
Methane
6
7
8
%)
Carbon dioxide
Methyl acetylene
Propylene
4
5
6
mou
nt (m
ole
%
n-Butane
Ethylene
Ethane
2
3
Am
0
1
0 10 20 30 40 50 60
Time (min)

Results Results –– Condensable at 280Condensable at 280ooCC
35000000
Condensables vs. Time; Torrefaction - 280oC
α-pinene
25000000
30000000
ance
α pinene
camphene
β-pinene
β phellandrene
20000000
25000000
elat
ive
Abu
nda β-phellandrene
10000000
15000000Re
0
50000000
0 10 20 30 40 50 600 10 20 30 40 50 60
Time (min)
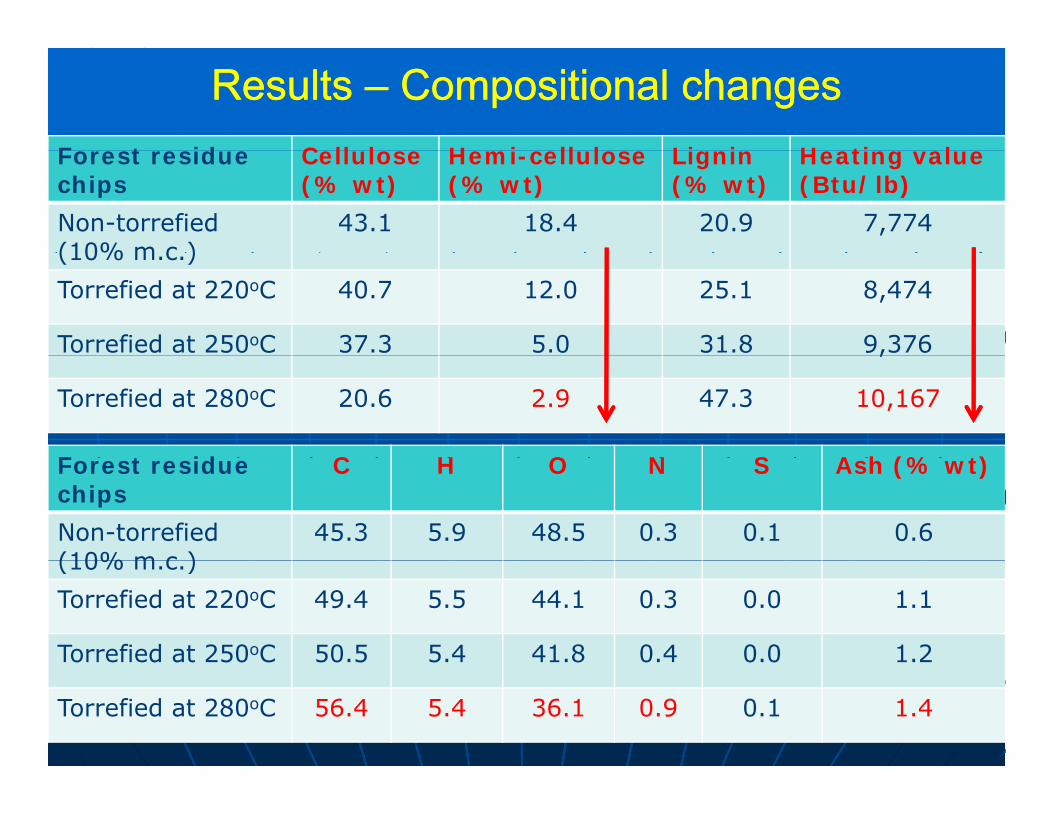
Results Results –– Compositional changesCompositional changesF t id C ll l H i ll l Li i H ti lForest residue chips
Cellulose(% wt)
Hemi-cellulose(% wt)
Lignin (% wt)
Heating value(Btu/lb)
Non-torrefied(10% m c )
43.1 18.4 20.9 7,774(10% m.c.)
Torrefied at 220oC 40.7 12.0 25.1 8,474
Torrefied at 250oC 37.3 5.0 31.8 9,376,
Torrefied at 280oC 20.6 2.9 47.3 10,167
F t id C H O N S A h (% t)Forest residue chips
C H O N S Ash (% wt)
Non-torrefied(10% m c )
45.3 5.9 48.5 0.3 0.1 0.6(10% m.c.)
Torrefied at 220oC 49.4 5.5 44.1 0.3 0.0 1.1
Torrefied at 250oC 50.5 5.4 41.8 0.4 0.0 1.2
Torrefied at 280oC 56.4 5.4 36.1 0.9 0.1 1.4

Results Results –– Compositional changesCompositional changesF t id M i t V l til C Fi d C A h (%)Forest residue chips
Moisture (%)
Volatile C(% wt)
Fixed C(% wt)
Ash (%)
Non-torrefied(10% m c )
10 75.3 16.3 0.4(10% m.c.)
Torrefied at 220oC 3.2 76.8 19.1 1.1
Torrefied at 250oC 2.3 74.9 20.6 1.2
Torrefied at 280oC 2.1 70.8 25.6 1.4

Change in bulk density during Change in bulk density during T f tiT f tiTorrefactionTorrefaction
200
179.51
175/m
3
160.43
152.13sity
, kg
/
150
ulk
den
s
125
220 250 280
B
Torrefaction temperature oC
Forest biomass chips – 18% change
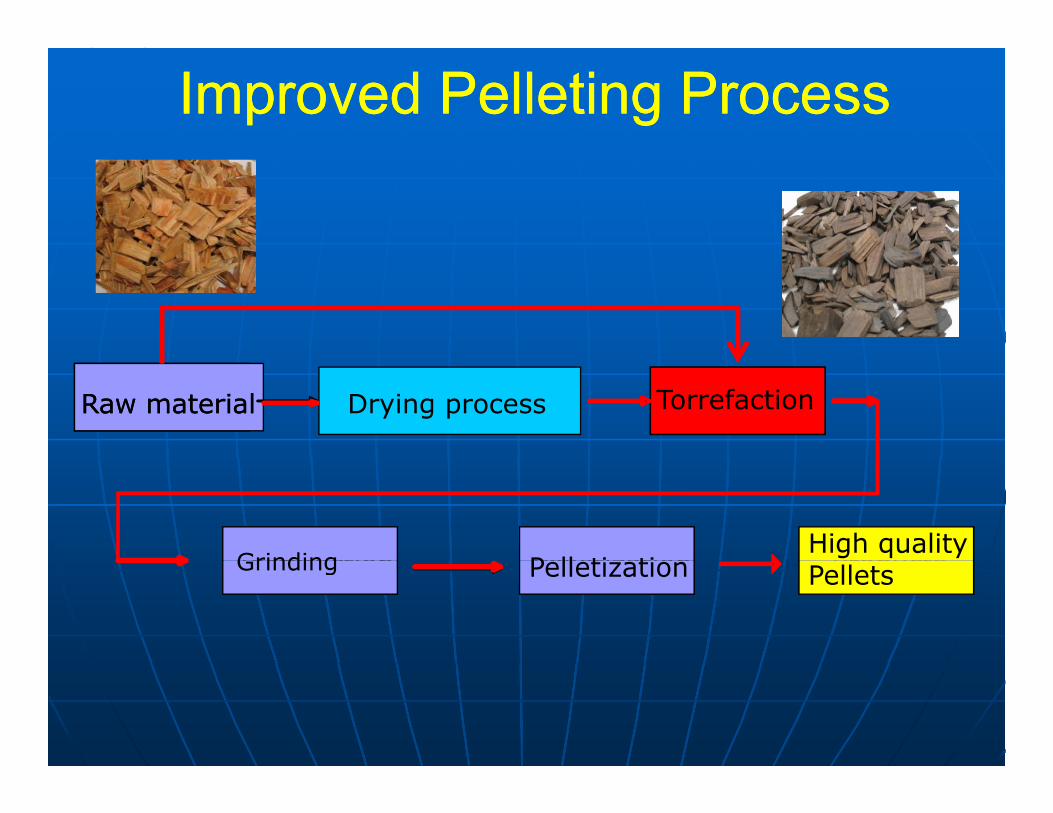
Improved Improved PelletingPelleting ProcessProcess
Raw material Drying process DryingRaw material Torrefaction
Torrefaction Pelletization ProductsGrinding P ll ti tiHigh quality
Torrefaction Pelletization ProductsGrinding Pelletization Pellets

Effect of Torrefaction on Pellet Density
1200
1000
1100
m3
220
900
1000
ty,
kg
/m
Control
800
et
Den
sit Control
220
250
600
700
Pell
e 250
280 280
0 2000 4000 6000 8000
Applied Forces, N

TorrefactionTorrefaction-- Pellet Production CostPellet Production Cost
50
/t Packing cost $40
30
40
cost
, $
/
Land use & building
Personnel cost$27 $24 $30
20
30
uct
ion
c
Miscellaneous equipmentScreening
100.00
6.45et
Pro
du
Pellet cooler
Pellet mill
0 0.00 0
Pelle
Hammer mill
Torrefaction
2424Drying operation

Torrefaction PyrolysisTorrefaction - Pyrolysis

TG/MS Analysis of Torrefied BiomassBiomass
TGA/MS (TGA/MS (MettlerMettler Toledo)Toledo)P f d d P f d d l til ti diti diti NN AAPerformed under Performed under pyrolyticpyrolytic conditions conditions –– NN22 or or ArArcarrier gascarrier gas10mg sample, 50 ml/min, 3010mg sample, 50 ml/min, 30--900900°°C at 10C at 10°°C/minC/minMonitored Off Gas in Selective Ion Mode (SIM)Monitored Off Gas in Selective Ion Mode (SIM)
• Non-condensables, CO-28, CO2-44, H2-2, H2O-18 2 2 2• Potential tar compounds,
Benzene – 78 Guaiacol – 124 Naphthalene – 128 Phenol – 94
• Potential hemicellulose breakdown productsAcetaldehyde 29 Acetaldehyde – 29 Acetic acid – 60 Acetol – 45

Effect of Torrefaction on Pyrolysis Kinetics (TGA Analysis)
Pine Pellet Pyrolysis
1012
0 8
1Pine Pellet Pyrolysis
1012
0 8
1Torrified Pine Pellets at 250C
1012
0 8
1Torrified Pine Pellets at 250C
1012
0 8
1
2
468
Mas
s, m
g
0 2
0.4
0.6
0.8
X, m
ass
2
468
Mas
s, m
g
0 2
0.4
0.6
0.8
X, m
ass
2468
Mas
s (m
g)
0.2
0.4
0.6
0.8
X, m
ass
2468
Mas
s (m
g)
0.2
0.4
0.6
0.8
X, m
ass
02
0 500 1000Temperature, C
0
0.2
02
0 500 1000Temperature, C
0
0.202
0 500 1000
Temperature, C
002
0 500 1000
Temperature, C
0
Torrified Pine Pellets at 300C
10
12
0 8
1
Torrified Pine Pellets at 300C
10
12
0 8
1X, fractional biomass conversionX, fractional biomass conversion
Higher temperature torrefaction Higher temperature torrefaction
2
46
810
Mas
s (m
g)
0 2
0.4
0.6
0.8
X, m
ass
2
46
810
Mas
s (m
g)
0 2
0.4
0.6
0.8
X, m
ass
g e e pe a u e o e ac og e e pe a u e o e ac o(> 300(> 300°°C) appears to reduce C) appears to reduce biomass thermal decomposition biomass thermal decomposition and alter and alter pyrolysispyrolysis kineticskinetics
More research needed to More research needed to 02
0 500 1000Tem perature, C
0
0.2
02
0 500 1000Tem perature, C
0
0.2More research needed to More research needed to confirm effectconfirm effect

Torrefaction-Pyrolysis-Solids PropertiesOxygen content reducedOxygen content reducedFixed carbon increased
Material
Characteristic PP BM PP T250 PP T300 PP T350 PP P500
C 52.6 53.9 73.2 78.0 82.5 H 5.7 5.3 4.7 3.7 2.6 N 0.2 0.1 0.2 0.2 0.2 S 0.0 0.1 0.1 0.1 0.0O 38.9 37.6 19.6 15.0 4.4
Moisture 7 2 0 0 1 0 2 0 3 2Moisture 7.2 0.0 1.0 2.0 3.2Volatiles 79.8 71.2 42.4 32.2 28.1
Ash 0.5 3.0 2.2 2.9 2.8 Fixed Carbon 19.7 25.8 55.4 64.9 69.1
HHV (MJ/kg) 20.6 20.9 28.8 29.7 31.0
PP, pine pellets; BM, biomass; T, torrefaction, P, pyrolysis

ParameterBio-Oil Characteristics
Pa PUb TPc TPUd
Ultimate analysis (wt % dry)
C 69 6 73 1 71 3 73 9C 69.6 73.1 71.3 73.9H 7.65 8.1 7.97 7.93N 0.74 0.4 0.19 0.17S 0.05 0.0 0.01 0.02Oe 22.0 18.4 20.5 18.0
HHV 29.1 30.9 28.6 30.7(MJ/kg, wet basis)
H2O 2.4 4.0 9.3 6.7(wt %)(wt. %)
pH 3.1 3.2 3.7 3.5aP: Pyrolysis (catalytic upgrading feedstock, no torrefaction)bPU: Pyrolysis + catalytic Upgrading (no torrefaction)bPU: Pyrolysis + catalytic Upgrading (no torrefaction)cTP: Torrefaction + Pyrolysis (catalytic upgrading feedstock)dTPU: Torrefaction + Pyrolysis + catalytic Upgrading

Torrefaction CombustionTorrefaction - Combustion


Comparison of combustion of torrefied biomass, untreated biomass and coalbiomass, untreated biomass and coal
1
1.2
0.8
1
ctio
n
t225
t235
0.6
nin
g f
rac t235
t250
t260
t275
0.4
rem
ain t275
t285
t300
0
0.2 raw pine
coal
0
0 1000 2000 3000 4000
Time

ConclusionsConclusionsCondensable compounds are mainly released from extractives in the biomass as α, β-pinene, camphene t Th d b di t d t l etc. These compounds can be redirected to supply
heat energy during torrefaction
D i t f ti h i ll l i l t d During torrefaction, hemi-cellulose is almost removed and results in higher energy density product with a heating value of 10 000 Btu/lb Torrefaction heating value of 10,000 Btu/lb. Torrefaction temperature plays a major role in defining the energy density of biomass and can be optimized for any y p yspecific applications.
Torrefaction followed by pelleting costs about $30/t of y p g $pellets. Torrefaction process alone costs about $6.5/t.

ConclusionsConclusionsBiomass torrefaction process can produce high energy Biomass torrefaction process can produce high energy density and consistent feedstock for thermal conversion density and consistent feedstock for thermal conversion density and consistent feedstock for thermal conversion density and consistent feedstock for thermal conversion technologies (gasification, cotechnologies (gasification, co--firing & firing & pyrolysispyrolysis))
PelletingPelleting of Torrefaction of biomass may be difficult due of Torrefaction of biomass may be difficult due PelletingPelleting of Torrefaction of biomass may be difficult due of Torrefaction of biomass may be difficult due to hydrophobic nature of the material and require to hydrophobic nature of the material and require additional binders to increase the bulk densityadditional binders to increase the bulk densityadditional binders to increase the bulk densityadditional binders to increase the bulk density
Future research at UGA is focused on optimizing the best reactor configuration for a torrefaction process g pand promote its application to co-firing, gasification and pyrolysis processes

AcknowledgementAcknowledgement
Financial support from Financial support from • University of Georgia Research
FoundationFoundation• State of Georgia – Traditional Industries
ProgramProgram• Georgia Power – Southern Company

Thank youThank you Densification
Direct combustion
Gasification
BiocoalCo-firing with coal
Biomass Torrefaction Technology