biomass resource options: creating a bioheat supply … · biomass resource options: creating a...
TRANSCRIPT

BIOMASS RESOURCE OPTIONS:
Creating a BIOHEAT Supply for the Canadian Greenhouse Industry
Phase I Research Report
Presented to
Natural Resources Canada CANMET Energy Technology Centre (CETC)
580 Booth Street, Ottawa, Ontario, K1A 0E4
Submitted by
Resource Efficient Agricultural Production (REAP)-Canada
Box 125 Centennial Centre CCB13,
Sainte Anne de Bellevue, Quebec, H9X 3V9
Authors: Stephanie Bailey-Stamler, Roger Samson and Claudia Ho Lem
July 2006
Resource Efficient Agricultural Production (R.E.A.P.) - Canada
Box 125, Centennial Centre CCB13, Ste Anne de Bellevue, Quebec, Canada, H9X 3V9
Tel. (514) 398-7743; Fax (514) 398-7972; www.reap-canada.ca
Contact: Mr. Roger Samson; [email protected]
REAP-Canada is an independent research, consulting and international development organization that has been working to support ecological food, fibre and energy systems since 1986. REAP is a world leader in developing bioenergy opportunities for rural development and greenhouse gas mitigation. In North America, Europe, Asia and Africa, REAP has created projects with the private and public sector to develop and commercialize dedicated bioenergy feedstocks and residues for biofuel applications, successfully completing over 20 biomass energy projects to date. REAP is currently working to develop bio-energy projects with farmers groups in Canada, China, Nigeria, the Gambia, and the Philippines.

i
Executive Summary
Greenhouse production in Canada is an energy intensive industry and is highly vulnerable to rising fossil fuel costs. In Quebec the industry is largely based on heating oil use while in Ontario, greenhouse producers are vulnerable to natural gas price peaks which coincide with the main heating period. Growers across Canada are seeking more economical alternative heating systems. British Columbia, Ontario and Quebec account for approximately 90% of the both the total greenhouse area and sales and are regions focused on for this report. This project analyzes the resource potential of low cost, greenhouse gas friendly biofuel energy resources as a substitute for fossil fuels in the main production areas in Canada. The biomass supply available for fuel switching for the greenhouse industry is highly region specific. British Columbia is currently experiencing an over supply of wood residue due to the pine beetle outbreak. There appears to be abundant woody residue resources for making a conversion to biofuel heating and this is progressing well. The main problem appears to be logistics of getting the wood residue supply to the greenhouse producers in the southwestern corner of the province. It is likely that an expansion in the use of bark pellets could be realized in British Columbia. The BC forest industry in 2006 will produce 630,000 tonnes of largely residential wood pellets and the growth is expected to increase in wood pellet production. Some shipping of crop milling residues such as oat hulls from Alberta could also supplement the use of wood residues in greenhouse heating in British Columbia. In Ontario and Quebec, the greatest biomass resource opportunity exists in the use of agri-fibres resources. Compared to British Columbia, greenhouse producers in the main production areas in these provinces have limited access to wood residue supplies and urban wood residue volumes appear to be modest. The greenhouse industry in both Ontario and Quebec are located within the major agricultural zones and access to agri-fibre residues is not hindered. The most promising agri-fibre biomass resources identified are crop milling residues, especially processing residues of the wheat, oat, and corn milling industries. These materials were generally of low to moderate cost and had few problems in terms of supply logistics or biomass quality for combustion. In the past year, approximately 30 Ontario farms and greenhouses have started to use oat hulls, pin oats, wheat mill feed and corn by-products for heat related energy applications. Especially in Ontario, large volumes of these milling residues are produced in close proximity to the main greenhouse industry. There are 26 medium to large crop milling industries in Ontario and 5 in Quebec producing wheat, corn or oats milling by-products. The most important residues identified were oat hull, wheat mill feed and corn bran. The potential quantity of crop milling residues that could be procured in Canada was assessed at 1,385,754 tonnes annually, most of which was produced in Ontario. There also was considerable volumes of field crop residues that could be procured in Ontario and Quebec from corn and soybean fields. An estimated recovery of 2,143,076 tonnes annually could be achieved, with corn cobs and soybean stalks identified as the most viable feedstocks. The main problems with field crop residues are the supply

ii
logistics as the material is frequently wet at the time of crop harvest and the biomass quality in terms of combustion, appearing more problematic than for crop milling residues. There appears also to be some potential for whole plant corn to be harvested for greenhouse heating in mid winter in the more southerly regions of Ontario and Quebec. Very large volumes of energy crops could be grown in Ontario and Quebec with an estimated 14 million tonnes of warm season grass energy crops possibly produced. Another promising opportunity that was identified, particularly in the case of Ontario, was the development of combined heat and power (CHP) installations at large greenhouses using manure, corn silage and energy crops. Ontario’s new renewable power purchase agreements could make these systems become viable. In Quebec there is an expanding bark pellet industry which is sold mainly in export markets. This material appears very competitive as a greenhouse heating fuel compared to the use of heating oil in the main greenhouse production area in the Montreal region. A widely recognized problem with biomass quality with using agri-fibres is the high potassium and chlorine contents in the potential fuel sources. High levels of potassium and chlorine can lead to problems of clinker formation and corrosion inside the combustion unit. On average, crop milling residues contain 60% less potassium and 87% less chlorine than field crop residues. The crop milling residue with the best biofuel potential has been identified as oat hull as it has a very low value as a livestock feed and its increased use would likely not be affected by an upturn in farm commodity prices. Delayed harvest strategies for energy grasses and whole plant corn would eliminate any significant fuel quality combustion concerns with using these fuels in modern commercial greenhouse boilers. In terms of supply, if it is assumed that the average greenhouse in Canada requires 10,000 GJ/ha of heat then the entire Canadian industry has a heat demand of 19.9 million GJ. Assuming a dry tonne of biomass contains 18.5 GJ/tonne, it would require 1.08 million tonnes of dry biomass or about 1 million tonnes to supply the British Columbia, Ontario and Quebec greenhouse industries. In total, the potential agri-fibre bioresources that could be made available dwarfs this requirement with up to 17.6 million tonnes annually produced through residue recovery or energy crop farming. Financially, greenhouse producers could reduce their annual fuel costs by approximately 33% to 60% by switching from natural gas and heating oil to densified agri-fibre and woody biomass fuels. Many greenhouses in densely populated areas prefer using densified fuels as the supply logistics and clean combustion make it a preferable biofuel form for greenhouse producers. The 2545 Canadian greenhouse producers could save 150-200 million dollars annually in fuel costs if a complete fuel switching occurred. This would eliminate over 1 million tonnes of GHG emissions from the Canadian GHG inventory. There appears to be no economic or supply barrier to create a large conversion of the Canadian greenhouse industry into biofuels. It is anticipated that the Canadian greenhouse industry will be the first major commercial heating industry in North America to make the large scale transition from fossil fuel heating to biofuel heating.

iii
Table of Contents
Executive Summary............................................................................................................. i
List of Tables ...................................................................................................................... v
List of Tables Cont. ........................................................................................................... vi
List of Figures .................................................................................................................. vii
List of Appendices ...........................................................................................................viii
1.0 Introduction.................................................................................................................. 1
1.1 Overview of the Canadian Greenhouse Industry ............................................................. 1
2.0 Biomass Supply ............................................................................................................ 4
2.1 Woody Biomass Supplies .................................................................................................... 4 2.1.1 Current Surplus Residue ........................................................................................................... 4 2.1.2 Future Wood Residue Surplus .................................................................................................. 5 2.1.3 Transportation Cost of Wood Residues.................................................................................... 6
2.2 Wood Pellet Production ...................................................................................................... 8
2.3 Urban Wood Recovery........................................................................................................ 9
2.4 Agri-fibre Inventory............................................................................................................ 9
2.5 Agricultural land use and production in Ontario and Quebec ..................................... 10
2.6 Agri-fiber Residue Supply ................................................................................................ 11
2.7 Potential of Selected Field Crop Residues in Ontario and Quebec............................... 11 2.7.1 Corn Stalk ................................................................................................................................. 11 2.7.2 Soybean Straw .......................................................................................................................... 12 2.7.3 Corn Cobs ................................................................................................................................. 12
2.8 Crop Milling Residues Processed in Canada .................................................................. 13 2.8.1 Wheat Processing ..................................................................................................................... 13 2.8.2 Oat Processing .......................................................................................................................... 15 2.8.3 Soybean Processing .................................................................................................................. 16 2.8.4 Corn bran.................................................................................................................................. 16
2.9 Residue Transportation Feasibility.................................................................................. 17
3.0 Energy Crop Farming................................................................................................ 20
3.1 Potential for Energy Crop Production in Quebec and Ontario .................................... 20 3.1.1 Energy Crop Yields .................................................................................................................. 20 3.1.2 Land Availability for Energy Crop Farming ......................................................................... 21 3.1.3 Energy Grass Production Potential of Ontario and Quebec ................................................ 22
4.0 Field Crop Harvesting Practices................................................................................ 24
4.1 Corn Harvesting Practices................................................................................................ 24
4.2 Harvesting Corn Residue Sustainably............................................................................. 24 4.2.1 Corn Stover Recovery Practices.............................................................................................. 25 4.2.2 Corn Cob Recovery Methods .................................................................................................. 26 4.2.3 Whole-Plant Corn Harvesting ................................................................................................. 27
4.3 Biomass Harvesting Techniques ...................................................................................... 27

iv
5.0 Biomass Quality.......................................................................................................... 29
5.1 Biomass Feedstock Characteristics.................................................................................. 29 5.1.1 Quality Characteristics of Agricultural Residues.................................................................. 29 5.1.2 Quality Characteristics of Energy Grasses ............................................................................ 31
6.0 Financial Summary.................................................................................................... 35
7.0 On-site Biogas Production Potential ......................................................................... 36
9.0 Literature Cited........................................................................................................... 39
10.0 Appendices ................................................................................................................ 47

v
List of Tables
Table 1 Canadian Greenhouse Industry Statistics for 2005 ................................................ 2 Table 2 Area of Major Greenhouse Crops in Canada (ha) 2005........................................ 2 Table 3 Selected Provincial Estimate Residue Surplus (2004) ......................................... 5 Table 4 Canadian Wood Pellet Production in 2005 and projected production in 20061.... 9 Table 5 Average cultivated area, production, and yield of selected crops in Ontario and Quebec over the last 5 years (2001-2005)................................................................ 10 Table 6 Average cultivated area, production and yield of selected crops in the three western Canadian provinces over the last 5 years (2001-2005)........................................ 11 Table 7 Average Total and Available Production of Corn Stalk and Soybean Straw by Province (2001-2005)........................................................................................................ 12 Table 8 Average Total Production of Milling Residues from Selected Crops by Province (2001-2005)........................................................................................................ 13 Table 9 Estimated Yearly Wheat Processing and Millfeed Production by Province........ 14 Table 10 Estimated Yearly Oat Processing and Oat Hull Production by Province .......... 15 Table 11 Estimated Yearly Soybean Processing and Soy Hull Production by Province.. 16 Table 12 Estimated Yearly Capacity for Corn ethanol and starch and sweeteners in Ontario1 ............................................................................................................................. 17 Table 13 Transportation costs (CAD) to ship wheat per tonne by CPR rail. ................... 18 Table 14 Summary of fall harvested switchgrass yields from the variety Cave in Rock in Canada............................................................................................................................... 21 Table 15 Canadian farm land area use .............................................................................. 22 Table 16 Land Availability and Biofuel Production Potential in Ontario and Quebec..... 22 Table 17 Kernel Versus Cob Moisture Contents for Corn................................................ 27 Table 18 Quality of grains, straw and milling residues1 ................................................... 30 Table 19 Effects of delayed harvest on elemental composition of switchgrass1 .............. 31
vi
List of Tables Cont.
Table 20 Potassium and Chloride Concentration in switchgrass plants (Christian et al., 2002)....................................................................................................... 32 Table 21 (Elbersen et al. 2002) average of data from 1999-2001) ................................... 32 Table 22 Ash Content of Switchgrass components (Samson et al., 2005) ....................... 33 Table 23 Switchgrass composition considering soil type and harvest (Mehdi et al., 1999) ........................................................................................................... 33 Table 24 Projected Heat Costs for Heating a 0.8 hectare Greenhouse in Canada ............ 35
vii
List of Figures
Figure 1: Forest Regions of British Columbia and location of the greenhouse industry.............................................................................................................................. 6 Figure 2: Forest Regions of Ontario and location of the greenhouse industry ................... 7 Figure 3: Forest Regions of Quebec and location of the greenhouse industry ................... 7 Figure 4: Example of modern corn cribs used in Quebec, Canada .................................. 26 Figure 5: Proportion of biogas production from different feedstocks in the province of Thuringia, Germany..................................................................................... 36 Figure 6: Potential Biogas Yield from various biomass products..................................... 37 Figure 7: An integrated manure utilization system in Vegreville-Alberta........................ 38

viii
List of Appendices
Appendix 1: List of Canadian Wood Pellet Manufacturers for 2006 ............................... 47 Appendix 2: List of Canadian Agri-Fibre Pellet and Cube Manufacturers 2006.............. 49 Appendix 3: Canadian Wheat Processing Facilities-2006 ................................................ 52 Appendix 4: Canadian Oat Milling Facilities-2006 .......................................................... 56 Appendix 5: Canadian Soybean Oil Crushing Facilities-2006 ......................................... 57 Appendix 6: Canadian Corn Ethanol and Milling Facilities-2006.................................... 58
1
1.0 Introduction
The rising costs of natural gas and heating oil combined with the need to develop “made in Canada solutions” to reducing our greenhouse gas emissions have created a strong rationale for a major fuel supply switch for the heat-intensive greenhouse industry. This report examines the possibilities of developing a large biomass resource supply for commercial heating of greenhouses. The purpose of this report is to examine the fuel supply options for the major greenhouse growing areas in Canada with emphasis on the southern areas of Ontario, Quebec and British Columbia. The focus of the analysis is on the quantity of various biomass resources available. It is widely recognized that not all biomass resources are easily used as heating fuels in commercial boilers. As such this report analyses certain biomass quality data. The report describes the diversity of available biofuels and identifies regionally which resources could be used for the Canadian greenhouse industry. Significant emphasis is placed on the potential use of agri-fibre fuel residues. The supporting rationale for agri-fibre residues as a biofuel option is that in eastern Canada there is a limited surplus of wood residue while both the greenhouse industry and the dominant agricultural regions are largely based in the southern areas of each eastern province. In western Canada, the British Columbia greenhouse industry has access to an abundant supply of wood residues due to the pine beetle outbreak, which is killing large areas of forest in the province. Historically, limited analyses have been conducted on the potential of agri-fuel resources as a fuel source for the commercial heating industry. In response, this report presents a comprehensive analysis of the agri-fuel potential for the Canadian greenhouse heating industry. In addition, the report examines the production potential of energy crop farming in Quebec and Ontario as a means to further increase the agri-fibre fuel supply thus enabling biofuels to become a major new energy source for commercial heating applications in Canada.
1.1 Overview of the Canadian Greenhouse Industry
The Canadian greenhouse industry is an important industry in the agri-food sector, it had retail sales of $2.2 billion dollars in 2004. The industry is divided into two main streams, vegetable production and ornamental flower and plant sales representing $727 million and $1.4 billion in sales respectively (Statistics Canada, 2006b). Greenhouses are located in all Canadian provinces, however, the primary concentration is in Ontario, Quebec and British Columbia. Together these three provinces account for approximately 90% of the both the total greenhouse area and sales (Table 1). In Canada there are 1989.1 hectares under greenhouse cultivation. Ontario is the largest producer with 52.5% of the greenhouse area, followed by British Columbia and Quebec with 25% and 12% respectively. Ontario and British Columbia have the largest sized operations with the average area under cultivation of about 0.9 ha, while Quebec and the rest of Canada are less than 0.35 ha (Statistics Canada, 2006b).

2
Table 1. Canadian Greenhouse Industry Statistics for 20051
Province Number of
greenhouses
Total
Area
Plastic &
Glass (ha)
Fruit &
Vegetable
Sales ($M)
Ornamental
Flower &
Plant Sales
($M)
Greenhouse
Sales ($M)
British Columbia 570 493.4 231 263 495
Alberta 345 115.6 30 79 110
Saskatchewan 165 23.2 0.65 21 22
Manitoba 130 24.7 0.20 3 31
Ontario 1200 1044.4 397 777 1,174
Quebec 775 235.2 61 165 227
New Brunswick 65 16.7 49
Nova Scotia 110 28.0 4 29 33
Prince Edward Island
10 2.1 1
Newfoundland & Labrador
55 5.9 0.17 6 6
Total Canada 3425 1989.1 727 1,424 2,151 1Statistics Canada, 2006b
The dominant vegetable crops grown in Canada are tomatoes, cucumber, sweet peppers and lettuce (Table 2). The ornamental flower and plant sales encompass cut flower production, potted plant production, cuttings and propagating material, and bedding plants. These are recorded by the number of stems and pots not by area and are therefore not directly comparable with the vegetable sector.
Table 2. Area of Major Greenhouse Crops in Canada (ha) 20051
Province Tomato Cucumber Sweet Pepper Lettuce
British Columbia 118 29 90
Alberta 12 22 5.7 0.4
Ontario 254 154 119 3.2
Quebec 41 17 0.4 4.1
Nova Scotia 3.8 1.3 0.07
Total Canada 431 (49%) 224 (26%) 215 (25%) 7.8 (0.8%) 1Statistics Canada, 2006b
The greenhouse industry in all three major producing provinces, British Columbia, Ontario and Quebec, are located in the southern regions. The southern zones of these provinces have milder climates conducive to greenhouse production and are in close proximity to large domestic and U.S. markets. In British Columbia 95% of all greenhouse production is in the lower mainland district. The other 5% of greenhouses are located on Vancouver Island and the interior of British Columbia (BCAFF, 2003). Although most regions of Ontario have greenhouse production, 70% of the vegetable greenhouses are in the southern part of Essex County around the town of Leamington, which has the largest concentration of greenhouse vegetables in North America. Other prominent regions include the Niagara Peninsula and Haldimard-Norfold region (OGVG,

3
2006). Seventy-five percent of the floriculture industry is located in the counties surrounding the western end of Lake Ontario and the north shore of Lake Erie (Brown and Murphy, 2003). In Quebec, 70% of all greenhouse production is in the southern areas immediately surrounding Montreal and Quebec City. The remaining 30% is listed as “other regions” and mainly distributed in the south-west area of the province (Rioux, 2004).
The Canadian greenhouse industry saw a rise in total operation costs over the last year accounted for by a rise in payroll and fuel expenses. The fuel expenses rose 8% from the 2004-2005 year (Statistics Canada, 2006b) with the major heating costs occurring between the months of January and March, the coldest period of the year, when revenue is generally at its lowest. The majority of greenhouses in Ontario are heated with natural gas, usually purchased through producer-owned cooperatives. In Quebec, approximately 90% of greenhouses use heating oil (informal survey of farmers, January 2006). Furthermore in terms of energy demand the Quebec greenhouse industry is located in a cooler climatic area, which requires more winter heat demand than the industries in Ontario and British Columbia. In the past, British Columbian greenhouses relied heavily on natural gas, however most large growers are now switching over to biomass heating.
No data was sourced which described the average heat demand for the greenhouse industry in each province. A survey performed by the Quebec Institute for the Development of Ornamental Horticulture (IQDHO) in 2005 indicated some growers used approximately 12,410 GJ per year to heat one hectare of a greenhouse (Clement, M. Personal Communication, April 2006). The biomass fuel requirement for the conversion of the entire Canadian greenhouse industry would be significant given this number. If it is assumed that the average greenhouse in Canada requires 10,000 GJ/ha of heat then the entire Canadian industry has a heat demand of 19.9 million GJ. Assuming a dry tonne of biomass contains 18.5 GJ/tonne, 1.08 million tonnes of dry biomass or about 1 million tonnes would be required for the British Columbia, Ontario and Quebec greenhouse industries.
4
2.0 Biomass Supply
This section of the report addresses the existing biomass supply that could be directed for biofuel use for the greenhouse industry. We review recent data evaluating the wood residue availability from the forest processing industry along with issues surrounding the transportation of this bulky biomass. Assessments are made of field crop residues, such as corn stalk and soybean straw, as well as crop milling residues from the processing of crops such as wheat, oats and soybeans. Crop milling residues are generally dry and could be advantageous to blend with wet wood residues, used on their own or blended with grass pellets. Harvesting and transportation issues are also examined including costs associated with shipping wood pellets or agri-fibre fuel pellets from the Prairie Provinces into the southern areas of Ontario, Quebec and British Columbia.
2.1 Woody Biomass Supplies
An evaluation of the availability of mill wood residues in Canada in 2004 was prepared for Natural Resources Canada and the Forest Products Association of Canada1. We have highlighted the important data from this analysis that pertain to the availability of woody biomass residues and waste biomass resources for Ontario, Quebec and British Columbia. Sawmills within British Columbia, Ontario and Quebec account for 81% of the forest residues produced in Canada (BW McCloy et al., 2005). Production of wood residues are typically dependant on the dominate wood industries. For example, the main forest industry in British Columbia is lumber production. British Columbia harvests 60% more lumber than Ontario and Quebec and produces the same amount of residue found in Quebec.
2.1.1 Current Surplus Residue
In British Columbia there was a surplus of 1.8 million BDt in 2004 with the demand for forest residues on the rise (Table 3). The increase in demand for forest residues has been offset by the increase in annual allowable cut (AAC) due to the mountain pine beetle infestation and the simultaneous increase in lumber production from the northern interior region mills. This upturn in forest harvesting and residue production is anticipated for the next 10 to 15 years. The abundance in supply is favouring the development of fibre processing industries and residues being used for bioenergy production.
1BW McCloy & Associates Inc. and Climate Change Solutions. 2005.Estimated Production, Consumption and Surplus Mill wood Residues in Canada-2004. A National Report. Prepared for, Natural Resources Canada, Canadian Forest Service Policy, Economics and Industry Branch and Forest Products Association of Canada. Nov. 2005. 60 pg. http://www.fpac.ca/Mill%20Residue/Mill%20Residue%20Inventory%20Canada_ Final%20November%202005.pdf

5
Table 3. Selected Provincial Estimate Residue Surplus (2004) Lumber
Production Residue
Province
MMfbm Production (‘000 BDt)
Surplus (‘000 BDt)
Estimated bark piles (‘000 BDt)
British Columbia 13,994 6,554 1,815 N/A
Alberta 3,413 2,406 481 N/A
Saskatchewan 501 580 164 2,900
Manitoba 270 225 13 0
Ontario 3,698 2,602 121 6,712
Quebec 8,246 6,669 100 5,652
New Brunswick 1,712 1,373 0 257
Nova Scotia 756 601 13 148
Total 32,590 21,010 2,707 15,669 Source: BW McCloy et al., 2005 Ontario produces minimal levels of surplus residues, an estimated 121,000 BDt with an additional 6.7 million tonnes in potential bark resources (Table 3). It is predicted that wood supply will fall below industrial demand in 5-10 years. The predicted potential shortage in available wood residues has negative implications on sawmill production and the forest industry, however it may free up poor-quality wood for energy. The current environment has led to a highly competitive market for wood residues with customers paying premium prices and forcing traditional users to pay higher rates (BW McCloy et al., 2005). Quebec produced even less surplus residue in 2004 then Ontario with 100,000 BDt (Table 3). Approximately 5.6 million tonnes of potential bark resources are in piles. The decrease of the AAC by 20% for Quebec in 2005 will likely further decrease wood residue production. The impact of this reduction in combination with the rising Canadian dollar has led to significant closures in the wood processing industries.
2.1.2 Future Wood Residue Surplus
The current annual production of wood residue especially in Ontario and Quebec is almost completely committed and companies are now searching for non-traditional sources of residue. One type of “new” residue is the bark also referred to hog piles, which is the bark taken off during harvesting and/or processing. In the western provinces, this residue is frequently incinerated and no estimates of standing piles were available. In the eastern provinces these piles of residue were historically considered an environmental problem; however today companies are examining the potential of mining them for energy production (BW McCloy et al., 2005). Ontario is currently examining strategies to increase residue production through the recovery of forest floor residue following harvest. Forest-floor biomass has also become another area of interest as an energy source. Forest-floor biomass is the debris (branches and needles etc.) left behind after harvesting also referred to as slash. Harvesting methods that involve whole tree harvesting produce large piles of slash at the roadside of harvesting sites. In the past, these piles have been burned to free up land for future renewal and/or to prevent forest fires. The Ontario Ministry of Natural Resources is currently assessing the economic and environmental sustainability of this resource (BW McCloy et al., 2005).

6
2.1.3 Transportation Cost of Wood Residues
The transportation costs of shipping wood residues are essential in determining the value of the resource for the greenhouse industry. British Columbia has five regions (Figure 2) across the province with surplus wood residues, 80% of the residue is located in the northern interior of British Columbia (Regions 2, 4 and 5), however the greenhouse industry is in the surrounding Vancouver area, region one (Figure 1). Typically in western Canada transportation cost become excessive beyond a 200-km radius for wood residues used for power generation.
Source: (BW McCloy et al., 2005)
Figure 1: Forest Regions of British Columbia and location of the greenhouse industry
In Ontario 100% of the surplus residue and 95% of the estimated available bark piles are located in the northwest and northeast regions of the province (Figure 2). These wood residues are approximately 500-1200 km from the main greenhouse production zones in southern Ontario (Figure 2) and present a significant transportation issue. In Quebec 70% and 75% of the surplus wood residue and potentially available bark piles are located in the northern regions of the province (Nord-Saguenay, Abitibi-Outaouais, Rive-Nord regions, Figure 3). In eastern Canada sawdust is hauled around 500-km for the pulp-
95% of BC Greenhouse Industry

7
Source: (BW McCloy et al 2005)
Figure 2: Forest Regions of Ontario and location of the greenhouse industry
digesters. However for both Ontario and Quebec the dominant wood residues are upwards of 1000-km away from the greenhouse industry (Figure 2 and 3). In terms of road transport of the raw residue this eliminates it as a potential fuel source. Furthermore, this type of wood residue is bulky and difficult to store and handle,
Source: (BW McCloy et al 2005)
Figure 3: Forest Regions of Quebec and location of the greenhouse industry
especially in the urban areas where the majority of greenhouses are located. A feasible option may be to pellet the bark fuel at the source (mills) and ship the material south by rail. In British Columbia at least 10 greenhouses are using wood pellets as fuel (Brand, P.
70 & 75% of Vegetable and Flower Greenhouses
Location of 70% of the Greenhouse Industry

8
Personal Communication, March 16, 2006). In Quebec, several greenhouse producers have started using bark pellets. The Energex pellet plant in Lac Megantic currently produces 50,000 tonnes of bark pellets almost entirely for export. These bark pellets could be transported into the Montreal area greenhouse market for approximately $20/tonne in bulk trailers, or a delivered price of approximately $140/tonne. This is a promising material for helping develop a biofuel base to support the widespread conversion of oil heated greenhouses in Quebec to biofuel heating.
2.2 Wood Pellet Production
Wood pellets are produced out of wood waste such as sawdust and shavings. The material is dried and mechanically fractioned to size and then extruded under intense pressure into pellets. This process densifies the original waste by approximately 3.7 times and the product produced has a bulk density of 605 kg/m3 (Samson et al., 2005) and a bulk storage factor of approximately 1.5-1.6 m3/tonne (Melin, 2002). British Columbia had the highest pellet production of 490,000 MT in 2005 (Table 4). The outbreak of the mountain pine beetle and the projected increase of wood processing and residue has led to the expansion of the pelleting industry, particularly in northern British Columbia, with 2 new pelleting plants due to open in 2006-2007 (Swaan, J. Personal Communication, March, 17 2006). Quebec is second to British Columbia, with 175,000 MT of wood pellets produced annually, due to the high production of wood residue from the pulp and paper mill industry (Table 4). Both British Columbia and Quebec are presently increasing their production of pellets by an estimated 25% and 13% respectively. However, given the current situation with the Quebec forestry industry it is unsure if they will be able to meet the projected production target. Alberta, Ontario and Nova Scotia have only limited residues available, with less than 130,000 MT, with no projected increase in wood pellet production in 2006.
Currently, 1 million tonnes of wood pellets are used in industrial boilers and residential heating and over 600,000 tonnes are exported to the European market (Swaan, 2005). In 2005 over 500,000 MT and 120,000 MT of wood pellets were exported from British Columbia and Quebec destined for power generation and district heating in Europe (Swaan, 2005). In British Columbia and Quebec there likely is significant scope for using wood pellets as fuel for greenhouse heating as these provinces have significant pellet production and greenhouse heating industries.

9
Table 4. Canadian Wood Pellet Production in 2005 and projected production
in 20061
Province Number
of Plants
Production
Capacity
Production
2005 (MT)
Projected
2006 (MT)
British Columbia 6 625,000 490,000 630,000
Alberta 3 120,000 90,000 110,000
Ontario 4 80,000 80,000 80,000
Quebec 4 200,000 175,000 200,000
New Brunswick 1 20,000 15,000 15,000
Nova Scotia 2 150,000 130,000 130,000 1J. Swaan, Personal Communication, March 17, 2006) see Appendix 1
2.3 Urban Wood Recovery
Urban wood waste can include saw lumber, pruned branches, stumps and whole trees from street and park maintenance. The main components of urban wood waste are used lumber, shipping pallets, trees, branches and other wood debris from construction and demolition clearing and grubbing activities (USDA, 2002). In Canada 1.8 million tonnes of wood waste is produced annually from residential, industrial, commercial and institutional companies and construction, renovation and demolition industries (Statistics, 2004). This represents approximately 6% of total waste received at municipal solid waste landfills in Canada. Canada recovers 702,202 tonnes from the demolition and construction stream (Statistics Canada, 2004) of that anywhere from 19-34 per cent is wood waste amounting approximately 186,083 tonnes of recoverable wood (CG & S, 2000). However, these statistics do not take residential and municipality wood waste produced in urban centres. One company in Quebec is already using these resources for heat generation. Boralex in Montreal recycles 1,590,000 tonnes of forest residue a year along with approximately 70,000 tonnes from an urban recovery program in Montreal (Boralex, 2006). There is limited detailed information available about potential volumes of urban wood waste. However the volumes appear modest relative to agri-fibre biomass resources analyzed in this report.
2.4 Agri-fibre Inventory
It is evident that because of the relatively modest wood residue availability in Eastern Canada and the fact that the main greenhouse industries in Ontario and in southern Quebec are in agricultural regions, the use of agri-fibre fuel sources could be a major new opportunity. This section of the report focuses on the potential of agri-fibre residues as a fuel source in the greenhouse industry in British Columbia, Ontario and Quebec. The available field crop and milling residues in eastern and western Canada have been evaluated. In eastern Canada we focused on the most likely field crop residues to be utilized including corn stalks, corn cobs and soybean straw. We also analyzed by- products from the milling and oil crushing processes, for the wheat, oat, corn and soybeans crops. Crop production statistics were obtained from the Canadian Socio-economic Information Management System (CANSIM) from Statistics Canada.

10
Agricultural production from Ontario and Quebec (Table 5) and the Prairie Provinces (Table 6) from 2001 to 2005 was examined.
2.5 Agricultural land use and production in Ontario and Quebec
In Ontario and Quebec, the largest field crops in production are hay and grain corn. Quebec in particular is a large hay producer with 45% of its agricultural land base in hay crops. Annual field crops and their residues mainly have been targeted to date for biofuel applications and are examined in detail. Corn grain production consists of 5.4 million tonnes and 3.3 million tonnes in Ontario and Quebec respectively (Table 5). The second largest annual field crop in terms of acreage in both provinces is soybean. However volumes of the oilseed are much lower at 1.8 and 0.4 million tonnes annually (Table 5). Ontario also produces significant amounts of wheat, with approximately 1.6 million tonnes produced annually while Quebec is a relatively small wheat producer (Table 5).
Table 5. Average cultivated area, production, and yield of selected crops in Ontario and
Quebec over the last 5 years (2001-2005)1
Ontario Quebec
Grain Area (1000 ha)
Yield (t/ha)
Production (1000 t)
Area (1000 ha)
Yield (t/ha)
Production (1000 t)
All Wheat 342 4.7 1618 46 3.2 149
Spring 53 3.5 186 45 3.2 143
Winter 289 4.9 1432 1.9 2.8 5.5
Oats 39 2.7 105 97 2.7 260
Barley 112 3.4 375 142 3.2 452
All Rye 25 2.3 56 1.6 2.0 3.2
Corn- Grain 728 7.5 5379 431 7.6 3259
Corn- Fodder 126 29.8 3742 46 32.9 1524
Soybean 868 2.1 1847 157 2.5 384
Tame Hay 948 5.1 4802 751 4.8 3638 1Statistics Canada, 2006a
An analysis of selected field crops as potential sources of agricultural biomass from the Prairies was also performed. In particular it is anticipated that crop milling residues from wheat and oat processing could become major fuel resources because of fuel quality advantages which are discussed in Section 5 of this report. The western provinces of Alberta, Saskatchewan and Manitoba were identified to have a total cereal production of 19 million tonnes of wheat and 9.8 million tonnes of oats (Table 6). Large volumes of both wheat and oat milling by-products could be generated for use in commercial heating applications. These milling residues could potentially be shipped to Ontario, Quebec and British Columbia greenhouses in a pellet fuel form. Whole grains are also transported outside of the prairies for milling, thereby generating significant volumes of milling residues within Ontario, Quebec and British Columbia.

11
1Statistics Canada, 2006a
2.6 Agri-fiber Residue Supply
Potential volumes of agri-fibre residue from corn and soybean were determined using the production numbers from tables 5 and 6. For both corn and soybean straw residue a straw to grain ratio was used to determine the total quantity of residue produced. However, we determined the recoverable quantity of residue that could be harvested sustainably. Ontario could potentially produce 1.6 million tonnes of recoverable agri-fibre residue annually, followed by Quebec with 494,923 and Manitoba with 63,170 tonnes, respectively. (Table 7)
2.7 Potential of Selected Field Crop Residues in Ontario and Quebec
2.7.1 Corn Stalk
Corn is the largest field crop in both Ontario and Quebec and these provinces produce an estimated 5.1 and 3.1 million tonnes of corn stalk respectively. The quantity of actual recoverable residue available following sustainable management practices is estimated in Ontario at 319,360 tonnes and in Quebec 193,488 tonnes (Table 7) which represents 6.25% of the total production. Details on the quantity of recoverable corn stalk as well as recovery methods are addressed in section 4. The major problems associated with field corn residue utilization are the relatively high moisture content (Table 18) at fall harvest makes storing the feedstock impractical and the removal of this bulky biomass on wet soils in the fall problematic. As well, the high potassium and chlorine content of corn stalks at fall harvest would strongly suggest they are difficult to burn. Spring harvesting of stalks is the most likely possible approach to corn stalk utilization. At this time of the year the stalks are dry and the over-wintering period had leached out the chemical components improving biomass quality. Another possible approach to using corn could be whole plant harvesting in mid winter. This opportunity is discussed further in section 4.
Table 6. Average cultivated area, production and yield of selected crops in the three western Canadian provinces over the last 5 years (2001-2005)
1
Alberta Saskatchewan Manitoba
Grain Area
(1000 ha) Yield (t/ha)
Production (1000 t)
Area (1000 ha)
Yield (t/ha)
Production (1000 t)
Area (1000 ha)
Yield (t/ha)
Production (1000 t)
All Wheat 2412 2.5 5962 5690 1.8 10007 1410 2.7 3706
Spring 1985 2.5 4985 3803 1.8 6715 1295 2.6 3290
Winter 37 2.9 110 67 2.3 149 102 3.7 385
Oats 270 2.5 681 592 2.0 1162 342 2.8 941
Barley 1558 2.9 4670 1685 2.3 3886 407 3.2 1287
All Rye 30 2.0 65 50 1.8 98 21 2.5 53
Corn- Grain 2.3 4.7 11 - - - 48 5.6 283
Corn- Fodder 13 36.2 460 - - - 21 26.5 367
Soybean - - - - - - 52 1.7 85
Tame Hay 2264 2.3 5284 1370 1.9 2727 856 3.1 2682

12
Table 7. Average Total and Available Production of Corn Stalk and Soybean Straw by Province
(2001-2005) Production (tonnes) by Province Stalk & Straw
Residue1 Quebec Ontario Manitoba Saskatchewan Alberta British Columbia
Total Production
Corn Stalk2 3,095,813 5,109,765 268,755 - 10,165 -
Soybean Straw3 575,625 2,770,875 67,350 - - -
Corn Cobs4 602,868 995,059 52,336 - 1,980 -
Recoverable Residue - -
Corn Stalk5 193,488 319,360 16,797 - 635 -
Soybean Straw6 - 831,263 - - - -
Corn Cobs7 301,434 497,525 26,168 - 990 -
Totals
Total Production 4,274,306 8,875,700 388,442 - 12,145 -
Total Recoverable 494,923 1,648,153 42,965 - 1,625 - 1Statistics Canada 2006a 2Corn Stover: Straw to grain yield 0.95 (Zan, 1998) 3Soybean Straw: Straw to grain yield 1.5 (Klass, 1998) 4Corn Cob: Cob to grain yield 0.19 (Zan, 1998) 5Recoverable straw and stalk is estimated at 20% 6Revoverable straw is estimate at 0% and 30% in Ontario and Quebec respectively 7Corn cob estimated recovery rate of 50%
2.7.2 Soybean Straw
Soybean straw residues in Ontario and Quebec are sizable in volume, with 575,625 and 2.7 million tonnes produced annually (Table 7). Soybeans do not produce large volumes of field crop residues compared to corn. After combine harvest, only 30% field cover remains in the field following soybean harvest which is just sufficient to adequately protect soils from erosion (OMAFRA 2002). The soil erosion problem could largely be avoided in Ontario if winter wheat can be no-till planted into soybean fields in the fall which will help protect fields from erosion. Currently most of the acreage of winter wheat in Ontario is planted after soybean using no-till methods. In Quebec and Manitoba, the soil erosion and soil organic matter loss problem from soybean stalks removal prevents their sustainable recovery. It is estimated that 30% of the Ontario soybean residue could be harvested sustainably. This would leave recoverable volumes of 831,263 tonnes in Ontario. The main advantage of soybean stalks are the stalks are relatively dry at the time of harvest and have a high energy content. Some producers are already collecting small volumes of soybean stalks for use as livestock bedding. However, there could be significant potential for recovery of this resource if energy markets for the material could be developed.
2.7.3 Corn Cobs
In Ontario there are 1.0 million tonnes and in Quebec 600,000 tonnes of corn cobs produced each year (Table 7). Corn cobs represent an interesting feedstock as they tend to be drier at harvest than corn stalks, they have a reasonably good energy density and the cobs can be collected at harvest in modified combines or through whole ear harvest and storage in cribs. It is estimated that 50% of this resource could be sustainably recovered if

13
a market for the material can be developed in the commercial heating industry. The total recoverable resource is estimated at 497,525 and 301,434 tonnes for Ontario and Quebec respectively.
2.8 Crop Milling Residues Processed in Canada
This section of the report analyses the total production of crop milling residues from the Canadian agricultural sector. It places a strong analysis around crop milling residues which appear to be a valuable low cost fuel resource and have distinct combustion advantages compared to field crop residues. Almost all of the crop milling residues are presently used in the livestock feed industry. Use in biofuel heating, will therefore be dependent on providing a stronger economic incentive to use these materials than their market value in the feed industry. An inventory was performed of the corn, oat, wheat and soybean milling industries in British Columbia, Ontario and Quebec.
2.8.1 Wheat Processing
Wheat milling uses 70-75% of the grain for flour production and the remaining 25%-30% of the grain is available as wheat by products commonly referred to as millfeed, wheat mill run or wheat middlings2. Generally there is no separation between the different names of wheat by products and as a consequence the inconsistency in terminology presents difficulties in establishing quantities (Blasi et al., 1998). For the purpose of our report we will use the term millfeed. A portion of the millfeed is used for human consumption in the form of wheat bran, while the majority is used in the livestock feed industry. Saskatchewan can potentially produce 2.8 million tonnes of millfeed annually, followed by Alberta and Manitoba at 1.6 and 1 million tonnes (Table 8). Ontario and Quebec combined only have the potential to produce 1.3 million tonnes of millfeed. However, wheat is shipped across country or exported and milled where demand requires. Ontario, for instance, grows 8% of Canadian wheat but processes 40% of all wheat processed in Canada (Table 9). The province processes its own winter wheat as well as imported western wheat.
Table 8. Average Total Production of Milling Residues from Selected Crops by Province
(2001-2005) Production (tonnes) by Province Milling Residues
1
Quebec Ontario Manitoba Saskatchewan Alberta British Columbia
Millfeed2 886,875 444,943 1,019,266 2,752,014 1,639,481 15,393
Oat Hull3 62,460 25,170 225,876 278,802 163,506 13,458
Pin Oats4 28,628 11,536 103,527 127,784 74,940 6,168
Soybean Hulls5 38,375 184,725 8,505 - - -
Totals
Milling Residue 733,218 1,661,434 1,409,511 3,158,600 1,879,907 35,019
2 Blasi, D.A., Reed, C.J, Kuhl, G.L., Trigo-Stockli, D.M., Drouillard, J.S., Behnke, K.C., Fairchild, F.J.1998. Wheat middlings: compositon, feeding value, and storage guidelines. Kansas State University Agri. Experiment Station and Cooperative Extension Service. p 21.

14
1Statistics Canada 2006a 2Millfeed 27.5% of unprocessed grain (Blasi et al., 1998) 3Oat hull: 24% of unprocessed grain (Brown et al., 2001) 4Pin Oats: 11% of unprocessed grain (Nott, D. Personal Communication, April 2006) 5Soybean hulls: 10% of unprocessed grain (Forbes, R. Personal Communication, March 23, 2006)
The majority of the mills in Ontario are located in the southern part of the province in the major cities close to the majority of greenhouse growers (Appendix 3). A total volume of 391,029 tonnes of millfeed are produced in Ontario (Table 9). Furthermore, just south of the border in Buffalo, New York there is an additional 219,589 tonnes of millfeed produced a year. This makes the available fuel resource for the greenhouse industry at approximately 610,618 tonnes a year. Quebec also is a major producer of millfeed, representing 24% of all Canadian wheat milling or 201,071 tonnes respectively. British Columbia is a relatively small processor with only 4 % of the millfeed available in Canada (Table 9). Alberta, Saskatchewan and Manitoba process a combined total of 1,067,322 MT or 30% of the wheat processed in Canada (Table 9). The average millfeed price in Canada over the last two years ranged from $63-$79 in provinces processing more than 1000 tonnes daily (Table 11). This represents the largest, relatively low cost biofuel resource in close proximity to the main greenhouse industry in Canada. Typically millfeed was the cheapest in Ontario ($64.57) followed by Quebec ($78.54) and the most expensive in British Columbia ($107.79; Table 11). The tendency for millfeed to be more expensive in Quebec is related to the subsidizing of feed crop commodities in the province as well as most wheat is imported. The majority of wheat in British Columbia is imported from the prairies and the shipping costs increase the cost of the residue.
Table 9. Estimated Yearly Wheat Processing and Millfeed Production by Province
Wheat Millfeed
Location Daily Capacity (tonnes)1
Estimated storage (tonnes)1
Estimated processing (tonnes)
Average feed wheat selling price (2 yr)
Feed wheat selling range (5 yrs)
Estimated millfeed residue (tonnes)
Average millfeed selling
price/tonne (2 yr)2
Millfeed selling
range/tonne (5 yrs)2
British Columbia 625 7,020 182,500 $131.40 $130-225 40,150 $107.79 $106-170
Alberta 2,531 32,805 739,052 $107.76 $104-194 162,591 $68.963 N/A
Saskatchewan 1,223 36,204 295,292 $97.81 $96-175 64,964 $62.603 N/A
Manitoba 434 2,160 126,728 $134.31 $131-176 27,880 $85.963 N/A
Ontario 6,087 291,640 1,777,404 $113.72 $109-180 391,029 $64,57 $63-117
Quebec 3,130 265,815 913,960 $148.83 $137-237 201,071 $78.84 $78-140
Nova Scotia 436 30,375 127,312 $174.58 $169-252 28,009 $297.50 $285-298
Buffalo, NY 3,038 272,700 998,131 219,589
Overall 12,909 625,599 4,162,248 $129.77 $96-$252 915,695 $63-298 $63-298 Assumptions: Based on 90% utilization of capacity and 22% of the grain available as millfeed 1 World Grain 2006 and Market Analysis Division, 2006a 2Market Analysis Division, 2006b and Independent milling processors (Appendix 3) 3Calculated by using a 64% cost difference from feed grain to millfeed residue

15
2.8.2 Oat Processing
Oats are processed for human consumption as rolled oats or when cleaned and processed for horse feeding produce pin oats (small sized oats) and oat hulls as by products. There is a combined estimate of 41,000 tonnes of pin oats produced from oats grown in Ontario and Quebec (Table 8). In addition to the pin oats Ontario and Quebec potentially produces 87,000 tonnes of oat hull annually (Table 8). Alberta, Saskatchewan and Manitoba theoretically produce 307,000 tonnes of pin oats (Table 8). These western provinces produce a much larger volume of oat hulls than eastern Canada with 668,000 tonnes of oat hulls annually (Table 8). The above estimates of oat residue production are based on the quantity of oats grown in each province, however oats are not always processed where they are produced. For example prairie oats are transported east to Ontario for processing in Peterborough, Ontario. Eighty percent or 588,088 tonnes of oat processing is performed by large milling companies in western Canada (Table 10). Modest volumes of oats are produced in Ontario and even smaller volumes in Quebec. However, Ontario and Quebec import 75,920 tonnes of oats for processing from western Canada, producing 25,054 tonnes of oat hull annually (Table 10). Oat hulls are a relatively cheap fuel source ($10-$35/tonne) and compared to the cost per tonne of wheat millfeed they are on average much cheaper on a cost per GJ basis. Additionally, the benefit of oat hulls is that they have amongst the lowest feed value of a crop milling industry by-product, which translates to little competition for livestock feed uses. There is potential to export oat hull pellets from Manitoba and Saskatchewan into Ontario and Quebec. Alberta oat processors could potentially export oat hull pellets into the British Columbia market. They could be a useful fuel for blending with wet wood waste commonly available in BC.
Assumptions: Based on 90% utilization of capacity and 33% of the grain available as oat hull 1World Grain 2006 and Market Analysis Division 2006a (Appendix 4) 2Market Analysis Division 2006c 3Nott (Personal Communication, April 2006)
Table 10. Estimated Yearly Oat Processing and Oat Hull Production by Province
Oats Oat Hull
Province Daily Capacity (tonnes)1
Estimated storage (tonnes)1
Estimated processing (tonnes)
Average Oat selling price (2yr)2
Oat selling range (5 yr)2
Estimated Residue (tonnes)
Average Ground Oat hull selling price/tonne (2yr)3
Ground Oat hull selling
range/tonne (5 yr)3
Alberta 440 11,060 128,480 N/A N/A 42,398 N/A N/A Saskatchewan 1,074 19,194 313,608 $129,99 $129-213 103,491 $20,00 $10-35 Manitoba 500 5,250 146,000 $140,01 $131-203 48,180 $20,00 $10-35
Ontario 260 60,200 75,920 $203,92 $196-310 25,054 N/A N/A
Overall 2,274 95,704 664,008 $157,97 $129-$310 219,123 $20,00 $10-35
16
2.8.3 Soybean Processing
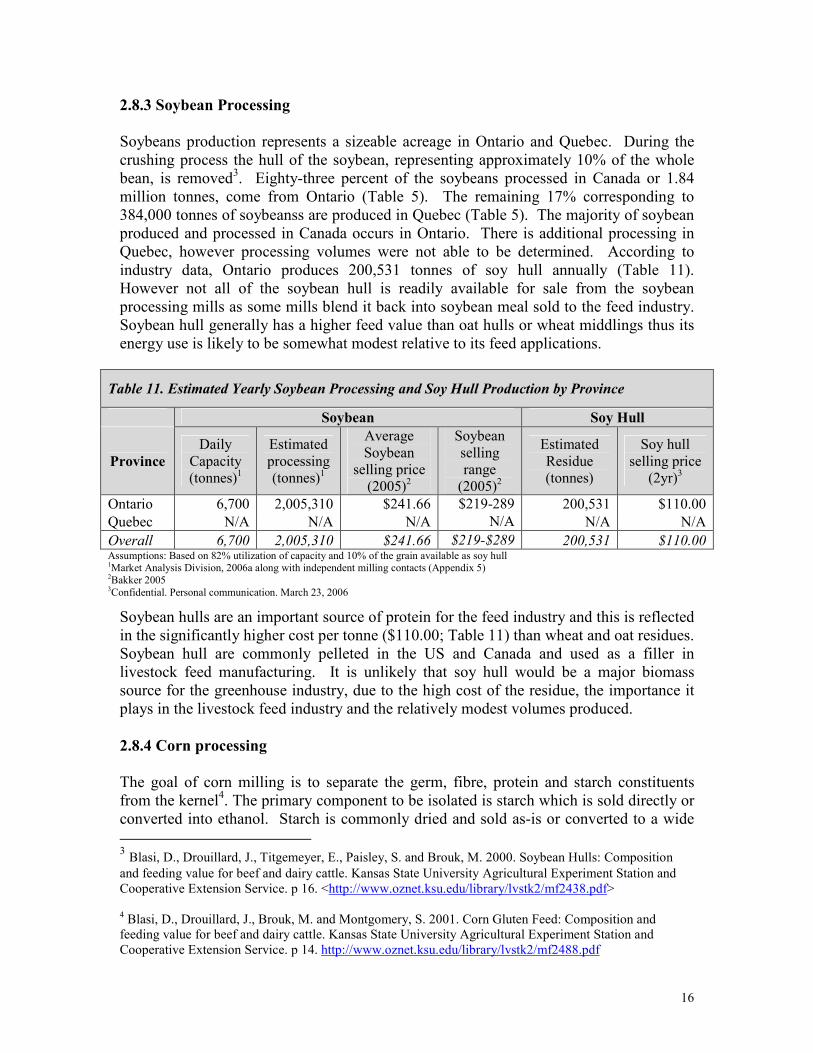
Soybeans production represents a sizeable acreage in Ontario and Quebec. During the crushing process the hull of the soybean, representing approximately 10% of the whole bean, is removed3. Eighty-three percent of the soybeans processed in Canada or 1.84 million tonnes, come from Ontario (Table 5). The remaining 17% corresponding to 384,000 tonnes of soybeanss are produced in Quebec (Table 5). The majority of soybean produced and processed in Canada occurs in Ontario. There is additional processing in Quebec, however processing volumes were not able to be determined. According to industry data, Ontario produces 200,531 tonnes of soy hull annually (Table 11). However not all of the soybean hull is readily available for sale from the soybean processing mills as some mills blend it back into soybean meal sold to the feed industry. Soybean hull generally has a higher feed value than oat hulls or wheat middlings thus its energy use is likely to be somewhat modest relative to its feed applications.
Table 11. Estimated Yearly Soybean Processing and Soy Hull Production by Province
Soybean Soy Hull
Province
Daily Capacity (tonnes)1
Estimated processing (tonnes)1
Average Soybean
selling price (2005)2
Soybean selling range (2005)2
Estimated Residue (tonnes)
Soy hull selling price (2yr)3
Ontario 6,700 2,005,310 $241.66 $219-289 200,531 $110.00
Quebec N/A N/A N/A N/A N/A N/A
Overall 6,700 2,005,310 $241.66 $219-$289 200,531 $110.00 Assumptions: Based on 82% utilization of capacity and 10% of the grain available as soy hull 1Market Analysis Division, 2006a along with independent milling contacts (Appendix 5) 2Bakker 2005 3Confidential. Personal communication. March 23, 2006
Soybean hulls are an important source of protein for the feed industry and this is reflected in the significantly higher cost per tonne ($110.00; Table 11) than wheat and oat residues. Soybean hull are commonly pelleted in the US and Canada and used as a filler in livestock feed manufacturing. It is unlikely that soy hull would be a major biomass source for the greenhouse industry, due to the high cost of the residue, the importance it plays in the livestock feed industry and the relatively modest volumes produced.
2.8.4 Corn processing
The goal of corn milling is to separate the germ, fibre, protein and starch constituents from the kernel4. The primary component to be isolated is starch which is sold directly or converted into ethanol. Starch is commonly dried and sold as-is or converted to a wide
3 Blasi, D., Drouillard, J., Titgemeyer, E., Paisley, S. and Brouk, M. 2000. Soybean Hulls: Composition and feeding value for beef and dairy cattle. Kansas State University Agricultural Experiment Station and Cooperative Extension Service. p 16. <http://www.oznet.ksu.edu/library/lvstk2/mf2438.pdf> 4 Blasi, D., Drouillard, J., Brouk, M. and Montgomery, S. 2001. Corn Gluten Feed: Composition and feeding value for beef and dairy cattle. Kansas State University Agricultural Experiment Station and Cooperative Extension Service. p 14. http://www.oznet.ksu.edu/library/lvstk2/mf2488.pdf

17
variety of products, including corn syrups and high fructose corn sweeteners. By products produced from the milling include bran, broken kernels, germ residue after oil extraction, and inseparable fractions of germ, pericarp, and endosperm (Stock et al., 1999). These materials are either sold separately or mixed and sold into the feed industry as corn gluten feed or corn gluten meal. Corn gluten feed is the part of the shelled corn that remains after the extraction of the large portion of the starch, gluten and germ. It is composed primarily of bran and steep liquor (liquid separated after steeping). It can contain up to 40-60% bran. As a livestock feed it is lower in quality than corn gluten meal and hence it is the lowest priced corn by-product in the marketplace. It is lower in crude protein (14-24%, DM basis) and valuable rumen by-pass protein than corn gluten meal (Stock et al, 1999). Corn gluten meal is a dry feed ingredient made from the protein remaining after the removal of starch and bran from the corn. It is possible to obtain the corn bran separately (not added to the gluten feed). Corn bran is the outer coating of the corn kernel, with little or none of the starchy part of the germ (Stock et al., 1999) and represents 15% of the total grain (Braisher et al., 2006). During the milling processes corn kernels become cracked and/or broken, these remnants are pooled together into what is know as corn screenings. Approximately 4% corn screenings are produced from each tonne of corn processed (Peak, J. Personal Communication, August 2005). Limited information is available on corn processing volumes in particular with corn bran, however data was obtain from two of the major starch producing companies in Ontario. It is therefore estimated that in Ontario a minimum of 195,129 tonnes of corn bran and approximately 55,807 tonnes of corn screenings could be recovered from the corn starch milling industry in Ontario. This material is currently being developed by Evergreen biofuels and partner companies as a fuel pellet resource in Ontario (Drisdelle, M. Personal Communication. May, 2006).
Table 12. Estimated Yearly Capacity for Corn ethanol and starch and sweeteners in Ontario1
Corn Residue
Processing Daily Capacity (tonnes)1
Estimated processing (tonnes)1
Average Corn selling price (2005)2
Corn selling range (2005)2
Residue Type
Estimated Residue (tonnes)
Residue selling
price (2yr)1
Bran 195,129 $100.00 Starch & sweeteners
4,200 1,226,400 $97.49 $90-$105 Corn Screenings 55,807 $100.00
Overall 4,200 1,226,400 $97.49 $90-$105 250,936 1World Grain 2006, Market Analysis Division, 2006a and independent milling contacts (Appendix 6) 3Market Analysis Division, 2006d
2.9 Residue Transportation Feasibility
In order to determine the feasibility of transporting milling residues we performed an analysis on the cost of shipping western feed wheat across the country. The dominant trends found was that shipping wheat to Quebec and eastern Ontario from Manitoba and Saskatchewan was similar in price and cheaper than shipping to London, Ontario. It was

18
more expensive to ship wheat west from Manitoba and Saskatchewan to Vancouver British Columbia.
Table 13. Transportation costs (CAD) to ship wheat per tonne by CPR rail.
Shipping Destination
British Columbia Ontario Quebec
Origin
Vancouver London Hamilton Port Colborne Montreal
Thunder Bay, ON NA 29.14 26.00 26.00 26.04
Winnipeg, MB 64.87 54.67 51.32 51.32 51.36
Brandon, MB 61.97 57.45 54.10 54.10 54.13
Saskatoon, SK 50.83 61.08 57.73 57.73 57.77
Golden Prairie, SK 47.92 62.12 58.77 58.77 58.81 1Source: CPR 2006. 2Assumptions: based on hopper with carrying capacity (132 m3) or 88 tonnes, fuel surcharge of 10.5%
The cost of shipping millfeed from Manitoba, or Saskatchewan to Ontario or Quebec would be approximately $56.32 per tonne. In order for this to become a viable option the cost of millfeed in Ontario and Quebec would need to be above $120.90 and $135.17, respectively. Millfeed prices change depending on the market demand and have ranged from $69-$117 in Ontario and $78-$140 in Quebec in the last five years (Table 9), therefore given seasonal variation over the year it may be possible to ship additional millfeed east to Ontario and Quebec. The cost of millfeed in British Columbia is on average $107.79 and the cost to ship a tonne of millfeed from Saskatchewan and Manitoba to British Columbia is approximately $56.40, for a minimum selling price of $164.18 per tonne. The range of millfeed in British Columbia has been between $106-$170 in the last five years (Table 9), so again it is possible but not probable given the wood pellet market. Given that millfeed has approximately the same energy content and quality as feed grains it appears to be a likely candidate for fuel use if grain commodity prices are relatively low. If prices rice, millfeed may still be useful as a binding agent in pellet production Oat hull is significantly cheaper compared to millfeed, costing approximately 15-20% the cost of the oat grain itself (Table 10). Oat hull ranged from $10-35/tonne in the last two years, if we include the cost of shipping oat hull from Saskatchewan and Manitoba to Ontario and Quebec, oat hull would sell at approximately $66.33-91.33. Similarly oat hull would have a minimum selling price of $66.40-$91.40 in British Columbia. Because of the low cost it is feasible to ship it in a pelleted form from the prairies to British Columbia and Ontario and Quebec. The current availability of local or regional processing facilities for drying, densifying, pelletizing, and storing biomass are listed in Appendix 2. As well, many feed mills (perhaps more than 100) in Canada can process crop milling residues into pellets. The average cost to pellet crop milling residues varies from region to region. In western Canada it costs approximately $10-12 dollars a tonne and in eastern Canada $15-20 a tonne to pellet crop milling residue (Confidential. Personal Communication, April 2006). Producing wood pellets are significantly more expensive, costing approximately $39 a

19
tonne if no drying is required (Mani et al., 2006). The major cost factor to make biomass pellets economical is low raw material costs. By using a low cost milling residue, agri-fibre pellets could potentially be produced for approximately $120-140/tonne in the main greenhouse producing areas.

20
3.0 Energy Crop Farming
Agriculture presents significant opportunities for the development of biomass feedstocks for the emerging bioenergy industry. Along with the use of agricultural residues as pellet feedstocks, dedicated perennial energy crops offer an important land use strategy that may create demand enhancement for the agricultural market as farmers diversify and shift production towards energy products from food products.
3.1 Potential for Energy Crop Production in Quebec and Ontario
An evaluation of the production potential of switchgrass and other grasses for use as energy feedstocks in Ontario and Quebec was performed. It was found that there is a large potential area of agricultural land suitable for switchgrass production in Ontario and Quebec, and as provincial energy consumption continues to increase, so will the demand for sustainable biofuels. Crop lands currently dedicated to the production of wheat, oats, barley, rye, corn and soybean or marginal lands are ideal for switchgrass production due to the low value return for these commodities in international and local markets. Converting 20% of these lands to biomass production would allow the development of a significant bioenergy industry. The conversion of forage lands to dedicated energy crop production may be an attractive option due to the decline of the beef industry in eastern Canada. As producing livestock in western Canada is significantly more economical, the industry is no longer competitive in the east. In eastern Canada converting up to 40% of lands currently used for forage production (including tame hay and improved pasture) into perennial bioenergy feedstocks is emerging as an interesting new option. The U.S. Department of Agriculture recently performed an analysis of the economic potential of biofuels and determined that bioenergy crops could be produced at a profit greater than existing agricultural uses for the land while also raising traditional crop prices (Walsh et al., 2003). The study illustrated that a conversion of 10% of existing crop, pasture and fallow land in the U.S. to bioenergy crops could produce 171 million tonnes of biomass while increasing crop prices by up to 14% above baseline values.
3.1.1 Energy Crop Yields
Warm season grasses are ideally suited to become a primary energy feedstock for the greenhouse heating industry in Ontario and Quebec because this industry is largely situated in the southern portions of the provinces, regions that are favorable for warm-season grass production and the regions lack wood residues. Most efforts in the development of warm season grasses have been focused on the production of switchgrass, a native warm season grass in Canada. Switchgrass was chosen as a model herbaceous energy crop species in the early 1990’s by the U.S. Department of Energy as it had a number of promising features including its moderate to high productivity, adaptation to marginal farmlands, drought resistance, stand longevity,
21
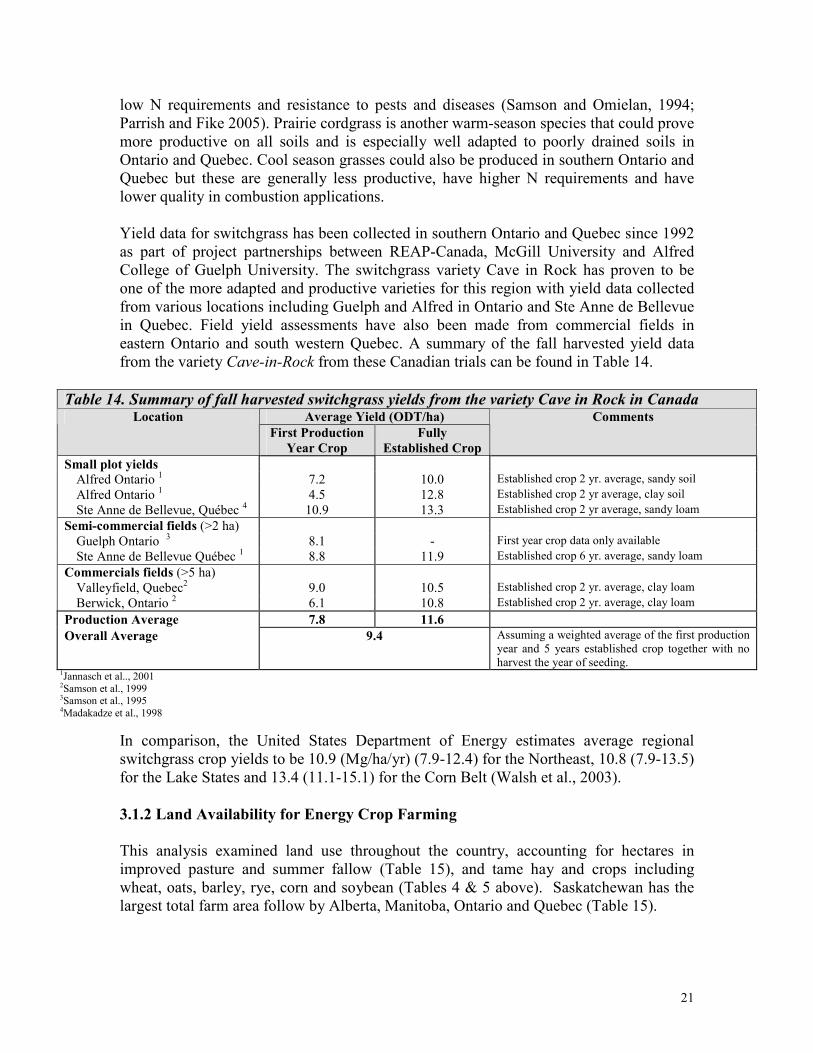
low N requirements and resistance to pests and diseases (Samson and Omielan, 1994; Parrish and Fike 2005). Prairie cordgrass is another warm-season species that could prove more productive on all soils and is especially well adapted to poorly drained soils in Ontario and Quebec. Cool season grasses could also be produced in southern Ontario and Quebec but these are generally less productive, have higher N requirements and have lower quality in combustion applications. Yield data for switchgrass has been collected in southern Ontario and Quebec since 1992 as part of project partnerships between REAP-Canada, McGill University and Alfred College of Guelph University. The switchgrass variety Cave in Rock has proven to be one of the more adapted and productive varieties for this region with yield data collected from various locations including Guelph and Alfred in Ontario and Ste Anne de Bellevue in Quebec. Field yield assessments have also been made from commercial fields in eastern Ontario and south western Quebec. A summary of the fall harvested yield data from the variety Cave-in-Rock from these Canadian trials can be found in Table 14.
Table 14. Summary of fall harvested switchgrass yields from the variety Cave in Rock in Canada Average Yield (ODT/ha) Location
First Production
Year Crop
Fully
Established Crop
Comments
Small plot yields Alfred Ontario 1 7.2 10.0 Established crop 2 yr. average, sandy soil
Alfred Ontario 1 4.5 12.8 Established crop 2 yr average, clay soil
Ste Anne de Bellevue, Québec 4 10.9 13.3 Established crop 2 yr average, sandy loam
Semi-commercial fields (>2 ha)
Guelph Ontario 3 8.1 - First year crop data only available
Ste Anne de Bellevue Québec 1 8.8 11.9 Established crop 6 yr. average, sandy loam
Commercials fields (>5 ha)
Valleyfield, Quebec2 9.0 10.5 Established crop 2 yr. average, clay loam
Berwick, Ontario 2 6.1 10.8 Established crop 2 yr. average, clay loam
Production Average 7.8 11.6
Overall Average 9.4 Assuming a weighted average of the first production year and 5 years established crop together with no harvest the year of seeding.
1Jannasch et al.., 2001 2Samson et al., 1999 3Samson et al., 1995 4Madakadze et al., 1998
In comparison, the United States Department of Energy estimates average regional switchgrass crop yields to be 10.9 (Mg/ha/yr) (7.9-12.4) for the Northeast, 10.8 (7.9-13.5) for the Lake States and 13.4 (11.1-15.1) for the Corn Belt (Walsh et al., 2003).
3.1.2 Land Availability for Energy Crop Farming
This analysis examined land use throughout the country, accounting for hectares in improved pasture and summer fallow (Table 15), and tame hay and crops including wheat, oats, barley, rye, corn and soybean (Tables 4 & 5 above). Saskatchewan has the largest total farm area follow by Alberta, Manitoba, Ontario and Quebec (Table 15).

22
Table 15. Canadian farm land area use
Region Land Use (ha)
Quebec Ontario Manitoba Saskatchewan Alberta British Columbia
Summerfallow 4,860 14,235 255,733 3,131,640 1,235,592 36,765
Improved Pasture2 182,841 313,085 383,474 1,405,734 2,230,892 233,044
Unimproved Pasture 185,905 531,892 1,580,374 5,126,442 6,678,899 1,207,553
Total Cropland3 1,849,938 3,656,705 4,714,830 15,375,929 9,728,181 617,545
All Other4 1,193,482 1,950,316 667,369 1,225,600 1,193,923 429,211
Total Farm Land5 3,417,026 5,466,233 7,601,779 26,265,645 21,067,486 2,587,118
1Statistics Canada, 2001 2Includes all tame and seeded pasture lands 3Includes all crops except Christmas tree production 4Includes Christmas tree production 5Includes farm land for all farms reporting income from agricultural production
3.1.3 Energy Grass Production Potential of Ontario and Quebec
Using the land areas from Table 15, it is found that by converting 20% of crop land 450,847 ha of land becomes available in Ontario and 188,012 ha in Quebec for biofuel production (Table 16). Assuming yields of 9.3 tonnes/ha for Ontario and Quebec (Table 14), this would result in the production of 5,941,389 tonnes of biomass in the two provinces. Similarly, converting 40% of forage land would allow 504,434 ha to become
Table 16. Land Availability and Biofuel Production Potential in Ontario and Quebec
Agricultural Ontario Quebec
Land Converted to grasses
Land for Biofuel
Yield Land Converted to grasses
Land for Biofuel
Yield Product Total Land Area (ha)1
(%) (ha) (tonnes)
Total Land Area (ha)1
(%) (ha) (tonnes)
Crops
All Wheat 342,000 20 68,400 636,120 46,000 20 9,200 85,560
Oats 39,000 20 7,800 72,540 97,000 20 19,400 180,420
Barley 112,000 20 22,400 208,320 142,000 20 28,400 264,120
Rye 25,000 20 5,000 46,500 16,000 20 3,200 29,760
Corn (grain) 728,000 20 145,600 1,354,080 431,000 20 86,200 801,660
Corn (fodder) 126,000 20 25,200 234,360 46,200 20 9,240 85,932
Soybean 868,000 20 173,600 1,614,480 157,000 20 31,400 292,020
Summer Fallow2 14,235 20 2,847 26,477 4,860 20 972 9,040
Total – Crop land 2,254,235 20 450,847 4,192,877 940,060 20 188,012 1,748,512
Forages
Tame hay 948,000 40 379,200 3,526,560 751,000 40 300,400 2,793,720
Improved Pasture2 313,085 40 125,234 1,164,676 182,841 40 73,136 680,165
Total – Forages 1,261,085 40 504,434 4,691,236 933,841 40 373,536 3,473,885
Total - Crops and
Forages
3,515,320 27 955,281 8,884,113 1,873,901 561,548 5,222,396
1Statistics Canada, 2006a (5 year averages) 2Statistics Canada, 2001

23
available in Ontario and 373,536 ha in Quebec for biofuel production. Again assuming yields of 9.3 tonnes/ha, this conversion would result in the production of 8,165,121 tonnes of biomass in the two provinces. Considering these changes in both crop and forage lands, the overall potential exists to produce 14,106,510 tonnes of biomass for energy in Ontario and Quebec annually. Productive annual species such as sorghum, sweet sorghum or corn could be grown as annuals for winter harvest. Whole plant corn has been researched by German scientists (Schneider and Hartmann, 2005) and tested on a pilot scale by at least one southern Ontario greenhouse producer. Under this scenario, the harvesting technology is the same as corn silage harvesting, forage wagons can handle the bulk material. These tall thick stemmed species lend themselves well to winter harvest on frozen ground in regions of Canada which have modest winter snow cover such as the main Corn Belt region southwest of London Ontario and south of Montreal in Quebec. No detailed analysis of this potential is presented in this report however, the yield potential of these crops is substantial at approximately double the field crop corn yield for the provinces.

24
4.0 Field Crop Harvesting Practices
As crop residues of corn and soybeans are abundantly available in the main greenhouse production areas of southern Ontario and southern Quebec, greater understanding of the issues related to harvesting these materials is required. Soybean stalks and corn cobs appear to be the most easily recovered materials as a bioenergy feedstock for combustion. Corn stalks however, appear to be significantly more difficult to recover in the relatively humid environments of Ontario and Quebec. The main problems related to the corn stalk harvest are the high moisture content of the corn stalk material and the biomass quality problems associated with the early fall harvest of corn stalks (see section 5). As well, corn is harvested in the late fall when soils are generally in a humid state. Hauling off large amounts of biomass in wet fall conditions could lead to serious soil compaction problems. In terms of timing of harvest, soybeans stalks and corn cobs appear to be managed best as fall harvested residues, whole plant corn can be mid-winter harvested or spring harvested, and corn stalks are most practically spring harvested in eastern Canada. There are no special equipment requirements for soybean stover harvesting, standard hay harvesting equipment is presently being utilized by producers using the material for livestock bedding applications. The recovery of corn cobs and stalks is more technically challenging.
4.1 Corn Harvesting Practices
Traditionally, corn residue has been harvested for use as animal feed, bedding and/or cattle grazing. Corn is harvested either with a grain combine which leaves the stover on the field, with a forage harvester taking the whole corn plant for silage or with corn pickers that harvest the ear (cob and grain are left intact). The harvesting method determines the resulting by products. Conventional combine harvesting separates the grain from the cobs and remaining stover, and spreads the cobs and stover back on the field. Forage harvesting mixes all corn components together and downsizes the residues into a medium-fine chopped state. Corn pickers strip the ears from the stalk, and leaves the stalks standing in the field. These current practices, with modification, can allow for simultaneous or subsequent residue collection.
4.2 Harvesting Corn Residue Sustainably
Corn harvesting usually has focused on the grain or whole plant silage for livestock feeding. However in recent years other parts of the corn plant (leaves, stalks, cobs) have emerged as potential biomass sources. Factors contributing to the greater interest in this material are not only bioenergy markets but higher hay and feed costs, more farmland production in row crops and the availability of large balers and stackers that can effectively harvest corn residue (Myers, 1992). However, corn residues play an important nutritive and structural role in the regeneration and maintenance of healthy soil as they are important for soil organic matter, protect the soil from erosion, strongly influence radiation balances and energy fluxes and reduce the rate of evaporation from the soil through the establishment of the next crop (Wilhelm et al., 2004). Removal of corn residue must therefore be at a level that will maintain soil productivity for future

25
crops. Previous studies (Nelson, 2003; Shinners et al., 2003; Nelson, 2002; Sheehan et al, 2002); McAloon et al., 2000) have estimated residue removal at rates between 20% and 60% depending on conventional tillage practices or no-till practices and soil conditions. For adequate protection of soil from erosion, 30% ground residue cover after planting is the standard adopted in the US and Eastern Canada. It has been estimated that based on the need to adequately protect soil from erosion, 20% (Nelson, 2002) to approximately 30% (McAloon et al, 2000) of the actual amount of stover can be removed. For the purpose of this study we have adopted a 25% rate of residue removal due to the mix of tillage systems and soil conditions and assumed 25% of the corn acreage could be accessed for a winter or spring harvest. Thus the total recovery of corn stover is estimated at 6.25% of the total resource available (Table 7).
4.2.1 Corn Stover Recovery Practices
With the conventional combine harvesting method there are two options for collecting the residue: 1) stover collection after the grain harvest or 2) a single pass system. Collection of stover includes using hay and forage handling equipment to bale the stover after harvest. Two or three different operations are usually conducted in the field to collect the stover which is both expensive and labour intensive (Quick and Tuetken, 2002). Picking up the swathed material results in dirt and trash collected with the stover and very few of the cobs are recovered. Furthermore during the grain harvest stover is knocked to the ground and run over by the combine, trucks and wagons, leading to a 50%-70% biomass loss (Billy, 2000; Montross et al., 2002; Pordesimo et al., 2002; Perlack and Turhollow, 2002). The single pass approach is where equipment is hitched directly behind the combine to catch the waste stream (stover and/or cobs). Several methods have been tested for collecting the stover and cobs (Shields and Shields, 2003; Quick and Tuetken, 2002). The advantages of this system over separate baling operations include: reduced cost, reduced soil compaction, simplified logistics, less contamination of the product with soil, less susceptibility to late season weather damage, reduced straw losses and removal of weed seed from the field (Atchison and Hettenhaus, 2004). The main problem however with the fall harvest is that the moisture content of the stalks is very high, typically in the moisture range of 50% or more in Eastern Canada (Savoie and Decouteaux, 2004). In Germany, Schneider and Hartmann (2005) found whole plant corn to have 30% moisture content in mid October, with stalks at 55% moisture, and grain at 10% moisture. Corn stalk bale drying has been assessed in eastern Canada. The energy costs associated with using natural gas as a heat source at $8.33/GJ and electrical fan energy however cost $77/tonne per tonne to dry the material to 12% moisture (Savoie and Decouteaux, 2004). They concluded that efficiency gains could be further made in the drying system but that dry storage likely was only practical for material that could be field recovered at 30% moisture. There are currently some farmers in eastern Ontario who have been recovering corn stalks for the mushroom industry (Duncan, D. Personal Communication, June 2006). This is currently being done in the fall as spring harvested material in eastern Ontario is problematic in terms of timing of operations. Farmers that are no-till planting soybeans are also concerned about soil compaction associated with running over the fields to recover the material (Duncan, D. Personal Communication, June 2006). The present system being utilized by one progressive eastern Ontario farmer
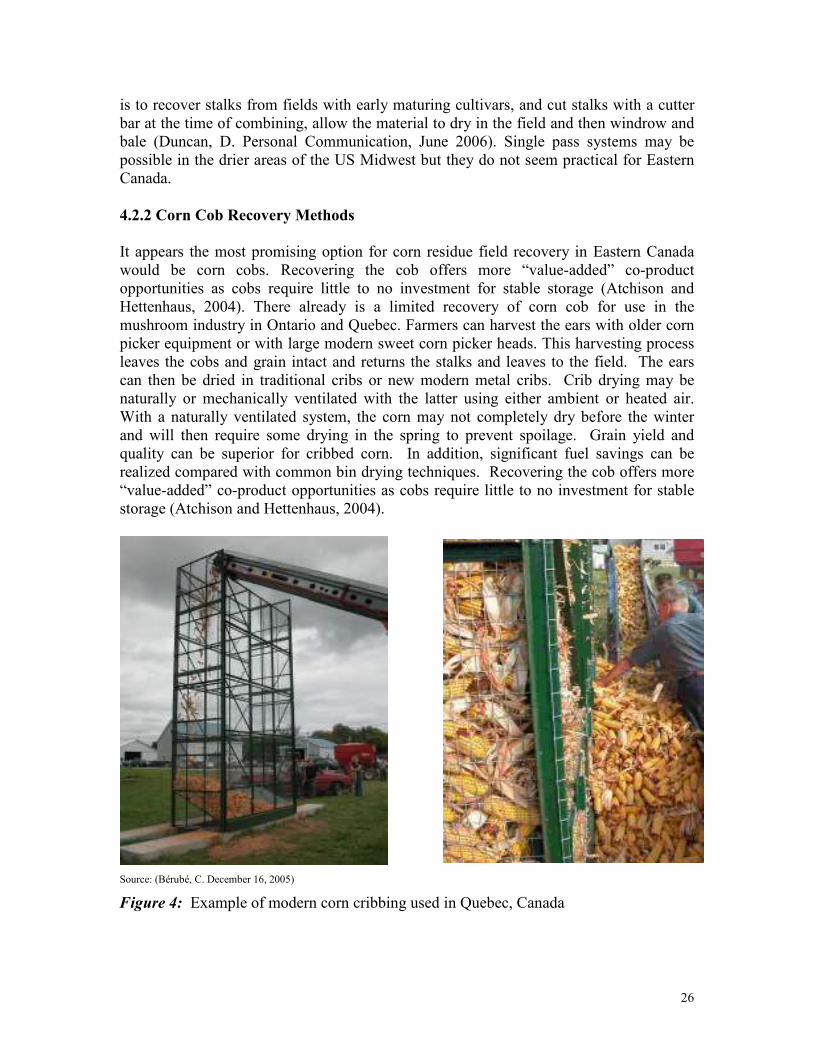
26
is to recover stalks from fields with early maturing cultivars, and cut stalks with a cutter bar at the time of combining, allow the material to dry in the field and then windrow and bale (Duncan, D. Personal Communication, June 2006). Single pass systems may be possible in the drier areas of the US Midwest but they do not seem practical for Eastern Canada.
4.2.2 Corn Cob Recovery Methods
It appears the most promising option for corn residue field recovery in Eastern Canada would be corn cobs. Recovering the cob offers more “value-added” co-product opportunities as cobs require little to no investment for stable storage (Atchison and Hettenhaus, 2004). There already is a limited recovery of corn cob for use in the mushroom industry in Ontario and Quebec. Farmers can harvest the ears with older corn picker equipment or with large modern sweet corn picker heads. This harvesting process leaves the cobs and grain intact and returns the stalks and leaves to the field. The ears can then be dried in traditional cribs or new modern metal cribs. Crib drying may be naturally or mechanically ventilated with the latter using either ambient or heated air. With a naturally ventilated system, the corn may not completely dry before the winter and will then require some drying in the spring to prevent spoilage. Grain yield and quality can be superior for cribbed corn. In addition, significant fuel savings can be realized compared with common bin drying techniques. Recovering the cob offers more “value-added” co-product opportunities as cobs require little to no investment for stable storage (Atchison and Hettenhaus, 2004).
Source: (Bérubé, C. December 16, 2005)
Figure 4: Example of modern corn cribbing used in Quebec, Canada

27
The second option is to recover the cobs off the back of a combine in a trailing wagon using a corn cob collecting apparatus (Flamme, 1999). This technology uses an air separation process to separate the cobs from the stalks and leaves. A corn cob collecting apparatus is being used in Quebec to recover corn cobs. The main problem with this system is that the cobs require some type of drying system as they typically may be recovered at about 35-40% and do not store well above 20% moisture. Corn cobs are typically considerably higher than the grain moisture content, especially at kernel humidity contents above 15% (Table 17).
Table 17: Kernel Versus Cob Moisture Contents for Corn
Kernel moisture (%) 10 13 15 20 25 30 35 40
Cob moisture (%) 9 13 18 33 45 52 56 59 Source: ASAE Standards, 1994
4.2.3 Whole-Plant Corn Harvesting
Harvesting of whole plant corn for silage normally occurs when the plant is at 70% field moisture. However, if corn is grown as a bioheat crop, the harvest can be delayed until stalk moisture levels approach 20%. One Ontario greenhouse operator has successfully field tested the mid-winter delayed harvested option. There are some disadvantages associated with delayed harvest, including yield losses and dependence on favourable weather conditions for low moisture at harvest and minimal snow cover. This system could be possible for use in southern Ontario and some areas of southwestern Quebec when the soil is frozen. The forage harvester is the only method now commercially available for one-pass corn harvesting (Atchison and Hettenhaus, 2004). It removes the whole plant and cuts it into small pieces for ensiling. This systems offers distinct advantages in terms of improving fuel quality with the moisture content and potassium and chlorine content being significantly improved (Schneider and Hartmann, 2005). This could help the logistics of biomass storage as material could be stored in field for use on an ongoing basis. It would likely be possible to use this system in some greenhouse growing areas in the months of February and March.
4.3 Biomass Harvesting Techniques
In the past, the main technical barrier to the development of herbaceous biomass for combustion was the high potassium and chlorine content of the material and the resulting difficulties these elements present during combustion. Increased understanding of delayed-harvesting practices can optimize biomass combustion quality and recoverable biomass yields.
The harvesting of switchgrass is best delayed not just until biomass growth has ceased, generally in August or September, but rather until shoots have senesced and died, which may not be until November or December (Parrish and Fike 2005). Previous studies (Sanderson et al., 1999; Vogel et al., 2002) reported yield declines of approximately 15% from August to November, however this decline actually represents the transfer of nutrients from above ground to below storage (Parrish and Wolf, 1992, 1993), and is

28
vital for stand sustainability. Best management strategies for switchgrass in northern latitudes recommend a single harvest taken after the tops have completely died back (Parrish and Fike 2005). Biomass yields have been found to further decrease as the stand is overwintered, mainly due to mechanical breakage and loss from leaves and seed heads (Goel et al., 2000). In southwestern Quebec, spring-harvested switchgrass yields were found to be approximately 24 percent lower than that of early October harvested switchgrass, with the loss of dry matter at 4 percent from the stem component, 11 percent from leaf sheaths, 30 percent from leaves and 80 percent from seed heads compared to fall harvesting. Other studies in Quebec have found on fully established switchgrass stands spring yields 15 percent below late October fall harvests where the crop is fully dormant (Girouard et al., 1998). Losses of biomass also occur during field operations (eg. cutting, baling, transport), with. Sanderson et al., (1997) reporting a 5% biomass loss from conventional fall harvesting of switchgrass (mower and baler) over a two-year study. A study conducted by REAP-Canada (Girouard and Samson 1996) found that conventional spring harvesting (mower and baler) of switchgrass resulted in a 45% loss of biomass (32% as mowing losses and 13% as baling losses). Losses of this magnitude were also witnessed by Hemming (1995) with reed canary grass where a mower conditioner was used. A subsequent comparison in Quebec between spring mowing and baling with spring swathing and baling found biomass losses of approximately 25.3% and 12.5% respectively (Girouard and Samson 1997). However, a follow up study by Girouard et al., (1998) witnessed a 3% decrease of biomass with the swathing and baling method. This was accounted for by the lowering of the cutting height from 16 cm to 13 cm compared to the 1997 study. Fall mowing and spring baling techniques require further investigation as approaches to reduce the breakage losses over winter.
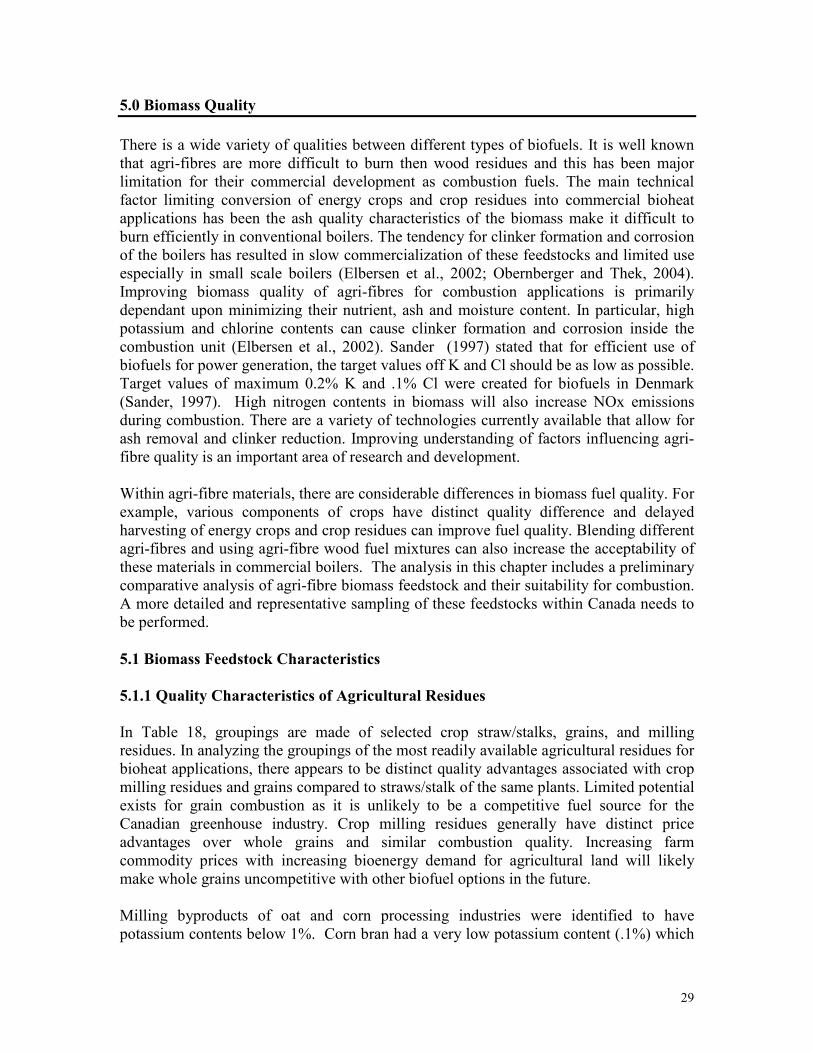
29
5.0 Biomass Quality
There is a wide variety of qualities between different types of biofuels. It is well known that agri-fibres are more difficult to burn then wood residues and this has been major limitation for their commercial development as combustion fuels. The main technical factor limiting conversion of energy crops and crop residues into commercial bioheat applications has been the ash quality characteristics of the biomass make it difficult to burn efficiently in conventional boilers. The tendency for clinker formation and corrosion of the boilers has resulted in slow commercialization of these feedstocks and limited use especially in small scale boilers (Elbersen et al., 2002; Obernberger and Thek, 2004). Improving biomass quality of agri-fibres for combustion applications is primarily dependant upon minimizing their nutrient, ash and moisture content. In particular, high potassium and chlorine contents can cause clinker formation and corrosion inside the combustion unit (Elbersen et al., 2002). Sander (1997) stated that for efficient use of biofuels for power generation, the target values off K and Cl should be as low as possible. Target values of maximum 0.2% K and .1% Cl were created for biofuels in Denmark (Sander, 1997). High nitrogen contents in biomass will also increase NOx emissions during combustion. There are a variety of technologies currently available that allow for ash removal and clinker reduction. Improving understanding of factors influencing agri-fibre quality is an important area of research and development. Within agri-fibre materials, there are considerable differences in biomass fuel quality. For example, various components of crops have distinct quality difference and delayed harvesting of energy crops and crop residues can improve fuel quality. Blending different agri-fibres and using agri-fibre wood fuel mixtures can also increase the acceptability of these materials in commercial boilers. The analysis in this chapter includes a preliminary comparative analysis of agri-fibre biomass feedstock and their suitability for combustion. A more detailed and representative sampling of these feedstocks within Canada needs to be performed.
5.1 Biomass Feedstock Characteristics
5.1.1 Quality Characteristics of Agricultural Residues
In Table 18, groupings are made of selected crop straw/stalks, grains, and milling residues. In analyzing the groupings of the most readily available agricultural residues for bioheat applications, there appears to be distinct quality advantages associated with crop milling residues and grains compared to straws/stalk of the same plants. Limited potential exists for grain combustion as it is unlikely to be a competitive fuel source for the Canadian greenhouse industry. Crop milling residues generally have distinct price advantages over whole grains and similar combustion quality. Increasing farm commodity prices with increasing bioenergy demand for agricultural land will likely make whole grains uncompetitive with other biofuel options in the future. Milling byproducts of oat and corn processing industries were identified to have potassium contents below 1%. Corn bran had a very low potassium content (.1%) which
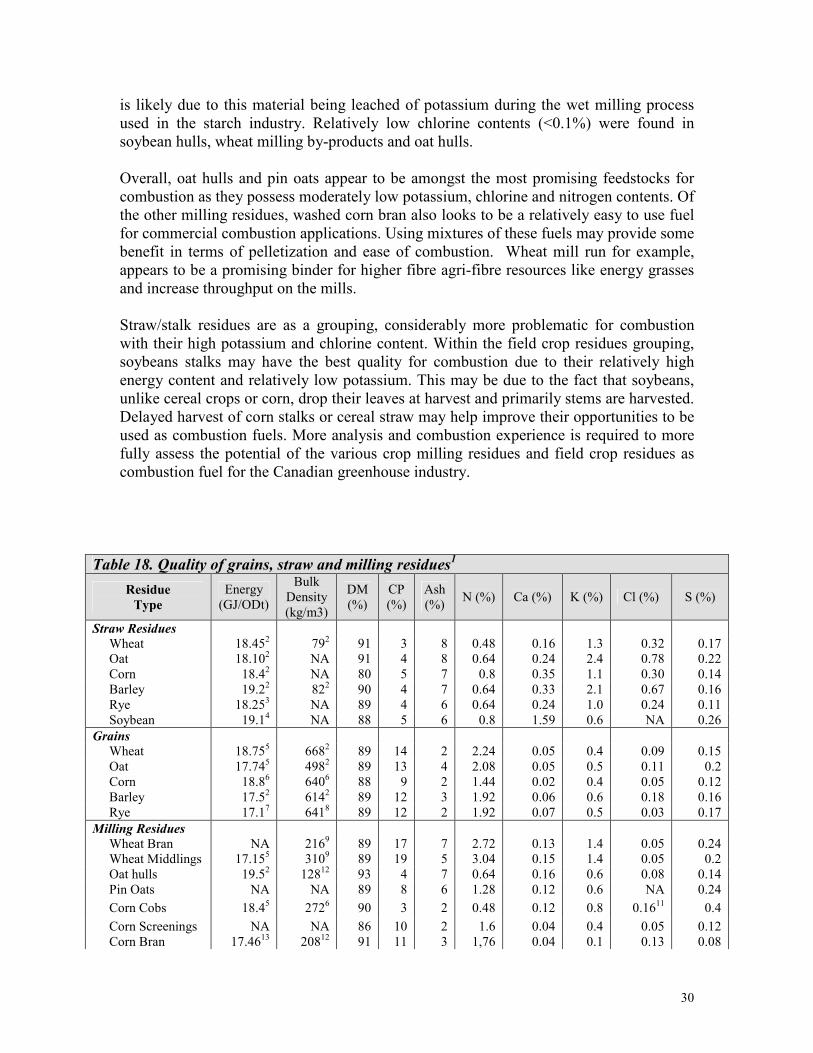
30
is likely due to this material being leached of potassium during the wet milling process used in the starch industry. Relatively low chlorine contents (<0.1%) were found in soybean hulls, wheat milling by-products and oat hulls. Overall, oat hulls and pin oats appear to be amongst the most promising feedstocks for combustion as they possess moderately low potassium, chlorine and nitrogen contents. Of the other milling residues, washed corn bran also looks to be a relatively easy to use fuel for commercial combustion applications. Using mixtures of these fuels may provide some benefit in terms of pelletization and ease of combustion. Wheat mill run for example, appears to be a promising binder for higher fibre agri-fibre resources like energy grasses and increase throughput on the mills. Straw/stalk residues are as a grouping, considerably more problematic for combustion with their high potassium and chlorine content. Within the field crop residues grouping, soybeans stalks may have the best quality for combustion due to their relatively high energy content and relatively low potassium. This may be due to the fact that soybeans, unlike cereal crops or corn, drop their leaves at harvest and primarily stems are harvested. Delayed harvest of corn stalks or cereal straw may help improve their opportunities to be used as combustion fuels. More analysis and combustion experience is required to more fully assess the potential of the various crop milling residues and field crop residues as combustion fuel for the Canadian greenhouse industry.
Table 18. Quality of grains, straw and milling residues1
Residue
Type
Energy
(GJ/ODt)
Bulk Density (kg/m3)
DM (%)
CP (%)
Ash (%)
N (%) Ca (%) K (%) Cl (%) S (%)
Straw Residues Wheat 18.452 792 91 3 8 0.48 0.16 1.3 0.32 0.17 Oat 18.102 NA 91 4 8 0.64 0.24 2.4 0.78 0.22 Corn 18.42 NA 80 5 7 0.8 0.35 1.1 0.30 0.14 Barley 19.22 822 90 4 7 0.64 0.33 2.1 0.67 0.16 Rye 18.253 NA 89 4 6 0.64 0.24 1.0 0.24 0.11 Soybean 19.14 NA 88 5 6 0.8 1.59 0.6 NA 0.26
Grains Wheat 18.755 6682 89 14 2 2.24 0.05 0.4 0.09 0.15 Oat 17.745 4982 89 13 4 2.08 0.05 0.5 0.11 0.2 Corn 18.86 6406 88 9 2 1.44 0.02 0.4 0.05 0.12 Barley 17.52 6142 89 12 3 1.92 0.06 0.6 0.18 0.16 Rye 17.17 6418 89 12 2 1.92 0.07 0.5 0.03 0.17
Milling Residues Wheat Bran NA 2169 89 17 7 2.72 0.13 1.4 0.05 0.24 Wheat Middlings 17.155 3109 89 19 5 3.04 0.15 1.4 0.05 0.2 Oat hulls 19.52 12812 93 4 7 0.64 0.16 0.6 0.08 0.14 Pin Oats NA NA 89 8 6 1.28 0.12 0.6 NA 0.24
Corn Cobs 18.45 2726 90 3 2 0.48 0.12 0.8 0.1611 0.4
Corn Screenings NA NA 86 10 2 1.6 0.04 0.4 0.05 0.12 Corn Bran 17.4613 20812 91 11 3 1,76 0.04 0.1 0.13 0.08

31
Soybean hull 17.615 17010 90 13 5 2.08 0.55 1.4 0.02 0.12 1Source: Preston (2005) 2Reisinger et al. (2006) 3Staniforth (1979) 4Barnard and Kristoferson (2005) 5AURI (2001) 6 White and Johnson (2003) 7FAO (2004) 8Murphy (1993) 9Blasi et al. (1998) 10Blasi et al. (2000) 11Smeenk and Brue (2000) 12ASI Instruments 2006 13Braisher et al. (2006)
5.1.2 Quality Characteristics of Energy Grasses
As with agricultural residues, the quality of dedicated energy grasses for combustion applications are also primarily dependant upon minimizing nutrient, ash and moisture contents, particularly those of potassium and chlorine (Samson et al., 2005). The incineration of biomass containing chlorine at high temperatures may also result in the production of polynuclear aromatic hydrocarbons (PAH), dioxins, furans and other volatile organic compounds (VOC) (Chaggera et al, 1998). High nitrogen contents in biomass will also increase NOx emissions during combustion, which can react with the PAH and other gases present in the emissions to form any number of possible polychlorinated compounds. However, biofuel ash may be the most limiting factor during combustion as it can form deposits on or corrode surfaces in the appliances and severely affect the operation of power plants (Cassida et al., 2005). These technical problems can now be resolved with a dual strategy to improve biomass quality (particularly lowering potassium and chlorine content) while utilizing advanced combustion systems. Samson et al., (2005) identified advances in plant breeding and crop management to reduce the chlorine, alkali and silica content. As well, combustion systems of advanced design specifically designed to burn higher ash fuels are now available (Obernberger and Thek, 2004). Harvest timing of grasses plays an important role in nutrient management of energy crops. Summer harvested switchgrass can have high chlorine, potassium, sulphur and nitrogen contents (Table 19). As the months pass and the crop overwinters, these nutrients are translocated into the root systems or leached by rainfall, achieving their lowest concentrations during the spring. Overwintering material is extremely effective in reducing nutrient contents of biomass with 95% of the potassium leached out of the switchgrass fibre over winter (Goel et al., 2000). Overwintered switchgrass has potassium and chlorine levels (Table 19) that approach levels of these elements in wood pellets of 0.05% and 0.01% respectively (Obernberger and Thek, 2004).
Table 19. Effects of delayed harvest on elemental composition of switchgrass1
Date of Harvest N (%) Ca (%) K (%) Cl (%) S (%)
July 1.35 0.49 1.33 0.26 0.11
August 0.78 0.50 0.98 0.22 0.08
November 0.45 0.59 0.30 0.10 0.06
December 0.46 0.59 0.20 0.06 0.08
February 0.53 0.65 0.10 0.02 0.08 1Unpublished Nicola Yates, 2003

32
Trials of upland switchgrass ecotypes including Cave-in-rock, Dacotah, Pathfinder, Sunburst, Forestburg, and Nebraska 28 confirm that potassium and chloride levels decrease as the crop is overwintered (Table 20).
Table 20. Potassium and chloride concentration in switchgrass plants (Christian et al.,
2002) Potassium Concentration (%) Chloride Concentration (%)
Trial year Dead Stem
Over wintered Harvest
Dead Stem Over wintered Harvest
1993 0.873 - - -
1994 0.221 0.140 0.101 0.047
1995 0.220 0.167 0.113 0.061
1996 0.127 - - -
1997 0.201 - - -
The production of switchgrass on clay soils has also been found to lead to much higher ash contents due to the higher uptake of silica in these soils (Samson and Mehdi, 1999. Elbersen et al., 2002). Silica enters the plant through water uptake (Jones and Handreck, 1967) and represents about two-thirds of the ash content found in grasses. Sandy soils, which have less monosilicic acid, produce feedstocks lower in ash content. In eastern Canada, the ash content of switchgrass grown on a sandy loam soils was 15% below that of clay loam soils (Samson et al 1999). However, delayed harvesting of the grass (overwintering the grass and harvesting the following spring) had an even bigger influence than soil type by reducing ash content by 39%. The potassium and chlorine contents of herbaceous species such as switchgrass at harvest is affected by resident levels of these elements in the soil, the rate of potassium fertilizer applied to the crop, the type of potassium fertilizer applied, the content of these elements at crop maturity, and the rate and duration of leaching of these elements that occur in the period following maturity until harvest time (Samson et al., 2005). An effective way to reduce potassium content in the fall is to use early maturing varieties that have a longer period to leach out material prior to late fall harvest (Elberson et al., 2002). Physiological ecotype, or characteristics of certain varieties due to their latitude of origin, can have a significant effect on biomass quality. Southern varieties of grasses may have higher water contents as they mature later and have thicker stems (Elbersen et al., 2002), leading to reduced leaching in the stem and higher concentrations of K and Cl in the biomass (Table 21).
Table 21. Switchgrass nutrient content as affected by variety and maturity (Elbersen et al.
2002) Clay Site Sandy Site
Switchgrass
variety
Latitude
of Origin Ash
(%DW) Cl
(kg/tonne) K
(kg/tonne) Ash
(%DW) Cl
(kg/tonne) K
(kg/tonne)
Forestburg 44 7.37 0.34 1.40 1.9 0.32 1.38
Summer 41 6.38 0.32 1.83 2.0 0.26 1.53
Cave-in-rock 38 7.01 0.78 3.93 1.7 0.78 2.61
Blackwell 37 8.00 0.69 2.77 2.6 0.81 2.52

33
Carthage 35 6.90 1.01 4.48 2.3 0.68 3.02
Plant morphology can also have a significant effect on biomass quality. Lowland types of switchgrass are characterized by tall, coarse stems with rapid growth and are adapted to poor drainage and often found in floodplains. They differ notably from upland types which are characterized by short, fine stems with a high drought tolerance (Cassida et al., 2005). Upland types have been found to have higher ash concentrations than lowland types (Cassida et al., 2005); however, they also tend to have lower chlorine and potassium levels and lower water contents. It is likely that these thinned stemmed upland ecotypes both dry out more quickly and have their elements leached more readily by rains. Lowland types have been found to have lower nitrogen concentrations due to their higher stem contents and low leaf content. Different components of the energy grass plants themselves have also been found to have varying degrees of biomass quality (Samson et al., 2005). Stem sections of the plant contain significantly lower levels of ash than the leaves, and moderately less than the leaf sheaths or seed heads (Table 22).
Table 22. Ash content of switchgrass components (Samson et al., 2005) Switchgrass Ash Contents (%)
Sandy Loam Soils Clay Loam Soils Plant
Component Spring 1998 Fall 1998 Spring 1998 Fall 1998
Leaves 6.20 7.40 7.67 9.19
Leaf sheaths 2.46 4.47 3.67 5.75
Stems 1.08 2.39 0.98 2.40
Seed heads 2.38 4.66 n/a 4.82
Weighted Average 2.75 4.50 3.21 5.24
When considering that the ratio between plant components the stem component, which has the best fuel quality, is the most important plant component at either spring (over wintered) or fall harvest (Table 23). Overall it would appear through site selection, breeding for increased stem content, and using a delayed harvest technique, considerable improvement in switchgrass as a combustion fuel can be achieved. From the data above, it appears the aforementioned biomass quality targets of 0.2% K and 0.1% chlorine established in Denmark are readily achievable using a delayed harvesting system on switchgrass. As well the higher silica content of switchgrass is not considered a serious problem for commercial boilers as many commercial boilers are capable of burning higher ash fuels like low grade coal. Overall it appears the development of overwintered warm season grasses have no significant supply, technical or environmental issues associated with its development as a commercial greenhouse heating fuel.
Table 23. Switchgrass composition considering soil type and harvest (Mehdi et al., 1999) % Average Composition
Soil and
Harvest Type Seed Head Leaves Stem Leaf Sheath Leaf Sheath +
Stem
Sand Site
Spring Harvest 2.4 28.2 53.1 16.3 69.4
Fall Harvest 9.8 25.4 48.4 16.5 64.8

34
Clay Site
Spring Harvest 5.0 25.0 51.4 18.3 70.0
Fall Harvest 7.4 23.0 55.1 14.5 69.9

35
6.0 Financial Summary
In order to put potential biomass resources into perspective with natural gas and heating oil prices, an analysis of estimated costs to heat a typical greenhouse the size of 0.8 hectares was performed (Table 24). Futures of heating oil and natural gas prices for the winter of 2006 were used to estimated the cost per unit of each heating fuel (Oil Intelligence Link, 2006). We also took delivery costs required for each respective fuel for commercial operations (Enbridge Energy, 2006). Assuming on average an 0.8 hectare greenhouse requires approximately 9,928 GJ of heat energy per year. On average a transition to biofuels would save greenhouses heated with oil and natural gas 60% and 33%, respectively, in yearly fuel costs.
Table 24. Projected Annual Fuel Costs for Heating a 0.8 hectare Greenhouse in Canada
Fuel Type Cost per
Unit Unit
Energy
Content
(GJ)
Cost per
GJ Efficiency
$ GJ Heat
delivered
GJ heat
demand for 0.8
ha (9,928 GJ)
Conventional Fuels
Heating Oil $ 0.75 Litre 0.039 $ 19.38 80% $ 24.22 $ 240 503.88
Natural Gas $ 0.48 m3 0.037 $ 10.63 85% $ 12.50 $ 149 128.94
BioFuels
Corn $ 150,00 Tonne 15.8 $ 9.49 80% $ 11.87 $ 117 816.46
Switchgrass Pellets $ 150,00 Tonne 18 $ 8.33 80% $ 10.42 $ 103 416.67
Crop Milling Residue Pellets
$ 130,00 Tonne 17.1 $ 7.60 80% $ 9.50 $ 89 132.60
Bark Pellets $ 140,00 Tonne 18 $ 7.37 80% $ 9.21 $ 91 422.11
In Ontario the majority of greenhouse heating is done with natural gas. The greenhouse industry in southern Ontario is well situated to use the 416,083 tonnes of available milling residues (Table 9 & 10), including over 1.6 million tonnes of straw and stalk residues (Table 7) and potentially 9 million tonnes of switchgrass production (Table 16). These three biofuel types in a pelleted form would have the potential to decrease costs to the 1200 provincial greenhouse growers by 82 million dollars annually. In Quebec, 90 % of greenhouses are heated with heating oil (informal survey of farmers in January 2006). The location of Quebec’s greenhouses in the southwestern part of the province is ideal for accessing the 494,923 tonnes of straw and stalk (Table 7), 201,071 tonnes of millfeed (Table 9) and potentially 5 million is switchgrass (Table 16). Furthermore, high-ash wood pellet production in the province could also be considered as an important fuel source. The 775 greenhouse growers could save a potential 43 million dollars in heating costs by using these and other alternative fuel sources. British Columbia has relied on natural gas in the past, but many greenhouse growers have or are in the process of switching over to biofuels. With access to wood residues and wood pellets relatively easy, this seems to be the most likely source for alternative heating. The 570 greenhouse growers could potentially save 41 million dollars in heating costs with a complete switch to bark pellets.

36
7.0 On-site Biogas Production Potential
A promising new opportunity for greenhouse heating that may be especially appropriate for the Ontario greenhouse industry is the use of biogas. A detailed analysis of the potential of this opportunity is outside the scope of this report. However there appears to be already some commercial interest amongst Ontario greenhouse growers in this opportunity. Biogas systems have historically used manure as an energy feedstock. In Germany where the technology is evolving rapidly, there were 2700 biogas systems in 2005 producing 650 MW of power (BIOPRO, 2006). Through fermentation, biomass produces the renewable energy gas known as methane. This gas is subsequently burnt to provide heat and power.
Source: Effenberger, 2006
Figure 5: Proportion of biogas production from different feedstocks in the province of Thuringia, Germany.
In the province of Thuringia, Germany, 40% of the biomass used for biogas systems is coming from energy crops such as perennials forages and corn silage (Figure 5). The potential use of biogas for heating Ontario greenhouses appears limited if manure is the primary feedstock. Unfortunately, much of Ontario’s greenhouse industry is located in areas where relatively limited livestock farming occurs. However, if biogas heating systems were run on corn silage or energy grasses grown in these areas, a very large feedstock supply could be created. The heartland of the Ontario greenhouse industry is Leamington which is situated near the border between the corn producing counties of Kent and Essex. These two counties produce approximately 650,000 tonnes of corn annually in Ontario (Statistics Canada 2006a) and large volumes of corn silage and perennial forages could be derived from the surrounding farmlands to fuel greenhouses in these areas.
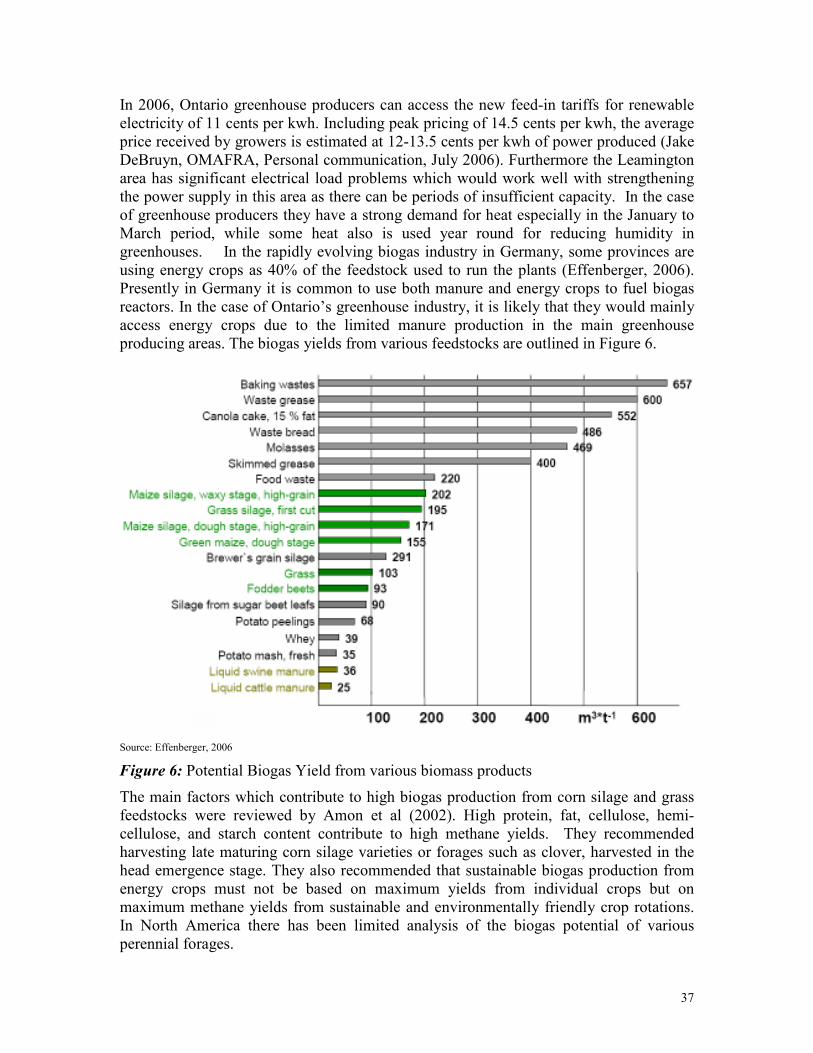
37
In 2006, Ontario greenhouse producers can access the new feed-in tariffs for renewable electricity of 11 cents per kwh. Including peak pricing of 14.5 cents per kwh, the average price received by growers is estimated at 12-13.5 cents per kwh of power produced (Jake DeBruyn, OMAFRA, Personal communication, July 2006). Furthermore the Leamington area has significant electrical load problems which would work well with strengthening the power supply in this area as there can be periods of insufficient capacity. In the case of greenhouse producers they have a strong demand for heat especially in the January to March period, while some heat also is used year round for reducing humidity in greenhouses. In the rapidly evolving biogas industry in Germany, some provinces are using energy crops as 40% of the feedstock used to run the plants (Effenberger, 2006). Presently in Germany it is common to use both manure and energy crops to fuel biogas reactors. In the case of Ontario’s greenhouse industry, it is likely that they would mainly access energy crops due to the limited manure production in the main greenhouse producing areas. The biogas yields from various feedstocks are outlined in Figure 6.
Source: Effenberger, 2006
Figure 6: Potential Biogas Yield from various biomass products
The main factors which contribute to high biogas production from corn silage and grass feedstocks were reviewed by Amon et al (2002). High protein, fat, cellulose, hemi-cellulose, and starch content contribute to high methane yields. They recommended harvesting late maturing corn silage varieties or forages such as clover, harvested in the head emergence stage. They also recommended that sustainable biogas production from energy crops must not be based on maximum yields from individual crops but on maximum methane yields from sustainable and environmentally friendly crop rotations. In North America there has been limited analysis of the biogas potential of various perennial forages.
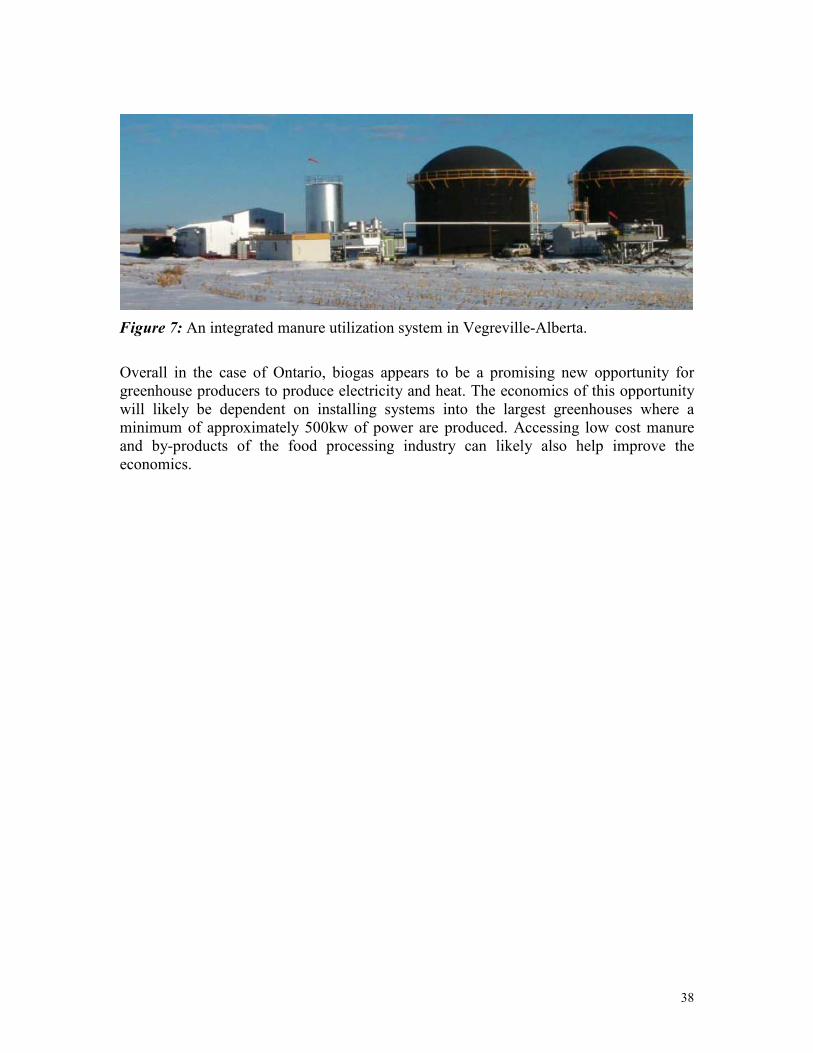
38
Figure 7: An integrated manure utilization system in Vegreville-Alberta.
Overall in the case of Ontario, biogas appears to be a promising new opportunity for greenhouse producers to produce electricity and heat. The economics of this opportunity will likely be dependent on installing systems into the largest greenhouses where a minimum of approximately 500kw of power are produced. Accessing low cost manure and by-products of the food processing industry can likely also help improve the economics.
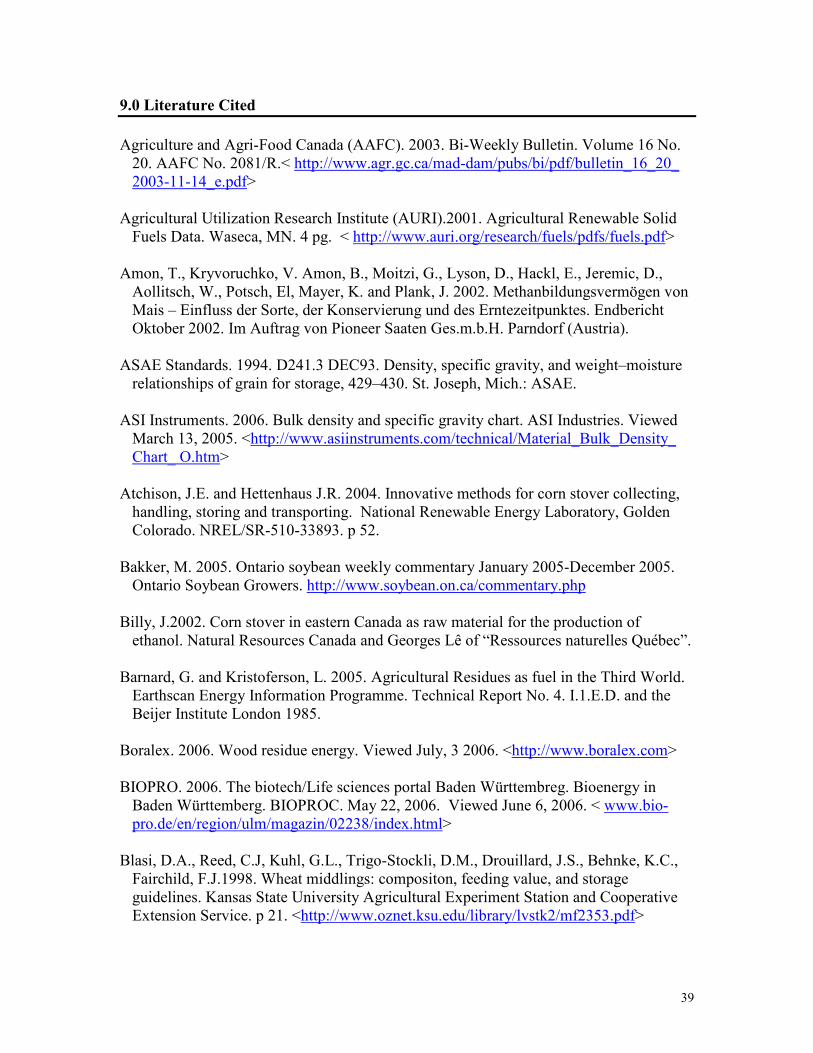
39
9.0 Literature Cited
Agriculture and Agri-Food Canada (AAFC). 2003. Bi-Weekly Bulletin. Volume 16 No. 20. AAFC No. 2081/R.< http://www.agr.gc.ca/mad-dam/pubs/bi/pdf/bulletin_16_20_ 2003-11-14_e.pdf>
Agricultural Utilization Research Institute (AURI).2001. Agricultural Renewable Solid Fuels Data. Waseca, MN. 4 pg. < http://www.auri.org/research/fuels/pdfs/fuels.pdf>
Amon, T., Kryvoruchko, V. Amon, B., Moitzi, G., Lyson, D., Hackl, E., Jeremic, D., Aollitsch, W., Potsch, El, Mayer, K. and Plank, J. 2002. Methanbildungsvermögen von Mais – Einfluss der Sorte, der Konservierung und des Erntezeitpunktes. Endbericht Oktober 2002. Im Auftrag von Pioneer Saaten Ges.m.b.H. Parndorf (Austria).
ASAE Standards. 1994. D241.3 DEC93. Density, specific gravity, and weight–moisture relationships of grain for storage, 429–430. St. Joseph, Mich.: ASAE.
ASI Instruments. 2006. Bulk density and specific gravity chart. ASI Industries. Viewed March 13, 2005. <http://www.asiinstruments.com/technical/Material_Bulk_Density_ Chart_ O.htm>
Atchison, J.E. and Hettenhaus J.R. 2004. Innovative methods for corn stover collecting, handling, storing and transporting. National Renewable Energy Laboratory, Golden Colorado. NREL/SR-510-33893. p 52.
Bakker, M. 2005. Ontario soybean weekly commentary January 2005-December 2005. Ontario Soybean Growers. http://www.soybean.on.ca/commentary.php
Billy, J.2002. Corn stover in eastern Canada as raw material for the production of ethanol. Natural Resources Canada and Georges Lê of “Ressources naturelles Québec”.
Barnard, G. and Kristoferson, L. 2005. Agricultural Residues as fuel in the Third World. Earthscan Energy Information Programme. Technical Report No. 4. I.1.E.D. and the Beijer Institute London 1985.
Boralex. 2006. Wood residue energy. Viewed July, 3 2006. <http://www.boralex.com> BIOPRO. 2006. The biotech/Life sciences portal Baden Württembreg. Bioenergy in Baden Württemberg. BIOPROC. May 22, 2006. Viewed June 6, 2006. < www.bio-pro.de/en/region/ulm/magazin/02238/index.html>
Blasi, D.A., Reed, C.J, Kuhl, G.L., Trigo-Stockli, D.M., Drouillard, J.S., Behnke, K.C., Fairchild, F.J.1998. Wheat middlings: compositon, feeding value, and storage guidelines. Kansas State University Agricultural Experiment Station and Cooperative Extension Service. p 21. <http://www.oznet.ksu.edu/library/lvstk2/mf2353.pdf>

40
Blasi, D., Drouillard, J., Titgemeyer, E., Paisley, S. and Brouk, M. 2000. Soybean hulls: composition and feeding value for beef and dairy cattle. Kansas State University Agricultural Experiment Station and Cooperative Extension Service. p 16. <http://www .oznet.ksu.edu/library/lvstk2/mf2438.pdf>
Braisher, M., Gill, S., Treharne, W., Wallace, M. and Winterburn, J. 2006. Design proposal: bio-ethanol production plan-project report. Oxford University Honours Project. 226pg. <http://users.ox.ac.uk/~kebl2245/Final_Report.pdf>
British Columbia Ministry of Agriculture Food and Fisheries (BCAFF). 2003. Factsheet: An overview of the BC greenhouse vegetable industry. 11 pages. <http://www.agf.gov. bc.ca/ghvegetable/publications/documents/industry_profile.pdf>
Brown, P.D., Duguid, S.D., Haber, S., Chong, J., Harder, D.E., Menzies, J., Noll, J.S. and R.I. H. McKenzie. 2001. AC Assiniboia oat. Can. J. Plant Sci. 81 :77-79.
Brown, W and G. Murphy. 2003. A profile of the Ontario greenhouse floriculture industry. Ontario Ministry of Agriculture, Food and Rural Affairs. Viewed March 14, 2006. < http://www.omafra.gov.on.ca/english/crops/facts/greenflor.htm>
BW McCloy & Associates Inc. and Climate Change Solutions. 2005. Estimated Production, Consumption and Surplus Mill wood Residues in Canada-2004. A National Report. Prepared for, Natural Resources Canada, Canadian Forest Service Policy, Economics and Industry Branch and Forest Products Association of Canada. Nov. 2005. 60 pg. <http://www.fpac.ca/Mill%20Residue/Mill%20Residue%20Inventory%20Canada _Final%20November%202005.pdf>
Cassida, K. A., J. P. Muir, M. A. Hussey, J. C. Read, B. C. Venuto and W. R. Ocumpaugh. 2005. Biofuel component concentrations and yields of switchgrass in South Central U.S. environments. Crop Sci. 45:682-692 (2005).
Canadian Pacific Railway (CPR). 2006. Tariff publishing system. Viewed March 2006. < https://www8.cpr.ca/inet64/tariffpublishing/>
CH2M Gore and Storrie Ltd (CG&S). 2000. Construction, renovation and demolition (CRD) waste utilization study. Prepared for Alberta construction, renovation and demolition waste advisory committee. Alberta. 131 p. <www3.gov.ab.ca/env/waste /aow/crd/publications/CRD_Report_All.pdf>
Chaggera, H. K., A. Kendall, A. McDonald, M. Pourkashanian and A. Williams. 1998. Formation of dioxins and other semi-volatile organic compounds in biomass combustion. Applied Energy 60:(2), Pages 101-114.

41
Elbersen, H.W., D.G. Christian, W. Bacher, E. Alexopoulou, V. Pignatelli, and D. van den Berg. 2002. Switchgrass variety choice in Europe. Final Report FAIR 5-CT97-3701 “Switchgrass”.
Effenberger, M. 2006. Biogas opportunities-pathways and wrong tracks to success. European Biogas Workshop. Presentation. Toronto, April 6, 2006. <http://www.omafra. gov.on.ca/english/engineer/facts/bg_pres4.pdf>
Enbridge Energy. 2006. Commercial and industrial rate 6 (ABC-T Customers) Natural Gas Heating Costs. Viewed March 19, 2006. < www.enbridge.com>
Flamme, V.L. 1999. Corn cob collecting apparatus for use with a combine. US Patent Issued on August 24, 1999. p 11. <www.patenstorm.us/patents/5941768-fulltext.html>
Food and Agricultural Organization of the United Nations (FAO). 2004. UBET Unified bioenergy terminology. FAO Forestry Department, Wood Energy Programme.58pg. <http://www.fao.org/documents/show_cdr.asp?url_file=//docrep/007/j4504e/j4504e00.htm>
Girouard, P. and R. Samson. 1996. Evaluation of conventional haymaking squipment for spring harvesting switchgrass. REAP-Canada report prepared for Domtar Inc., Noranda Inc. and Natural Resources Canada. Ottawa, Ontario. 12 pp.
Girouard, P. and R. Samson. 1997. Evaluation of haymaking equipment to harvest switchgrass/Part II. REAP-Canada internal report. Ste-Anne-de-Bellevue, QC. 12 pp.
Girouard, P., R. Samson, B.B. Mehdi.1998. Harvest and Delivered Costs of Spring Harvested Switchgrass: Final Report. REAP-Canada final report to Domtar Inc., Noranda Inc. and Natural Resources Canada. Ottawa Ontario. 12 pp.
Goel, K., R. Eisner, G. Sherson, T. Radiotis and J. Li. 2000. Switchgrass: A potential pulp fibre source. Pulp & Paper-Canada 101(6):51-45.
Hemming, M.S. 1995. spring Harvest of Reed Canary Grass (Phalaris arundinacea). In: Proc. Biomass for Energy, Environment, Agriculture and Industry. 8th E.C. conference. October 3-5, 1994. Vienna, Austria. 708-711.
Jannasch, R., P. Duxbury, and R. Samson. 2001. Development of bioenergy feedstocks: agronomy data from eastern Canada. Prepared for Natural Resources. Contract # 23384-005068/001150. Ottawa. 28 pg.
Jones, L.H.P. and K.A. Handreck. 1967. Silica in soils, plants and animals. Advances in Agronomy 19:107-149.
Klass, D. 1998. Biomass for renewable energy fuels and chemicals. Academic Press. San Diego California. 651 pg.

42
Madakadze, I.C., Coulman, B.E., Petersen, P., Stewart, K.A., Samson, R. and D.L Smith. 1998. Leaf area development, light interception and yield among switchgrass populations in a short-season area. Crop Science 38(3): 827-834.
Mani, S., Sokhansanj, S., Bi, X and Turhollow, A. 2006. Economics of producing fuel pellets from biomass. Amer. Soc. Agri. Biol. Eng. Vol 22 (3): 421-426.
Market Analysis Division (MAD). 2006a. Bi-weekly bulletin-Canada: primary processing of grains ando. Agriculture and Agri-Food Canada. June 22, 2006 19:9, 6 p <http://www.agr.gc.ca/mad-dam/e/index2e.htm>
Market Analysis Division (MAD). 2006b. Historic millfeed prices1993-2006. Agriculture and Agri-Food Canada.
Market Analysis Division (MAD). 2006c. Historic oat prices1993-2006. Agriculture and Agri-Food Canada.
Market Division Analysis (MAD). 2006d. Grain weekly price summary. Agriculture & Agri-Food Canada. Viewed June 29, 2006. <http://www.agr.gc.ca/mad-dam/index _e.php?s1= pubs&s2=pri&page=intro&PHPSESSID=446f0f041ce5dc25ff228a 18c2b0e0a9>
Market Analysis Division. (MAD). 2004. Canadian special crops. Strategic Policy Branch, Agriculture and Agri-Food Canada, July 5, 2004. < http://www.agr.gc.ca/misb /spec/index_e.php>
McAloon, A., F. Taylor, W. Yee, K. Ibsen, and R. Wooley. 2000. Determining the cost of producing ethanol from cornstarch and lignocellulosic feedstocks. Tech. Rep. NREL/TP-580–28893. Natl. Boca Raton, FL. Renewable Energy Lab., Golden, CO.
Mehdi, B., Samson, R., Asbil, W. and P-A. Blais. 1999. Switchgrass plant improvement program for paper and agri-fibre production in eastern Ontario. REAP-Canada final report for Ontario CAN-ADAPT program. Guelph, Ontario, Canada. 49pp.
Melin, S. 2002. General information sheet-wood pellets. Translational Technology LLC. Viewed. March 21, 2006. http://www.techtp.com/wood_pellets.htm
Montross, M.D., Stombaugh, T.S., Shearer, S.A., McNeil, S.G. and Sokhansanj, S. 2002. Collection and characterization of corn stover in Kentucky, BioEnergy. 2002 www. bioenergy2002.org
Murphy, W.J. 1993. Tables for weights and measurement: crops. University of Missouri Extension. Viewed March 13th, 2006. <www.muextension.missouri.edu/xplor/agguides/ crops/g04020.htm>

43
Myers, D.K., Underwood, J. 1992. Harvesting corn residue. AGF-OO3-92 Ohio State Extension, 1992. http://ohioline.osu.edu/agf-fact/0003.html
Nelson, R.G. 2002. Resource assessment and removal analysis for removal effects on corn yield and fertility of a Norfolk sandy loam. Corn stover and wheat straw in the Eastern and Midwestern United States. Soil Sci. Soc. Am. J. 48:868–872.
Nelson, R. G. 2003. Rainfall and wind erosion-based sustainable residue removal analysis and resource assessment for corn stover and wheat straw for eight selected cropping rotations in the United States. Oral presentation 1A-02. Program and Abstracts, page 2. 25th Symposium on Biotechnology for Fuels and Chemicals, May 4-7. National Renewable Energy Laboratory, Golden, CO.
Obernberger, I. and G. Thek. 2004. Physical characterization and chemical composition of densified biomass fuels with regard to their combustion behaviour. Biomass and Bioenergy 27:653-669.
Oil Intelligence Link. 2006. The Ethanol Monitor. Political Posturing: Who Will Win the “My Idea Will Lower Gasoline Prices” Lottery Vol 2 No. 17. May 8th, 2006 6pg.
OMAFRA. 2002. Soil Management and Fertilizer Use: Tillage Systems. http://www.omafra.gov.on.ca/english/crops/pub811/2tillsys.htm
Ontario Greenhouse Vegetable Growers (OGVG). 2006. 2005-2006 Greenhouse statistics. 3 p.<www.ontariogreenhouse.com/attachments/show/816>
Parrish, D.J and J.H. Fike. 2005. The biology and agronomy of switchgrass for biofuels. Critical Reviews of Plant Sciences. 24:423-459.
Parrish, D.J. and D.D. Wolf. 1992. Managing switchgrass for sustainable biomass production. In: Proc. Symp. Liquid Fuels from Renewable Resources. Pp 34-39. Nashwille, TN, 13-14 December 1992. ASAE, St. Joseph, MI.
Parrish D.J. and D.D. Wolf. 1993. Switchgrass as a biofuels crop for the upper Southeast. In: Proc First Biomass Comference of the Americas, Burlington, VT. 1:248-253. National Renewable Energy Lab, Golden CO.
Perlack, R.D. and Turhollow, A.F. 2002. Assessment of options for collection, handling and transport of corn stover. ORNL/TM-2002/44. <www.osti.gov/bridge>
Pordesimo, L.O., Edens, W.C. and Sokhansanj, S. 2002. Soil contamination in collected stover. BioEnergy 2002. <www.bioenergy2002.org>
Preston, R.L. (2005) 2005 Feed composition tables. Beef Magazine. Viewed March 10, 2006. <http://beef-mag.com/mag/beef_feed_composition_tables>.

44
Quick, G.R. and Tuetken, T.J. 2002. Single-pass corn and stover harvesting developments. Paper presented at Bioenergy for the Environment, The 2002 Bioenergy Conference, Idaho, Sept. 2002.
Reisinger, K., C. Haslinger, M. Herger, and H. Hofbauer. 2006. BIOBIB-A Database for biofuels. Institute of Chemical Engineering, Fuel and Environmental Technology, University of Technology Vienna, Getreidemarkt 9, 1060 Wien, Austria. <http://www.infoenergie.cz/web/root/ energy.php?nav01=121&nav02=343>.
Rioux, M-C. 2004. L'horticulture en bref… au Québec portrait statistique 2004. Ministère de l'Agriculture, des Pêcheries et de l'Alimentation Direction des études économiques et d'appui aux filières. 47p <http://www.mapaq.gouv.qc.ca/NR/rdonlyres/5205963D-8F85-4973-AB9D-A374D3F55853/5328/Horticultureenbref2004.pdf>
Samson, R., P. Girouard, B. Mehdi. 1999. Establishment of commercial switchgrass plantations. Final report prepared for Domtar Inc., Noranda & Natural Resources Canada. 11 pg.
Samson, R., Giouard, P., Omielan, J. Chen, Y. and J. Quinn. 1995. Technology evaluation and demonstration of short rotation forestry and switchgrass for energy production. Final report to Bioenergy development program. Cost shared-EMR(CANMET)/Forestry Canada/Agriculture Canada. 213 p.
Samson, R., Mani, S., Boddey, R., Sokhansanj, S., Quesada, D., Urquiaga, S., Reis, V. and C. Ho Lem. 2005. The potential of C4 perennial grasses for developing a global BIO-HEAT industry. Critical Reviews in Plant Science 24: 461-495.
Samson, R. A. and B. Mehdi. 1998. Strategies to reduce the ash content of perennial grasses. Bioenergy 98, Expanding Bioenergy Partnerships, Proceedings 8th North American Bioenergy Conf., Great Lakes Regional Bioenergy Program, Chicago, Illinois p. 1124-1131.
Samson, R.A. and J. Omielan. 1994. Switchgrass: A potential biomass energy crop for ethanol production. In Wickett, R.G., P.D. Lewis, A. Woodliffe and P. Pratt. Proc. 13th North Amercian Prairie Conference. Dept. of Parks and Recreation, Windsor, Ontario, Canada, p. 253-258.
Sander, B. 1997. Properties of Danish biofuels and the requirements for power generation. Biomass and Bioenergy 12: 177-183.
Sanderson, M.A., R.P. Egg and A.E. Wiselogel. 1997. Biomass losses during harvest and storage of switchgrass. Biomass & Bioenergy. 12(2):107-114.
Sanderson, M.A., J.C. Read and R.L. Read. 1999. Harvest management of switchgrass for biomass feedstock and forage production. Agron.J. 91:5-10.
Savoie, P. and Descôteaux S. 2004. Artificial drying of corn stover in mid sized bales. Canadian Biosystems Engineering. Volume 46, pg 2.25-2.34.

45
Schneider C., and Hartmann H. 2005.Maize as energy crops for combustion-optimization of fuel supply. Proceedings of the 14th European Biomass Conference & Exhibition. Paris, France October 17-21, 2005.
Sheehan, J., A. Aden, C. Riley, K. Paustian, K. Killian, J. Brenner, D. Lightle, R. Nelson, M. Walsh, and J. Cushman. 2002. Is ethanol from corn stover sustainable? Adventures in cyber-farming: A life cycle assessment of the production of ethanol from corn stover for use in a flexible fuel vehicle. National Renewable Energy Laboratory, Golden, CO.
Shields, M. and Shields. G. 2003. The Glenvar biomass collection history and the western Australian biomass market. ICCHP Proceedings. Louisville Kentucky. ASAE. February 2003.
Shinners, K.J., Binversie, B.N. and Savoie, P. 2003.Harvest and storage of wet and dry corn stover as a biomass feedstock. ASAE Annual international meeting. Las Vegas, Nevada. July 27-30, 2003.
Smeenk J. and Brue E. (2000) Utilization of agricultural residues in 2 MWth fluidized bed gasifier. Poster Presentation at BioEnergy 2000 Buffalo, NY.
Staniforth, A. R. 1979. Cereal straw. Clarendon Press. Oxford Press. 175pg Statistics Canada. 2001. Agriculture 2001 Census Farm Operator Data: initial release. Viewed March 1, 2006 <www.statscan.ca/english/agcensus2001/index.htm>
Statistics Canada. 2006a. CANSIM Table 001-0010 - Estimated areas, yield, production and average farm price of principal field crops, in metric units, annual. Series 1346. Field Crop Reporting Series 3401. <http://cansim2.statcan.ca/cgi-win/cnsmcgi.exe?Lang=E& ArrayId=10010&Array_Pick=1&Detail=1&RootDir=CII/&ResultTemplate=CII\CII>
Statistics Canada. 2006b. Greenhouse, Sod and Nursery Industry 2005. Statistics Canada Agriculture Division Horticultural Crops Unit. Catalogue No. 22-202-XIB. Minister of Industry, Ottawa ON. 28 pages. <http://www.statcan.ca/english/freepub/22-202-XIB/0000522-202-XIB.pdf>
Statistics Canada. 2004. Waste management industry survey: business and governmental sectors 2002. Minister of Industry, Ottawa ON. 59p. <http://www.statcan.ca/english /freepub/16F0023XIE/16F0023XIE2002001.pdf>
Stock, R.A., J.M.Lewis. T.J. Klopenstein and C.T. Milton. 1999. Review of new information on the use of wet and dry milling feed by-products in feedlot diets.
Proceedings of the American Society of Animal Science. p 1-12.

46
Swan, J. 2005. BC role in the global wood pellet Iindustry. Presentation at BC BioProducts Government Awareness and Education Conference. November 29, 2005, Victoria, British Columbia, Canada.
USDA. 2002. Successful approaches to recycling urban wood waste. Gen. Tech. Report. FPL-GTR-133. Madison, WI: U.S. Department of Agriculture, Forest Service, Forest Products Laboratory. 20 p.
Vogel, K.P., J.J. Brejda, D.T. Walters and D.R. Buxton. 2002. Switchgrass biomass production in the Midwest USA: Harvest and nitrogen management. Agron. J.94:413-420.
Walsh, Marie E., Daniel G. de la Torre Ugarte, Hosein Shapouri and Stephen P. Slinsky. 2003. Bioenergy crop production in the United States: potential quantities, land use changes, and economic impacts on the agricultural sector. Environmental and Resource Economics 24 (4): 313 – 333.
Wenger, M. and Su, C. 2003. Processes alfalfa and compressed hay market surveys for crop year 2001/2002 and 2002/2003 intentions. Alberta Agriculture, Food and Rural Development, statistics and data development unit. 16 pg.
White, P. and Johnson, L. (Eds). 2003. Corn chemistry and technology 2nd Ed. American Association of cereal chemists Inc. St. Paul, Minnesota USA. 2003. 892 pg.
Wilhelm, W.W., Johnson, J.M.F., Hatfield, J.L., Voorhees, Ward, and Linden, D.R. 2004. Crop and soil productivity response to corn residue removal: A literature review. Agron. J. 96:1-17.
World Grain. 2006. World Grain. Sosland Publishing Co, Kansas City, USA. Viewed March 24, 2006. <www.world-grain.com>
Zan, C. 1998. Carbon storage in two biomass energy plantations. Master of Science thesis. McGill University, Montreal Quebec. 109 pg.

47
10.0 Appendices
Appendix 1: List of Canadian Wood Pellet Manufacturers for 2006
Province
Company
Address
Phone
Website
British
Columbia
Armstrong Pellet Inc.
P.O. Box 280 3480 Pleasant
Valley Rd Armstrong, BC V0E
1B0
250-546-8484 www.armstrongpellets.com
Pacific BioEnergy Corp. (PFI Pellet
Flame Ltd.)
12080 Willow Cale Forest Rd.,
Prince George, BC, V2N 4T7
250-963-7220 www.pelletfame.bc.ca
Pinnacle Pellet Inc.
4252 Dog Prairie Rd., Quesnel,
B.C. V2J 6K9
250-747-1714 www.pinnaclepellet.com
Premium Pellet Ltd.
Box 125 Vanderhoof, BC V0J
3A0
250-567-2110 www.premiumpellet.com
Princeton Co-Generation Corp.
210 Old Hedley Rd.,
Princeton, BC, V0X 1W0
250-295-6940
Westwood Fibre Products Ltd.
2677-A Kyle Road Kelowna,
BC V1Z 2M9
250-769 -
1427
www.westfibre.com
Alberta
La Crete Sawmills Ltd.
La Crete, AB
780-928-2292 www.lacretesawmills.com
Kentucky Komfort
11607-178th St., Edmonton,
ABT5S 1N6
877-303-3134 www.kentuckykomfort.com
Ecobiofuel INC
1024 Shawnee Dr, Calgary,
AB T2Y 2T9
403-714-0066 www.ecobiofuel.com
Vanderwell Contractors Ltd.
P.O. Box 415 Slave Lake, AB
T0G 2A0
780-849-3824
Ontario
Lakewood-Industries Pellet Division Ear Falls, ON
807-222-3616
N.S. Bauman Ltd.
R.R. 3 Wallenstein, ON N0B
2S0
519-669-5447
NorWa Wood Pelleting Mill
164 Mills Drive Wawa ON,
P0S 1K0
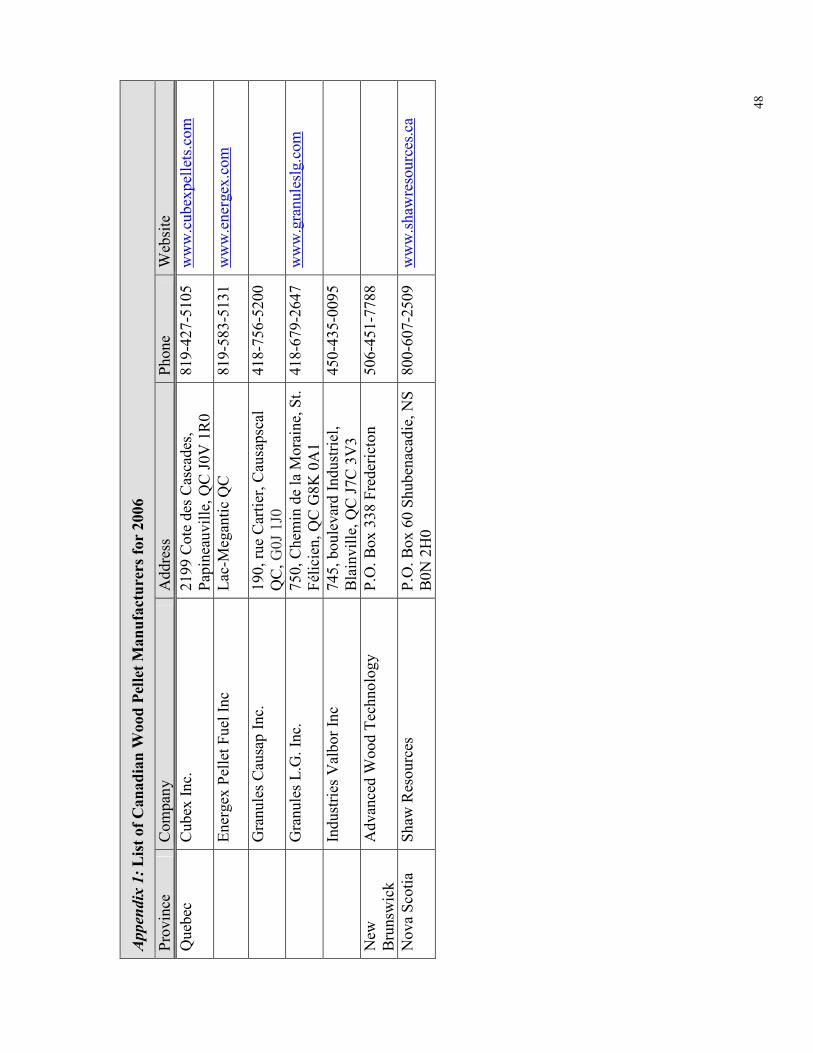
48
Appendix 1: List of Canadian Wood Pellet Manufacturers for 2006
Province
Company
Address
Phone
Website
Quebec
Cubex Inc.
2199 Cote des Cascades,
Papineauville, QC J0V 1R0
819-427-5105 www.cubexpellets.com
Energex Pellet Fuel Inc
Lac-Megantic QC
819-583-5131 www.energex.com
Granules Causap Inc.
190, rue Cartier, Causapscal
QC, G0J 1J0
418-756-5200
Granules L.G. Inc.
750, Chemin de la Moraine, St.
Félicien, QC G8K 0A1
418-679-2647 www.granuleslg.com
Industries Valbor Inc
745, boulevard Industriel,
Blainville, QC J7C 3V3
450-435-0095
New
Brunswick
Advanced Wood Technology
P.O. Box 338 Fredericton
506-451-7788
Nova Scotia
Shaw Resources
P.O. Box 60 Shubenacadie, NS
B0N 2H0
800-607-2509 www.shawresources.ca
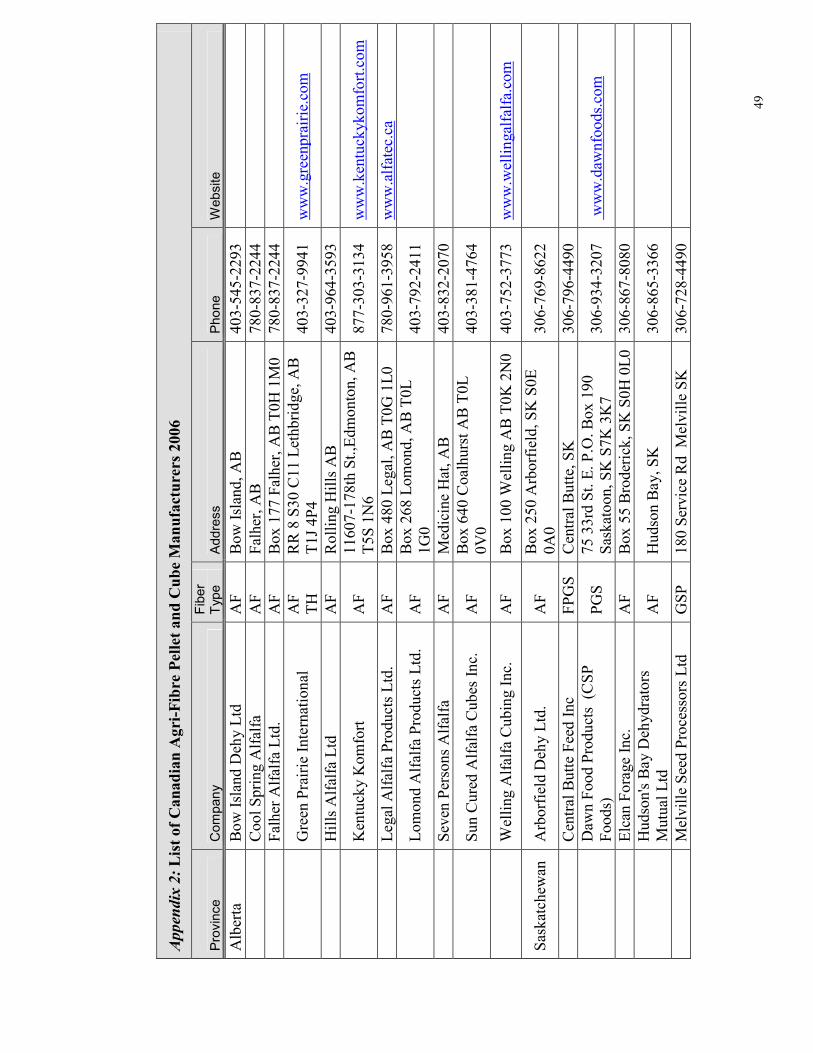
49
Appendix 2: List of Canadian Agri-Fibre Pellet and Cube Manufacturers 2006
Province
Company
Fiber
Type
Address
Phone
Website
Alberta
Bow Island Dehy Ltd
AF
Bow Island, AB
403-545-2293
Cool Spring Alfalfa
AF
Falher, AB
780-837-2244
Falher Alfalfa Ltd.
AF
Box 177 Falher, AB T0H 1M0
780-837-2244
Green Prairie International
AF
TH
RR 8 S30 C11 Lethbridge, AB
T1J 4P4
403-327-9941
www.greenprairie.com
Hills Alfalfa Ltd
AF
Rolling Hills AB
403-964-3593
Kentucky Komfort
AF
11607-178th St.,Edmonton, AB
T5S 1N6
877-303-3134
www.kentuckykomfort.com
Legal Alfalfa Products Ltd.
AF
Box 480 Legal, AB T0G 1L0
780-961-3958
www.alfatec.ca
Lomond Alfalfa Products Ltd.
AF
Box 268 Lomond, AB T0L
1G0
403-792-2411
Seven Persons Alfalfa
AF
Medicine Hat, AB
403-832-2070
Sun Cured Alfalfa Cubes Inc.
AF
Box 640 Coalhurst AB T0L
0V0
403-381-4764
Welling Alfalfa Cubing Inc.
AF
Box 100 Welling AB T0K 2N0 403-752-3773
www.wellingalfalfa.com
Saskatchewan Arborfield Dehy Ltd.
AF
Box 250 Arborfield, SK S0E
0A0
306-769-8622
Central Butte Feed Inc
FPGS Central Butte, SK
306-796-4490
Dawn Food Products (CSP
Foods)
PGS
75 33rd St. E. P.O. Box 190
Saskatoon, SK S7K 3K7
306-934-3207
www.dawnfoods.com
Elcan Forage Inc.
AF
Box 55 Broderick, SK S0H 0L0 306-867-8080
Hudson's Bay Dehydrators
Mutual Ltd
AF
Hudson Bay, SK
306-865-3366
Melville Seed Processors Ltd
GSP
180 Service Rd Melville SK
306-728-4490

50
Appendix 2: List of Canadian Agri-Fibre Pellet and Cube Manufacturers 2006
Province
Company
Fiber
Type
Address
Phone
Website
S0A 2P0
Parkland Alfalfa Products Ltd
AF
Site 2 Box 20 RR 1Ridgedale,
SK , S0E 1L0
306-873-2000
Popowich Milling Corp
GSP
Myrtle Avenue, Yorkton,
Saskatchewan S3N 1R1
306-783-2931
www.popowichmilling.com
Robin Hood Multifood Inc
GSP
First Ave. and 33rd St. E. P.O.
Box 537 Saskatoon, SK S7K
3L6
306-665-7114
Tisdale Alfalfa Dehy Ltd.
AF
Box 1688 Tisdale, SK S0E 1T0 306-873-2605
West Central Pelleting Ltd
FGSP Box 298 WIilkie, SK S0K 4W0 866-422-2242
Western Alfalfa Milling Co. Ltd. AF
PO Box 568 Norquay SK S0A
2V0
306-594-2362
Weyburn Inland Terminal
FGSP P.O. Box 698 Weyburn, SK
S4H 2K8
306-842-7436
www.wit.ca
Manitoba
Prairie Bio-Energy Inc.
FL
La Broquerie
204-424-5313
Alfalfa Products Ltd
AF
PO Box 90 Rpo Fort Whyte
Winnipeg, MB
204-895-8008
Coldstream Alfalfa Processing
AF
PO Box 337 Stn Main
Dauphin MB, R7N 2V2
204-638-9781
Ontario
Eco Comfort Fuel
AF?
Wroxeter ON
519-291-4602
Don Nott Farms
CMR
RR#4, Clinton, O.N., N0M 1L0 519-482-7439
Langs Dehy Ltd.
AF
R.R.#1 Palmerston, ON N0G
2P0
519-343-3353
Lorenz Farms
AF
St. Jacobs, ON N0B 2N0
519-699-5663

51
Appendix 2: List of Canadian Agri-Fibre Pellet and Cube Manufacturers 2006
Province
Company
Fiber
Type
Address
Phone
Website
Kraehling Farms Inc.
AF
1441 Erbs Road St. Agatha ON
N0B 2L0
519-886-6276
Veenstra Farms
WS
Sherkston, ON
905-894-4030
Quebec
Les Luzerniers Belcan du Lac
St-Jean Inc.
AF
251 rue Joseph Hamel
Hebertville-Station QC G0W
1T0
418-343-2000
Note: AF-Alfalfa; TH-Tame Hay; FPGS-Fortified Pelleted Grain Screenings; GPS-Grain Pelleted Screenings; FL-Flax Shives; WS-Wheat Straw; CMR-Crop
Milling Residue
In terms of alfalfa processing Canada is ranked in the world’s top five largest exporter of alfalfa pellets and alfalfa a cubes (Market
Analysis Division 2004). Annually Canada produces 322,000 tonnes of alfalfa pellets and 169,000 tonnes of alfalfa cubes and exports
80% per cent to Asian, European markets. (AAFC 2003). Alberta and Saskatchewan are the major alfalfa processing provinces in
Canada, processing 90% of the Canadian total (Wenger and Su 2003).

52
Appendix 3: Canadian Wheat Processing Facilities-2006
Province
Company
Processed Address
Website
Telephone
Flour Milling
British
Columbia
Rogers Foods Ltd.
(Interior)
WF, RF,
WWF
4420 Larkin Rd. Armstrong, BC
V0E 1B0
www.rogersfoods.com
250-546-8744
Rogers Foods Ltd.
(Pacific)
WF, RF,
WWF
44360 Simpson Rd.
Chilliwack, BC V2R 4B7
www.rogersfoods.com
250-546-8744
Alberta
ADM Milling
WF,
SWF,
WWF
4002 Bonnybrook Rd. S.E.
Calgary, AB T2G 4M9
403-267-5600
ADM milling
WF
1222 Allowance Ave. S.E. P.O.
Box 160 Medicine Hat, AB T1A
3H1
www.admworld.com
403-328-6622
Ellison Milling Co.
WF,
WWF, RF 1301 Second Ave. S. Box 400
Lethbridge, AB T1J 3Z1
www.ellisonmilling.com
780-672-3675
Permolex (API)
WF
Red Deer, AB
403-526-2876
Prairie Sun Grains
2000, Inc.
WF
4601 51st Ave. P.O. Box 1570
Camrose, AB T4V 1X4
306-934-3200
Schroeder Milling
WF
Camrose, AB
www.schroedermilling.ca
306-682-3932
Saskatchewan Dawn Foods (Organic) WF
1309 Railway Ave. P.O. Box
3430 Humboldt, SK S0K 2A0
www.dawnfoods.com
306-682-3932
Dawn Foods
WF
75 33rd St. E. P.O. Box 190
Saskatoon, SK S7K 3K7
www.dawnfoods.com
306-665-7111
FarmGro Organic Food WF
Regina SK
204-925-2100
Nutrasun Foods
WF
1695 Dewdney Avenue
Regina SK S4N 4N0
www.nutrasunfoods.com
705-526-7861
53
Appendix 3: Canadian Wheat Processing Facilities-2006
Province
Company
Processed Address
Website
Telephone
Robin Hood
Multifoods*
WF
First Ave. and 33rd St. E. P.O.
Box 537 Saskatoon, SK S7K
3L6
204-353-2895
Manitoba
ADM Milling
WF,
SWF,
WWF
Seven Higgins Ave. Winnipeg,
MB R3B 0A1
www.admworld.com
905-819-7000
Prairie Flour Mills
Ltd.
WF
11 Janzen Rd. P.O. Box 301
Elie, MB R0H 0H0
www.flour.com
905-826-2701
Ontario
ADM Milling
WF,
WWF
P.O. Box 369, 202 First Street
Midland, ON L4R 4L1
www.admworld.com
876-968-7221
ADM Milling
WF
1770 Barberton Road
Mississauga, ON L5M 2M5
www.admworld.com
800-621-0588
ADM Milling
WF
209 Winward Rd. Kingston, WI
2 JAM
www.admworld.com
ADM Milling
WF,
WWF,
SWF
P.O. Box 310, Port Colborne,
ON L3K 5W1
www.admworld.com
905-851-1194
ADM Milling
SWF
62 Albert St. Strathroy, ON
N7G IV5
www.admworld.com
519-660-0199
Arva Flour Mills Ltd.
SWF,
WWF, RF Arva Flour Mills Ltd. 2042
Elgin St. Arva, ON N0M 1C0
905-834-4556
Dover Mills
WF
P.O. Box 3368, 140 King Street,
Cambridge, ON N3H 4T3
www.dovergrp.com
905-374-7111
Golden Gate Mills
WWF
73 Sinclair Blvd Brantford, ON
N3S 7X6
505-743-3260
Grain Process
Enterprise Inc.
SWF
39 Golden Gate Ct. Scarborough,
ON M1P 3A4
514-846-8500

54
Appendix 3: Canadian Wheat Processing Facilities-2006
Province
Company
Processed Address
Website
Telephone
Halton Flour Mills
WF
62 Mill Street West Halton Hills
Acton ON, L7J 1G4
www.dovergrp.com
866-221-2278
HayHoe Mills
WF,
SWF,
WWF
201 Pine Grove Road
Woodbridge, ON, L4L 2H7
www.hayhoe.com/
800-265-5510
Kraft Milling
SWF, WF 27 Reid Drive Mississauga, ON,
L5M 2B1
519-523-4241
New Life Mills
WF, SWF P.O. Box 219 Hanover, ON,
N4N 3C5
519-245-2250
Port Royal Mills
WWF
240 Industrial Parkway S.
Aurora, ON L4G 3V6
514-527-8971
Robin Hood
Multifoods
WF
Sherwood Forest Lane Port
Colborne, ON L3K 5V8
905-713-1712
Quebec
ADM Milling
WF,WWF 950 Mill St. Montreal, QB H3C
1Y4
www.admworld.com
514-846-8500
ADM Milling
WF,
WWF
3800 Notre Dame St. E.
Montreal, QB H1W 2T5
www.admworld.com
514-343-4000
Cereal Foods
WF,
WWF
380 Rue Oak Montreal, QB H3K
3G2
902-429-0622
Robin Hood
Multifoods
WF
2110 Notre Dame St. W.
Montreal, QB H3J 1N2
514-934-3234
Nova Scotia
Dover Mills
WF
Marginal Rd. P.O. Box 2185
Halifax, NS B3J 3C4
www.dovergrp.com
Durum M
illing
Alberta
Ellison Milling
DP
1301 Second Ave. S. Box 400
Lethbridge, AB T1J 3Z1
www.ellisonmilling.com

55
Appendix 3: Canadian Wheat Processing Facilities-2006
Province
Company
Processed Address
Website
Telephone
Saskatchewan FarmGro Organic
Food
DP
Regina SK
306-751-2440
Robin Hood
Multifoods*
DP
First Ave. and 33rd St. E. P.O.
Box 537 Saskatoon, SK S7K
3L6
306-665-7111
Ontario
ADM Milling
DP
P.O. Box 310, Port Colborne,
ON L3K 5W1
www.admworld.com
Howson & Howson
Limited
DP
390 Mill Street Blyth, Ontario
N0M 1H0
www.howsonandhowson.ca 519-523-4241
Kraft Milling
DP
Woodbridge, ON
www.admworld.com
Quebec
ADM Milling
DP
950 Mill St. Montreal, QB H3C
1Y4
www.admworld.com
514-846-8500
Note: WF-Wheat flour; WWF-Whole Wheat Flour; SWF-Soft Wheat Flour; RF-Rye Flour; DP-Durum Products
*This is a swing mill-mills both durum and wheat flour.

56
Appendix 4: Canadian Oat Milling Facilities-2006
Province
Company
Processed Address
Website
Telephone
Alberta
Westglen Milling
OF, OP
P.O. Box 4615 Barrhead, AB
T7N 1A5
www.conagrafoodingredients.com 780-674-3960
Alberta Oats Milling
Ltd.
OP
P.O. Box 228, R.R. 6
Edmonton, AB T5B 4K3
www.albertaoats.com
780-973-9101
Manitoba
Emerson Milling Inc.
OF, OP
Box 424, Riverlot #58,
Emerson, MB R0A 0L0
www.emersonmilling.com
Can-Oat Milling
OF, OP
Box 520, Portage La Prairie,
MB R1N 3W1
www.can-oat.com
Saskatchewan Can-Oat Milling
OF, OP
Box 1299
Martensville, SK S0K 2T0
CAN
www.can-oat.com
306-975-0083
Smucker Foods
OF
First Ave. and 33rd St. E. P.O.
Box 537 Saskatoon, SK S7K
3L6
306-665-7110
Popowich Milling
Corporation
OF, OP
Myrtle Avenue, Yorkton,
Saskatchewan S3N 1R1
www.popowichmilling.com
306-783-2981
Ontario
Quaker Oats.
OF, OP
Quaker Park, 14 Hunter St.
East Peterborough, ON K9J
7B2
www.qtgcanada.com
505-743-3260
Smucker Foods Of
Canada Co.
OF
Sherwood Forest Lane Port
Colbourn, ON L3K 5V8 CAN
905-834-4555
Note: OF-Oat Flour; OP-Oat Products

57
Appendix 5: Canadian Soybean Oil Crushing Facilities-2006
Province
Company
Address
Website
Telephone
MB
Jordan Mills
Carman, MB
Ontario
ADM
P.O. Box 7128 Windsor, ON
N9C 3Z1
www.admworld.com
(519) 972-8100
Bunge Milling
701 Richmond, Street
Chatham, ON N7M 5K6
www.bungenorthamerica.com (905) 825-7900
Helin Oils
280 Hopkins St Whitby, ON
L1N 2B9
(905) 430-6646
Huron Commodities Inc. P.O. Box 1353, Clinton, ON
N0M 1L0
www.huron.com
(519) 482-8400
Jackson Seed Service
1315 Jackson St.Dresden,
ON
N0P 1M0
(519) 683-4413
Nature's Milling
2141 Woodburn Road R.R. #
1 Binbrook, ON, L0R 1C0
(905) 692-0197
Sunfield Oilseed
RR 1 Wingham, ON, N0G
2W0
(519) 335-3589
Tri-County Protein
Corp.
12206 Gypsy Lane, P.O. Box
414, Winchester ON, K0C
2K0
(613) 652-1282
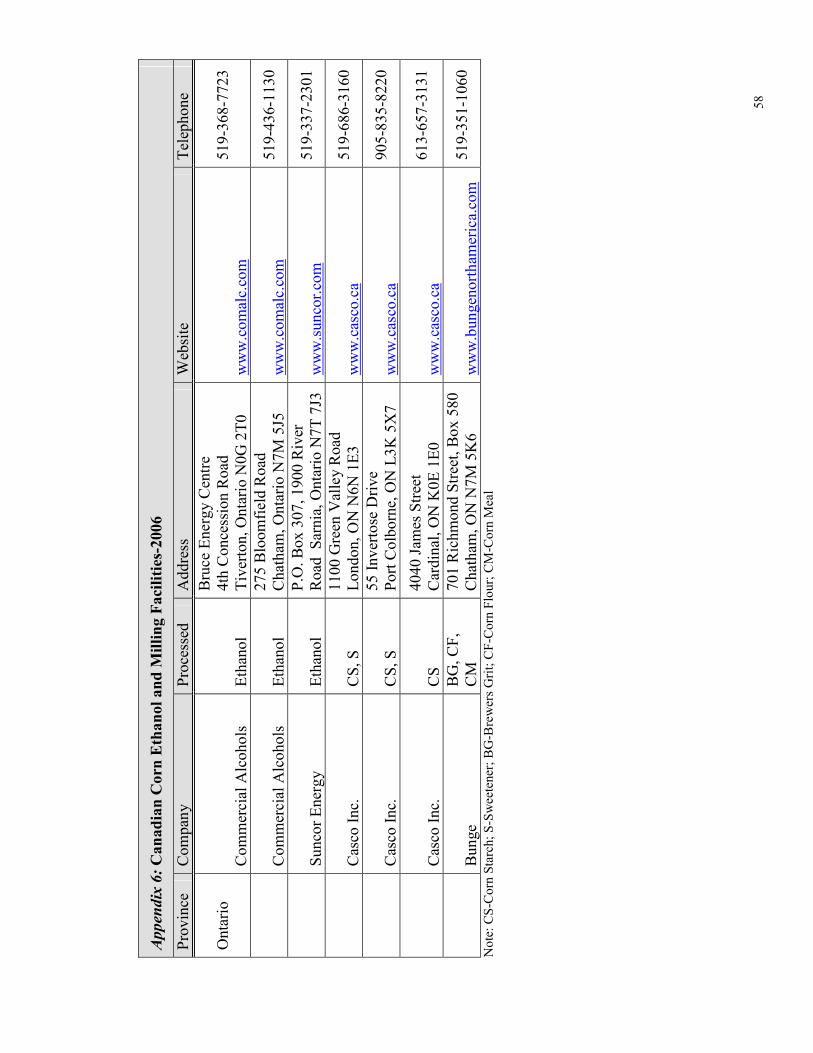
58
Appendix 6: Canadian Corn Ethanol and Milling Facilities-2006
Province
Company
Processed
Address
Website
Telephone
Ontario
Commercial Alcohols
Ethanol
Bruce Energy Centre
4th Concession Road
Tiverton, Ontario N0G 2T0
www.comalc.com
519-368-7723
Commercial Alcohols
Ethanol
275 Bloomfield Road
Chatham, Ontario N7M 5J5
www.comalc.com
519-436-1130
Suncor Energy
Ethanol
P.O. Box 307, 1900 River
Road Sarnia, Ontario N7T 7J3 www.suncor.com
519-337-2301
Casco Inc.
CS, S
1100 Green Valley Road
London, ON N6N 1E3
www.casco.ca
519-686-3160
Casco Inc.
CS, S
55 Invertose Drive
Port Colborne, ON L3K 5X7
www.casco.ca
905-835-8220
Casco Inc.
CS
4040 James Street
Cardinal, ON K0E 1E0
www.casco.ca
613-657-3131
Bunge
BG, CF,
CM
701 Richmond Street, Box 580
Chatham, ON N7M 5K6
www.bungenorthamerica.com 519-351-1060
Note: CS-Corn Starch; S-Sweetener; BG-Brewers Grit; CF-Corn Flour; CM-Corn Meal