biomass composition on the methane yield - boku · biomass composition on the methane yield 1 2 3 4...
TRANSCRIPT

Biogas production from maize and dairy cattle manure – influence of
biomass composition on the methane yield
1
2
3
4
5
6
7
8
Thomas Amon*, Barbara Amon*, Vitaliy Kryvoruchko*, Werner Zollitsch**, Karl
Mayer***, Leonhard Gruber****
* University of Natural Resources and Applied Life Sciences, Department of Sustainable Agricultural Systems,
Division of Agricultural Engineering, Peter Jordan-Strasse 82, A-1190 Vienna, Austria; tel.: (++43 1) 47654
3502, fax: (++43 1) 47654 3527, [email protected] 9
10
11
12
13
14
15
16
17
18
19
20
21
22
23
24
25
26
27
28
** University of Natural Resources and Applied Life Sciences, Department of Sustainable Agricultural Systems,
Division of Livestock Sciences, Gregor Mendel-Strasse 33, A-1190 Vienna, Austria
*** Chamber for Agriculture and Forestry, Styria, Hamerlinggasse 3, A-8011 Graz, Austria
**** Federal Research Institute for Agriculture in Alpine Regions, A – 8952 Irdning, Austria
ABSTRACT
There is an increasing world wide demand for energy crops and animal manures for biogas
production. To meet these demands, this research project aimed at optimising anaerobic
digestion of maize and dairy cattle manures. Methane production was measured for 60 days in
1 litre eudiometer batch digesters at 38 °C. Manure received from dairy cows with medium
milk yield that were fed a well balanced diet produced the highest specific methane yield of
166.3 Nl CH4 kg VS-1. Thirteen early to late ripening maize varieties were grown on several
locations in Austria. Late ripening varieties produced more biomass than medium or early
ripening varieties. On fertile locations in Austria more than 30 Mg VS ha-1 can be produced.
1
1
2
3
4
5
6
7
8
9
10
11
12
13
14
15
16
17
18
19
20
21
22
The methane yield declined as the crop approaches full ripeness. With late ripening maize
varieties, yields ranged between 312 – 365 Nl CH4 kg VS-1 (milk ripeness) and 268 – 286 Nl
CH4 kg VS-1 (full ripeness). Silaging increased the methane yield by about 25 % compared to
green, non conserved maize. Maize (Zea mays L.) is optimally harvested, when the product
from specific methane yield and VS yield per hectare reaches a maximum. With early to
medium ripening varieties (FAO 240 – 390), the optimum harvesting time is at the “end of
wax ripeness”. Late ripening varieties (FAO c. 600) may be harvested later, towards “full
ripeness”. Maximum methane yield per hectare from late ripening maize varieties ranged
between 7100 and 9000 Nm3 CH4 ha-1. Early and medium ripening varieties yielded 5300 –
8500 Nm3 CH4 ha-1 when grown in favourable regions. The highest methane yield per hectare
was achieved from digestion of whole maize crops. Digestion of corns only or of corn–cob–
mix resulted in a reduction in methane yield per hectare of 70 and 43 %, respectively. From
the digestion experiments a multiple linear regression equation, the Methane Energy Value
Model, was derived that estimates methane production from the composition of maize. It is a
helpful tool to optimise biogas production from energy crops. The Methane Energy Value
Model requires further validation and refinement.
Keywords
Anaerobic digestion; maize varieties; harvesting time; harvesting technique; methane energy
value model

2
1
2
3
4
5
6
7
8
9
10
11
12
13
14
15
16
17
18
19
20
21
22
23
24
25
26
1 Introduction
Biogas production from agricultural biomass is of growing importance as it offers
considerable environmental benefits and is an additional source of income for farmers.
Renewable energy is produced. The principle of a closed circuit is strengthened, because
particularly the nitrogen is being hold stronger in the system (Möller, 2003). Methane
emissions during manure storage are reduced and the fertiliser quality of the digestate is high.
Suitable substrates for the digestion in agricultural biogas plants are: energy crops, organic
wastes, and animal manures. Maize (Zea mays L.), herbage (Poacae), clover grass
(Trifolium), sudan grass (Sorghum sudanense), fodder beet (Beta vulgaris) and others may
serve as energy crops. Maize is the most dominating crop for biogas production. Maize is
considered to have the highest yield potential of field crops grown in Central Europe.
Open questions are quality needs, the yield potential considering the given limits in water
availability and thermal time and the integration of energy maize in sustainable cropping
systems to minimize negative effects on the environment and to maximize net energy yield
(Kauter and Claupein, 2004).
Economic efficiency of anaerobic digestion depends on the investment costs, on the costs for
operating the biogas plant and on the optimum methane production. A maximum methane
yield is especially important with the digestion of energy crops as these – in contrast to animal
manures or organic wastes – have production costs that have to be covered by the methane
production. When energy crops are digested, the methane yield per hectare must be
maximised – always bearing in mind not only the single crops, but environmentally friendly
crop rotations that deliver maximum methane yields. The quality of energy crops, used for
biogas production, is determined on the field. The content and availability of substances
which are able to produce methane is influenced by variety, cultivation and stage of maturity
3
1
2
3
4
5
6
7
8
9
10
11
12
13
14
15
16
17
18
19
20
21
22
23
24
25
26
at harvesting time (Amon et al., 2005). An estimation of the potential to produce methane of
energy crops and animal manures is essential. Maximum methane yield requires adequate and
efficient nutrient supply for micro-organisms in the digester.
Existing models concentrated on picturing the kinetics of anaerobic digestion and showing
influences such as e.g. pH value, NH4-N content, or content of volatile fatty acids (Angelidaki
et al., 1993; Batstone et al., 2000; Batstone et al., 2001; Henze et al., 1986; McCarty and
Mosey, 1991; Pavlostathis and Gossett, 1986). They are only valid for specific areas of
digestion of organic wastes. These models were not developed to estimate methane yield from
energy crops and to optimise nutrient supply for micro-organisms in the digester of
agricultural biogas plants.
Buswell (1936) and Boyle (1977) developed a model that estimates biogas composition (CH4,
CO2, H2S und NH3) from the chemical composition of organic substrates: C, H, N and S. This
model does not estimate the methane yield that can be achieved from digestion of organic
substrates. Structural substances, especially lignin, are key influences for the digestibility of
organic substrates in biogas plants (Amon et al. 2002a; Scherer, 2002; Wellinger et al., 1984).
They determine the degradability and thus the methane yield that can be produced through
anaerobic digestion. The models of Buswell (1936) and Boyle (1977) do not integrate the
influence of lignin. Another shortcoming for the introduction of this model on commercial
farm is that it requires C, H, N and S content to be known, which is normally not the case. In
the area of animal nutrition, extensive databases are available on the composition of crops that
can be fed to animals (e.g. crude fibre, protein, fat content). If a model was developed that can
use these databases as input factors, additional costly substrate analyses would not be
necessary and commercial farms could easily apply such a model.

4
1
2
3
4
5
6
7
8
9
10
11
12
13
14
15
16
17
18
19
20
21
22
23
24
25
Methane production from organic substrates mainly depends on their content of substances
that can be degraded to CH4 and CO2. Composition and biodegradability are key factors for
the methane yield from energy crops and animal manures. Crude protein, crude fat, crude
fibre, cellulose, hemi-cellulose, starch and sugar markedly influence methane formation
(Amon et al., 2000b; Amon et al., 2003; Amon et al., 2004a; Balsari et al., 1983).
Figure 1
Figure 1 illustrates influences on the biomass quality considering as example maize for all
stages of biogas production. Key influences on the quality of maize for anaerobic digestion
can already be found in phase I, when maize is grown on the field. Location, climate and
maize variety are important. Plant management and the stage of vegetation when maize is
harvested must be optimally chosen to maximise the methane yield. In Phase II (harvest,
conservation and supply) farmers can positively influence methane yield by choosing the
optimum harvesting time and conservation technology and by possibly applying additives. In
phase III, energy in the organic substrates is transformed to methane energy in the biogas.
Environmental conditions in the digester such as pH, temperature or inhibitors and the
nutrient composition of organic substrates determine the methane yield. Amount and quality
of the biogas and of the digestate in phase IV result from the influences shown in phases I to
III.
The research project aimed at optimising methane production from maize and dairy cattle
manure. Influence of performance and feeding intensity on dairy cattle manure composition
and on the methane yield from dairy cattle manure was investigated.

5
1
2
3
4
5
6
7
8
9
10
11
12
13
14
15
16
17
18
19
20
21
22
23
24
25
Experiments with maize aimed at finding options that achieve a maximum methane yield per
hectare. A new model – the Methane Energy Value Model – was developed that estimates
methane yield from the nutrient composition of maize via regression models. Factors
investigated were: quality criteria for anaerobic digestion of maize, suitability of maize
varieties and achievable methane yields per hectare, influence of silaging, optimum harvesting
time and optimum harvesting technology.
2 Materials and Methods
2.1 Dairy cattle manure
The Federal Research Institute for Agriculture in Alpine Regions (HBLFA Raumberg-
Gumpenstein) conducted feeding trials with dairy cattle at contrasting milk yields and feeding
intensities. The animal diets are listed in table 1. Milk yield ranged from 11.2 to 29.2 l milk
per cow and day. Animal diets differed in their concentrate level and in forage composition
(hay, grass silage, maize silage). Methane production from the contrasting dairy cattle manure
was measured in eudiometer batch digesters (see section 2.3).
Table 1
2.2 Maize for anaerobic digestion
The following maize varieties and locations were included in the experiments:
Year 2001, location: Gross Enzersdorf, Lower Austria (dry region), varieties: PR39G12 (FAO
240), Sandrina (FAO 270), Clarica (FAO 310), Monalisa (FAO 360), Ribera (FAO 390);

6
1
2
3
4
5
6
7
8
9
10
11
12
13
14
15
16
17
18
19
20
21
22
23
24
25
26
seeding: 2001-04-26; early harvest: 2001-08-21 (118 days after seeding); medium harvest:
2001-09-03 (131 days after seeding); late harvest: 2001-09-19 (147 days after seeding).
Year 2002, location Ludersdorf, Styria (favourable region for maize production), varieties:
Benicia (FAO 300), Ribera (FAO 390), Phönix (FAO 290), Atalante (FAO 290), Saxxo (FAO
380); seeding: 2002-04-30; early harvest: 2002-08-08 (100 days after seeding); medium
harvest: 2002-09-12 (143 days after seeding); late harvest: 2002-10-29 (190 days after
seeding).
Year 2003, location Ludersdorf, Styria, varieties: Tonale, PR 34G13, Tixxus LZM 650, CSO
271 (FAO - 600), Garbure, Ribera, Saxxo, Conca, DKS4626 (FAO 380-400); seeding: 2003-
04-25; early harvest: 2003-07-31 (97 days after seeding); medium harvest: 2003-08-25 (122
days after seeding); late harvest: 2003-09-23 (151 days after seeding).
In course of the vegetation period, the following parameters were determined for all varieties:
Nutrient composition, gross energy, dry matter and organic dry matter content at milk
ripeness, wax ripeness and full ripeness; specific methane yield and biogas quality during
anaerobic digestion in eudiometer batch experiments; methane yield per hectare for each
harvesting time.
In addition, the influence of harvesting technology on the methane yield was investigated.
Whole maize crops, corns only, corn-cob-mix, and maize without corns and cob were
anaerobically digested and methane yields were compared. Methane production from silaged
maize compared to green, non conserved maize was measured, as well. A detailed description
of cultivation, plant management, and harvesting of maize can be found in Amon et al.
(2002b, 2003).

7
1
2
3
4
5
6
7
8
9
10
11
12
13
14
15
16
17
18
19
20
21
22
23
24
25
2.3 Measuring methane production
Substance and energy turnover during anaerobic digestion of maize and dairy cattle manure
were measured in 1 litre eudiometer batch digesters at 38 °C. Methane yields from each
treatment were measured in three replicates.
Measurements were conducted according to DIN 38 414 (1985). Each eudiometer consists of
six digesters. A water bath tempers the digesters. A magnetic stirrer mixes the substrates for
10 seconds every 10 minutes. Biogas is collected in an equilibrium vessel. Amount of biogas
production is monitored every day. Biogas production is given in norm litre per kg of volatile
solids (Nl (kg VS)-1). I.e. the volume of biogas production is based on norm conditions: 273
K, and 1013 mbar. Biogas quality (CH4, H2S, NH3) was analysed 10 times in course of the 6-
week digestion. Each variant was replicated two to four times. Biogas production from
inoculum alone was measured as well and subtracted from the biogas production that was
measured in the digesters that contained inoculum and biomass.
Maize was chopped after harvest, prior to the ensiling process. Particle size was 0.5 – 3.0 mm.
Inoculum was received from two biogas plants that digest energy crops (maize, sun flower,
grass) at 38 °C. Hydraulic residence time was 70 – 80 days. 30 – 70 g maize silage were
digested together with 350 g inoculum. Maize silage : inoculum ratio was 1 : 2 (basis: dry
matter). With the digestion of dairy cattle manure, the manure : inoculum ratio was 7 : 1
(basis: dry matter). This resulted in a dry matter content of the sample of 9 % which
corresponds to the dry matter content that is commonly found on commercial biogas plants.

8
1
2
3
4
5
6
7
8
9
10
11
12
13
14
15
16
17
18
19
20
21
22
23
24
25
26
Methane concentrations in the biogas were analysed by a Gas Data LMS NDIR analyser
(accuracy: ± 1 – 3 % of measurement reading). The analyser was calibrated every 10th sample
with a 60 % CH4 calibration gas. NDIR readings were validated at regular intervals by gas
chromatographic analysis of CH4 concentration in the biogas. A Shimadzu 14B GC with HP-
Plot molecular sieve 5A, and thermal conductivity detector (TCD) was used in isothermal
mode. Oven, detector, and injector were operated at 40, 150, and 105 °C, respectively. H2S
concentration in the biogas was analysed two times per week with different Dräger tubes (1D,
measurement range (m.r): 1 – 200 ppm; 100 A, m.r. 100 – 200 ppm, 0,2%/A, m.r: 0,2 – 7
Vol. %.). H2S concentration was analysed via a chemical reaction: H2S+Pb2+ = PbS (brown
colour) + 2H. Accuracy was ± 5 – 10 % of measurement reading. NH3 concentration was
measured with Dräger tubes Type 5/b ammonia (measurement range 5 – 100 ppm). A pH
indicator gives a blue colour if it comes in contact with NH3 (accuracy: ± 10 - 15 % of
measurement reading).
Substrates were analysed prior to digestion for pH, dry matter (DM), crude protein (XP),
crude fibre (XF), cellulose (Cel), hemi-cellulose (Hem), starch (XS), sugar (XZ), lignin
(ADL), crude fat (XL) and ash (XA) with standard analysing procedures. Gross energy (GE)
was measured with a calorimeter and is given as MJ per kg of dry matter. A detailed
methodology description can be taken from Amon et al. (2003).
2.4 Statistical data analysis
Statistical data analysis was carried out with the software package SPSS, version 11.5 (SPSS
Inc. 2005). Each treatment was measured in three replicates. In a first step, the data were
summarised by descriptive statistics. Mean, standard deviation and frequency distributions of
the data were determined. Differences between treatments were tested with comparative
9
1
2
3
4
5
6
7
8
9
10
11
12
13
14
15
16
17
18
19
20
21
22
23
24
25
26
statistics. Variance analysis methods were applied to find significant differences in the means.
The following tests and procedures were used: ANOVA and the one factorial post hoc tests
“Student-Newma-Keuls” and “Scheffe”. Homogenity of Variances was analysed with the
Levene test statistic. Normal distribution was checked by the rule 0.9 < mean < 1.1 and 3s <
mean (Sachs, 1992). The Methane Energy Value Model was developed by carrying out a
multifunctional analysis of full regression models (Sachs, 1992).
3 Results and Discussion
3.1Biogas production from dairy cattle manure
Table 2 gives the nutrient composition of the contrasting dairy cow manures: pH, dry matter
(DM), crude protein (XP), crude fibre (XF), cellulose (Cel), hemi-cellulose (Hem), lignin
(ADL), crude fat (XL), ash (XA) and gross energy (GE). Biogas and methane yield per norm
litre of volatile solids are listed as well.
Table 2
Dairy cows of the treatments dairy-1 and dairy-2 had a low milk yield, dairy-3 and dairy-4
had a medium milk yield and dairy-5 and dairy-6 had a high milk yield. In each level of
intensity, manures with contrasting crude protein levels were produced. The manures with the
higher crude protein levels (dairy-1, 3, and 6) gave higher methane yields during anaerobic
digestion. Lignin in the manure reduced the specific methane yield. The higher the feeding
intensity and the milk yield, the greater was the reduction in methane yield through an
increase in lignin content. Manure of the treatment dairy-3 was received from cows with
medium milk yield that were fed a well balanced diet. Forage consisted of hay, grass silage
10
1
2
3
4
5
6
7
8
9
10
11
12
13
14
15
16
17
18
19
20
21
22
23
24
25
26
and maize silage. Concentrate was supplemented according to the cows` requirements.
Manure of the treatment dairy-3 produced the highest specific methane yield of 166.3 Nl CH4
(kg VS)-1.
Brachtl (2000), Thomé-Kozmiensky (1995) and Wellinger (1991) digested cattle manure and
found biogas yields between 200 and 300 l biogas (kg VS)-1. Braun (1982) conducted an
intensive literature search on biogas production from cattle manure and found a range
between 140 and 266 Nl biogas (kg VS)-1. The range corresponds well with our experiments
that gave biogas yields of 208 – 268 Nl (kg VS)-1. Most of the biodegradable carbon in cattle
feed is already digested in the rumen and in the gut. Thus, cattle manure has a lower potential
to produce biogas than pig or poultry manure. CH4 concentration in the biogas is lower
(Weiland, 2000).
In agreement with our results, Balsari et al. (1983) found the lignin and cellulose content of
cattle diets to influence biogas and methane production from dairy cattle manure. A model
was developed that estimates biogas and methane yield from carbohydrate, fat und protein
content of cattle manure. Lignin content in cattle manure, which is determined by lignin
content in the animal diet, was a key influence on biogas production. Feed lignin content
correlates with the vegetation period and a variation can be observed in course of the year.
Amon et al. (2001) measured methane production at a commercial biogas plant for one year.
The biogas plant digested dairy cattle and pig farmyard manure. Specific methane production
was not constant throughout the year. When the dairy cattle diet changed from winter feed to
summer feed, specific methane production increased. Winter feed consisted mainly of hay. In
spring and summer fresh clover grass was fed.
3.2 Biogas production from maize

11
1
2
3
4
5
6
7
8
9
10
11
12
13
14
15
16
17
18
19
20
21
22
23
24
25
26
Maize was harvested at three different times in course of the vegetation period. Net total
maize yield per hectare, and specific methane yield per kg VS were measured at each
harvesting time. Methane yield per hectare was calculated. Correlations between harvesting
technology and methane yield were investigated. A regression equation was established that
estimates methane production from anaerobic digestion of maize from its nutrient
composition.
3.2.1 Influence of silaging on the specific methane yield
Investigations on the influence of silaging on the specific methane yield were carried out with
the maize variety Ribera (FAO 380). Three replicates of ensiled and green maize were
anaerobically digested. Ensiling conditions were optimal for the production of lactic acid:
maize was chopped, compacted and stored under anoxic conditions. Degradation of sugars to
lactic acid goes along with a very small energy loss of about 3 % (Buchgraber et al., 1994).
Maize silage yielded 289 Nl CH4 VS-1 (standard deviation of three replicates ±10,8 Nl CH4
VS-1). Green, non conserved maize only produced 225 Nl CH4 per kg VS (standard deviation
of three replicates ±7,1 Nl CH4 VS-1) which is c. 25 % less than silaged maize. During the
silaging process lactic acid, acetic acid, methanol, alcohols, formic acid, H+ and CO2 are
formed. These products are important precursors for methane formation (Madigan et al.,
2000). Another reason for the increase in specific methane yield could be a pre-decomposition
of crude fibre in course of the silaging process, which improves the availability of nutrients
for the methanogenic metabolism.
3.2.2 Influence of harvesting time on the biomass yield, on the specific methane yield and on
the methane yield per hectare

12
1
2
3
4
5
6
7
8
9
10
11
12
13
14
15
16
17
18
19
20
21
22
23
24
25
26
The influence of harvesting time on the biomass yield, on the specific methane yield and on
the methane yield per hectare is illustrated with late ripening maize varieties (FAO c. 600).
Results from investigations from early and medium ripening varieties (FAO 240 – 390) can
be found in Amon et al. (2004a, b, c).
Figure 2
Figure 2 gives the biomass yield per hectare of late ripening maize varieties in course of the
vegetation period. Date were gained from the following maize varieties: Tonale, PR34G13,
Tixxus, LZM 600, CSO271 (FAO 600), Garbure, Ribera, Saxxo, Conca, DKC4626 (FAO
380 - 400). Biomass yield of late ripening maize varieties (FAO 600) increased until full
ripeness of the maize plants. Earlier experiments with early and medium ripening varieties
(FAO 300 - 400) only showed an increase in biomass yield until wax ripeness. The latest
harvest at full ripeness resulted in a loss in net total biomass yield (Amon et. al., 2002b;
2003). The reduction in biomass yield from late harvesting of early ripening maize varieties
may be due to respiration and / or breakage losses (Zscheischler et al., 1984). According to
Zscheischler et al. (1984) the optimum harvesting time for maize is reached at a dry matter
content of 30 – 35 %. Maize can then easily be silaged and gives maximum biomass yields.
At milk ripeness, the VS yield varied between 17.2 Mg VS ha-1 (Garbure) and 20.2 Mg VS
ha-1 (Conca, LZM 600). At wax ripeness, the VS yield increased to 21.9 – 26.7 Mg VS ha-1.
At full ripeness, 22.3 – 31.4 Mg VS ha-1 had been produced. In Austria, the mean maize yield
in the years 2000 – 2003 was c. 43 Mg fresh matter ha-1. Assuming a dry matter content of 30
%, this corresponds to a medium yield of 12.9 Mg VS ha-1. The medium maize yield in the
EU (EU15) is about 42.1 Mg ha-1, which corresponds to c. 12.6 Mg VS ha-1 (Eurostat, 2003).

13
1
2
3
4
5
6
7
8
9
10
11
12
13
14
15
16
17
18
19
20
21
22
23
24
25
26
Figure 3
The methane yield per hectare is the product of biomass yield and specific methane yield per
kg VS. Figure 3 gives the methane yield per hectare in course of the vegetation period for
three late ripening maize varieties. Schumacher et al. (2006) found similar methane yield per
hectare from maize grown in Germany. The specific methane yield is shown in Table 3. It
ranged from 312 – 365 Nl CH4 kg VS-1 (milk ripeness) to 268 – 286 Nl CH4 kg VS-1 (full
ripeness). The specific methane yield declined towards full ripeness. Oechsner et al. (2003)
carried out digestion experiments in discontinuous digesters according to the “Hohenheim
biogas yield test”. Substrates were digested for 36 days at 37 °C. When maize was harvested
at or near full ripeness at a dry matter content of 30 – 42 %, medium biogas yield was 375 Nl
CH4 kg VS-1. Harvesting before wax ripeness at a dry matter content of 22.2 % resulted in
methane yields between 310 and 350 Nl CH4 kg VS-1.
The methane content in the biogas ranged from 55 to 62 % (mean: 58.5 %, n = 100). H2S
(mean: 140.6 ppm; n = 60) and NH3 (mean: 20.7 ppm, n = 27) content in the biogas were low.
Methane yield per hectare was highest at full ripeness. It ranged from 7,226 (PR 34G13) to
9,039 Nm3 CH4 ha-1 (LZM 600). With PR 34G13 and LZM 600, the biggest increase in the
methane yield per hectare was observed from milk ripeness to wax ripeness. At full ripeness,
only a small additional increase was observed.
It was shown, that biomass yield and specific methane production develop in opposite
directions in course of the vegetation period. The methane yield per hectare is predominantly
influenced by the maize variety and by the time of harvesting. Maize is optimally harvested,
when the product from specific methane yield and VS yield per hectare reaches a maximum.

14
1
2
3
4
5
6
7
8
9
10
11
12
13
14
15
16
17
18
19
20
21
22
23
24
25
26
With early to medium ripening varieties (FAO 240 – 390), the optimum harvesting time is at
the “end of wax ripeness”. Maize has then a dry matter content of 35 – 39 % (Amon et al.,
2004c). Late ripening varieties (FAO c. 600) may be harvested later, towards “full ripeness”
at a dry matter content of c. 44 %. On fertile locations, late ripening varieties should be grown
as these make better use of their potential of biomass production.
3.2.3 Influence of harvesting technology on the methane yield per hectare
Maize can be harvested as whole maize crops, maize corns or corn cob mix.
Figure 4
When maize is used for energy production in biogas plants, the harvesting technology must be
chosen that delivers the highest methane yield per hectare. The harvesting technology
determines the biomass yield per hectare and the specific methane yield from the digested
substrate. Figure 4 shows the biomass yield of whole maize crops, maize corns, corn cob mix
and maize without corns and cob.
The biomass yield of whole plants was significantly different in the three harvests. Different
letters indicate significant differences at p < 0.05. The highest biomass yield of whole plants
was achieved in the vegetation stage wax ripeness. The biomass yield of maize without corn
and cobs in the vegetation stages milk and wax ripeness was not significantly different, and
declined to the vegetation stage full ripeness. The biomass yield of corn cob mix was lowest
at milk ripeness. The vegetation stage has no significant influence on the biomass yield of
maize corns.

15
1
2
3
4
5
6
7
8
9
10
11
12
13
14
15
16
17
18
19
20
21
22
23
24
25
26
The specific methane yield was measured from the maize variety Benicia (FAO 300). Benicia
was harvested at milk ripeness (22.3 % DM), at wax ripeness (c. 36.5 % DM) and at full
ripeness (48.4 % DM). After 60 days of anaerobic digestion, whole maize crops (gross energy
content 19.2 MJ kg VS-1) had produced 326 Nl CH4 kg VS-1 (±6.6 Nl CH4 kg VS-1, n=3).
Corn cob mix (GE = 17.3 MJ kg VS-1) yielded 316 Nl CH4 kg VS-1 (± 7.5 Nl CH4 kg VS-1,
n=3). From corns only (GE = 16.7 MJ kg VS-1) a specific methane yield of 309 Nl CH4 kg
VS-1 (± 7.1 Nl CH4 kg VS-1, n=3) was measured. Maize without corns and cob (GE = 18.2 MJ
kg VS-1) produced 274 Nl CH4 kg VS-1 (± 7.1 Nl CH4 kg VS-1, n=3). Whole maize crops
contained more nutrients that are suitable for methane production than corn cob mix or corns
alone. Specific methane yield of all silages declined in course of the vegetation period.
Biomass yield was measured at each harvesting time and the methane yield per hectare was
calculated.
Figure 5
From the biomass yield of three maize varieties (Benicia, Ribera, Saxxo) and from the
specific methane yield of the maize variety Benicia, the methane yield per hectare was
calculated. The highest methane yield per hectare was achieved from digestion of whole
maize crops. Digestion of maize without corn and cob, corn cob mix and corns only resulted
in a reduction in the methane yield per hectare (Fig. 5). Harvesting at wax ripeness gave the
highest methane yields per hectare. Methane yield at wax ripeness was 8,778 (±231, n=3)
Nm3 ha-1 for whole maize crops, 4,961 (±311, n=3) Nm3 ha-1 for corn cob mix, 3,744 (±341,
n=3) Nm3 ha-1 for maize without corn and cob, and 2,403 (±758, n=3) Nm3 ha-1 for corns
only. Digestion of corns only gave only 30 % of energy compared to digestion if whole maize
crops. This means, that when maize is used for energy production, the whole maize crop
should be harvested. Area requirement for a given energy production is then much smaller.

16
1
2
3
4
5
6
7
8
9
10
11
12
13
14
15
16
17
18
19
20
21
22
23
24
25
26
3.2.4 Methane Energy Value Model for maize
Amon et al. (2003) started to develop the Methane Energy Value Model (MEVM) that
estimates methane production during anaerobic digestion from the composition of maize.
With the results of the experiments presented above, the MEVM was further developed and
its accuracy was further improved. More experiments and results were available on which the
model could be based on. The Methane Energy Value gives the potential of maize silage to
produce methane when anaerobically digested in a biogas plant.
Table 3
Table 3 shows the nutrients that were analysed and the specific methane yield that was
measured from experiments with late ripening maize varieties grown at Ludersdorf / Styria in
2003 and calculates the carbon : nitrogen ratio.
The maize varieties showed a characteristic methane production potential that was strongly
dependent on their composition. The composition was mainly determined by the stage of
vegetation. Crude protein (XP), crude fibre (XF) and cellulose (Cel) content declined in
course of the vegetation period. Hemi-cellulose (Hem), N-free-extracts (XX) and starch (XS)
content increased. The C : N ratio rose from c. 24 on the first, early harvest (after c. 97 days
of vegetation) to > 42 at the last, late harvest (after c. 151 days of vegetation). Anaerobic
digestion requires a C : N ratio between 10 and 30 (Schattauer and Weiland, 2004). When the
C : N ratio is too wide, carbon can not optimally be converted to CH4 and the CH4 production
potential is not achieved. When maize was harvested at full ripeness, the C : N ratio was
outside the optimum range with regard to producing a maximum specific methane yield. Co-

17
1
2
3
4
5
6
7
8
9
10
11
12
13
14
15
16
17
18
19
20
21
22
23
24
25
26
digestion of substrates with a narrower C : N ratio could help to overcome this disadvantage.
Location of maize cultivation and variety also influenced the nutrient composition of maize
silage. Identical maize varieties grown at different locations differed in their composition
(Amon et al., 2004a).
From the digestion experiments, a multiple linear regression equation was derived that
estimates methane production from the nutrient composition of maize (Table 4):
Methane Energy Value [Nl CH4 (kg VS)-1] = 19.05 * crude protein [% in DM]
+ 27.73 * crude fat [% in DM]
+ 1.80 * cellulose [% in DM]
+ 1.70 * hemi-cellulose [% in DM]
The nutrients crude protein (XP), crude fat (XL), cellulose (Cel) and hemi-cellulose (Hem)
proved to have a significant influence on methane production. From their content – expressed
as % in maize silage dry matter – the specific potential of maize to produce methane – its
methane energy value – is estimated. The regression equation is based on the experiments
shown in this paper and on experiments from earlier results (Amon et al. 2002b; 2003;
2004c). All trials are included that gave a specific methane yield between 250 and 375 Nl CH4
(kg VS)-1.
Table 4
Table 4 shows coefficients of regression, standard error and level of significance of the
regression model for the estimation of methane yield from anaerobic digestion of maize
silage. The coefficients of regression are highly significant. They show the contribution of
18
1
2
3
4
5
6
7
8
9
10
11
12
13
14
15
16
17
18
19
20
21
22
23
24
25
26
each nutrient to the net total methane yield. Crude fat (27.73) and crude protein (19.05)
contribute most to the net total methane energy value of maize silage (Amon et al., 2004a).
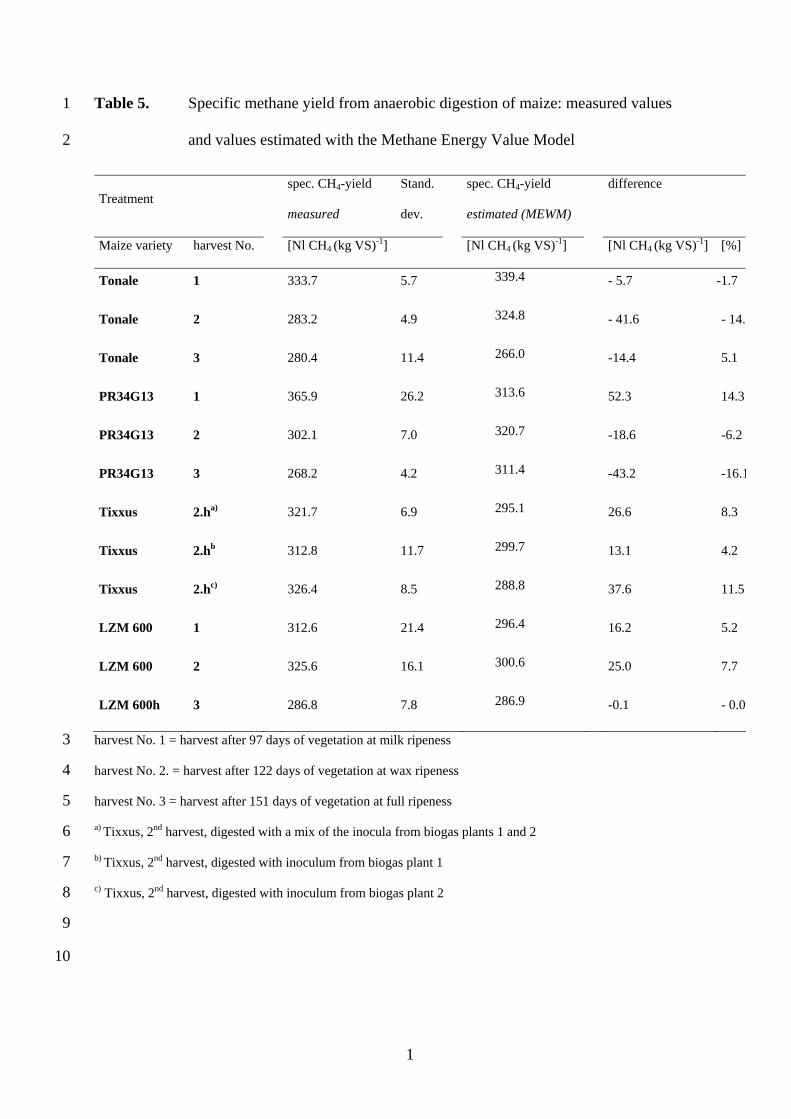
Table 5
Specific methane yields, measured in the eudiometer batch digesters, were compared to the
values estimated with the Methane Energy Value Model (Table 5). Estimated values differed
between 0.17 and 52 Nl CH4 (kg VS)-1 from the measured values. This corresponds to a
difference of 0.1 to 14.3 %. Mean difference was 1.5 %. Additional experiments are necessary
to further improve the accuracy of the Methane Energy Value Model. In particular, the role of
starch for the methane yield has to be investigated in more detail.
4 Conclusions
Anaerobic digestibility of animal manures is markedly influenced by the animal diet and
performance. The highest methane yield was achieved from manure that was received from
cows with medium milk yield that were fed a well balanced diet.
Maize should be conserved as silage prior to anaerobic digestion as this increases the methane
yield. Late ripening varieties (FAO c. 600) make better use of their potential to produce
biomass than medium or early ripening varieties. On fertile locations in Austria they can
produce more than 30 Mg VS ha-1. Maize is optimally harvested, when the product from
specific methane yield and VS yield per hectare reaches a maximum. With early to medium
ripening varieties, the optimum harvesting time is at the “end of wax ripeness”. Late ripening
varieties may be harvested later, towards “full ripeness”. Farmers are advised to harvest maize
when the dry matter yield per hectare reaches its maximum and maize can still be silaged.

19
1
2
3
4
5
6
7
8
9
10
11
12
13
14
15
16
17
18
19
20
21
22
23
24
25
Maximum methane yield is achieved from digestion of whole maize crops. Digesting corn
cob mix, corns only or maize without corn and cob gives 43 – 70 % less methane yield per
hectare.
From the digestion experiments, the Methane Energy Value Model was developed. It
estimates the methane yield from crude protein (XP), crude fat (XL), cellulose (Cel) and
hemi-cellulose (Hem) of maize silage. The Methane Energy Value Model helps to optimise
biogas production by the following capabilities: estimation of the methane production of
organic substrates from their composition, estimation of the power of agricultural biogas
plants in dependency of amount and composition of organic substrates that are digested,
recommendations on varieties and optimum harvesting time of energy crops, and estimation
of the methane yield per hectare of energy crops.
ACKNOWLEDGEMENTS
This work has been funded by the Austrian Federal Ministry of Agriculture, Forestry,
Environment and Water Management, by Pioneer Saaten Ltd. Parndorf, by Raiffeisen Ware
Austria AG, by KWS Austria Saatzucht Ltd., and by the Austrian Federal Ministry for
Transport, Innovation and Technology under the subprogram "Energy Systems of
Tomorrow".
References

20
1
2
3
4
5
6
7
8
9
10
11
12
13
14
15
16
17
18
19
20
21
22
23
24
25
Amon, T., Jeremic, D., Boxberger J. 2001. Neue Entwicklungen der landwirtschaftlichen
Biogaserzeugung in Österreich. In: Freyer, B. (Ed.) 6. Wissenschaftstagung zum
ökologischen Landbau, 6.- 8. März 2001, Freising Weihenstephan/Deutschland, 465 - 468.
Amon, T., Hackl, E., Jeremic, D., Amon, B. 2002a. Kofermentation von Wirtschaftsdüngern
mit Energiegräsern in landwirtschaftlichen Biogasanlagen, Optimierung der
Gärgutmischungen und des Biogasertrages. Final report, Vienna. Wiener Wirtschaftskammer
(Ed.).
Amon, T., Kryvoruchko, V., Amon, B., Moitzi, G., Lyson, D., Hackl, E., Jeremic, D.,
Zollitsch, W., Pötsch, E., Mayer, K., Plank, J. 2002b. Methanbildungsvermögen von Mais –
Einfluss der Sorte, der Konservierung und des Erntezeitpunktes. Final report, October 2002.
On behalf of Pioneer Saaten Ges.m.b.H. Parndorf (Austria).
Amon, T., Kryvoruchko, V., Amon, B., Moitzi, G., Lyson, D., Hackl, E., Jeremic, D.,
Zollitsch, W., Pötsch, E. 2003. Optimierung der Biogaserzeugung aus den Energiepflanzen
Mais und Kleegras. Final report July 2003. Bundesministeriums für Land- und
Forstwirtschaft, Umwelt- und Wasserwirtschaft (Ed.). research project No. 1249.
Amon, T., Kryvoruchko, V., Amon, B., Buga, S., Amin, A., Zollitsch, W., Mayer, K., Pötsch,
E. 2004a. Biogaserträge aus landwirtschaftlichen Gärgütern. In: BAL Gumpenstein,
BMLFUW (Ed.) BAL-Bericht über das 10. Alpenländische Expertenforum zum Thema
Biogasproduktion – Alternative Biomassenutzung und Energiegewinnung in der
Landwirtschaft am 18./19. März 2004, ISBN 3-901980-72-5, 21 – 26.

21
1
2
3
4
5
6
7
8
9
10
11
12
13
14
15
16
17
18
19
20
21
22
23
24
25
Amon, T., Kryvoruchko, V., Amon, B., Reinhold, G., Oechsner, H., Schwab, M., Weiland, P.,
Linke, B. 2004b. Biogaserträge von Energiepflanzen und Wirtschaftsdüngern –
Laborversuchsergebnisse. In: KTBL (Ed.) Die Landwirtschaft als Energieerzeuger. KTBL-
Tagung vom 30. bis 31. März 2004 in Osnabrück., ISBN 3-7843-2162-3, 46 – 61.
Amon, T., Kryvoruchko, V., Amon, B., Zollitsch, W., Mayer, K., Buga, S., Amid, A. 2004c.
Biogaserzeugung aus Mais – Einfluss der Inhaltsstoffe auf das spezifische
Methanbildungsvermögen von früh- bis spätreifen Maissorten. In: BAL Gumpenstein (Ed.)
Beitrag zur 54. Züchtertagung der Vereinigung der Pflanzenzüchter und Saatgutkaufleute
Österreichs, 25. bis 27. November 2003;
Amon, T., Kryvoruchko, V., Bodiroza, V., Amon, B. 2005. Methanerzeugung aus Getreide,
Wiesengras und Sonnenblumen. Einfluss des Erntezeitpunktes und der Vorbehandlung. In: 7.
Tagung: Bau, Technik und Umwelt in der landwirtschaftlichen Nutztierhaltung 2005.
Herausgeber: Kuratorium für Technik und Bauwesen in der Landwirtschaft e.V. (Ed.), 343-
348.
Angelidaki, I., Ellegaard, L., Ahring B.K. 1993. A mathematical model for dynamic
simulation of anaerobic digestion of complex substrates: Focusing on ammonia inhibition.
Biotech. Bioeng. 42, 159 – 166.
Balsari, P., Bonfanti, P., Bozza, E., Sangiorgi, F. 1983. Evaluation of the influence of animal
feeding on the performances of a biogas installation (mathematical model). In: Third
international Symposium on Anaerobic Digestion, 14 –20 August 1983, A 20, Boston,
Massachusetts, USA.

22
1
2
3
4
5
6
7
8
9
10
11
12
13
14
15
16
17
18
19
20
21
22
23
24
25
26
Batstone, D.J., Keller, J., Newell, R.B., Newland, M. 2000. Modelling anaerobic degradation
of complex wastewater. Part II: parameter estimation and validation using slaughterhouse
effluent. Bioresource Techn., 75 (1), 75 – 85.
Batstone, D.J., Keller, J., Angelidaki, R.I., Kalyuzhny, S.V., Pavlostathis, S.G., Rozzi, A.,
Sanders, W.T.M., Siegrist, H., Vavilin, V.A. 2001. The IWA Anaerobic Digestion Model No
1 (ADM1), In: van Velsen, A.F.M., Verstraete, W.H. (Eds.) Proceedings of 9th World
Congress Anaerobic Digestion, Antwerp – Belgium, September 2-6.
Boyle, W.C. 1977. Energy recovery from sanitary landfills. In: A.G. Schlegel, J. Barnea
(Eds.) Microbial Energy Conversion, Unitar, 119 – 138.
Brachtl, E. 2000. Pilotversuche zur Cofermentation von pharmazeutischen Abfällen mit
Rindergülle. Diplomarbeit. Interuniversitäres Forschungsinstitut für Agrarbiotechnologie,
Abt. Umweltbiotechnologie (Ed.), A-3430 Tulln.
Braun, R. 1982. Biogas – Methangärung organischer Abfallstoffe: Grundlagen und
Anwendungsbeispiele (Innovative Energietechnik). Springer, Wien, New York, ISBN 3-211-
81705-0.
Buchgraber, K., Deutsch, A., Gindl, G. 1994. Zeitgemäße Grünlandbewirtschaftung. Leopold
Stocker-Verlag, Graz-Stuttgart, ISBN 3-7020-0683-4.
Buswell, A.M. 1936. Anaerobic fermentations. Bull. No.32, Div. State Water Survey, Univ.
of Illinois, 193.

23
1
2
3
4
5
6
7
8
9
10
11
12
13
14
15
16
17
18
19
20
21
22
23
24
25
26
DIN 38 414 1985. Bestimmung des Faulverhaltens „Schlamm und Sedimente“. Beuth Verlag,
Berlin
EUROSTAT 2003. Informationsdienst des Statistischen Amtes der Europäischen
Gemeinschaften (Eurostat) in Zusammenarbeit mit dem Statistischen Bundesamt. Berlin.
http://www.eu-datashop.de/
Henze, M., Grady, C. P. L., Gujer, W., Marais, G.R., Matsuo, T. 1986. Activated Sludge
Model no 1. International Association on Water Pollution Research and Control. Scientific
and Technical Reports No 1. ISSN: 1010-707X.
Kauter, D., Claupein W. 2004. Cropping Systems for Energy Supply with Catch Crops and
Energy Maize in Central Europe: Principles and Agronomic Problems. In: Proceedings of the
Second World Biomass Conference “Biomass for Energy, Industry and Climate Protection”
Rome, Italy. 10 – 14. May 2004. 417- 420.
Madigan, M.T., Martinko, J.M., Parker, J. 2000. Brock Mikrobiologie, Spektrum
Akademischer Verlag GmbH Heidelberg, Berlin
McCarty, P.L., Mosey, F.E. 1991. Modelling of anaerobic digestion process (a discussion of
concepts). Water Sci. Technol. 24, 17 – 33.
Möller, K. 2003. Systemwirkungen einer "Biogaswirtschaft" im ökologischen Landbau:
Pflanzenbauliche Aspekte, Auswirkungen auf den N-Haushalt und auf die
Spurengasemissionen, Biogas Journal(1), 20-29.
24
1
2
3
4
5
6
7
8
9
10
11
12
13
14
15
16
17
18
19
20
21
22
23
24
25
26
Oechsner, H., Lemmer, A., Neuberg, C. 2003. Feldfrüchte als Gärsubstrat in Biogasanlagen.
Landtechnik 3, 146 – 147.
Pavlostathis, S.G., Gossett, J.M. 1986. A kinetic model for anaerobic digestion of biological
sludge. Biotech. Bioeng. 28, 1519 – 1530.
Sachs, L. Angewandte Statistik, siebente Auflage. Springer-Verlag, Berlin, 1992.
Schattauer, A., Weiland, P. 2004. Handreichung Biogasgewinnung und –nutzung. Final
report. Förderkennzeichen 22027200. Fachagentur Nachwachsende Rohstoffe e.V. (Ed.),
Gülzow.
Scherer, P. 2002. Mikrobielle Aspekte bei der Vergärung von Biomasse in Batch-Ansätzen.
In: VDI (Ed.) VDI Workshops „Vergärung Organischer Stoffe“, 18./19. April 2002,
Düsseldorf / Germany. Paper No. 9
Schumacher, B, Böhmel, C., Oechsner, H. 2006. Welchen Energiemais wann ernten für die
Biogasgewinnung? Landtechnik 61/2, 84 – 85.
SPSS Inc. 2005. SPSS software, Release 11.5, SPSS Inc. Chicago, Illinois;
http://www.spss.com/spss/
Thomé-Kozmiensky, K.J. 1995. Biologische Abfallbehandlung. EF-Verlag für Energie- und
Umwelttechnik, Berlin.
Wellinger, A., Edelmann, W., Favre, R., Seiler, B., Woschitz, D. 1984. Biogashandbuch –
25
1
2
3
4
5
6
7
8
9
10
11
12
13
Grundlagen, Planung und Betrieb landwirtschaftlicher Biogasanlagen. Verlag Wirz AG,
Aarau, ISBN 3-85983-028-7.
Weiland, P. 2000. Stand und Perspektiven der Biogasnutzung und –erzeugung in
Deutschland. In: Fachagentur Nachwachsender Rohstoffe e.V., Gülzow (Ed.) Energetische
Nutzung von Biogas: Stand der Technik und Optimierungspotential, Gülzower
Fachgespräche, Band 15, Weimar 26./27. Oktober 2000.
Zscheischler, J., Estler, M., Groß, F., Burgstaller, G., Neumann, H., Geißler, B. 1984.
Handbuch Mais: Anbau – Verwertung – Fütterung, 3. Auflage, Frankfurt (Main): DLG-
Verlag; München, BLV-Verlagsgesellschaft; Münster-Hiltrup: Landwirtschaftsverlag; Wien:
Österreichischer Agrarverlag; Bern: Verbandsdruckerei/Wirz, 1984.

26
1
2
3
TABLES
Table 1. Diet and milk yield of dairy cattle that delivered the manure for the digestion
experiments.
Treatment concentrate hay grass silage maize silage milk yield
[kg DM] [l day-1]
dairy-1 0 5.2 10.4 0 11.2
dairy-2 0 5.4 6.4 5.8 11.2
dairy-3 4.6 4.0 4.8 5.2 17.6
dairy-4 5.8 5.0 10.0 0 16.0
dairy-5 11.0 3.2 3.8 3.6 29.2
dairy-6 10.0 3.0 6.2 0 29.2
DM = dry matter 4

27
1 Table 2. Composition of dairy cow manure and specific biogas and methane yield.
Treatment
composition of dairy cow manure
[g (kg DM)-1]
gas yield b
[Nl (kg VS-1)]
pH DMa XP XF Cel Hem ADL XL XA GE [MJ] biogas methane
dairy-1 6.95 143.7 162.6 265.9 194.7 144.0 162.1 46.4 157.1 15.8 208.2 136.5
dairy-2 6.79 128.8 154.3 265.8 227.3 175.9 128.2 34.5 155.0 17.3 213.1 131.8
dairy-3 6.60 135.0 156.6 310.1 250.8 190.3 124.7 23.8 131.7 14.6 245.8 166.3
dairy-4 6.60 159.6 150.6 279.5 164.1 187.9 183.3 29.1 162.8 19.3 222.5 143.1
dairy-5 6.70 148.5 180.2 273.3 161.8 208.7 190.4 28.5 148.4 15.6 238.9 125.5
dairy-6 6.66 157.3 296.5 248.5 210.1 195.5 121.7 30.3 167.8 16.8 267.7 159.2
a [g (kg FM)-1] b Nl = Norm litre (273 K, 1.013 bar) 2
3
4
DM = dry matter; XP = crude protein; XF = crude fibre; Cel = cellulose; Hem = hemi cellulose; ADL =
lignin; XL = crude fat; XA = crude ash; GE = gross energy

28

Table 3. Composition and specific methane yield from late ripening maize varieties 1
Treatment Composition of maize varieties CH4 yield
maize variety
harvest No.
[% DM] [% FM] Nl CH4 (kg VS)- 1
XP XL XF XA XX ADL Cel Hem C XS sugar C/N DM VS spec. CH4 yield stand. dev.
Tonale 1 10.1 1.4 34.5 5.3 48.8 6.4 36.2 25.3 49.6 1.20 0.3 24.2 19.4 18.4 334 5.7
Tonale
2 7.9 2.1 26.2 4.8 59.0 5.3 28.6 38.0 49.9 20.2 1.0 39.6 29.8 28.3 283 4.9
Tonale 3 6.9 1.5 20.3 2.9 68.3 4.8 22.2 30.4 50.1 32.1 2.9 45.1 43.1 41.8 280 11.4
PR34G13 1 9.2 1.2 30.8 4.1 54.7 8.6 33.8 25.4 50.6 4.1 1.5 24.9 18.0 17.2 366 26.2
PR34G13 2 7.8 2.5 23.8 4.5 61.4 5.5 26.1 32.7 50.5 27.4 0.8 33.5 28.2 26.9 302 7.0
PR34G13 3 7.2 2.2 26.3 3.5 60.7 6.7 28.9 35.9 50.9 25.5 2.4 46.2 43.0 41.4 268 4.2
Tixxus 1 7.9 1.2 34.9 4.9 51.1 5.3 37.1 26.4 50.3 2.9 0.3 37.0 19.4 18.4 n.m. n.m.
Tixxus 2 6.9 2.3 24.7 5.2 61.0 4.5 25.0 35.5 50.3 25.5 1.1 44.1 30.2 28.6 322 11.7
Tixxus 3 5.9 2.6 23.4 4.2 63.9 4.6 23.8 36.2 51.0 30.9 4.8 52.1 52.9 50.7 n.m. n.m.
LZM 600 1 7.8 1.3 35.6 4.1 51.2 7.5 37.3 26.1 50.4 1.2 0.5 43.5 18.1 17.4 313 21.4
LZM 600 2 6.7 2.4 27.2 5.3 58.4 6.1 27.5 33.7 49.6 22.6 0.4 42.1 29.0 27.5 326 16.1
LZM 600 3 6.7 2.4 18.7 2.8 69.4 4.3 19.3 34.2 49.3 44.6 0.3 42.2 48.0 46.7 287 7.8
n.m.= not measured 2
3
4
5
6
7
harvest No. 1 = harvest after 97 days of vegetation at milk ripeness
harvest No. 2. = harvest after 122 days of vegetation at wax ripeness
harvest No. 3 = harvest after 151 days of vegetation at full ripeness
FM = fresh matter; XP = crude protein; XL = crude fat; XF = crude fibre; XA = crude ash ; XX = nitrogen free extracts; ADL = lignin; Cel = cellulose; Hem = hemi cellulose;
XS = starch; C/N = C : N ratio; DM = dry matter; VS = volatile solids; Nl = Norm litre (273 K, 1.013 bar)

Table 4. Coefficients of regression, standard error and level of significance for the
estimation of methane yield from maize silage from its composition
1
2
nutrient coefficient of regression standard error level of significance
[% DM] (p)
crude protein 19.05 2.95 0.000
crude fat 27.73 7.09 0.000
cellulose 1.80 0.40 0.000
hemicellulose 1.70 0.40 0.000
The regression equation is derived from 34 batches with maize, each batch was replicated
three times
3
4
1
1
2
Table 5. Specific methane yield from anaerobic digestion of maize: measured values
and values estimated with the Methane Energy Value Model
Treatment spec. CH4-yield
measured
Stand.
dev.
spec. CH4-yield
estimated (MEWM)
difference
Maize variety harvest No. [Nl CH4 (kg VS)-1] [Nl CH4 (kg VS)-1] [Nl CH4 (kg VS)-1] [%]
Tonale 1 333.7 5.7 339.4 - 5.7 -1.7
Tonale 2 283.2 4.9 324.8 - 41.6 - 14.
Tonale 3 280.4 11.4 266.0 -14.4 5.1
PR34G13 1 365.9 26.2 313.6 52.3 14.3
PR34G13 2 302.1 7.0 320.7 -18.6 -6.2
PR34G13 3 268.2 4.2 311.4 -43.2 -16.1
Tixxus 2.ha) 321.7 6.9 295.1 26.6 8.3
Tixxus 2.hb 312.8 11.7 299.7 13.1 4.2
Tixxus 2.hc) 326.4 8.5 288.8 37.6 11.5
LZM 600 1 312.6 21.4 296.4 16.2 5.2
LZM 600 2 325.6 16.1 300.6 25.0 7.7
LZM 600h 3 286.8 7.8 286.9 -0.1 - 0.0
harvest No. 1 = harvest after 97 days of vegetation at milk ripeness 3
4
5
6
7
8
9
10
harvest No. 2. = harvest after 122 days of vegetation at wax ripeness
harvest No. 3 = harvest after 151 days of vegetation at full ripeness
a) Tixxus, 2nd harvest, digested with a mix of the inocula from biogas plants 1 and 2
b) Tixxus, 2nd harvest, digested with inoculum from biogas plant 1
c) Tixxus, 2nd harvest, digested with inoculum from biogas plant 2

2
1
2
3
4
5
6
7
8
9
10
11
12
13
14
15
16
17
18
19
FIGURE CAPTIONS
Fig. 1. Influences on biogas production from maize along the production process.
Fig. 2. Biomass yield of late ripening maize varieties at different stages of vegetation.
Fig. 3. Methane yield per hectare of late ripening maize varieties at different stages of
vegetation with standard deviation from three replicates per variety and vegetation
stage. Different letters indicate significant differences at p < 0.05.
Fig. 4. Biomass yield from whole maize crops, maize without corns and cob, corn cob mix
and corns only at different stages of vegetation (varieties: Benicia, Ribera, Saxxo) with
standard deviation from three replicates per treatment and vegetation stage. Different
letters indicate significant differences at p < 0.05.
Fig. 5. Methane yield per hectare from whole maize crops, maize without corns and cob, corn
cob mix and corns only at different stages of vegetation (varieties: Benicia, Ribera,
Saxxo) with standard deviation from three replicates per treatment and vegetation
stage. Different letters indicate significant differences at p < 0.05.

phase I
biomassproduction
phase II
harvest, conservation, supply
phase III
fermentation
phase IV
end products
digestate
biogas
fermentationsubstrate
biomass fordigestion
plant
locationclimate
varietyharvestingtechnology
chopping additives
environmentalconditions
substrate composition
conservationfermentationtechnology
time of harvesting
plant management
3
1
2
3
4
5
Fig. 1. Influences on biogas production from maize along the production process.

y = 8.9221Ln(x) - 8.0991R2 = 0.6201
0
5
10
15
20
25
30
35
0 10 20 30 40 50 60
whole plant DM content [%]
biom
ass
yiel
d [t
VS
ha-1
]
70
milk ripeness
wax ripeness
full ripeness
1
2 Fig. 2. Biomass yield of late ripening maize varieties at different stages of vegetation.
4

5
1
0
1000
2000
3000
4000
5000
6000
7000
8000
9000
10000
milk ripeness wax ripeness full ripeness
met
hane
yie
ld p
er h
ecta
re [N
m3 C
H4 h
a-1]
TonalePR34G13LZM 600
ab
(abc)
c
def def defg
ji
ab
ji
(gji)(def)
2 3
4
5
6
7
Fig. 3. Methane yield per hectare of late ripening maize varieties at different stages of
vegetation with standard deviation from three replicates per variety and vegetation
stage. Different letters indicate significant differences at p < 0.05.

0
5
10
15
20
25
30
35
40
milk ripeness wax ripeness full ripeness
biom
ass
yiel
d [t
VS
ha-1
]cornscorn cob mixmaize without CCMwhole maize plants
abc
l
m
abc abcd
ef efgj gj
i
k
(abc)(def)(gji)
(klm)
1
2
3
4
5
6
Fig. 4. Biomass yield from whole maize crops, maize without corns and cob, corn cob mix
and corns only at different stages of vegetation (varieties: Benicia, Ribera, Saxxo) with
standard deviation from three replicates per treatment and vegetation stage. Different
letters indicate significant differences at p < 0.05.
6

0
1000
2000
3000
4000
5000
6000
7000
8000
9000
10000
milk ripeness wax ripeness full ripeness
met
hane
yie
ld p
er h
ecta
re [N
m3 C
H4 h
a-1]
cornscorn cob mixmaize without corns and cobwhole maize plants
abc
l
km
abc
abc
df
e
df
gj
gj
i
km
(abc)(def)(gji)(klm)
1 2
3
4
5
Fig. 5. Methane yield per hectare from whole maize crops, maize without corns and cob, corn
cob mix and corns only at different stages of vegetation (varieties: Benicia, Ribera,
Saxxo) with standard deviation from three replicates per treatment and vegetation
stage. Different letters indicate significant differences at p < 0.05.
7

8
1