biomass as a renewable energy source: the case of converting municipal solid waste (msw) to energy
TRANSCRIPT

Biomass As A Renewable Energy Source: The case of Converting Municipal Solid Waste
(MSW) to Energy
Baharuddin Bin Ali [BSc(Hons) PhD(Leeds), FIEM, PEng]
Puri PujanggaUniversiti Kebangsaan Malaysia (UKM)
National University of Malaysia
16TH June 2014
7th Asian School on Renewable Energy
President Yayasan Mahkota

Baharuddin Bin Ali
7th Asian School on Renewable Energy, Puri Pujangga UKM, Malaysia, 16th-20th June 2014
Sypnosis
The paper describes the importance of biomassas a source of renewable energy. Biomassmaterials have greatest potential to beprocessed as feedstocks in bio-energyproduction or as fuels in combustion,gasification and pyrolysis systems. It discussesvarious methods of preparing the biomassmaterials. It identifies various applications andfocus areas of research and development inhandling, storage of biomass.
2

Baharuddin Bin Ali
7th Asian School on Renewable Energy, Puri Pujangga UKM, Malaysia, 16th-20th June 2014
Biomass as Energy Source : Pros and Cons
• Pros:
• Domestic benefit
• Reduced trade deficit
• Create jobs
• Strengthen rural economies
• Local raw materials
• Renewable resources
• Carbon cycle to reduce build up of greenhouse gases
• Technology improvements should continue to reduce costs
3
Cons:• Lower energy density• Solids difficult to handle• High water content• Competing uses as high value food
stuff• Symbiotic relationship —producers &
users• Commercial Issues
• Biomass feedstock, availability, & cost
• Suitable sites• Production technologies• Qualified owner‐operator• Project financing

Baharuddin Bin Ali
7th Asian School on Renewable Energy, Puri Pujangga UKM, Malaysia, 16th-20th June 2014
Clean Air Act & Amendments
• Series of Clean Air Acts
• Air Pollution Control Act of 1955
• Clean Air Act of 1963
• Air Quality Act of 1967
• Clean Air Act Extension of 1970
• Clean Air Act Amendments in 1977 & 1990
• 1977 Clean Air Act amendments set requirements for "substantially similar gasoline“
• Oxygenates added to make motor fuels burn more cleanly & reduce tailpipe pollution (particularly CO)
• Required that oxygenates be approved by the U.S. EPA
• MTBE & ethanol primary choices
• California Phase 3 gasoline regulation approved by California Air Resources Board in December 1999 prohibits gasoline with MTBE after Dec 31, 2002
• Water quality issues
4

Baharuddin Bin Ali
7th Asian School on Renewable Energy, Puri Pujangga UKM, Malaysia, 16th-20th June 2014
Renewable Fuel Standard
• Energy Policy Act of 2005
• Replaced oxygenate requirements
• MTBE & ethanol
• Renewable fuel volume mandates
• Ethanol volumes
• 2nd generation production methods given a higher multiplier to encourage investment & production
5

Baharuddin Bin Ali
7th Asian School on Renewable Energy, Puri Pujangga UKM, Malaysia, 16th-20th June 2014
2007 Renewable Fuel Standard
6

Baharuddin Bin Ali
7th Asian School on Renewable Energy, Puri Pujangga UKM, Malaysia, 16th-20th June 2014
Typical Elemental Analyses:Petroleum, Biomass, & Biofuels
7

Baharuddin Bin Ali
7th Asian School on Renewable Energy, Puri Pujangga UKM, Malaysia, 16th-20th June 2014
1st Generation Biofuels
• Ethanol
• Typically derived from fermentation of sugars & starches
• US: Corn starch
• Brazil: Sugar cane juice
• Biodiesel
• FAME – Fatty Acid Methyl Ester (Malaysia)
• From fats and oils
• US: Soybean oil
• Europe: Rapeseed oil
8

Baharuddin Bin Ali
7th Asian School on Renewable Energy, Puri Pujangga UKM, Malaysia, 16th-20th June 2014
Edible Constituents of Biomass
• Starch: 70%–75% (corn)
• Readily available and hydrolysable
• Basis for existing U.S. “biorefineries”
• Oil: 4%–7% (corn), 18%–20% (soybeans)
• Readily separable from biomass feedstock
• Basis for oleochemicals and biodiesel
• Protein: 20%–25% (corn), 80% (soybean meal)
• Key component of food
• Chemical product applications
9

Baharuddin Bin Ali
7th Asian School on Renewable Energy, Puri Pujangga UKM, Malaysia, 16th-20th June 2014
Ethanol From Corn Starch
Two primary processing options
• Wet mills
• Expensive to build – not common
• Sophisticated operations
• Multiple products (Fuel, food, & fiber)
• Dry mills
• Most common – fairly simple operations
• Processing options making more sophisticated
• Limited products – primarily ethanol & Distiller’s Dried Grains (DDG) with Solubles (DDGS)
• More sophisticated operations may add germ, fermentation co-products, …
10

Baharuddin Bin Ali
7th Asian School on Renewable Energy, Puri Pujangga UKM, Malaysia, 16th-20th June 2014
Ethanol from Corn vs. Sugar Cane
11

Baharuddin Bin Ali
7th Asian School on Renewable Energy, Puri Pujangga UKM, Malaysia, 16th-20th June 2014
Criticisms of Ethanol
• Food vs fuel
– Divert land from growing food to growing fuel
• Just a farmer subsidy
• Ethanol not compatible with gasoline infrastructure
– RBOB – (Reformulated Blendstock for Oxygenate Blending) special blend stock to allow for RVP increase at E10 levels
– Picks up water
• Cannot be transported in petroleum pipelines – use water slugs between batches
• Takes more energy to make that you get back
– Based on “wells to wheels” Life Cycle Assessment
– LCA normally compare energy out vs. fossil energy in
– Highly dependent upon feedstock, farming practice, processing, …
• Takes too much water to make
– Highly dependent upon feedstock, farming/irrigation practice, processing, …
12

Baharuddin Bin Ali
7th Asian School on Renewable Energy, Puri Pujangga UKM, Malaysia, 16th-20th June 2014
Corn Ethanol Energy Balance
13
Source: M. Wang (2003)

Baharuddin Bin Ali
7th Asian School on Renewable Energy, Puri Pujangga UKM, Malaysia, 16th-20th June 2014
Biodiesel Cycle
14
Baharuddin Bin Ali
7th Asian School on Renewable Energy, Puri Pujangga UKM, Malaysia, 16th-20th June 2014
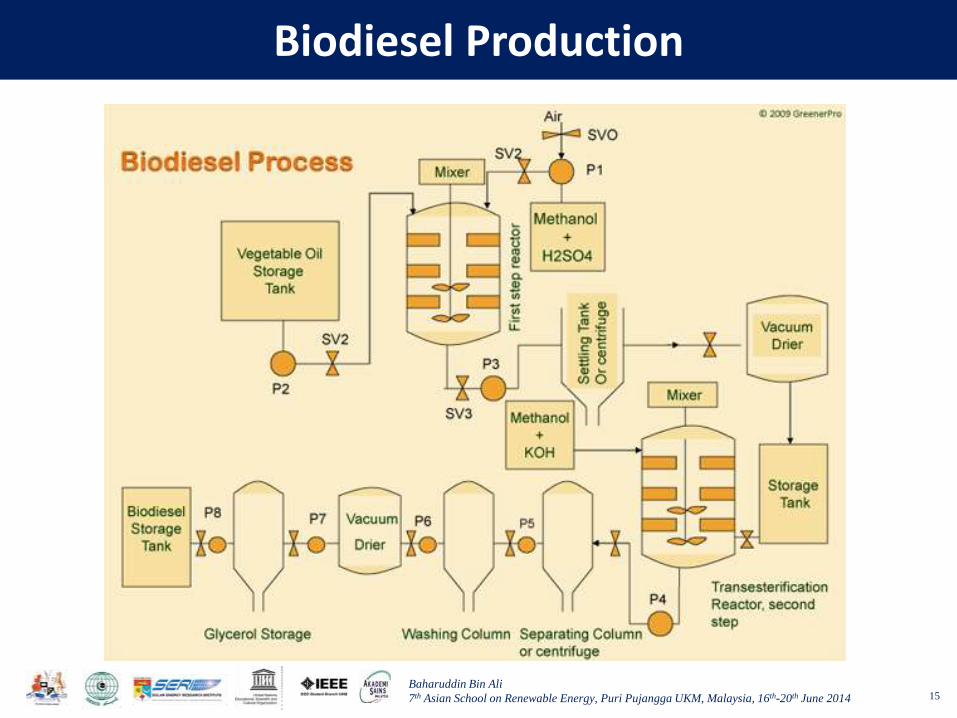
Biodiesel Production
15

Baharuddin Bin Ali
7th Asian School on Renewable Energy, Puri Pujangga UKM, Malaysia, 16th-20th June 2014
Biodiesel Production Example
16

Baharuddin Bin Ali
7th Asian School on Renewable Energy, Puri Pujangga UKM, Malaysia, 16th-20th June 2014
2nd Generation Biofuels
• Cellulosic/Lignocellulosic Ethanol
– Biochemical pathway
• Utilize sugars from cellulose & hemicellulose
– Thermochemical pathway
• Utilize all carbon, including lignin
• Butanol
– More closely compatible to petroleum derived gasoline
– From fermentation (BP/DuPont)
– Gasification & catalytic synthesis
• Green/Renewable Diesel/Gasoline
– Hydrocarbon just like petroleum‐derived products
– Multiple sources & processing paths
• Hydro-processed fats & oils
– Both diesel & gasoline
– Could be integrated into existing refineries
• End product from gasification & FT synthesis (Fischer–Tropsch process is a collection of chemical reactions that converts a mixture of CO and H2 into liquid hydrocarbons.
– Excellent diesel
17

Baharuddin Bin Ali
7th Asian School on Renewable Energy, Puri Pujangga UKM, Malaysia, 16th-20th June 2014
Non‐Edible Constituents of Biomass
• Lignin: 15%–25%
– Complex aromatic structure
– Very high energy content
– Resists biochemical conversion
• Hemicellulose: 23%–32%
– Xylose is the second most abundant sugar in the biosphere
– Polymer of 5‐ and 6‐carbon sugars, marginal biochemical feed
• Cellulose: 38%–50%
– Most abundant form of carbon in biosphere
– Polymer of glucose, good biochemical feedstock
18

Baharuddin Bin Ali
7th Asian School on Renewable Energy, Puri Pujangga UKM, Malaysia, 16th-20th June 2014
Biochemical Conversion Process
19
Lignocellulosic Biomass to Ethanol Process Design and Economics NREL/TP‐510‐32438 June, 2002http://www.nrel.gov/docs/fy02osti/32438.pdf

Baharuddin Bin Ali
7th Asian School on Renewable Energy, Puri Pujangga UKM, Malaysia, 16th-20th June 2014
Thermochemical Conversions
• Pyrolysis
• Thermal conversion (destruction) of organics in the absence of oxygen
• In the biomass community, this commonly refers to lower temperature thermal processes producing liquids as the primary product
• Possibility of chemical and food byproducts
• Gasification
• Thermal conversion of organic materials at elevated temperature and reducing conditions to produce primarily permanent gases, with char, water, & condensibles as minor products
• Primary categories are partial oxidation and indirect heating
20

Baharuddin Bin Ali
7th Asian School on Renewable Energy, Puri Pujangga UKM, Malaysia, 16th-20th June 2014
Syngas Products
21
• Hydrogen
• Methanol and its derivatives (NH3, DME, MTBE formaldehyde, acetic acid, MTG, MOGD, TIGAS)
• Fischer Tropsch Liquids
• Ethanol
• Mixed alcohols
• Olefins
• Oxosynthesis
• Isosynthesis
Products from Syngas
TIGAS - Topsoe's Improved Gasoline Synthesis Process (converts the synthesis gas to gasoline)MTG - Methanol-to-GasolineMOGD - (Mobil-Olefins-to-Gasoline-and-Distillate

Baharuddin Bin Ali
7th Asian School on Renewable Energy, Puri Pujangga UKM, Malaysia, 16th-20th June 2014
Thermochemical Conversion
22
Personal communication Ryan Davis, National Renewable Energy Laboratory. November 2009.

Baharuddin Bin Ali
7th Asian School on Renewable Energy, Puri Pujangga UKM, Malaysia, 16th-20th June 2014
Hydrodeoxygenation of Organic Oils
• Organic oils can be hydrotreated to form “green” diesel
• Fully compatible with petroleum derived diesel
• Excellent cetane number because of the straight chain nature
• Challenges for catalyst design
• Oxygen relatively easy to remove, but large oxygen content
• Prefer to deoxygenate to CO2 to maximize fuel usage of H2
23
“Hydrotreating in the production of green diesel”, . Egeberg, N. Michaelsen, L. Skyum, & P. ZeuthenJournal of Petroleum Technology, 2nd Quarter 2010

Baharuddin Bin Ali
7th Asian School on Renewable Energy, Puri Pujangga UKM, Malaysia, 16th-20th June 2014
Algae
• Better solar collector than land‐based biomass
• Higher solar utilization
• Lower land use requirements
• Can use brackish water
• Limitation is getting carbon to the organism
• Co‐locate with power plants –use CO2 in flue gas
• Biofuels potential
• Kill the algae & harvest its natural oils
• Biodiesel or biocrude feedstock
• Biocatalyst to secrete desired product
• Like yeast for fermentation
• Hydrogen production possible
24
• Near‐term processing steps• Cultivation
• Open ponds• Low cost but high potential
for contamination• Photo bioreactors – flat panel,
tubular, column• Higher cost but more
controlled conditions• Harvesting• High water content of algae
• Oil extraction• Intercellular rather than
intracellular• Usually chemical extraction

Baharuddin Bin Ali
7th Asian School on Renewable Energy, Puri Pujangga UKM, Malaysia, 16th-20th June 2014
Bioethanol Production
25

Baharuddin Bin Ali
7th Asian School on Renewable Energy, Puri Pujangga UKM, Malaysia, 16th-20th June 2014
Biofuels Production
26

Baharuddin Bin Ali
7th Asian School on Renewable Energy, Puri Pujangga UKM, Malaysia, 16th-20th June 2014
Biomass Cycle
27

Baharuddin Bin Ali
7th Asian School on Renewable Energy, Puri Pujangga UKM, Malaysia, 16th-20th June 2014
Composition of Plant Biomass
28
• The chemical composition of plant biomass varies among species. Yet, in general terms, plants are made of approximately 25% lignin and 75% carbohydrates or sugars.
• The carbohydrate fraction consists of many sugar molecules linked together in long chains or polymers.
• Two categories are distinguished: cellulose and hemi-cellulose. The lignin fraction consists of non-sugar type molecules that act as a glue holding together the cellulose fibers.
Cellulose Hemi-cellulose LigninSoftwood 45 25 30Hardwood 42 38 20
Straw stalks 40 45 15
Typical values for the composition of straw, softwoods and hardwoods

Baharuddin Bin Ali
7th Asian School on Renewable Energy, Puri Pujangga UKM, Malaysia, 16th-20th June 2014
Where does biomass come from? The Global carbon cycle
29
• Carbon dioxide (CO2) from the atmosphere and water absorbed by the plants roots are combined in the photosynthetic process to produce carbohydrates (or sugars) that form the biomass.
• The solar energy that drives photosynthesis is stored in the chemical bonds of the biomass structural components. During biomass combustion, oxygen from the atmosphere combines with the carbon in biomass to produce CO2 and water.
• The process is therefore cyclic because the carbon dioxide is then available to produce new biomass.
• This is also the reason why bio-energy is potentially considered as carbon-neutral, although some CO2 emissions occur due to the use of fossil fuels during the production and transport of biofuels.

Baharuddin Bin Ali
7th Asian School on Renewable Energy, Puri Pujangga UKM, Malaysia, 16th-20th June 2014
Representation of the Global Carbon Cycle
30
The figure above shows the global carbon reservoirs in Gtons of carbon (1GtC = 1012 kg) and the annual fluxes and accumulation rates in GtC/year, calculated over the period 1990 to 1999. The values shown are approximate and considerable uncertainties exist as to some of the flow values.

Baharuddin Bin Ali
7th Asian School on Renewable Energy, Puri Pujangga UKM, Malaysia, 16th-20th June 2014
Biomass Resources
31
• Biomass resources can be classified according to the supply sector
Supply Type
Sector Example
ForestryDedicated forestry
Short rotation plantations (e.g. willow, poplar, eucalyptus)
Forestry by-products Wood blocks, wood chips from thinnings
Agriculture
Dry lignocellulosic energy crops
Herbaceous crops (e.g. miscanthus, reed canary grass, giant reed)
Oil, sugar and starch energy crops
Oil seeds for methyl esters (e.g. rape seed, sunflower)
Sugar crops for ethanol (e.g. sugar cane, sweet sorghum)
Starch crops for ethanol (e.g. maize, wheat)
Agricultural residues Straw, prunings from vineyards and fruit trees
Livestock waste Wet and dry manure
Industry Industrial residuesIndustrial waste wood, sawdust from sawmills
Fibrous vegetable waste from paper industries
Waste
Dry lignocellulosic Residues from parks and gardens (e.g. prunings, grass)
Contaminated waste
Demolition woodOrganic fraction of municipal solid wasteBiodegradable land filled waste, landfill gasSewage sludge

Baharuddin Bin Ali
7th Asian School on Renewable Energy, Puri Pujangga UKM, Malaysia, 16th-20th June 2014
Biomass in Malaysia
32
Municipal Wastes
Sugarcane1%
Biomass
Rice1%
Wood 1%
Oil Palm94%
EFB
Fibre
Shell
POME
Forest
Sawmill
Husk
Straw
Bagasse
MolassesMSW
Landfill Gas
OrganicFertlizer
Fronds/
trunk
Abundant in Malaysia > 70 million tonnes collected / yearProduction of biomass throughout the year because of –high sunlight intensity/time and high rainfallMain contributor of biomass is the palm oil industry, mainly ligno-cellulosics
• Malaysia generates in excess of 15,000 tons of solid waste per day
• Malaysian government recognizes the importance of preserving the environment
by promoting recycling (4R)

Baharuddin Bin Ali
7th Asian School on Renewable Energy, Puri Pujangga UKM, Malaysia, 16th-20th June 2014
Current Applications and Potential of Renewable Energy (Biomass-Oil Palm Industry)
33
Baharuddin Bin Ali
7th Asian School on Renewable Energy, Puri Pujangga UKM, Malaysia, 16th-20th June 2014
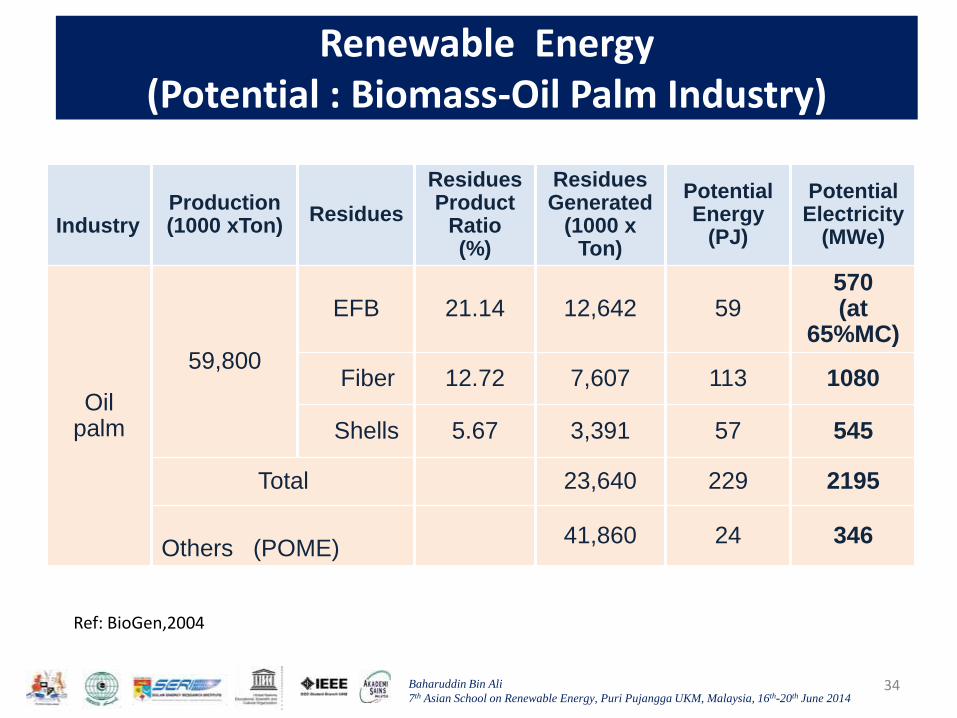
Current Applications and Potential of Renewable Energy
(Potential : Biomass-Oil Palm Industry)
34
IndustryProduction (1000 xTon)
Residues
ResiduesProduct
Ratio(%)
Residues Generated
(1000 x Ton)
PotentialEnergy
(PJ)
PotentialElectricity
(MWe)
Oil palm
59,800
EFB 21.14 12,642 59570(at
65%MC)
Fiber 12.72 7,607 113 1080
Shells 5.67 3,391 57 545
Total 23,640 229 2195
Others (POME)41,860 24 346
Ref: BioGen,2004

Baharuddin Bin Ali
7th Asian School on Renewable Energy, Puri Pujangga UKM, Malaysia, 16th-20th June 2014
Current Applications and Potential of Renewable Energy (Biomass : Approved Projects)
35
No.Type
Energy Resource
Approved Application
Grid Connected
Capacity (MW)
1 BiomassEmpty Fruit Bunches
15 103.2
Wood Residues
1 6.6
Rice Husk 1 4.1
Municipal Solid Waste
4 25
2 Landfill Gas 3 6.0
3 Mini-hydro 23 93.2
Total 47 244
Source: Energy Commission, July 2006

Baharuddin Bin Ali
7th Asian School on Renewable Energy, Puri Pujangga UKM, Malaysia, 16th-20th June 2014
Applications and Potential of Renewable Energy (Biomass : Rubber Residues)
36
• The replanting of rubber plantations used to be very importantsource of fuel. However, with the development of technology forthe utilization of rubber wood for the manufacture of furnitureand other value-added wood products, the availability of rubberwood waste for fuel is much decreased.
Baharuddin Bin Ali
7th Asian School on Renewable Energy, Puri Pujangga UKM, Malaysia, 16th-20th June 2014
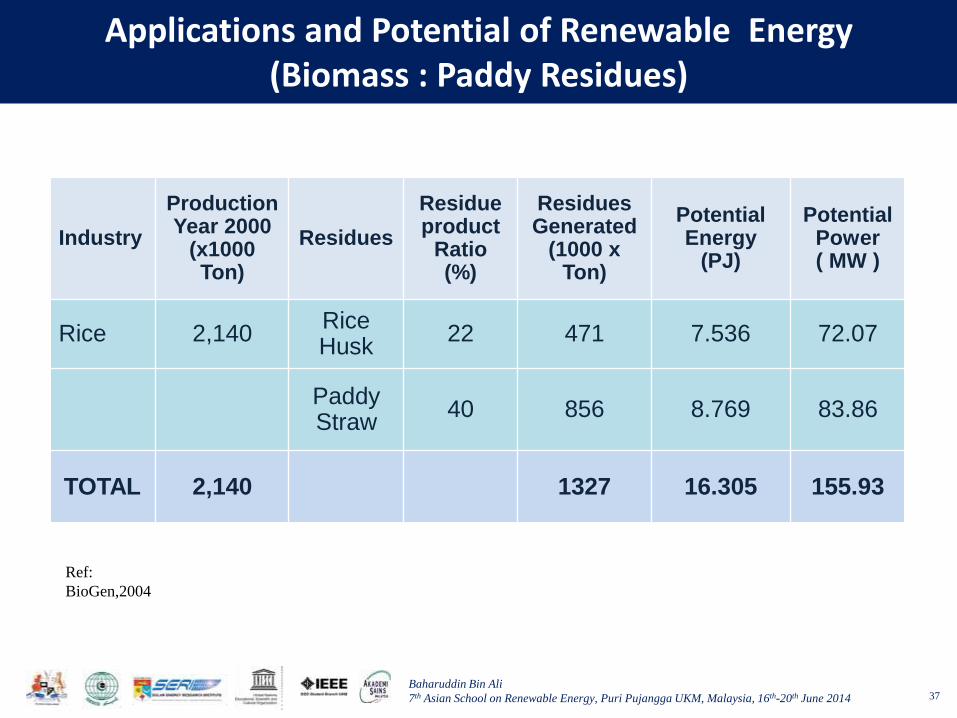
Applications and Potential of Renewable Energy(Biomass : Paddy Residues)
37
Industry
ProductionYear 2000
(x1000 Ton)
Residues
Residue product
Ratio(%)
Residues Generated
(1000 x Ton)
PotentialEnergy
(PJ)
PotentialPower( MW )
Rice 2,140Rice Husk
22 471 7.536 72.07
Paddy Straw
40 856 8.769 83.86
TOTAL 2,140 1327 16.305 155.93
Ref:
BioGen,2004

Baharuddin Bin Ali
7th Asian School on Renewable Energy, Puri Pujangga UKM, Malaysia, 16th-20th June 2014
Applications and Potential of Renewable Energy (Biomass : MSW)
38
YearPopulation
(Million)
Estimatedamount
of wastes(mil.ton/yr)
1991 17.5 4.5
1994 18.9 5.0
2015 31.3 7.8
2020 35.9 9.0
Ref: BioGen,2004
Industrial24%
Construction9%
Municipal2%
Domestic49%
Commercial/Institutional
16%
Composition of Solid MSW in Malaysia
Baharuddin Bin Ali
7th Asian School on Renewable Energy, Puri Pujangga UKM, Malaysia, 16th-20th June 2014
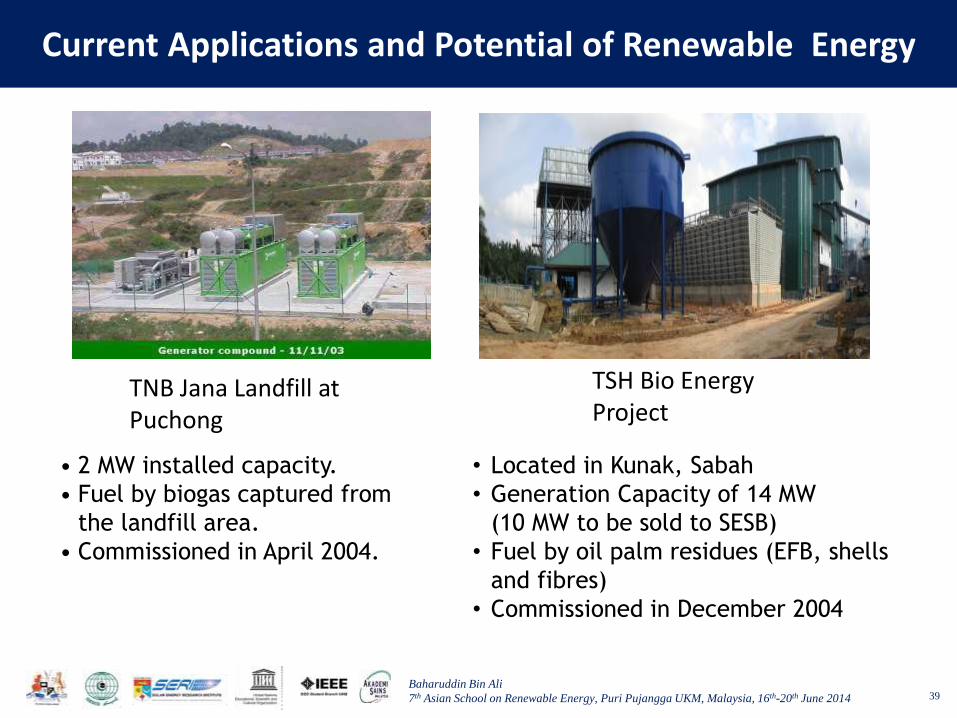
Current Applications and Potential of Renewable Energy
39
• 2 MW installed capacity.
• Fuel by biogas captured from
the landfill area.
• Commissioned in April 2004.
TNB Jana Landfill at Puchong
TSH Bio Energy Project
• Located in Kunak, Sabah
• Generation Capacity of 14 MW
(10 MW to be sold to SESB)
• Fuel by oil palm residues (EFB, shells
and fibres)
• Commissioned in December 2004

Baharuddin Bin Ali
7th Asian School on Renewable Energy, Puri Pujangga UKM, Malaysia, 16th-20th June 2014
Biomass Potential in Malaysia
40
Location
Hectare under oil
palm cultivation
(2005)
Number of Palms
(at 136/Ha)
million
FFB delivered to
Mills
Million Tonnes
Sabah 1,081,102 147 25
Sarawak 405,729 55 6
Peninsula Malaysia 1,956,129 266 43
Total 3,450,960 468 74
Oil Palm planted areas and FFB production in 2005
By 2020 5,500,000 new acreage mainly in Sarawak & Sabah

Baharuddin Bin Ali
7th Asian School on Renewable Energy, Puri Pujangga UKM, Malaysia, 16th-20th June 2014
Biomass Potential in Malaysia
41
Biomass
Components
Quantity Available
million
tons(2005)
Energy Potential
(MWhr)
Empty fruit bunches
(EFB)17.0 At 9t/MWh = 1,900
Fibre 9.60
Shell 4.44
Wet shell 1.48 At 2t/MWh = 0.74
Oil Palm Biomass- Energy potential
Sources: MPOB, Malaysian Statistics of Oil Palm 2005

Baharuddin Bin Ali
7th Asian School on Renewable Energy, Puri Pujangga UKM, Malaysia, 16th-20th June 2014 42
Biomass Resource Potential for Malaysia
Renewable Energy Energy Value(RM mil per annum)
Forest residues 11,984
Oil palm biomass 6,379
Solar thermal 3,023
Mill residues 836
Hydro 506
Solar PV 378
Municipal Waste 190
Rice Husk 77
Landfill gas 4

Baharuddin Bin Ali
7th Asian School on Renewable Energy, Puri Pujangga UKM, Malaysia, 16th-20th June 2014
Malaysian Gov’t Initiatives in promoting Renewable Resources
43
Type Energy ResourceApproved
Application
Generation
Capacity (MW)
Grid
Connected
Capacity (MW)
Biomass Empty Fruit Bunches 22 200.5 165.9
Wood Residues 1 6.6 6.6
Rice Husk 2 12.0 12.0
Municipal Solid Waste 1 5.0 5.0
Mix Fuels 3 19.2 19.2
Landfill Gas 5 10.2 10.0
Mini-hydro 26 99.2 97.4
Wind and
Solar0 0 0.0
Total 60 352.70 316.1
Sources: Hashim, Mazlina, 2005
As of August 2004 , SREP Projects Approved by SCORE stands at 60

Baharuddin Bin Ali
7th Asian School on Renewable Energy, Puri Pujangga UKM, Malaysia, 16th-20th June 2014
Energy Content in Biomass
44
• The calorific value of a fuel is usually expressed as Higher Heating Value (HHV) and/or Lower Heating Value (LHV). The difference is caused by the heat of evaporation of the water formed from the hydrogen in the material and the moisture. The difference between the two heating values depends on the chemical composition of the fuel.
• The HHV correspond to the maximum potential energy released during complete oxidation of a unit of fuel. It includes the thermal energy recaptured by condensing and cooling all products of combustion.
• The LHV was created in the late 1800s when it became obvious that condensation of water vapour or sulfur oxide in smoke stacks lead to corrosion and destruction of exhaust systems. As it was technically impossible to condense flue gases of sulfur-rich coal, the heat below 150°C was considered of no practical use and therefore excluded from energy considerations.
• The most important property of biomass feedstocks with regard to combustion – and to the other thermo-chemical processes - is the moisture content, which influences the energy content of the fuel.
• the evolution of the lower heating value (LHV, in MJ/kg) of wood as a function of the moisture content.

Baharuddin Bin Ali
7th Asian School on Renewable Energy, Puri Pujangga UKM, Malaysia, 16th-20th June 2014
Moisture Content For Selected Biomass Resources
45
Biomass resource
Moisture content
Wt % (wb)
Industrial fresh wood chips and sawdust
40 – 60
Industrial dry wood chips and sawdust
10 – 20
Fresh forest wood chips 40 – 60
Chips from wood stored andair-dried several months
30 – 40
Waste wood 10 – 30
Dry straw 15

Baharuddin Bin Ali
7th Asian School on Renewable Energy, Puri Pujangga UKM, Malaysia, 16th-20th June 2014
Some typical characteristics of biomass fuels compared to oil and coal
46
• Biomass resources include a wide variety of materials diverse in both physical and chemical properties. These variations may be critical for the final performance of the system. Some advanced applications require fairly narrow specifications for moisture, ash content, ash composition. Both the physical and chemical characteristics vary significantly within and between the different biomass raw materials.
• However, biomass feedstocks are more uniform for some of their properties compared with competing feedstocks such as coal or petroleum.
• Coals show gross heating value ranges from 20 - 30 GJ/ton. • Nearly all kinds of biomass feedstocks destined for combustion fall in the range 15-19 GJ/ton for their
LHV, (most woody materials are 18-19 GJ/tonne), (most agricultural residues are in the region of 15-17 GJ/ton).
Typical characteristics GJ/t toe/t kg/m³ GJ/m³
Volume oil equivalent (m³)Fuel
Fuel oil 41,9 1,00 950 39,8 1,0Coal 25,0 0,60 1000 25,0 1,6Pellets 8% moist. 17,5 0,42 650 11,4 3,5Pile wood (stacked, 50%) 9,5 0,23 600 5,7 7,0Industrial softwood chips 50% moist. 9,5 0,23 320 3,0 13,1Industrial softwood chips 20% moist. 15,2 0,36 210 3,2 12,5Forest softwood chips 30% moist. 13,3 0,32 250 3,3 12,0Forest hardwood chips 30% moist. 13,3 0,32 320 4,3 9,3Straw chopped 15% moist. 14,5 0,35 60 0,9 45,9Straw big bales 15% moist. 14,5 0,35 140 2,0 19,7

Baharuddin Bin Ali
7th Asian School on Renewable Energy, Puri Pujangga UKM, Malaysia, 16th-20th June 2014
Volume (m³) required to substitute 1 m³ of oil by some other fuels
47

Baharuddin Bin Ali
7th Asian School on Renewable Energy, Puri Pujangga UKM, Malaysia, 16th-20th June 2014
What is Modern Bioenergy?
48
• Bioenergy is energy of biological and renewable origin, normally derived from purpose-grown energy crops or by-products of agriculture.
• Examples of bioenergy resources are wood, straw, bagasseand organic waste.
• The term bioenergy encompasses the overall technical means through which biomass is produced, converted and used.
• Modern bio-energy refers to some technological advances in biomass conversion combined with significant changes in energy markets that allow exploring an increased contribution of biomass to our energy needs, whether throughout traditional and emerging technological areas (e.g. from combustion to liquid biofuels).

Baharuddin Bin Ali
7th Asian School on Renewable Energy, Puri Pujangga UKM, Malaysia, 16th-20th June 2014
The Range Of Costs For Different Fossil And Renewable Technologies And Fuels
49
• Biomass is the cheapest of the renewable energies for electricity production.
• Biomass is present almost everywhere, indigenous energy source generation of electricity.
• The figures in blue, represent the CO2 emissions from each fuel.
• Biomass is a CO2 saver as it emits only 30 kg of CO2 equiv/MWh (fossil fuels : range 400 - 800 kg of CO2
equiv/MWh).• Subsidies are unfairly supporting
high carbon emitters, thus limiting the growth of renewable energies. Removal of such subsidies seems unlikely as this will only increase electricity prices.
• Gradual reduction in these subsidies should lead to an increase in low carbon technology markets.
Subsidies NOT shown

Baharuddin Bin Ali
7th Asian School on Renewable Energy, Puri Pujangga UKM, Malaysia, 16th-20th June 2014
Bioenergy Key Drivers And Advantages
50
Some bioenergy key drivers consist in its contribution to:• the reduction of energy dependency on energy imports and
thus, the increased security of supply • the climate change mitigation (bioenergy use decrease net
greenhouse gas emissions and some other noxious gas emissions compared to fossil fuels and the fight against desertification
• stable employment opportunities in rural areas and among small and medium sized enterprises; this in turn fosters regional development, achieving greater social and economic cohesion at community level.

Baharuddin Bin Ali
7th Asian School on Renewable Energy, Puri Pujangga UKM, Malaysia, 16th-20th June 2014
Other Important Advantages Of Bioenergy
51
• Widespread resources are available • Biomass resources show a considerable potential in the long
term, if residues are properly valorised and dedicated energy crops are grown. Bioenergy makes valuable use of some wastes, avoiding their pollution and cost of disposal
• Biomass has the capacity to penetrate every energy sector: heating, power and transport.
• Bio-fuels can be stored easily and bioenergy produced when needed
• Bioenergy creates worldwide business opportunities• Biofuels are generally bio-degradable and non toxic, which is
important when accident occur.

Baharuddin Bin Ali
7th Asian School on Renewable Energy, Puri Pujangga UKM, Malaysia, 16th-20th June 2014
Barriers To Bioenergy, Specific Actions Against Them And Driving Forces To Support These Activities
52
Barriers to bioenergy expansion• costs of bioenergy technologies and
resources • competitiveness strongly depends
on the amount of externalities included in the cost calculations
• resource potentials and distributions
• lack of organisation in supply structures for the supply of biofuels
• local land-use and environmental aspects in the developing countries
• administrative and legislative bottlenecks.
Overcoming these barriers• improving the cost-effectiveness of
conversion technologies; • developing and implementing
modern, integrated bioenergysystems
• it took farmers thousands of years to develop plants that are especially suitable for food. There is therefore a considerable potential in developing dedicated energy crops productivity
• establishing bioenergy markets and developing bioenergy logistics (transport and delivery bioenergyresources and products
• valuing of the environmental benefits for society e.g. on carbon balance.

Baharuddin Bin Ali
7th Asian School on Renewable Energy, Puri Pujangga UKM, Malaysia, 16th-20th June 2014
Conversion Routes to Bioenergy
53
• The energy available in biomass may be used either by direct use as in combustion, or by initial upgrading into more valuable and useful fuels such as charcoal, liquid fuels, producer gas or biogas.
• Thus, biomass conversion technologies can be separated into 4 basic categories: • direct combustion, • thermo-chemical
conversion processes (pyrolysis, gasification),
• bio-chemical processes (anaerobic digestion, fermentation) and
• physico-chemical processes (the route to biodiesel).

Baharuddin Bin Ali
7th Asian School on Renewable Energy, Puri Pujangga UKM, Malaysia, 16th-20th June 2014 54
Stage Emerging technologies Future technologies
Biomass resources
• New energy crops• New oilseed crops• Bio-waste management
• Bio-engineering of new energy plants• Development of low-energy agricultural production systems• Aquatic biomass (algae)• IT methods in land and biological systems management
Supply systems
• Use of new agro-machinery• Biomass densification• Other simple pretreatments (e.g. leaching)• Logistics of supply chains
• Biorefining• Biotech-based quality monitoring throughout the whole
procurement chain• IT tools for supply chain modelling and optimal management
Conversion
• Advanced combustion• Co-combustion• Gasification• Pyrolysis• Bioethanol from sugar and starch• Bioethanol from lignocellulosics• Biodiesel from vegetable oils• Advanced anaerobic digestion
• Biohydrogen (hydrogen from bioconversion of biomass) • Plasma-based conversions• Advanced bioconversion schemes• Other novel conversion pathways (e.g. electrochemical)• Novel schemes for down-stream processing
(e.g. of pyrolytic liquids or synthetic FT-biofuels)
End products
• Bioheat• Bioelectricity• Transport biofuels• Upgraded solid biofuels (pellets)
• Use of hydrogen in fuel cells• Use of FT-biofuels in new motor-concepts e. g. CCS
(Combined Combustion Systems)• New bio-products (biotech)• Complex, multi-product systems (IT)• CO2 sequestration; other new end-use “cultures”
(e.g., user-friendliness, “closed cycle”)
System integration
• Normalisation and standards• Best practices• Economic/ecological modelling and optimisation
• IT-based management• Socio-technical and cultural design of applications• Sustainability based on global as well as local effects

Baharuddin Bin Ali
7th Asian School on Renewable Energy, Puri Pujangga UKM, Malaysia, 16th-20th June 2014
Biofuels Procurement / Production Costs
55
EU-15 10 NMS + BG + RO
€/GJ €/toe €/GJ €/toe
TradablesForestry by-products 2.4 100 2.1 88
Wood fuels 4.3 180 2.7 113Dry agricultural residues
3.0 126 2.1 88
Solid industrial residues 1.6 67 2.5 105
Solid energy crops 5.4 226 4.4 184
Imported biofuels 6 251 6 251
Transport fuelsBiodiesel 23 ≈ 960 23 ≈ 960
Bio-ethanol 29 ≈ 1200 29 ≈ 1200
• On average, supply costs of tradable biomass fuels in the EU-15 vary from 1.6 EUR/GJ (solid industrial residues) to 5.4 EUR/GJ (solid energy crops).
• On average, the supply costs of solid energy crops are close to those of imported biomass, which was taken at a standard level of 6 EUR/GJ.
• Single average supply costs of 23-29 EUR/GJ were determined for the refined bio-transport fuels bio-ethanol (from sugar beet and wheat) and biodiesel (from rape and sunflower seed).
Average supply costs of tradable biomass and crops for transport fuels (EUR/GJ).

Baharuddin Bin Ali
7th Asian School on Renewable Energy, Puri Pujangga UKM, Malaysia, 16th-20th June 2014
Overview of investment costs and production costs of biofuels
56
Investment costs[€/kWhr]
Productions costs[€/litre]
Productions costs[€/GJ]
short term
Longterm
short term
long term
short term
long term
Ethanol (sugar crops) 290 170 0.32 - 0.54 15 - 25
Ethanol (wood) 350 180 0.11 - 0.32 5 - 15
RME 150 110 0.50 0.20 15 6
Methanol 700 530 0.14 - 0.20 0.10 9 - 13 7
DME 0.27 14
Fischer-Tropsch diesel 720-770 500-540 0.31 - 0.45 9 - 13
Pyrolysis oil 1.000 790 0.06 - 0.25 4 - 18
HTU diesel 535 400 0.16 - 0.24 5 - 7

Baharuddin Bin Ali
7th Asian School on Renewable Energy, Puri Pujangga UKM, Malaysia, 16th-20th June 2014
Competitiveness in the electricity market .Capital costs & efficiencies of principal bioelectricity & competing conversion
technologies
57
TechnologyCapital cost in
2002(EUR/kWe)
Capital cost in 2020
(EUR/kWe)
Electrical efficiency
(%)
Cost of electricity in
2020 **(EUR/MWh)
Existing coal – co-firing 250 250 35 - 40 24 – 47Existing coal and natural gas
combined cycle – parallel firing700 600 35 - 40 34 – 59
Grate / fluid bed boiler + steam turbine*
1500 - 2500 1500 – 2500 20 - 40 57 - 140
Gasification + diesel engine or gas turbine - (50 kWe – 30 MW)*
1500 - 2500 1000 - 2000 20 – 30 50 - 120
Gasification + combined cycle -(30 – 100 MWe)
5000 - 6000 1500 - 2500 40 – 50 53 - 100
Wet biomass digestion + engine or turbine
2000 - 5000 2000 - 5000 25 - 35 52 - 130
Landfill gas + engine or turbine 1000 - 1200 1000 25 - 35 26
Pulverised coal – 500 MWe 1300 1300 35 - 40 48 – 50Natural gas combined cycle – 500
MWe500 500 50 - 55 23 - 35
• Larger scale systems will be characterised by the lowest cost and higher efficiency in the value ranges** 15% discount rate; biomass fuel cost between 7,2 and 14,4 EUR/MWh except for digestion and landfill
gas plants where fuel cost assumed to be zero; coal cost 5,8 EUR/MWh; natural gas cost between 5,4 and 10,8 EUR/MWh. The cost is calculated for electricity supply only and cogeneration could reduce the electricity cost significantly.
Source: Bauen et. al,2003

Baharuddin Bin Ali
7th Asian School on Renewable Energy, Puri Pujangga UKM, Malaysia, 16th-20th June 2014
Environmental benefits of Bioenergy
58
+ avoided mining of fossil resources
– emission from biomass production
+ avoided fossil fuel transport (from producer to user)
– emission from biomass fuel transport (from producer to user)
+ avoided fossil fuel utilisation
• One of the key drivers to bioenergy deployment is its positive environmental benefit, in particular regarding the global balance of green house gas (GHG) emissions.
• IEA Bioenergy Task 38 (Greenhouse Gas Balances of Biomass and BioenergySystems) investigates all processes involved in the use of bioenergy systems on a full fuel-cycle basis with the aim of establishing overall GHG balances.
• This is not a trivial matter, because biomass production and use are not entirely GHG neutral. In general terms, the GHG emission reduction as a result of employing biomass for energy, read as follows:
Budget breakdown of GHG emission savings
Baharuddin Bin Ali
7th Asian School on Renewable Energy, Puri Pujangga UKM, Malaysia, 16th-20th June 2014
Environmental Benefits
59
• The real gains are made with that of avoided emissions from the use of fossil fuels. The balance of the other four matters is not neutral, and in fact slightly negative for the biomass system. Two GHG emission types are omitted from the above balance: the negative emission (capture) as a result of biomass growth, and the positive emission as a result from using the biomass fuel. They are considered to cancel out.
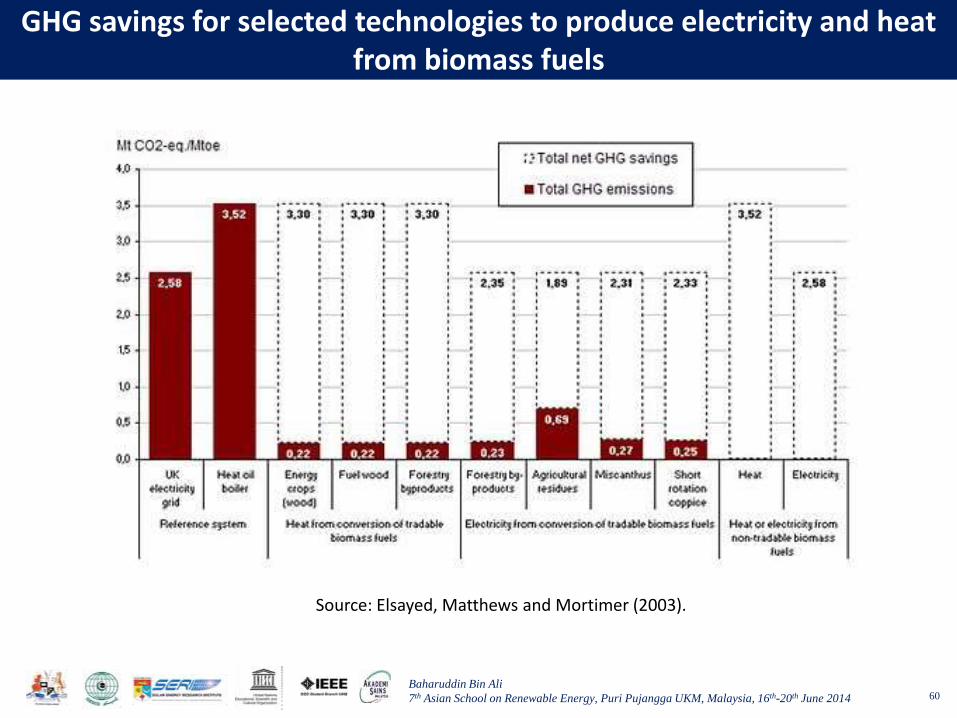
• GHG emission balances for biomass-fuelled electricity and heat applicationsGHG balances for a wide range of technologies to produce electricity and heat were prepared by Elsayed, Matthews and Mortimer (2003). System boundaries encompassed the entire chain from fuel production to end-use.
• Some biomass systems show net GHG emissions savings of more than 40% of the substituted fossil alternatives, while some others only score 4%.
• Thus, the span of the environmental benefit is wide, and the effective value will depend on the particular application situation (technology, scale etc).
• The total GHG emissions from contaminated biomass fuels (non-tradables) are set at 0, since these fuels are available anyway. There existence cannot be avoided, and all GHG emissions associated with their production should be allocated to the products from which they are the unavoidable result.
Baharuddin Bin Ali
7th Asian School on Renewable Energy, Puri Pujangga UKM, Malaysia, 16th-20th June 2014
GHG savings for selected technologies to produce electricity and heat from biomass fuels
60
Source: Elsayed, Matthews and Mortimer (2003).

Baharuddin Bin Ali
7th Asian School on Renewable Energy, Puri Pujangga UKM, Malaysia, 16th-20th June 2014
GHG Emission Balances Of Selected Bio-transport Fuels
61
• For an assessment of GHG emission reduction that result from replacing fossil transport fuels by biofuels, the entire life cycle of the respective fuels is usually considered from well to wheel. A complete life cycle analysis (LCA) of emissions takes into account • the direct emissions from vehicles and also those associated with the
fuel’s production process, (extraction, production, transport, processing and distribution).
• Ranges in data result from local variations between fuel routes and differences in technology, which may occur at all stages of the well-to-wheel fuel chain.
• The pivots indicate the uncertainty related to the used data.
• The substitution of biodiesel for petrol results in a total GHG emission reduction of 45-80%. If replacing fossil diesel fuel, this emission reduction is smaller, because diesel shows lower CO2-equivalent well-to-wheel emissions than petrol. The range of ethanol-starch is quite broad, which can be partly explained by differences in crop (corn, sugar beet, molasses), and differences in technology.

Baharuddin Bin Ali
7th Asian School on Renewable Energy, Puri Pujangga UKM, Malaysia, 16th-20th June 2014
GHG Savings For Selected Bio-transport Fuels
62
Source: Elsayed, Matthews and Mortimer (2003)

Baharuddin Bin Ali
7th Asian School on Renewable Energy, Puri Pujangga UKM, Malaysia, 16th-20th June 2014
Global GHG Emission Savings
63
• From the White Paper issued in 1997, it appears that biomass would be the biggest contributor in absolute terms to the CO2 emissions reduction effort.
Estimated CO2 benefits from the increase of renewable energy in the EU primary energy supply
Additional capacity(1997-2010)
CO2 reduction(Mt CO2-eq./year)
Biomass 90 Mtoe 255
Wind 36 GW 72
Hydro 13 GW 48
Solar collectors 94 Mio m2 19
Geothermal 2.5 GW 5
Photovoltaic 3 GWp 3

Baharuddin Bin Ali
7th Asian School on Renewable Energy, Puri Pujangga UKM, Malaysia, 16th-20th June 2014
Employment Benefits
64
• Bioenergy is a decentralised energy option whose implementation presents positive impacts on rural development by creating business and employment opportunities. Jobs are created all along the bioenergy chain, from biomass production or procurement, to its transport, conversion, distribution and marketing.
• Bioenergy appears as the most labour-intensive sector among renewables. The jobs created range from manual ones to specialised engineering and administration positions.
• Through liquid biofuels, bioenergy can also offer agriculture an opportunity to diversify its market outcomes.
• From the perspective of bioenergy projects, the term employment usually includes three different categories. Direct employment results from operation, construction and production. In the case of bioenergy systems, this refers to the total labour necessary for crop production, construction, operation and maintenance of conversion plants, and for the transportation of biomass.
• Indirect employment is jobs generated within the economy as a result of expenditures related to biomass fuel cycles. Indirect employment results from all activities connected, but not directly related, such as supporting industries, services and similar.
• The higher purchasing power, due to increased earnings from direct and indirect jobs may also create opportunities for new secondary jobs, which may attract people to stay or even to move in. These latter effects are referred to as induced employment.
• The main issue is whether the bioenergy project will provide earnings that are high enough for long enough to make it worthwhile to mobilise local resources for implementation.

Baharuddin Bin Ali
7th Asian School on Renewable Energy, Puri Pujangga UKM, Malaysia, 16th-20th June 2014
An estimate of the employment effect of forest chips production in Finland by 2010
65
ProductProduction
1000 m3
Man.years/1000 m3
Man.years/annum
Small tree chips
- whole tree chips, mechanised cutting 600 0.60 360
- whole tree chips, manual cutting 200 1.20 240
- stemwood chips, self-employed forest owners
200 2.00 400
Logging residues chips 2500 0.30 750
Stump chips 1500 0.35 525
Forest chips, total 5000 0.45 2275

Baharuddin Bin Ali
7th Asian School on Renewable Energy, Puri Pujangga UKM, Malaysia, 16th-20th June 2014
Employment per PJ Annual Fuel Consumption Among Selected European Projects
66
Biomass source/ technology
MWth
Direct jobs
Indirect jobs
Induced jobs
Total jobs
Multiplier Country
SRC, gasifier 2 51 11 36 98 1.25 The UK
Miscanthus, heat 0.13 321 0 214 534 1.21 Belgium
Forest residues, CHP 40 52 33 30 115 1.30 France
Triticale, proc. Heat 2 134 60 28 222 1.33 Germany
Artichoke, heat 1 269 19 93 380 1.50 Greece
SRC, gasifier 5 36 21 23 80 1.29 Ireland
Ind. Residues, CHP 17 41 11 13 65 1.46 Italy
Waste etc. CHP 5 13 2 27 42 1.18 Netherlands
Logging Residues, heat
10 52 2 21 76 1.26 Sweden

Baharuddin Bin Ali
7th Asian School on Renewable Energy, Puri Pujangga UKM, Malaysia, 16th-20th June 2014
Impact Of Renewable Technologies On Employment In The European Union
67
Technology 2005 2010 2020
Bioenergy 449,928 642,683 838,780
- Energy crops and residues, forest residues
307,641 416,538 515,364
- Bio-anaerobic 37,223 70,168 120,285
- Bio-thermal 94,164 123,608 154,422
- Liquid biofuels 10,900 32,369 48,709Solar thermal heat 4590 7390 14, 311
PV 479 -1769 10,231
Solar thermal electric 593 649 621Wind onshore 8690 20,822 35,211Wind offshore 530 -7968 -6584
Small hydro -11,391 -995 7977
TOTAL 453,418 660,812 900,546
Source: IEA, 2003 (from the ECOTEC study “The impact of renewables on employment and economic growth. Directorate General for Energy, European Commission, 1999.)
• The use of renewable energy technologies will more than double by 2020 and will lead to the creation of about 900,000 jobs by 2020.
• More than 90% of these jobs (approximately 840,000) will be in the bioenergy sector and 500,000 of them in the agricultural industry in order to provide primary biomass fuels.
Impact of renewable technologies on employment in the European Union (new net jobs FTE employment relative to base in 1995)

Baharuddin Bin Ali
7th Asian School on Renewable Energy, Puri Pujangga UKM, Malaysia, 16th-20th June 2014
Bioenergy employment in the EU
68
Bioenergy employment in the EU (new net jobs FTE employment relative to base in 1995

Baharuddin Bin Ali
7th Asian School on Renewable Energy, Puri Pujangga UKM, Malaysia, 16th-20th June 2014
Bioenergy employment in the EU
69
• There is quite a wide consensus that, over the coming decades, modern biofuels will provide a substantial source of alternative energy. Nowadays, biomass already provides approximately 11-14% of the world’s primary energy consumption (data vary according sources). There are significant differences between industrialised and developing countries, as shown in the figure below. In particular, in many developing countries bioenergy is the main energy source.
Bioenergy contribution worldwide as a fraction of total energy consumption

Baharuddin Bin Ali
7th Asian School on Renewable Energy, Puri Pujangga UKM, Malaysia, 16th-20th June 2014
Biomass in Relatively Poor Countries
70
• For 75% of the world’s population living in developing countries, biomass is the most important source of energy.
• With increases in population and per capita demand, and depletion of fossil-fuel resources, the demand for biomass is expected to increase rapidly in developing countries.
• On average, biomass produces 35 % of the primary energy in developing countries, but many sub-Saharan countries depend on biomass for up to 90 %.
• Biomass will remain an important global energy source in developing countries well into the next century.
• Despite its wide use in developing countries, biomass is used with very low efficiency applications.
• The overall efficiency in traditional use (e.g. cooking stoves) is only about 5 - 15 %, and biomass is often less convenient to use compared with fossil fuels.
• It can also be a health hazard in some circumstances. For example, cooking stoves can release particulates, carbon monoxide (CO), nitrous oxides (NOx) and other organic compounds in poorly ventilated homes, often far exceeding the recommended World Health Organisation levels.
• Furthermore, inefficient biomass utilisation is often associated with the increasing scarcity of hand-gathered wood, nutrient depletion, and the problems of deforestation and desertification.

Baharuddin Bin Ali
7th Asian School on Renewable Energy, Puri Pujangga UKM, Malaysia, 16th-20th June 2014
Bio-energy in the EU
71
Bio-energy in the EU• In the EU, renewable energy sources provide approximately 6% of
the total gross inland energy consumption (5.7% in 2002 for the EU-25).
EU-25 gross inland consumption by fuel

Baharuddin Bin Ali
7th Asian School on Renewable Energy, Puri Pujangga UKM, Malaysia, 16th-20th June 2014
Contribution of RES to the EU Primary Energy Supply
72
EU-15 EU-25
Mtoe % Mtoe %
Renewables 85,3 100% 94,9 100%
Biomass 53,9 63% 62,1 65%
Hydro 24,2 28% 25,6 27%
Wind 3,1 4% 3,1 3%
Solar 0,5 1% 0,5 1%
Geothermal 3,7 4% 3,7 4%
• Bioenergy contributes about 64% of all RES primary energy requirements of the European Union, about 98% of RES heat and 9% of RES electricity. Bioenergy use in EU countries varies from 1% in the UK to 20% in Finland.
Contribution of RES to the EU primary energy supply (2002)
Source: EUROSTAT

Baharuddin Bin Ali
7th Asian School on Renewable Energy, Puri Pujangga UKM, Malaysia, 16th-20th June 2014
Contribution of RES to the EU Primary Energy Supply
73

Baharuddin Bin Ali
7th Asian School on Renewable Energy, Puri Pujangga UKM, Malaysia, 16th-20th June 2014
Biomass Resources Assessments
74
Biomass resources assessments• Biomass resources and potential are considerable. Estimations vary
according to the calculation methodology and the assumptions made (e.g. land use patterns for food production, agricultural management systems, wood demand evolution, production technologies used, natural forest growth etc). It is also common to distinguish several potentials: • Theoretical potential: the theoretical maximum potential is
limited by factors such as the physical or biological barriers that cannot be altered given the current state of science.
• Technical potential: the potential that is limited by the technology used and the natural circumstances.
• Economic potential: the technical potential that can be produced at economically profitable levels.
• Ecological potential: the potential that takes into account ecological criteria, e.g. loss of biodiversity or soil erosion.

Baharuddin Bin Ali
7th Asian School on Renewable Energy, Puri Pujangga UKM, Malaysia, 16th-20th June 2014
Biomass resources : World Bioenergy Potential
75
• Bioenergy could in principle provide all the world’s energy requirements, but its real technical and economic potential is much lower 10%.
• The WEC Survey of Energy Resources (2001) estimates that bioenergycould theoretically provide 2900 EJ/y, but that technical and economic factors limit its current practical potential to just 270 EJ/y.
• Table B1 shows the potential and current use of bioenergy by region. Even with the current resource base, the practical potential of bioenergy is much greater than its current exploitation.
• Obstacles to greater use of bioenergy include poor matching between demand and resources, and high costs compared to other energy sources.
• Projections by the WEC, WEA and IPCC estimate that by 2050 bioenergy could supply a maximum of 250–450 EJ/y, representing around 25% of global final energy demand.
• The technological potential of bioenergy at 30% of global energy demand.

Baharuddin Bin Ali
7th Asian School on Renewable Energy, Puri Pujangga UKM, Malaysia, 16th-20th June 2014
Current Technical Potentials And Biomass Use Compared To Primary Energy Consumption (PEC) From Fossil Fuels & Hydro
76
PEC fossil fuels + hydro
Bioenergyuse
Bioenergypotential
Use / potential
Use / PEC
Potential / PEC
(EJ/year) %
North-America 104.3 3.1 19.9 16% 3% 19%
Latin-America & Caribbean 15.1 2.6 21.5 12% 17% 142%
Asia * 96.8 23.2 21.4 108% 24% 22%
Africa 11 8.3 21.4 39% 75% 195%
Europe 74.8 2 8.9 22% 3% 12%
Former USSR 37.5 0.5 10 5% 1% 27%
Total 339.5 39.7 103.1 39% 12% 30%
Current technical potentials and biomass use compared to primary energy consumption (PEC) from fossil fuels & hydro
• In Asia the actual use of biomass is higher than the potential. The value for potential and actual use refer to sustainable use, indicating that in the case of Asia the actual use is not sustainable, i.e. it can not be sustained over a long period, due to e.g. limited land availability
Source: Kaltschmitt, 2001

Baharuddin Bin Ali
7th Asian School on Renewable Energy, Puri Pujangga UKM, Malaysia, 16th-20th June 2014
Current Technical Potentials And Biomass Use Compared To Primary Energy Consumption (PEC) From Fossil Fuels & Hydro
77

Baharuddin Bin Ali
7th Asian School on Renewable Energy, Puri Pujangga UKM, Malaysia, 16th-20th June 2014
Estimation of Global Conventional And Biomass Resources
78
Energy category Million toe EJOil statistics (ENI, 2003-2004)Annual oil extraction 3850 161.2World oil reserves 149600 6263.5World energy statistics (IEA, 2003)World annual primary energy supply 10376 434.4
- Oil 3715 155.5- Coal 2379 99.6- Natural gas 2169 90.8- Renewables & Waste 1121 46.9- Nuclear 695 29.1- Hydro 228 9.5- Other (includes geothermal, solar, wind, etc.) 52 2.2
EUROSTAT, EU-25 Energy statistics (2002)Annual gross inland consumption (GIC) 1680 70.3Share of renewable energy sources in GIC 95 4.0Share of bioenergy in GIC 62 2.6EU-25 (+Bulgaria, +Romania) biomass available potential (BTG, 2004)Biomass available potential by 2010 183 7.7Biomass available potential by 2020 210 8.8

Baharuddin Bin Ali
7th Asian School on Renewable Energy, Puri Pujangga UKM, Malaysia, 16th-20th June 2014
Estimation of Global Conventional And Biomass Resources
79
Energy category Million toe EJEUBIA2020 biomass potential in the EU-25 200 8.42050 biomass potential in the EU-25 400 16.7EU-25 forest biomass, crop residues and energy crops (Ericsson, Nilsson, 2004)Scenario 1 (short term, 10-20 years) 105 4.4Scenario 2a (medium term, 20-40 years; low harvest) 184 7.7Scenario 2b(medium term, 20-40 years; high harvest) 220 9.2Scenario 3a (long term, >40 years; low harvest) 375 15.7Scenario 3b (long term, >40 years; high harvest) 451 18.9World bioenergy potential from forestry by 2050 (Smeets et al., 2004)Low demand 764 32.0Medium demand 1027 43.0High demand 1242 52.0Bioenergy technical production potentials from agricultural residues and bioenergy production on surplus agricultural lands to 2050 (Smeets et al., 2004)World min. 6520 273.0World max. 35134 1471.0West Europe min. 191 8.0West Europe max. 597 25.0East Europe min. 96 4.0East Europe max. 693 29.0

Baharuddin Bin Ali
7th Asian School on Renewable Energy, Puri Pujangga UKM, Malaysia, 16th-20th June 2014
Availability of bioenergy in Europe in 2000, 2010 and 2020 (Mtoe/yr)
80
Source: BTG, 2004EU-15 10 NMS + BG, RO
2000 2010 2020 2000 2010 2020
Tradables: 86 93 101 21 22 24
Forestry by products & (refined) wood fuels 34 38 42 7.9 8.7 9.6Solid agricultural residues 25 28 31 7.3 8.1 8.9Solid industrial residues 11 12 13 2.1 2.4 2.6Solid energy crops* 16 16 16 3.2 3.2 3.2
Non-tradeables: 40 53 66 7.1 9.4 13Wet manure 11 12 13 3.4 3.8 4.2Organic waste- Biodegradable municipal waste 6.7 17 28 0.5 2.5 5.7- Demolition wood 5.3 5.8 6.4 0.6 0.6 0.7- Dry manure 1.9 2 2.3 0.4 0.4 0.5- Black liquor 9.9 11 12 0.7 0.8 0.9Sewage gas 1.7 1.9 2.1 0.4 0.4 0.5Landfill gas 4.0 3.8 2.1 1.1 0.9 0.4
Transport fuels 4.9 4.9 4.9 0.8 0.8 0.8Bio-ethanol* 3.7 3.7 3.7 0.5 0.5 0.5Bio-diesel* 1.2 1.2 1.2 0.3 0.3 0.3
Total bio-energy 131 151 172 28 32 38
*: It is assumed that 50% of the set-aside area is available for solid energy crops and 25% each for liquid bio-fuel (bio-ethanol and biodiesel) cropsNote the growth in the availability of organic wastes, which results from the EU implementation of the EC directive on the landfill of waste (1999/31/EC). This directive discourages the land filling of biodegradable waste and prescribes a time schedule to reduce this waste disposal to a specific level.

Baharuddin Bin Ali
7th Asian School on Renewable Energy, Puri Pujangga UKM, Malaysia, 16th-20th June 2014
Trade of Biofuels
81
• The most critical non-technical barrier to bioenergy is the availability of resources to ensure long-term supply at a reasonable cost. International trade of solid biomass fuels and this supply chain is an important element in the development of bioenergy on a global scale.
• Biofuels are usually produced and used locally. This pattern has changed in northern Europe due to industrial and large scale uses (e.g. in district heating systems) of different forms of biofuels.
• Today, solid biofuels like wood residues, pellets and wood chips are traded in Europe and have reached 50 PJ/a. International biomass trade can provide biofuels at lower prices. The largest volumes of biomass are traded from the Baltic countries (Estonia, Latvia, Lithuania) to the Nordic countries (especially Sweden, Denmark, Finland). Some are also traded from Finland to other Nordic countries, and between neighbouring countries in Central Europe, especially the Netherlands, Germany, Austria, Slovenia and Italy. The traded biofuel is most often of refined wood fuels (pellets and briquettes) and industrial by-products (sawdust, chips), in Central Europe also wood waste.
• Bio-ethanol has also become a global commodity. Since May 2004, futures in bioethanol are traded at the New York stock exchange.
• Land availability for fuel crops in Europe is limited. From the current 6 million ha of set aside in the EU-15, approximately 7 Mtoe of RME could be produced, or 8.5 – 16 Mtoe of bio-ethanol (respectively from wheat or sugar beet). This corresponds to 2.1 – 4.7% of the fuel used for transport (338 Mtoe in 2002).
• Brasil could have a production potential in the region of 100 Mtoe/year by 2020. Therefore, biofuels use in the EU is likely to be supported by global trade. Tropical countries are the most interesting stakeholders in biofuels due to their favourable production conditions. Moreover, their experience (e.g. Brasil) can be instrumental for biofuel development in the European context.
Baharuddin Bin Ali
7th Asian School on Renewable Energy, Puri Pujangga UKM, Malaysia, 16th-20th June 2014
Research & Development in Biofuels and Bioenergy
82

Baharuddin Bin Ali
7th Asian School on Renewable Energy, Puri Pujangga UKM, Malaysia, 16th-20th June 2014
R & D Orentations
83
• In order to foster the development of sustainable biomass-based energy technologies, different fields of research must be integrated.

Baharuddin Bin Ali
7th Asian School on Renewable Energy, Puri Pujangga UKM, Malaysia, 16th-20th June 2014
R&D and Policy Needs for Achieving Vision Goals
84

Baharuddin Bin Ali
7th Asian School on Renewable Energy, Puri Pujangga UKM, Malaysia, 16th-20th June 2014
Crosscutting Impacts of Feedstock Production R&D
85

Baharuddin Bin Ali
7th Asian School on Renewable Energy, Puri Pujangga UKM, Malaysia, 16th-20th June 2014
R&D : Plant Biochemistry & Enzymes
86

Baharuddin Bin Ali
7th Asian School on Renewable Energy, Puri Pujangga UKM, Malaysia, 16th-20th June 2014
R&D : Chemical & Biological Pathways
87

Baharuddin Bin Ali
7th Asian School on Renewable Energy, Puri Pujangga UKM, Malaysia, 16th-20th June 2014
R&D : Agronomic Pathways
88

Baharuddin Bin Ali
7th Asian School on Renewable Energy, Puri Pujangga UKM, Malaysia, 16th-20th June 2014
R&D : Feedstock Logistics & Handling Pathways
89

Baharuddin Bin Ali
7th Asian School on Renewable Energy, Puri Pujangga UKM, Malaysia, 16th-20th June 2014
Crosscutting Benefits of Processing & Conversion
90

Baharuddin Bin Ali
7th Asian School on Renewable Energy, Puri Pujangga UKM, Malaysia, 16th-20th June 2014
R&D : Thermochemical Conversion
91

Baharuddin Bin Ali
7th Asian School on Renewable Energy, Puri Pujangga UKM, Malaysia, 16th-20th June 2014
R&D : Bioconversion
92

Baharuddin Bin Ali
7th Asian School on Renewable Energy, Puri Pujangga UKM, Malaysia, 16th-20th June 2014
R&D : Biorefinery
93
Baharuddin Bin Ali
7th Asian School on Renewable Energy, Puri Pujangga UKM, Malaysia, 16th-20th June 2014
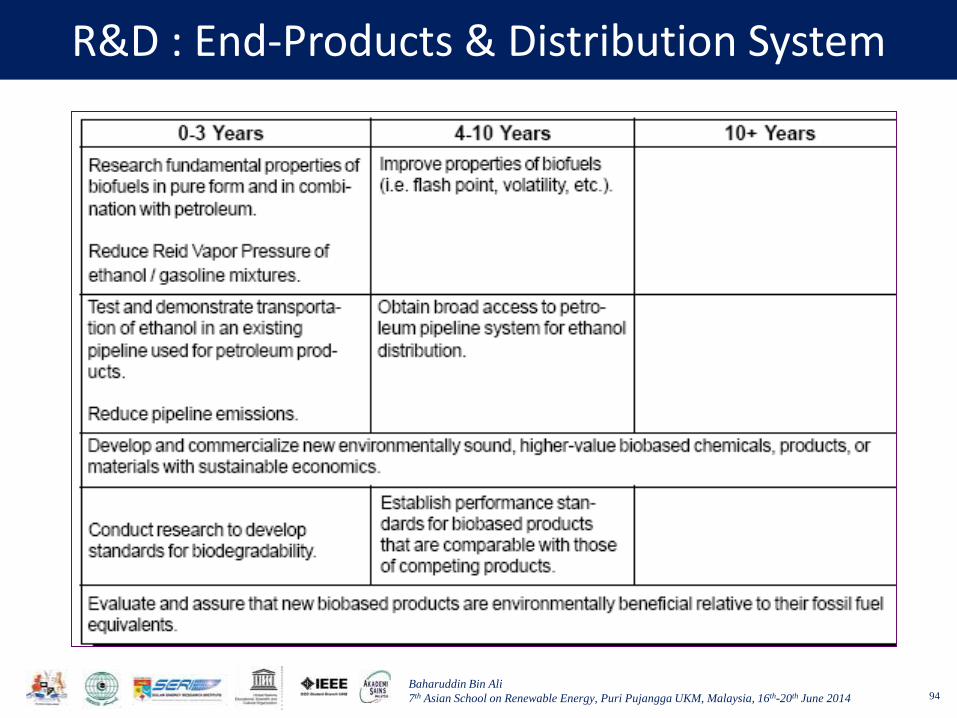
R&D : End-Products & Distribution System
94

Baharuddin Bin Ali
7th Asian School on Renewable Energy, Puri Pujangga UKM, Malaysia, 16th-20th June 2014
Quranic Inspiration
95
"The same Who produces for you fire out of the
green trees, when behold! Ye kindle therewith (your own fires)!
(Surah Yaasin : 80)

Baharuddin Bin Ali
7th Asian School on Renewable Energy, Puri Pujangga UKM, Malaysia, 16th-20th June 2014
Operational problems in biomass combustion
96
• Complete combustion produces minimum pollution and depends on the combustion chamber temperature, the turbulence of the burning gases, residence time and the excess O2 These parameters are governed by :• combustion technology (e.g. combustion chamber design, process control) • settings of the combustion (e.g. primary and secondary air ratio,
distribution of the air nozzles) • load condition (full- or part-load) • fuel characteristics (shape, size distribution, moisture content, ash content,
ash melting behaviour).• Biomass is difficult to handle and combust due to low energy density and
presence of inorganic constituents. • Some types of biomass contain significant amounts of chlorine, sulfur and
potassium. The salts, KCl and K2SO4, are quite volatile, and the release of these components may lead to heavy deposition on heat transfer surfaces, resulting in reduced heat transfer and enhanced corrosion rates. Severe deposits may interfere with operation and cause unscheduled shut downs.
• The release of alkali metals, chlorine and sulfur to the gas-phase may also lead to generation of significant amounts of aerosols (sub-micron particles) along with relatively high emissions of HCl and SO2.

Baharuddin Bin Ali
7th Asian School on Renewable Energy, Puri Pujangga UKM, Malaysia, 16th-20th June 2014
Operational problems in biomass combustion
97
• The nature and severity of the operational problems related to biomass depend on the choice of combustion technique. • In grate-fired units deposition and corrosion problems are the major concern. • In fluidized bed combustion the alkali metals in the biomass may facilitate agglomeration of
the bed material, causing serious problems for using this technology for herbaceous based biofuels. Fluidized bed combustors are frequently used for biomass (e.g. wood and waste material), circulating FBC are the preferred choice in larger units.
• Application of biomass in existing boilers with suspension- firing is considered an attractive alternative to burning biomass in grate-fired boilers.
• However, also for this technology the considerable chlorine and potassium content in some types of biomass (e.g. straw) may cause problems due to deposit formation, corrosion, and deactivation of catalysts for NO removal (SCR).
• Currently wood based bio-fuels are the only biomasses that can be co-fired with natural gas; the problems of deposition and corrosion prevent the use of herbaceous biomass. However, significant efforts are aimed at co-firing of herbaceous biomass together with coal on existing pulverized coal burners.
• For some problematic fuels, esp. straw a separate auxiliary boiler may be required. In addition to the concerns about to deposit formation, corrosion, and SCR catalyst deactivation, the addition of biomass in these coal units may impede the utilization of fly ash for cement production. In order to minimize these problems, various fuel pretreatment processes have been considered, including washing the straw with hot water or using a combination of pyrolysis and char treatment.

Baharuddin Bin Ali
7th Asian School on Renewable Energy, Puri Pujangga UKM, Malaysia, 16th-20th June 2014
Cogeneration
98
• Cogeneration is the combined production of electrical (or mechanical) and useful thermal energy from the same primary energy source.
• It encompasses a range of technologies, but always includes an electricity generator and a heat recovery system. Cogeneration is also known as combined heat and power (CHP).
• Comparison: • Conventional power generation, on
average, is only 35% efficient – up to 65% of the energy potential is released as waste heat.
• Combined cycle generation can improve efficiency to 55%, excluding losses for the transmission and distribution of electricity.
• Through the utilisation of the heat, the efficiency of cogeneration plant can reach 90% or more.

Baharuddin Bin Ali
7th Asian School on Renewable Energy, Puri Pujangga UKM, Malaysia, 16th-20th June 2014
Benefits of Co-generation
99
• Cogeneration installations are usually sited as near as possible to the place where the heat is consumed and, ideally, are built to a size to meet the heat demand. Otherwise an additional boiler will be necessary, and the environmental advantages will be partly hindered. This is the central and most fundamental principle cogeneration.
• The benefits of cogeneration are:• Increased efficiency of energy conversion and use, and thus large
cost savings, providing additional competitiveness for industrial and commercial users, and offering affordable heat for domestic users
• Lower emissions to the environment, in particular of CO2 • An opportunity to move towards more decentralised forms of
electricity generation, and to improve local and general security of supply

Baharuddin Bin Ali
7th Asian School on Renewable Energy, Puri Pujangga UKM, Malaysia, 16th-20th June 2014
Deployment of Cogeneration
100
• Cogeneration is an established technology. Its ability to provide a reliable and cost-effective supply of energy has been proven. Cogeneration is currently used on many thousands of sites throughout the EU, and supplied around 10% of both the electricity generated and heat demand in the EU-15 in 1999. The EU target is to reach 18% by 2010. The following table illustrates what this target could achieve in terms of CO2 emissions reduction. The results are different depending on the fuel being displaced:
Fuel displaced
CO2
savingsMillion tonnes
Coal electricity and coal boilers 342 Gas electricity and gas boilers 50Fossil mix and boilers 188
Source: COGEN

Baharuddin Bin Ali
7th Asian School on Renewable Energy, Puri Pujangga UKM, Malaysia, 16th-20th June 2014
Applications of Cogeneration
101
• There are 4 broad categories of cogeneration applications:1. small-scale cogeneration schemes, usually designed to meet space and
water heating requirements in buildings, based on spark ignition reciprocating engines
2. large-scale cogeneration schemes, usually associated with steam raising in industrial and large buildings applications, and based on compression ignition reciprocating engines, steam turbines or gas turbines
3. large scale cogeneration schemes for district heating based around a power station or waste incinerator with heat recovery supplying a local heating network
4. Cogeneration schemes fuelled by renewable energy sources, which may be at any scale.
• Since 1990, significant technological progress has been made to enable engine and turbine technology to be widely implemented and promote more decentralised forms of cogeneration and power generation. Cost-effectiveness and decreasing emissions have resulted. There are an increasing number of varied applications in industry and residential areas and which can be used in heating and cooling applications.

Baharuddin Bin Ali
7th Asian School on Renewable Energy, Puri Pujangga UKM, Malaysia, 16th-20th June 2014
Cogeneration Technologies
102
• A cogeneration plant consists of 4 basic elements: 1. a prime mover (engine), 2. an electricity generator, 3. a heat recovery system and 4. a control system.
• Cogeneration units are generally classified by the type of prime mover (i.e. drive system), generator and fuel used. Currently available drive systems for cogeneration units include:• Reciprocating engines • Steam turbines • Gas turbines • Combined cycle
• New developments are bringing new technologies towards the market. It is expected that fuel cells, Stirling engine and micro-turbines will become economically available from in the next decade.

Baharuddin Bin Ali
7th Asian School on Renewable Energy, Puri Pujangga UKM, Malaysia, 16th-20th June 2014
Typical Cogeneration Systems
103
Prime mover Fuel usedSize range
(MWe)Heat: power
ratElectrical efficiency
Overall efficiency
Heat quality
Pass out steam turbine
Any fuel 1 - 100+ 3:1 - 8:1+ 10 - 20% Up to 80%Steam at 2
Press or moreBack pressure steam turbine
Any fuel 0.5 – 500 3:1 - 10:1+ 7 - 20% Up to 80%Steam at 2
Press or moreCombined cycle gas turbine
Gas, biogas, gasoil, LFO,
LPG, naphtha3 - 300+ 1:1 - 3:1* 35 – 55% 73 - 90%
Medium grade steam; high temp.
hot water
Open cycle gas turbine
Gas, biogas, gasoil, HFO,
LFO, LPG, naphtha0.25 - 50+ 1.5:1 - 5:1* 25 – 42% 65 – 87%
High grade steam; high temp. hot
water
Compression Ignition engine
Gas, biogas, gasoil, HFO,
LFO, naphtha0.2 - 20 0.5:1 - 3:1* 35 – 45% 65 - 90%
Low pressure steam low;
medium temp. hot water
Sparkignition engine
Gas, biogas, LHO, naphtha
0.003 – 6 1:1 - 3:1 25 - 43% 70 - 92%Low and medium temp. hot water
* Highest heat:power ratios for these systems are achieved with supplementary firing.
Source: COGEN

Baharuddin Bin Ali
7th Asian School on Renewable Energy, Puri Pujangga UKM, Malaysia, 16th-20th June 2014
Gasification
104
The SilvaGas® Gasification Process
• The SilvaGas gasification technology underwent initial development at Battelle’s Columbus Laboratories as a part of the USA DOE’s Biomass Power Program.
• In the process, biomass is indirectly heated using a hot sand stream to produce a medium calorific value gas (approximately 17 to 19 /Nm3.

Baharuddin Bin Ali
7th Asian School on Renewable Energy, Puri Pujangga UKM, Malaysia, 16th-20th June 2014
The SilvaGas® Gasification Process
105
• The process uses 2 circulating fluidized bed reactors as the primary process vessels. The circulating sand is used as a heat transfer medium to rapidly heat the incoming biomass and convey char from the gasification reactor into the process combustor.
• Thermal gasification of biomass provides flexibility for the production of the complete slate of products in a virtual “biomass refinery". Indirect gasification holds great potential as a means for generating a flexible product gas capable of fulfilling a range of energy needs by its direct use or as input to a synthesis reactor. By providing a full scale demonstration of the SilvaGas process, the VGP has been used to validate the technology and confirm its commercial viability.
• The flexibility of the medium Btu gas produced in the SilvaGas process allows its use for:• Direct use as a fuel gas that can be interchanged with
natural gas or distillate oil• Co-fired with biomass or fossil fuels for heating or
power applications,• Use as a fuel for advanced power generation cycles
including turbines or fuel cells, and• Use as a feed gas for synthesis applications such as
production of Fisher Tropsch liquids, alcohols, and hydrogen.

Baharuddin Bin Ali
7th Asian School on Renewable Energy, Puri Pujangga UKM, Malaysia, 16th-20th June 2014
A Commercial Scale Demonstration Plant
106
• Designed for 182 dry tonnes (200 tons) per day of biomass feed. based on the SilvaGasprocess was constructed in Burlington, Vermont. Burlington Electric Department’s (BED) McNeil station and commissioned in 1999.
• BED’s McNeil station, 50 MW, is one of the world’s largest wood fired power stations. • It uses conventional biomass combustion technology, a stoker grate, conventional steam
power cycle, and particulate removal using ESP’s. • BED improves its generating efficiency by implementing a gasification combined cycle system.• The gas produced is being used as a co-fired fuel in the existing McNeil power boilers.• A gas combustion turbine is installed to accept the product gas from the gasifier• The SilvaGas process uses short residence time circulating fluidized bed reactors for both the
gasification and combustion systems.• Gasifier capital costs for a 400 ton per day (dry biomass basis) gasification plant have been
estimated to be approximately USD12.0 million. • This facility will produce > 200 million Btu/hr of medium Btu product gas plus recoverable
sensible energy from the flue gas and product gas streams of approximately 46 million Btu/hr.
• If a net zero cost biomass fuel is assumed, a 12% ROI can be realized with a medium Btu gas selling price of $3.00/MM Btu – a value competitive in today’s energy market.
• These favorable economics reflect the simplicity of operation of the SilvaGas system. Only one operator is required for plant operations, exclusive of feedstock handling.
• This gas selling price does not reflect any potential tax credits or “green energy” credits.

Baharuddin Bin Ali
7th Asian School on Renewable Energy, Puri Pujangga UKM, Malaysia, 16th-20th June 2014
The Vermont Gasification Project
107
Indirect Gasifier
Biomass
Biogas
Heat Recovery Flue Gas
Steam turbine
Generator
Electricity
Char Combustor
Hot Sand
Steam Air
Gas turbine
Fuel Gas Comp
Steam
Char &
Sand
Scrubber
To heat recovery
& exhaust
Dryer
Boiler

Baharuddin Bin Ali
7th Asian School on Renewable Energy, Puri Pujangga UKM, Malaysia, 16th-20th June 2014
Vermont Gasifier General Layout View From West Vermont Gasifier General Layout View From East
108

Baharuddin Bin Ali
7th Asian School on Renewable Energy, Puri Pujangga UKM, Malaysia, 16th-20th June 2014
The Vermont Gasification Project
109
The Vermont Gasification Plant (the largest in the world)

Baharuddin Bin Ali
7th Asian School on Renewable Energy, Puri Pujangga UKM, Malaysia, 16th-20th June 2014
The Battelle High Throughput Gasification Process
110

Baharuddin Bin Ali
7th Asian School on Renewable Energy, Puri Pujangga UKM, Malaysia, 16th-20th June 2014
Pyrolysis Of Biomass
111
• Pyrolysis is a very old energy technology• Vehicles were run on gas produced by pyrolysis of wood in
times of war. • Main advantages over conventional combustion
technologies:• The combined heat and power generation via biomass
gasification connected to gas-fired engines or gas turbines can achieve significantly higher electrical efficiencies (22 -37 %)
• Using the produced gas in fuel cells for power generation can achieve an even higher overall electrical efficiency of 25 - 50 %, even during partial load operation
• Improved electrical efficiency of the energy conversion via pyrolysis means greater reduction in CO2.
• Reduced NOx compounds and removal of pollutants in most cases. The NOx advantages may be partly lost if the gas is consumed in gas-fired engines or gas turbines.
• Significantly lower emissions of NOx, CO and hydrocarbons when the gas is used in fuel cells.
Steam is used to gasify biomass in order to get
higher quality gas

Baharuddin Bin Ali
7th Asian School on Renewable Energy, Puri Pujangga UKM, Malaysia, 16th-20th June 2014
Pyrolysis Of Biomass
112
• Pyrolysis of biomass generates 3 different energy products in different quantities: coke, gas and bio-oils.
• Flash pyrolysis gives high bio-oil yields, but requires further technical R&D efforts to process bio-oils
• Pyrolysis as the first stage in a 2-stage gasification plant for straw and other agricultural materials does deserve consideration.
• In the typical biomass gasification process, air is used as the gasifying agent and hence the gas has a low calorific value (3-5 MJ/m3). After cleaning it can be used in gas-fired engines or gas turbines.
Flash pyrolysis of biomass in action

Baharuddin Bin Ali
7th Asian School on Renewable Energy, Puri Pujangga UKM, Malaysia, 16th-20th June 2014
Pyrolysis Of Biomass
113
• Gas turbines connected to a steam turbine will burn medium calorific value (MCV) gas (12-15 MJ/m³) more favourably than low calorific gas. The use of steam injection into the gas turbine combustion chamber (Cheng process) requires at the very least MCV gas.
• The production of hydrogen or methanol from gasification of biomass or the use of producer gas in low-temperature fuel cells also require either gasifiersthat operate with highly-enriched oxygen and steam, or indirectly heated gasifiers must be used with steam as a gasification medium to generate the necessary medium calorific value producer gas with high hydrogen content.
• Gasification of wood, wood-type residues and waste in fixed bed or fluidised bed gasifiers with combustion of the gas for heat production is now standard.
• Much greater technical problems are posed by gasification of straw and other solid agricultural materials, which generally have much higher concentrations of chlorine, nitrogen, sulphur, and alkalis.
• The gasification of green biomass is still at an early stage of development. Strengthened development efforts on gasification technologies for green biomass materials are essential as the potential supply of this type of fuels is comparatively large.

Baharuddin Bin Ali
7th Asian School on Renewable Energy, Puri Pujangga UKM, Malaysia, 16th-20th June 2014
Pyrolysis Of Biomass
114
• Efficient cleaning of the gas and correct adaptation of the products of biomass gasification to the specific requirements of the gas combustion systems are prerequisites for use in gas-fired engines, gas turbines and fuel cells.
• Tar compounds can be effectively removed by increasing the gas temperature or by catalytic cracking over nickel. There is still no economically viable solution of this problem.
Tar is one of products of gasification of biomass
• None of the gasifier types currently available have been successfully tested in connection with gas-fired engines in long term operation in working combined heat and power stations
• Pressurised gasification achieves higher overall electrical efficiencies, but requires greater technical resources to feed the biomass into the gasifier, and problems with gas cleaning may occur. The gas produced consists mainly of high levels of carbon monoxide and hydrogen, coupled with some methane and other combustibles.

Baharuddin Bin Ali
7th Asian School on Renewable Energy, Puri Pujangga UKM, Malaysia, 16th-20th June 2014
Pyrolysis Of Biomass
115
• For power plants with integrated biomass gasification in the range 3 - 20 MW electricity, fluidised bed gasification of biomass under atmospheric pressure, coupled with gas turbines using the Cheng cycle or gas and steam turbines appear to be the most promising technology at present in technical and economic terms.
• For combined heat and power stations with capacities up to about 2 MW electricity, gas use in gas-fired engines is, at the moment, more attractive than gas turbines.
• Because of problems with fuel supply and transport, biomass gasification plants with capacities above 30 MW electricity are not a viable proposition in most countries.
• The co-firing of biomass in existing large coal power stations (< 100 MW) is currently being investigated in various countries. The integration of biomass-fuelled gasifiers in coal-fired power stations would have certain advantages over stand-alone biomass gasification plants. Most important are the improved flexibility in response to annual and seasonal fluctuations in biomass availability and the lower investment costs.

Baharuddin Bin Ali
7th Asian School on Renewable Energy, Puri Pujangga UKM, Malaysia, 16th-20th June 2014
Pyrolysis Of Biomass
116
• Organic (carbon-based) compounds and materials can be "broken down" into their constituent elements when rapidly exposed to high temperatures in the absence of oxygen; this process is called "fast pyrolysis“. The process produces gases, liquids and solids (char).
• The exact composition and volume of products produced varies depending on the specific biomass being processed:• combustible gases and BIO-oil can be used as a renewable, clean burning
source of energy for heating, motive power and electrical generation. • Non combustible gases (primarily CO2) could be utilized in green house
operations. • BIO-oil can be further processed into chemical feed stock for industrial and
commercial applications • Carbon char can be utilized as a fuel source, or sold as a carbon compound• Ash can be utilized as an additive for cement production or agricultural
fertilizer • The high temperature nature of pyrolysis will destroy pathogens and can also
act to isolate and concentrate chemical pollutants for appropriate disposal.

Baharuddin Bin Ali
7th Asian School on Renewable Energy, Puri Pujangga UKM, Malaysia, 16th-20th June 2014
Pyrolysis Of Biomass
117

Baharuddin Bin Ali
7th Asian School on Renewable Energy, Puri Pujangga UKM, Malaysia, 16th-20th June 2014
Pyrolysis Benefits
118
• Production of valuable liquid, gaseous and solid products from agricultural wastes
• Renewable "green" energy source (bio-oil) for use in motive power, electrical generation and/or heating
• Reduction of prohibitive feed stock shipping costs • Reduction of pollution from agricultural waste, particularly the
burning of certain straws (rice & flax) • Destruction of pathogens in potentially hazardous materials
(animal renderings) • Soil nutrient recovery N, P, C additives in char and ash used as
fertilizer additives • Adaptable to many different agricultural and agri-food
materials, solid, or liquid • Bench test lab facilities available for pre-testing new materials
and optimizing operating parameters

Baharuddin Bin Ali
7th Asian School on Renewable Energy, Puri Pujangga UKM, Malaysia, 16th-20th June 2014
Agri-THERM's Mobile Pyrolysis Pilot Plant
119
Ready to be relocated
Ready for action
119
Dorchester, Ontario, Canada N0L 1G5
• Agricultural waste is a light density, large volume product and is seasonal in nature. Therefore, it is preferable to have a mobile pyrolysis plant that can be transported to the source of the waste product.
• Agri-THERM have designed and built a mobile pilot plant with the capacity of processing 10 – 40 Tonne/day of agricultural waste.

Baharuddin Bin Ali
7th Asian School on Renewable Energy, Puri Pujangga UKM, Malaysia, 16th-20th June 2014
Pyrolysis and Gasification Factsheet
120
• Pyrolysis and gasification, like incineration, are options for recovering value from waste by thermal treatment. The basic technology concepts are not novel but, several new proprietary processes have been developed.
What are Pyrolysis and Gasification ?• Both pyrolysis and gasification turn wastes into energy rich fuels by heating
the waste under controlled conditions. Whereas incineration fully converts the input waste into energy and ash, these processes deliberately limit the conversion so that combustion does not take place directly. Instead, they convert the waste into valuable intermediates that can be further processed for materials recycling or energy recovery.
Pyrolysis:• Thermal degradation of waste in the
absence of air to produce char, pyrolysis oil and syngas, eg the conversion of wood to charcoal
Gasification:• Breakdown of hydrocarbons into a
syngas by carefully controlling the amount of oxygen present, eg the conversion of coal into town gas

Baharuddin Bin Ali
7th Asian School on Renewable Energy, Puri Pujangga UKM, Malaysia, 16th-20th June 2014
Why use Pyrolysis and Gasification ?
121
1. Increased possibilities for recycling• Pyrolysis and gasification offer more scope for recovering products
from waste than incineration. When waste is burnt in a modern incinerator the only practical product is energy, whereas the gases, oils and solid char from pyrolysis and gasification can not only be used as a fuel but also purified and used as a feedstock for petro-chemicals and other applications.
• Many processes also produce a stable granulate instead of an ash which can be more easily and safely utilised. In addition, some processes are targeted at producing specific recyclables such as metal alloys and carbon black. From waste gasification, in particular, it is feasible to produce hydrogen, which many see as an increasingly valuable resource.
• While this type of recycling is rarely economically attractive under current market conditions, these technologies do offer the scope for increasing recycling rates to achieve government targets or address environmental concerns.

Baharuddin Bin Ali
7th Asian School on Renewable Energy, Puri Pujangga UKM, Malaysia, 16th-20th June 2014
Why use Pyrolysis and Gasification ?
122
2. Better energy efficiency & contribution to reducing global warming• Gasification can be used in conjunction with gas engines (and potentially gas turbines)
to obtain higher conversion efficiency than conventional fossil-fuel energy generation. By displacing fossil-fuels, waste pyrolysis and gasification can help meet renewable energy targets, address concerns about global warming
• Conventional incineration, used in conjunction with steam-cycle boilers and turbine generators, achieves lower efficiency.
• For technical and financial reasons, many current projects do not implement these advantages, preferring instead to use proven – but lower efficiency – methods of energy recovery integration with composting and materials recovery
• Many of the new processes fit well into a modern integrated approach to waste management.
3. More flexibility of scale• Systems are being developed for a wide range of capacities. • Small scale (30,000 tonne/year) systems handle wastes generated by isolated
communities, while large (150,000 – 500,000 tonne/year) systems serve regional facilities.

Baharuddin Bin Ali
7th Asian School on Renewable Energy, Puri Pujangga UKM, Malaysia, 16th-20th June 2014
What types of waste can be processed ?
123
• Gasification and Pyrolysis technologies can handle a very wide range of materials (over 50 different types of waste for which systems are available or under development).
• Specific processes have been optimised to handle particular feedstock (for example, tyre pyrolysis and sewage sludge gasification), while others have been designed to process mixed wastes like MSW. Today, the main applications are:• Processing agricultural and forestry residues• Handling household and commercial waste• Recovering energy from residues left from materials recycling (auto-
shredder residue, electrical and electronic scrap, tyres, mixed plastic waste and packaging residues)
• Materials recycling and composting cannot handle mixed waste feeds –today only landfill and incineration can do this.
• A few pyrolysis and gasification systems can handle unsegregated MSW, although operational reliability has not yet been fully demonstrated for most of these processes.

Baharuddin Bin Ali
7th Asian School on Renewable Energy, Puri Pujangga UKM, Malaysia, 16th-20th June 2014
What processes are available commercially ?
124
•More than 150 companies are marketing systems based on pyrolysis and gasification concepts for waste treatment. Many of these are optimised for specific wastes or particular scales of operation. •Today, about 10 companies are vying for the
largest potential market, bulk disposal of MSW.

Baharuddin Bin Ali
7th Asian School on Renewable Energy, Puri Pujangga UKM, Malaysia, 16th-20th June 2014
Is this technology proven in operation ?
125
• More than 100 facilities operating or ordered around the world, capable of processing over 4 million tonnes of waste per year.
• Some plants – particularly in Europe and Japan - have been operating commercially for more than 5 years.
• Many of the proprietary systems currently being promoted have only operated so far as small scale pilots and, in general, incineration is far more proven than pyrolysis and gasification for most applications.
• There are of course concerns about operational reliability.

Baharuddin Bin Ali
7th Asian School on Renewable Energy, Puri Pujangga UKM, Malaysia, 16th-20th June 2014
How do the economics compare with alternatives ?
126
• Shortage of hard data on true CAPEX and OPEX for 'real-world' applications (many projects have been supported by subsidies while, in other cases, vendors have forward-priced projects to secure prestigious references.
• Gasification and pyrolysis have been proven commercially feasible.
• But project costs are rarely significantly lower than conventional alternatives. Individual projects need to be considered on a case-by-case basis to determine economic viability.

Baharuddin Bin Ali
7th Asian School on Renewable Energy, Puri Pujangga UKM, Malaysia, 16th-20th June 2014
Pyrolysis and Gasification for handling unsegregated MSW
127
• Focus is on the potential for these technologies to handle the bulk disposal of household waste. Several commercial sites in Japan.
• Technical and economic feasibility not fully demonstrated. • Increasing emphasis upon resource recovery and renewable
energy may make these processes more attractive in the medium term.
• The key to their widespread adoption will be successful extended operation at 'flagship' reference facilities.

Baharuddin Bin Ali
7th Asian School on Renewable Energy, Puri Pujangga UKM, Malaysia, 16th-20th June 2014
Principles of Pyrolysis
128
Mode Conditions Liquid Char Gas
Fast pyrolysis
moderate temperature, short residence time particularly vapour
75% 12% 13%
Carbonisation
low temperature, very long residence time
30% 35% 35%
Gasificationhigh temperature, long residence times
5% 10% 85%
• Pyrolysis is thermal decomposition occurring in the absence of oxygen. It is always also the first step in combustion and gasification processes where it is followed by total or partial oxidation of the primary products.
• Lower process temperature and longer vapour residence times favour the production of charcoal.
• High temperature and longer residence time increase the biomass conversion to gas and moderate temperature and short vapour residence time are optimum for producing liquids.
• The product distribution obtained from different modes of pyrolysis process are summarised in the table below. Fast pyrolysis for liquids production is of particular interest currently as the liquids are transportable and storage.
Typical product yields (dry wood basis) obtained by different modes of pyrolysis of wood

Baharuddin Bin Ali
7th Asian School on Renewable Energy, Puri Pujangga UKM, Malaysia, 16th-20th June 2014
Fast Pyrolysis
129
1. Fast pyrolysis occurs in less than few seconds. Therefore chemical reaction kinetics, heat and mass transfer processes, and phase transition phenomena, play important roles. The critical issue is to bring the reacting biomass particle to the optimum process temperature and minimize its exposure to the intermediate (lower) temperatures that favour formation of charcoal either:
1. by using small particles, eg: in the fluidised bed processes, or2. to transfer heat very fast only to the particle surface that contacts the heat source,
which is applied in ablative processes.
2. In fast pyrolysis biomass decomposes to generate mostly vapours and aerosols and some charcoal. After cooling and condensation, bio-oil is formed which has a heating value about half that of conventional fuel oil. While it is related to the traditional pyrolysis processes for making charcoal, fast pyrolysis, with carefully controlled parameters gives high yields of bio-oils. The essential features of a fast pyrolysis process for producing bio-oils are:
• very high heating and heat transfer rates at the reaction interface, which usually requires a finely ground biomass feed
• carefully controlled pyrolysis reaction temperature 500ºC and vapour phase temperature of 400 - 450ºC,
• short vapour residence times of typically < 2 seconds• rapid cooling of the pyrolysis vapours to give the bio-oil product.

Baharuddin Bin Ali
7th Asian School on Renewable Energy, Puri Pujangga UKM, Malaysia, 16th-20th June 2014
Fast Pyrolysis
130
3. The main product, bio-oil (75% wt on dry feed basis). By-products char and gas which are used within the process to provide the process heat requirements so there are no waste streams other than flue gas and ash.
4. A fast pyrolysis process includes drying the feed to typically < 10% water in order to minimise the water in the product liquid oil (< 15% acceptable), grinding the feed (2 mm in the case of fluid bed reactors) to ensure rapid reaction, pyrolysis reaction, separation of solids (char), quenching and collection of the liquid product (bio-oil).
5. Virtually any form of biomass can be considered for fast pyrolysis. Nearly 100 different biomass types have been tested by many laboratories ranging from agricultural wastes.
6. At the heart of a fast pyrolysis process is the reactor. Although it probably represents at most only about 10-15% of the total capital cost of an integrated system, most R & D has focused on the reactor, followed by control and improvement of liquid quality including improvement of collection systems.
7. The rest of the process consists of biomass reception, storage and handling, biomass drying and grinding, product collection, storage and, when relevant, upgrading.

Baharuddin Bin Ali
7th Asian School on Renewable Energy, Puri Pujangga UKM, Malaysia, 16th-20th June 2014
Overall Fast Pyrolysis Process
131
1. Reception and storage• Low capacity systems of < 3 t/h feed typically consist of a concrete pad for
tipping delivered feed and a front end loader to move it between reception, storage and handling steps.
• Larger size plants require more sophisticated systems employs weighbridge, tipping units, conveyors, bunker storage.
2. Feed drying• Usually essential unless a naturally dry material such as straw is available (< 10%
moisture). The feed moisture report to the liquid product but also the reaction water from pyrolysis, (typically gives 12-15% water) in the product.
• Waste low grade process heat would usually be employed.3. Comminution
• Particles have to be very small to fulfil the requirements of rapid heating and to achieve high liquid yields.
• This is costly and reactors that can use larger particles, such as ablative pyrolysers, have an advantage.
4. Reactor• various configurations have been tested that show considerable diversity and
innovation in meeting the basic requirements of fast pyrolysis. The "best" method is not yet established.

Baharuddin Bin Ali
7th Asian School on Renewable Energy, Puri Pujangga UKM, Malaysia, 16th-20th June 2014
Overall Fast Pyrolysis Process
132
Overall fast pyrolysis process (continue)
5. Char + ash separation • Some char is inevitably carried over from cyclones and collects in the liquid.
Almost all of the ash in the biomass is retained in the char. So successful char removal gives successful ash removal.
• The char may be separated and exported, otherwise it would be used to provide process heat either directly as in circulating fluid bed reactors or indirectly as in fluid bed systems .
6. Liquids collection • Larger scale processing would usually employ quenching with an immiscible
liquid such as a hydrocarbon or cooled liquid product. Although collection of aerosols is difficult there has been considerable success with electrostatic precipitators. Careful design is needed to avoid blockage from differential condensation of heavy ends. Light ends collection is important in reducing liquid viscosity.
7. Storage and transport• The bio-oils require a tank farm for storage and later blending facilities. Both
storage and transport are features unique to fast pyrolysis and permit economies of scale to be realised from building as large a conversion plant as possible as well as offering economic supplies of bio-oil for distributed or decentralised small scale power and heat applications.

Baharuddin Bin Ali
7th Asian School on Renewable Energy, Puri Pujangga UKM, Malaysia, 16th-20th June 2014
BIO-OIL - Pyrolysis Liquid
133
1. Crude pyrolysis liquid or bio-oil is dark brown and approximates to biomass in elemental composition of a very complex mixture of oxygenated hydrocarbons with an appreciable proportion of water from both the original moisture and reaction product. Solid char may also be present.
2. Bio-oil is formed by rapidly quenching and thus ‘freezing’ the intermediate products of flash degradation of hemicellulose, cellulose and lignin. Bio-oil thus contains many reactive species, which contribute to its unusual attributes. Bio-oil can be considered a micro-emulsion in which the continuous phase is an aqueous solution of holocellulose decomposition products, that stabilizes the discontinuous phase of pyrolytic lignin macro-molecules through mechanisms such as hydrogen bonding. Aging or instability is believed to result from a breakdown in this emulsion. In some ways it is analogous to asphaltenes found in petroleum.
3. Fast pyrolysis bio-oil has a higher heating value of about 17 MJkg-1 as produced with about 25% wt. water that cannot readily be separated. Bio-oil will not mix with any hydrocarbon liquids. It is composed of a complex mixture of oxygenated compounds that provide both the potential and challenge for utilisation.

Baharuddin Bin Ali
7th Asian School on Renewable Energy, Puri Pujangga UKM, Malaysia, 16th-20th June 2014
BIO-OIL - Pyrolysis Liquid
134
4. Bio-oil has a distinctive odour - an acrid smoky smell, can irritate the eyes on prolonged exposure due to the low molecular weight aldehydes and acids. It contains several hundred different chemicals in widely varying proportions, ranging from formaldehyde and acetic acid to complex high molecular weight phenols, anhydrosugars and other oligosaccharides.
5. Bio-oil contains varying quantities of water, which forms a stable single phase mixture, ranging 15 wt% to 30 - 50wt% water, depending on how it was produced and subsequently collected. Pyrolysis liquids can tolerate the addition of some water, before phase separation occurs. It cannot be dissolved in water. It is miscible with polar solvents such as methanol, acetone, etc. but totally immiscible with petroleum-derived fuels.
6. The density of bio-oil is very high at around 1.2 kg/litre (light fuel oil 0.85 kg/litre), meaning the liquid has 42% of the energy content of fuel (weight basis), but 61% (volumetric basis). This has implications on the design and specification of equipment such as pumps and atomisers in boilers and engines.
7. The viscosity of the bio-oil as produced can vary from 25 - 1000 cSt (at 40°C) or more depending on the feedstock, the water content of the oil, the amount of light ends that have been collected and the extent to which the oil has aged.
8. Bio-oils cannot be completely vaporised once they have been recovered from the vapour phase. If bio-oil is heated to > 100ºC it rapidly reacts and eventually produces a solid residue of around 50 wt% of the original liquid and some distillate containing volatile organic compounds and water. While bio-oil has been successfully stored for several years in normal storage conditions in steel and plastic drums without any deterioration that would prevent its use in any of the applications tested to date, it does change slowly with time, most noticeably there is a gradual increase in viscosity.

Baharuddin Bin Ali
7th Asian School on Renewable Energy, Puri Pujangga UKM, Malaysia, 16th-20th June 2014
Typical properties of wood derived crude bio-oil
135
Physical property Typical value Characteristics
Moisture content 20-30%pH 2.5Specific gravity 1.20Elemental analysis
C 55-58%H 5.5-7.0%O 35-40%N 0-0.2%
Ash 0-0.2%HHV as produced 16-19 MJ/kgViscosity (40oC & 25% H2O) 40-100 cpSolids (char) 0.1 – 0.5%Vacuum distillation residue <50%
· Liquid fuel· Ready substitution for conventional
fuels in many stationary applications such as boilers, engines, turbines
· Heating value of 17 MJ/kg at 25% wt. water, is about 40% that of fuel oil / diesel
· Does not mix with hydrocarbon fuels· Not as stable as fossil fuels· Quality needs definition for each
application

Baharuddin Bin Ali
7th Asian School on Renewable Energy, Puri Pujangga UKM, Malaysia, 16th-20th June 2014
REACTORS - Bubbling Fluid Beds
136
• Bubbling fluid beds, usually referred to as just fluid beds as opposed to circulating fluid beds (see below) have the advantages of a well understood technology that is simple in construction and operation, good temperature control and very efficient heat transfer to biomass particles due to high solids density.
• A typical configuration is shown below with electrostatic precipitators that are more widely used in laboratory systems. Commercial plants may try to rely on a series of collection stages including de-misters although aerosol capture is notoriously difficult.
Bubbling fluid bed reactor with electrostatic precipitator

Baharuddin Bin Ali
7th Asian School on Renewable Energy, Puri Pujangga UKM, Malaysia, 16th-20th June 2014
REACTORS - Bubbling fluid beds
137
• Heating can be achieved in a variety of ways as shown in the figure below and scaling is well understood. However, heat transfer to bed at large-scales of operation has to be considered carefully due to scale-up limitations of different methods of heat transfer.
Methods of heat transfer to a pyrolysis reactor
• Fluid bed pyrolysers give good and consistent performance with high liquid yields of typically 70-75%wt. from wood on a dry feed basis. Small biomass particle sizes < 2-3 mm are needed to achieve high biomass heating rates, and the rate of particle heating is usually the rate limiting step.
• Residence time of solids and vapours is controlled by the fluidising gas flow rate and is higher for char than for vapours. As char acts as an effective vapour cracking catalyst at fast pyrolysis reaction temperatures, rapid and effective char separation/elutriation is important. This is achieved by ejection and entrainment followed by separation in one or more cyclones so careful design of sand and biomass/char hydrodynamics is important.

Baharuddin Bin Ali
7th Asian School on Renewable Energy, Puri Pujangga UKM, Malaysia, 16th-20th June 2014
REACTORS - Bubbling fluid beds
138
Circulating fluid bed reactor
REACTORS - Circulating fluid beds and transported bed• Circulating fluid bed (CFB) and transported bed reactor
systems have many of the features of bubbling beds except that the residence time for the char is almost the same as for vapours and gas and char is more attrited due to the higher gas velocities which can lead to higher char contents in the collected bio-oil.
• An added advantage is that CFBs are suitable for very large throughputs even though the hydrodynamics are more complex - this technology is widely used at very high throughputs in the petroleum and petrochemical industry.
• Heat supply is usually from recirculation of heated sand from a secondary char combustor, which can be either a bubbling or circulating fluid bed. In this respect the process is similar to a twin fluid bed gasifier except that the reactor (pyrolyser) temperature is much lower and the closely integrated char combustion in a second reactor requires careful control to ensure that the temperature and heat flux match the process and feed requirements. One of the unproven areas is heat transfer at large-scales of throughput.
• The rotating cone reactor has many similarities except that the sand and biomass transport is effected by centrifugal forces operating in a rotating cone.

Baharuddin Bin Ali
7th Asian School on Renewable Energy, Puri Pujangga UKM, Malaysia, 16th-20th June 2014
REACTORS - Ablative pyrolysis
139
• Ablative pyrolysis is substantially different in concept compared to the other methods of fast pyrolysis. In all these other methods, the rate of reaction is limited by the rate of heat transfer through a biomass particle, which is why small particles are required. The mode of reaction in ablative pyrolysis is analogous to melting butter in a frying pan, when the rate of melting can be significantly enhanced by pressing down and moving the butter over the heated pan surface. In ablative pyrolysis heat is transferred from the hot reactor wall to "melt" wood that is in contact with it under pressure.
• The pyrolysis front thus moves unidirectionally through the biomass particle. As the wood is mechanically moved away, the residual oil film both provides lubrication for successive biomass particles and also rapidly evaporates to give pyrolysis vapours for collection in the same way as other processes. The rate of reaction is strongly influenced by pressure, the relative velocity of wood on the heat exchange surface and the reactor surface temperature.
• The key features of ablative pyrolysis are therefore as follows:• High pressure of particle on hot reactor wall, achieved due to centrifugal force• High relative motion between particle and reactor wall,• Reactor wall temperature < 600°C.
• As reaction rates are not limited by heat transfer through the biomass particle large particles can be used, there is no upper limit to the size that can be processed. The process is limited by the rate of heat supply to the reactor rather than the rate of heat absorption by the pyrolysing biomass as in other reactors. There is no requirement for inert gas, so the processing equipment is smaller, and the reaction system is thus more intensive. However the process is surface area controlled so scaling is more costly and the reactor is mechanically driven so is thus more complex.

Baharuddin Bin Ali
7th Asian School on Renewable Energy, Puri Pujangga UKM, Malaysia, 16th-20th June 2014
REACTORS - Summary and status
140
Overview of fast pyrolysis reactor characteristics for bio-oil production
Property Status Bio-oil Complexity Feed Inert gas Specific Scalewt% size need size up
Fluid bed Demo 75 Medium Small High Medium EasyCFB Pilot 75 High Medium High Large EasyEntrained None 65 High Small High Large EasyRotating cone Pilot 65 High V small Low Small HardAblative Lab 75 High Large Low Small HardVacuum Demo 60 High Large Low Large Hard
Blue cells show desirable characteristics # Demo = demonstration (200 - 2000 kg h-1)
Yellow cells show undesirable characteristics # Pilot = pilot plant (200 - 200 kg h-1
Red cells show moderate characteristics # Lab = laboratory (1 - 20 kg h-1)
• A summary of some key features of fast pyrolysis reactor systems is shown in the table below, which identifies the more promising and less promising features of each type of reactor.

Baharuddin Bin Ali
7th Asian School on Renewable Energy, Puri Pujangga UKM, Malaysia, 16th-20th June 2014
Pyrolysis & Gasification - Summary
141
Pyrolysis and gasification• Thermo-chemical processes do not necessarily produce useful energy directly. • Controlled conditions of temperature and oxygen level to convert the original bioenergy
feedstock into more convenient energy carriers such as producer gas, oil or methanol.• Compared to the original biomass, these energy carriers either have higher energy densities –
and lower transport costs – or more predictable and convenient combustion characteristics, allowing them to be used in internal combustion engines and gas turbines.
Pyrolysis• Pyrolysis is a process for thermal conversion of solid fuels in the complete absence of oxidizing
agent (air/oxygen), or with such limited supply that gasification does not occur to any appreciable extent.
• Commercial applications are either focused on the production of charcoal or production of a liquid product, the bio-oil. The latter is potentially interesting as a substitute for fuel oil and as a feedstock for production of synthetic gasoline or diesel fuel.
• During pyrolysis, which takes place at temperatures in the range 400-800°C, most of the cellulose and hemicellulose and part of the lignin will disintegrate to form smaller and lighter molecules which are gases at the pyrolysis temperature. As theses gases cool, some of the vapours condense to form a liquid, which is the bio-oil. The remaining part of the biomass, mainly parts of the lignin, is left as a solid i.e. the charcoal. To some extent, it is possible to influence the product mix so that either gases, condensable vapours or the solid charcoal is promoted.

Baharuddin Bin Ali
7th Asian School on Renewable Energy, Puri Pujangga UKM, Malaysia, 16th-20th June 2014
Pyrolysis & Gasification - Summary
142
Fast pyrolysis is an advanced process which gives a yield of bio-fuels up to 80% on dry feed, typically, 65% liquids and 10% non-condensable gases. The characteristic features of fast pyrolysisare the very high heating and heat transfer rates, a carefully controlled pyrolysis temperature and a rapid cooling of the products. The residence time at the pyrolysis temperature must be very short, typically less than one second. Low temperatures (up to about 650°C) maximize the yield of condensable vapours, and about 70% of the biomass weight can be obtained as a liquid. High temperatures (above 700°C) maximize gas yields, about 80% of the biomass can be converted to a combustible gas with this process.
Fig: Pyrolysis product distribution as a function of heating rate, residence time and maximum
reaction temperature
Slow pyrolysis at temperatures 400-800°C and long residence times maximizes the charcoal yield and gives about 30% of the dry biomass weight as charcoal, although higher pressure may give a significant higher yield. The yield and composition of the charcoal also depends on the pyrolysistemperature. A low temperature gives a higher yield but results in a charcoal with a higher content of volatiles. The optimum pyrolysis temperature depends on the purpose for which the charcoal is used.

Baharuddin Bin Ali
7th Asian School on Renewable Energy, Puri Pujangga UKM, Malaysia, 16th-20th June 2014
Pyrolysis & Gasification - Summary
143
• Technically, the pyrolysis process and specifically the supply of heat may be carried out in three quite different ways:
• turnover in storage should be shorter than few months. Whether or not the bio-oil is competitive with petroleum fuel oil depends on the feedstock costs and local fossil fuel oil prices. The most primitive method is to treat the biomass feedstock batchwise and generate the heat required for pyrolysis by burning part of the biomass with admission of air. This is the method used in charcoal kilns. This method gives a slow pyrolysis and is mainly useful for charcoal production even though tar can also be obtained as a by-product.
• The second type of process is used for industrial production of charcoal. The feedstock is heated by inert combustion gases in complete absence of oxygen. The industrial processes are continuous and the capacity is of the order of 1 tonne of charcoal per hour or more. Modern charcoal processes are achieves efficiencies of over 30% by weight. The pyrolysis is started by burning fuel oil, but when combustible gases are released from the biomass, these gases are burned instead of the oil. The continuous process makes careful control of the emissions, unlike with the batchwise process.
• The third type of process uses inert solid material as an energy carrier (e.g. sand in a FBC) to heat the biomass being pyrolysed. This process is suitable when fast heating of the biomass is desirable, i.e. when yields of gas or liquid product are the most interesting.

Baharuddin Bin Ali
7th Asian School on Renewable Energy, Puri Pujangga UKM, Malaysia, 16th-20th June 2014
Pyrolysis & Gasification - Summary
144
• Pyrolysis of biomass has been used for the production of charcoal for industrial or household markets. Bio-oil has so far only been commercialized for production of food additives. The bio-oil could also be used for the extraction of other special chemicals and that the bio-oil as such could find a market as a substitute for petroleum products. However, the bio-oil has some properties that triggers additional costs. It is acidic and corrosive which means that more expensive materials must be used in the burner nozzles and the entire fuel system. The bio-oil calorific value (typically ranging 17-20 GJ/ton) is lower than fuel oil (approx. 40 GJ/ton) which leads to increased costs for transportation and storage. The viscosity of the oil increases during storage, therefore

AN INTEGRATED RESOURCE RECOVERY CENTRE -WASTE TO ENERGY PLANT
SEMENYIH, SELANGOR

Baharuddin Bin Ali
7th Asian School on Renewable Energy, Puri Pujangga UKM, Malaysia, 16th-20th June 2014
AN INTEGRATED SYSTEM
146
Power Plant
Material/ResourceRecovery
Waste Treatment& Fuel Preparation
Leachate Treatment
Sanitary Landfill

Baharuddin Bin Ali
7th Asian School on Renewable Energy, Puri Pujangga UKM, Malaysia, 16th-20th June 2014
Why an Integrated Solution
147
Current practice focuses on improvement on waste collection and nothing much done to improve waste disposal – 100% goes to landfill
WASTE
GENERATION
21,000 tpd
WASTE
COLLECTION
18,000 tpd
LANDFILL/
DUMPSITE
18,000 tpd

Baharuddin Bin Ali
7th Asian School on Renewable Energy, Puri Pujangga UKM, Malaysia, 16th-20th June 2014
Increase Resource Recovery & Value Creation
148
OUR OPTIMIZATION MODEL WILL REMOVE 85% OF MSW AND INCREASE RESOURCE RECOVERY WHILE GENERATING RENEWABLE ENERGY/ AND VALUE CREATION
WASTE
GENERATIONWASTE
COLLECTION
WASTE
PROCESSING
(REMOVE 85%)
SANITARY
LANDFILL
(ONLY 15%)
Resource Recovery,
& Renewable Energy
CCSB IS THE ONLY TECHNOLOGY PROVIDER AND OPERATOR IN RRC-WTE IN THE REGION

Baharuddin Bin Ali
7th Asian School on Renewable Energy, Puri Pujangga UKM, Malaysia, 16th-20th June 2014
MSW Composition
149

Baharuddin Bin Ali
7th Asian School on Renewable Energy, Puri Pujangga UKM, Malaysia, 16th-20th June 2014
Current Waste Separation Issue
150
Office Household
ParksKitchen
SEGREGATED WASTE BINS
Waste Unsorted

Baharuddin Bin Ali
7th Asian School on Renewable Energy, Puri Pujangga UKM, Malaysia, 16th-20th June 2014
Our Concept : The Integrated Approach
151
MSW
COLLECTION
RRC/RDF-WTE
PLANT
SANITARY
LANDFILL
RESOURCE
RECOVERY
REJECT
MATERIALS
INERT
MATERIALS
ORGANIC
MATERIALS
RECOVERED
MATERIALS
BIO-DRYING
FACILITY

Baharuddin Bin Ali
7th Asian School on Renewable Energy, Puri Pujangga UKM, Malaysia, 16th-20th June 2014
Economic Model
152
MSW
SANITARY LANDFILL (SLF)
RRC/RDF-WTE
100%
10-15%RECYCLABLE MATERIALS
30% RDF
20%-30% H2O
10%-15%INERTS
10% BIO-DRIED
INCOME
TREATMENT FEE
RECYCLABLE MATERIALS
POWER GENERATION

Baharuddin Bin Ali
7th Asian School on Renewable Energy, Puri Pujangga UKM, Malaysia, 16th-20th June 2014
RRC – WTE Process
153
WEIGHBRIDGE
EFFLUENT TREATMENT
PLANT
RECEIVING AREA
BAG SPLITTER FEEDING HOPPERROTARY SCREEN
DRIER
MAGNETIC SEPERATOR
SHREDDERS POWER PLANT
RESOURCE RECOVERY FACILITIES

Baharuddin Bin Ali
7th Asian School on Renewable Energy, Puri Pujangga UKM, Malaysia, 16th-20th June 2014
Concept of RRC-WTE Plant
154

Baharuddin Bin Ali
7th Asian School on Renewable Energy, Puri Pujangga UKM, Malaysia, 16th-20th June 2014
Process Flow of RRC-WTE Plant
155

Baharuddin Bin Ali
7th Asian School on Renewable Energy, Puri Pujangga UKM, Malaysia, 16th-20th June 2014
What Facilities Do We Provide ?
156
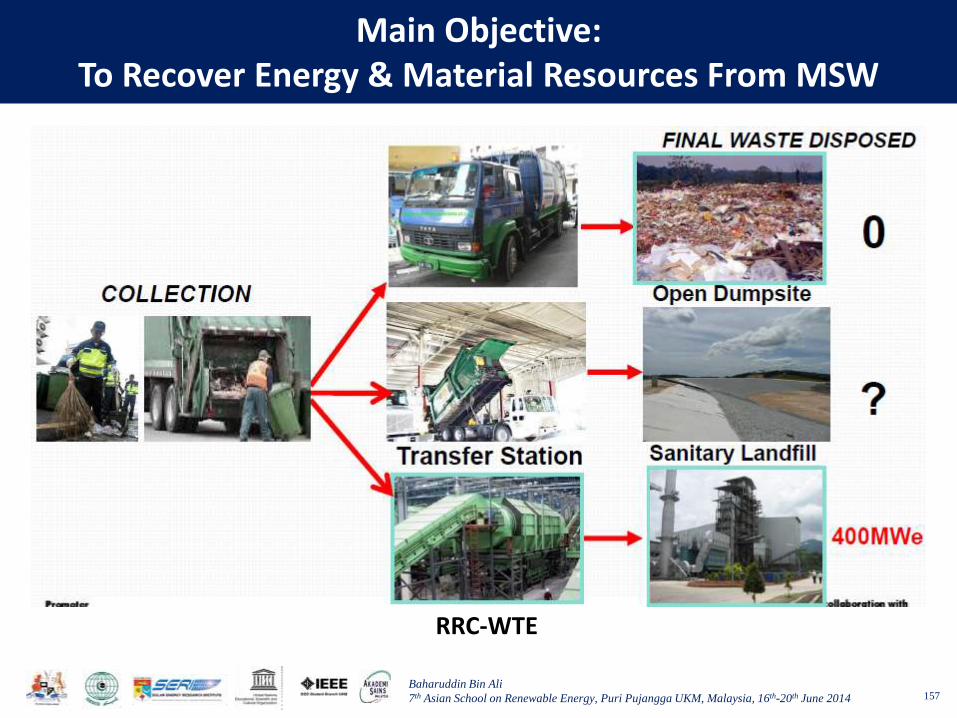
Baharuddin Bin Ali
7th Asian School on Renewable Energy, Puri Pujangga UKM, Malaysia, 16th-20th June 2014
Main Objective: To Recover Energy & Material Resources From MSW
157
RRC-WTE

Baharuddin Bin Ali
7th Asian School on Renewable Energy, Puri Pujangga UKM, Malaysia, 16th-20th June 2014
What Have We Achieved?Accountability & Efficiency
158
WEIGHBRIDGE –PROVIDES ACCOUNTABILITY
MECHANIZED MSW SEPARATION –INCREASE EFFICIENCY

Baharuddin Bin Ali
7th Asian School on Renewable Energy, Puri Pujangga UKM, Malaysia, 16th-20th June 2014
Treated & Process 550 tons/day of MSW
159

Baharuddin Bin Ali
7th Asian School on Renewable Energy, Puri Pujangga UKM, Malaysia, 16th-20th June 2014
550 tpd of MSW Receiving Bay
160

Baharuddin Bin Ali
7th Asian School on Renewable Energy, Puri Pujangga UKM, Malaysia, 16th-20th June 2014
Treated Leachate Into Standard ‘A’ Water*
161

Baharuddin Bin Ali
7th Asian School on Renewable Energy, Puri Pujangga UKM, Malaysia, 16th-20th June 2014
Reuse & Recycle Treated Leachate
162
TREATED LEACHATE USED FOR WASHING MSW TRUCK & PLANT

Baharuddin Bin Ali
7th Asian School on Renewable Energy, Puri Pujangga UKM, Malaysia, 16th-20th June 2014
Increase Recovery of Recycling MaterialsThrough Mechanization
163

Baharuddin Bin Ali
7th Asian School on Renewable Energy, Puri Pujangga UKM, Malaysia, 16th-20th June 2014
Recover Recyclables
164
Recover METALS, PLASTICS, RECYCLABLES , Organics to biodrying/fuel
Aluminium
Film Plastics Resin Recycled Products

Baharuddin Bin Ali
7th Asian School on Renewable Energy, Puri Pujangga UKM, Malaysia, 16th-20th June 2014
ORGANICS – In Vessel Biodrying & Screening
165

Baharuddin Bin Ali
7th Asian School on Renewable Energy, Puri Pujangga UKM, Malaysia, 16th-20th June 2014
Produce Re-engineered Fuel (RDF) As Fossil Fuel Replacement)
166

Baharuddin Bin Ali
7th Asian School on Renewable Energy, Puri Pujangga UKM, Malaysia, 16th-20th June 2014
Generates 31 GWhr / Export 19 GWhr of RE
167
POWER PLANT BOILER
TURBINE
GENERATOR
POLLUTION CONTROL SYSTEMCHIMNEY WITH CEMs SYSTEM

Baharuddin Bin Ali
7th Asian School on Renewable Energy, Puri Pujangga UKM, Malaysia, 16th-20th June 2014
REDUCE 566,020 tons of CO2
168
0.58 kg CO2/kWh 0.138 kg
CO2/kWh
CONVENTIONAL POWER PLANT RDF POWER PLANT
Life Cycle Analysis Comparison done by Sirim
1,000 TONS MSW/DAY & 13MWe = REDUCTION OF 300,000 TONS CO2
ANNUALLY

Baharuddin Bin Ali
7th Asian School on Renewable Energy, Puri Pujangga UKM, Malaysia, 16th-20th June 2014
Harvest Waste For Renewable Energy
169

Baharuddin Bin Ali
7th Asian School on Renewable Energy, Puri Pujangga UKM, Malaysia, 16th-20th June 2014
Environment Friendly & Extend Lifespan Of Landfill
170
OPEN DUMPSITE IN
SUNGAI KEMBONG
THE SITE BEFORE
CONSTRUCTION
COMMERCIAL RRC/WTE FACILITY
IN SUNGAI LALANG, SEMENYIH
SELANGOR D.E.
BEFORE
AFTER

Baharuddin Bin Ali
7th Asian School on Renewable Energy, Puri Pujangga UKM, Malaysia, 16th-20th June 2014
The First In Malaysia
171
The first Resource Recovery - Waste to Energy Plant receiving 700 tons/day of MSW and generating 8.9MW and exporting 5.5MW to the grid .

Baharuddin Bin Ali
7th Asian School on Renewable Energy, Puri Pujangga UKM, Malaysia, 16th-20th June 2014
Output And Outcome Of RRC-WTE
172
INTANGIBLESTANGIBLES
RECOVER AND RECYCLE RESOURCES
RENEWABLE ENERGY
Better Use of Land than Landfill
Jobs/Businesses
BEAUTIFUL ENVIRONMENT
Avoid Future Environment Cleanup
HEALTHY SOCIETY
ECONOMY ENVIRONMENT

Baharuddin Bin Ali
7th Asian School on Renewable Energy, Puri Pujangga UKM, Malaysia, 16th-20th June 2014
Awards Received
173
ANUGERAH INOVASI PENYELIDIKAN
BERSAMA (AIPB)
2004
GOLD MEDAL FROM CHINA ASSOCIATION OF PATENT 2004
SILVER MEDAL FROM SEOUL INTERNATIONAL INVENTION
FAIR (SIIF) 2004
FROST & SULLIVAN INDUSTRIALTECHNOLOGY AWARD 2006
ICHEM E SHELL ENERGY INNOVATION & EXCELLENCE
AWARD 2008
OUTSTANDING INVESTEE
COMPANIES AWARD
FROM MVCA25 March 2011
TOP RENEWABLE ENERGY PLANT AWARDILLINOIS, USA
MAY 2011

Baharuddin Bin Ali
7th Asian School on Renewable Energy, Puri Pujangga UKM, Malaysia, 16th-20th June 2014
Recognition
174
1
Ruj kami: eu-perak-s09/Speaker/corecomp
30 June 2009
Mr. Abdul Nasir bin Adnan
Chief Executive Officer
Core Competencies Sdn Bhd
16-2, Jalan SD7/3A
Bandar Sri Damansara
52200 Kuala Lumpur
Sir,
INVITATION TO SPEAK AT THE EU-PERAK SOLID WASTE
MANAGEMENT PLANNING SEMINAR ON 4TH AUGUST 2009 AT
IMPIANA CASUARINA HOTEL, IPOH
We are pleased to inform you that EU-Asia Sustainable Waste Management
Cycle (EA-SWMC), a project funded by the European Commission (EC) under
the Asia Pro Eco Programme, jointly promoted by The State Government of
Perak, The Association of Environmental Consultants and Companies of
Malaysia (AECCOM), The International Urban Development Association
(INTA) – The Netherlands, ICLEI Eyropean Secretariat GmbH – Germany
and Danish Topic Centre on Waste and Resources (DTC/WR), Shrophshire
County Council – UK will be hosting the EU-Perak Solid Waste Management
Planning Seminar on 4th
August 2009 at Impiana Casuarina Hotel in Ipoh,
Perak, Malaysia.
This project has completed series of capacity building programmes, seminar,
international conference, research to complete the Perak Solid Waste Management
Plan. Based on collective effort of multi-stakeholders, EU experts and Malaysia
government officers from 3 levels of government, the project has identified
relevant findings, good practices and recommendation in order to create better
environmental stewardship which will be presented at the seminar.
EA-SWMC has identified RDF as feasible technological solution to address solid
waste management in Malaysia. We are pleased to invite you to give a presentation
on RDF in this seminar. The seminar will be attended by 150 – 200 multi-
stakeholders from 3 levels of government, industry representatives and NGOs. The
details of our invitation are as following:-
presents
EU-Perak Solid Waste Management Planning Seminar
4th
– 5th
August 2009
Impiana Casuarina Hotel, Ipoh, Perak
Seminar Secretariat:
EA-SWMC has identified RDF as feasible technological solution to address solid waste management in
Malaysia.
20 June 2008

Baharuddin Bin Ali
7th Asian School on Renewable Energy, Puri Pujangga UKM, Malaysia, 16th-20th June 2014
Recognition – May 9, 2011
175
December 2010

Baharuddin Bin Ali
7th Asian School on Renewable Energy, Puri Pujangga UKM, Malaysia, 16th-20th June 2014
Recognition
176
This Power Plant utilizes municipal solid waste and is also the first in Malaysian to be connected to the TNB grid
20 July 2009.

Baharuddin Bin Ali
7th Asian School on Renewable Energy, Puri Pujangga UKM, Malaysia, 16th-20th June 2014
Commitment Required : Stakeholders Support
177
ECONOMY ENERGY
SOCIETYENVIRONMENT