biomass and bioenergy resource...
TRANSCRIPT
Biomass and Bioenergy Resource Assessment
State of Hawaii
Prepared for
State of Hawaii Department of Business, Economic Development
and Tourism
by
University of Hawaii Hawaii Natural Energy Institute
School of Ocean and Earth Sciences and Technology
Scott Q. Turn Vheissu Keffer
Milton Staackmann
December 2002
The United States Department of Energy provided funds for this report under Cooperative Agreement No. DE-FC51-02R021318. This report was prepared as an account of work sponsored by the United States Government. Neither the United States Government nor any agency thereof, nor any of their employees, makes any warranty, express or implied, or assumes any legal liability or responsibility for the accuracy, completeness, or usefulness of any information, apparatus, product, or process disclosed, or represents that its use would not infringe privately owned rights. Reference herein to any specific commercial product, process, or service by trade name, mark, manufacturer, or otherwise, does not necessarily constitute or imply its endorsement, recommendation, or favoring by the United States government or any agency thereof. The views and opinions of the authors expressed herein do not necessarily state or reflect those of the United States Government or any agency thereof.
This report has been cataloged as follows: Turn, Scott Q. Biomass and bioenergy resource assessment, State of Hawaii, by Scott Q. Turn, Vheissu Keffer, and Milton Staackmann. Honolulu: Hawaii Natural Energy Institute, School of Ocean and Earth Sciences and Technology, University of Hawaii, 2002. Prepared for the State of Hawaii, Dept. of Business, Economic Development and Tourism. 1. Renewable energy resources-Hawaii. 2. Biomass energy-Hawaii. I. Keffer, Vheissu. II. Staackmann, Milton HD9502.5.B54.T8.2002
Table of Contents
Abstract ........................................................................................................................................... 1
1. Introduction................................................................................................................................ 2
2. Summary of Biomass Resources in Hawaii............................................................................... 2
2.1 Animal Wastes ..................................................................................................................... 2
2.1.1 Swine............................................................................................................................. 2
2.1.2 Cattle Manure................................................................................................................ 6
2.1.3 Poultry Manure ............................................................................................................. 9
2.2 Forest Industry Residues.................................................................................................... 10
2.2.1 Forest Products............................................................................................................ 10
2.3.2 Forest Resources ......................................................................................................... 11
2.3 Agricultural Residues......................................................................................................... 14
2.3.1 Sugar ........................................................................................................................... 14
2.3.2 Pineapple..................................................................................................................... 16
2.3.3 Macadamia Nuts ......................................................................................................... 16
2.4 Urban Waste....................................................................................................................... 18
2.4.1 Municipal Solid Waste................................................................................................ 18
2.4.2 Food Waste ................................................................................................................. 27
2.4.3 Sewage Sludge/Biosolids............................................................................................ 29
2.4.4 Landfill Gas Recovery ................................................................................................ 31
2.4.5 Fat, Oil, and Grease .................................................................................................... 32
3. Summary and Conclusions ...................................................................................................... 35
4. References................................................................................................................................ 36
List of Figures
Figure 1. Livestock populations in Hawaii for the period from 1992 to 2002. [1]........................ 3 Figure 2. Estimates of manure production (@ 90.8% moisture) for breeding and market hogs
based on animal weight [6]. .................................................................................................... 5 Figure 3. Distribution of hog sizes in the 2003 Hawaii swine industry [3]. .................................. 5 Figure 4. Estimates of manure production (@ 87.3% moisture) for dairy animals based on
animal weight [6, 9]. ............................................................................................................... 7 Figure 5. Jaako Pöyry estimates of areas of potential timber plantations (shown in parentheses)
for the island of Hawaii by district [12]................................................................................ 14 Figure 6. Summary of pineapple harvested acreage and production in Hawaii for the period 1998
to 2002 [24]. Arrows indicate appropriate axis. .................................................................. 17 Figure 7. Summary of macadamia nut harvest acreages and nut-in-shell delivered to processors
from 1998 to 2002. Crop year is period from July 1 of previous year to June 30 of year indicated [27]. Arrows indicate appropriate axis. ................................................................ 18
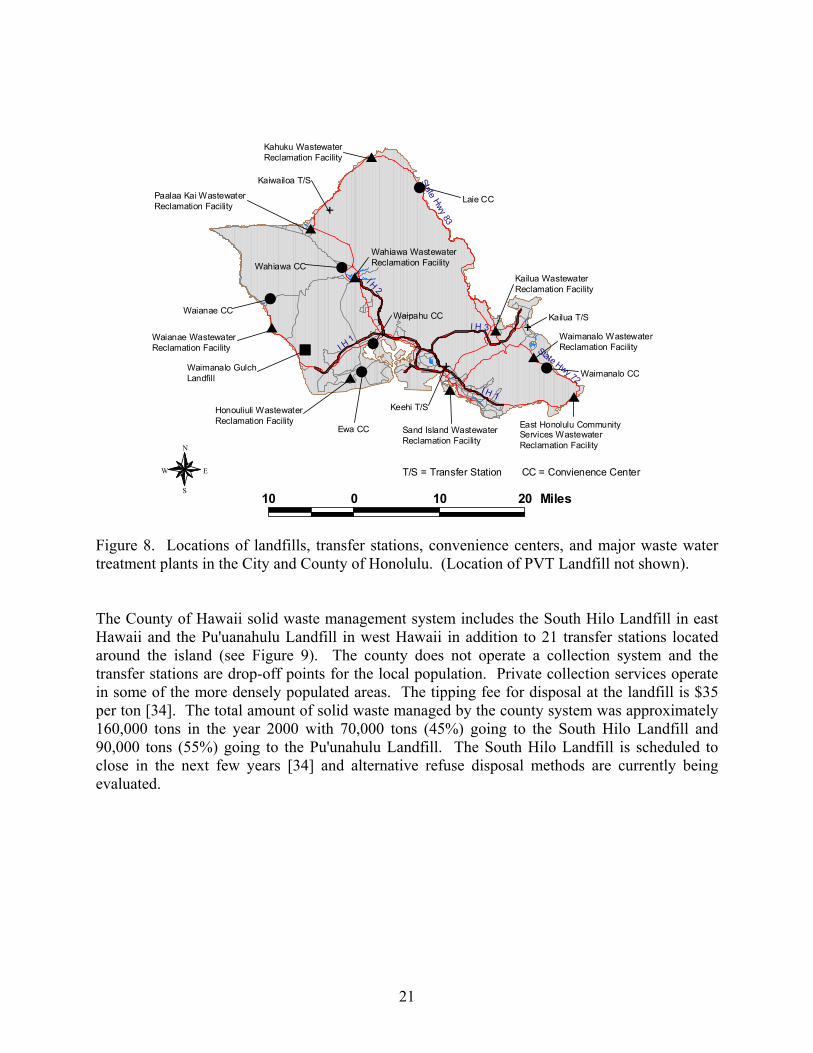
Figure 8. Locations of landfills, transfer stations, convenience centers, and major waste water
treatment plants in the City and County of Honolulu. (Location of PVT Landfill not shown)................................................................................................................................... 21
Figure 9. Locations of landfills, transfer stations, and waste water treatment plants on Hawaii
[34]. ....................................................................................................................................... 22 Figure 10. Locations of landfills, transfer stations, and waste water treatment plants in Maui
County [38]. .......................................................................................................................... 24 Figure 11. Locations of landfill, transfer stations, and waste water treatment plants on Kauai
[39]. ....................................................................................................................................... 26 Figure 12. Distribution of food waste generators in Honolulu based on data self reported to the
City and County in 1997 [43] and from client lists of MLC International [45]. The City and County data set was not complete but represents best available information....................... 28
List of Tables
Table 1. Summary of swine populations and hog farm sizes in Hawaii, 1997 data [2]. ............... 4 Table 2. Summary of hog population and manure production by county. .................................... 6 Table 3. Summary of cattle inventory in the state of Hawaii in 2002 [8]...................................... 8 Table 4. Summary of 1997 chicken operations with egg producers 20 weeks or older [2]........... 9 Table 5. Estimates of chicken inventories and manure resources in Hawaii............................... 10 Table 6. Summary of product options and associated forest area and timber requirements for
Hawaii processing facilities [12]. ............................................................................... 12 Table 7. Summary of Waiakea and Hamakua Coast timber and bioenergy resource estimates
based on a 15 year harvest schedule. .......................................................................... 13 Table 8. Potential bioenergy feedstocks generated by the Hawaii sugar industry in 2002. ........ 15 Table 9. Summary of Oahu's waste composition and recycling/diversion program in 2002 [30].
..................................................................................................................................... 20 Table 10. Composition of the material entering the South Hilo Landfill [34]. ........................... 23 Table 11. Summary of 1994 solid waste characterization conducted for Maui County [38]. ..... 25 Table 12. Distribution of food waste generators in Honolulu by zip code from available data. . 29 Table 13. Summary of number, location, and ownership of wastewater treatment plants
(WWTP) and 1999 sludge production and amount diverted from landfilling in Hawaii [46]. ............................................................................................................................. 31
Table 14. Estimates of urban grease resources in the State of Hawaii using factors from [44]. . 34 Table 15. Summary of biomass resources and biomass resource utilization in the State of Hawaii
broken down by County.............................................................................................. 35
1
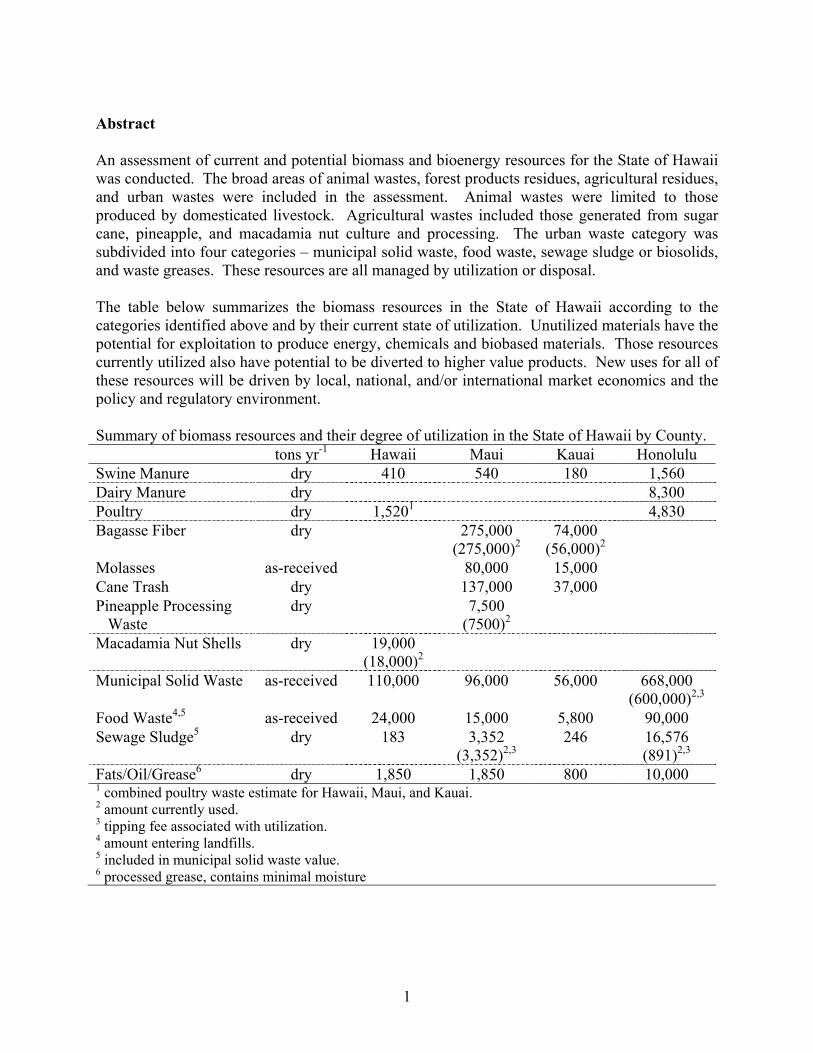
Abstract An assessment of current and potential biomass and bioenergy resources for the State of Hawaii was conducted. The broad areas of animal wastes, forest products residues, agricultural residues, and urban wastes were included in the assessment. Animal wastes were limited to those produced by domesticated livestock. Agricultural wastes included those generated from sugar cane, pineapple, and macadamia nut culture and processing. The urban waste category was subdivided into four categories – municipal solid waste, food waste, sewage sludge or biosolids, and waste greases. These resources are all managed by utilization or disposal. The table below summarizes the biomass resources in the State of Hawaii according to the categories identified above and by their current state of utilization. Unutilized materials have the potential for exploitation to produce energy, chemicals and biobased materials. Those resources currently utilized also have potential to be diverted to higher value products. New uses for all of these resources will be driven by local, national, and/or international market economics and the policy and regulatory environment. Summary of biomass resources and their degree of utilization in the State of Hawaii by County. tons yr-1 Hawaii Maui Kauai Honolulu Swine Manure dry 410 540 180 1,560 Dairy Manure dry 8,300 Poultry dry 1,5201 4,830 Bagasse Fiber dry 275,000
(275,000)2 74,000
(56,000)2
Molasses as-received 80,000 15,000 Cane Trash dry 137,000 37,000 Pineapple Processing
Waste dry 7,500
(7500)2
Macadamia Nut Shells dry 19,000 (18,000)2
Municipal Solid Waste as-received 110,000 96,000 56,000 668,000 (600,000)2,3
Food Waste4,5 as-received 24,000 15,000 5,800 90,000 Sewage Sludge5 dry 183 3,352
(3,352)2,3 246 16,576
(891)2,3
Fats/Oil/Grease6 dry 1,850 1,850 800 10,000 1 combined poultry waste estimate for Hawaii, Maui, and Kauai. 2 amount currently used. 3 tipping fee associated with utilization. 4 amount entering landfills. 5 included in municipal solid waste value. 6 processed grease, contains minimal moisture
2
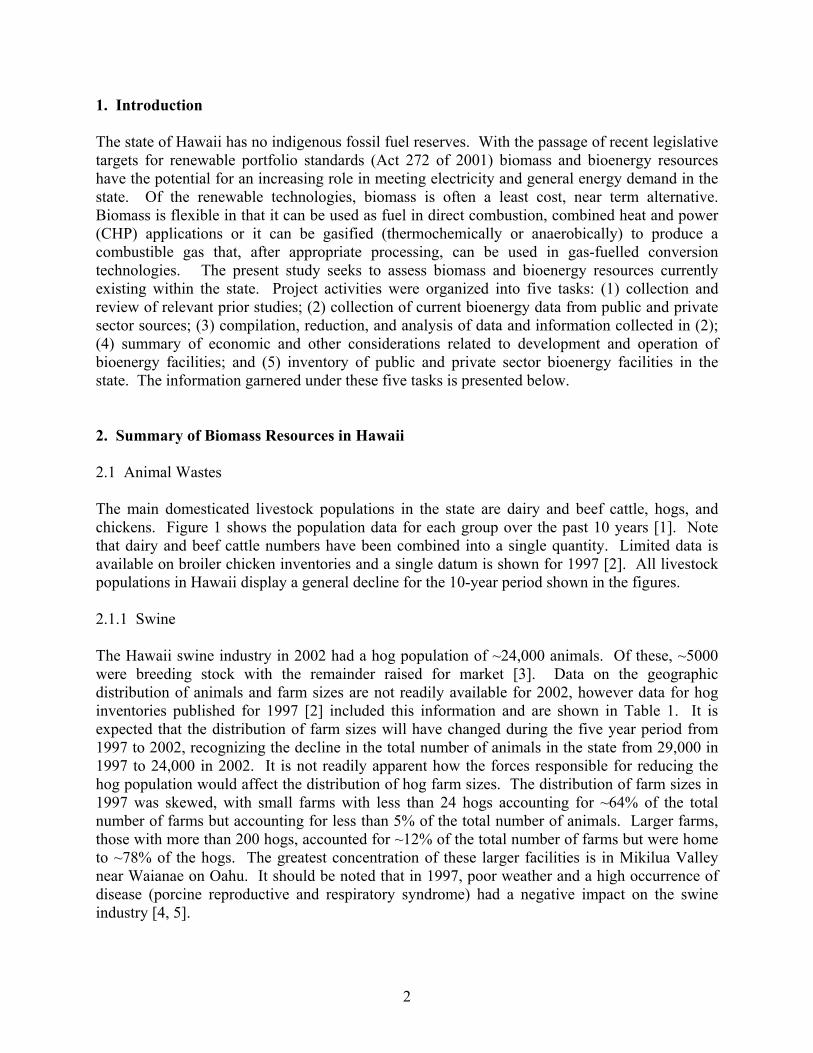
1. Introduction The state of Hawaii has no indigenous fossil fuel reserves. With the passage of recent legislative targets for renewable portfolio standards (Act 272 of 2001) biomass and bioenergy resources have the potential for an increasing role in meeting electricity and general energy demand in the state. Of the renewable technologies, biomass is often a least cost, near term alternative. Biomass is flexible in that it can be used as fuel in direct combustion, combined heat and power (CHP) applications or it can be gasified (thermochemically or anaerobically) to produce a combustible gas that, after appropriate processing, can be used in gas-fuelled conversion technologies. The present study seeks to assess biomass and bioenergy resources currently existing within the state. Project activities were organized into five tasks: (1) collection and review of relevant prior studies; (2) collection of current bioenergy data from public and private sector sources; (3) compilation, reduction, and analysis of data and information collected in (2); (4) summary of economic and other considerations related to development and operation of bioenergy facilities; and (5) inventory of public and private sector bioenergy facilities in the state. The information garnered under these five tasks is presented below. 2. Summary of Biomass Resources in Hawaii 2.1 Animal Wastes The main domesticated livestock populations in the state are dairy and beef cattle, hogs, and chickens. Figure 1 shows the population data for each group over the past 10 years [1]. Note that dairy and beef cattle numbers have been combined into a single quantity. Limited data is available on broiler chicken inventories and a single datum is shown for 1997 [2]. All livestock populations in Hawaii display a general decline for the 10-year period shown in the figures. 2.1.1 Swine The Hawaii swine industry in 2002 had a hog population of ~24,000 animals. Of these, ~5000 were breeding stock with the remainder raised for market [3]. Data on the geographic distribution of animals and farm sizes are not readily available for 2002, however data for hog inventories published for 1997 [2] included this information and are shown in Table 1. It is expected that the distribution of farm sizes will have changed during the five year period from 1997 to 2002, recognizing the decline in the total number of animals in the state from 29,000 in 1997 to 24,000 in 2002. It is not readily apparent how the forces responsible for reducing the hog population would affect the distribution of hog farm sizes. The distribution of farm sizes in 1997 was skewed, with small farms with less than 24 hogs accounting for ~64% of the total number of farms but accounting for less than 5% of the total number of animals. Larger farms, those with more than 200 hogs, accounted for ~12% of the total number of farms but were home to ~78% of the hogs. The greatest concentration of these larger facilities is in Mikilua Valley near Waianae on Oahu. It should be noted that in 1997, poor weather and a high occurrence of disease (porcine reproductive and respiratory syndrome) had a negative impact on the swine industry [4, 5].
3
0
20
40
60
80
100
120
140
160
180
200
1992 1993 1994 1995 1996 1997 1998 1999 2000 2001 2002
num
ber i
n th
ousa
nds
all cattle milk cows hogs broiler chickens
(a)
0
200
400
600
800
1,000
1,200
1992 1993 1994 1995 1996 1997 1998 1999 2000 2001 2002
num
ber i
n th
ousa
nds
chickens (excluding broilers)
(b)
Figure 1. Livestock populations in Hawaii for the period from 1992 to 2002. [1]
4
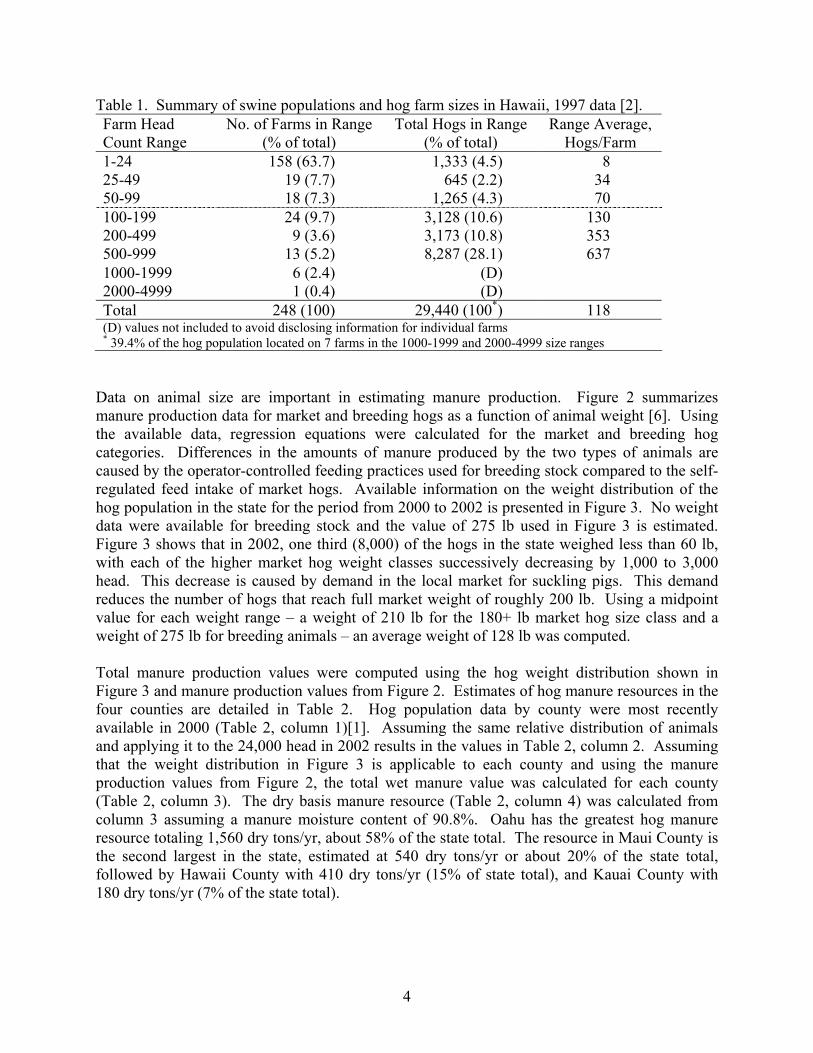
Table 1. Summary of swine populations and hog farm sizes in Hawaii, 1997 data [2]. Farm Head Count Range
No. of Farms in Range (% of total)
Total Hogs in Range (% of total)
Range Average, Hogs/Farm
1-24 158 (63.7) 1,333 (4.5) 8 25-49 19 (7.7) 645 (2.2) 34 50-99 18 (7.3) 1,265 (4.3) 70 100-199 24 (9.7) 3,128 (10.6) 130 200-499 9 (3.6) 3,173 (10.8) 353 500-999 13 (5.2) 8,287 (28.1) 637 1000-1999 6 (2.4) (D) 2000-4999 1 (0.4) (D) Total 248 (100) 29,440 (100*) 118 (D) values not included to avoid disclosing information for individual farms * 39.4% of the hog population located on 7 farms in the 1000-1999 and 2000-4999 size ranges
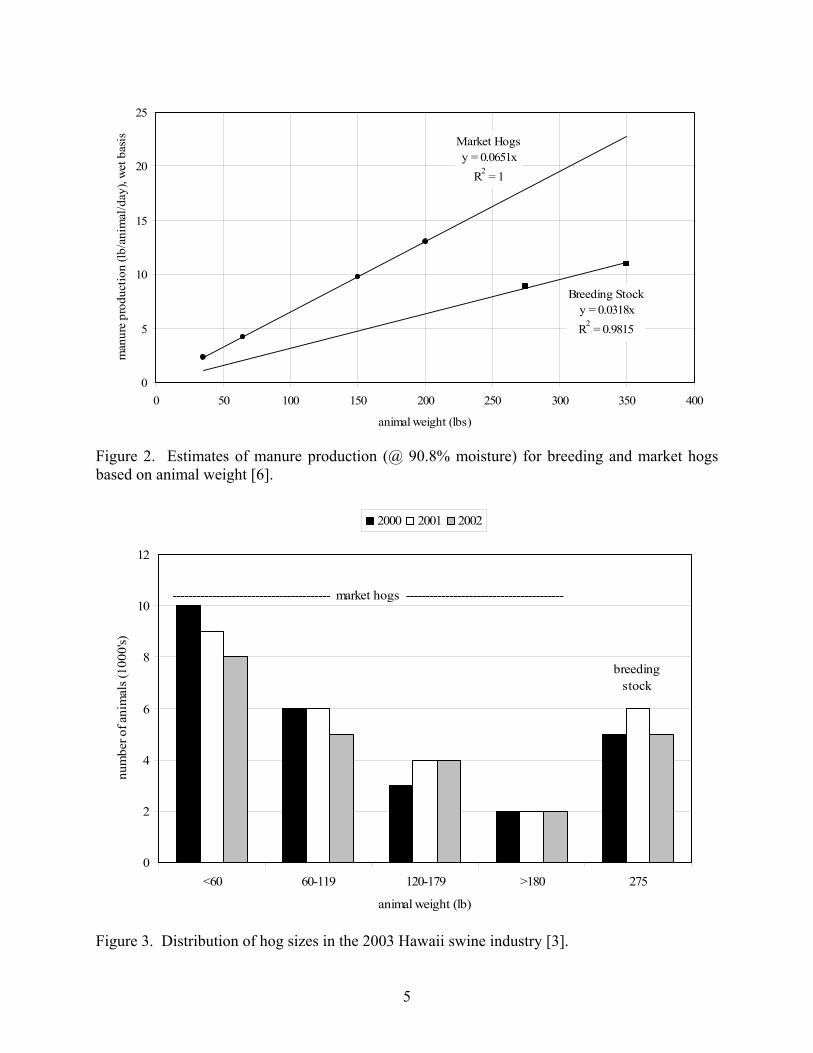
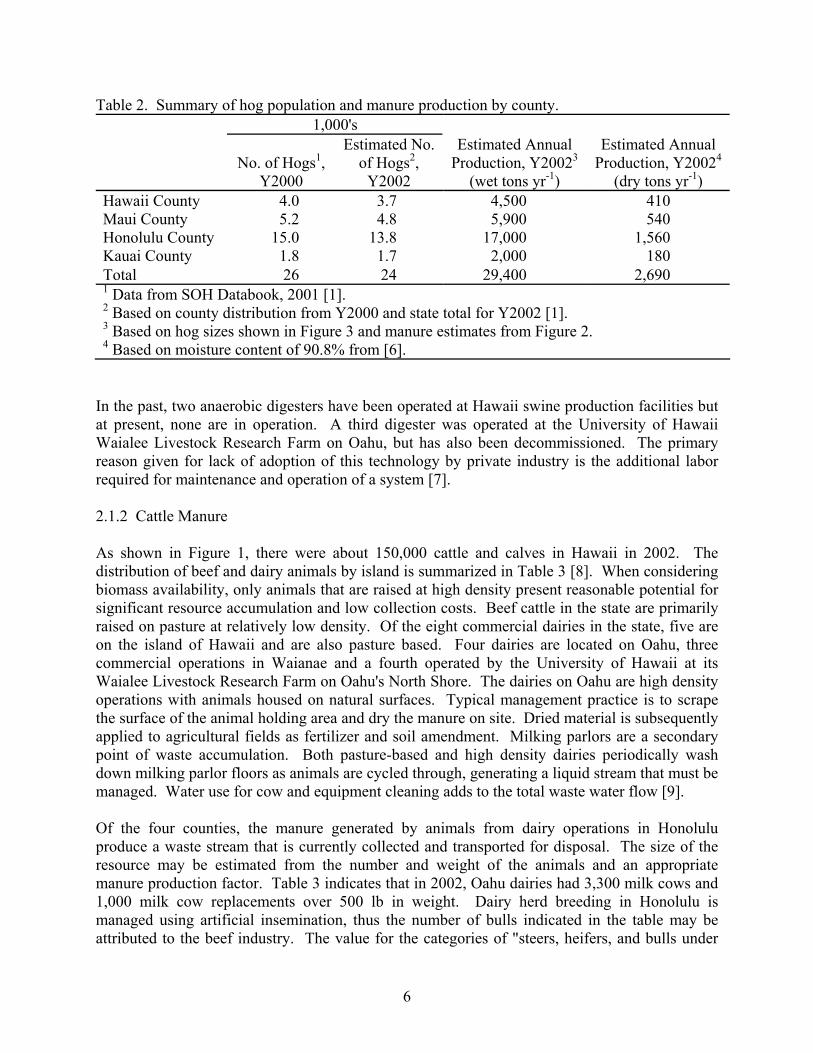
Data on animal size are important in estimating manure production. Figure 2 summarizes manure production data for market and breeding hogs as a function of animal weight [6]. Using the available data, regression equations were calculated for the market and breeding hog categories. Differences in the amounts of manure produced by the two types of animals are caused by the operator-controlled feeding practices used for breeding stock compared to the self-regulated feed intake of market hogs. Available information on the weight distribution of the hog population in the state for the period from 2000 to 2002 is presented in Figure 3. No weight data were available for breeding stock and the value of 275 lb used in Figure 3 is estimated. Figure 3 shows that in 2002, one third (8,000) of the hogs in the state weighed less than 60 lb, with each of the higher market hog weight classes successively decreasing by 1,000 to 3,000 head. This decrease is caused by demand in the local market for suckling pigs. This demand reduces the number of hogs that reach full market weight of roughly 200 lb. Using a midpoint value for each weight range – a weight of 210 lb for the 180+ lb market hog size class and a weight of 275 lb for breeding animals – an average weight of 128 lb was computed. Total manure production values were computed using the hog weight distribution shown in Figure 3 and manure production values from Figure 2. Estimates of hog manure resources in the four counties are detailed in Table 2. Hog population data by county were most recently available in 2000 (Table 2, column 1)[1]. Assuming the same relative distribution of animals and applying it to the 24,000 head in 2002 results in the values in Table 2, column 2. Assuming that the weight distribution in Figure 3 is applicable to each county and using the manure production values from Figure 2, the total wet manure value was calculated for each county (Table 2, column 3). The dry basis manure resource (Table 2, column 4) was calculated from column 3 assuming a manure moisture content of 90.8%. Oahu has the greatest hog manure resource totaling 1,560 dry tons/yr, about 58% of the state total. The resource in Maui County is the second largest in the state, estimated at 540 dry tons/yr or about 20% of the state total, followed by Hawaii County with 410 dry tons/yr (15% of state total), and Kauai County with 180 dry tons/yr (7% of the state total).
5
Market Hogsy = 0.0651x
R2 = 1
Breeding Stocky = 0.0318xR2 = 0.9815
0
5
10
15
20
25
0 50 100 150 200 250 300 350 400
animal weight (lbs)
man
ure
prod
uctio
n (lb
/ani
mal
/day
), w
et b
asis
Figure 2. Estimates of manure production (@ 90.8% moisture) for breeding and market hogs based on animal weight [6].
0
2
4
6
8
10
12
<60 60-119 120-179 >180 275
animal weight (lb)
num
ber o
f ani
mal
s (10
00's)
2000 2001 2002
---------------------------------------- market hogs ----------------------------------------
breedingstock
Figure 3. Distribution of hog sizes in the 2003 Hawaii swine industry [3].
6
Table 2. Summary of hog population and manure production by county. 1,000's
No. of Hogs1,
Y2000
Estimated No. of Hogs2,
Y2002
Estimated Annual Production, Y20023
(wet tons yr-1)
Estimated Annual Production, Y20024
(dry tons yr-1) Hawaii County 4.0 3.7 4,500 410 Maui County 5.2 4.8 5,900 540 Honolulu County 15.0 13.8 17,000 1,560 Kauai County 1.8 1.7 2,000 180 Total 26 24 29,400 2,690 1 Data from SOH Databook, 2001 [1]. 2 Based on county distribution from Y2000 and state total for Y2002 [1]. 3 Based on hog sizes shown in Figure 3 and manure estimates from Figure 2. 4 Based on moisture content of 90.8% from [6].
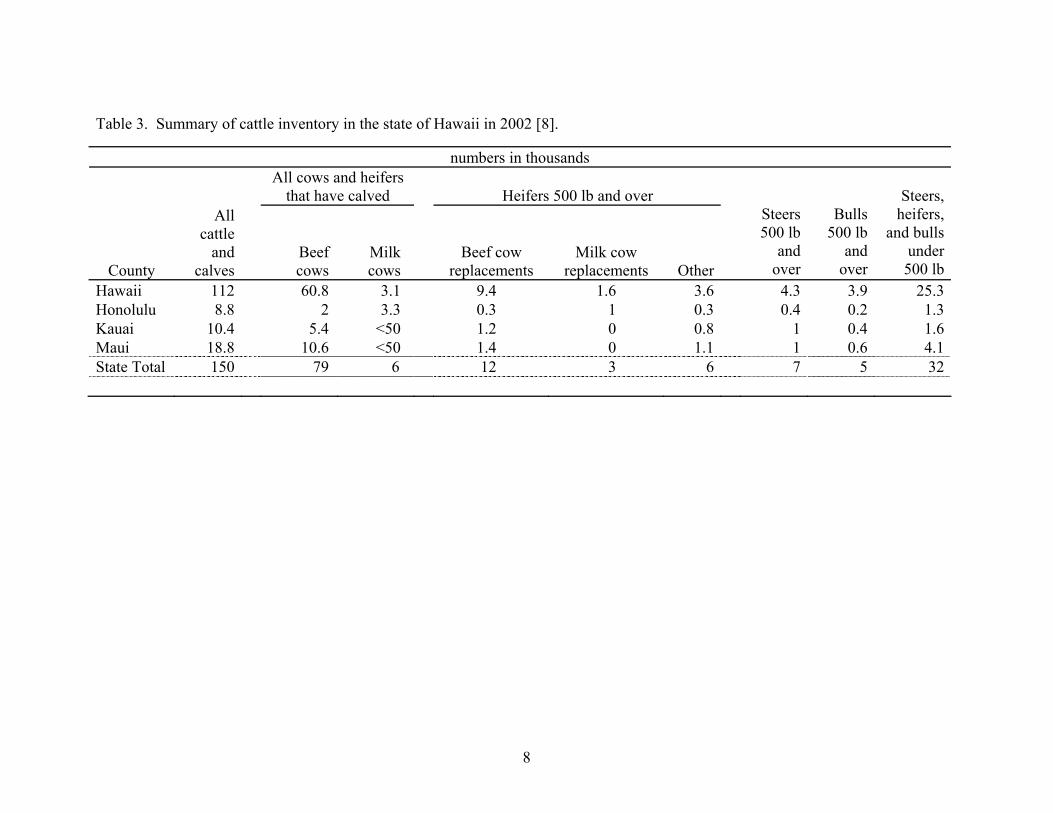
In the past, two anaerobic digesters have been operated at Hawaii swine production facilities but at present, none are in operation. A third digester was operated at the University of Hawaii Waialee Livestock Research Farm on Oahu, but has also been decommissioned. The primary reason given for lack of adoption of this technology by private industry is the additional labor required for maintenance and operation of a system [7]. 2.1.2 Cattle Manure As shown in Figure 1, there were about 150,000 cattle and calves in Hawaii in 2002. The distribution of beef and dairy animals by island is summarized in Table 3 [8]. When considering biomass availability, only animals that are raised at high density present reasonable potential for significant resource accumulation and low collection costs. Beef cattle in the state are primarily raised on pasture at relatively low density. Of the eight commercial dairies in the state, five are on the island of Hawaii and are also pasture based. Four dairies are located on Oahu, three commercial operations in Waianae and a fourth operated by the University of Hawaii at its Waialee Livestock Research Farm on Oahu's North Shore. The dairies on Oahu are high density operations with animals housed on natural surfaces. Typical management practice is to scrape the surface of the animal holding area and dry the manure on site. Dried material is subsequently applied to agricultural fields as fertilizer and soil amendment. Milking parlors are a secondary point of waste accumulation. Both pasture-based and high density dairies periodically wash down milking parlor floors as animals are cycled through, generating a liquid stream that must be managed. Water use for cow and equipment cleaning adds to the total waste water flow [9]. Of the four counties, the manure generated by animals from dairy operations in Honolulu produce a waste stream that is currently collected and transported for disposal. The size of the resource may be estimated from the number and weight of the animals and an appropriate manure production factor. Table 3 indicates that in 2002, Oahu dairies had 3,300 milk cows and 1,000 milk cow replacements over 500 lb in weight. Dairy herd breeding in Honolulu is managed using artificial insemination, thus the number of bulls indicated in the table may be attributed to the beef industry. The value for the categories of "steers, heifers, and bulls under
7
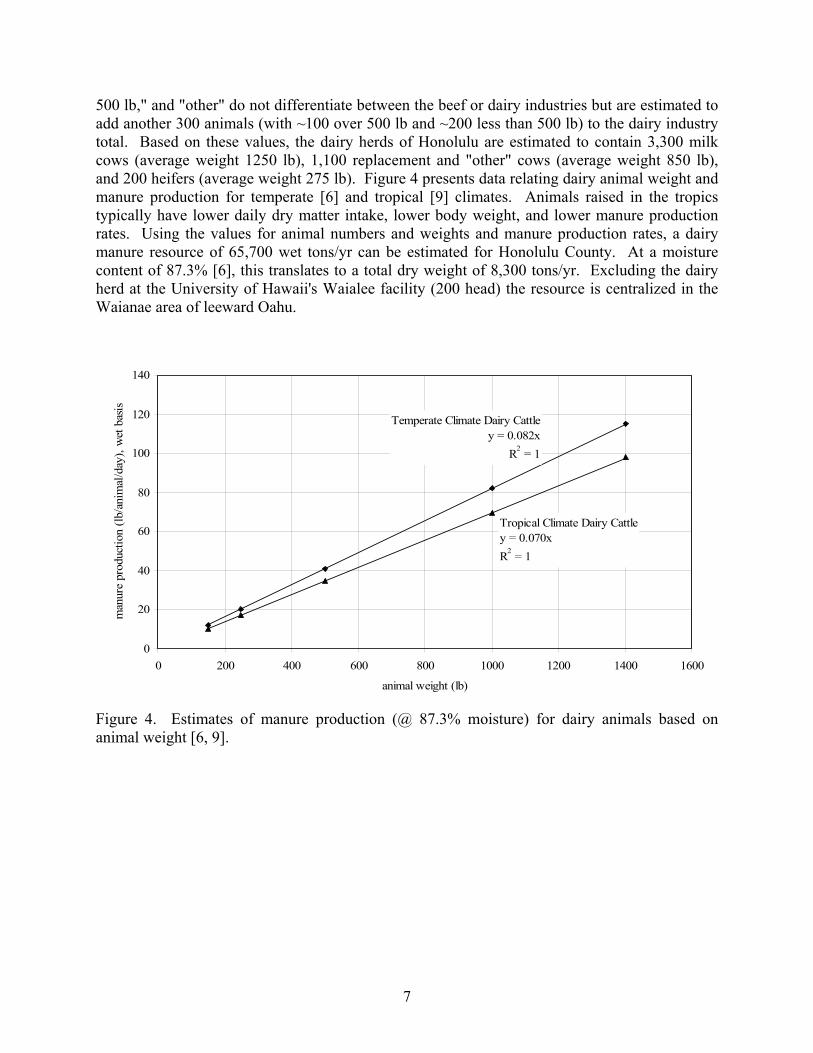
500 lb," and "other" do not differentiate between the beef or dairy industries but are estimated to add another 300 animals (with ~100 over 500 lb and ~200 less than 500 lb) to the dairy industry total. Based on these values, the dairy herds of Honolulu are estimated to contain 3,300 milk cows (average weight 1250 lb), 1,100 replacement and "other" cows (average weight 850 lb), and 200 heifers (average weight 275 lb). Figure 4 presents data relating dairy animal weight and manure production for temperate [6] and tropical [9] climates. Animals raised in the tropics typically have lower daily dry matter intake, lower body weight, and lower manure production rates. Using the values for animal numbers and weights and manure production rates, a dairy manure resource of 65,700 wet tons/yr can be estimated for Honolulu County. At a moisture content of 87.3% [6], this translates to a total dry weight of 8,300 tons/yr. Excluding the dairy herd at the University of Hawaii's Waialee facility (200 head) the resource is centralized in the Waianae area of leeward Oahu.
Temperate Climate Dairy Cattley = 0.082x
R2 = 1
Tropical Climate Dairy Cattley = 0.070xR2 = 1
0
20
40
60
80
100
120
140
0 200 400 600 800 1000 1200 1400 1600
animal weight (lb)
man
ure
prod
uctio
n (lb
/ani
mal
/day
), w
et b
asis
Figure 4. Estimates of manure production (@ 87.3% moisture) for dairy animals based on animal weight [6, 9].
8
Table 3. Summary of cattle inventory in the state of Hawaii in 2002 [8].
numbers in thousands
All cows and heifers
that have calved Heifers 500 lb and over
County
All cattle
and calves
Beef cows
Milk cows
Beef cow replacements
Milk cow replacements Other
Steers 500 lb
and over
Bulls 500 lb
and over
Steers, heifers,
and bulls under 500 lb
Hawaii 112 60.8 3.1 9.4 1.6 3.6 4.3 3.9 25.3Honolulu 8.8 2 3.3 0.3 1 0.3 0.4 0.2 1.3Kauai 10.4 5.4 <50 1.2 0 0.8 1 0.4 1.6Maui 18.8 10.6 <50 1.4 0 1.1 1 0.6 4.1State Total 150 79 6 12 3 6 7 5 32

9
2.1.3 Poultry Manure Figure 1 presents data on chicken populations in the State of Hawaii over the past 10 years. Figure 1 (b) shows a decline in the population of chickens (excluding broilers) over the period from 1992 through 1998 and relatively stable populations of ~720,000 birds thereafter through 2000, the last year that data was published in the State of Hawaii Data Book [1]. Data for 2001 published by the Hawaii Agricultural Statistics Service [10] is also presented in the figure. More recent data for the months of October and November, 2002, published by the Hawaii Agricultural Statistics Service [11] indicate that the number of laying hens present in the state was ~535,000. Honolulu County accounted for 76% of this total with the remaining 24% (128,000 birds) distributed over the neighbor island counties. Time series data was not available for broiler populations but a census conducted in 1997 indicates a population of ~112,000 broilers in the state and this is indicated as a single point on the chart in Figure 1(a). Published information regarding the size of chicken production operations and their distribution within the state is not readily available due to the limited number of operations and the wish to protect the privacy of individual businesses. Available data on farm sizes with laying birds 20 weeks or older from a census conducted in 1997 is summarized in Table 4. Approximately 0.5% of the chickens reported in Table 4 were found on farms with less than 3,200 birds and less than 5% on farms with less than 20,000 birds, indicating that roughly 95% of the birds are located on seven farms of 20,000 or more birds. The four largest farms, those with more than 50,000 birds, account for more than 75% of the total. Table 4. Summary of 1997 chicken operations with egg producers 20 weeks or older [2].
Farms with Inventory of No. of Farms % of Farms
No. of Birds in Range
% of Total No. of Birds
1-49 114 83.8 1,543 0.22 50-99 6 4.4 300 0.04 100-399 4 2.9 600 0.08 400-3,199 3 2.2 1,300 0.18 3,200-9,999 1 0.7 * * 10,000-19,999 1 0.7 * * 20,000-49,999 3 2.2 132,168 18.5 50,000-99,999 2 1.5 * * >100,000 2 1.5 * * Total 136 714,924 * Withheld to avoid disclosure of individual operations
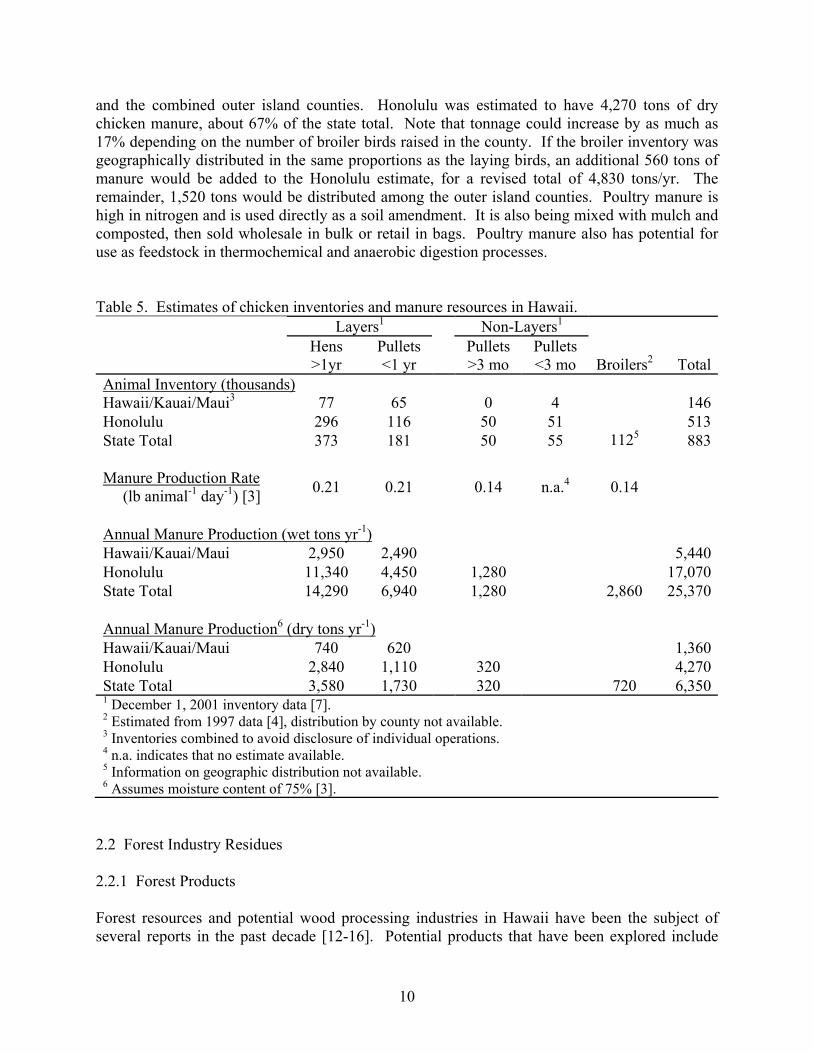
Classification of chicken inventories and manure production by age and egg production status for two geographic regions in the state is summarized in Table 5. The non-broiler data indicate that at least 58% of the chickens in the state are located in Honolulu County. Taking into account that broiler production companies operate in Honolulu County, the actual percentage would be higher. Daily manure production values based on bird weight and age are listed in the table for each category. These were used to calculate annual manure production estimates for Honolulu
10
and the combined outer island counties. Honolulu was estimated to have 4,270 tons of dry chicken manure, about 67% of the state total. Note that tonnage could increase by as much as 17% depending on the number of broiler birds raised in the county. If the broiler inventory was geographically distributed in the same proportions as the laying birds, an additional 560 tons of manure would be added to the Honolulu estimate, for a revised total of 4,830 tons/yr. The remainder, 1,520 tons would be distributed among the outer island counties. Poultry manure is high in nitrogen and is used directly as a soil amendment. It is also being mixed with mulch and composted, then sold wholesale in bulk or retail in bags. Poultry manure also has potential for use as feedstock in thermochemical and anaerobic digestion processes. Table 5. Estimates of chicken inventories and manure resources in Hawaii. Layers1 Non-Layers1
Hens >1yr
Pullets <1 yr
Pullets >3 mo
Pullets <3 mo Broilers2 Total
Animal Inventory (thousands) Hawaii/Kauai/Maui3 77 65 0 4 146Honolulu 296 116 50 51 513State Total 373 181 50 55 1125 883 Manure Production Rate (lb animal-1 day-1) [3] 0.21 0.21 0.14 n.a.4 0.14
Annual Manure Production (wet tons yr-1) Hawaii/Kauai/Maui 2,950 2,490 5,440Honolulu 11,340 4,450 1,280 17,070State Total 14,290 6,940 1,280 2,860 25,370 Annual Manure Production6 (dry tons yr-1) Hawaii/Kauai/Maui 740 620 1,360Honolulu 2,840 1,110 320 4,270State Total 3,580 1,730 320 720 6,3501 December 1, 2001 inventory data [7]. 2 Estimated from 1997 data [4], distribution by county not available. 3 Inventories combined to avoid disclosure of individual operations. 4 n.a. indicates that no estimate available. 5 Information on geographic distribution not available. 6 Assumes moisture content of 75% [3].
2.2 Forest Industry Residues 2.2.1 Forest Products Forest resources and potential wood processing industries in Hawaii have been the subject of several reports in the past decade [12-16]. Potential products that have been explored include
11
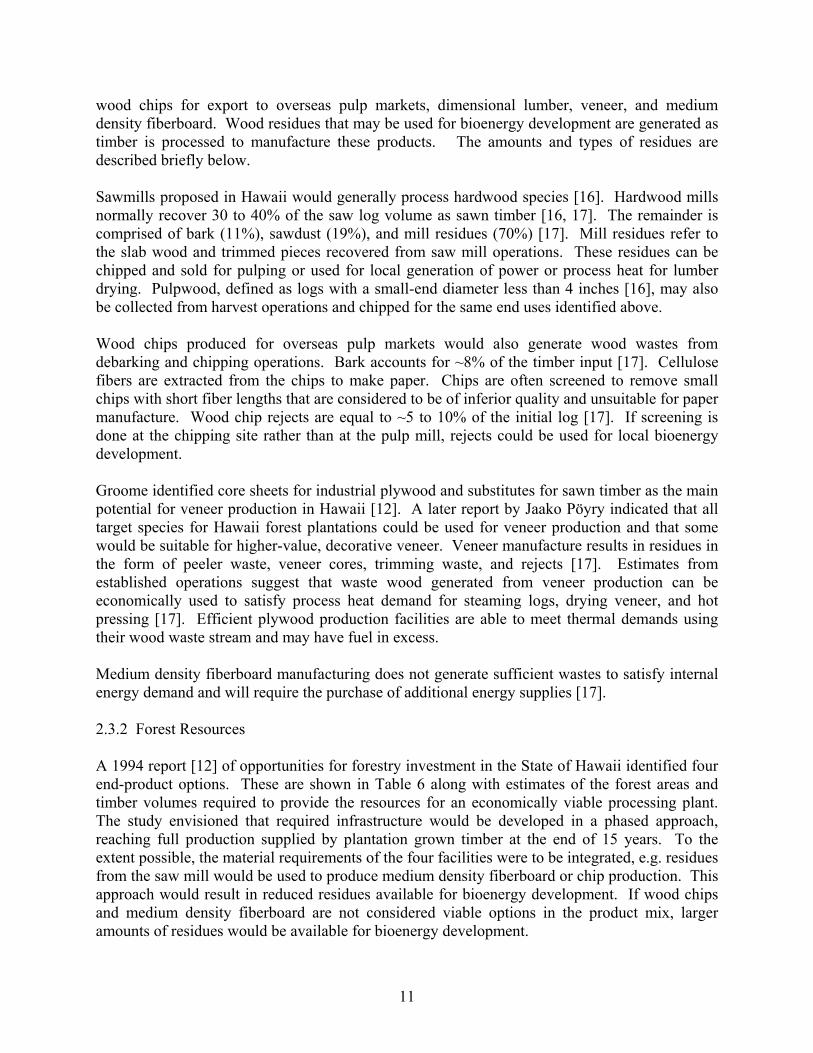
wood chips for export to overseas pulp markets, dimensional lumber, veneer, and medium density fiberboard. Wood residues that may be used for bioenergy development are generated as timber is processed to manufacture these products. The amounts and types of residues are described briefly below. Sawmills proposed in Hawaii would generally process hardwood species [16]. Hardwood mills normally recover 30 to 40% of the saw log volume as sawn timber [16, 17]. The remainder is comprised of bark (11%), sawdust (19%), and mill residues (70%) [17]. Mill residues refer to the slab wood and trimmed pieces recovered from saw mill operations. These residues can be chipped and sold for pulping or used for local generation of power or process heat for lumber drying. Pulpwood, defined as logs with a small-end diameter less than 4 inches [16], may also be collected from harvest operations and chipped for the same end uses identified above. Wood chips produced for overseas pulp markets would also generate wood wastes from debarking and chipping operations. Bark accounts for ~8% of the timber input [17]. Cellulose fibers are extracted from the chips to make paper. Chips are often screened to remove small chips with short fiber lengths that are considered to be of inferior quality and unsuitable for paper manufacture. Wood chip rejects are equal to ~5 to 10% of the initial log [17]. If screening is done at the chipping site rather than at the pulp mill, rejects could be used for local bioenergy development. Groome identified core sheets for industrial plywood and substitutes for sawn timber as the main potential for veneer production in Hawaii [12]. A later report by Jaako Pöyry indicated that all target species for Hawaii forest plantations could be used for veneer production and that some would be suitable for higher-value, decorative veneer. Veneer manufacture results in residues in the form of peeler waste, veneer cores, trimming waste, and rejects [17]. Estimates from established operations suggest that waste wood generated from veneer production can be economically used to satisfy process heat demand for steaming logs, drying veneer, and hot pressing [17]. Efficient plywood production facilities are able to meet thermal demands using their wood waste stream and may have fuel in excess. Medium density fiberboard manufacturing does not generate sufficient wastes to satisfy internal energy demand and will require the purchase of additional energy supplies [17]. 2.3.2 Forest Resources A 1994 report [12] of opportunities for forestry investment in the State of Hawaii identified four end-product options. These are shown in Table 6 along with estimates of the forest areas and timber volumes required to provide the resources for an economically viable processing plant. The study envisioned that required infrastructure would be developed in a phased approach, reaching full production supplied by plantation grown timber at the end of 15 years. To the extent possible, the material requirements of the four facilities were to be integrated, e.g. residues from the saw mill would be used to produce medium density fiberboard or chip production. This approach would result in reduced residues available for bioenergy development. If wood chips and medium density fiberboard are not considered viable options in the product mix, larger amounts of residues would be available for bioenergy development.
12
Table 6. Summary of product options and associated forest area and timber requirements for Hawaii processing facilities [12].
Product Required Forest Area (acre)
Required Annual Timber
Volume1 (106 ft3) Wood chips for export 30,000 17.7 Medium density fiberboard 10,000 6.4 Dimensional lumber 4,000 4.2 Veneer 15,000 1.1 1 Volume requirements assumed integration of facilities.
A second study completed in 2000 entitled Market Research on Commodity Wood Products from 8 Non-Native, Hawaiian Grown Timber Species was prepared by Jaakko Pöyry Consulting (Asia-Pacific ) Pty. Ltd. The Jaakko Pöyry report was prepared for the Hawaii Forest Industry Association with funding from the Hawaii Forestry & Communities Initiative [16]. Much of the wood resource estimates from this study were based on timber inventories available from State of Hawaii owned timber stands on the island of Hawaii. The inventories are briefly described below. The island of Hawaii currently has the largest forest plantings with commercial potential in the state. The State of Hawaii has about 12,000 acres of timber resources in the Waiakea Timber Management Area (WTMA) containing more than 10 different major tree species [13]. Age and size of timber in the WTMA varies by species and location. The area was originally planted in the mid 1960's and some tracts have been harvested and replanted. The WTMA is largely comprised of non-native tree species, the exception being ~500 acres of ohia (Metrosideros polymorpha) and koa (Acacia koa). Roughly 33% of the WTMA is planted in five eucalyptus species with Eucalyptus saligna and E. grandis present in greatest abundance. The WTMA acreage is not in a contiguous land area but is contained within a rectangle roughly five miles wide by 12 miles long bounding the Stainback Highway leaving Hilo. The state also has nearly 6,300 acres of non-native timber along the Hamakua Coast, extending from the Hamakua Forest Reserve (located roughly 8 miles west of Honokaa) to the Hilo Forest Reserve located ~5 miles west of Hilo [14]. This area measures ~40 miles from end to end. Plantings are not contiguous and are contained within 144 timber stands, some of which are located adjacent to one another. Roughly 5300 acres of the Hamakua Coast timber land is planted in more than six eucalyptus species with Eucalyptus robusta the largest single component occupying ~2,500 acres. Smaller state-owned non-native timber plantings are located in the Kohala Forest Reserve and Puu O Umi Natural Area Reserve (164 acres) north of Waimea town, in the Honuaula and Waiaha Springs Forest Reserves (355 acres) on the west side of the island, and in the Ka'u Forest Reserve (165 acres) in the Ka'u district [15].
13
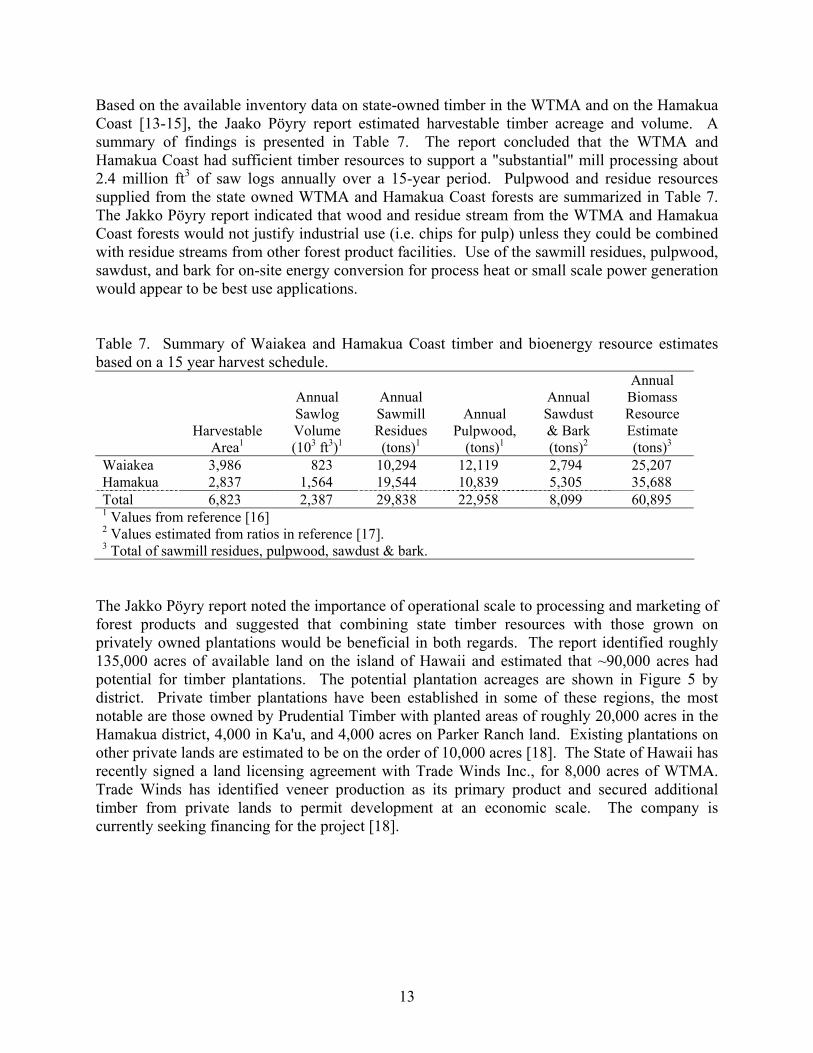
Based on the available inventory data on state-owned timber in the WTMA and on the Hamakua Coast [13-15], the Jaako Pöyry report estimated harvestable timber acreage and volume. A summary of findings is presented in Table 7. The report concluded that the WTMA and Hamakua Coast had sufficient timber resources to support a "substantial" mill processing about 2.4 million ft3 of saw logs annually over a 15-year period. Pulpwood and residue resources supplied from the state owned WTMA and Hamakua Coast forests are summarized in Table 7. The Jakko Pöyry report indicated that wood and residue stream from the WTMA and Hamakua Coast forests would not justify industrial use (i.e. chips for pulp) unless they could be combined with residue streams from other forest product facilities. Use of the sawmill residues, pulpwood, sawdust, and bark for on-site energy conversion for process heat or small scale power generation would appear to be best use applications. Table 7. Summary of Waiakea and Hamakua Coast timber and bioenergy resource estimates based on a 15 year harvest schedule.
Harvestable
Area1
Annual Sawlog Volume (103 ft3)1
Annual Sawmill Residues (tons)1
Annual Pulpwood,
(tons)1
Annual Sawdust & Bark (tons)2
Annual Biomass Resource Estimate (tons)3
Waiakea 3,986 823 10,294 12,119 2,794 25,207 Hamakua 2,837 1,564 19,544 10,839 5,305 35,688 Total 6,823 2,387 29,838 22,958 8,099 60,895 1 Values from reference [16] 2 Values estimated from ratios in reference [17]. 3 Total of sawmill residues, pulpwood, sawdust & bark.
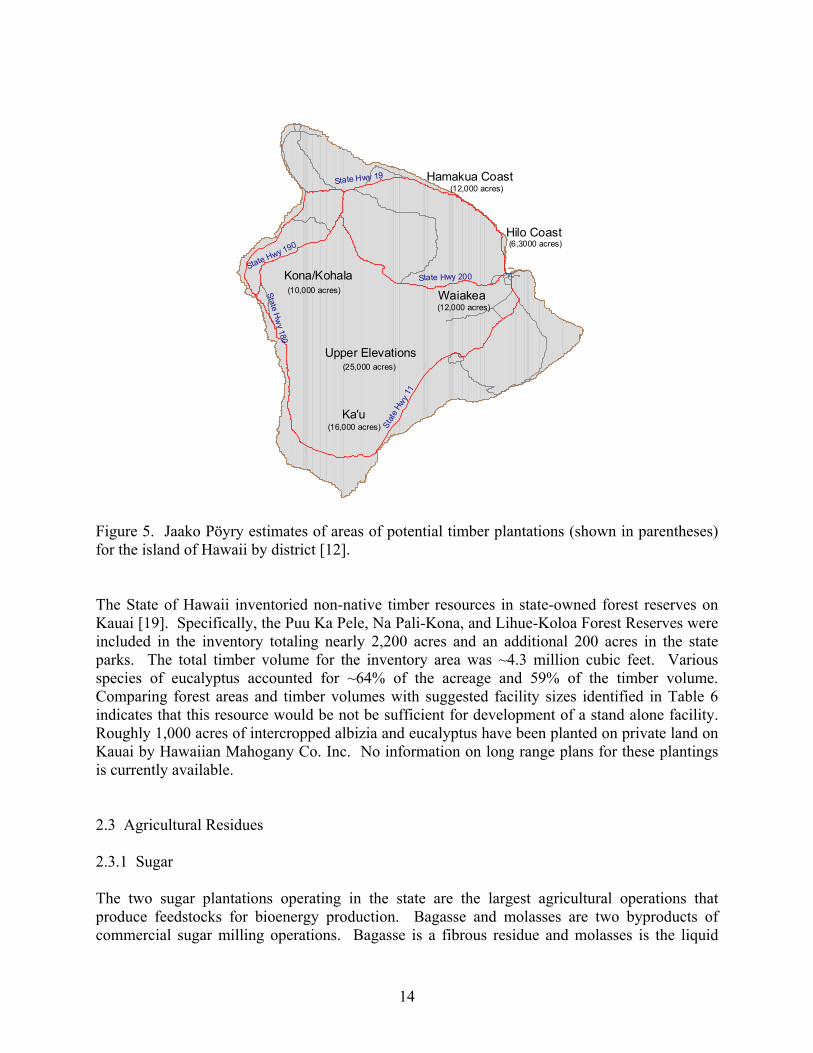
The Jakko Pöyry report noted the importance of operational scale to processing and marketing of forest products and suggested that combining state timber resources with those grown on privately owned plantations would be beneficial in both regards. The report identified roughly 135,000 acres of available land on the island of Hawaii and estimated that ~90,000 acres had potential for timber plantations. The potential plantation acreages are shown in Figure 5 by district. Private timber plantations have been established in some of these regions, the most notable are those owned by Prudential Timber with planted areas of roughly 20,000 acres in the Hamakua district, 4,000 in Ka'u, and 4,000 acres on Parker Ranch land. Existing plantations on other private lands are estimated to be on the order of 10,000 acres [18]. The State of Hawaii has recently signed a land licensing agreement with Trade Winds Inc., for 8,000 acres of WTMA. Trade Winds has identified veneer production as its primary product and secured additional timber from private lands to permit development at an economic scale. The company is currently seeking financing for the project [18].
14
Stat
e Hwy
11
State Hwy 19
State Hwy 200State Hwy 190
State Hw
y 180
Hilo Coast
Hamakua Coast
Upper Elevations
Ka'u
Kona/Kohala
(16,000 acres)
(25,000 acres)
(10,000 acres)
(12,000 acres)
(12,000 acres)
(6,3000 acres)
Waiakea
Figure 5. Jaako Pöyry estimates of areas of potential timber plantations (shown in parentheses) for the island of Hawaii by district [12]. The State of Hawaii inventoried non-native timber resources in state-owned forest reserves on Kauai [19]. Specifically, the Puu Ka Pele, Na Pali-Kona, and Lihue-Koloa Forest Reserves were included in the inventory totaling nearly 2,200 acres and an additional 200 acres in the state parks. The total timber volume for the inventory area was ~4.3 million cubic feet. Various species of eucalyptus accounted for ~64% of the acreage and 59% of the timber volume. Comparing forest areas and timber volumes with suggested facility sizes identified in Table 6 indicates that this resource would be not be sufficient for development of a stand alone facility. Roughly 1,000 acres of intercropped albizia and eucalyptus have been planted on private land on Kauai by Hawaiian Mahogany Co. Inc. No information on long range plans for these plantings is currently available. 2.3 Agricultural Residues 2.3.1 Sugar The two sugar plantations operating in the state are the largest agricultural operations that produce feedstocks for bioenergy production. Bagasse and molasses are two byproducts of commercial sugar milling operations. Bagasse is a fibrous residue and molasses is the liquid
15
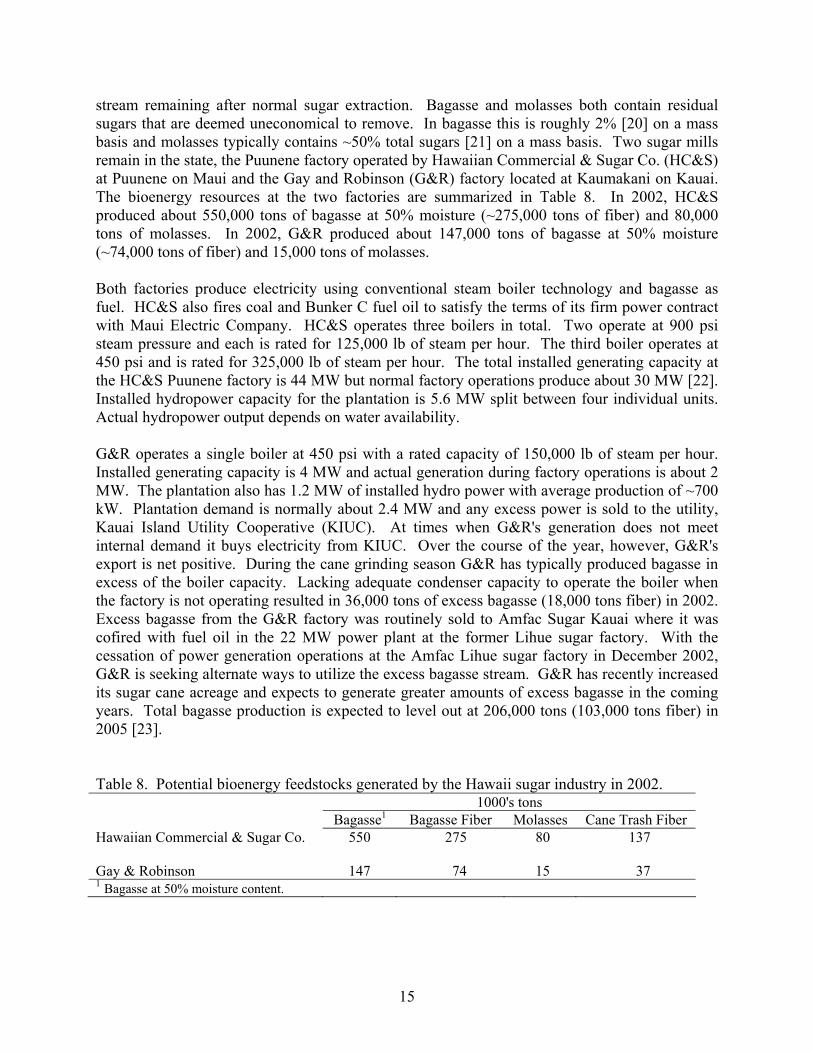
stream remaining after normal sugar extraction. Bagasse and molasses both contain residual sugars that are deemed uneconomical to remove. In bagasse this is roughly 2% [20] on a mass basis and molasses typically contains ~50% total sugars [21] on a mass basis. Two sugar mills remain in the state, the Puunene factory operated by Hawaiian Commercial & Sugar Co. (HC&S) at Puunene on Maui and the Gay and Robinson (G&R) factory located at Kaumakani on Kauai. The bioenergy resources at the two factories are summarized in Table 8. In 2002, HC&S produced about 550,000 tons of bagasse at 50% moisture (~275,000 tons of fiber) and 80,000 tons of molasses. In 2002, G&R produced about 147,000 tons of bagasse at 50% moisture (~74,000 tons of fiber) and 15,000 tons of molasses. Both factories produce electricity using conventional steam boiler technology and bagasse as fuel. HC&S also fires coal and Bunker C fuel oil to satisfy the terms of its firm power contract with Maui Electric Company. HC&S operates three boilers in total. Two operate at 900 psi steam pressure and each is rated for 125,000 lb of steam per hour. The third boiler operates at 450 psi and is rated for 325,000 lb of steam per hour. The total installed generating capacity at the HC&S Puunene factory is 44 MW but normal factory operations produce about 30 MW [22]. Installed hydropower capacity for the plantation is 5.6 MW split between four individual units. Actual hydropower output depends on water availability. G&R operates a single boiler at 450 psi with a rated capacity of 150,000 lb of steam per hour. Installed generating capacity is 4 MW and actual generation during factory operations is about 2 MW. The plantation also has 1.2 MW of installed hydro power with average production of ~700 kW. Plantation demand is normally about 2.4 MW and any excess power is sold to the utility, Kauai Island Utility Cooperative (KIUC). At times when G&R's generation does not meet internal demand it buys electricity from KIUC. Over the course of the year, however, G&R's export is net positive. During the cane grinding season G&R has typically produced bagasse in excess of the boiler capacity. Lacking adequate condenser capacity to operate the boiler when the factory is not operating resulted in 36,000 tons of excess bagasse (18,000 tons fiber) in 2002. Excess bagasse from the G&R factory was routinely sold to Amfac Sugar Kauai where it was cofired with fuel oil in the 22 MW power plant at the former Lihue sugar factory. With the cessation of power generation operations at the Amfac Lihue sugar factory in December 2002, G&R is seeking alternate ways to utilize the excess bagasse stream. G&R has recently increased its sugar cane acreage and expects to generate greater amounts of excess bagasse in the coming years. Total bagasse production is expected to level out at 206,000 tons (103,000 tons fiber) in 2005 [23]. Table 8. Potential bioenergy feedstocks generated by the Hawaii sugar industry in 2002. 1000's tons Bagasse1 Bagasse Fiber Molasses Cane Trash Fiber Hawaiian Commercial & Sugar Co. 550 275 80 137 Gay & Robinson 147 74 15 37 1 Bagasse at 50% moisture content.
16
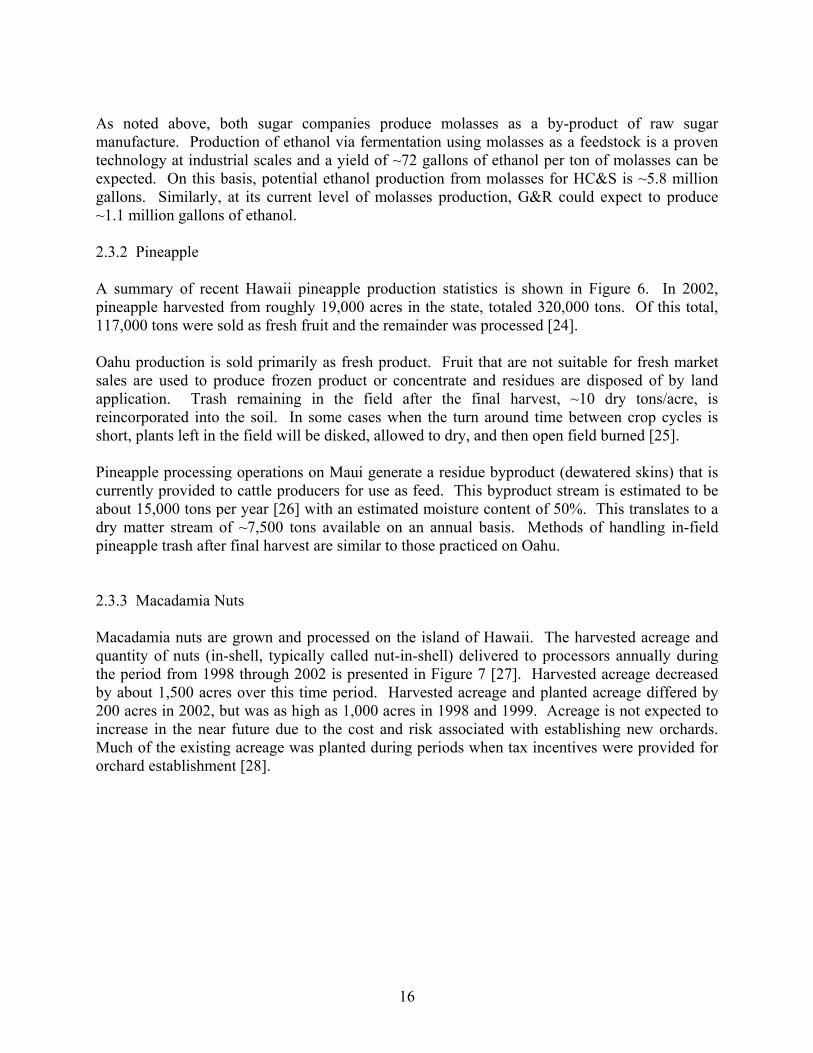
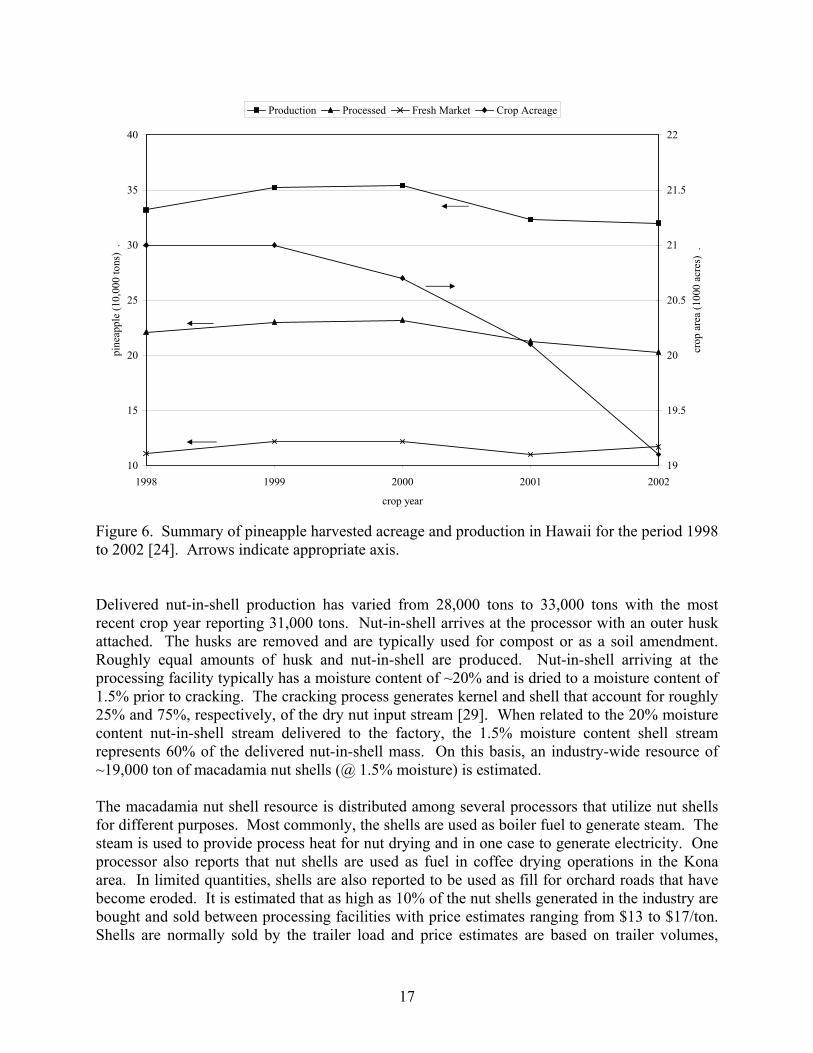
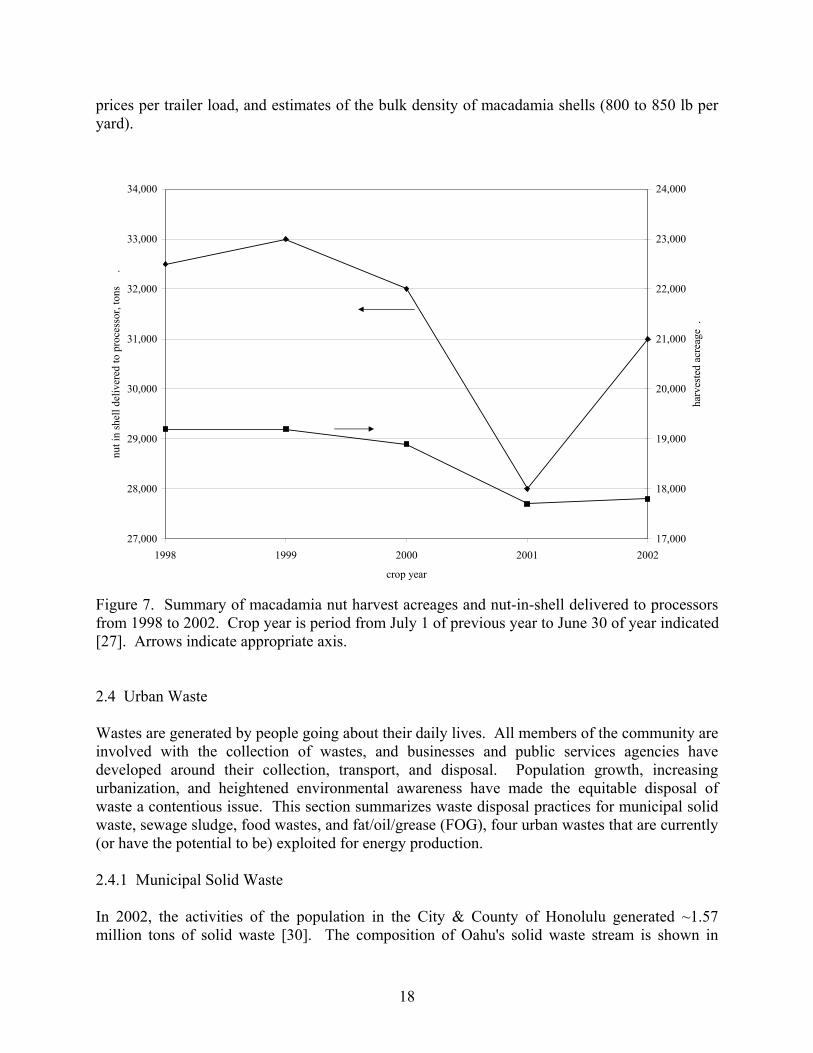
As noted above, both sugar companies produce molasses as a by-product of raw sugar manufacture. Production of ethanol via fermentation using molasses as a feedstock is a proven technology at industrial scales and a yield of ~72 gallons of ethanol per ton of molasses can be expected. On this basis, potential ethanol production from molasses for HC&S is ~5.8 million gallons. Similarly, at its current level of molasses production, G&R could expect to produce ~1.1 million gallons of ethanol. 2.3.2 Pineapple A summary of recent Hawaii pineapple production statistics is shown in Figure 6. In 2002, pineapple harvested from roughly 19,000 acres in the state, totaled 320,000 tons. Of this total, 117,000 tons were sold as fresh fruit and the remainder was processed [24]. Oahu production is sold primarily as fresh product. Fruit that are not suitable for fresh market sales are used to produce frozen product or concentrate and residues are disposed of by land application. Trash remaining in the field after the final harvest, ~10 dry tons/acre, is reincorporated into the soil. In some cases when the turn around time between crop cycles is short, plants left in the field will be disked, allowed to dry, and then open field burned [25]. Pineapple processing operations on Maui generate a residue byproduct (dewatered skins) that is currently provided to cattle producers for use as feed. This byproduct stream is estimated to be about 15,000 tons per year [26] with an estimated moisture content of 50%. This translates to a dry matter stream of ~7,500 tons available on an annual basis. Methods of handling in-field pineapple trash after final harvest are similar to those practiced on Oahu. 2.3.3 Macadamia Nuts Macadamia nuts are grown and processed on the island of Hawaii. The harvested acreage and quantity of nuts (in-shell, typically called nut-in-shell) delivered to processors annually during the period from 1998 through 2002 is presented in Figure 7 [27]. Harvested acreage decreased by about 1,500 acres over this time period. Harvested acreage and planted acreage differed by 200 acres in 2002, but was as high as 1,000 acres in 1998 and 1999. Acreage is not expected to increase in the near future due to the cost and risk associated with establishing new orchards. Much of the existing acreage was planted during periods when tax incentives were provided for orchard establishment [28].
17
10
15
20
25
30
35
40
1998 1999 2000 2001 2002
crop year
pine
appl
e (1
0,00
0 to
ns)
.
19
19.5
20
20.5
21
21.5
22
crop
are
a (1
000
acre
s) .
Production Processed Fresh Market Crop Acreage
Figure 6. Summary of pineapple harvested acreage and production in Hawaii for the period 1998 to 2002 [24]. Arrows indicate appropriate axis. Delivered nut-in-shell production has varied from 28,000 tons to 33,000 tons with the most recent crop year reporting 31,000 tons. Nut-in-shell arrives at the processor with an outer husk attached. The husks are removed and are typically used for compost or as a soil amendment. Roughly equal amounts of husk and nut-in-shell are produced. Nut-in-shell arriving at the processing facility typically has a moisture content of ~20% and is dried to a moisture content of 1.5% prior to cracking. The cracking process generates kernel and shell that account for roughly 25% and 75%, respectively, of the dry nut input stream [29]. When related to the 20% moisture content nut-in-shell stream delivered to the factory, the 1.5% moisture content shell stream represents 60% of the delivered nut-in-shell mass. On this basis, an industry-wide resource of ~19,000 ton of macadamia nut shells (@ 1.5% moisture) is estimated. The macadamia nut shell resource is distributed among several processors that utilize nut shells for different purposes. Most commonly, the shells are used as boiler fuel to generate steam. The steam is used to provide process heat for nut drying and in one case to generate electricity. One processor also reports that nut shells are used as fuel in coffee drying operations in the Kona area. In limited quantities, shells are also reported to be used as fill for orchard roads that have become eroded. It is estimated that as high as 10% of the nut shells generated in the industry are bought and sold between processing facilities with price estimates ranging from $13 to $17/ton. Shells are normally sold by the trailer load and price estimates are based on trailer volumes,
18
prices per trailer load, and estimates of the bulk density of macadamia shells (800 to 850 lb per yard).
27,000
28,000
29,000
30,000
31,000
32,000
33,000
34,000
1998 1999 2000 2001 2002
crop year
nut i
n sh
ell d
eliv
ered
to p
roce
ssor
, ton
s
.
17,000
18,000
19,000
20,000
21,000
22,000
23,000
24,000
harv
este
d ac
reag
e .
Figure 7. Summary of macadamia nut harvest acreages and nut-in-shell delivered to processors from 1998 to 2002. Crop year is period from July 1 of previous year to June 30 of year indicated [27]. Arrows indicate appropriate axis. 2.4 Urban Waste Wastes are generated by people going about their daily lives. All members of the community are involved with the collection of wastes, and businesses and public services agencies have developed around their collection, transport, and disposal. Population growth, increasing urbanization, and heightened environmental awareness have made the equitable disposal of waste a contentious issue. This section summarizes waste disposal practices for municipal solid waste, sewage sludge, food wastes, and fat/oil/grease (FOG), four urban wastes that are currently (or have the potential to be) exploited for energy production. 2.4.1 Municipal Solid Waste In 2002, the activities of the population in the City & County of Honolulu generated ~1.57 million tons of solid waste [30]. The composition of Oahu's solid waste stream is shown in
19
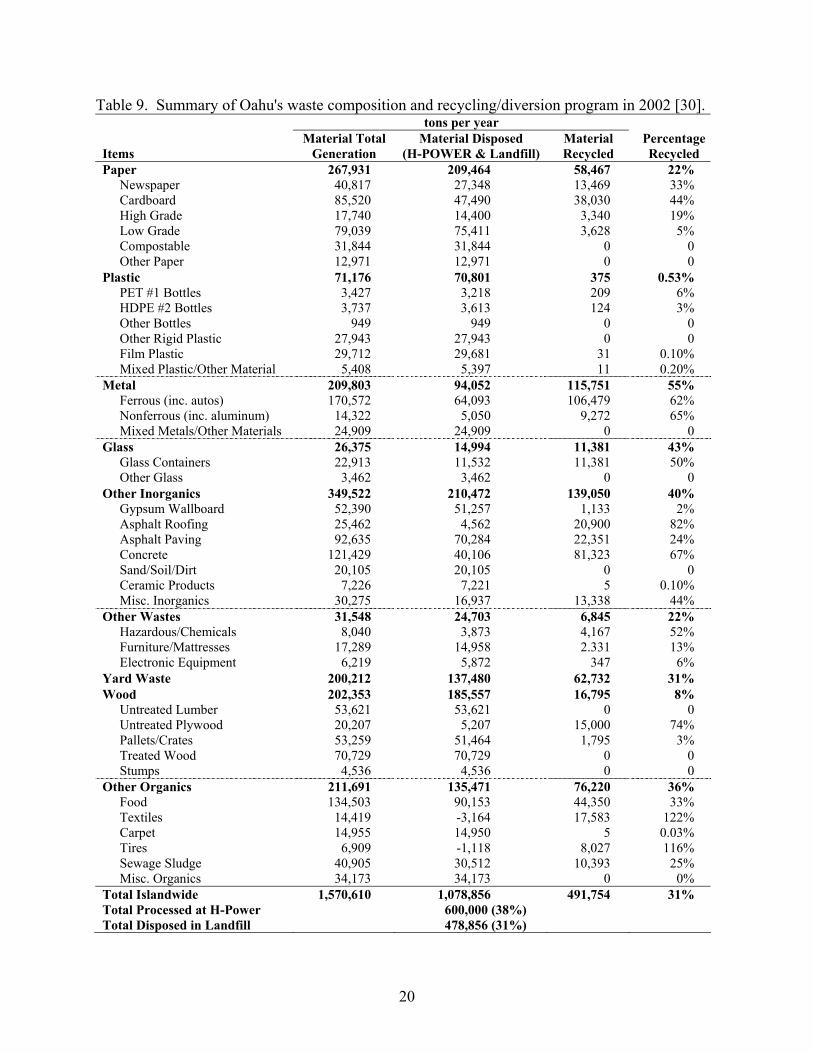
Table 9. Honolulu has an aggressive recycling program and much of the waste stream is recovered for beneficial reuse as shown in the table. Material that is not recycled is either converted to energy at H-POWER, a steam-cycle power plant operating on refuse derived fuel (RDF), or disposed at one of two Oahu landfills. A private enterprise, PVT Landfill in Nanakuli, accepts construction and demolition (C&D) wastes. The Waimanalo Gulch Landfill accepts residential and commercial refuse in excess of H-POWER's capacity, non-recyclable, non-combustible materials separated from the refuse stream entering H-POWER, and the ash that is removed from H-POWER's boilers. H-POWER has a generating capacity of 63 MW [31]. The locations of City & County-supported landfills, transfer stations, and convenience centers are shown in Figure 8. The amount of refuse that is currently available for energy production can be estimated from the data in Table 9. The materials that could reasonably be expected to be converted for energy production include paper, plastic, yard waste, untreated wood materials, and other organics and account for 17, 5, 13, 8, and 13%, respectively, of the total refuse stream. Materials with energy production potential that are currently being recycled account for 14% of the total refuse stream. This is roughly one quarter (14%/56%) of the material that could reasonably be expected to be converted for energy production. H-POWER currently handles 600,000 tons of refuse per year, about 38% of the total refuse stream [30]. This indicates that about 4% of the total refuse stream (68,000 tons) is not recycled or processed at H-POWER and has potential for energy production. The C&C of Honolulu recently released a request for proposals (RFP) for a plasma arc or gasification facility to dispose of up to 25,580 tons of auto fluff, 13,440 tons of recycling residuals, and 60,995 tons of municipal solid waste per year [32]. The availability of 68,000 tons estimated from the waste composition data [30] is consistent with the RFP [32]. This RFP is particularly timely since the Waimanalo Gulch Landfill is nearing capacity and alternative disposal practices will have to be implemented [33]. Various tipping fees are associated with refuse disposal. H-POWER and the Waimanalo Gulch Landfill currently have a common tipping fee of $73.25 per ton with a 12% recycling surcharge and $0.35 per ton State surcharge. The recycling surcharge funds Honolulu's recycling programs and the State surcharge funds operations at the Office of Solid Waste Management within the Department of Health. Green waste is recycled for the city by two private companies with an associated tipping fee of $45 per ton. Tipping fees for C&D waste at PVT Landfill begin at $26 per ton for large semi trailer loads. Rates for pickup truck or van loads are higher at $65 per ton. Special charges apply for loads containing lead acid batteries or tires.
20
Table 9. Summary of Oahu's waste composition and recycling/diversion program in 2002 [30]. tons per year
Items Material Total
Generation Material Disposed
(H-POWER & Landfill) Material Recycled
Percentage Recycled
Paper 267,931 209,464 58,467 22% Newspaper 40,817 27,348 13,469 33% Cardboard 85,520 47,490 38,030 44% High Grade 17,740 14,400 3,340 19% Low Grade 79,039 75,411 3,628 5% Compostable 31,844 31,844 0 0 Other Paper 12,971 12,971 0 0
Plastic 71,176 70,801 375 0.53% PET #1 Bottles 3,427 3,218 209 6% HDPE #2 Bottles 3,737 3,613 124 3% Other Bottles 949 949 0 0 Other Rigid Plastic 27,943 27,943 0 0 Film Plastic 29,712 29,681 31 0.10% Mixed Plastic/Other Material 5,408 5,397 11 0.20%
Metal 209,803 94,052 115,751 55% Ferrous (inc. autos) 170,572 64,093 106,479 62% Nonferrous (inc. aluminum) 14,322 5,050 9,272 65% Mixed Metals/Other Materials 24,909 24,909 0 0
Glass 26,375 14,994 11,381 43% Glass Containers 22,913 11,532 11,381 50% Other Glass 3,462 3,462 0 0
Other Inorganics 349,522 210,472 139,050 40% Gypsum Wallboard 52,390 51,257 1,133 2% Asphalt Roofing 25,462 4,562 20,900 82% Asphalt Paving 92,635 70,284 22,351 24% Concrete 121,429 40,106 81,323 67% Sand/Soil/Dirt 20,105 20,105 0 0 Ceramic Products 7,226 7,221 5 0.10% Misc. Inorganics 30,275 16,937 13,338 44%
Other Wastes 31,548 24,703 6,845 22% Hazardous/Chemicals 8,040 3,873 4,167 52% Furniture/Mattresses 17,289 14,958 2.331 13% Electronic Equipment 6,219 5,872 347 6%
Yard Waste 200,212 137,480 62,732 31% Wood 202,353 185,557 16,795 8%
Untreated Lumber 53,621 53,621 0 0 Untreated Plywood 20,207 5,207 15,000 74% Pallets/Crates 53,259 51,464 1,795 3% Treated Wood 70,729 70,729 0 0 Stumps 4,536 4,536 0 0
Other Organics 211,691 135,471 76,220 36% Food 134,503 90,153 44,350 33% Textiles 14,419 -3,164 17,583 122% Carpet 14,955 14,950 5 0.03% Tires 6,909 -1,118 8,027 116% Sewage Sludge 40,905 30,512 10,393 25% Misc. Organics 34,173 34,173 0 0%
Total Islandwide 1,570,610 1,078,856 491,754 31% Total Processed at H-Power 600,000 (38%) Total Disposed in Landfill 478,856 (31%)
21
I H 3
I H 1
I H 2
I H 1State Hwy 83
State Hwy 72
+
+
+$
$
$
$
$
$
$
$
%U
#
#
#
#
#
#$
#
Honouliuli WastewaterReclamation Facility
#
Waimanalo GulchLandfill
#
Waianae WastewaterReclamation Facility
#
Waianae CC
#
Laie CC
#
Kahuku WastewaterReclamation Facility
#Wahiawa CC#
Wahiawa WastewaterReclamation Facility
#
Waipahu CC
#
Ewa CC
#
Sand Island WastewaterReclamation Facility
#
Kailua WastewaterReclamation Facility
#
Kailua T/S
#
Waimanalo WastewaterReclamation Facility
#
Waimanalo CC
#
Paalaa Kai WastewaterReclamation Facility
#
Kaiwailoa T/S
#
Keehi T/S#
East Honolulu Community Services WastewaterReclamation Facility
T/S = Transfer Station CC = Convienence Center
10 0 10 20 Miles
N
EW
S
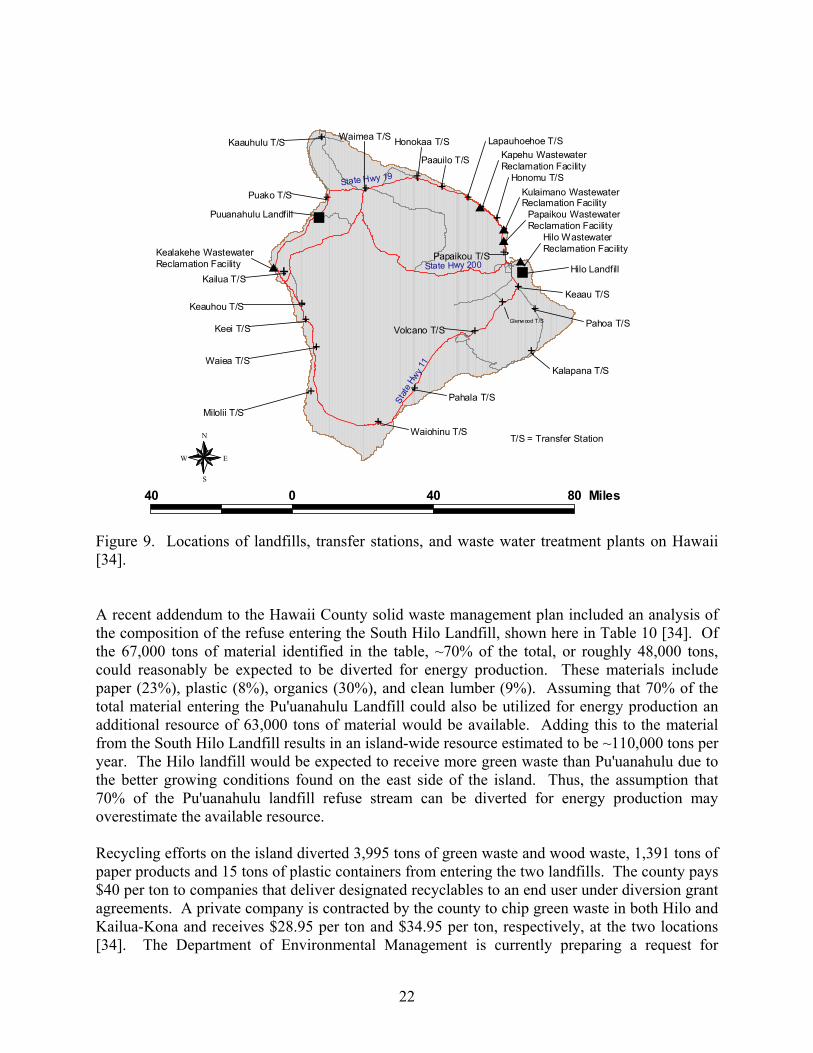
Figure 8. Locations of landfills, transfer stations, convenience centers, and major waste water treatment plants in the City and County of Honolulu. (Location of PVT Landfill not shown). The County of Hawaii solid waste management system includes the South Hilo Landfill in east Hawaii and the Pu'uanahulu Landfill in west Hawaii in addition to 21 transfer stations located around the island (see Figure 9). The county does not operate a collection system and the transfer stations are drop-off points for the local population. Private collection services operate in some of the more densely populated areas. The tipping fee for disposal at the landfill is $35 per ton [34]. The total amount of solid waste managed by the county system was approximately 160,000 tons in the year 2000 with 70,000 tons (45%) going to the South Hilo Landfill and 90,000 tons (55%) going to the Pu'unahulu Landfill. The South Hilo Landfill is scheduled to close in the next few years [34] and alternative refuse disposal methods are currently being evaluated.
22
Stat
e Hwy
11
State Hwy 19
State Hwy 200$ $
$$
$
Glenwood T/S
%
+
+
++
+
++
++
+
+%+
+ +
++
+
+
+
+
T/S = Transfer Station
#
Waiea T/S
#
Keei T/S
#Keauhou T/S
#
Kailua T/S#
Kealakehe WastewaterReclamation Facility
#Puuanahulu Landfill
#Kaauhulu T/S
#
Kapehu Wastewater Reclamation Facility
#
Honomu T/S
#
Papaikou WastewaterReclamation Facility
#Papaikou T/S#
Hilo WastewaterReclamation Facility
#Hilo Landfill
#
Pahoa T/S
#
Kalapana T/S
#
Pahala T/S
#
Waiohinu T/S
#
Milolii T/S
#
Keaau T/S
#Puako T/S#
Waimea T/S
#
Kulaimano WastewaterReclamation Facility
#
Paauilo T/S
#
Lapauhoehoe T/S
#
Honokaa T/S
#Volcano T/S
40 0 40 80 Miles
N
EW
S
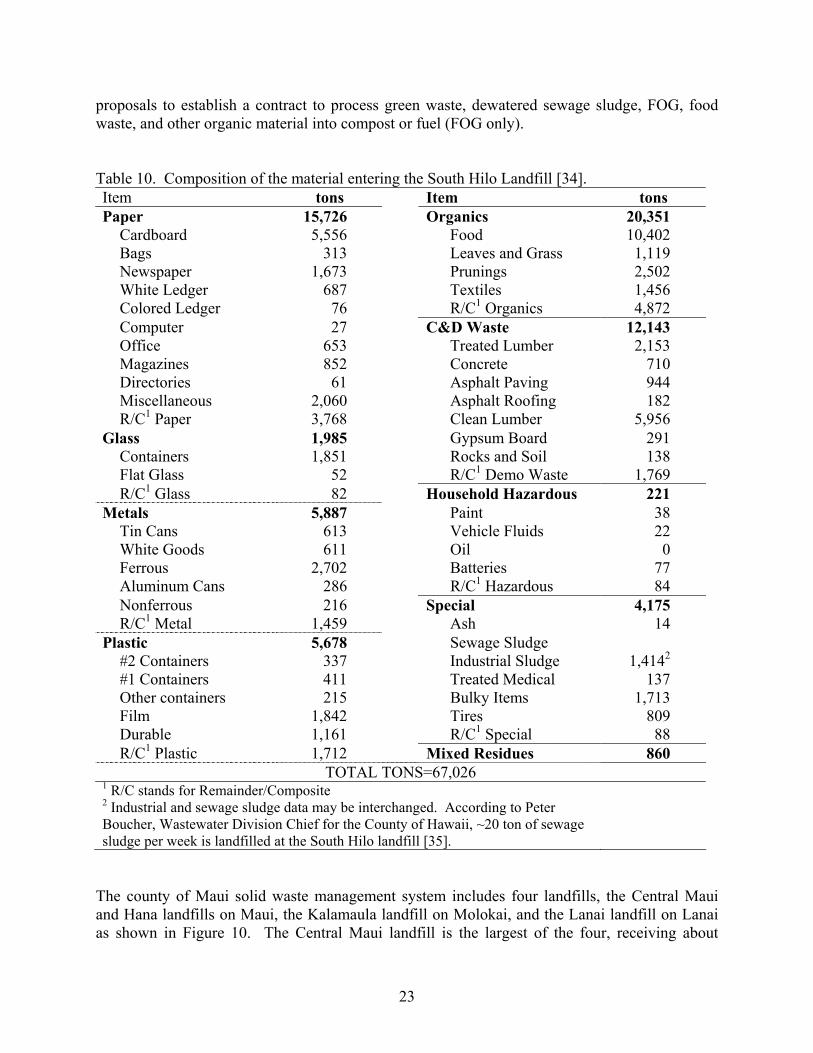
Figure 9. Locations of landfills, transfer stations, and waste water treatment plants on Hawaii [34]. A recent addendum to the Hawaii County solid waste management plan included an analysis of the composition of the refuse entering the South Hilo Landfill, shown here in Table 10 [34]. Of the 67,000 tons of material identified in the table, ~70% of the total, or roughly 48,000 tons, could reasonably be expected to be diverted for energy production. These materials include paper (23%), plastic (8%), organics (30%), and clean lumber (9%). Assuming that 70% of the total material entering the Pu'uanahulu Landfill could also be utilized for energy production an additional resource of 63,000 tons of material would be available. Adding this to the material from the South Hilo Landfill results in an island-wide resource estimated to be ~110,000 tons per year. The Hilo landfill would be expected to receive more green waste than Pu'uanahulu due to the better growing conditions found on the east side of the island. Thus, the assumption that 70% of the Pu'uanahulu landfill refuse stream can be diverted for energy production may overestimate the available resource. Recycling efforts on the island diverted 3,995 tons of green waste and wood waste, 1,391 tons of paper products and 15 tons of plastic containers from entering the two landfills. The county pays $40 per ton to companies that deliver designated recyclables to an end user under diversion grant agreements. A private company is contracted by the county to chip green waste in both Hilo and Kailua-Kona and receives $28.95 per ton and $34.95 per ton, respectively, at the two locations [34]. The Department of Environmental Management is currently preparing a request for
23
proposals to establish a contract to process green waste, dewatered sewage sludge, FOG, food waste, and other organic material into compost or fuel (FOG only). Table 10. Composition of the material entering the South Hilo Landfill [34]. Item tons Item tons Paper 15,726 Organics 20,351
Cardboard 5,556 Food 10,402 Bags 313 Leaves and Grass 1,119 Newspaper 1,673 Prunings 2,502 White Ledger 687 Textiles 1,456 Colored Ledger 76 R/C1 Organics 4,872 Computer 27 C&D Waste 12,143 Office 653 Treated Lumber 2,153 Magazines 852 Concrete 710 Directories 61 Asphalt Paving 944 Miscellaneous 2,060 Asphalt Roofing 182 R/C1 Paper 3,768 Clean Lumber 5,956
Glass 1,985 Gypsum Board 291 Containers 1,851 Rocks and Soil 138 Flat Glass 52 R/C1 Demo Waste 1,769 R/C1 Glass 82 Household Hazardous 221
Metals 5,887 Paint 38 Tin Cans 613 Vehicle Fluids 22 White Goods 611 Oil 0 Ferrous 2,702 Batteries 77 Aluminum Cans 286 R/C1 Hazardous 84 Nonferrous 216 Special 4,175 R/C1 Metal 1,459 Ash 14
Plastic 5,678 Sewage Sludge #2 Containers 337 Industrial Sludge 1,4142 #1 Containers 411 Treated Medical 137 Other containers 215 Bulky Items 1,713 Film 1,842 Tires 809 Durable 1,161 R/C1 Special 88 R/C1 Plastic 1,712 Mixed Residues 860
TOTAL TONS=67,026 1 R/C stands for Remainder/Composite 2 Industrial and sewage sludge data may be interchanged. According to Peter Boucher, Wastewater Division Chief for the County of Hawaii, ~20 ton of sewage sludge per week is landfilled at the South Hilo landfill [35].
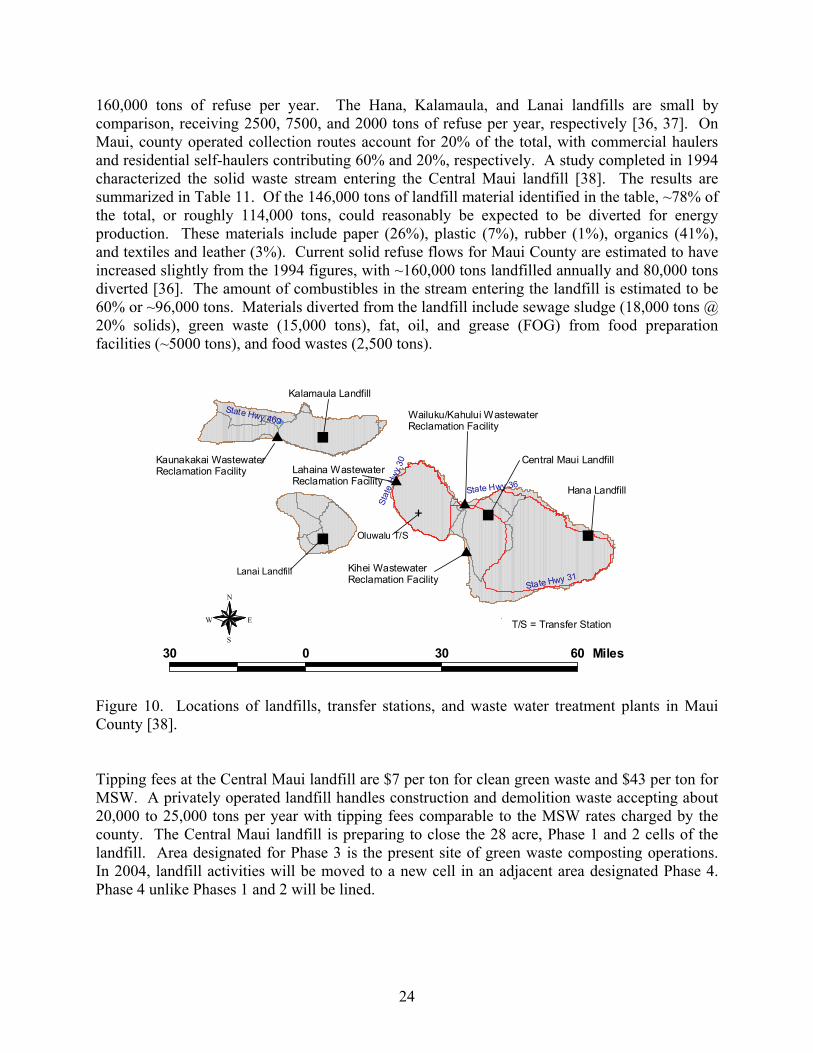
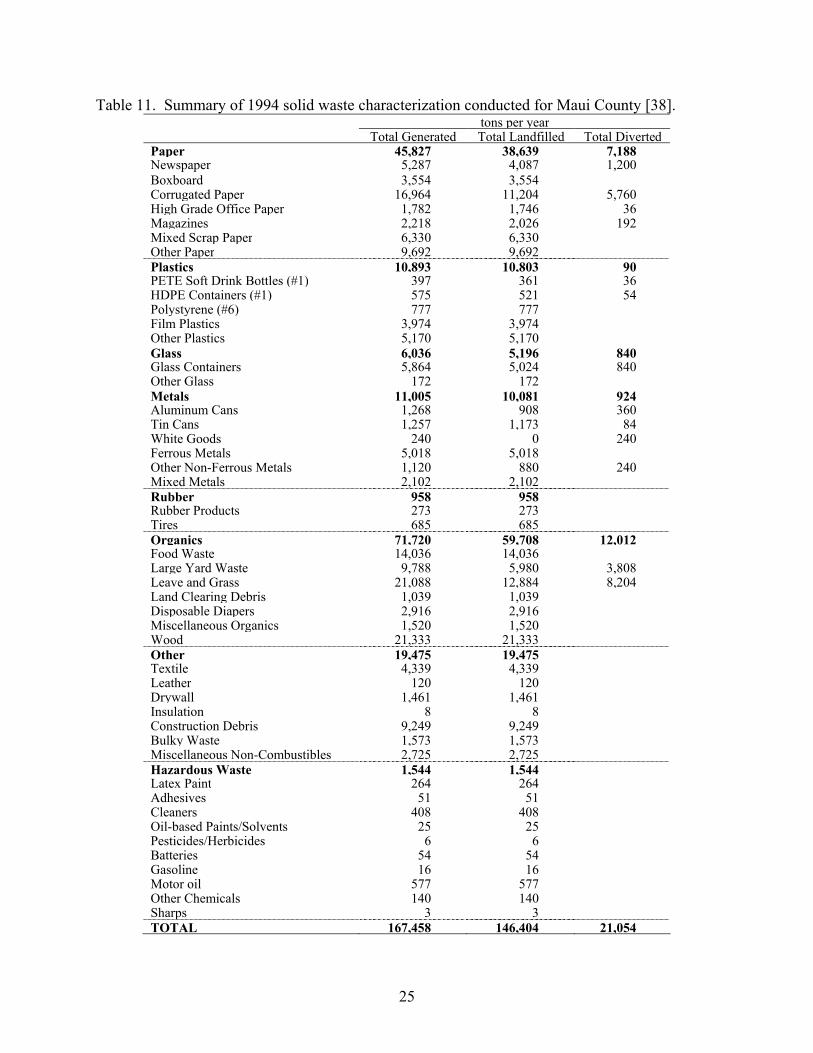
The county of Maui solid waste management system includes four landfills, the Central Maui and Hana landfills on Maui, the Kalamaula landfill on Molokai, and the Lanai landfill on Lanai as shown in Figure 10. The Central Maui landfill is the largest of the four, receiving about
24
160,000 tons of refuse per year. The Hana, Kalamaula, and Lanai landfills are small by comparison, receiving 2500, 7500, and 2000 tons of refuse per year, respectively [36, 37]. On Maui, county operated collection routes account for 20% of the total, with commercial haulers and residential self-haulers contributing 60% and 20%, respectively. A study completed in 1994 characterized the solid waste stream entering the Central Maui landfill [38]. The results are summarized in Table 11. Of the 146,000 tons of landfill material identified in the table, ~78% of the total, or roughly 114,000 tons, could reasonably be expected to be diverted for energy production. These materials include paper (26%), plastic (7%), rubber (1%), organics (41%), and textiles and leather (3%). Current solid refuse flows for Maui County are estimated to have increased slightly from the 1994 figures, with ~160,000 tons landfilled annually and 80,000 tons diverted [36]. The amount of combustibles in the stream entering the landfill is estimated to be 60% or ~96,000 tons. Materials diverted from the landfill include sewage sludge (18,000 tons @ 20% solids), green waste (15,000 tons), fat, oil, and grease (FOG) from food preparation facilities (~5000 tons), and food wastes (2,500 tons).
State Hwy 31
State Hwy 36
Stat
e Hw
y 30
State Hwy 460
T/S = Transfer Station
Hana Landfill
Kalamaula Landfill
Central Maui Landfill
Wailuku/Kahului WastewaterReclamation Facility
Kihei WastewaterReclamation Facility
Lahaina WastewaterReclamation Facility
Kaunakakai WastewaterReclamation Facility
$
$
$
$
%
%+
%
%
.
.
#
Lanai Landfill
Oluwalu T/S
30 0 30 60 Miles
N
EW
S
Figure 10. Locations of landfills, transfer stations, and waste water treatment plants in Maui County [38]. Tipping fees at the Central Maui landfill are $7 per ton for clean green waste and $43 per ton for MSW. A privately operated landfill handles construction and demolition waste accepting about 20,000 to 25,000 tons per year with tipping fees comparable to the MSW rates charged by the county. The Central Maui landfill is preparing to close the 28 acre, Phase 1 and 2 cells of the landfill. Area designated for Phase 3 is the present site of green waste composting operations. In 2004, landfill activities will be moved to a new cell in an adjacent area designated Phase 4. Phase 4 unlike Phases 1 and 2 will be lined.
25
Table 11. Summary of 1994 solid waste characterization conducted for Maui County [38]. tons per year Total Generated Total Landfilled Total DivertedPaper 45,827 38,639 7,188 Newspaper 5,287 4,087 1,200 Boxboard 3,554 3,554 Corrugated Paper 16,964 11,204 5,760 High Grade Office Paper 1,782 1,746 36 Magazines 2,218 2,026 192 Mixed Scrap Paper 6,330 6,330 Other Paper 9,692 9,692 Plastics 10,893 10,803 90 PETE Soft Drink Bottles (#1) 397 361 36 HDPE Containers (#1) 575 521 54 Polystyrene (#6) 777 777 Film Plastics 3,974 3,974 Other Plastics 5,170 5,170 Glass 6,036 5,196 840 Glass Containers 5,864 5,024 840 Other Glass 172 172 Metals 11,005 10,081 924 Aluminum Cans 1,268 908 360 Tin Cans 1,257 1,173 84 White Goods 240 0 240 Ferrous Metals 5,018 5,018 Other Non-Ferrous Metals 1,120 880 240 Mixed Metals 2,102 2,102 Rubber 958 958 Rubber Products 273 273 Tires 685 685 Organics 71,720 59,708 12,012 Food Waste 14,036 14,036 Large Yard Waste 9,788 5,980 3,808 Leave and Grass 21,088 12,884 8,204 Land Clearing Debris 1,039 1,039 Disposable Diapers 2,916 2,916 Miscellaneous Organics 1,520 1,520 Wood 21,333 21,333 Other 19,475 19,475 Textile 4,339 4,339 Leather 120 120 Drywall 1,461 1,461 Insulation 8 8 Construction Debris 9,249 9,249 Bulky Waste 1,573 1,573 Miscellaneous Non-Combustibles 2,725 2,725 Hazardous Waste 1,544 1,544 Latex Paint 264 264 Adhesives 51 51 Cleaners 408 408 Oil-based Paints/Solvents 25 25 Pesticides/Herbicides 6 6 Batteries 54 54 Gasoline 16 16 Motor oil 577 577 Other Chemicals 140 140 Sharps 3 3 TOTAL 167,458 146,404 21,054
26
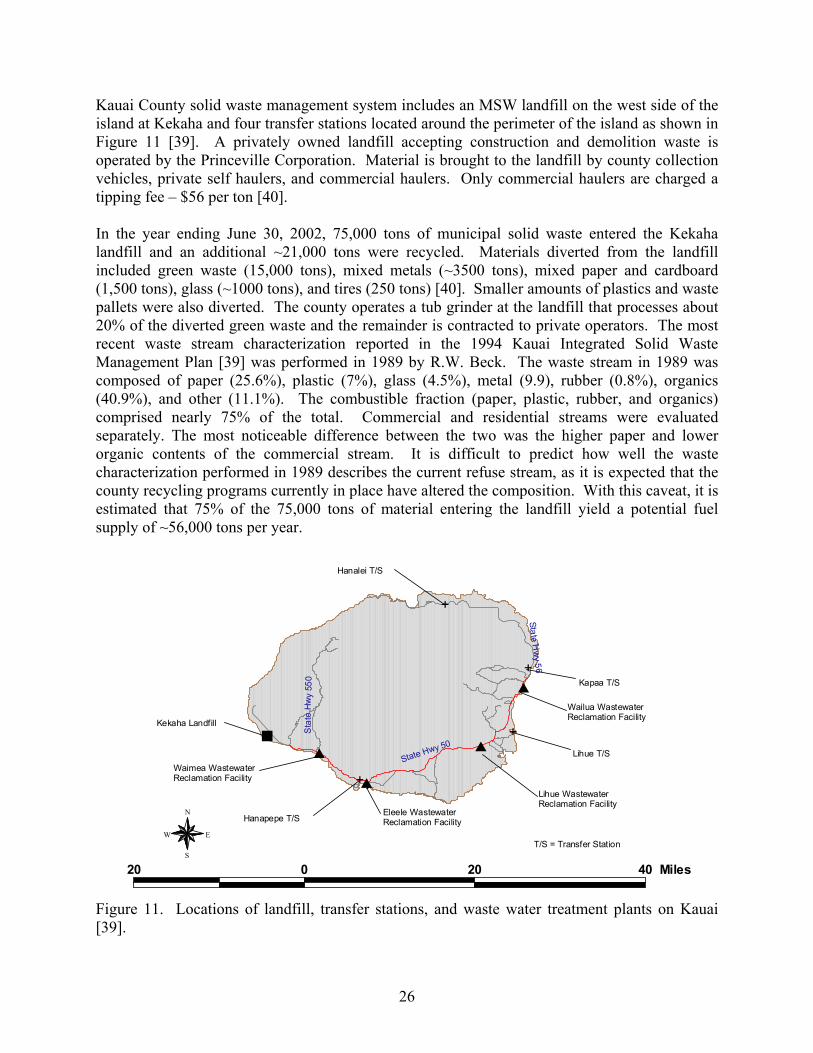
Kauai County solid waste management system includes an MSW landfill on the west side of the island at Kekaha and four transfer stations located around the perimeter of the island as shown in Figure 11 [39]. A privately owned landfill accepting construction and demolition waste is operated by the Princeville Corporation. Material is brought to the landfill by county collection vehicles, private self haulers, and commercial haulers. Only commercial haulers are charged a tipping fee – $56 per ton [40]. In the year ending June 30, 2002, 75,000 tons of municipal solid waste entered the Kekaha landfill and an additional ~21,000 tons were recycled. Materials diverted from the landfill included green waste (15,000 tons), mixed metals (~3500 tons), mixed paper and cardboard (1,500 tons), glass (~1000 tons), and tires (250 tons) [40]. Smaller amounts of plastics and waste pallets were also diverted. The county operates a tub grinder at the landfill that processes about 20% of the diverted green waste and the remainder is contracted to private operators. The most recent waste stream characterization reported in the 1994 Kauai Integrated Solid Waste Management Plan [39] was performed in 1989 by R.W. Beck. The waste stream in 1989 was composed of paper (25.6%), plastic (7%), glass (4.5%), metal (9.9), rubber (0.8%), organics (40.9%), and other (11.1%). The combustible fraction (paper, plastic, rubber, and organics) comprised nearly 75% of the total. Commercial and residential streams were evaluated separately. The most noticeable difference between the two was the higher paper and lower organic contents of the commercial stream. It is difficult to predict how well the waste characterization performed in 1989 describes the current refuse stream, as it is expected that the county recycling programs currently in place have altered the composition. With this caveat, it is estimated that 75% of the 75,000 tons of material entering the landfill yield a potential fuel supply of ~56,000 tons per year.
State Hwy 50
State Hw
y 56
Sta
te H
wy
550
Kekaha Landfill
Waimea WastewaterReclamation Facility
Lihue WastewaterReclamation Facility
Wailua WastewaterReclamation Facility
Hanalei T/S
Hanapepe T/S
Lihue T/S
Kapaa T/S$
$
$
$+
+
+
+
%
T/S = Transfer Station
#
Eleele WastewaterReclamation Facility
20 0 20 40 Miles
N
EW
S
Figure 11. Locations of landfill, transfer stations, and waste water treatment plants on Kauai [39].
27
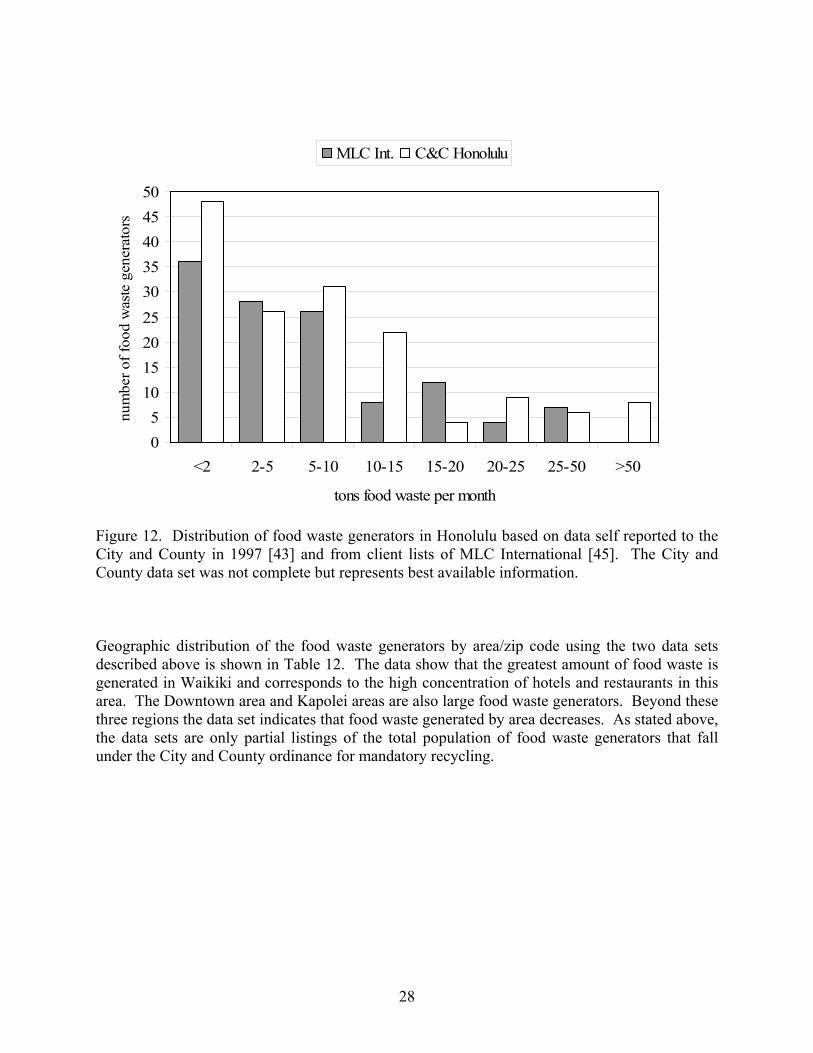
2.4.2 Food Waste Food waste separation, collection, and recycling are mandated in the Revised Ordinances of Honolulu, Section 9, Article 3.5. The article includes a set of criteria that establish the need for compliance based on the size of a given food waste generating establishment. Included are restaurants, food courts, hotels, markets, food manufacturers and processors, caterers, and hospitals. The ordinance contains a clause that exempts the food establishment from compliance if the cost to recycle exceeds the comparable disposal charge at HPOWER. Similar ordinances have not been enacted in the other counties, although food waste recycling is practiced to some extent. Food waste has been used for hog feed from the time hogs became domesticated and this practice continues today throughout the state. Food waste in Honolulu has also been used as feedstock for an anaerobic digestion facility operated by Unisyn, a disposal company that ceased operations in 1999 [41]. At present, hog feed appears to be the primary end use for food waste. Entities that process food wastes for hog feed must be licensed with the Hawaii Department of Agriculture's Animal Industry Division. Food waste that is improperly treated (cooked) prior to feeding may transmit disease and licensing is conducted to aid in enforcing proper treatment. There are currently 141 entities operating in the state that are licensed to process food waste for hog feed; 61 on Oahu, 38 on Hawaii, 18 on Maui, and 24 on Kauai [42]. Food waste quality is largely defined by the end product targeted by the recycling entity. Food waste that does not contain animal protein may be fed directly to hogs without treatment [42] and thus may be assigned a higher value than food waste that requires cooking. An example of this would be the waste product from a tofu factory (high protein, no cooking required) vs. the food waste generated from a hotel restaurant (mixed food scraps, contains toothpicks, requires cooking). Chemical composition and nutrient content of food wastes vary and these factors may be important in developing rations for hog feed or feed stock for an anaerobic digestion process. According to the City and County of Honolulu, 134,503 tons of food waste was generated on Oahu in 2002 [30]. Of this total, ~90,000 tons per year entered the landfill. Food waste generator data are not available for the same time period, however data from 1997 were available from the city's recycling office [43]. Food waste generators are required to report the amount they produce on a regular basis. It should be noted that this data set was not considered to be complete and represents best available data at present. In some cases, waste quantities were reported on a volume basis rather than a weight basis and the conversion to a common weight basis was done using a value of 7.5 lb per gallon [44]. A second list of food waste generators was obtained from Matt Lyum, a local consultant and principal of MLC International, LLC. This second list was based on a client list from 1996. The latter data set was reported in tons per month and no additional processing was performed. Frequency distributions of these two data sets are presented in Figure 12. Both data sets indicate that ~30% of the food waste generators produce less than 2 tons per month and the 2 to 5 per month and 5 to 10 ton per month sized generators each represent about 20% of the total number of generators. Larger tonnage generators are fewer in number but would represent least cost opportunities for resource collection if the quality of the food waste is the same from all sources.
28
05
101520253035404550
<2 2-5 5-10 10-15 15-20 20-25 25-50 >50
tons food waste per month
num
ber o
f foo
d w
aste
gen
erat
ors
MLC Int. C&C Honolulu
Figure 12. Distribution of food waste generators in Honolulu based on data self reported to the City and County in 1997 [43] and from client lists of MLC International [45]. The City and County data set was not complete but represents best available information. Geographic distribution of the food waste generators by area/zip code using the two data sets described above is shown in Table 12. The data show that the greatest amount of food waste is generated in Waikiki and corresponds to the high concentration of hotels and restaurants in this area. The Downtown area and Kapolei areas are also large food waste generators. Beyond these three regions the data set indicates that food waste generated by area decreases. As stated above, the data sets are only partial listings of the total population of food waste generators that fall under the City and County ordinance for mandatory recycling.
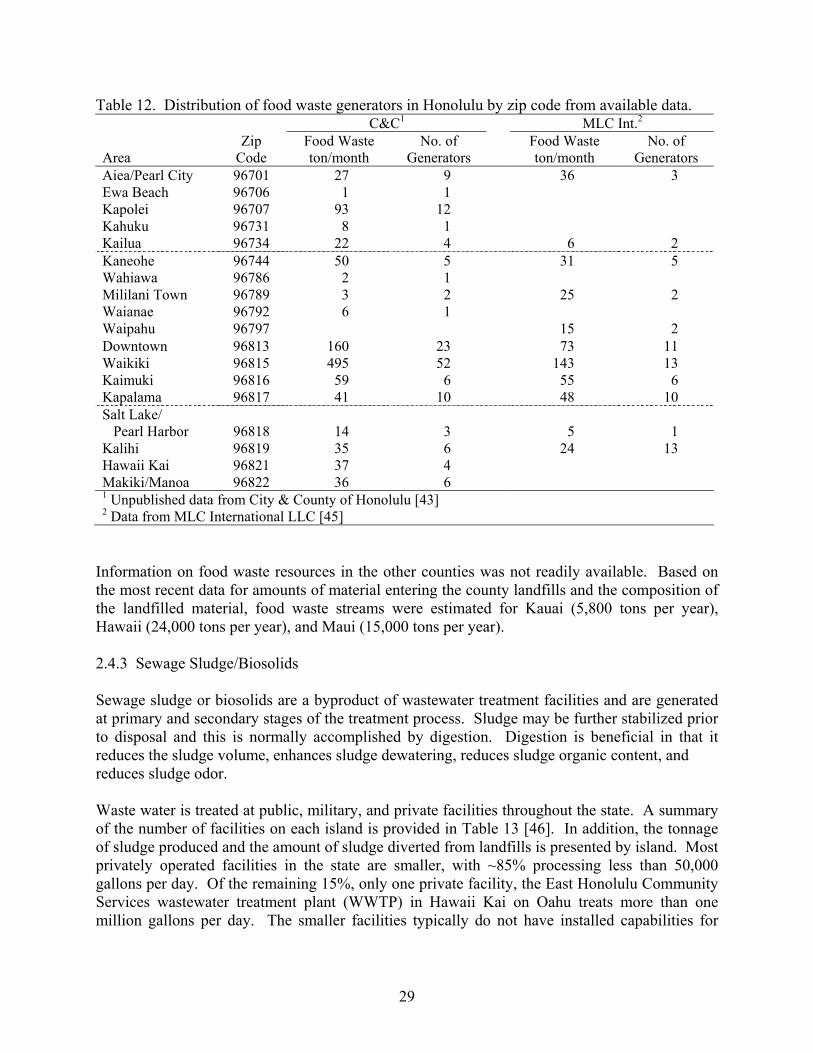
29
Table 12. Distribution of food waste generators in Honolulu by zip code from available data. C&C1 MLC Int.2
Area Zip
Code Food Waste ton/month
No. of Generators
Food Waste ton/month
No. of Generators
Aiea/Pearl City 96701 27 9 36 3 Ewa Beach 96706 1 1 Kapolei 96707 93 12 Kahuku 96731 8 1 Kailua 96734 22 4 6 2 Kaneohe 96744 50 5 31 5 Wahiawa 96786 2 1 Mililani Town 96789 3 2 25 2 Waianae 96792 6 1 Waipahu 96797 15 2 Downtown 96813 160 23 73 11 Waikiki 96815 495 52 143 13 Kaimuki 96816 59 6 55 6 Kapalama 96817 41 10 48 10 Salt Lake/ Pearl Harbor 96818 14 3 5 1 Kalihi 96819 35 6 24 13 Hawaii Kai 96821 37 4 Makiki/Manoa 96822 36 6 1 Unpublished data from City & County of Honolulu [43] 2 Data from MLC International LLC [45]
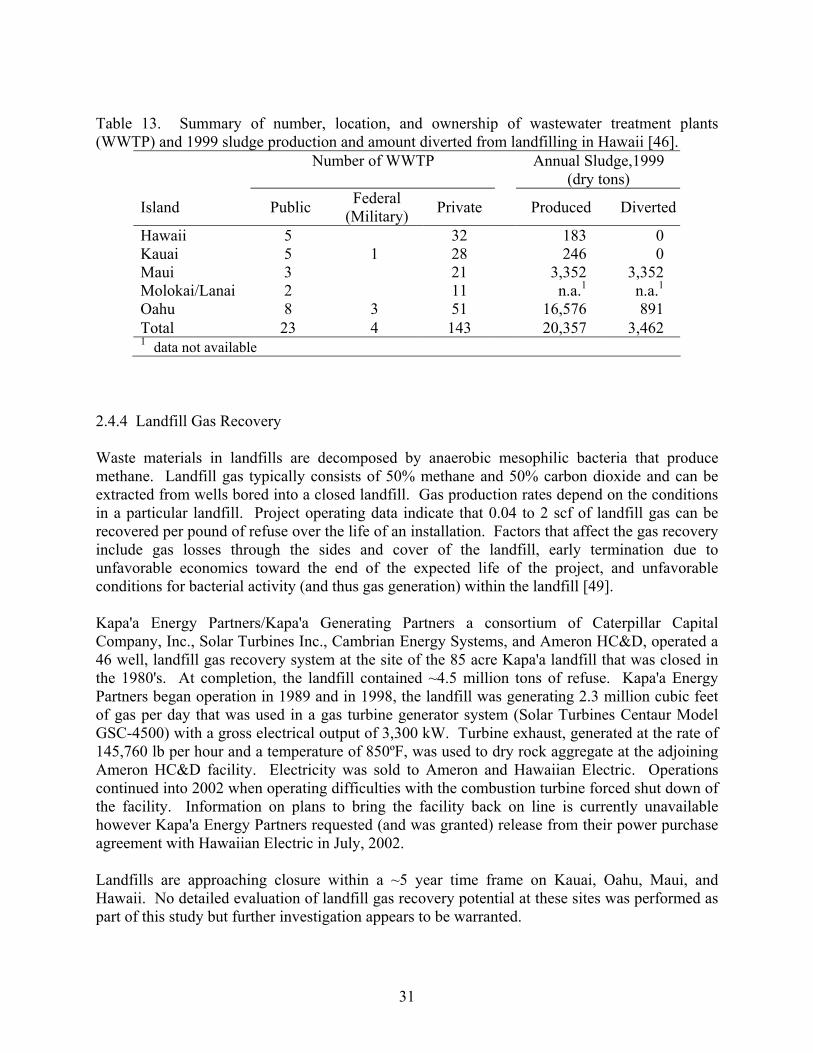
Information on food waste resources in the other counties was not readily available. Based on the most recent data for amounts of material entering the county landfills and the composition of the landfilled material, food waste streams were estimated for Kauai (5,800 tons per year), Hawaii (24,000 tons per year), and Maui (15,000 tons per year). 2.4.3 Sewage Sludge/Biosolids Sewage sludge or biosolids are a byproduct of wastewater treatment facilities and are generated at primary and secondary stages of the treatment process. Sludge may be further stabilized prior to disposal and this is normally accomplished by digestion. Digestion is beneficial in that it reduces the sludge volume, enhances sludge dewatering, reduces sludge organic content, and reduces sludge odor. Waste water is treated at public, military, and private facilities throughout the state. A summary of the number of facilities on each island is provided in Table 13 [46]. In addition, the tonnage of sludge produced and the amount of sludge diverted from landfills is presented by island. Most privately operated facilities in the state are smaller, with ~85% processing less than 50,000 gallons per day. Of the remaining 15%, only one private facility, the East Honolulu Community Services wastewater treatment plant (WWTP) in Hawaii Kai on Oahu treats more than one million gallons per day. The smaller facilities typically do not have installed capabilities for
30
sludge dewatering and the common practice is for sludge to be transported to public facilities for this operation, thus consolidating the sludge from each island at the public facilities. Several of the public facilities anaerobically digest sludge prior to final disposal. Biogas produced in the process is composed of 60 to 70% methane and 20 to 30% carbon dioxide with trace amounts of ammonia, hydrogen sulfide, and other contaminants. Biogas heating values are typically 575 to 675 BTU per standard cubic foot (scf). At present, biogas is used primarily to generate heat to maintain digester temperatures at optimum conditions for bacteria activity. The Kailua WWTP typically uses 20% of the biogas generated from their digesters for system heating and the remaining 80% (~125,000 scf per day) is flared. A recent study concluded that this resource could be exploited by installing a gas conditioning system to remove hydrogen sulfide and siloxane and a reciprocating engine-based cogeneration system for electricity and on-site chilling for air conditioning [47]. At present, sludge reuse has been accomplished by composting biosolids with green waste on Maui and Oahu. Maui County's program diverts all sewage biosolids to compost production under contract to Maui EKO Systems, Inc. The Navy established a biosolids treatment facility at Barbers Point that composts sludge from the Fort Kamehameha and Schofield Barracks WWTP's and the Honouliuli WWTP operated by the City and County of Honolulu. In 1999, 891 tons (dry basis) of the City and County's biosolids were composted with green waste. This value was increased to ~10 tons (dry basis) per day in 2002 resulting in an annual diversion of 3,650 tons of sludge from the landfill [46]. Note that data for the amount of Navy and Army biosolids diverted under this program were not included in these values. The City and County of Honolulu recently announced a new sludge reuse project to be located at the Sand Island WWTP. A contract has been awarded to Syangro-WWT Inc. of Millersville, Maryland, to design, build, and operate an anaerobic sludge digester to produce a stabilized, pelleted soil conditioner. A gas collection system and hydrogen sulfide removal unit will be part of the facility. Start up of the new facility is expected for August, 2004 and is expected to divert all of the sludge from the Sand Island WWTP from current landfill disposal [48].
31
Table 13. Summary of number, location, and ownership of wastewater treatment plants (WWTP) and 1999 sludge production and amount diverted from landfilling in Hawaii [46].
Number of WWTP Annual Sludge,1999 (dry tons)
Island Public Federal (Military) Private Produced Diverted
Hawaii 5 32 183 0 Kauai 5 1 28 246 0 Maui 3 21 3,352 3,352 Molokai/Lanai 2 11 n.a.1 n.a.1
Oahu 8 3 51 16,576 891
Total 23 4 143 20,357 3,462 1 data not available
2.4.4 Landfill Gas Recovery Waste materials in landfills are decomposed by anaerobic mesophilic bacteria that produce methane. Landfill gas typically consists of 50% methane and 50% carbon dioxide and can be extracted from wells bored into a closed landfill. Gas production rates depend on the conditions in a particular landfill. Project operating data indicate that 0.04 to 2 scf of landfill gas can be recovered per pound of refuse over the life of an installation. Factors that affect the gas recovery include gas losses through the sides and cover of the landfill, early termination due to unfavorable economics toward the end of the expected life of the project, and unfavorable conditions for bacterial activity (and thus gas generation) within the landfill [49]. Kapa'a Energy Partners/Kapa'a Generating Partners a consortium of Caterpillar Capital Company, Inc., Solar Turbines Inc., Cambrian Energy Systems, and Ameron HC&D, operated a 46 well, landfill gas recovery system at the site of the 85 acre Kapa'a landfill that was closed in the 1980's. At completion, the landfill contained ~4.5 million tons of refuse. Kapa'a Energy Partners began operation in 1989 and in 1998, the landfill was generating 2.3 million cubic feet of gas per day that was used in a gas turbine generator system (Solar Turbines Centaur Model GSC-4500) with a gross electrical output of 3,300 kW. Turbine exhaust, generated at the rate of 145,760 lb per hour and a temperature of 850ºF, was used to dry rock aggregate at the adjoining Ameron HC&D facility. Electricity was sold to Ameron and Hawaiian Electric. Operations continued into 2002 when operating difficulties with the combustion turbine forced shut down of the facility. Information on plans to bring the facility back on line is currently unavailable however Kapa'a Energy Partners requested (and was granted) release from their power purchase agreement with Hawaiian Electric in July, 2002. Landfills are approaching closure within a ~5 year time frame on Kauai, Oahu, Maui, and Hawaii. No detailed evaluation of landfill gas recovery potential at these sites was performed as part of this study but further investigation appears to be warranted.
32
2.4.5 Fat, Oil, and Grease Fat, oil, and grease (FOG) or urban grease waste is generated as byproducts from food preparation activities. FOG can be classified into two categories, yellow grease and grease trap waste. Yellow grease is derived from used cooking oil and waste greases that are separated and collected at the point of use by the food preparation facility. Yellow grease accumulated by food service facilities is normally picked up by a company that consolidates material and in turn sells it or uses it to manufacture tallow, animal feed supplements, fuels, or other products. Grease traps are located in the drain lines from restaurant and food service facility sinks and dish washers and serve to accumulate grease, thereby preventing it from entering the sewage system. If not removed, grease accumulates on the walls of sewer pipes leading to reduced flow and eventual clogs. Grease trap installation and maintenance are mandated by county ordinances as preventative measures. Grease traps are tanks with baffles that reduce drain flow velocities, allowing grease to separate and form a surface layer floating at the top of the water level that is trapped between the baffles. A layer will also form at the bottom of the grease trap as heavy solids settle and accumulate. The grease removal efficiency of the trap decreases as the thicknesses of the top grease layer and the bottom sediment layer increase. To maintain efficiency, grease traps must be emptied on a schedule that controls excessive accumulation, normally when the combined thickness of the grease and sediments layer is ~25% of the grease trap depth [50]. Grease traps are normally serviced by a pumper truck, a truck equipped with a pump that sucks the accumulated grease, water, and sediment into a tank mounted on the truck. On all islands, it is currently illegal to discharge grease into sewer lines, however a common theme that recurred in discussions with county officials associated with monitoring and enforcing grease trap use, maintenance, and waste disposal regulations was that grease still finds its way into the sewer system. Proper enforcement would require additional county staff largely due to the number and dispersed nature of the generators and the mobility of the pumpers. Companies accept grease trap waste from pumpers and then dewater it and remove solids to produce a brown grease product which can be sold to markets similar to those for yellow grease as described above. Reclaimed grease products are marketed by several companies in the state. Island Commodities Corp. utilizes yellow grease in boilers at their processing facility in Campbell Industrial Park on Oahu and sells 2000 gallons of yellow grease a week to Young Laundry & Drycleaning under a three year contract. Young, located in Kalihi Kai, uses the yellow grease as boiler fuel [51]. Pacific Biodiesel headquartered on Maui maintains processing and sales facilities on Maui and Oahu, and markets biodiesel, yellow grease, and brown grease [52]. Biodiesel is the industry name for fuel derived by transforming the fatty acids present in vegetable oils, recycled cooking grease, or animal fats to fatty acid methyl esters [53]. Pacific Biodiesel products are used in tour boat engines, generators, off-road heavy equipment, fleet and private on-road vehicles, and industrial boilers. In October of 2002, Pacific Biodiesel's yellow grease product was successfully fired in a large boiler at the Hawaiian Commercial & Sugar (HC&S) Puunene sugar factory in a compliance test for stationary source permitting. Emissions were determined to be below levels mandated by HC&S's air quality permit.
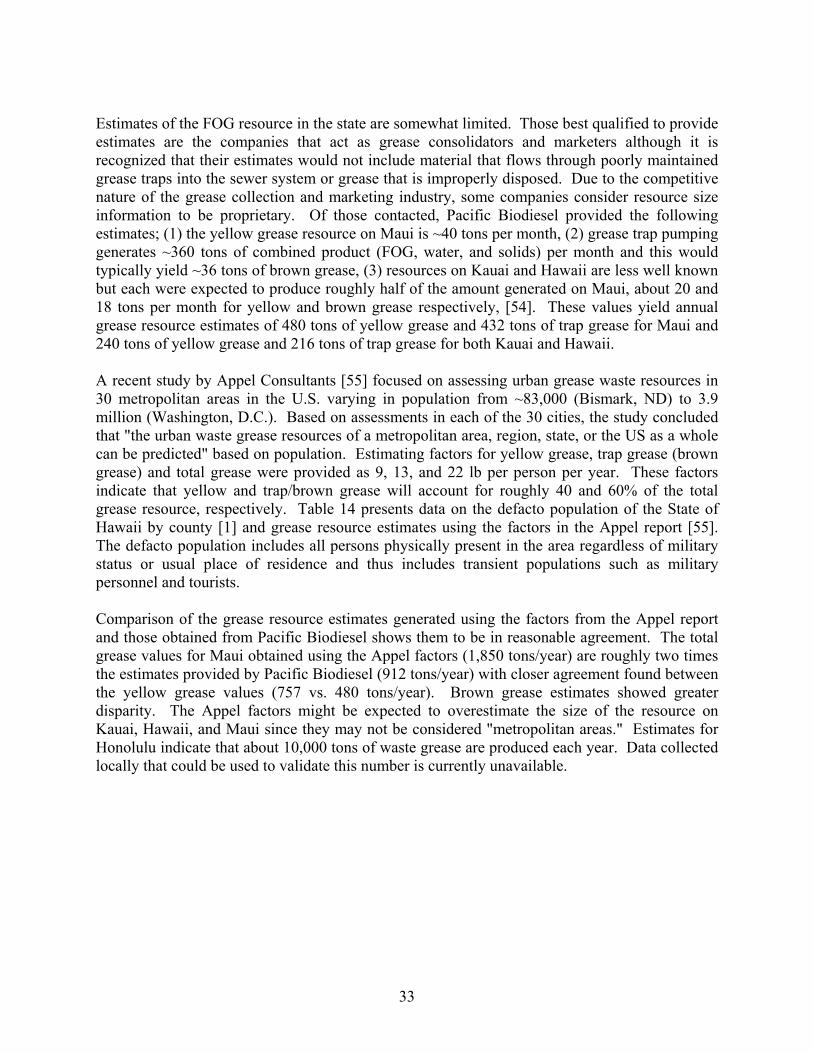
33
Estimates of the FOG resource in the state are somewhat limited. Those best qualified to provide estimates are the companies that act as grease consolidators and marketers although it is recognized that their estimates would not include material that flows through poorly maintained grease traps into the sewer system or grease that is improperly disposed. Due to the competitive nature of the grease collection and marketing industry, some companies consider resource size information to be proprietary. Of those contacted, Pacific Biodiesel provided the following estimates; (1) the yellow grease resource on Maui is ~40 tons per month, (2) grease trap pumping generates ~360 tons of combined product (FOG, water, and solids) per month and this would typically yield ~36 tons of brown grease, (3) resources on Kauai and Hawaii are less well known but each were expected to produce roughly half of the amount generated on Maui, about 20 and 18 tons per month for yellow and brown grease respectively, [54]. These values yield annual grease resource estimates of 480 tons of yellow grease and 432 tons of trap grease for Maui and 240 tons of yellow grease and 216 tons of trap grease for both Kauai and Hawaii. A recent study by Appel Consultants [55] focused on assessing urban grease waste resources in 30 metropolitan areas in the U.S. varying in population from ~83,000 (Bismark, ND) to 3.9 million (Washington, D.C.). Based on assessments in each of the 30 cities, the study concluded that "the urban waste grease resources of a metropolitan area, region, state, or the US as a whole can be predicted" based on population. Estimating factors for yellow grease, trap grease (brown grease) and total grease were provided as 9, 13, and 22 lb per person per year. These factors indicate that yellow and trap/brown grease will account for roughly 40 and 60% of the total grease resource, respectively. Table 14 presents data on the defacto population of the State of Hawaii by county [1] and grease resource estimates using the factors in the Appel report [55]. The defacto population includes all persons physically present in the area regardless of military status or usual place of residence and thus includes transient populations such as military personnel and tourists. Comparison of the grease resource estimates generated using the factors from the Appel report and those obtained from Pacific Biodiesel shows them to be in reasonable agreement. The total grease values for Maui obtained using the Appel factors (1,850 tons/year) are roughly two times the estimates provided by Pacific Biodiesel (912 tons/year) with closer agreement found between the yellow grease values (757 vs. 480 tons/year). Brown grease estimates showed greater disparity. The Appel factors might be expected to overestimate the size of the resource on Kauai, Hawaii, and Maui since they may not be considered "metropolitan areas." Estimates for Honolulu indicate that about 10,000 tons of waste grease are produced each year. Data collected locally that could be used to validate this number is currently unavailable.
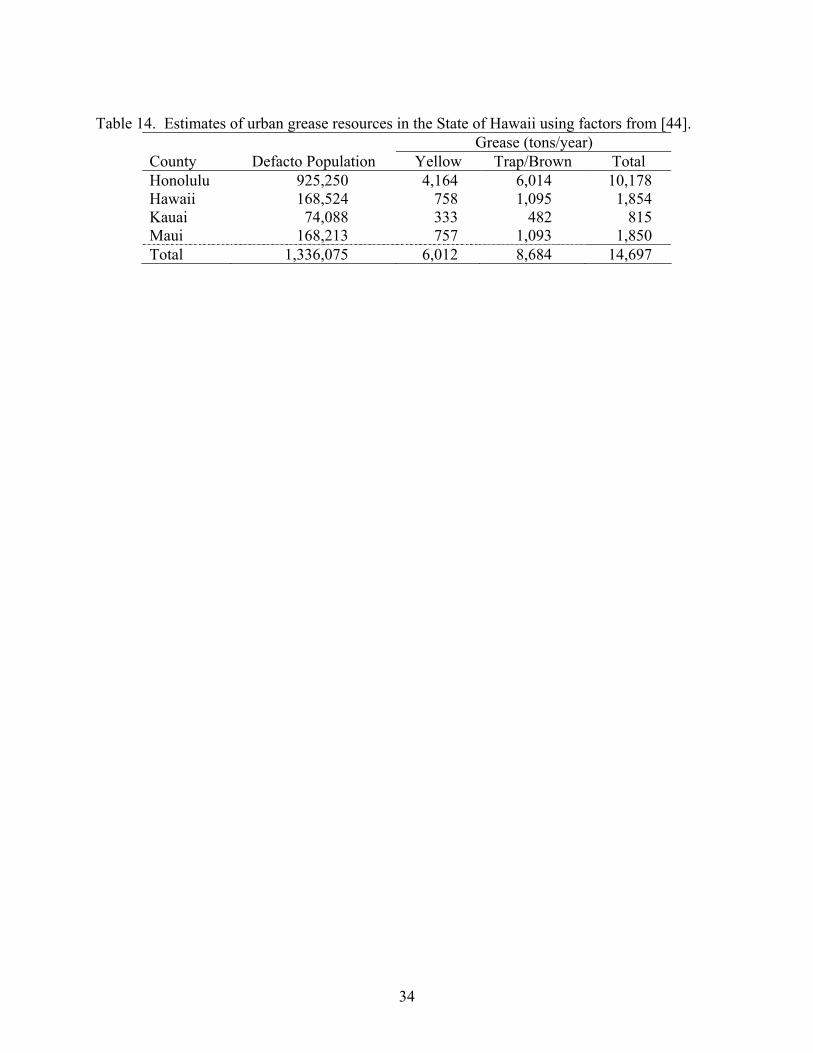
34
Table 14. Estimates of urban grease resources in the State of Hawaii using factors from [44].
Grease (tons/year) County Defacto Population Yellow Trap/Brown Total Honolulu 925,250 4,164 6,014 10,178 Hawaii 168,524 758 1,095 1,854 Kauai 74,088 333 482 815 Maui 168,213 757 1,093 1,850 Total 1,336,075 6,012 8,684 14,697
35
3. Summary and Conclusions An assessment of current and potential biomass and bioenergy resources for the State of Hawaii was conducted. The broad areas of animal wastes, forest products residues, agricultural residues, and urban wastes were included in the assessment. Animal wastes were limited to those produced by domesticated livestock. Agricultural wastes included those generated from sugar cane, pineapple, and macadamia nut culture and processing. The urban waste category was subdivided into four categories – municipal solid waste, food waste, sewage sludge or biosolids, and waste greases. These resources are all managed by utilization or disposal. Table 15 summarizes the biomass resources in the State of Hawaii according to the categories identified above and by their current degree of utilization. Unutilized materials have the potential for exploitation to produce energy, chemicals and biobased materials. Those resources currently utilized also have potential to be diverted to higher value products. New uses for all of these resources will be driven by local, national, and/or international market economics and the policy and regulatory environment. Table 15. Summary of biomass resources and biomass resource utilization in the State of Hawaii broken down by County. tons yr-1 Hawaii Maui Kauai Honolulu Swine Manure dry 410 540 180 1,560 Dairy Manure dry 8,300 Poultry dry 1,5201 4,830 Bagasse Fiber dry 275,000
(275,000)2 74,000
(56,000)2
Molasses as-received 80,000 15,000 Cane Trash dry 137,000 37,000 Pineapple Processing
Waste dry 7,500
(7500)2
Macadamia Nut Shells dry 19,000 (18,000)2
Municipal Solid Waste as-received 110,000 96,000 56,000 668,000 (600,000)2,3
Food Waste4,5 as-received 24,000 15,000 5,800 90,000 Sewage Sludge5 dry 183 3,352
(3,352)2,3 246 16,576
(891)2,3
Fats/Oil/Grease6 dry 1,850 1,850 800 10,000 1 combined poultry waste estimate for Hawaii, Maui, and Kauai. 2 amount currently used. 3 tipping fee associated with utilization. 4 amount entering landfills. 5 included in municipal solid waste value. 6 processed grease, contains minimal moisture
36
4. References 1. Anon. 2001. The State of Hawaii Data Book, A statistical abstract. http://www.hawaii.gov/dbedt/db01/index.html 2. Anon. 1997. 1997 Census of Agriculture Volume 1: Part 11, Chapter 1, Hawaii State-Level Data. United States Department of Agriculture, http://www.nass.usda.gov/census/census97/volume1/hi-11/hi1_33.pdf 3. Anon. 2002. Hawaii Agricultural Statistics Service, Fact finding for agriculture. Hawaii Department of Agriculture, (http://www.nass.usda.gov/hi/lvstk/hogs.htm) . 4. Ohira, R. 1997. Disease and bad weather trigger pig shortage. Honolulu Star Bulletin., http://starbulletin.com/97/04/18/news/story2.html 5. Zaleski, H. Personal communication between S. Turn and Dr. H. Zaleski, Swine Extension Specialist, College of Tropical Agriculture and Human Resources, University of Hawaii, Manoa. 6. Anon. 1980. Midwest Plan Service Structures and Environment Handbook, 10th Edition, Iowa State University, Ames, Iowa. 7. Yang, P.Y. Personal communication between S. Turn and Dr. P.Y. Yang, Professor of Molecular Biosciences and Bioengineering, College of Tropical Agriculture and Human Resources, University of Hawaii, Manoa. 8. Anon. 2002. Hawaii Agricultural Statistics Service, Fact finding for agriculture. Hawaii Department of Agriculture, (http://www.nass.usda.gov/hi/lvstk/cattle.htm). 9. Lee, C.N., Personal communication between S. Turn and Dr. C.N. Lee, Dairy Extension Specialist, College of Tropical Agriculture and Human Resources, University of Hawaii, Manoa. personal communication. 10. Anon. 2002. Hawaii Agricultural Statistics Service. 2001 Poultry and Egg Highlights. Hawaii Department of Agriculture. (http://www.nass.usda.gov/hi/stats/stat-66.htm) 11. Anon. 2002. Hawaii Agricultural Statistics Service, Fact finding for agriculture. Hawaii Department of Agriculture, (http://www.nass.usda.gov/hi/lvstk/lvstk1.htm). 12. Anon. 1994. Hawaii Forestry Investment Memorandum. Prepared for the State of Hawaii, Department of Business, Economic Development & Tourism by Groome Pöyry Limited, Auckland, New Zealand. 13. Constantinides, M. and R.J. Canarella. 1999. A timber inventory of the Waiakea Timber Management Area. Department of Forestry and Wildlife, State of Hawaii. Honolulu, HI.
37
14. Constantinides, M., K.J. Dancil, and R.J. Canarella. 2000. An inventory of state-owned non-native timber resources along the Hamakua Coast of Hawaii. Department of Forestry and Wildlife, State of Hawaii. Honolulu, HI. 15. Constantinides, M. and R.J. Canarella. 1999. An inventory of non-native timber resources on Hawaii – A supplement to the 1999 Waiakea and Hamakua timber inventory reports. Department of Forestry and Wildlife, State of Hawaii. Honolulu, HI. 16. Anon. 2000. Market research on commodity wood products from 8 non-native, Hawaiian grown timber species. Jaakko Pöyry Consulting (Asia-Pacific) Pty Ltd, Canberra Australia. 17. Fung, P.Y.H., M.U.F. Kirschbaum, R.J. Raison, and C. Stucley. 2002. The potential for bioenergy production from Australian forests, its contribution to national greenhouse targets and recent developments in conversion processes. Biomass and Bioenergy, (22) pp. 223-236. 18. Masaki, C. Personal communication between S. Turn and Carl Masaki, State of Hawaii, Department of Land and Natural Resources, Division of Forestry and Wildlife. 19. Constantinides, M., K.J. Dancil, and R.J. Canarella. 2000. An inventory of non-native timber resources in the forest reserves of Kauai. Department of Forestry and Wildlife, State of Hawaii. Honolulu, HI. 20. Chen, J.C.P. 1985. Cane Sugar Handbook, Eleventh Edition. John Wiley & Sons, New York, New York. 21. Paturau, J.M. 1989. By-Products of the Cane Sugar Industry: An Introduction to Their Industrial Utilization, Third Edition. Elsevier, New York, New York. 22. Jakeway, L.A. 2002. Demonstration of Fiber Cane Recovery for Boiler Fuel, Bioenergy 2002, Boise, Idaho. Omnipress. 23. Kennett, A. Personal communication between Alan Kennett (President of Gay & Robinson) and Scott Turn. 24. Anon. 2002. Hawaii Agricultural Statistics Service. Hawaii Pineapple Annual Summary. Hawaii Department of Agriculture. (http://www.nass.usda.gov/hi/fruit/pine.htm) 25. Hubbard, C. Personal communication between Chris Hubbard (Director of Agriculture, Dole Food Company Hawaii) and Scott Turn. 26. Kawano, G. Personal communication between Gary Kawano (Factory Superintendent, Maui Land and Pineapple Company) and Scott Turn. 27. Anon. 2002. Hawaii Agricultural Statistics Service. Hawaii Macadamia Nuts Final Season Estimates, Hawaii Department of Agriculture (http://www.nass.usda.gov/hi/fruit/mac-fin.htm)
38
28. Nagao, M. Personal communication between Michael Nagao (Horticulturalist, University of Hawaii, College of Tropical Agriculture and Human Resources, Beaumont Research Center) and Scott Turn. 29. White, K. Personal communication between Kerwin White (Senior Director of Manufacturing, Mauna Loa Macadamia Nut Corporation) and Scott Turn. 30. Anon. 2002. Oahu Waste Composition, Disposal and Recycling. City and County of Honolulu. (http://www.opala.org/facts1.html) 31. Anon. 2002. Hawaii's Electricity Generation Facilities. Department of Business Economic Development & Tourism. (http://www.hawaii.gov/dbedt/ert/energytable.html) 32. Anon. 2003. Request for Proposals for the Financing, Design, Construction and Twenty (20) Year Operation of a Municipal Solid Waste Plasma Arc/Torch and/or Gasification Facility. City and County of Honolulu. 33. Anon. 2002. Final Supplemental Environmental Impact Statement (FEIS), Waimanalo Gulch Sanitary Landfill Expansion, Waimanalo Gulch, Oahu, Hawaii, TMK: 9-2-03:072 and 073. Prepared for the City and County of Honolulu by R.M. Towill Corporation, Honolulu, HI. 34. Anon. 2002. Final Draft, Revision 1, November 15, 2002, Addendum to the Integrated Solid Waste management Plan for the County of Hawaii. Harding ESE, Aiea, Hawaii. 35. Boucher, P. Personal communication between Peter Boucher (Wastewater Division Chief, Department of Environmental Management, Hawaii County) and Scott Turn. 36. Harder, J. Personal communication between John Harder (Solid Waste Division Chief, Department of Public Works & Waste Management, Maui County) and Scott Turn. 37. Anon. 1993. County of Maui Integrated Solid Waste Management Plan. Paramerix, Inc., Kirkland, WA 38. Anon. 1994. Solid Waste Characterization Study – Maui, Hawaii. December, 1994. R.W. Beck. 39. Anon. 1994. County of Kauai Integrated Solid Waste Management Plan. Harding Lawson Associates. Portland, Oregon. 40. Tanigawa, T. Personal communication between Troy Tanigawa (Solid Waste Division, Department of Public Works, Kauai County) and Scott Turn. 41. Morse, H. 2000. Waimanalo board OKs Unisyn waste cleanup plan. Honolulu Star Bulletin, (http://starbulletin.com/2000/04/11/news/stor15.html)
39
42. Foppoli, J. Unpublished data from the Hawaii Department of Agriculture, Animal Industry Division. 43. Jones, S. Unpublished data, City and County of Honolulu, Department of Environmental Services, Refuse Division, Recycling Office. 44. Anon. 1997. Measuring Recycling: A guide for state and local governments. United States Environmental Protection Agency, Solid Waste and Emergency Response. EPA530-R-97-011. (http://www.epa.gov/recycle.measure/docs/guide1.pdf) 45. Lyum, M. Personal communication between Matt Lyum (Principal, MLC International, LLC) and Scott Turn. 46. Anon. Listing of waste water treatment facilities, capacities and aggregate sludge generation by island in Hawaii in 1999. Unpublished data from the Hawaii Department of Health, Waste Water Branch Chief, Marshall Lum. 47. Anon. 2002. Draft Kailua Wastewater Plant Cogeneration Feasibility Study. Prepared for the City and County of Honolulu by C.H. Guernsey & Company, Honolulu, HI. 48. Gonser. J. 2003. Sewage conversion plant planned. Honolulu Advertiser, February 18, 2003. 49. Schumacher, M.M. 1983. Landfill Methane Recovery. Noyes Data Corporation, Park Ridge, New Jersey. 50. Kawahara, K. Personal communication between Ken Kawahara (Engineer, Regulatory Control Branch, Dept. of Environmental Services) and Scott Turn. 51. Nakaso, D. Grease is a word for new fuel. Honolulu Advertiser, June 18, 2001. 52. Anon. Pacific Biodiesel website (http://www.biodiesel.com) 53. Tyson, K.S. 2001. Biodiesel Handling and Use Guidelines. National Renewable Energy Laboratory Report No. TP-580-30004. (http://www.nrel.gov/docs/fy01osti/30004.pdf) 54. Zolezzi, L. Personal communication between Larry Zolezzi (Pacific Biodiesel, Maui) and Scott Turn. 55. Wiltsee, G. 1998. Urban Waste Grease Resource Assessment. Produced by Appel Consultants, Inc., Valencia, CA for the National Renewable Energy Laboratory, NREL Report No. SR-570-26141. (http://www.nrel.gov/docs/fy99osti/26141.pdf)