biomarkers and social sciences elliot friedman biomarkers, genetics, and social sciences workshop...
Post on 19-Dec-2015
215 views
TRANSCRIPT

Biomarkers and Social Sciences
Elliot Friedman
Biomarkers, Genetics, and Social Sciences Workshop
July 7, 2010

Biomarkers and social sciences What is a “biomarker?”
Indicator of some biological process Biological processes are designed to serve
adaptive functions Can become damaging to health under certain
circumstances A potential mechanistic link between social factors
and health outcomes How social factors may “get under the skin”

Example – social status and health Health status is graded by social status
Living in poverty 12 fewer years of life 16 fewer years of disease/disability-free life
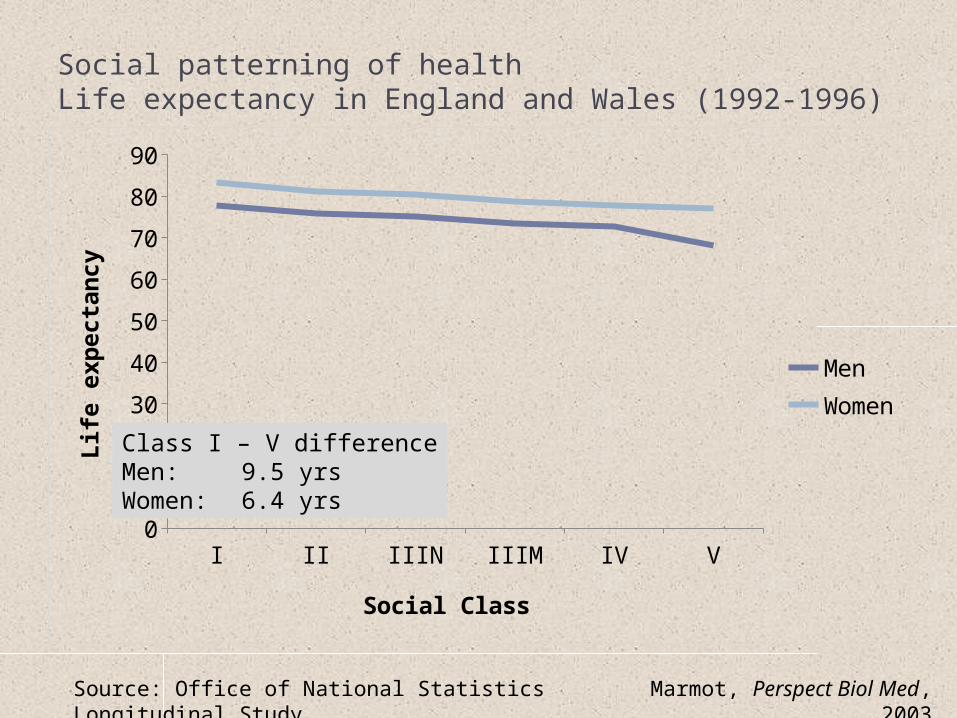
Social patterning of healthLife expectancy in England and Wales (1992-1996)
I II IIIN IIIM IV V0
10
20
30
40
50
60
70
80
90
MenWomen
Social Class
Lif
e e
xp
ecta
ncy
Marmot, Perspect Biol Med, 2003
Source: Office of National Statistics Longitudinal Study
Class I – V differenceMen: 9.5 yrsWomen: 6.4 yrs

Example – social status and health Health status is graded by social status
Living in poverty 12 fewer years of life 16 fewer years of disease/disability-free life
What accounts for social gradients in health? Possible explanations
Differential access to health care But gradient seen in countries with universal health care
Poorer health behavior among the poor Explains only ~30% of the relationship
Psychosocial factors, especially stress
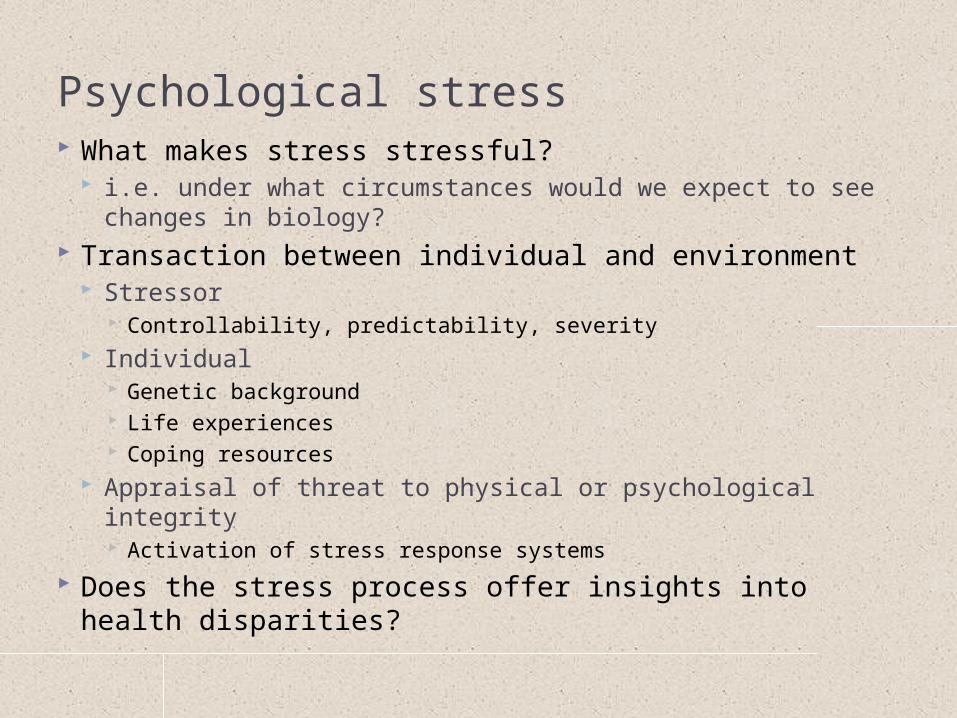
Psychological stress What makes stress stressful?
i.e. under what circumstances would we expect to see changes in biology?
Transaction between individual and environment Stressor
Controllability, predictability, severity Individual
Genetic background Life experiences Coping resources
Appraisal of threat to physical or psychological integrity Activation of stress response systems
Does the stress process offer insights into health disparities?
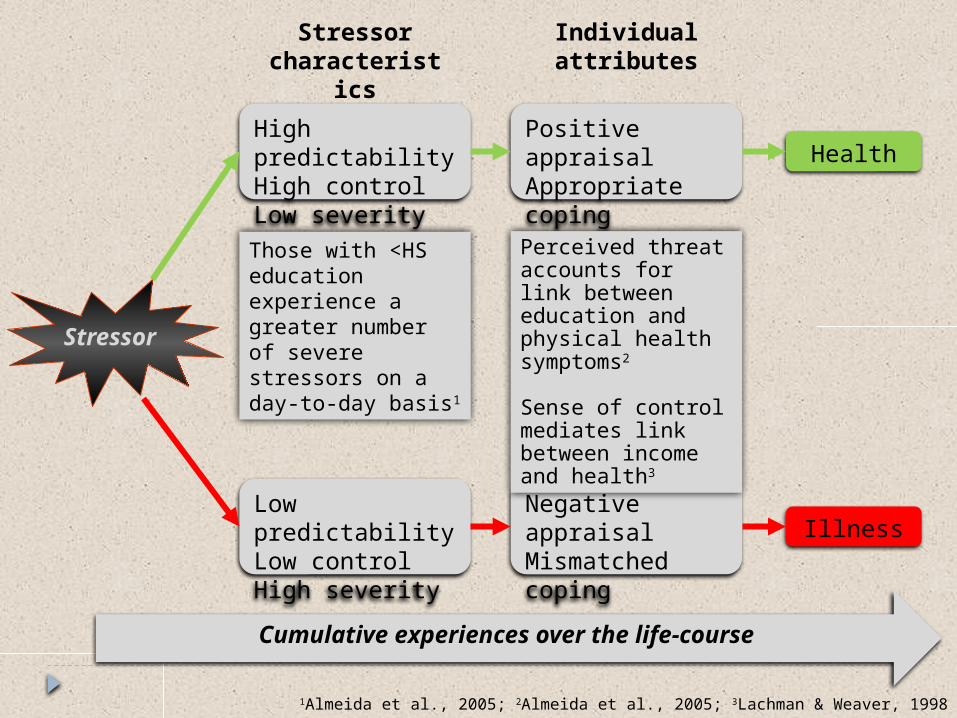
Stressor
Health
Illness
Stressor characteristi
cs
Individual attributes
High predictabilityHigh controlLow severity
Low predictabilityLow controlHigh severity
Positive appraisalAppropriate coping
Negative appraisalMismatched coping
Those with <HS education experience a greater number of severe stressors on a day-to-day basis1
1Almeida et al., 2005; 2Almeida et al., 2005; 3Lachman & Weaver, 1998
Perceived threat accounts for link between education and physical health symptoms2
Sense of control mediates link between income and health3
Cumulative experiences over the life-course
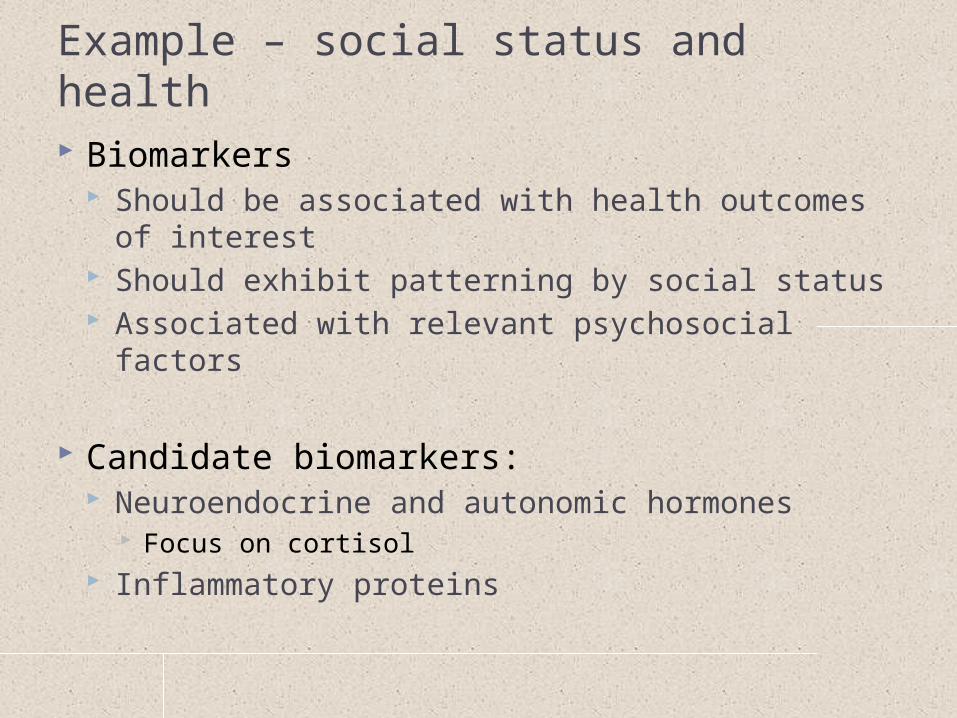
Example – social status and health Biomarkers
Should be associated with health outcomes of interest
Should exhibit patterning by social status Associated with relevant psychosocial factors
Candidate biomarkers: Neuroendocrine and autonomic hormones
Focus on cortisol Inflammatory proteins

Organizational model:psychosocial factors and physiological dysregulation
Social Status
Health Behaviors Psychosocial Processes
Neuroendocrine and autonomic regulatory
systems
Inflammatory proteins
Disease

Plan for the afternoon Part I Neuroendocrine and autonomic
hormones Part II Inflammatory proteins Part III Multi-system dysregulation
Part INeuroendocrine and autonomic hormones
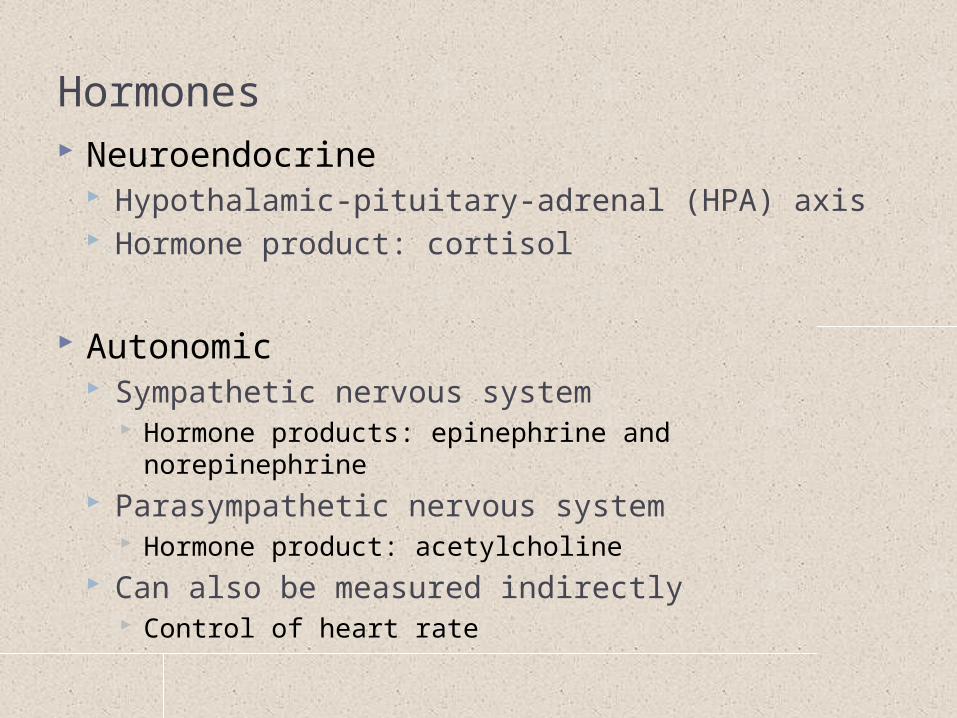
Hormones Neuroendocrine
Hypothalamic-pituitary-adrenal (HPA) axis Hormone product: cortisol
Autonomic Sympathetic nervous system
Hormone products: epinephrine and norepinephrine Parasympathetic nervous system
Hormone product: acetylcholine Can also be measured indirectly
Control of heart rate
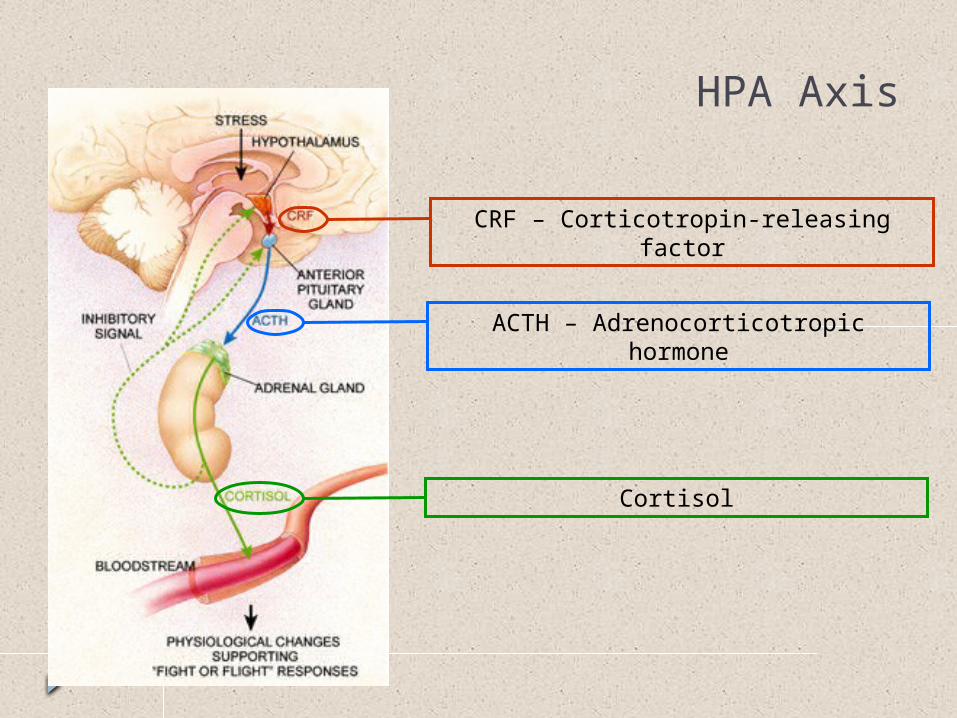
CRF – Corticotropin-releasing factor
ACTH – Adrenocorticotropic hormone
Cortisol
HPA Axis
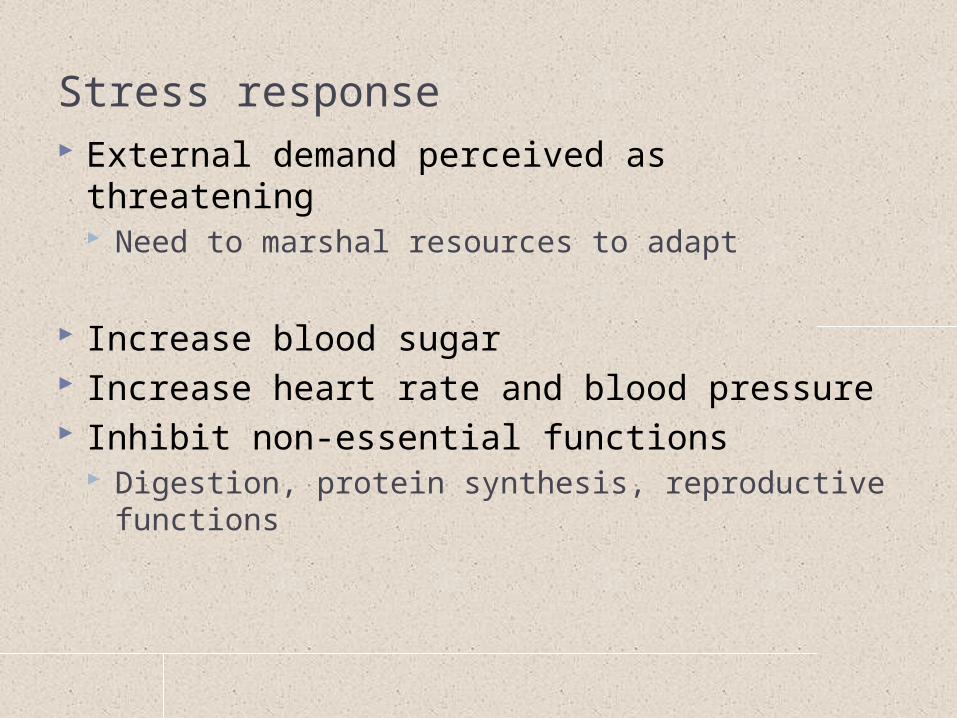
Stress response External demand perceived as threatening
Need to marshal resources to adapt
Increase blood sugar Increase heart rate and blood pressure Inhibit non-essential functions
Digestion, protein synthesis, reproductive functions

HIPPOCAMPUS
Negative Feedback
In the presence of sustained exposure to cortisol, feedback is lost

Cortisol and hippocampal volume
Lupien et al., Nat Neurosci., 1998

Measuring cortisol Source of cortisol
Urine Blood Saliva
Type of measurement Assessment of stable levels Assessment of dynamic change

Measuring cortisol Stable levels
Urinary cortisol Integrative measure Need to adjust for urine concentration
Typically by using creatinine levels
Blood or saliva
Low lonely High lonely0
5
10
15
20
25
30
35
Uri
nary
Cort
isol
(mg/g
cre
ati
nin
e)
Sapolsky et al (1997), Archives of General Psychiatry, 54: 1137-1143
Kiecolt-Glaser et al. (1984), Psychosomatic Medicine, 46: 15-23

Measuring cortisol Dynamic change
Diurnal rhythm Cortisol awakening
response (CAR) Daily decline Area under the curve
(AUC)
Up to 50% increase in cortisol 30-45 min after awakening
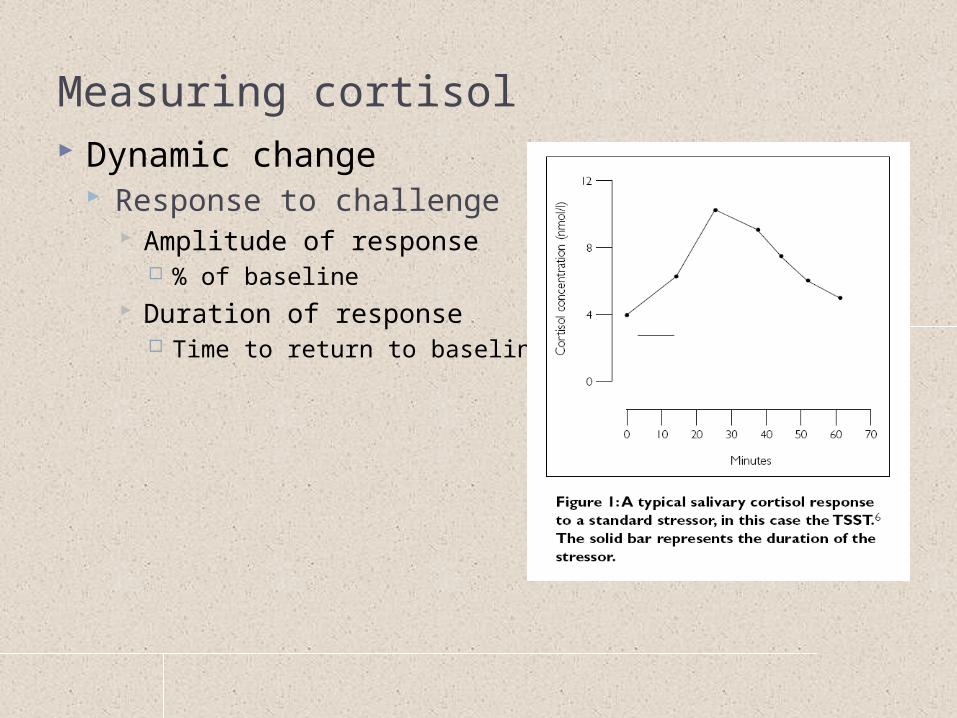
Measuring cortisol Dynamic change
Response to challenge Amplitude of response
% of baseline Duration of response
Time to return to baseline

Evaluating cortisol What do the different assessments tell you?
Stable levels Urinary sample is most reliable Time scale: ½ to full day Q: How do social factors relate to stable levels of cortisol?
Diurnal patterns Time scale: hours; times of day Q: How do social factors relate to dynamics of daily cortisol
regulation? Response to challenge
Time scale: minutes Q: How do social factors relate to HPA system’s ability to
respond to and recover from an acute challenge?
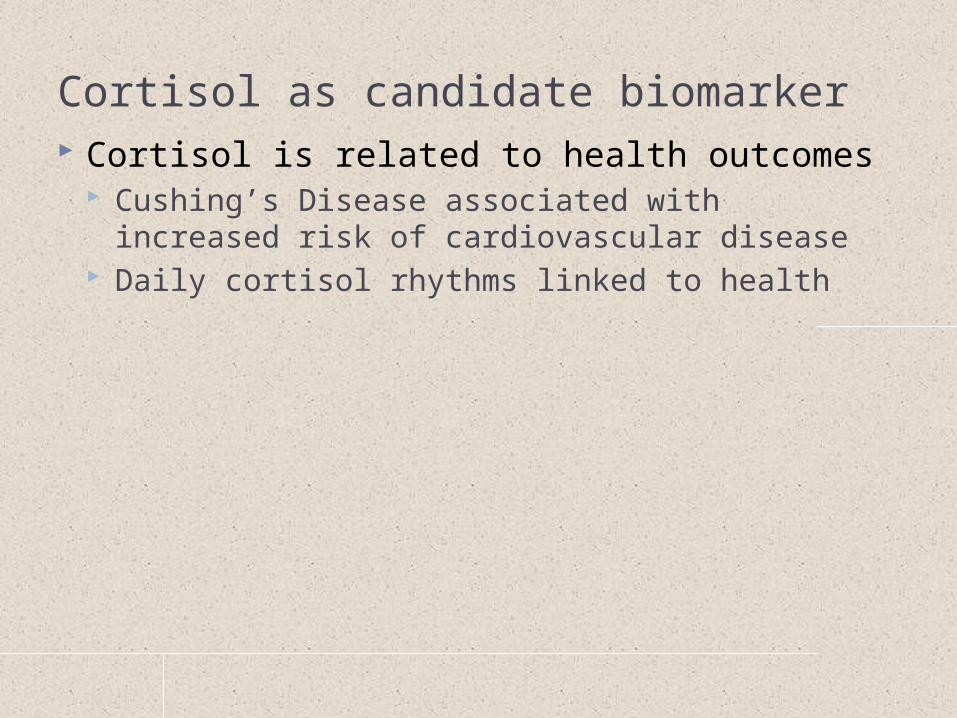
Cortisol as candidate biomarker Cortisol is related to health outcomes
Cushing’s Disease associated with increased risk of cardiovascular disease
Daily cortisol rhythms linked to health
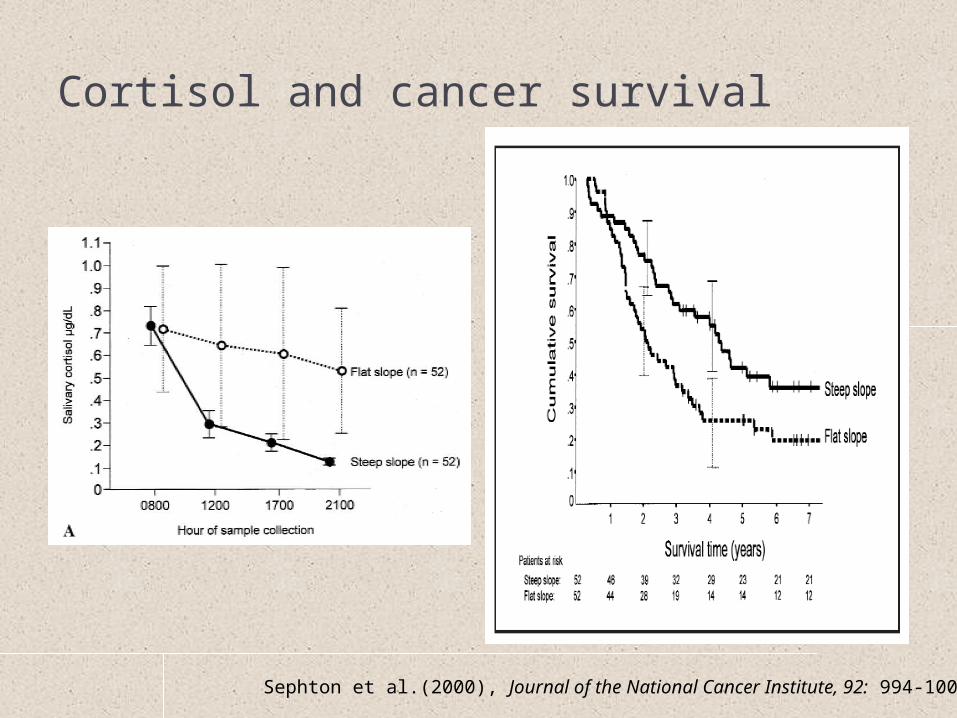
Cortisol and cancer survival
Sephton et al.(2000), Journal of the National Cancer Institute, 92: 994-1000

Cortisol as candidate biomarker Cortisol is related to health outcomes
Cushing’s Disease associated with increased risk of cardiovascular disease
Daily cortisol rhythms linked to health
Cortisol is patterned by social factors (including status)

Social factors and diurnal cortisol patterns
Hajat et al (2010), Psychoneuroendocrinology, 35: 932-943
Data from the Multi-Ethnic Study of Atherosclerosis (MESA; N = 935)

Social factors and diurnal cortisol patterns
Data from the study of Coronary Artery Risk Development in Adolescents (CARDIA; N = 781)
Cohen et al (2006), Psychosomatic Medicine, 68: 41-50

Cortisol as candidate biomarker Cortisol is related to health outcomes
Cushing’s Disease associated with increased risk of cardiovascular disease
Daily cortisol rhythms linked to health
Cortisol is patterned by social factors (including status)
Associated with relevant psychosocial factors Stressors increases cortisol levels
Social-evaluative threats are the most potent Mitigating factors
Perceptions of control or predictability Social support
Severe or chronic stress changes cortisol regulation Flatter diurnal slopes Amplified responses to acute stressors
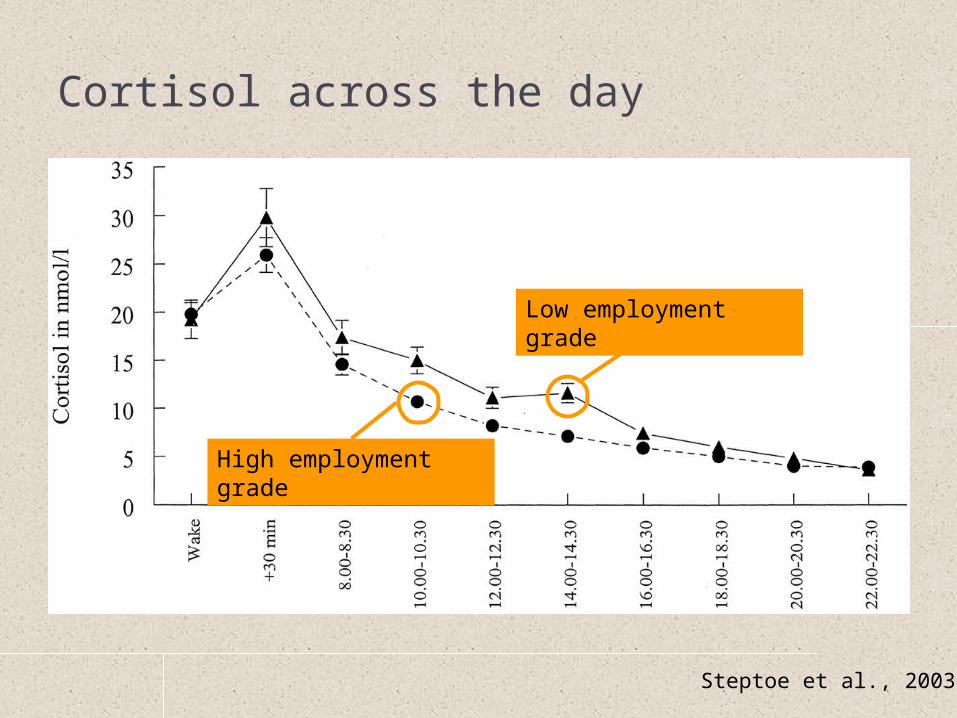
Cortisol across the day
Steptoe et al., 2003
Low employment grade
High employment grade
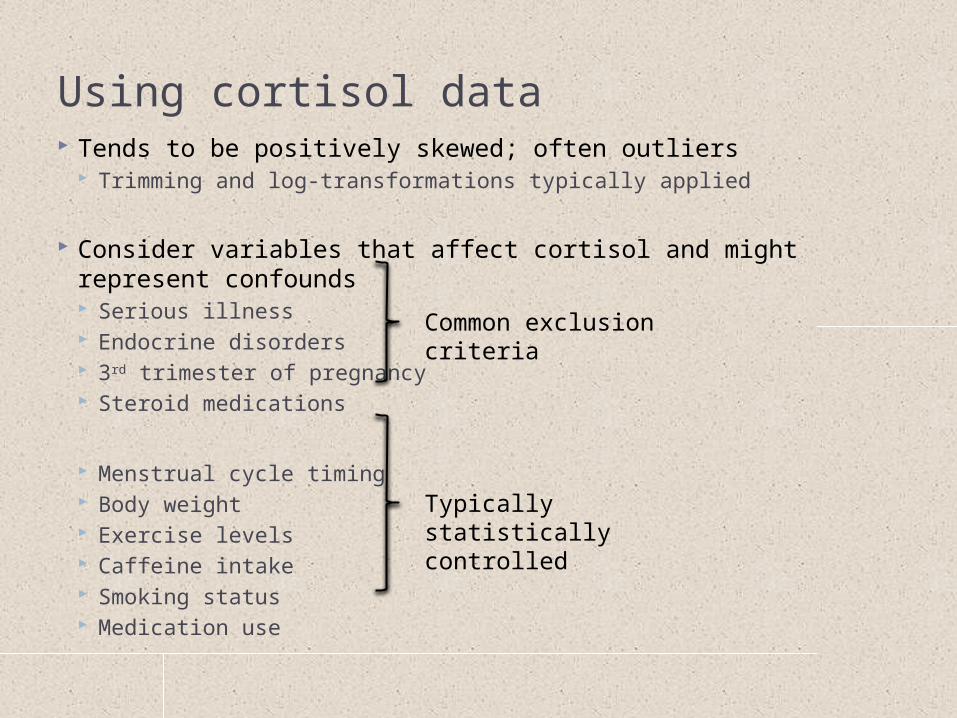
Using cortisol data Tends to be positively skewed; often outliers
Trimming and log-transformations typically applied
Consider variables that affect cortisol and might represent confounds Serious illness Endocrine disorders 3rd trimester of pregnancy Steroid medications
Menstrual cycle timing Body weight Exercise levels Caffeine intake Smoking status Medication use
Common exclusion criteria
Typically statistically controlled

Using cortisol data Additional considerations
What time of day were data collected? Important for blood and saliva in particular
For daily samples, how was collection time verified? Critical for determining daily patterns, like CAR or
decline

Importance of sample timing
Kudielka et al (2003), Psychosomatic Medicine 65: 313-319

Age and the CAR:Rationale for multi-day cortisol sampling
Data from the Survey of Mid-Life in the United States (MIDUS; N = 1,143
Almeida et al (2009), Psychology and Aging, 24: 819-827
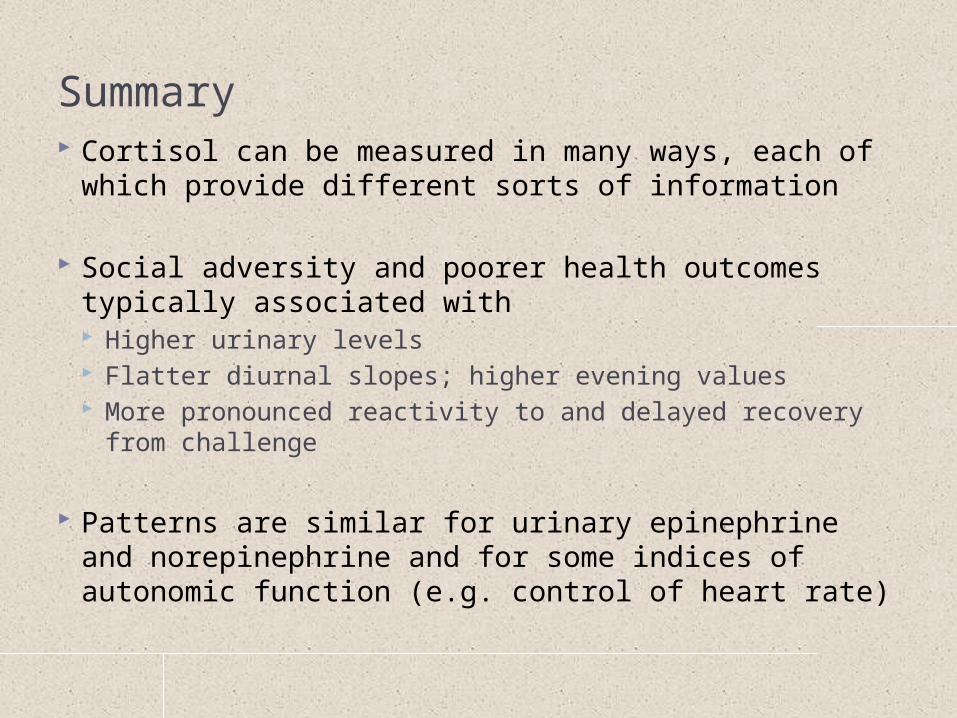
Summary Cortisol can be measured in many ways, each of
which provide different sorts of information
Social adversity and poorer health outcomes typically associated with Higher urinary levels Flatter diurnal slopes; higher evening values More pronounced reactivity to and delayed recovery
from challenge
Patterns are similar for urinary epinephrine and norepinephrine and for some indices of autonomic function (e.g. control of heart rate)

Inflammatory proteins
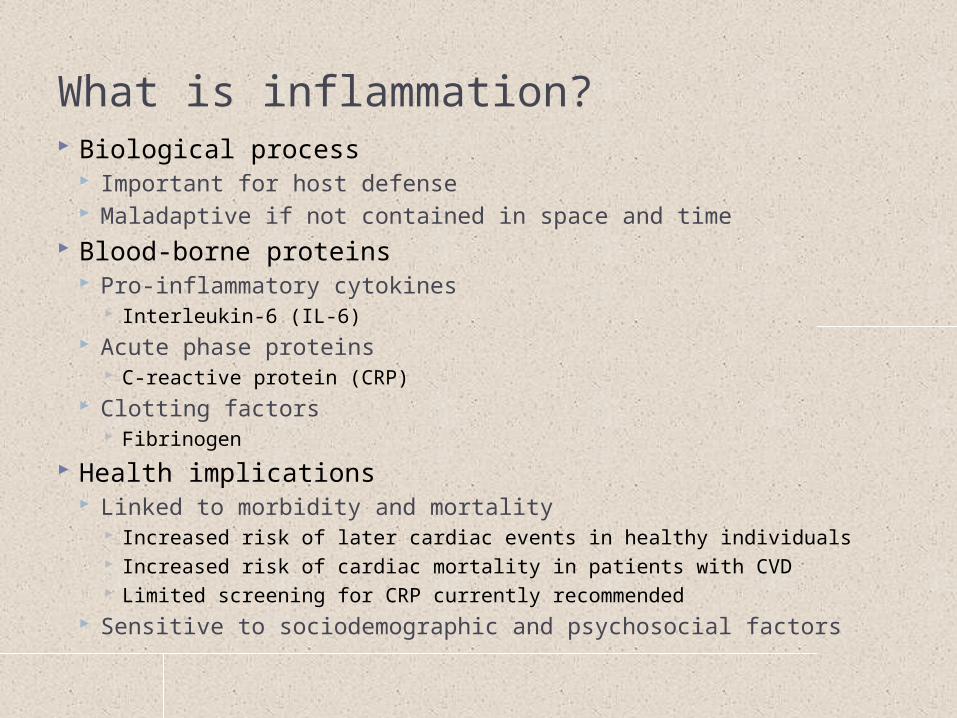
What is inflammation? Biological process
Important for host defense Maladaptive if not contained in space and time
Blood-borne proteins Pro-inflammatory cytokines
Interleukin-6 (IL-6) Acute phase proteins
C-reactive protein (CRP) Clotting factors
Fibrinogen
Health implications Linked to morbidity and mortality
Increased risk of later cardiac events in healthy individuals Increased risk of cardiac mortality in patients with CVD Limited screening for CRP currently recommended
Sensitive to sociodemographic and psychosocial factors

Macrophage
“Large eater” Innate immune
system Many locations
around body Initiates
inflammatory response
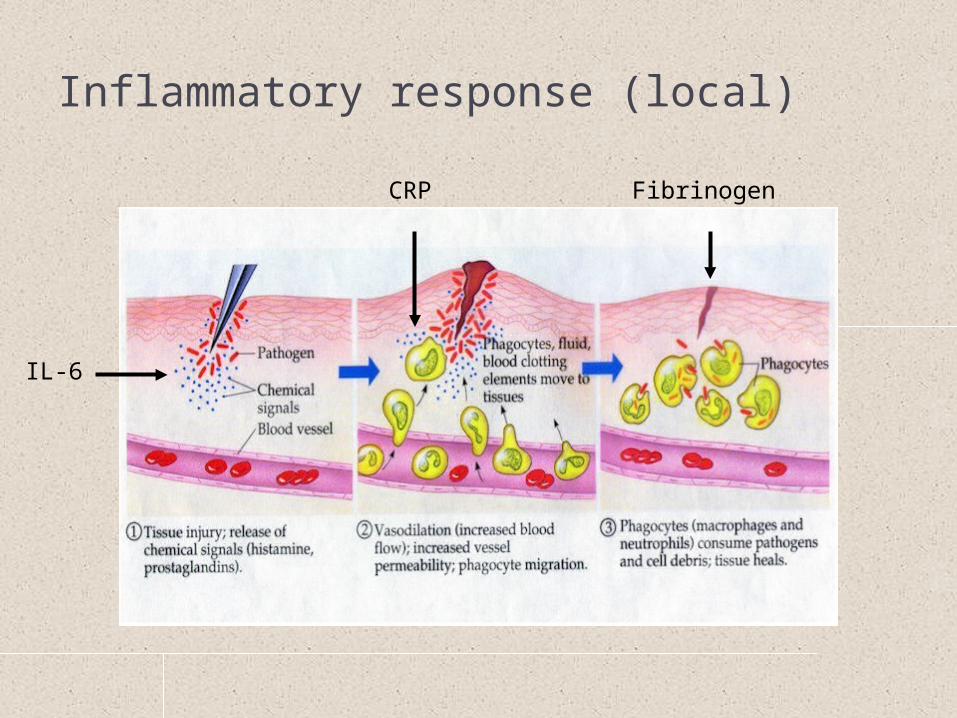
Inflammatory response (local)
IL-6
CRP Fibrinogen

Inflammation Local
Contained, short-lived Proteins typically not detected in blood Critical for host defense
Robust response indicative of optimal health Systemic
Indicative of chronic disease or disease risk Measurable blood levels of inflammatory
proteins Predictive of adverse health outcomes
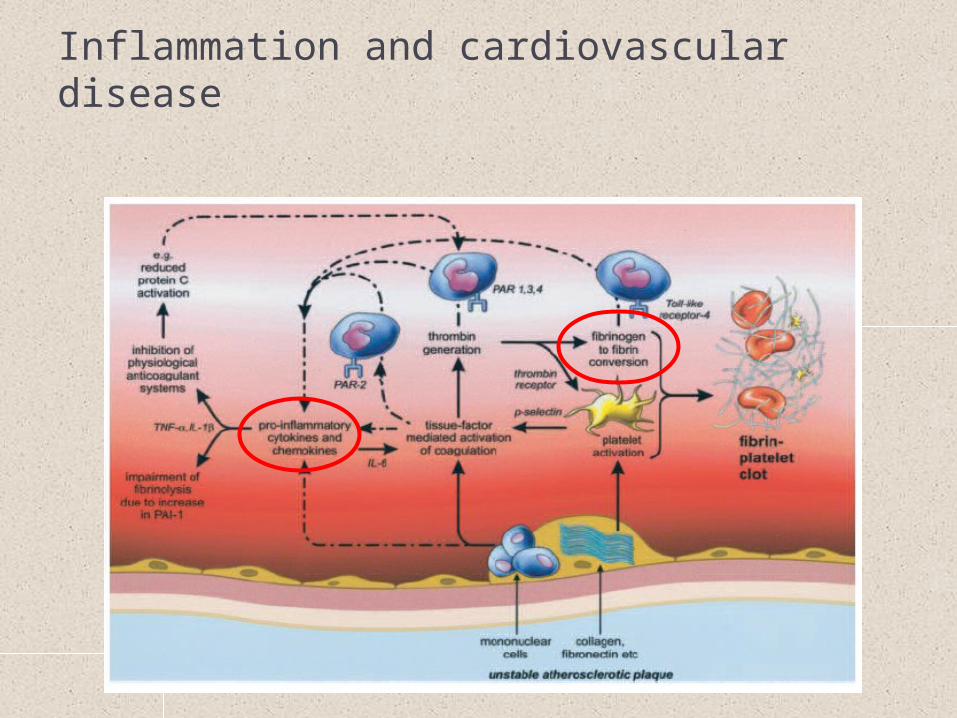
Inflammation and cardiovascular disease

Social status and health Inflammatory proteins as candidate
biomarkers Should be associated with health outcomes of
interest

Inflammation as nexus
Inflammation
Cardiovascular Disease
Diabetes
Cancer
Alzheimer’s Disease
Rheumatoid arthritis
E.g. Interleukin-6 (IL-6)

Social status and health Inflammatory proteins as candidate
biomarkers Should be associated with health outcomes of
interest Should exhibit patterning by social status
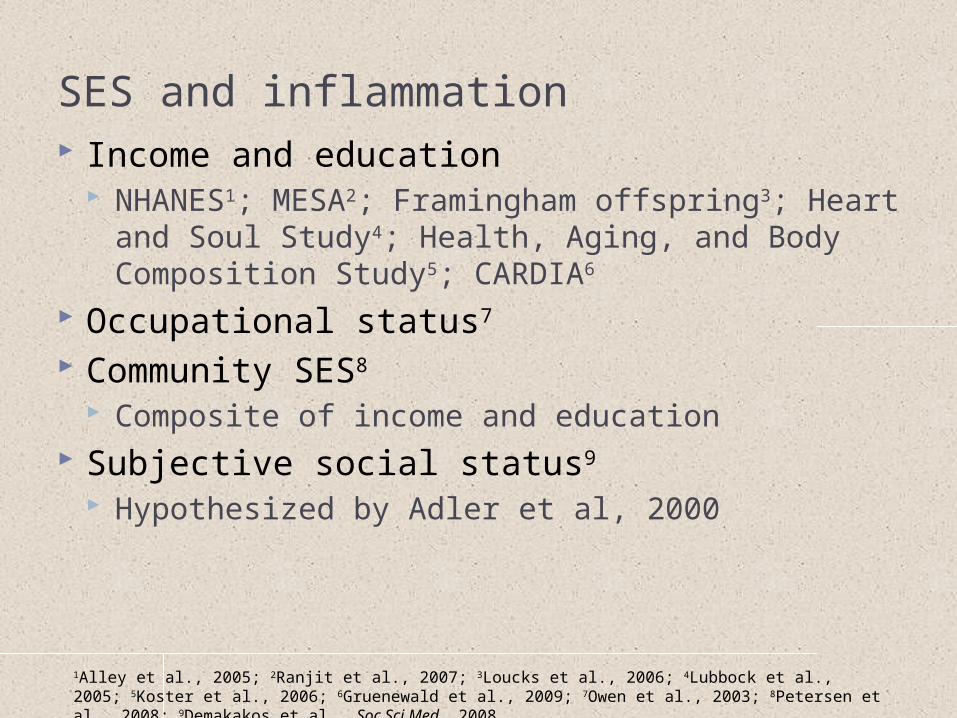
SES and inflammation Income and education
NHANES1; MESA2; Framingham offspring3; Heart and Soul Study4; Health, Aging, and Body Composition Study5; CARDIA6
Occupational status7
Community SES8
Composite of income and education Subjective social status9
Hypothesized by Adler et al, 2000
1Alley et al., 2005; 2Ranjit et al., 2007; 3Loucks et al., 2006; 4Lubbock et al., 2005; 5Koster et al., 2006; 6Gruenewald et al., 2009; 7Owen et al., 2003; 8Petersen et al., 2008; 9Demakakos et al., Soc Sci Med, 2008
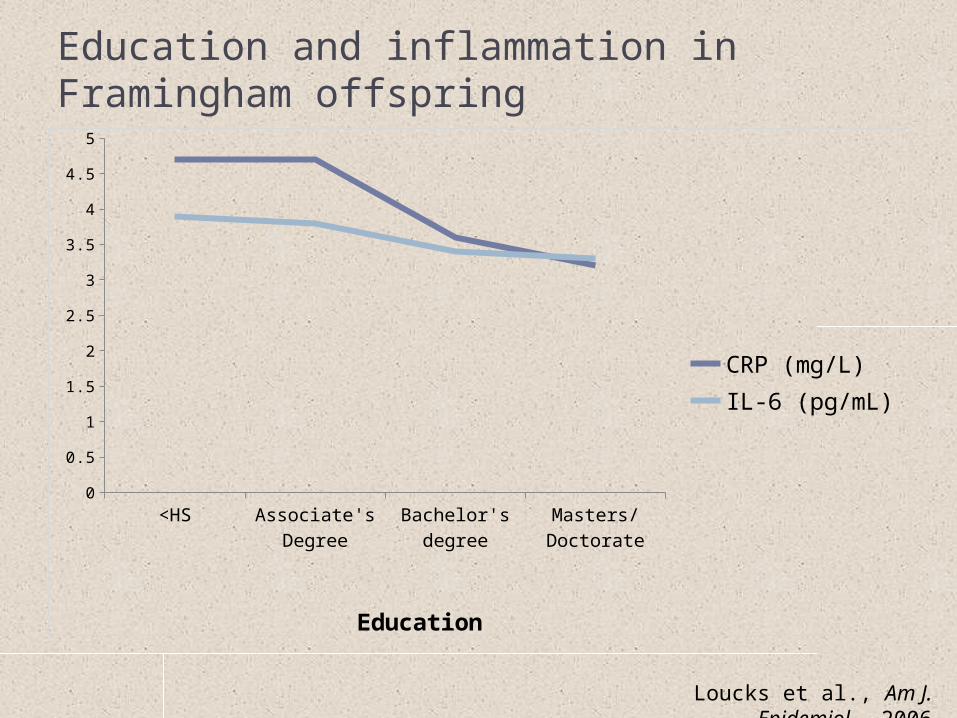
Education and inflammation in Framingham offspring
0
0.5
1
1.5
2
2.5
3
3.5
4
4.5
5
CRP (mg/L)IL-6 (pg/mL)
Education
Loucks et al., Am J. Epidemiol., 2006

Poverty and very high CRP (>10 mg/L) in NHANES IV
Alley et al., Brain Behav. Immun., 2006
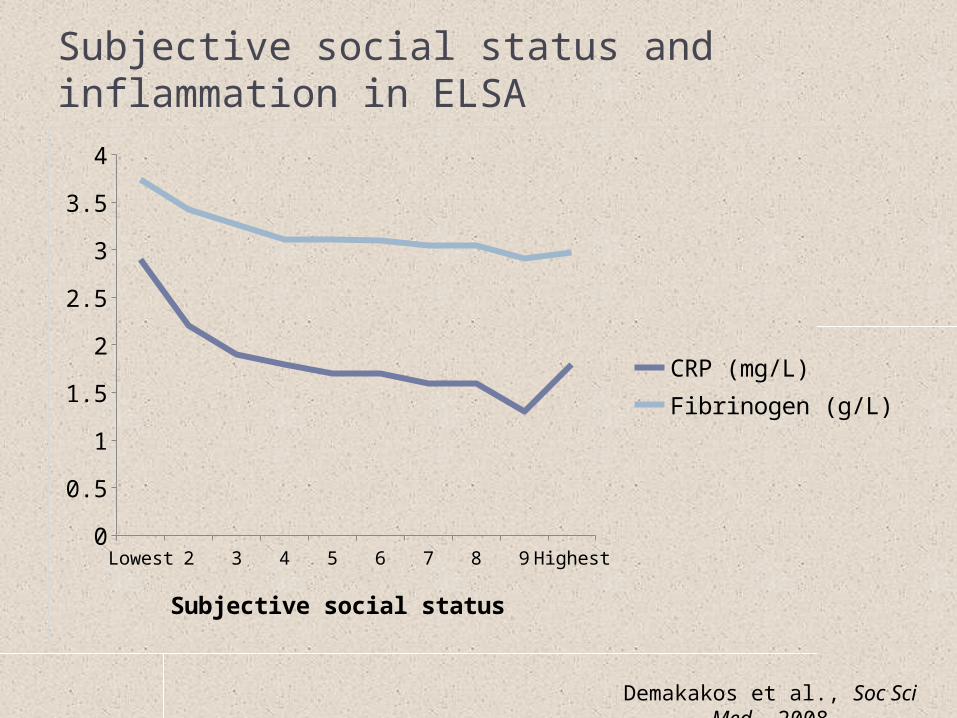
Subjective social status and inflammation in ELSA
Lowest 2 3 4 5 6 7 8 9 Highest0
0.5
1
1.5
2
2.5
3
3.5
4
CRP (mg/L)Fibrinogen (g/L)
Subjective social status
Demakakos et al., Soc Sci Med, 2008

Income and IL-6
Q1 Q2 Q3 Q4 Q50
0.1
0.2
0.3
0.4
0.5
Pre-Tax Household Income (quintiles)
Log S
eru
m I
L-6
Lowest Highest
Friedman & Herd (2010), Psychosomatic Medicine, 73: 290-300

Income and CRP
Q1 Q2 Q3 Q4 Q50
0.1
0.2
0.3
Pre-Tax Household Income (quintiles)
Log S
eru
m C
RP
Lowest Highest
Friedman & Herd (2010), Psychosomatic Medicine, 73: 290-300

Social status and health Inflammatory proteins as candidate
biomarkers Should be associated with health outcomes of
interest Should exhibit patterning by social status Associated with relevant psychosocial factors

Inflammation as nexus
Inflammation
Socioeconomic status
Psychological functioning
Social and familial
relationships
Cardiovascular Disease
Diabetes
Cancer
Alzheimer’s Disease
Rheumatoid arthritis
Age
Neurobiological functioning
E.g. Interleukin-6 (IL-6)

Measuring inflammatory proteinsCollection method Advantages Disadvantages
Blood sample Many assays calibrated for blood samples
Can analyze multiple proteins in single sample (now hundreds of proteins)
Invasive
Collection requires trained phlebotomists
Samples must be processed and frozen quickly after collection
Blood spot Minimally invasive
Can be easily used in the field
Very stable at room temperature for long periods
Few assays available (CRP, but not IL-6)
Quality of spot important; may require trained staff
Saliva Non-invasive
Can be easily used in the field
Few assays available (IL-6, but not CRP)
Sample must be frozen soon after collection
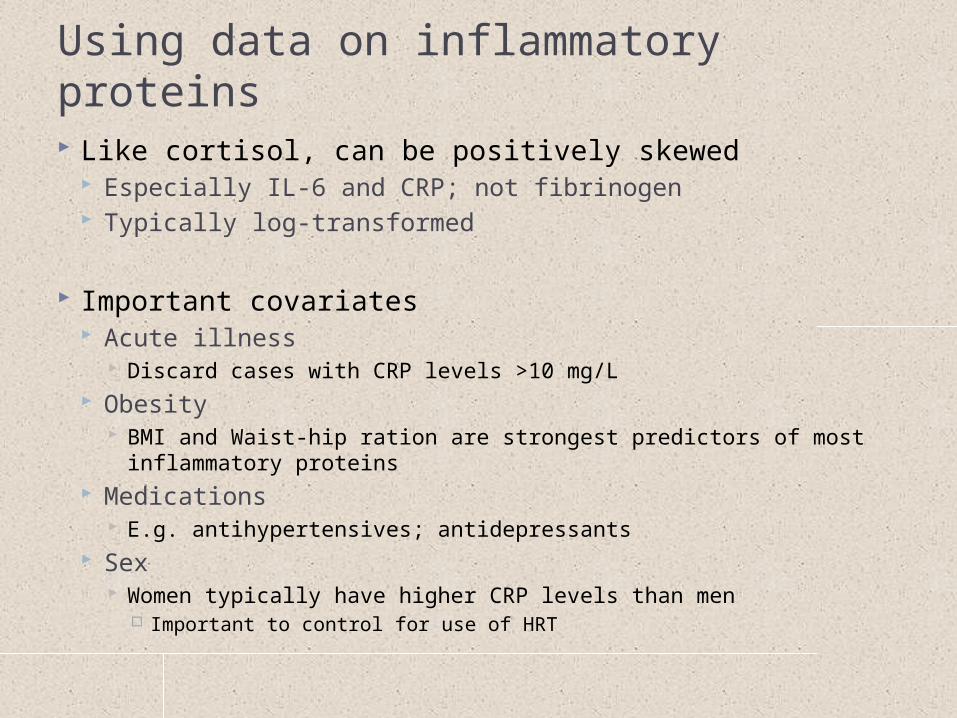
Using data on inflammatory proteins Like cortisol, can be positively skewed
Especially IL-6 and CRP; not fibrinogen Typically log-transformed
Important covariates Acute illness
Discard cases with CRP levels >10 mg/L Obesity
BMI and Waist-hip ration are strongest predictors of most inflammatory proteins
Medications E.g. antihypertensives; antidepressants
Sex Women typically have higher CRP levels than men
Important to control for use of HRT

Integrative model:regulation of inflammation How does inflammation machinery “listen” to
social factors? Regulation by neuroendocrine and autonomic
systems Influences
Cortisol is anti-inflammatory Norepinephrine and epinephrine have pro-
inflammatory actions

Neuroendocrine and autonomic regulation

Macrophage

Cortisol regulation of immune function
Miller et al., 2002

Integrative model:role for epigenetics Epigenetics
Genome codes for proteins “epigenome” determines whether and when genes
are activated and proteins are actually made Gene X environment interaction in “real time”
Can be long-lasting (intergenerational)

Epigenetics
Young MZ twins Old MZ twins
Fraga et al. (2005), PNAS:10604-10609
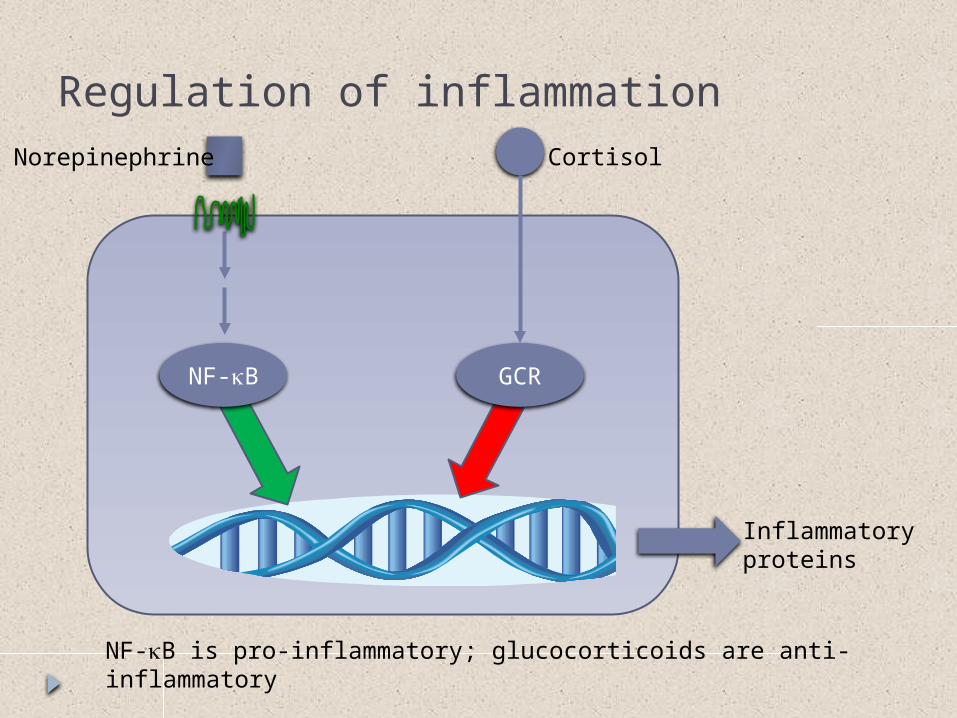
Regulation of inflammation
NF-kB
Cortisol
GCR
Inflammatory proteins
NF-kB is pro-inflammatory; glucocorticoids are anti-inflammatory
Norepinephrine
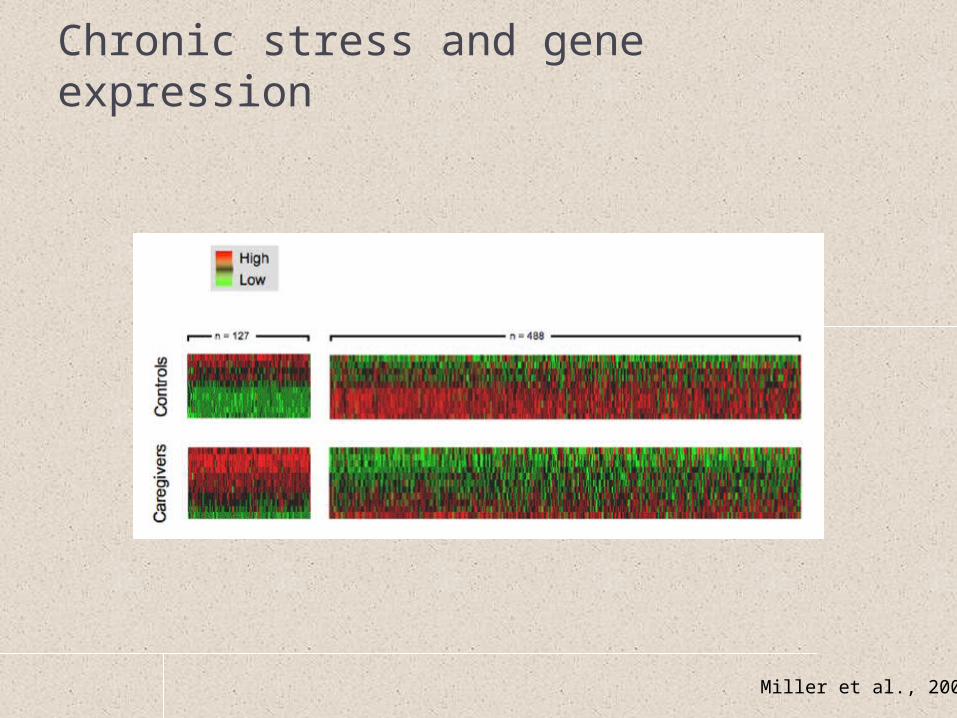
Chronic stress and gene expression
Miller et al., 2008
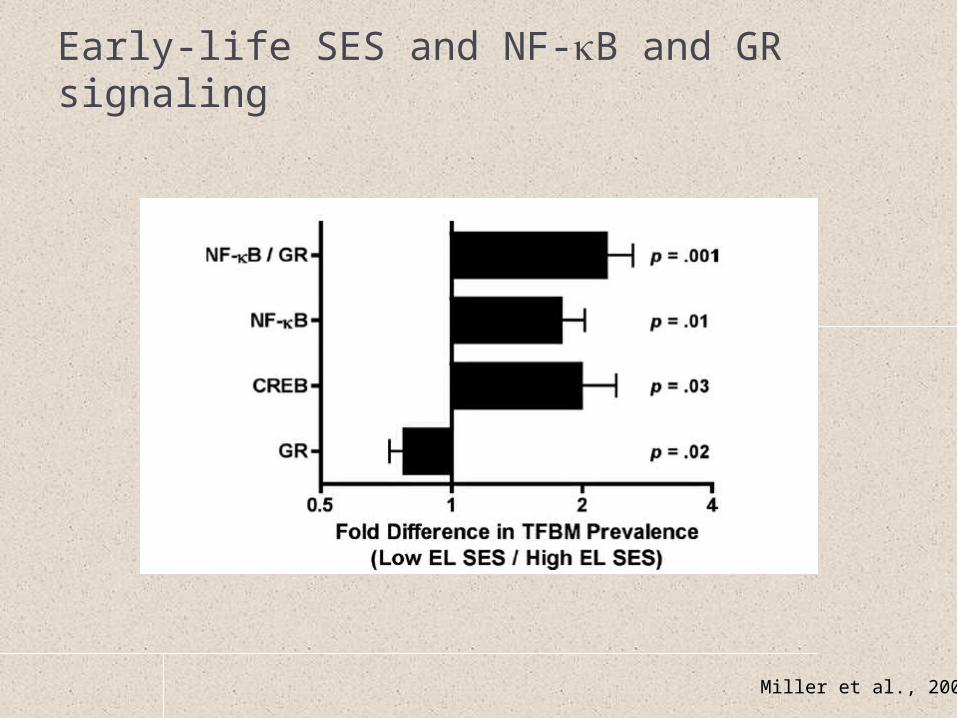
Early-life SES and NF-kB and GR signaling
Miller et al., 2009

Chronic stress and regulation of inflammation
Miller et al., 2008

Multi-system dysregulation

Multi-system dysregulation Rationale
Changes in multiple biological systems associated with both social factors and different disease states
Biological risk of disease may be best captured by multi-system perspective
Allostatic load Homeostasis - “steady state” Allostasis - “stability through change” Maintaining vital functions “costs” an organism
Over time, organism may not be able to return to optimal levels of function (“wear and tear”)
Costs are higher when demands are greater or more persistent e.g. low social status Cost benefit assessment: survival in the short-term in exchange for
disease in the long-term

Allostatic loadWhat to measure?
Earlier formulation (10 items) Recent formulation (19 items)
Systolic blood pressure Diastolic blood pressure Waist-hip ratio Lipids (total and HDL
cholesterol) Glycosylated hemoglobin Urinary cortisol, DHEA-S Urinary norepinephrine Urinary epinephrine
Cardiovascular Systolic blood pressure Diastolic blood pressure Heart rate/pulse
Metabolism Glucose Glycosylated hemoglobin Insulin Lipids (total, HDL, LDL cholesterol) Body mass index/waist-hip ratio
HPA Urinary cortisol, DHEA-S
Autonomic Urinary norepinephrine/epinephrine Heart rate variability
Inflammation IL-6, CRP

Allostatic loadHow to measure? Summary score
Number of items in top (i.e. “highest risk”) quartile of distribution Bottom quartile for HDL cholesterol and DHEA-S
Other approaches that have been used Canonical correlation
Karlamangla et al (2002), Journal of Clinical Epidemiology, 55: 696-710 Recursive partitioning
Gruenewald et al (2006), Proceedings of the National Academy of Sciences, 103: 14158-14163.
Grade-of-membership Seplacki et al (2006), Demography, 43: 165-183.
Current Conclusion No clear “gold standard” for either items to include or construction
of risk index
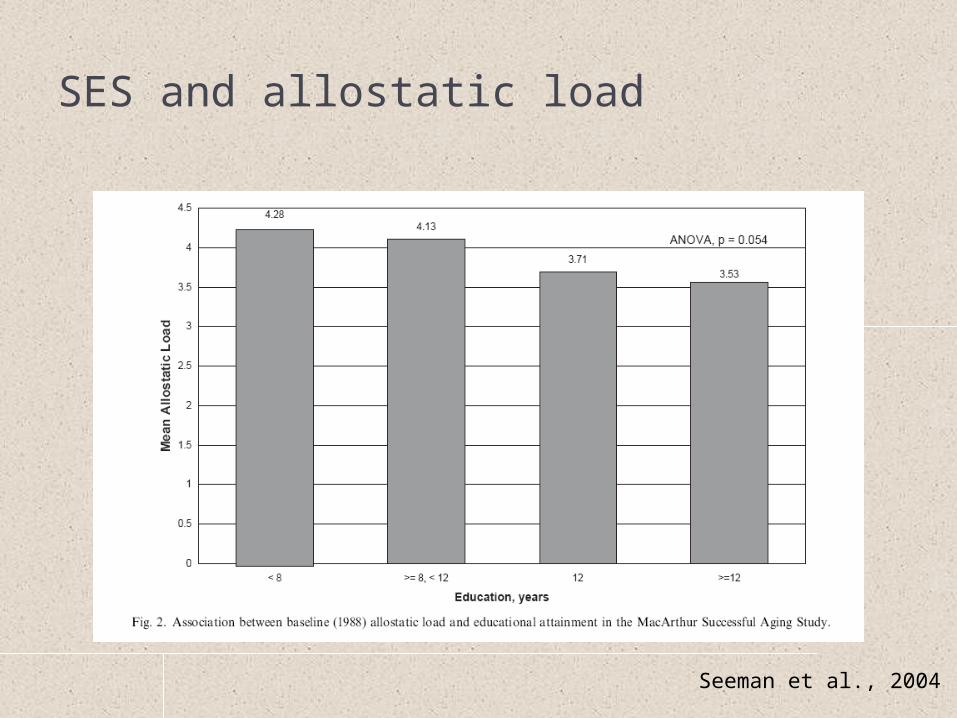
SES and allostatic load
Seeman et al., 2004

Allostatic load and mortality risk
Seeman et al., 2004

Recursive partitioning (regression trees)
Gruenewald et al (2006), PNAS, 103: 14158-14163

Recursive partitioning (regression trees)
Gruenewald et al (2006), PNAS, 103: 14158-14163
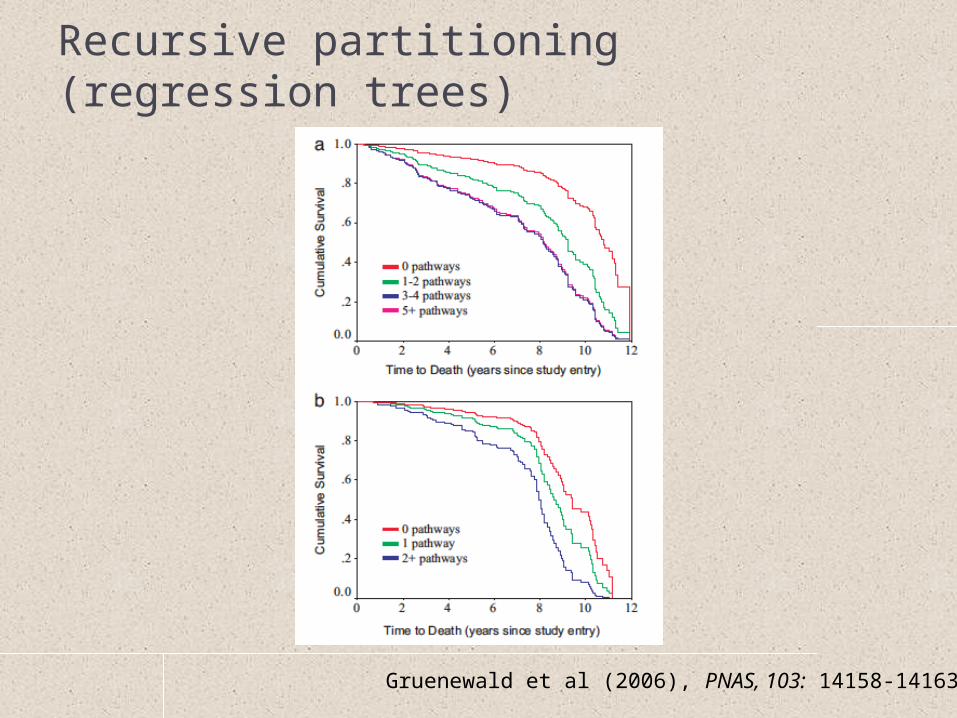
Recursive partitioning (regression trees)
Gruenewald et al (2006), PNAS, 103: 14158-14163

Allostatic load Advantages
Captures possible dysregulation across biological systems that are associated with stress and health outcomes
Better prediction of health than individual markers alone
Critiques Loss of information at opposite extremes Examinations of mediation have not been
supportive

Organizational model:psychosocial factors and physiological dysregulation
Social Status
Health Behaviors Psychosocial Processes
Neuroendocrine and autonomic regulatory
systems
Inflammatory proteins
Disease

General Conclusions Biological systems are designed to respond to
environmental demands Static and dynamic biomarker measures provide
different kinds of information Biological systems are designed to interact
Allostatic load assesses multi-system risk, but not multi-system interactions
Allostasis perspective Physiological dysregulation later in life may be the
price of survival earlier in life

Perspectives on biomarkers Why study them?
‘Canaries in the coal mine’ Biological systems are highly tuned to the
environment Even at the genetic level Lens on social processes
Biological systems inter-related Measurement of individual factors may be less informative
than measurement of their associations/combinations Biological systems are dynamic
Designed to “do” something Health may be more related to biological function than
levels of biomarkers