biology 9744/01 - home | the learning space sg
TRANSCRIPT

© RI 2018 Preliminary Examination 9744/01 [Turn over
RAFFLES INSTITUTION
2018 Year 6 Preliminary Examination Higher 2
BIOLOGY 9744/01
Paper 1 Multiple Choice 25th September 2018
1 hour
Additional Materials: Multiple Choice Answer Sheet READ THESE INSTRUCTIONS FIRST Write in soft pencil. Do not use staples, paper clips, highlighters, glue or correction fluid. Write your name and shade your Index Number on the Answer Sheet in the spaces provided unless this has been done for you. There are thirty questions in this paper. Answer all questions. For each question there are four possible answers A, B, C, and D. Choose the one you consider correct and record your choice in soft pencil on the separate Answer Sheet. Read the instructions on the Answer Sheet very carefully. Each correct answer will score one mark. A mark will not be deducted for a wrong answer. Any rough working should be done in this booklet. Calculators may be used. (Erase all mistakes completely. Do not bend or fold the OMR Answer Sheet).
This document consists of 21 printed pages.
Raffles Institution Internal Examination

2
© RI 2018 Preliminary Examination 9744/01
1.
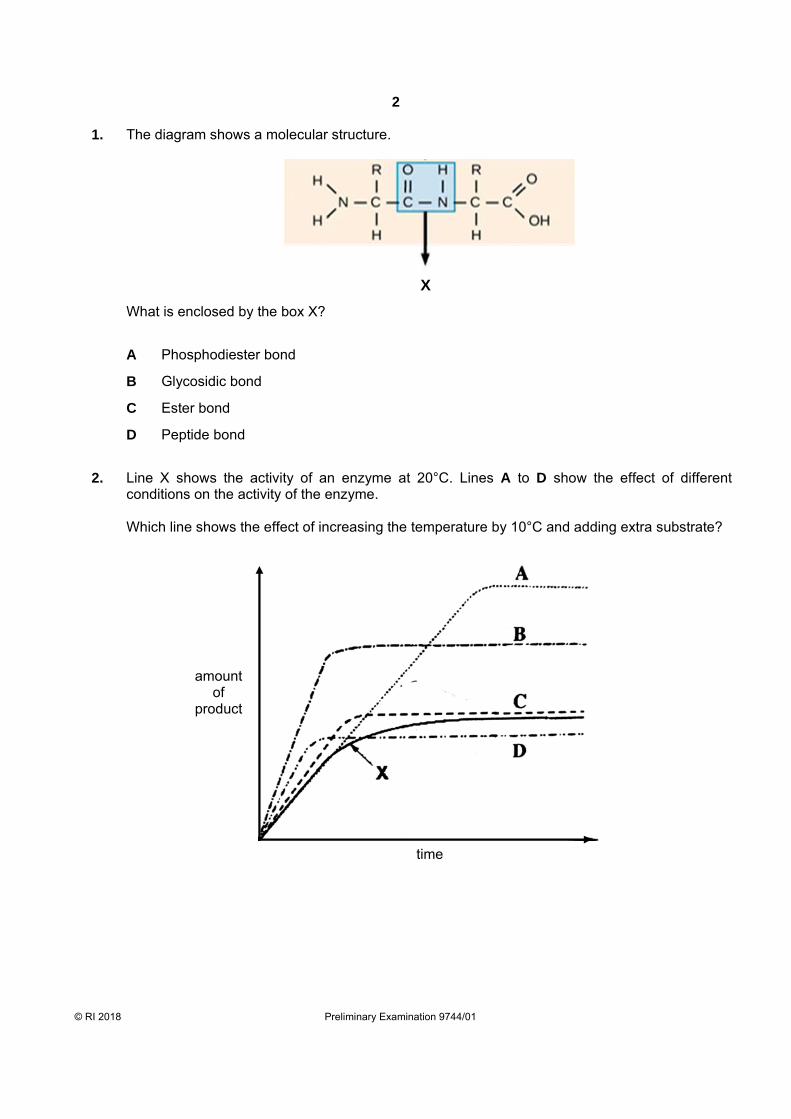
The diagram shows a molecular structure.
What is enclosed by the box X?
A Phosphodiester bond
B Glycosidic bond
C Ester bond
D Peptide bond
2.
Line X shows the activity of an enzyme at 20°C. Lines A to D show the effect of different conditions on the activity of the enzyme. Which line shows the effect of increasing the temperature by 10°C and adding extra substrate?
X
amount of
product
time

3
© RI 2018 Preliminary Examination 9744/01 [Turn over
3.
The electron micrograph shows part of an organelle in a cell.
What describes a function of the cisternae in the organelle shown?
A Moving protein to places where they are covered by phospholipid membranes for secretion outside the cell
B Producing proteins and covering them with phospholipid membranes for secretion outside the cell
C Producing proteins, covering them with phospholipid membranes and moving them for use inside the cell
D Producing ribosomes and proteins and storing them in phospholipid membranes for use inside the cell
4. Glycophorin, an integral membrane protein, has a single transmembrane α helix. Which of the
following plots most likely represents glycophorin?
A C
B D
4
© RI 2018 Preliminary Examination 9744/01
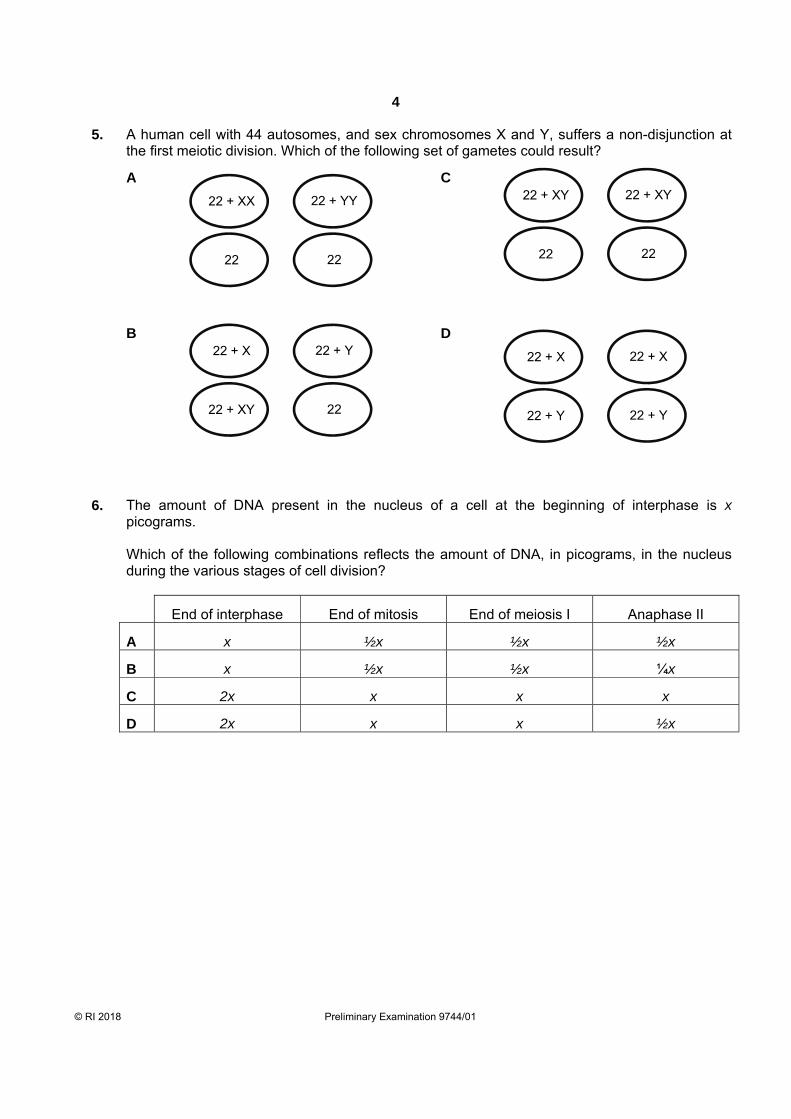
5. A human cell with 44 autosomes, and sex chromosomes X and Y, suffers a non-disjunction at the first meiotic division. Which of the following set of gametes could result?
A
C
B
D
6.
The amount of DNA present in the nucleus of a cell at the beginning of interphase is x picograms. Which of the following combinations reflects the amount of DNA, in picograms, in the nucleus during the various stages of cell division?
End of interphase End of mitosis End of meiosis I Anaphase II
A x ½x ½x ½x
B x ½x ½x ¼x
C 2x x x x
D 2x x x ½x
22 + XX
22
22 + YY
22
22 + XY
22
22 + XY
22
22 + X
22 + XY
22 + Y
22
22 + X
22 + Y
22 + X
22 + Y

5
© RI 2018 Preliminary Examination 9744/01 [Turn over
7.
The structures of purine and pyrimidine are shown below.
Which of the following correctly shows the number of carbon atoms in the corresponding nucleic acid?
Molecule Number of carbons in the molecule
A DNA strand with the sequence
ATCGAAA 33
B mRNA molecule with the sequence
AUCGAAA on 1 strand 30
C DNA molecule with the sequence
ATCGAAA on 1 strand 33
D DNA strand with the sequence
ATCGAAA 68
8.
The diagram below shows the process of translation in a prokaryotic cell.
Which of the following correctly identifies the bonds?
P Q Between R and S
A Peptide Phosphodiester Hydrogen
B Hydrogen Disulfide Phosphodiester
C Phosphodiester Peptide Hydrogen
D Hydrogen Hydrogen Peptide
Q

6
© RI 2018 Preliminary Examination 9744/01
9.
The active messenger RNAs (active mRNAs) in tissue cells can be isolated by passing the homogenised cell contents through a fractionating column. The column has short lengths of uracil nucleotides attached to a solid supporting material. Molecules of mRNA that can pass through the column are quickly broken up into small pieces and cannot be translated. The active mRNAs that attach to the column can be collected subsequently by an appropriate treatment. Which statements correctly describe active mRNA?
1 Active mRNAs are held to the fractionating column by bonds between adenine and uracil bases.
2 Active mRNAs can be released from the fractionating column by breaking hydrogen bonds.
3 Only mRNAs with polyadenine tailing can be translated.
4 Polyadenine tailing stabilises mRNA and prevents it from being broken up.
A 1 and 2
B 1, 2 and 3
C 3 and 4
D 1, 2, 3 and 4
10.
A hybrid phage was artificially created by removing the DNA from lambda phage and replacing it with DNA from T4 phage. This hybrid was allowed to infect a bacterium and reproduce. The progeny of the hybrid phage will have the characteristics of a ___________________.
A T4 phage
B lambda phage
C hybrid phage with T4 DNA and lambda proteins
D hybrid virus with lambda DNA and T4 protein

7
© RI 2018 Preliminary Examination 9744/01 [Turn over
11.
E. coli bacteria are grown in a culture of nutrients, which includes glucose and lactose as the main source of carbon-based nutrient. The following growth curve is obtained.
Which of the following corresponds correctly to the region specified on the growth curve of E. coli?
CAP activated High amounts of lac polycistronic mRNA
Repressor inactivated
A X only X and Y only Y and Z only
B Y only Y and Z only X, Y and Z
C Y and Z only Z only Y and Z only
D Y and Z only Y and Z only X, Y and Z
12. Which feature occurs in the life cycle of the influenza virus?
A Host cell DNA is destroyed by lytic enzymes.
B Viral genome is integrated into the host genome.
C Viral DNA acts as a template for DNA synthesis.
D Viruses enter the host cell by receptor-mediated endocytosis.
YLog cell number
Time

8
© RI 2018 Preliminary Examination 9744/01
13.
Which of the following statements describe possible ways by which viruses can cause disease in animals?
I They inhibit normal host cell DNA, RNA or protein synthesis in host cell.
II They disrupt and inactivate the tumour suppressor genes of the host cell causing uncontrolled cell division.
III They disrupt and inactivate the oncogenes of the host cell causing uncontrolled cell division.
IV Their viral proteins and glycoproteins on the surface membrane of host cells cause them to be recognised and destroyed by the body’s immune system.
V They deplete the host cell of cellular materials essential for metabolic functions.
A I, II and V
B I, II and IV
C II, III and V
D I, II, IV and V

9
© RI 2018 Preliminary Examination 9744/01 [Turn over
14.
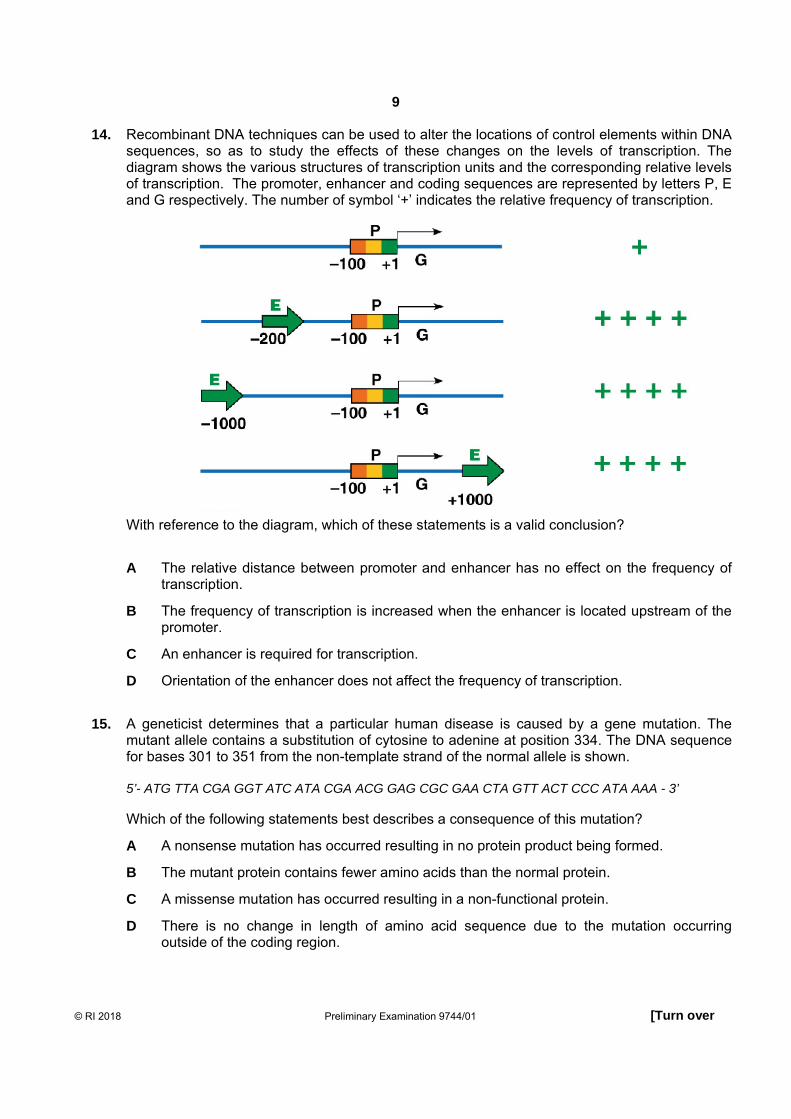
Recombinant DNA techniques can be used to alter the locations of control elements within DNA sequences, so as to study the effects of these changes on the levels of transcription. The diagram shows the various structures of transcription units and the corresponding relative levels of transcription. The promoter, enhancer and coding sequences are represented by letters P, E and G respectively. The number of symbol ‘+’ indicates the relative frequency of transcription.
With reference to the diagram, which of these statements is a valid conclusion?
A The relative distance between promoter and enhancer has no effect on the frequency of transcription.
B The frequency of transcription is increased when the enhancer is located upstream of the promoter.
C An enhancer is required for transcription.
D Orientation of the enhancer does not affect the frequency of transcription.
15.
A geneticist determines that a particular human disease is caused by a gene mutation. The mutant allele contains a substitution of cytosine to adenine at position 334. The DNA sequence for bases 301 to 351 from the non-template strand of the normal allele is shown. 5’- ATG TTA CGA GGT ATC ATA CGA ACG GAG CGC GAA CTA GTT ACT CCC ATA AAA - 3’ Which of the following statements best describes a consequence of this mutation?
A A nonsense mutation has occurred resulting in no protein product being formed.
B The mutant protein contains fewer amino acids than the normal protein.
C A missense mutation has occurred resulting in a non-functional protein.
D There is no change in length of amino acid sequence due to the mutation occurring outside of the coding region.

10
© RI 2018 Preliminary Examination 9744/01
16.
In 1882, the German botanist T.W. Engelmann performed an ingenious experiment to investigate the effects of different wavelengths of light on the rate of photosynthesis for a suspension of alga Spirogyra (a filamentous microorganism containing long, spiral chloroplasts). In his experiment, a prism was placed between the light source and the alga filament to produce and scatter all colours of the light across the alga filament evenly. Then, aerobic bacteria were added to the alga filament suspension. All the other variables were kept constant. After exposure to light for a certain period of time, the bacteria were found to move towards and accumulate at specific lengths along the alga filament as shown below.
Which of the following conclusion(s) can be drawn from the above experiment.
I The directional movement of the bacteria is due to oxygen released from Spirogyra.
II Green light is least absorbed, whereas red and blue wavelength of light is efficiently used for photosynthesis.
III NADPH is the reducing power that drives the formation of glyceraldehyde-3-phosphate.
A II only
B I and II only
C II and III only
D All of the above

11
© RI 2018 Preliminary Examination 9744/01 [Turn over
17.
The figure below shows an electron micrograph of an organelle.
Which of the following correctly matches the processes with the corresponding structures?
Formation of pyruvate
Oxidative phosphorylation
Direction of diffusion of H+ ions
Formation of reduced co-enzymes
A W X Z Y Z
B Z Y Z Y W and Z
C Z Y Y Z W
D W X Y Z W and Z
Y
Z X
W

12
© RI 2018 Preliminary Examination 9744/01
18.
The pedigree below shows the inheritance of Marfan syndrome which affects connective tissues in the body.
Individual X is homozygous at the loci for the disease gene. What is the genetic basis of inheritance of the disease?
A Autosomal dominant
B Autosomal recessive
C Sex-linked dominant
D Sex-linked recessive
X

13
© RI 2018 Preliminary Examination 9744/01 [Turn over
19.
Coat colour in mice is controlled by two genes, each with two alleles. The genes are on different chromosomes.
One gene controls pigment colour. The presence of allele A results in a yellow and black banding pattern on individual hairs, producing an overall grey appearance called agouti. Mice with the genotype aa do not make the yellow pigment and are, therefore, black.
The other gene determines whether any pigment is produced. The allele D is required for development of coat colour. Mice with the genotype dd produce no pigment and are called albino.
An albino mouse is mated with a black mouse to produce 12 albino mice, 7 agouti mice and 5 black mice.
A χ2 test was performed to test the significance of the difference between the observed and expected results.
distribution of χ2
number of degrees of freedom (v)
probability
0.1 0.05 0.01
1 2.71 3.84 6.64
2 4.60 5.99 9.21
3 6.25 7.82 11.34
4 7.78 9.49 13.28
Using the equation and the table of χ2 values, which of the following correctly describes the result
of the χ2 test?
number of
degrees of freedom (v) probability
significance of difference between observed and
expected results
A 2 < 0.05 significant
B 3 < 0.05 significant
C 2 > 0.05 not significant
D 3 > 0.05 not significant

14
© RI 2018 Preliminary Examination 9744/01
20.
Pure breeding plants of contrasting traits were cross fertilised and the seeds were planted in pots of soil containing equal proportion of fertiliser. The pots were then exposed to different light conditions for 60 days. Throughout the investigation, the plants were watered with equal amount of water, twice daily.
At the end of the investigation, the plants’ height, number of leaves, length of leaves and colour of leaves were measured and summarised in the table below.
No light Dim Light Bright light
Height/cm 10.3 ± 0.3 8.1± 0.5 6.6 ± 0.4
Length of leaves/cm 1.7 ± 0.3 1.7± 0.2 1.6± 0.1
Colour of leaves Yellow Pale green Dark green
Which of the following statement(s) cannot be explained by the data?
1 The additive effect of genes is responsible for the continuous variation observed in the height and length of leaves.
2 The genes involved in chlorophyll pigment synthesis are activated by light.
3 Leaf colour is controlled by a gene locus whereby heterozygotes have pale green leaves.
A 2 only
B 3 only
C 1 and 3 only
D 2 and 3 only
21. Totipotency is demonstrated when __________.
A cancer cells give rise to heterogeneous cell types
B a stem cell can differentiate into placental cells and all cells in an organism
C a hematopoietic stem cell differentiates into a lymphocyte
D an embryonic stem cell divides and differentiates

15
© RI 2018 Preliminary Examination 9744/01 [Turn over
22.
The diagram below shows the role of an endocrine tissue in controlling blood glucose concentration.
Which of the following statements are true?
1 Small amounts of hormone I and II inducing a large response in liver tissue demonstrates positive feedback.
2 Hormones I and II inducing different responses from the same target tissue is due to the hormones binding to different receptors on the liver cell surface membrane.
3 The binding of hormone I to receptors on liver cell surface membrane leads to the production of second messenger, cAMP.
4 Besides the liver, hormone I will also target muscle tissue to regulate blood glucose concentration.
A 1 and 2
B 2 and 3
C 3 and 4
D 2 and 4
Normal blood glucose concentration = 80-120 mg per 100cm3 blood
fall in blood glucose
concentration
rise in blood glucose
concentration
α cells β cells Endocrine tissue
Hormone I produced Hormone II produced
target tissue: liver target tissue: liver
release of glucose absorption of glucose
Normal blood glucose concentration = 80-120 mg per 100cm3 blood

16
© RI 2018 Preliminary Examination 9744/01
23. Which of the following statements is false about cell signalling involving tyrosine kinase receptors?
A Ligand molecules are mostly hydrophilic in nature.
B Different activated relay proteins serve to directly amplify the effects of the ligand.
C Dimerisation serves to initiate auto-phosphorylation.
D Receptors are transmembrane proteins that are anchored within the cell surface membrane.
24.
The different forms of natural selection can be distinguished according to their effect on the body size of the pink salmon (Onchorhynchus gorbuscha).
Which of the following describes the correct form of natural selection for each of the following sets of graphs?
Graphs I Graphs II Graphs III Graphs IV
A Disruptive selection Directional selection Stabilising selection No selection
B No selection Stabilising selection Directional selection Disruptive selection
C Directional selection Stabilising selection Disruptive selection No selection
D Directional selection Disruptive selection No selection Stabilising selection

17
© RI 2018 Preliminary Examination 9744/01 [Turn over
25.
Bacteria in the genus Wolbachia infect many butterfly species. They are passed from one generation to the next in eggs, but not in sperms, and they selectively kill developing male embryos. During the 1960s in Samoa, the proportion of male blue moon butterflies fell to less than 1% of the population. However, by 2006, the proportion of males was almost 50% of the population. Resistance to Wolbachia is the result of the dominant allele of a suppressor gene. Which statements correctly describe the evolution of resistance to Wolbachia in the blue moon butterfly population?
I Wolbachia acts as a selective agent.
II The selective killing of male embryos is an example of artificial selection.
III When infected with Wolbachia, male embryos that are homozygous for the recessive allele of the suppressor gene die.
IV All male embryos that carry the dominant allele of the suppressor gene pass that allele to their offspring.
V The frequency of the dominant allele of the suppressor gene rises in the butterfly population.
A I and IV
B II and III
C I, III and V
D II, IV and V

18
© RI 2018 Preliminary Examination 9744/01
26.
In the mid-1960s, DDT was widely used as an insecticide against mosquitoes. The sensitivity to insecticide in mosquitoes is determined by a single gene that has two alleles. allele 1 : resistant to DDT allele 2 : sensitive to DDT Over several years, genotypic frequencies were measured in a population of mosquito larvae. The graph below shows the results.
Analysis of the graph reveals that in the population, __________________________ .
A allele 1 confers a selective disadvantage in the absence of DDT.
B heterozygote advantage is demonstrated after DDT spraying is reduced.
C mutant allele 1 emerged as a result of the use of DDT in 1965.
D only one copy of allele 1 is required for resistant phenotype.
Percentage of
mosquitoes

19
© RI 2018 Preliminary Examination 9744/01 [Turn over
27.
The diagram below shows the structure of an antibody.
Which of the following correctly matches the events with the regions in which diversity is generated?
Somatic recombination Somatic hypermutation Class switching
A X X Z
B Y X Z
C Y Y Z
D Z X Y
XY
Z

20
© RI 2018 Preliminary Examination 9744/01
28. The diagram below shows the antibody production during a primary and a secondary immune response.
Which of the following statement(s) is/are correct?
I Class switching only occurs during the secondary immune response. II The secondary immune response is faster and stronger compared to the primary
immune response. III Class switching results in the production of antibodies with higher binding affinity
during the secondary immune response. IV Vaccination ‘primes’ the immune system such that a secondary immune response
can be mounted when the body encounters the actual pathogen.
A II only
B II and IV only
C I, II and IV only
D All of the above
29. Which of the following describes a positive feedback concerning climate change?
A Increased atmospheric temperature result in melting of sea ice which decreases the amount of sunlight reflected back into space.
B Increased burning of fossil fuels increases atmospheric CO2 concentration, enhancing the greenhouse effect.
C Melting of glaciers causes an increase in sea levels.
D Increase in atmospheric temperature causes many species to move towards increased altitudes to stay within their optimum temperature range.

21
© RI 2018 Preliminary Examination 9744/01 [Turn over
30.
The diagram below shows the distribution of confirmed cases of dengue fever from 1943 to 2013.
Which of the following explain the observed changes in distribution?
I Increased global human traffic. II Increased global temperatures allow mosquitoes to survive better at increased
latitudes. III Increased global temperatures allow mosquitoes carrying the dengue virus to move
northwards. IV Increased global temperatures increases the replication rate of the dengue virus in
mosquitoes. V Increased global temperatures reduces the replication rate of the dengue virus in
humans.
A II and V only
B II, III and IV only
C I, II and IV only
D All of the above
- End of Paper -

22
© RI 2018 Preliminary Examination 9744/01

© RI 2018 Preliminary Examination 9744/01 [Turn over
RAFFLES INSTITUTION
2018 Year 6 Preliminary Examination Higher 2
BIOLOGY 9744/01
Paper 1 Multiple Choice 25th September 2018
1 hour
Additional Materials: Multiple Choice Answer Sheet READ THESE INSTRUCTIONS FIRST Write in soft pencil. Do not use staples, paper clips, highlighters, glue or correction fluid. Write your name and shade your Index Number on the Answer Sheet in the spaces provided unless this has been done for you. There are thirty questions in this paper. Answer all questions. For each question there are four possible answers A, B, C, and D. Choose the one you consider correct and record your choice in soft pencil on the separate Answer Sheet. Read the instructions on the Answer Sheet very carefully. Each correct answer will score one mark. A mark will not be deducted for a wrong answer. Any rough working should be done in this booklet. Calculators may be used. (Erase all mistakes completely. Do not bend or fold the OMR Answer Sheet).
This document consists of 21 printed pages.
Raffles Institution Internal Examination
2
© RI 2018 Preliminary Examination 9744/01
1.
The diagram shows a molecular structure.
What is enclosed by the box X?
A Phosphodiester bond
B Glycosidic bond
C Ester bond
D Peptide bond
2.
Line X shows the activity of an enzyme at 20°C. Lines A to D show the effect of different conditions on the activity of the enzyme. Which line shows the effect of increasing the temperature by 10°C and adding extra substrate?
X
amount of
product
time

3
© RI 2018 Preliminary Examination 9744/01 [Turn over
3.
The electron micrograph shows part of an organelle in a cell.
What describes a function of the cisternae in the organelle shown?
A Moving protein to places where they are covered by phospholipid membranes for secretion outside the cell
B Producing proteins and covering them with phospholipid membranes for secretion outside the cell
C Producing proteins, covering them with phospholipid membranes and moving them for use inside the cell
D Producing ribosomes and proteins and storing them in phospholipid membranes for use inside the cell
4. Glycophorin, an integral membrane protein, has a single transmembrane α helix. Which of the
following plots most likely represents glycophorin?
A C
B D

4
© RI 2018 Preliminary Examination 9744/01
5. A human cell with 44 autosomes, and sex chromosomes X and Y, suffers a non-disjunction at the first meiotic division. Which of the following set of gametes could result?
A
C
B
D
6.
The amount of DNA present in the nucleus of a cell at the beginning of interphase is x picograms. Which of the following combinations reflects the amount of DNA, in picograms, in the nucleus during the various stages of cell division?
End of interphase End of mitosis End of meiosis I Anaphase II
A x ½x ½x ½x
B x ½x ½x ¼x
C 2x x x x
D 2x x x ½x
22 + XX
22
22 + YY
22
22 + XY
22
22 + XY
22
22 + X
22 + XY
22 + Y
22
22 + X
22 + Y
22 + X
22 + Y

5
© RI 2018 Preliminary Examination 9744/01 [Turn over
7.
The structures of purine and pyrimidine are shown below.
Which of the following correctly shows the number of carbon atoms in the corresponding nucleic acid?
Molecule Number of carbons in the molecule
A DNA strand with the sequence
ATCGAAA 33
B mRNA molecule with the sequence
AUCGAAA on 1 strand 30
C DNA molecule with the sequence
ATCGAAA on 1 strand 33
D DNA strand with the sequence
ATCGAAA 68
8.
The diagram below shows the process of translation in a prokaryotic cell.
Which of the following correctly identifies the bonds?
P Q Between R and S
A Peptide Phosphodiester Hydrogen
B Hydrogen Disulfide Phosphodiester
C Phosphodiester Peptide Hydrogen
D Hydrogen Hydrogen Peptide
Q
6
© RI 2018 Preliminary Examination 9744/01
9.
The active messenger RNAs (active mRNAs) in tissue cells can be isolated by passing the homogenised cell contents through a fractionating column. The column has short lengths of uracil nucleotides attached to a solid supporting material. Molecules of mRNA that can pass through the column are quickly broken up into small pieces and cannot be translated. The active mRNAs that attach to the column can be collected subsequently by an appropriate treatment. Which statements correctly describe active mRNA?
1 Active mRNAs are held to the fractionating column by bonds between adenine and uracil bases.
2 Active mRNAs can be released from the fractionating column by breaking hydrogen bonds.
3 Only mRNAs with polyadenine tailing can be translated.
4 Polyadenine tailing stabilises mRNA and prevents it from being broken up.
A 1 and 2
B 1, 2 and 3
C 3 and 4
D 1, 2, 3 and 4
10.
A hybrid phage was artificially created by removing the DNA from lambda phage and replacing it with DNA from T4 phage. This hybrid was allowed to infect a bacterium and reproduce. The progeny of the hybrid phage will have the characteristics of a ___________________.
A T4 phage
B lambda phage
C hybrid phage with T4 DNA and lambda proteins
D hybrid virus with lambda DNA and T4 protein

7
© RI 2018 Preliminary Examination 9744/01 [Turn over
11.
E. coli bacteria are grown in a culture of nutrients, which includes glucose and lactose as the main source of carbon-based nutrient. The following growth curve is obtained.
Which of the following corresponds correctly to the region specified on the growth curve of E. coli?
CAP activated High amounts of lac polycistronic mRNA
Repressor inactivated
A X only X and Y only Y and Z only
B Y only Y and Z only X, Y and Z
C Y and Z only Z only Y and Z only
D Y and Z only Y and Z only X, Y and Z
12. Which feature occurs in the life cycle of the influenza virus?
A Host cell DNA is destroyed by lytic enzymes.
B Viral genome is integrated into the host genome.
C Viral DNA acts as a template for DNA synthesis.
D Viruses enter the host cell by receptor-mediated endocytosis.
YLog cell number
Time

8
© RI 2018 Preliminary Examination 9744/01
13.
Which of the following statements describe possible ways by which viruses can cause disease in animals?
I They inhibit normal host cell DNA, RNA or protein synthesis in host cell.
II They disrupt and inactivate the tumour suppressor genes of the host cell causing uncontrolled cell division.
III They disrupt and inactivate the oncogenes of the host cell causing uncontrolled cell division.
IV Their viral proteins and glycoproteins on the surface membrane of host cells cause them to be recognised and destroyed by the body’s immune system.
V They deplete the host cell of cellular materials essential for metabolic functions.
A I, II and V
B I, II and IV
C II, III and V
D I, II, IV and V
9
© RI 2018 Preliminary Examination 9744/01 [Turn over
14.
Recombinant DNA techniques can be used to alter the locations of control elements within DNA sequences, so as to study the effects of these changes on the levels of transcription. The diagram shows the various structures of transcription units and the corresponding relative levels of transcription. The promoter, enhancer and coding sequences are represented by letters P, E and G respectively. The number of symbol ‘+’ indicates the relative frequency of transcription.
With reference to the diagram, which of these statements is a valid conclusion?
A The relative distance between promoter and enhancer has no effect on the frequency of transcription.
B The frequency of transcription is increased when the enhancer is located upstream of the promoter.
C An enhancer is required for transcription.
D Orientation of the enhancer does not affect the frequency of transcription.
15.
A geneticist determines that a particular human disease is caused by a gene mutation. The mutant allele contains a substitution of cytosine to adenine at position 334. The DNA sequence for bases 301 to 351 from the non-template strand of the normal allele is shown. 5’- ATG TTA CGA GGT ATC ATA CGA ACG GAG CGC GAA CTA GTT ACT CCC ATA AAA - 3’ Which of the following statements best describes a consequence of this mutation?
A A nonsense mutation has occurred resulting in no protein product being formed.
B The mutant protein contains fewer amino acids than the normal protein.
C A missense mutation has occurred resulting in a non-functional protein.
D There is no change in length of amino acid sequence due to the mutation occurring outside of the coding region.

10
© RI 2018 Preliminary Examination 9744/01
16.
In 1882, the German botanist T.W. Engelmann performed an ingenious experiment to investigate the effects of different wavelengths of light on the rate of photosynthesis for a suspension of alga Spirogyra (a filamentous microorganism containing long, spiral chloroplasts). In his experiment, a prism was placed between the light source and the alga filament to produce and scatter all colours of the light across the alga filament evenly. Then, aerobic bacteria were added to the alga filament suspension. All the other variables were kept constant. After exposure to light for a certain period of time, the bacteria were found to move towards and accumulate at specific lengths along the alga filament as shown below.
Which of the following conclusion(s) can be drawn from the above experiment.
I The directional movement of the bacteria is due to oxygen released from Spirogyra.
II Green light is least absorbed, whereas red and blue wavelength of light is efficiently used for photosynthesis.
III NADPH is the reducing power that drives the formation of glyceraldehyde-3-phosphate.
A II only
B I and II only
C II and III only
D All of the above

11
© RI 2018 Preliminary Examination 9744/01 [Turn over
17.
The figure below shows an electron micrograph of an organelle.
Which of the following correctly matches the processes with the corresponding structures?
Formation of pyruvate
Oxidative phosphorylation
Direction of diffusion of H+ ions
Formation of reduced co-enzymes
A W X Z Y Z
B Z Y Z Y W and Z
C Z Y Y Z W
D W X Y Z W and Z
Y
Z X
W

12
© RI 2018 Preliminary Examination 9744/01
18.
The pedigree below shows the inheritance of Marfan syndrome which affects connective tissues in the body.
Individual X is homozygous at the loci for the disease gene. What is the genetic basis of inheritance of the disease?
A Autosomal dominant
B Autosomal recessive
C Sex-linked dominant
D Sex-linked recessive
X

13
© RI 2018 Preliminary Examination 9744/01 [Turn over
19.
Coat colour in mice is controlled by two genes, each with two alleles. The genes are on different chromosomes.
One gene controls pigment colour. The presence of allele A results in a yellow and black banding pattern on individual hairs, producing an overall grey appearance called agouti. Mice with the genotype aa do not make the yellow pigment and are, therefore, black.
The other gene determines whether any pigment is produced. The allele D is required for development of coat colour. Mice with the genotype dd produce no pigment and are called albino.
An albino mouse is mated with a black mouse to produce 12 albino mice, 7 agouti mice and 5 black mice.
A χ2 test was performed to test the significance of the difference between the observed and expected results.
distribution of χ2
number of degrees of freedom (v)
probability
0.1 0.05 0.01
1 2.71 3.84 6.64
2 4.60 5.99 9.21
3 6.25 7.82 11.34
4 7.78 9.49 13.28
Using the equation and the table of χ2 values, which of the following correctly describes the result
of the χ2 test?
number of
degrees of freedom (v) probability
significance of difference between observed and
expected results
A 2 < 0.05 significant
B 3 < 0.05 significant
C 2 > 0.05 not significant
D 3 > 0.05 not significant

14
© RI 2018 Preliminary Examination 9744/01
20.
Pure breeding plants of contrasting traits were cross fertilised and the seeds were planted in pots of soil containing equal proportion of fertiliser. The pots were then exposed to different light conditions for 60 days. Throughout the investigation, the plants were watered with equal amount of water, twice daily.
At the end of the investigation, the plants’ height, number of leaves, length of leaves and colour of leaves were measured and summarised in the table below.
No light Dim Light Bright light
Height/cm 10.3 ± 0.3 8.1± 0.5 6.6 ± 0.4
Length of leaves/cm 1.7 ± 0.3 1.7± 0.2 1.6± 0.1
Colour of leaves Yellow Pale green Dark green
Which of the following statement(s) cannot be explained by the data?
1 The additive effect of genes is responsible for the continuous variation observed in the height and length of leaves.
2 The genes involved in chlorophyll pigment synthesis are activated by light.
3 Leaf colour is controlled by a gene locus whereby heterozygotes have pale green leaves.
A 2 only
B 3 only
C 1 and 3 only
D 2 and 3 only
21. Totipotency is demonstrated when __________.
A cancer cells give rise to heterogeneous cell types
B a stem cell can differentiate into placental cells and all cells in an organism
C a hematopoietic stem cell differentiates into a lymphocyte
D an embryonic stem cell divides and differentiates

15
© RI 2018 Preliminary Examination 9744/01 [Turn over
22.
The diagram below shows the role of an endocrine tissue in controlling blood glucose concentration.
Which of the following statements are true?
1 Small amounts of hormone I and II inducing a large response in liver tissue demonstrates positive feedback.
2 Hormones I and II inducing different responses from the same target tissue is due to the hormones binding to different receptors on the liver cell surface membrane.
3 The binding of hormone I to receptors on liver cell surface membrane leads to the production of second messenger, cAMP.
4 Besides the liver, hormone I will also target muscle tissue to regulate blood glucose concentration.
A 1 and 2
B 2 and 3
C 3 and 4
D 2 and 4
Normal blood glucose concentration = 80-120 mg per 100cm3 blood
fall in blood glucose
concentration
rise in blood glucose
concentration
α cells β cells Endocrine tissue
Hormone I produced Hormone II produced
target tissue: liver target tissue: liver
release of glucose absorption of glucose
Normal blood glucose concentration = 80-120 mg per 100cm3 blood

16
© RI 2018 Preliminary Examination 9744/01
23. Which of the following statements is false about cell signalling involving tyrosine kinase receptors?
A Ligand molecules are mostly hydrophilic in nature.
B Different activated relay proteins serve to directly amplify the effects of the ligand.
C Dimerisation serves to initiate auto-phosphorylation.
D Receptors are transmembrane proteins that are anchored within the cell surface membrane.
24.
The different forms of natural selection can be distinguished according to their effect on the body size of the pink salmon (Onchorhynchus gorbuscha).
Which of the following describes the correct form of natural selection for each of the following sets of graphs?
Graphs I Graphs II Graphs III Graphs IV
A Disruptive selection Directional selection Stabilising selection No selection
B No selection Stabilising selection Directional selection Disruptive selection
C Directional selection Stabilising selection Disruptive selection No selection
D Directional selection Disruptive selection No selection Stabilising selection

17
© RI 2018 Preliminary Examination 9744/01 [Turn over
25.
Bacteria in the genus Wolbachia infect many butterfly species. They are passed from one generation to the next in eggs, but not in sperms, and they selectively kill developing male embryos. During the 1960s in Samoa, the proportion of male blue moon butterflies fell to less than 1% of the population. However, by 2006, the proportion of males was almost 50% of the population. Resistance to Wolbachia is the result of the dominant allele of a suppressor gene. Which statements correctly describe the evolution of resistance to Wolbachia in the blue moon butterfly population?
I Wolbachia acts as a selective agent.
II The selective killing of male embryos is an example of artificial selection.
III When infected with Wolbachia, male embryos that are homozygous for the recessive allele of the suppressor gene die.
IV All male embryos that carry the dominant allele of the suppressor gene pass that allele to their offspring.
V The frequency of the dominant allele of the suppressor gene rises in the butterfly population.
A I and IV
B II and III
C I, III and V
D II, IV and V

18
© RI 2018 Preliminary Examination 9744/01
26.
In the mid-1960s, DDT was widely used as an insecticide against mosquitoes. The sensitivity to insecticide in mosquitoes is determined by a single gene that has two alleles. allele 1 : resistant to DDT allele 2 : sensitive to DDT Over several years, genotypic frequencies were measured in a population of mosquito larvae. The graph below shows the results.
Analysis of the graph reveals that in the population, __________________________ .
A allele 1 confers a selective disadvantage in the absence of DDT.
B heterozygote advantage is demonstrated after DDT spraying is reduced.
C mutant allele 1 emerged as a result of the use of DDT in 1965.
D only one copy of allele 1 is required for resistant phenotype.
Percentage of
mosquitoes

19
© RI 2018 Preliminary Examination 9744/01 [Turn over
27.
The diagram below shows the structure of an antibody.
Which of the following correctly matches the events with the regions in which diversity is generated?
Somatic recombination Somatic hypermutation Class switching
A X X Z
B Y X Z
C Y Y Z
D Z X Y
XY
Z

20
© RI 2018 Preliminary Examination 9744/01
28. The diagram below shows the antibody production during a primary and a secondary immune response.
Which of the following statement(s) is/are correct?
I Class switching only occurs during the secondary immune response. II The secondary immune response is faster and stronger compared to the primary
immune response. III Class switching results in the production of antibodies with higher binding affinity
during the secondary immune response. IV Vaccination ‘primes’ the immune system such that a secondary immune response
can be mounted when the body encounters the actual pathogen.
A II only
B II and IV only
C I, II and IV only
D All of the above
29. Which of the following describes a positive feedback concerning climate change?
A Increased atmospheric temperature result in melting of sea ice which decreases the amount of sunlight reflected back into space.
B Increased burning of fossil fuels increases atmospheric CO2 concentration, enhancing the greenhouse effect.
C Melting of glaciers causes an increase in sea levels.
D Increase in atmospheric temperature causes many species to move towards increased altitudes to stay within their optimum temperature range.

21
© RI 2018 Preliminary Examination 9744/01 [Turn over
30.
The diagram below shows the distribution of confirmed cases of dengue fever from 1943 to 2013.
Which of the following explain the observed changes in distribution?
I Increased global human traffic. II Increased global temperatures allow mosquitoes to survive better at increased
latitudes. III Increased global temperatures allow mosquitoes carrying the dengue virus to move
northwards. IV Increased global temperatures increases the replication rate of the dengue virus in
mosquitoes. V Increased global temperatures reduces the replication rate of the dengue virus in
humans.
A II and V only
B II, III and IV only
C I, II and IV only
D All of the above
- End of Paper -

22
© RI 2018 Preliminary Examination 9744/01
Answers:
1. D 7. D 13. D 19. C 25. C 2. B 8. C 14. A 20. C 26. A 3. A 9. D 15. C 21. B 27. A 4. D 10. A 16. B 22. B 28. B 5. C 11. D 17. D 23. B 29. A 6. C 12. D 18. A 24. C 30. C

© RI 2018 Preliminary Examination / H2 Biology
1. D 7. D 13. D 19. C 25. C 2. B 8. C 14. A 20. C 26. A 3. A 9. D 15. C 21. B 27. A 4. D 10. A 16. B 22. B 28. B 5. C 11. D 17. D 23. B 29. A 6. C 12. D 18. A 24. C 30. C
Paper 2 1 Fig. 1.1 shows the effect of low ATP on Phosphofructokinase (PFK) activity.
Fig. 1.1
(a) (i) On Fig. 1.1, draw a graph to show the effect of high ATP on PFK activity [1] (ii) Explain the graph you have drawn. [3] 1) High levels of ATP inhibits PFK activity by lowering its affinity for fructose 6-
phosphate. 2) ATP* acts as an allosteric inhibitor which binds to an allosteric site which inhibits the
PFK activity 3) [Vmax]: inhibition can be overcome by high substrate concentrations; 4) [idea of cooperativity] binding of substrate to 1 subunit changes conformation of
other subunits such that it becomes easier for substrate to bind;
(iii) Name 1 molecule that will act as allosteric activator of PFK activity.[1] AMP/ADP
R: fructose-6-phosphate (b) Fig. 1.2 shows a PFK molecule. (i) Describe the structure of PFK. [4] 1) PFK has a quaternary* structure made up of 4 polypeptide chains.
2) Each of which has primary structure which is unique number and sequence of amino acid in a polypeptide linked by peptide bonds.
3) Secondary, tertiary and quaternary structures are hence direct consequences of
Raffles Institution 2018 Preliminary Examination H2 Biology
Paper 1

2
© RI 2018 Preliminary Examination / H2 Biology
primary structure. 4) Secondary structure refers to regular coiling and folding/pleating of polypeptide held by
hydrogen bonds between CO and NH groups of polypeptide backbone. 5) Tertiary structure refers to a single polypeptide chain which is further folded into specific
3D conformation, held by bonds between R-groups within same polypeptide. 6) Tertiary structure is maintained by hydrophobic interaction, hydrogen bonds, ionic
bonds. 7) Overall conformation of PFK is maintained by its primary, secondary and tertiary
structure in addition to interaction among the 4 polypeptide chains. 8) Presence of active sites* complementary in shape and charge to substrate. 9) Presence of allosteric sites* complementary in shape and charge to activator/inhibitor. 10) PFK is globular/water-soluble, arranged so that most of its hydrophilic amino acid side
chains are o external surface of the protein while hydrophobic amino acid side chains are buried in interior.
(ii) Explain how a change in pH affect the PFK activity.[3] 1) Affects ionisation of R groups* of aa;
2) A change in pH will disrupt the ionic and hydrogen bond* that maintain the 3D conformation of active site of PFK; (A: mention of either one of the bonds)
3) which will result in a change in 3D conformation of active sites* (R: catalytic sites), no longer complementary in shape and charge to substrate / substrate cannot fit, hence;
4) less enzyme-substrate complex* formed hence reducing the PFK activity;
[Total : 12]2 (a) With reference to Fig. 2.1 and Table 2.1, (i) identify the type of molecule as well as the type of regulatory sequences studied in
the experiment.[3] Type of molecule Position Type of Regulatory
Sequence A Activator -2580 to -2400 Enhancer B Repressor -1350 to -1000 Silencer C RNA polymerase / General
transcription factor -30 to 0 Promoter
(ii) explain how you arrived at the identity of molecule B as well as the type of regulatory
sequence at -1350 to -1000. [2]
1. <correct set of data comparison + quote data> Wild type vs deletion construct 2 / deletion of -1350 to -1000, resulted in an increase of 282 a.u. in relative mRNA quantity. (A: deletion construct 2 resulted in increase in relative mRNA quantity of 550 a.u. compared to the wild-type construct of 268 a.u.).
2. Repressor* protein is unable to bind to silencer* sequence to lower transcriptional activity. (A: presence of -1350 to -1000 sequence allowed repressor* to bind to a silencer* sequence to downregulate transcription).
3. Thus, transcriptional initiation complex / RNA polymerase can assemble (more easily/readily) at promoter*, thus increasing frequency of transcription, which leads to more mRNA formed (marker’s note : increase rate of transcription).
Note to marker: pt 1 is compulsory
(b) The LCT mature mRNA excluding its poly-A tail is much shorter than the LCT gene. Account for this difference. [2]

3
© RI 2018 Preliminary Examination / H2 Biology
1. Due to non-coding sequences in gene such as introns*, which are removed during splicing* by the spliceosome. 2. The gene includes promoter* sequences which are not transcribed by the RNA polymerase. R: enhancer / silencer (not part of gene)
(c) With reference to the lac operon, describe one difference in the regulation of lactose
metabolism in bacteria and humans.[1]
Eukaryotes Bacteria Effect of promoter
Each gene* is controlled by a single promoter*;
Multiple related genes* are controlled by the same/single promoter* (operon system);
Regulatory sequences involved
Regulatory sequences e.g. enhancer* and silencer* that involved in controlling frequency of transcription initiation may be distal;
Regulatory sequences, e.g. the operator* that involved in control of transcription is proximal to the genes under its control;
(d) (i) Complete the graph by showing the concentration of bacteria in culture over time from
W to Z. [1]
Fig 2.2
WX-Increase, platuea, increase A: exponential increase
Using your knowledge of the lac operon, explain the shape of the graph for lactose from (ii) Time W to X [2]
1. Glucose present thus, low cAMP* levels; 2. Catabolite Activator Protein* (CAP) not activated, hence no CAP binding to
CAP binding site in promoter and thus no up regulation of transcription of lac operon;
3. Beta-galactosidase* not expressed to break down lactose, hence lactose amount maintained; OR
Permease* not expressed for lactose uptake, thus lactose level remains

4
© RI 2018 Preliminary Examination / H2 Biology
unchanged;
(ii) Time Y to Z [4]
1. Lactose is converted to allolactose* which acts as an inducer*, binds to repressor*, repressor is inactivated;
2. As binding causes a change in conformation such that repressor no longer binds to the operator*,
3. RNA polymerase can bind promoter* and initiate transcription* of the structural genes(Lac Z,Y and A) to take place.
4. In absence of glucose, high cAMP* levels 5. result in cAMP-Catabolite Activator Protein* (CAP) complex which attaches to CAP-
binding site on promoter strengthening affinity of RNA polymerase for promoter upregulation of transcription of the lac operon
6. Beta-galactosidase* expressed in high amounts to break down lactose, hence lactose amount drops;
OR Permease* expressed in high amounts for lactose uptake, thus lactose level remains drops;
[Total : 15]3 (a) Discuss the role of centromere in the production of gametes. [3] 1. They allow (proteins called kinetochore proteins, and subsequently) spindle fibres, to
attach; (MUST HAVE) 2. resulting in proper alignment of bivalents on equator in metaphase I/meiosis I; 3. so that homologous chromosomes can be equally separated to opposite poles during
anaphase I/meiosis I; 4. resulting in proper alignment of chromosome singly in on equator in metaphase
II/meiosis II; 5. so that sister chromatids / daughter chromosome can be equally separated to opposite
poles during anaphase II/meiosis II; Note : point 1 is compulsory and from points 2-5 any two. Without point 1, maximum marks that can be obtained is 2.
(b) The graph in Fig 3.1 shows the length of the spindle fibres during meiosis.
(i) In which regions of the graph did the centromeres detach from the spindle fibres. [1] D and H (ii) Which region on the graph corresponds to the stage shown in the Fig 3.2. [1]
F (iii) Name and identify the 2 corresponding stages on the graph in Fig 3.1 that
contributes to genetic variation in gametes, and explain how they bring about genetic variation. [6]
Stage :
1. Prophase I, A 2. Crossing over* of segments of non-sister chromatids of homologous
chromosomes* at prophase I of meiosis I. 3. This leads to new combinations of alleles on chromosomes of gametes.
Stage : 4. Metaphase I, B

5
© RI 2018 Preliminary Examination / H2 Biology
5. Independent assortment* of homologous chromosomes* occurs where arrangement of one pair of homologues at metaphase plate is independent of the arrangement of the other pairs of homologues;
6. This results in different combinations of maternal and paternal chromosomes in daughter cells;
7. there are 2n possible combinations of gametes where n is number of homologous pairs. / 223 possible combinations of gametes in human ;
A: Metaphase II, F; only if answer clearly makes ref to; random arrangement of /independent orientation of non-identical sister chromatids* (R;chromosome) of each chromosome at the metaphase plate & their subsequent separation during metaphase II and anaphase II respectively
(c) (i) What is the mode of inheritance of the disease WAS? [1] Sex-linked recessive ;
(ii) Use suitable symbols to represent the alleles of the gene controlling the disease WAS
[1] XW
: Dominant allele that codes for no WAS on X chromosome Xw
: recessive allele that codes for disease WAS on X chromosome; Must show both alleles Must have X chromosome on symbol
(iii) Use a genetic diagram to explain the results of couple 2. [4] 1. [1] parental phenotype and genotype;
P phenotype: wavy-hair female WAS sufferer x wavy-hair normal male ; P genotype: XwXwHSH x XWYHSHC Gametes (n): XwHS XwHC x XWHS YHS XWHC YHC
2. [1] all correct gametes (circled) in P and punnet square
Male gamete
XWHS
YHS
XWHC
YHC
Female gamete
XdHS XWXwHSHS
Normal Straight hair female
XwYHSHS
WAS sufferer,
straight hair male
XWXdHSHC
Normal wavy hair female
XwYHSHC
WAS sufferer, wavy hair male
XdHC
XWXwHSHC Normal wavy hair
female
XwYHSHC WAS
sufferer, wavy hair
male
XWXdHCHC
Normal curly hair female
XwYHCHC WAS sufferer, curly hair male
3. [1] Punnett square with correct genotypes and related phenotypes offspring genotypic ratio
XWXdHSHS
XWXwHSHC
XWXwHCHC
XwYHSHS
XwYHSHC XwY
HCHC
offspring phenotypic
Normal Straight
Normal wavy
Normal curly hair
WAS sufferer,
WAS sufferer,
WAS sufferer,

6
© RI 2018 Preliminary Examination / H2 Biology
ratio hair female
hair female
female straight hair male
wavy hair male
curly hair male
1 2 1 1 2 1 4. [1] Correct offspring genotypic and phenotypic ratio
[Total : 17]4 (a) (i) With reference to Fig. 4.1, state the best conditions for the growth of cucumber.[1] 0.13% carbon dioxide, 30ºC, above 5 arbitrary units of light; (ii) Define the term limiting factor.[1] 1. when a chemical process is affected by more than one factor, its rate is limited by
that factor which is nearest its minimum value; 2. It is that limiting factor which directly affects a process if its magnitude is changed;
AVP
(iii) With reference to Fig. 4.1, explain reasons for the difference between curves B and C. [3]
1. Curve B reaches a plateau at rate of photosynthesis of 95 mm3cm-2h-1 at lower light intensity of 3 units, whereas Curve C reaches a higher maximal rate of photosynthesis of 210 mm3cm-2h-1 at higher light intensity of 5 units; (idea of : max rate being different, with values)
2. due to presence of higher CO2 concentration at 0.13 (graph C); OR 3. Curve B: reaches max rate at light intensity of 3 units, while Curve C reaches max
rate at light intensity of 5 unit 4. light intensity is no longer a limiting factor as any further increase in light intensity
does not affect rate of photosynthesis. Hence, CO2 concentration becomes limiting;
(max 2 from 1 and 2 or 3 and 4) 5. Plant C achieve higher rates of photosynthesis as compared to B, because higher
CO2 / substrate concentration during carbon fixation* in Calvin cycle.
6. results in higher frequency of effective collision* with enzyme Rubisco (and RuBP), thus more enzyme-substrate complexes* being formed;
(b) With reference to Fig. 4.2, (i) explain why most plants are characteristically green, and [2] 1. Percentage of green light absorbed by (all 3 pigments – marker discretion) is very low at
less than 5%; 2. Green light is reflected / transmitted; For reference: Blue ~ 490–450 nm, red ~ 635-700 nm
(ii) explain the shape of the action spectrum. [3]

7
© RI 2018 Preliminary Examination / H2 Biology
1. Peak(s) of action spectrum/ highest rate of photosynthesis, correspond to absorption peak(s) (Idea of :action spectrum = sum of absorption of all pigments);
2. Light absorbed by different photosynthetic pigments is used for photoactivation/ photosynthesis
3. thus higher percentage of light absorption leads to higher rate of photosynthesis in red and blue light; (idea of : chl a peak corresponding to action spectrum peak)
4. carotenoids / chl b absorbed at blue and red light, broadening the range of wavelength that can be used for photosynthesis
5. Region between 500 to 600 nm (R: green) is not an exact match between absorption and action spectra due to role of other accessory pigments;
(c) In conducting experiments to obtain the action spectrum for photosynthesis, explain why
use of organic solvents such as acetone or ether is necessary to extract photosynthetic pigments. [2]
1. Chlorophyll pigments are membrane-bound (A: thylakoid and chloroplast membranes);
2. Only organic solvents can dissolve the membrane, that is composed of a phospholipid bilayer;
[Total: 11]5 (a) Name the method of gene transfer seen in Fig. 5.1 and describe it briefly. [4] 1. Conjugation*;
2. Sex pilus* of F+ bacterial cell makes contact with a F- cell ; 3. and retracts / contract to bring the F- cell closer so a mating bridge* is formed between
the 2 cells; (R: shorten) 4. One of the 2 strands of plasmid DNA in F+ cell is nicked and transferred from F+ cell to
the F- cell through mating bridge (via rolling circle mechanism); 5. as the other DNA strand is used as a template for elongation of nicked strand; 6. The single strand F plasmid DNA circularizes in F- cell and is used as a template* to
synthesise a complementary strand; 7. for a double-stranded F plasmid DNA resulting in F+ cell;
(b) After several hours of incubation, the cells were transferred to minimal medium (without
methionine and threonine). Predict and explain if any bacterial growth would be observed.[2]
1. No growth;
2. Filter prevent physical contact between the 2 strains and did not allow for conjugation / did not allow for sex pili from F+ cell to come into contact with F- cell
(c) (i) Predict if the bacterial progeny from this tube can survive in minimal medium without
additional of methionine and threonine.[2] 1. Progeny can survive in minimum medium;
2. DNA enclosed inside cell / mating bridge / not exposed to surrounded, and hence not degraded by nuclease;
3. Conjugation occurred, allowing genes coding for enzymes involved in metabolism of met and threo to be tranfered between the 2 bacteria.
R: reference to nuclease needed to nick the F plasmid for conjugation.

8
© RI 2018 Preliminary Examination / H2 Biology
(ii) State the purpose of setting up this tube.[1] To exclude transformation* as a possible method of gene transfer (d) (i) With reference to Fig. 5.3, determine if strain A or Strain B is the F+ cell.[1] Strain B (ii) In cases of gene transfer shown in Fig. 5.3, the F plasmid-bacterial chromosome is
usually not transferred completely to the recipient cell. Random breakage interrupts the process. The recipient cell is unable to go on to donate any genes to other cells. With reference to Fig. 5.3, suggest if the recipient cell is considered an F+ or and F- cell after the transfer. Explain your answer.[2]
1. F-;
2. F factor is not transferred, so the cell is unable to synthesise sex pili to initiate conjugation; (A: incomplete F plasmid transferred)
[Total: 12] 6 (a) Describe two changes to the bones in the feet of horses that have taken place over the
past 50 million years. [2] 1. Bones became larger/longer/thicker;
2. Number of bones became fewer/idea of fewer toes or bones fused; 3. Fewer bones touched ground/lower surface area in contact with the ground;
Accept any other valid observable changes (b) (i) Explain one advantage to Eohippus of the arrangement of bones in its feet. [1] With a larger surface area (how arrangement of bones confer advantage) in contact with
the ground, it can distribute its weight and not sink into the soft mud/ can escape predators (advantage);
(ii) Based on the information given, explain how the changes in the arrangement of the
foot bones of horses support Darwin’s theory of evolution by natural selection. [4] Descent from a common ancestor
1. It shows descent with modification from a common ancestor, as basic underlying homologous foot structure was modified over time;
With modification 2. There was variation in size/number/arrangement of foot bones in population; (context
specific) 3. Environment changed from swampy to hard and firm ground; (envt change, quote) 4. They faced selection pressure of predation*; (idea of selection pressure, quoting
predation) R: if selection pressure is vague like “environment” or wrong like “hard/soft ground”
5. Natural selection selected for individuals who had larger/fewer foot bones as they are; (selected traits)
6. Able to run faster on firm ground to avoid predation; (suggest why trait is an advantage) Pt 5 must be correct first.
7. Those who survive*, are able to reproduce and pass on their alleles for larger/fewer bones to the next generation;

9
© RI 2018 Preliminary Examination / H2 Biology
(c) (i) Fossils of Eohippus, Mesohippus and Merychippus have been unearthed only in the North American continent. Explain how the biogeographical distribution of these fossils support Darwin’s theory of evolution. [3]
Accounting for their geographical distribution and common ancestry: 1. Their close geographical proximity to each other suggest that the 3 extinct horses
descended from a common ancestor* that originated in North America/same continent*; (idea of center of origin of common ancestor)
2. Ancestral population dispersed and spread outwards from center of origin and colonized various habitats but confined by the oceans surrounding North American continent; accept idea of discontinuous distribution; (Distribution: all extinct horse species are only found in N America and nowhere else)
Accounting for descent with modification 3. Occupying different niches/environments, with natural selection, they evolve over time
to give rise to different species; (Speciation from common ancestor) 4. Their fossils/structural foot bone changes demonstrate descent with modification as it
changes over time; (descent with modification); (ii) Explain how scientists created the phylogram in Fig. 6.2? [2] 1. They studied DNA sequences of a homologous gene e.g. cytochrome C found in all the
organisms; 2. Through sequence alignment and comparing difference in nucleotides, they can work
out relationship between organisms; R: genotype, analyse 3. The fewer nucleotide differences, the more closely related the species and therefore
they share a more recent the common ancestor/branch point more recent in time; 4. Carbon dating of fossils will tell how long ago an extinct species existed so that you can
place them along a timeline; 5. Changes in nucleotide sequence accumulate over time with clockwork regularity. We
can thus estimate the timeline of speciation events; [Total :12]
7 (a) With reference to the steps in Fig 7.1, identify the steps and explain the processes that kills
the pathogenic bacteria.[2]
1. Step 4 - Fusion of phagosome with lysosome* forming phagolysosome; 2. Step 5 – Lysosomal / hydrolytic / digestive enzymes digest pathogen into harmless
substance/cuts up antigens into short peptides; Thus bacteria is unable to further infect the host;
(b) Describe how the humoral immune response enhances the action of the macrophage on
the pathogenic bacteria.[3]
1. Plasma cells produce antibodies/immunoglobulins; 2. Agglutination*, where antibodies clumps bacteria to promote phagocytosis* by
macrophages; 3. Opsonisation*, where antibodies tag pathogen to promote phagocytosis* by
macrophages; 4. Fab region of antibody/immunoglobulins binds to antigens on pathogen; 5. Fc region binds to Fc receptor on phagocytes to promote phagocytosis; (max 3 marks)
(c) Explain how Mycobacterium tuberculosis protects itself from the host immune system.[2]
1. M. tuberculosis has cell walls that contain mycolic acids*; (KIV if MUST HAVE) 2. Protects bacterium from acids / digestive enzymes / lysosomal enzymes / reactive

10
© RI 2018 Preliminary Examination / H2 Biology
oxygen species produced by lysosome; 3. inhibit the fusion of the phagosome with lysosomes, hence no phagolysosome is
formed and no lysosomal enzymes are available to kill the bacteria; (max 2 marks)
(d) With reference to Fig 7.2, explain how rifampin acts to achieve bactericidal effects on
Mycobacterium tuberculosis.[3] 1. Rifampin is a competitive inhibitor of RNA polymerase;
2. Structure of rifampin is complementary in shape/conformation to active site of RNA polymerase;
3. Blocks active site*, prevents binding of free ribonucleotides / DNA template/promoter. 4. prevents transcription* of bacterial genes hence no mRNA produced; (R; transcription
of mRNA) 5. Prevent expression of essential/housekeeping genes / no proteins produced;
[Total:10 ] 8 (a) With reference to Fig. 8.1, suggest why the sea ice extent in March is different from that in
September.[1] Ice extent was higher in March than Sept, as March is during winter/colder months where
sea ice forms/less melting and Sept occurs during summer/warmer months where more ice have melted. Temperature (hot/cold) / season difference (winter/summer) between March and September More melting / more freezing difference in sea ice extent
(b) (i) Identify X shown in Fig. 8.2. [1] X: duration of sea ice melt; (ii) Describe how X changes from 1979 to 2015. [1]
1. X increased by about a month from 1979 to 2015 2. Sea ice melt season is starting earlier and ending later , melt season spanning from
mid june to mid sept in 1979, to late may to late sept in 2015; (iii) Explain how this is linked to the changes in sea ice extent as shown in Fig. 8.1 and
Fig. 8.3. [3] Fig 8.1
1. Longer sea ice melt season results in more ice melting, [E] 2. lowering minimum sea ice extent observed in September (/min); [O] 3. less time is available for formation of sea ice in winter months; [E] 4. decrease in maximum sea ice extent seen in March (/max) [O] Fig. 8.3 5. Longer duration of sea ice melt resulted in less ice remaining frozen past melt season;
[E] 6. As seen in decrease in the amount / proportion of multi-year old ice / decrease in extent of sea ice over all ages; [O] 7. Which implies thinning of ice cover over the years; Mark allocation: Max 2 for each Fig Max 2 for Obs across Fig

11
© RI 2018 Preliminary Examination / H2 Biology
(c) (i) State the class of receptors that melanopsin belongs to.[1] G-protein coupled receptor; (ii) With reference to Fig. 8.5, describe how phosholipase C could become activated.[3] 1. Light causes a conformational change in the cytoplasmic domain of melanopsin;
2. Allowing melanopsin to bind to an inactive G protein; 3. Causing exchange of its bound GDP for a GTP, activating G protein; 4. Activated G protein moves along cytoplasmic side of membrane; 5. To bind to and activate phospholipase C;
[Total : 15]

12
© RI 2018 Preliminary Examination / H2 Biology
Paper 3 Section A 1 (a) Show how a lactose molecule is hydrolysed into its monomers in the space provided below.
[2]
1. Shown* and labelled lactose structure hydrolysed to form correct structure of
monomers; 2. Shows how water is involved in hydrolysis;
[A: if carbon not drawn] (b) Compare the structures labelled A and B in Fig. 1.2. [3] 1. A= alpha helix and B=beta pleated sheet
Similarities 2. Both maintained by hydrogen bonds* between NH and CO* of polypeptide
backbone*; 3. Both consist of amino acids* joined together with peptide bonds*; Differences 4. A is helical in shape whereas B comprised of flat sheet which becomes folded (R:
pleated sheet does not describe); 5. A is formed within a single region of polypeptide whereas B may be formed between
different regions of same polypeptide 6. In A, hydrogen bonds are formed between O and CO group of one amino acid and H of
NH group of another, 4 amino acids away, but in B, hydrogen bonds are formed between CO group of 1 region and NH gp of an adjacent region
[For full marks, must have 1 similarity + 1 difference] (c) (i) Explain a similarity and a difference in structure between the fungus lactase and the
human lactase. [4] Similarity [2]
1. Active sites* of both fungal and human lactase have similar 3D conformation and are complementary* in shape and charge to lactose;
2. So as to allow for hydrolysis of glycosidic bonds* in lactose; Difference [2]
3. Consists of different structural amino acids in polypetide of fungal and human lactase (A: primary structure in place of amino acids);
4. Both have different 3D conformation due to having different bonds, e.g. ionic / hydrogen bonds;
5. Hence they have different optimum pH because the bonds are stable at different pH;
(ii) Explain why the fungal lactase will only work in the stomach but not in the small intestine. [3]
1. Stomach has an pH of acidic around 2, which is within pH range of fungal lactase; Or Small intestine has an alkaline environment, which is out of pH range of fungus lactase;
13
© RI 2018 Preliminary Examination / H2 Biology
2. Deviation from optimum pH, results in lowering of rate of reaction as excess [H+] or [OH-] ions may affect ionisation of R-groups of amino acids;
3. Results in change in specific 3D conformation/shape of enzyme’s active site or results in causing enzyme to be denatured*;
(d) (i) With reference to Fig. 1.3, discuss the effectiveness of lactase treatment in reducing
the symptoms of lactose intolerance. [3] 1. Lactase treatment was effective in decreasing amount of H2 in breath test;
2. Compare placebo and lactase-treatment, e.g. steep/sharp vs gradual/slight increase, highest vs lowest amount;
3. Little / slight difference between high dosage and low dosage of lactase; 4. + data quoted to support points 2 and 3, e.g. max value, difference in H2 amount
etc; (ii) Explain the shape of the graph for the group given placebo. [2] 1. From 0 to 3 hours: sharp / steep* increase in amount of H2 produced from 0 to 56
ppm ; (shape and paired values required) 2. Due to lack of lactase resulting in large amount of lactose reaching large intestine,
hence high rate of lactose fermentation; 3. At 3 hours, max reached at 56 ppm / from 3 to 6h, decrease slightly / gradually*
to 53 ppm; (shape and paired values required) R: plateau 4. Since no more H2 produced as all lactose was used up in fermentation; Must have 2 or 4 to get max 2
(iii) Draw on the graph in Fig. 1.3, the results obtained from this participant’s test. [1] 0 to 3 hours: start at higher +
3 to 6 hours: follows trend of lactase or plateau (R: gradual increase that follows placebo);
(e) Describe a mechanism that accounts for this age-dependent lactase regulation during
adulthood. [2] 1. DNA methylation / histone deacetylation / chromatin remodelling complex,
condensation of DNA / chromatin; 2. Prevents access of transcription factors and RNA polymerase / transciption initation
factors to promoter, decrease frequency of transctiption; R: repressors binding to silencers since this is not long-term control of gene expression
(f) (i) State the mode of inheritance of lactase persistence. [1] Autosomal dominant; (ii) Explain how you arrived at your answer in (f)(i). [4] Dominant
1. **Individual II5 and II6 are both LP. However, some of their children, II5 and III7 are non-LP; (must clearly state the individuals and their phenotype)
2. Shows that II5 and II6 are heterozygous where non LP allele is masked by presence of LP allele;
3. If it is recessive, then all their children will have LP; Autosomal 4. **Father with LP (II6) produce daughter who is non LP (III5); (must clearly state
the individuals and their phenotype) 5. III5 inherited X chromosome from II6 but is non LP. Therefore LP allele is not
found on X chromosome; Or If it sex-linked and dominant, father with LP would produce daughters that are all LP;

14
© RI 2018 Preliminary Examination / H2 Biology
(g) Fig. 1.5 shows a gel with the results of the RFLP analysis for an individual who is homozygous for the T allele. Draw on Fig. 1.5 to show the results of the banding patterns of individuals II 5 and III 1 from Fig. 1.4. [2]
Answer:
2 Fig. 2.1 shows the principle of ELISA. (a) Explain how the structure of the patient’s Ig enables its binding to the NS-1 that coats the
wells of the polystyrene plates. [2] 1. Each Ig contains 2 antigen binding site*;
2. Complementary in shape and charge to antigen/epitope of NS-1; (b) With reference to Fig. 2.1 and using your knowledge of enzymes, explain how the process
of ELISA allows quantification of the concentration of human Ig against NS-1. [3] 1. As concentration of human Ig against NS-1 bound to NS-1 on the well increases;
2. concentration of secondary antibody tagged with enzyme increases; 3. Increase in enzyme concentration results in increase frequency of effective
collision/enzyme substrate complex formation/results in increase in rate of reaction between chromogen and active site of enzyme;
4. Increase in intensity of blue product formed within fixed time (idea: rate), which is detected using a spectrophotometer;
(c) (i) Describe one characteristic of primers used and how it facilitates qPCR. [2] 1. Single-stranded;
2. Complementary to 3’ end viral RNA sequence so that they can anneal to viral RNA; 3. Contain a free 3’OH end so that 4. Taq polymerase can extend the DNA/synthesize complementary DNA strand/form phosphodiester bonds between adjacent deoxyribonucelotides;
(ii) Suggest how SYBR® green interacts with the PCR products. [1] 1. Sybr green intercalates/bind itself in space between the base pairs;
Reject reference to formation of hydrogen bonds with nitrogenous bases/complementary base pairs.
2. Structure of Sybr green is complementary in shape to grooves of eg: DNA-RNA hybrid;
(d) (i) Explain the purpose of including the control with no RNA. [1] 1. This is a negative control to show base line fluorescence level if there is no
amplification of viral RNA/PCR product formed; AVP; ORA;
(ii) If a typical qPCR cycle takes 3 minutes, calculate the minimum time taken to report a positive result.
Minimum time taken is …………………… [2] 1. 3 min x 10/11 cycles; (Ans must show working and number of cycles needed)
2. 30/33 minutes;
15
© RI 2018 Preliminary Examination / H2 Biology
(iii) Suggest why qPCR is a better test compared to ELISA. [2] 1. Allowing earlier detection of dengue infection;
2. Viral RNA is immediately present in infected patient whereas it take some time before Ig is produced;
3. Faster than ELISA; 4. with reference to 30 min vs 3 hour; 5. AVP
(e) (i) describe and explain the temperature trends in Singapore from 1974 to 2017, [2] 1. Annual temperatures increased from 26.0°C in 1974 to 27.7°C in 2017 (A: +/-
0.1°C); 2. Globally, industrialisation / burning of fossil fuels for electricity/ deforestation led
to increased release of CO2; 3. Increased greenhouse gas emissions (GHG) led to increased trapping of
radiation/heat causing temperatures to rise; (R: radiation reflected from/to earth) (ii) explain the impact of climate change on transmission of dengue in Singapore. [2] 1. Global warming results in higher temperatures, thus conditions become more
suited for survival of mosquitoes / shortens the mosquito’s life cycle ; 2. Transmission of dengue virus (DENV) will increase if mosquito vector, Aedes
aegypti, that transmits dengue is present / increases as the virus reproduces within the mosquito ;
3. Faster replication of dengue virus in the mosquito; (ref: shorter incubation period in mosquito)
(iii) With reference to Fig. 2.4a and 2.4b, and the information given above, comment on the aspect of climate which has a greater influence on dengue transmission in Singapore. [2]
1. Temperature has greater influence over dengue transmission; 2. During June to October, dengue infections were high, which correlates with higher
temperatures May to Oct, where as rainfall was low/moderate in those months. (f) (i) Given the above information, explain how nuclear division may be affected. [2] 1. Paternal chromosomes did not condense during prophase*;
2. Mitosis is arrested, and thus unable to produce daughter cells; 3. Chromosomes are unable to align singly at the metaphase plate during
metaphase*; 4. Non-disjunction occurs / sister chromatids of paternal chromosome are unable to
separate during anaphase*; 5. Paternal chromosomes may get entangled during anaphase*, and thus resulting
in DNA damage; R: meiosis, and cannot form gametes.
(ii) Given the above information, justify Singapore’s choice to adopt the release of only Wolbachia-infected males. [2]
1. Male mosquitoes do not bite, whereas release of female mosquitoes will increase mosquito bites;
2. It helps to bring down mosquito population, as the cross of infected male with wild type does not result in new mosquito offsprings;
3. Conversely a cross with infected female mosquitoes will still result in propagation of mosquitoes albeit they are unable to transmit dengue;
4. Idea of unable to control mosquito population if there is undesirable outcome eg: ecological damage;
5. AVP; R: prevents the transmission of dengue
Section B 3 (a) Account for the importance of hydrogen bonds in biological organisms. [13]

16
© RI 2018 Preliminary Examination / H2 Biology
Context Importance Protein structure
Ref to levels of protein structure 1. Secondary structure* maintained by hydrogen bonds between
CO* and NH* groups of peptide backbone; 2. Tertiary structure* maintained by hydrogen bonds between R
groups* of same polypeptide to allow for protein to fold into functional conformation;
3. Quaternary structure* maintained by hydrogen bonds between R groups between polypeptides* allowing for interaction between different subunits of same protein;
Relate structure to function 4. Ref. to specific example: Collagen: hydrogen bonds between R
groups of adjacent polypeptide in a tropocollagen 5. high tensile strength; Note: tensile strength (pt5 and pt 10 – 1 mark] 6. A: General description 3D conformation eg. Enzyme active site 7. Ref. to crucial for function eg binding to substrate
complementary in shape and charge to catalyse reaction 8. Ref to co-operativity eg: allosteric enzyme, haemoglobin
Cellulose/Carhohydrates
9. Cellulose: hydrogen bonds between cellulose chains to produce cellulose fibres;
10. that has high tensile strength;
Solubility 11. In a largely aqueous environment, ability of molecules to form hydrogen bonds with water;
12. a. enables solubility so that molecules can e.g. (give 1 e.g.): transport, diffuse through, metabolised; b. lack of hydrogen bonds result in insolubility – relate to function eg. Structural.
DNA structure 13. Hydrogen bonds between complementary bases; 14. causing DNA to be a stable double-stranded molecule;
DNA replication / transcription
15. Hydrogen bonds between complementary bases (A: idea of 2 strands) are weak bonds;
16. hence it is easy break and separate DNA into 2 strands to allow for DNA replication / transcription;
17. DNA replication uses 1 strand as a template to synthesise new
strand: Free nucleotides / deoxyribonucleoside triphosphate (dNTPs) form hydrogen bonds with bases on DNA strand;
18. Transcription: same as above but free ribonucleotides / ribonucleoside triphosphate form hydrogen bonds with DNA strand;
For 17 and 18, should identify product as either DNA or RNA; 19. Function: to use 1 strand as template* to synthesise a
complementary strand;
tRNA and Translation
20. tRNA has intramolecular hydrogen bonds; 21. maintain 3D conformation of tRNA so that tRNA can fit into
active site* of aminoacyl-tRNA synthetase to be joined to its corresponding amino acid;
17
© RI 2018 Preliminary Examination / H2 Biology
22. Translation: anticodon* on tRNA* forms hydrogen bonds with complementary* codon* on mRNA*;
23. Allows polypeptide synthesised to have amino acid sequence corresponding to codon sequence on mRNA;
Ligand-receptor interactions
24. Ligand-receptor interactions may also involve hydrogen bonds allow ligand to bind, cause conformational changes and trigger cell signalling;
25. As hydrogen bonds are weak interactions, it will allow for ligand to bind and dissociate (A: bind temporary) from receptor;
Enzyme-substrate complex
26. Interaction involving enzyme active site* and substrate may also involve hydrogen bonds
27. which would help to bind to substrate and hold them in correct orientation for reaction;
Transpiration 28. Hydrogen bonds form between water molecules; 29. allow for water uptake in plants via transpirational pull/ capillary
action; AVP; QWC: ref to 4 different context;
(b) Discuss the diverse roles of membranes in a cell. [12] 1. Membranes are made up phosphoslipid bilayer with hydrophobic core;
2. Protein being embedded within bilayer; Context Roles Selectively permeable / S
3. Being selectively permeable, membrane only allows some molecules to cross directly without assistance;
4. Non-polar/uncharged (ignore: hydrophobic) molecules are able to dissolve and diffuse through;
5. Ions/charged and/or most polar molecules (ignore: hydrophilic) are repelled; (Generic principle cannot be replaced by H+)
Compart-mentalisation / C
6. Formation of unique environment for highly specialised activities; 7. e.g. lysosomes maintain an acidic environment that favours its
enzymes to work;
8. localization of enzymes for reactions to take place so that they are not suppose to catalyse reactions that they are not supposed to;
9. e.g.: enzymes in Calvin Cycle in stroma;
10. accumulation of ions to generate a concentration gradient; 11. e.g. H+ in intermembranal space in mitochondria/within thylakoid
space in chloroplasts establishes a proton gradient for chemiosmosis* and formation of ATP;
12. Storage of food source; 13. e.g. starch in plant cells are stored in amyloplasts;
R: starch grain, make sure it is membrane bound
Localisation of proteins of a related function
14. Allows functionally-related proteins to be grouped together to enhance sequential biochemical processes;
15. e.g. enzymes and proteins are grouped into photosystems II and I on thylakoid membrane of chloroplast so that electrons from

18
© RI 2018 Preliminary Examination / H2 Biology
/ L photosystem II are shuttled to photosystem I during photophosphorylation;
Increase surface area / I
16. Highly folded increases surface area to hold more; 17. e.g.: electron transport chains/ ATP synthase in cristae of
mitochondria;
Cell-cell recognition and adhesion / R
18. Glycoproteins / glycolipids are involved in cell-cell recognition; 19. (any 1 e.g.)
eg: T cell receptor on membranes of naïve T cells + how it helps to recognize peptide: MC on antigen presenting cells;
Signal transduction / T
20. Some transmembrane proteins serve as cell surface receptors to transfer information from environment into cell when specific molecules (ligands) bind to them;
21. E.g. glucagon (hormone) bind to glucagon receptor in membrane which triggers a cascade of chemical reactions leading to hydrolysis of glycogen to glucose; E.g. insulin
QWC: ref to 3 different contexts
4 (a) Discuss how the complementary shapes between biomolecules enable eukaryotic cells
to carry out their diverse functions. [13]
Category Description Transport protein – molecule to be transported / T
1. A transport protein has a binding site complementary in shape to specific for molecule,
2. E.g. pyruvate – pyruvate translocase / water - aquaporin
Enzyme – substrates / E
3. Substrates have complementary conformation* and charge* to active site (conformation is a more accurate word than ‘shape’);
4. DNA polymerase – active site can bind to deoxyribonucleotides,
5. catalyses formation of phosphodiester bonds between adjacent DNA nucleotides to synthesise new strand (DNA replication);
6. DNA ligase – active site can bind to deoxyribonucleotides, 7. forms a phosphodiester bond between two DNA fragments/
sealing nick;
8. RNA polymerase – active site can bind to ribonucleotides; 9. and catalyses formation of phosphodiester bonds between
adjacent RNA nucleotides of newly synthesised strand;
10. Amino acyl RNA synthetase – active site complementary to an amino acid and tRNA molecule;
11. in order to join them to form an amino acyl tRNA molecule, to help form peptide bonds between amino acids;
Protein 12. Proteins may have DNA binding domains / sites that are

19
© RI 2018 Preliminary Examination / H2 Biology
– nucleic acid / PN
complementary in shape and charge to specific DNA sequence;
13. RNA polymerase – promoter sequence; 14. Initiating RNA synthesis/transcription at correct position / in
frame to produce functional protein; 15. Transcription factors - specific sequence of DNA adjacent to
the genes that they regulate; 16. Activators – specific transcription factors known as activators*
bind to enhancer nucleotide sequences 17. to increase frequency of transcription; / promoting assembly of
transcription initiation complex; 18. Repressors – specific transcription factors known as
repressors* bind to silencers* nucleotide sequences 19. to decrease frequency of transcription/ inhibiting assembly of
transcription initiation complex;
20. Spliceosome recognises DNA sequence at intron-exon boundary,
21. to excise intron and join exons to form mature mRNA; 22. DNA-binding proteins (e.g. transcriptional repressors, histone
deacetylases and repressive chromatin remodeling complexes) recognize and bind to methylated DNA
23. to condense chromatin (A: converse) results in gene silencing/ no gene expression;
Protein – protein / PP
24. Proteins may have protein binding domains / sites that are complementary in shape and charge to other protein molecules;
25. Activators – specific transcription factors known as activators*
bind to general transcription factors at enhancers; 26. promoting assembly of transcription initiation complex; 27. Repressors – specific transcription factors known as
repressors* bind to general transcription factors at silencers; 28. inhibiting assembly of transcription initiation complex;
Transport Or enzyme Or enzyme complex to link
29. H+ must fit into ATP synthase 30. so that can diffuse through ATP synthase, so that ADP can be
phosphorylated to form ATP;
Ligand - receptor / L
31. Ligand has a complementary shape that allows it to fit precisely into (extracellular domains of) receptor molecules on target cells;
32. in order to transfer information from environment into cell when specific molecules (ligands) bind to them / convert extracellular signal to an intracellular signal;
33. Eg. Cell surface receptors: has an extracellular ligand-
binding site* binding to hydrophilic ligand, 34. Eg. Binding of ligand causes conformational change in

20
© RI 2018 Preliminary Examination / H2 Biology
intracellular domain of receptor; can ref to specific receptor. 35. Eg. GPCR: Ligand binding to GCPR causes conformational
change in intracellular domain of receptor allowing it to bind to and activate G protein; or RTK: conformational change… activation of kinase region to result in cross-phosphorylation;
Immune system / I
36. Ligand has a complementary shape that allows it to fit precisely into (extracellular domains of) receptor molecules on target cells;
37. Naïve T cell has specific T cell receptor that fits and binds to peptide:MHC complex presented on antigen presenting cells;
38. Helps to trigger clonal expansion and differentiation of naïve T cells;
39. T helper cells has specific T cell receptor that fits and binds to specific B cell receptor on naïve B cells;
40. Helps to trigger clonal expansion and differentiation of naïve B cells;
41. Antibodies have unique antigen binding site that can bind to
antigens/ pathogens 42. causing opsonisation or neutralisation;
Function point (eg: points 5, 14 can only be given if named of interacting molecules are given). AVP – any valid points are awarded depending on importance of interacting molecules and depth of description. QWC: 3 different categories + overacrching principle for each category
(b) Organisms are able to detect and respond to changes in their environments. Discuss
this, with reference to specific examples in unicellular and multi-cellular organisms. [12] 1. Unicellular organisms eg bacteria: responds to changes in the nutrients available in
the environment in order to optimise use of resources / produce enzymes only when necessary / WTTE;
2. Specific example: lac operon*: genes involved in lactose metabolism under control
of a single promoter* and operator*; 3. Lac I codes for active lac repressor which binds to operator region to prevent
expression of structural genes in lac operon; 4. Presence of lactose results in production of allolactose which binds to lac repressor
to inactivate it; 5. Allowing for structural genes to be transcribed and translated to produce b-
galactosidse, permease and transacetylase 6. Allows bacteria to take up lactose from its surrounding and break down lactose into
glucose and galactose; 7. Presence of glucose results in low cAMP. Hence catabolite activator protein (CAP)
is not activated; 8. And is therefore unable to upregulate / increase the frequency of transcription of the
structural genes; 9. Specific example 2: trp operon: genes involved in synthesis of tryptophan under the
control of a single promoter* and operator*; (promoter and operator can be in pts 2 or 7)
10. Trp R codes for inactive trp repressor which cannot bind operator, allowing for transcription of structural genes in trp operon;

21
© RI 2018 Preliminary Examination / H2 Biology
11. Tryptophan binds to trp repressor to activate it; 12. Tryptophan synthesis is thus stopped when bacteria is able to obtain sufficient
amounts of tryptophan (from its environment); 13. Multicellular organsms eg humans have mechanisms to maintain a constant internal
environment despite changes in the external environment; 14. Specific example: maintenance of blood glucose concentration; 15. Intake of food results in an increase in blood glucose concentration 16. which stimulates production of insulin* by �-cells* in the islets of Langerhan*; 17. Insulin binds to insulin receptors on muscle cells* and liver cells*; 18. Causes increase uptake of glucose into cells and conversion of glucose to glycogen; 19. Lack of food results in low blood glucose concentration as glucose; 20. which stimulates production of glucagon* by a-cells* in islets of Langerhan*; 21. Glucagon binds to glucagon receptors on liver cells*; R if muscle cells included 22. Causes breakdown of glycogen into glucose and release of glucose into blood; (Signal transduction) 23. Receptor allows transduction from extracellular to intracellular; 24. Multiple steps in pathway allowing for many pts of control / different pathways in
different cells to produce a coordinated response; 25. signal amplification to produce a large response; QWC: at least 1 ref to unicellular and 1 to multicellular; Cap unicellular to 7, multicellular to 7 A: details on nervous system

22
© RI 2018 Preliminary Examination / H2 Biology
Paper 4 1 (a) -
(b) • Start time / end time - did not reset stopwatch between readings, record in e.g. 00:30, 02:15;
• Computation of time taken, in whole numbers; • Table 1.1: correct trend of data; in ascending order of time taken W2, 4, 1, 5, 3; • Table 1.2: correct trend of data; in ascending order of time taken W2, 4, 1, 5, 3;
(c) Prepare and complete a table in the space below to show the mean time taken to reach the
end-point for each glucose solution. [4] 1. Heading (glucose solution, mean time taken with correct units (s not sec)) 2. Correct Calculation of mean; 3. Mean time taken recorded to nearest second / 1 d.p.; 4. Table must show all grid lines and border, drawn using ruler.
(d) A sixth boiling tube should be set-up. Describe how a control is set-up and explain the reason for this. [2]
1. With all other variables kept constant, replace glucose solution is with distilled water; 2. This is to show that glucose is responsible for reduction and hence the decolourisation /
colour change of permanganate;
(e) Present the above data in a graphical format. [5] 1. S – Scale must be appropriate and both axis must cover at least 1/2 of the space given. 2. A – correct choice of axes + correct labels and units + correctly labelled intervals 3. P - all points plotted correctly 4. L - all points joined by line of best fit and 5. E - no extrapolation beyond plotted points
(f) Estimate the concentration of, (i) solution W1 by using the graph
Concentration of solution W1 : ……………………[1]Read off graph + show dotted line on graph and values on x and y axes + Value should be within teachers’ range.
Without extrapolating the graph, estimate the concentration of solution W5 by : (ii) Using the formula y=mx + c,. Show your working clearly, on how the values of m and c are
calculated. Concentration of solution U : ……………………[3] 1) Use values from graph to calculate gradient ; m : Gradient = 115 – 10 5 – 25 = - 5.25 2) Use gradient (m) and y value from graph to calculate C ; Reject if candidate use y = 0
C : Y = -5.25x + C 88 = -5.25 (10) + C C = 140.5
3) Use calculate gradient (m), value of C and time taken for wW to turn from pink to colourless to calculate concentration. Values of time take for W5 to turn colourless must be within teachers’ value.
X : substituting y = mx + C , 77.5 = -5.25x + 140.5 X = 12 %

23
© RI 2018 Preliminary Examination / H2 Biology
2 You are given a prepared slide showing a section of a root tip showing different stages of
mitosis. (a) Examine the slide. Identify 2 cells at different stages of mitosis and make a large labelled
drawing of each cell. Indicate the stage of mitosis for each of the cells drawn. [6] 1. Drawing of chromosomes matched with label of stage and accurately represented (cell 1) 2. Drawing of chromosomes matched with label of stage and accurately represented (cell 2)
* Reject if individual chromosomes are drawn or if drawing is inaccurate. E.g. nuclear enveloped has not disintegrated in Metaphase or Anaphase. * Reject interphase. Not part of mitosis.
3. Sharp and smooth continuous line. Reject fuzzy lines, or messy drawing with blunt pencil 4. Proportion: Thin cell wall of consistent thickness + size of chromosomes 5. Labels: cellulose cell wall, plasma membrane, chromosome, cytoplasm (any 3 labelled) 6. Large: 2/3 of space provided
(b) Calculate the actual length of the chromosome shown in Fig. 2.1 in μm. …………………………… μm [3]
10 eyepiece graticule division = 0.02mm = 20μm; (conversion of mm to μm) 1 eyepiece graticule division = 20/10 = 2μm; (calibrate eyepiece graticule) A: alternative definitions of a “division”= smallest division as 1 according to diagram or smallest division = ¼ 1 division = 20/40 = 0.5um Length of chromosome = 1.5 eyepiece graticule = 3μm; (measurement of chromosome)
(c) Using the prepared slide, count the number of cells in each stage of the mitotic cell cycle, using 100 cells from a randomly chosen field of view of the microscope. Repeat the count for another chosen field of view.
(i) Prepare and complete a table in the space below to show the percentage of cells in each stage of the mitotic cell cycle. [5]
Stage Number of cells out of 100 Percentage of cells in stage / % Count 1 Count 2 Average
Interphase Prophase Metaphase Anaphase Telophase
1. Appropriate headings with units 2. All stages listed 3. Cells out of 100 + average – recorded to nearest whole number 4. Percentage of cells to whole number
A and %: up to 1 d.p. 5. Correct trend: Interphase most, Meta/Ana - least
(b) The percentage of cells observed in each stage can be used to infer the duration of the stage. (i) State the longest stage of the cell cycle and explain how you arrived at your conclusion.
[2] 1. Interphase; (ecf – based on student’s results) 2. Majority / Higher percentage of cells in stage implies that the stage took the
longest duration to complete hence highest probability of finding a cell in that stage;
(ii) A student commented that a vital piece of information is required to determine the exact duration of each stage. Suggest what is this vital piece of information. [1]

24
© RI 2018 Preliminary Examination / H2 Biology
• Exact timing for completion of cell cycle (iii) Another student commented that this method of determining the duration of each stage
is inaccurate. Other than the absence of 3 replicates, suggest why it is so and describe how you can improve on the accuracy of the results obtained. [2] Error:
• Small numbers (100) of cells counted / small number cells in metaphase / anaphase / telophase / not all cells in each stage may be observed, hence not accurate;
How to improve: • Count larger number of cells eg. 200 (must specify at least 200) / different root
samples or slides ; (c) Using the formula above and the probability table given, what conclusion can be drawn from
this t-test? [3] 1. Degree of freedom = 10 + 10 – 2 = 18, from table: p<0.001; 2. Since p<0.05, at 5% level of significance, 3. the difference between T1 and T2 is significant and not due to chance; 4. Rate of cell division is higher at higher temperature;
3 It is known that Q, an organic compound can act as an inhibitor of phosphatase. Using the list
of apparatus below, design an experiment to determine if Q is a competitive or a non-competitiveinhibitor. [14] Aim To determine if Q is a competitive or a non-competitive inhibitor of phosphatase activity. Theory
T1. Substrate, phenolphthalein diphosphate (XP) complementary in shape and charge (must have both shape and charge) to active site* of phosphatase;
T2. Intensity of colour/pink compound can be measured using a spectrophotometer over a fixed period of time is an indication of phosphatase activity;
T3. If Q is a competitive inhibitor, it competes with substrate for active site*; T4. If Q is a non-competitive inhibitor, it binds to a site other than active site, causing a
change in active site; [Theory T1, T2, max 2 marks] Trend (Expected results / how to make conclusion)
Tr1. If Q is a competitive inhibitor, same maximum absorbance reached at high [XP], compared to without inhibitor;
Tr2. If Q is a non-competitive inhibitor, lower maximum absorbance at high [XP], compared to without inhibitor
[Trend Tr, max 1 mark] Variables
Description How it is controlled Independent variable
IV1: Presence and absence of inhibitor
• Conduct experiment, with and without inhibitor Q.
IV2: 5 concentrations of XP
• Dilution table (5 regular [XP]).
Measurable variable
MV: Measure absorbance
• Measure 1 cm3 of solution (XP + phosphatase + sodium carbonate), add it into a cuvette.
Dependent variable
DV: Rate of phosphatase activity
• obtained by measuring absorbance of pink colouration divided by time (idea of fixed time).

25
© RI 2018 Preliminary Examination / H2 Biology
[Independent variable – IV1: with and without inhibitor Q, IV2: 5 concentrations of XP in dilution table] [Measurable variable – state + how it is measured (MV)] [Dependent variable – state + how it is measured (DV)]
Conduct a pilot experiment to determine suitability of apparatus, range of independent variables (e.g. range of concentration of inhibitor Q), duration of experiment & amount of materials used.
Numbered steps Preparation of inhibitor solution
1. Using 10 cm3 syringe, prepare 5 different concentrations of XP solution by following dilution table below:
Concentration of XP /%
Volume of 10% XP used /cm3
Volume of distilled water used /cm3
2 2.0 8.0 4 4.0 6.0 6 6.0 4.0 8 8.0 2.0
10 10.0 0.0 Preparation of enzyme reaction
2. Set up a water bath of 370C, using hot and cold water, and use a thermometer to monitor temperature. (constant variable: temperature + how: using hot and cold water, use a thermometer to monitor temperature + why: temp. affect rate of enzyme catalyzed reactions)
3. Place substrate XP, enzyme phosphatase and inhibitor Q, separately into water bath. Allow 1 min of equilibration time, so that solutions can attain temperature of water bath. [Equilibration E]
4. Using a syringe add 1 cm3 of 2%, 4%, 6%, 8% and 10% XP to test tubes. 5. Add 1 cm3 of 5% inhibitor Q to each test tube. 6. Add 1 cm3 of pH buffer 7 to each test tube.
(constant variable: pH + how: using buffer/ fix pH eg pH7 + why: pH changes denatures enzymes)
7. Add 1 cm3 of 5% phosphatase to each test tube. Mix well and incubate mixture in water bath. (constant variable: concentration of enzyme / volume of enzyme + how: using syringe / fix vol. eg 1 cm3 + why: affect total amount of enzyme / final [enzyme] , so affects rate of reaction
8. Prepare a “blank” – fill a cuvette with 1 cm3 distilled water and measure its absorbance value using a spectrophotometer. This acts a blank / absorbance should be at 0% / if it is not 0% then spectrophotometer should be re-zeroed. [Blank – state how + why, B]
9. After 5 minutes, add 1 cm3 of mixture with 1 cm3 sodium carbonate to get a pink
colouration. (constant variable: reaction time)
10. Transfer 1 cm3 of reaction mixture into a cuvette and measure absorbance value/colour intensity of pink solution using a spectrophotometer.

26
© RI 2018 Preliminary Examination / H2 Biology
11. Repeat Step 3-10 using distilled water instead of inhibitor Q. 12. Record colour intensity in absorbance value (A) for each concentration of XP. 13. Plot a graph of colour intensity in absorbance value/A against concentration of XP. [Constant variable: state any 2] [Constant variable: how + why it is controlled CV1] [Constant variable: how + why it is controlled CV2]
Control
• Keep all variables constant, set up control experiment using boiled and cooled phosphatase/ distilled water instead of inhibitor Q.
• This is to obtain baseline results, in absence of inhibitors/ to show phosphatase enzyme is responsible for dephosphorylation of XP.
[Control: state + purpose, Co] Repeats & replicates
• Conduct 3 replicates for each condition to check that no anomalies are present. • Repeat entire experiment twice to check for reproducibility. [Repeat and replicates: state how + why purpose, RR]
Data Recording and Processing
Record and process data: (table and graph should have same heading / unit)
Concentration of XP /%
Absorbance /A With inhibitor Q Without inhibitor Q
Trial 1 Trial 2 Trial 3 Average
Trial 1 Trial 2 Trial 3 Average
2 4 6 8
10 [Table, Ta]
Graph on effect of inhibitor Q on rate of phosphatase activity
at various concentration of substrate
[Graph, G: shows expected trend]
Risks & precautions
1. Wear gloves and goggles when handling XP solution, inhibitor Q solution and phosphatase solutions as they may be toxic.

27
© RI 2018 Preliminary Examination / H2 Biology
2. Do not touch electrical switch of the spectrophotometer with wet hands to prevent electrocution.
3. Wear oven mittens / insulating gloves when handling hot water to avoid scalding. [Risk and Precautions, RP: state 1 risk + precaution]
Compulsory point to get max 14m: Answering the question

© RI 2018 Preliminary Examination 9744/02 [Turn over
RAFFLES INSTITUTION 2018 Year 6 Preliminary Examination Higher 2
BIOLOGY 9744/02 Paper 2 Structured Questions 13th September 2018
2 hours Candidates answer on the Question Paper. No Additional Materials are required.
READ THESE INSTRUCTIONS FIRST Write your index number, CT group & name in the spaces at the top of this page. Write in dark blue or black pen. You may use a HB pencil for any diagrams or graphs. Do not use staples, paper clips, glue or correction fluid. DO NOT WRITE IN ANY BARCODES Answer all questions in the spaces provided on the Question Paper. The use of an approved scientific calculator is expected, where appropriate. You may lose marks if you do not show your working or if you do not use appropriate units At the end of the examination, fasten all your work securely together. The number of marks is given in brackets [ ] at the end of each question or part question.
This document consists of 22 printed pages.
CIVICS GROUP
CANDIDATE NAME
INDEX NUMBER 8 S 0 3 1
Raffles Institution Internal Examination
For Examiner’s Use
1 / 12
2 / 15
3 / 17
4 / 12
5 / 12
6 / 12
7 / 10
8 / 10
Total / 100

2
© RI 2018 Preliminary Examination 9744/02
For Examiner’s
Use
Answer all questions. 1 Phosphofructokinase (PFK) is an allosteric enzyme made of 4 subunits and controlled by
many activators and inhibitors which regulate glycolysis. PFK phosphorylates fructose-6-phosphate to form fructose-1,6-bisphosphate.This enables the cell to increase or decrease the rate of glycolysis in response to the cell's energy requirements. For example, a high ratio of ATP to ADP will inhibit PFK and glycolysis. Fig 1.1 shows the effect of low ATP on phosphofructokinase (PFK) activity.
Fig. 1.1
(a) (i) On Fig. 1.1, draw a graph to show the effect of high ATP on PFK activity. [1] (ii) Explain the graph you have drawn.
…………………………………………………………………………………………………. …………………………………………………………………………………………………. …………………………………………………………………………………………………. …………………………………………………………………………………………………. …………………………………………………………………………………………………. ……………………………………………………………………………………………… [3]
(iii) Name a molecule that will act as an allosteric activator of PFK.
………………………………………………………………………………………….…… [1]

3
© RI 2018 Preliminary Examination 9744/02 [Turn over
For Examiner’s
Use
(b) Fig. 1.2 shows a PFK molecule.
Fig. 1.2
(i) Describe the structure of PFK.
…………………………………………………………………………………….…………… …………………………………………………………………………………….…………… …………………………………………………………………………………….…………… …………………………………………………………………………………….…………… …………………………………………………………………………………….…………… …………………………………………………………………………………….…………… …………………………………………………………………………………….…………… …………………………………………………………………………………….………… [4]
(ii) Explain how a change in pH may affect PFK activity.
…………………………………………………………………………………….…………… …………………………………………………………………………………….…………… …………………………………………………………………………………….…………… …………………………………………………………………………………….…………… …………………………………………………………………………………….…………… …………………………………………………………………………………….………… [3]
[Total : 12]

4
© RI 2018 Preliminary Examination 9744/02
For Examiner’s
Use
2 A student wanted to investigate the difference between gene regulation of lactose metabolism in humans and bacteria.
The enzyme, lactase, is responsible for breaking down lactose in humans. LCT gene coding for lactase is found on chromosome 2, where its molecular nucleotide location is from base pairs 135,787,840 to 135,837,195.
Deletion constructs of the LCT gene were designed with various sequences on chromosome 2 deleted. These nucleotide positions are all upstream of the LCT gene, and were selected as they were found to be bound by molecules (A, B and C) which exert influence over LCT gene regulation. Fig. 2.1 shows the map of a particular portion of chromosome 2, where relative positions of these sequences as well as the molecules associated with them are shown.
Fig 2.1
In order to quantify the effect of deletion on regulation of LCT, the student measured the amount of LCT mRNA produced, and the results are summarised in Table 2.1.
Deletion construct Nucleotides deleted Relative mRNA quantity / a.u.
Wild type - 268 1 -30 to 0 0 2 -1350 to -1000 550 3 -2580 to -2400 76
(a)
Table 2.1 With reference to Fig 2.1 and Table 2.1,
(i) identify the type of molecule as well as the type of regulatory sequences studied in the experiment.
Type of molecule Position Type of Regulatory Sequence
A -2580 to -2400 B -1350 to -1000 C -30 to 0
[3]

5
© RI 2018 Preliminary Examination 9744/02 [Turn over
For Examiner’s
Use
(ii) explain how you arrived at the identity of molecule B as well as the type of regulatory sequence at -1350 to -1000.
………………………………………………………………………………….……………… ………………………………………………………………………………….……………… ………………………………………………………………………………….……………… ………………………………………………………………………………….…………… [2]
(b) The LCT mature mRNA excluding its poly-A tail is much shorter than the LCT gene.
Account for this difference.
…………….…………………………………………………………………………………………… …………………….…………………………………………………………………………………… …………………………….…………………………………………………………………………… ……………………………………………………………………………………………………… [2]
(c) The lac operon is responsible for lactose metabolism in bacteria.
With reference to the lac operon, describe one difference in the regulation of lactose
metabolism in bacteria and humans.
……………………………………………………………………..…………………………………… ……………………………………………………………………………………………………… [1]
(d) The student wanted to investigate how glucose and lactose impact gene expression of lac
operon and growth of E. coli. Fig. 2.2 shows the utilisation of glucose and lactose as carbon sources in a culture of bacteria.
Fig 2.3

6
© RI 2018 Preliminary Examination 9744/02
For Examiner’s
Use
(c) (i) Complete the graph by showing the concentration of bacteria in culture over time from W to Z. [1]
Using your knowledge of the lac operon, explain the shape of the graph for lactose from
(ii) time W to X, and
………………………………………………………………………………..………………… ………………………………………………………………………………..………………… ……………………………………………………………………………..…………………… …………………………………………………………………………….………………… [2]
(ii) Time Y to Z
………………………………………………………………………………………………… ………………………………………………………………………………………………… ………………………………………………………………………………………………… ………………………………………………………………………………………………… ………………………………………………………………………………………………… ………………………………………………………………………………………………… ………………………………………………………………………………………………… ……………………………………………………………………………………………… [4]
[Total : 15]

7
© RI 2018 Preliminary Examination 9744/02 [Turn over
For Examiner’s
Use
3 During meiosis, the cell divides to produce gametes.
(a) Discuss the role of centromere in the production of gametes.
……………………………………………………………………………………………………...… ……………………………………………………………………………………………………...… ……………………………………………………………………………………………………...… ……………………………………………………………………………………………………...… ……………………………………………………………………………………………………...… ……………………………………………………………………………………………………..[3]
(b) The graph in Fig. 3.1 shows the length of the spindle fibres during meiosis.
Fig. 3.1
(i) In which regions of the graph did the centromeres detach from the spindle fibres?
……………………………………………………………………………………………… [1] (ii) Fig. 3.2 shows a particular stage in meiosis
Fig 3.2
Which region on the graph corresponds to the stage shown in the Fig. 3.2.
……………………………………………………………………………………………… [1]

8
© RI 2018 Preliminary Examination 9744/02
For Examiner’s
Use
(ii) Name and identify 2 corresponding stages on the graph in Fig 3.1 that contributes to genetic variation in gametes, and explain how they bring about genetic variation.
Stage ……………………… Explanation …………………………………………………………………………….……… ……………………………………………………………………………………………….… ……………………………………………………………………………………………….… Stage ……………………… Explanation …………………………………………………………………………………… …………………………………………………………………………………………….…… ………………………………………………………………………………………….…… [6]
(c) Most human traits as well as medical conditions are under genetic influence.
A gene is found to control a rare disease, Wiskott–Aldrich syndrome (WAS) which is characterised by eczema, low platelet count and immune deficiency. Another gene that controls hair type has 2 alleles. 1 allele results in straight hair, another codes for curly hair. Presence of both results in wavy hair. In couple 1, a normal female with straight hair married a wavy-haired male suffering from WAS. Predicted phenotypic ratio of their offspring is as follows:
WAS Hair Female All normal 1 wavy : 1 straight
Male All normal 1 wavy : 1 straight For couple 2, a wavy-haired female suffering from WAS married a wavy-haired normal man. Predicted phenotypic ratio of their offspring is as follows:
WAS Hair Female All normal 1 curly : 2 wavy : 1 straight
male All affected 1 curly : 2 wavy : 1 straight
(i) What is the mode of inheritance of the WAS disease?
……………………………………………………………………………………………… [1]
(ii) Use suitable symbols to represent the alleles of the gene controlling the WAS
disease.
……………………………………………………………………………………………… [1]

9
© RI 2018 Preliminary Examination 9744/02 [Turn over
For Examiner’s
Use
(iii) Use a genetic diagram to explain the results of couple 2.
[4]
[Total : 17] 4 Fig. 4.1 shows the results of experiments investigating the effect of different light intensities
on the rate of photosynthesis of cucumber plants measured as mm3 CO2 uptake per cm2 leaf area per hour. The experiments were carried out at different temperatures and carbon dioxide concentrations.
Fig. 4.1

10
© RI 2018 Preliminary Examination 9744/02
For Examiner’s
Use
(a) (i) With reference to Fig. 4.1, state the best conditions for the growth of cucumber plant.
……………………………………………………………………………………………… [1]
(ii) Define the term limiting factor.
………………………………………………………………………………………………… ……………………………………………………………………………………………… [1]
(iii) With reference to Fig. 4.1, explain reasons for the difference between curves B and
C.
………………………………………………………………………………………………… ………………………………………………………………………………………………… ………………………………………………………………………………………………… ………………………………………………………………………………………………… ………………………………………………………………………………………………… ……………………………………………………………………………………………… [3]
(b) Fig. 4.2 shows the absorption spectra of various leaf pigments and the action spectrum for
photosynthesis.
Fig. 4.2
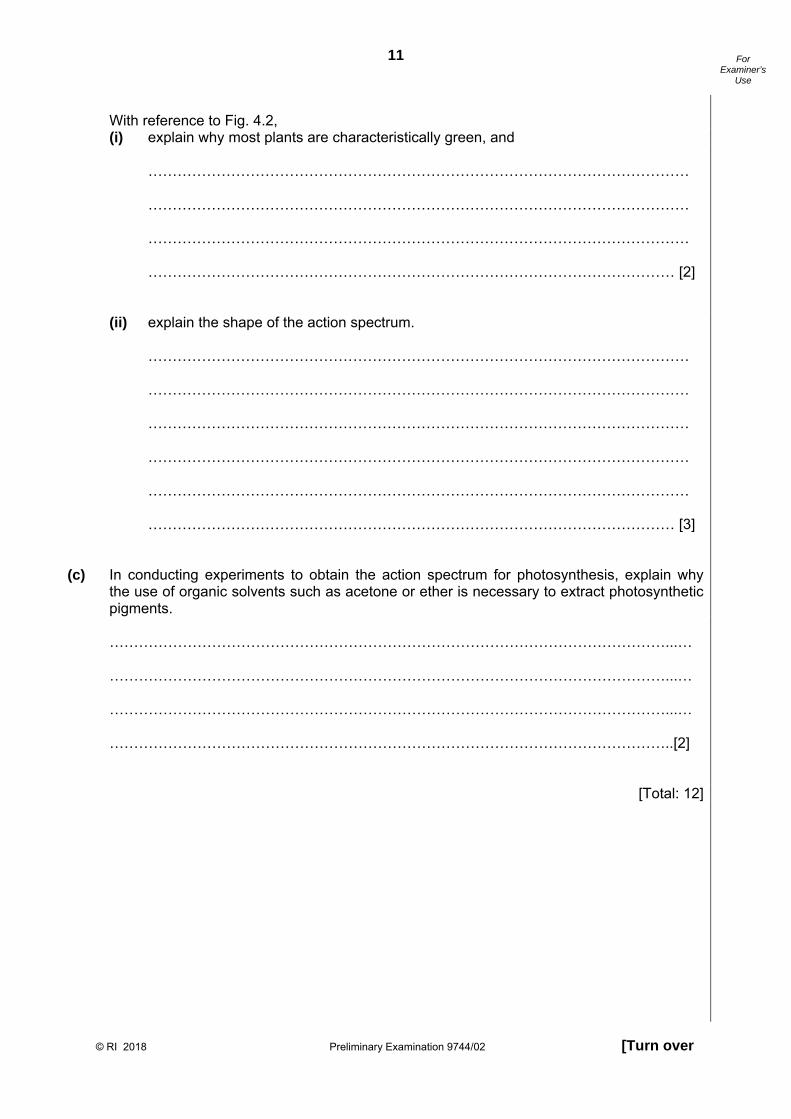
11
© RI 2018 Preliminary Examination 9744/02 [Turn over
For Examiner’s
Use
With reference to Fig. 4.2,
(i) explain why most plants are characteristically green, and
………………………………………………………………………………………………… ………………………………………………………………………………………………… ………………………………………………………………………………………………… ……………………………………………………………………………………………… [2]
(ii) explain the shape of the action spectrum.
………………………………………………………………………………………………… ………………………………………………………………………………………………… ………………………………………………………………………………………………… ………………………………………………………………………………………………… ………………………………………………………………………………………………… ……………………………………………………………………………………………… [3]
(c) In conducting experiments to obtain the action spectrum for photosynthesis, explain why
the use of organic solvents such as acetone or ether is necessary to extract photosynthetic pigments.
……………………………………………………………………………………………………...…
……………………………………………………………………………………………………...… ……………………………………………………………………………………………………...… ……………………………………………………………………………………………………..[2]
[Total: 12]
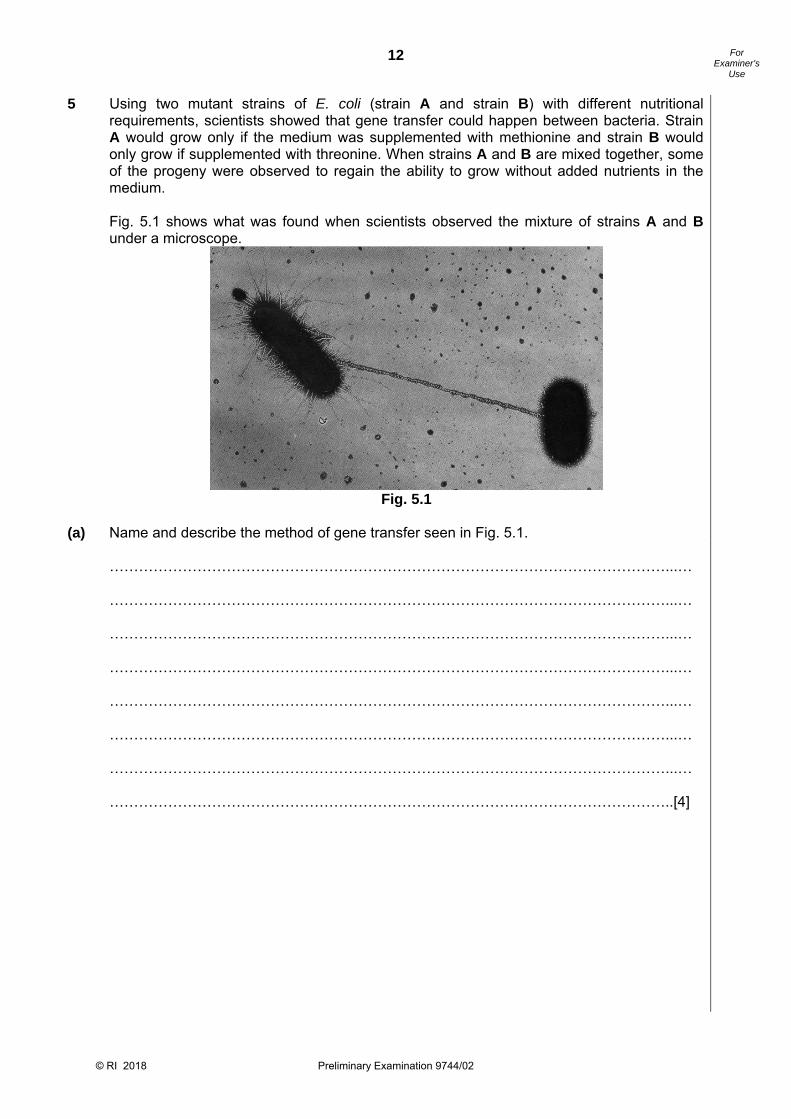
12
© RI 2018 Preliminary Examination 9744/02
For Examiner’s
Use
5 Using two mutant strains of E. coli (strain A and strain B) with different nutritional requirements, scientists showed that gene transfer could happen between bacteria. Strain A would grow only if the medium was supplemented with methionine and strain B would only grow if supplemented with threonine. When strains A and B are mixed together, some of the progeny were observed to regain the ability to grow without added nutrients in the medium. Fig. 5.1 shows what was found when scientists observed the mixture of strains A and B under a microscope.
Fig. 5.1
(a) Name and describe the method of gene transfer seen in Fig. 5.1.
……………………………………………………………………………………………………...… ……………………………………………………………………………………………………...… ……………………………………………………………………………………………………...… ……………………………………………………………………………………………………...… ……………………………………………………………………………………………………...… ……………………………………………………………………………………………………...… ……………………………………………………………………………………………………...… ……………………………………………………………………………………………………..[4]

13
© RI 2018 Preliminary Examination 9744/02 [Turn over
For Examiner’s
Use
The following experimental set-up was used to investigate more about the method of gene
transfer seen in Fig. 5.1. A suspension of strain A was placed in one arm of a U-tube and strain B was placed in the other arm. Liquid may be transferred between the arms but bacterial cells cannot pass through the center filter.
Fig. 5.2
(b) After several hours of incubation, the cells were transferred to minimal medium (without
methionine and threonine). Predict and explain if any bacterial growth would be observed.
……………………………………………………………………………………………………...… ……………………………………………………………………………………………………...… ……………………………………………………………………………………………………...… ……………………………………………………………………………………………………..[2]
(c) It was suggested that the scientists should set up a test-tube containing a mixture of strain
A, strain B and an enzyme nuclease.
(i) Predict if the bacterial progeny from this tube can survive in minimal medium without the addition of methionine and threonine.
………………………………………………………………………………………………… ………………………………………………………………………………………………… ………………………………………………………………………………………………… ……………………………………………………………………………………………… [2]

14
© RI 2018 Preliminary Examination 9744/02
For Examiner’s
Use
(ii) State the purpose of setting up this tube.
………………………………………………………………………………………………… ……………………………………………………………………………………………… [1]
(d) Further investigation revealed that the genes controlling methionine synthesis and
threonine synthesis are found on the bacterial chromosome. They can be transferred after the F plasmid integrates with the bacterial chromosome. The method of transfer is illustrated in Fig. 5.3.
Fig. 5.3
(i) With reference to Fig. 5.3, determine if strain A or strain B is the F+ cell.
……………………………………………………………………………………………… [1]
Met+ Thr −

15
© RI 2018 Preliminary Examination 9744/02 [Turn over
For Examiner’s
Use
(ii) In cases of gene transfer shown in Fig. 5.3, the F plasmid-bacterial chromosome is usually not transferred completely to the recipient cell. Random breakage interrupts the process. The recipient cell is unable to go on to donate any genes to other cells.
With reference to Fig. 5.3, suggest if the recipient cell is considered an F+ or and F- cell after the transfer. Explain your answer.
………………………………………………………………………………………………… ………………………………………………………………………………………………… ………………………………………………………………………………………………… ……………………………………………………………………………………………… [2]
[Total: 12] 6 Fig. 6.1 shows changes in the foot bones of four ancestors of modern horses over the past
50 million years.
Fig. 6.1
(a) Describe two changes in the foot bones of horses that have taken place over the past 50
million years.
……………………………………………………………………………………………………...… ……………………………………………………………………………………………………...… ……………………………………………………………………………………………………...… ……………………………………………………………………………………….……………..[2]

16
© RI 2018 Preliminary Examination 9744/02
For Examiner’s
Use
(b) Eohippus lived in swampy areas with soft mud. Since then, the ground in the habitat has become drier and harder. All of the horse ancestors were preyed upon by other animals.
(i) Explain one advantage to Eohippus of the arrangement of bones in its feet.
………………………………………………………………………….……………………… ……………………………………………………………………………………………… [1]
(ii) Based on the information given, explain how the changes in the arrangement of the
foot bones of horses support Darwin’s theory of evolution by natural selection.
………………………………………………………………………………………….……… ………………………………………………………………………………………….……… ………………………………………………………………………………………….……… ………………………………………………………………………………………….……… ………………………………………………………………………………………….……… ………………………………………………………………………………………….……… ………………………………………………………………………………………….……… ………………………………………………………………………………………….…… [4]
(c) (i) Fossils of Eohippus, Mesohippus and Merychippus have been unearthed only in the
North American continent. Explain how the biogeographical distribution of these fossils support Darwin’s theory of evolution.
…………………………………………………………………………………………….…… …………………………………………………………………………………………….…… …………………………………………………………………………………………….…… …………………………………………………………………………………………….…… …………………………………………………………………………………………….…… …………………………………………………………………………………………….… [3]

17
© RI 2018 Preliminary Examination 9744/02 [Turn over
For Examiner’s
Use
(ii) The first “modern” one toed horses Equus also arose in North America, around 5 million years ago, but quickly spread into the Asia and Europe, when the land bridge formed between continental America and Asia. They then diversified into the modern
species we know today - horses, donkeys, asses and zebras.
Explain how scientists created the phylogram shown in Fig. 6.2.
………………………………………………………………………………………….………
………………………………………………………………………………………….……… ………………………………………………………………………………………….……… ………………………………………………………………………………………….…… [2]
[Total :12]
Zebras
Horses
Asses
Donkeys
Fig. 6.2
Time PresentPast

18
© RI 2018 Preliminary Examination 9744/02
For Examiner’s
Use
7 The immune system protects the human body against pathogen’s infection of the host and subsequent development of disease. Fig. 7.1 shows the action of a macrophage on a pathogenic bacteria.
Fig. 7.1
(a) With reference to Fig. 7.1, identify the steps and explain the processes that kills the
pathogenic bacteria.
………………………………………………………………………………….…………………...… ……………………………………………………………………………………………………...… ……………………………………………………………………………………………………...… ……………………………………………………………………………………………………..[2]
(b) Describe how the humoral immune response enhances the action of macrophages on the pathogenic bacteria.
……………………………………………………………………………………………………...… ……………………………………………………………………………………………………...… ……………………………………………………………………………………………………...… ……………………………………………………………………………………………………...… ……………………………………………………………………………………………………...… ……………………………………………………………………………………………………..[3]
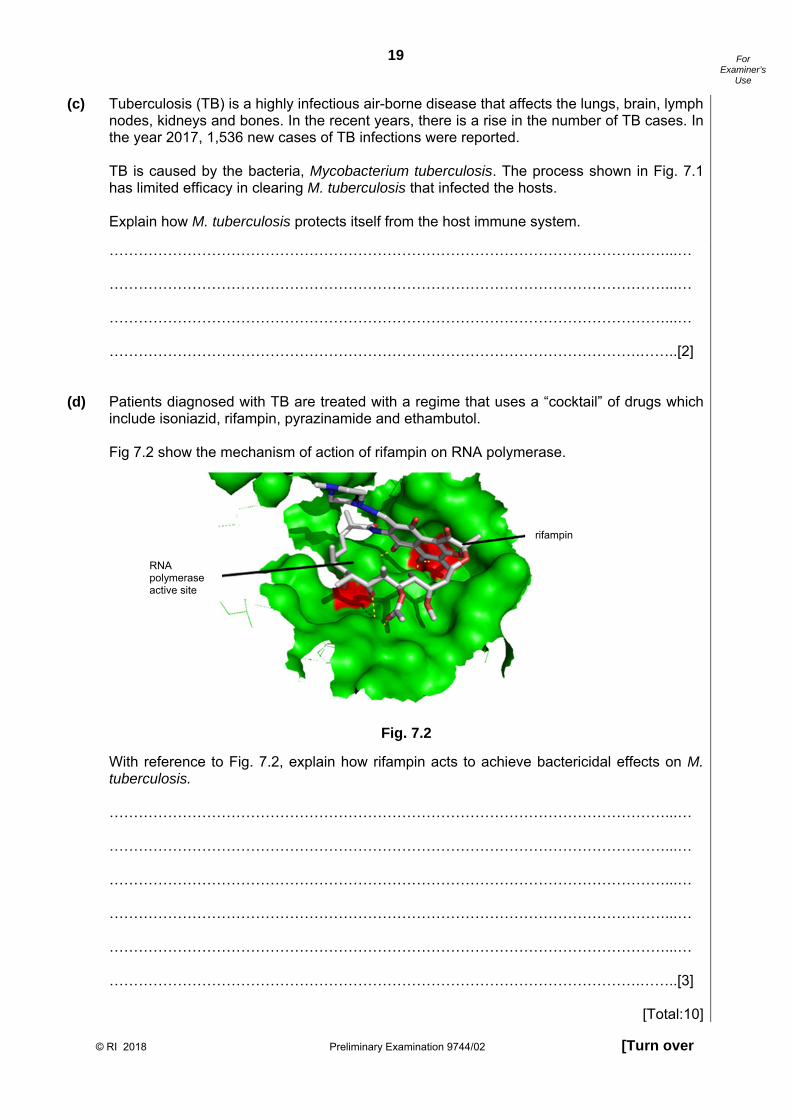
19
© RI 2018 Preliminary Examination 9744/02 [Turn over
For Examiner’s
Use
(c) Tuberculosis (TB) is a highly infectious air-borne disease that affects the lungs, brain, lymph nodes, kidneys and bones. In the recent years, there is a rise in the number of TB cases. In the year 2017, 1,536 new cases of TB infections were reported. TB is caused by the bacteria, Mycobacterium tuberculosis. The process shown in Fig. 7.1 has limited efficacy in clearing M. tuberculosis that infected the hosts. Explain how M. tuberculosis protects itself from the host immune system.
……………………………………………………………………………………………………...… ……………………………………………………………………………………………………...… ……………………………………………………………………………………………………...… ……………………………………………………………………………………………….……..[2]
(d) Patients diagnosed with TB are treated with a regime that uses a “cocktail” of drugs which
include isoniazid, rifampin, pyrazinamide and ethambutol. Fig 7.2 show the mechanism of action of rifampin on RNA polymerase.
Fig. 7.2
With reference to Fig. 7.2, explain how rifampin acts to achieve bactericidal effects on M. tuberculosis.
……………………………………………………………………………………………………...… ……………………………………………………………………………………………………...… ……………………………………………………………………………………………………...… ……………………………………………………………………………………………………...… ……………………………………………………………………………………………………...… ……………………………………………………………………………………………….……..[3]
[Total:10]
rifampin
RNA polymerase active site

20
© RI 2018 Preliminary Examination 9744/02
For Examiner’s
Use
8 Sea ice is an integral part of the Arctic Ocean. The extent of area covered by Arctic sea ice is an important indicator of changes in global climate because warmer air and water temperatures are reducing the amount of sea ice present.
Fig. 8.1 shows Arctic sea ice extent for the months of September and March of each year from 1979 through 2016. September and March are when the minimum and maximum extent typically occur each year.
Fig. 8.2 shows the start and end of the sea ice melt season.
Fig. 8.3 shows the distribution of Arctic sea ice extent by age group during the week in September with the smallest extent of ice for each year.

21
© RI 2018 Preliminary Examination 9744/02 [Turn over
For Examiner’s
Use
(a) With reference to Fig. 8.1, suggest why the sea ice extent in March is different from that in September.
……………………………………………………………………………………………………...… ……………………………………………………………………………………………………..[1]
(b) With reference to Fig. 8.2, (i) identify what X denotes.
……………………………………………………………………………………………… [1]
(ii) describe how X changes from 1979 to 2015.
………………………………………………………………………………………………… ……………………………………………………………………………………………… [1]
(ii) Explain how this is linked to the changes in sea ice extent as shown in Fig. 8.1 and Fig. 8.3.
……………………………………………………………………………………………….… ……………………………………………………………………………………………….… ……………………………………………………………………………………………….… ……………………………………………………………………………………………….… ……………………………………………………………………………………………….… …………………………………………………………………………………………….… [3]

22
© RI 2018 Preliminary Examination 9744/02
For Examiner’s
Use
(c) A number of animals living in the Arctic are able to change their coat colour as the seasons change. The ability to change coat colour is a result of their ability to control pigment production in response to variation in lengths of day or night. These animals are able to detect the lengths of day or night via a light-sensitive receptor known as melanopsin that is found in their retina. Fig. 8.4 shows the structure of melanopsin.
Fig. 8.4
(i) State the class of receptors that melanopsin belongs to.
………………………………………………………………………………………….…… [1]
Melanopsin is known to activate an enzyme known as phospholipase C via the signaling pathway shown in Fig. 8.5.
Fig. 8.5
(ii) With reference to Fig. 8.5, describe how phosholipase C could become activated.
………………………………………………………………………………………….……… ………………………………………………………………………………………….……… ………………………………………………………………………………………….……… ………………………………………………………………………………………….……… ………………………………………………………………………………………….…… [3]
[Total : 10]
End of Paper

23
© RI 2018 Preliminary Examination 9744/02 [Turn over
For Examiner’s
Use

© RI 2018 Preliminary Examination 9744/03 [Turn over
RAFFLES INSTITUTION 2018 Year 6 Preliminary Examination Higher 2
BIOLOGY 9744/03 Paper 3 Long Structured and Free-response Questions 18th September 2018
2 hours Candidates answer on the Question Paper. Additional Materials: Writing paper.
READ THESE INSTRUCTIONS FIRST Write your index number, CT group & name in the spaces at the top of this page. Write in dark blue or black pen. You may use a HB pencil for any diagrams or graphs. Do not use staples, paper clips, glue or correction fluid. DO NOT WRITE IN ANY BARCODES Section A Answer all questions in the spaces provided on the Question Paper. Section B Answer any one question in the writing paper provided. The use of an approved scientific calculator is expected, where appropriate. You may lose marks if you do not show your working or if you do not use appropriate units. At the end of the examination, hand in your essay question SEPARATELY. The number of marks is given in brackets [ ] at the end of each question or part question.
This document consists of 14 printed pages.
CIVICS GROUP
CANDIDATE NAME
INDEX NUMBER 8 S 0 3 1
Raffles Institution Internal Examination
For Examiner’s Use
Section A
1 / 27
2 / 23
Section B
3 or 4 / 25
Total / 75

2
© RI 2018 Preliminary Examination 9744/03
For Examiner’s
Use
Section A
Answer all the questions in this section. 1 Lactose is the major carbohydrate in milk which is a main source of food for infants. Young
children almost universally produce lactase, an enzyme which digests lactose. Fig. 1.1 shows the structure of a lactose molecule.
Fig. 1.1
(a) Show how a lactose molecule is hydrolysed into its monomers in the space provided below.
[2]
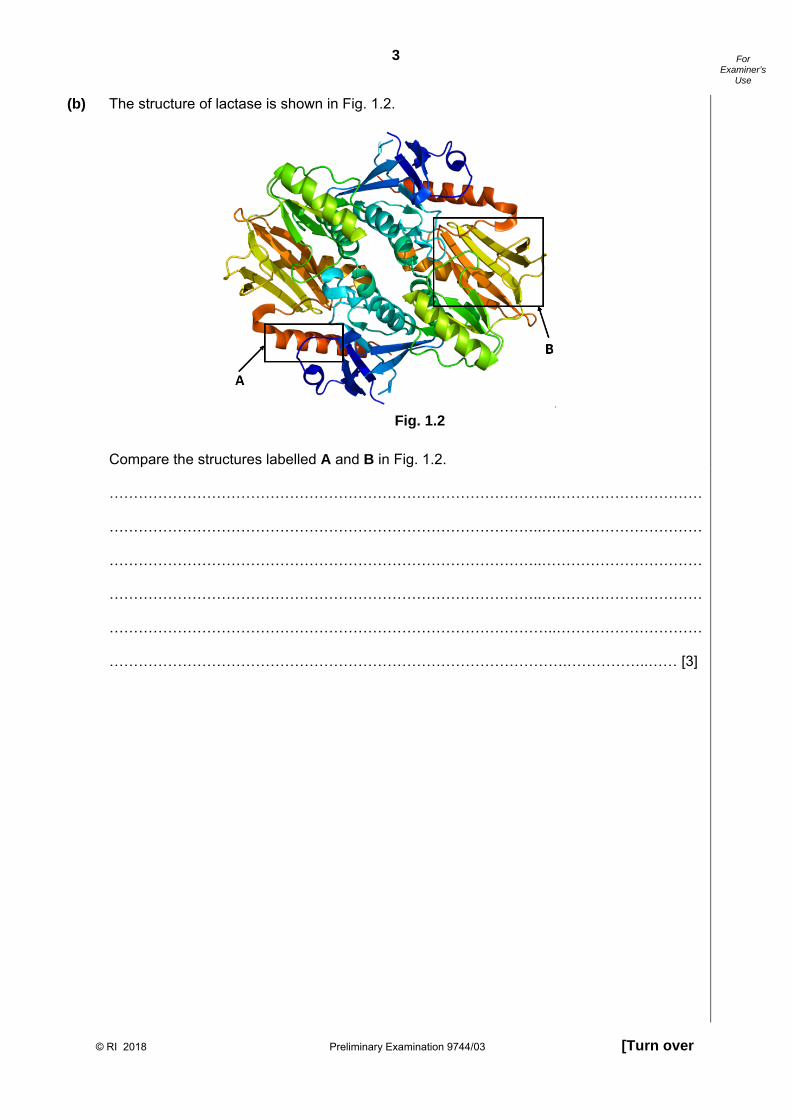
3
© RI 2018 Preliminary Examination 9744/03 [Turn over
For Examiner’s
Use
(b) The structure of lactase is shown in Fig. 1.2.
Fig. 1.2
Compare the structures labelled A and B in Fig. 1.2.
………………………………………………………………………………..………………………… ……………………………………………………………………………..…………………………… ……………………………………………………………………………..…………………………… ……………………………………………………………………………..…………………………… ………………………………………………………………………………..………………………… ………………………………………………………………………………….……………..…… [3]

4
© RI 2018 Preliminary Examination 9744/03
For Examiner’s
Use
(c) Lactose is digested in humans by lactase in the small intestine, which has an alkaline environment. People who are lactose intolerant lack the enzyme lactase, which digests lactose. If undigested, lactose reaches the large intestine where it can be fermented by microbes. Lactose fermentation results in the production of volatile fatty acids and gases such as carbon dioxide and hydrogen gas. A part of the hydrogen gas is expired by breath. The hydrogen (H2) breath test has been developed as a method to identify lactose intolerance. The fungus, Aspergillus oryzae, produces a lactase which converts lactose to glucose and galactose at a pH of 2 to 3.5. This makes the fungal lactase particularly effective to digest lactose in the stomach, which has a highly acidic environment. Therefore it is ideal for use in dietary supplements as a digestive aid.
(i) Explain a similarity and a difference in structure between the fungus lactase and the human lactase.
Similarity………………………….……………………………………………………….…… …………………………………………………….……………………………………….…… ………………………………………………………….……………………….……………… ………………………………………………………….……………………….……………… Difference……………………………………………….……………………………………… ………………………………………………………….……………………….……………… ……………………………………………………………………………………..…………… …………………………………………………………………………………….………… [4]
(ii) Explain why the fungal lactase will only work in the stomach but not in the small
intestine.
…………………………………………………………………………………..……………… ………………………………………………………………………………………..………… ………………………………………………………………………………………..………… …………………………………………………………………………………………..……… …………………………………………………………………………………………..……… ……………………………………………………………………………………….……… [3]

5
© RI 2018 Preliminary Examination 9744/03 [Turn over
For Examiner’s
Use
(d) To determine if the fungal lactase can reduce the symptoms of lactose intolerance, 100 lactose-intolerant participants took part in a H2 breath test. All the participants were given 500 mL of milk during the test. Following that, they were divided into 3 groups: 1 group was given a placebo (0 ALU of lactase). The other 2 groups were given low dosage (4625 ALU) and high dosage (7700 ALU) of lactase, respectively. The graph in Fig. 1.3 shows the results of the H2 breath test.
Fig. 1.3
(i) With reference to Fig. 1.3, discuss the effectiveness of lactase treatment in reducing the symptoms of lactose intolerance.
………………………………………………………………………………………………...… ……………………………………………………………………………………………...…… ………………………………………………………………………………………………...… ……………………………………………………………………………………………...…… ………………………………………………………………………………………...………… …………………………………………………………………………………………….… [3]
(ii) Explain the shape of the graph for the group given placebo.
…………………………………………….……..……………………………………………… …………………………………………….……..……………………………………………… ………………………………………………..…………………………….…………………… …………………………………………………….………………………………………… [2]

6
© RI 2018 Preliminary Examination 9744/03
For Examiner’s
Use
(iii) The participants are required to fast for 12 hours from milk-containing food as a prerequisite for doing the H2 breath test. A participant who did not fast from milk-containing food is given the low dosage (4625 ALU) of lactase. He drank milk 4 hours before the H2 breath test. Draw on the graph in Fig. 1.3, the results obtained from this participant’s test. [1]
(e) In most mammals, including 65% of humans, the level of lactase mRNA found in the
intestinal epithelial cell is greatly decreased in adults. Describe a mechanism that accounts for this age-dependent lactase regulation during
adulthood.
………………………………………………………………..………………………………………… ……………………………………………………………………..…………………………………… ……………………………………………………………………………..…………………………… ……………………………………………………………………………………………………… [2]
(f) Some individuals, however, are lactase-persistent (LP). They maintain high levels of lactase
expression throughout adult life and hence remain tolerant of lactose. LP is thought to have originated from a mutation. The pedigree in Fig. 1.4 shows the presence of lactase persistence of a family.
Fig. 1.4
(i) State the mode of inheritance of lactase persistence.
……………………………………………………………………………………………..… [1]
lactase-persistent

7
© RI 2018 Preliminary Examination 9744/03 [Turn over
For Examiner’s
Use
(ii) Explain how you arrived at your answer in (f)(i).
..………………………………………………………………………………………………… ..………………………………………………………………………………………………… ..………………………………………………………………………………………………… ..………………………………………………………………………………………………… ..………………………………………………………………………………………………… …………………………………………………………………………………..……………… ………………………………………………………………………………..………………… …………………………………………………………………………………….………… [4]
(g) A single nucleotide polymorphism (SNP) is found to exist between LP and non-LP
individuals. The SNP known as LCT−13910 has 2 alleles, T allele and C allele. The genotype of individuals at that SNP can be used to predict if they are lactase-persistent. The T allele is found in LP individuals who have higher levels of lactase. Individuals who carry the C allele have lower levels of lactase. In a RFLP assay of both the genetic variants, polymerase chain reaction was used to amplify both the T and C alleles. Each allele resulted in a 448 bp product. The amplified products were digested with restriction enzyme BsmFI. It produced two fragments (351 and 97 bp) for the C allele, and three fragments (253, 98 and 97 bp) for the T allele.
Fig. 1.5 shows a gel with the results of the RFLP analysis for an individual who is
homozygous for the T allele. Draw on Fig. 1.5 to show the results of the banding patterns of individuals II 5 and III 1 from Fig. 1.4.
Fig. 1.5
[2] [Total: 27]
Position of wells
TT II 5 III 1

8
© RI 2018 Preliminary Examination 9744/03
For Examiner’s
Use
2 Dengue fever is a mosquito-borne disease caused by the dengue virus. Dengue is transmitted by several species of mosquito, including Aedes aegypti. Symptoms such as high fever, headache, vomiting, muscle and joint pains, and a characteristic skin rash, typically begin three to fourteen days after infection. The disease can develop into the life-threatening dengue hemorrhagic fever. A number of tests are available to confirm the diagnosis of dengue fever. This includes the Enzyme Linked Immunosorbant Assay (ELISA) which detects the presence of a patient’s immunoglobulin (Ig) produced against the dengue virus’ non-structural-1 protein (NS-1). This process takes about 3 hours. Fig. 2.1 shows the principle of ELISA.
Fig. 2.1
(a) Explain how the structure of the patient’s Ig enables its binding to the NS-1 that coats the
wells of the polystyrene plates.
..………………………………………………………………………………………………………… …………………………………………………………………………………..……………………… ………………………………………………………………………………..………………………… ……………………………………………………………………………………………………… [2]
Dengue virus NS-1
Patients’ Ig against NS-1
Secondary antibody against human Ig tagged with enzyme
Substrate catalysed by enzyme on secondary antibody to produce blue colouration
1.Coating of the wells on polystyrene plates with dengue NS-1.
2.The patients’ serum which may contain Ig against NS-1 is added to the well.
3. A secondary antibody that binds to human Ig is added to the wells.
4.The enzyme on the secondary antibody catalyses conversion of substrate to produce a blue compound, which is then quantified using a spectrophotometer.

9
© RI 2018 Preliminary Examination 9744/03 [Turn over
For Examiner’s
Use
(b) ELISA allows detection for the presence of patients’ Ig. It also allows the quantification of the concentration of human Ig against NS-1. With reference to Fig. 2.1 and using your knowledge of enzymes, explain how the process of ELISA allows quantification of the concentration of human Ig against NS-1.
…………………………………………………………….…………………………………………… ………………………………………………………………….……………………………………… …………………………………………………………….…………………………………………… ………………………………………………………………….……………………………………… …………………………………………………………………………….…………………………… ……………………………………………………………………………………………………… [3]
(c) An alternative test is the quantitative polymerase chain reaction (qPCR) that detects the
presence of dengue viral RNA. The principles of qPCR is similar to normal PCR except that it uses RNA as a template. In qPCR, SYBR® Green is added to the reaction mix. Interaction between SYBR® Green with the PCR products produces green fluorescence, which can be detected. Fig. 2.2 shows the primer annealing and extension phases of qPCR.
Fig. 2.2
(i) Describe one characteristic of primers used and how it facilitates qPCR.
..………………………………………………………………………………………………… …………………………………………………………………………………..……………… ………………………………………………………………………………..………………… …………………………………………………………………………………….………… [2]
Primer annealing (56oC)
Extension (72oC)
SYBR® Green
Taq polymerase
Viral RNA
Primer
SYBR® Green
fluoresces

10
© RI 2018 Preliminary Examination 9744/03
For Examiner’s
Use
(ii) Suggest how SYBR® green interacts with the PCR products.
………………………………………………………………………………..………………… …………………………………………………………………………………….………… [1]
(d) qPCR is performed in a thermocycler that measures the fluorescence in the tube over a
number of cycles. If the level of fluorescence is above the threshold level (4 A.U.), it is considered a positive test. Fig. 2.3 shows the changes in the fluorescence level over 30 cycles.
Fig. 2.3
(i) Explain the purpose of including the control with no RNA.
………………………………………………………………………………..………………… …………………………………………………………………………………….………… [1]
(ii) If a typical qPCR cycle takes 3 minutes, calculate the minimum time taken to report a
positive result.
Minimum time taken is …………………… [2]
Threshold level

11
© RI 2018 Preliminary Examination 9744/03 [Turn over
For Examiner’s
Use
(iii) Suggest why qPCR is a better test compared to ELISA.
………………………………………………………………………………..………………… ………………………………………………………………………………..………………… ………………………………………………………………………………..………………… …………………………………………………………………………………….………… [2]
(e) Factors affecting the transmission of dengue are being closely monitored.
Singapore is not insulated from the effects of global warming. Fig. 2.4 shows the annual average temperature in the past 70 years.
Fig. 2.4
With reference to Fig. 2.4,
(i) describe and explain the temperature trends in Singapore from 1974 to 2017,
…………………………………………………………………………………………..……… ………………………………………………………………………………………..………… ………………………………………………………………………..………………………… ……………………………………………………………………….……………………… [2]

12
© RI 2018 Preliminary Examination 9744/03
For Examiner’s
Use
(ii) explain the impact of climate change on transmission of dengue in Singapore.
…………………………………………………………………………………………..……… ………………………………………………………………………………………..………… …………………………………………………………………………………..……………… ………………………………………………………………………………….…………… [2]
As it is situated near the equator, Singapore’s climate is characterised by high
temperatures, rainfall and humidity all year-round. However, there exists slight variations within the months. The figures below show the variations in temperature (Fig. 2.4a) and rainfall (Fig. 2.4b) over the months in the year of 2015.
Fig. 2.4a
Fig. 2.4b

13
© RI 2018 Preliminary Examination 9744/03 [Turn over
For Examiner’s
Use
(iii) It has been observed that there are higher incidences of dengue infections reported between June to October. With reference to Fig. 2.4a and 2.4b, and the information given above, comment on the aspect of climate which has a greater influence on dengue transmission in Singapore.
………………………………………………………………………………………………..… ………………………………………………………………………………………..………… ………………………………………………………………………………………..………… …………………………………………………………………………………………….… [2]
(f) In order to decrease dengue transmission, studies have been conducted to find a suitable
method of control of the Aedes mosquito population. One such method implemented recently was the use of Wolbachia, a bacteria common in insect species, to control the mosquito population. Wolbachia infection in mosquitoes are maternally transferred, and mosquitoes carrying the Wolbachia bacteria are unable to transmit the dengue virus. Fig. 2.5 shows the crosses of Wolbachia-infected mosquitoes.
Fig. 2.5
When a male Wolbachia-infected mosquito mates with a wild-type female mosquito, the female mosquito lays eggs which are unable to hatch, due to a phenomenon known as cytoplasmic incompatibility. A scientist hypothesised the following to explain cytoplasmic incompatibility: after fertilisation, condensation of paternal chromosomes in the zygote is prevented.

14
© RI 2018 Preliminary Examination 9744/03
For Examiner’s
Use
(i) Given the above information, explain how nuclear division may be affected.
…………………………..……………………………………………………………………… …………………………………………..……………………………………………………… …………………………………………………..……………………………………………… …………………………………………………….………………………………………… [2]
(ii) Different Wolbachia strategies have been implemented to control the spread of
mosquito-borne diseases. Some countries have opted for the release of both Wolbachia-infected males and female mosquitoes. However, Singapore has adopted the strategy to release only Wolbachia-infected male mosquitoes. Given the above information, justify Singapore’s choice to adopt the release of only Wolbachia-infected males.
…………………………………..………………………………………………………………. ……………………………..……………………………………………………………………. …………………………………..………………………………………………………………. ……………………………………………………………………………………….……… [2]
[Total: 23]
Section B
Answer one question in this section.
Write your answers on the separate answer paper provided. Your answers should be illustrated by large, clearly labelled diagrams, where appropriate.
Your answers must be in continuous prose, where appropriate. Your answers must be set out in sections (a), (b) etc., as indicated in the question.
3 (a) Account for the importance of hydrogen bonds in biological organisms. [13] (b) Discuss the diverse roles of membranes in a cell. [12] [Total: 25] 4 (a) Discuss how the complementary shapes between biomolecules enable eukaryotic cells
to carry out their diverse functions. [13] (b) Organisms are able to detect and respond to changes in their environments. Discuss
this, with reference to specific examples in unicellular and multi-cellular organisms. [12] [Total: 25]
End of Paper

©RI 2018 Preliminary Examination 9744/04 [Turn over
RAFFLES INSTITUTION 2018 Year 6 Preliminary Examination Higher 2
BIOLOGY 9744/04 Paper 4 Practical 24th August 2018
2 hours 30 minutes Candidates answer on the Question Paper.
Additional Materials: As listed in the Confidential Instructions.
READ THESE INSTRUCTIONS FIRST
Write your index number, CT group & name on all the work you hand in. Give details of the practical shift and laboratory, where appropriate, in the boxes provided. Write in dark blue or black pen on both sides of the paper. You may use a HB pencil for any diagrams or graphs. Do not use staples, paper clips, highlighters, glue or correction fluid. Answer questions 1 and 2 in the spaces provided on the Question Paper. Answer question 3 in the foolscap paper provided. The use of an approved scientific calculator is expected, where appropriate. You may lose marks if you do not show your working or if you do not use appropriate units. At the end of the examination, fasten all your work securely together. The number of marks is given in brackets [ ] at the end of each question or part of the question.
This document consists of 11 printed pages.
Raffles Institution Internal Examination
CIVICS GROUP
CANDIDATE NAME
INDEX NUMBER
8 S 0 3 1
For Examiner’s Use
1
2
3
Total
Shift
Laboratory

2
©RI 2018 Preliminary Examination 9744/04
Answer all the questions.
1 Glucose in solution reduces pink, acidified potassium manganate (VII) solution, P, to a colourless or slightly yellow solution at end-point.
The rate of the colour change depends on the concentration of the glucose solution. The greater the concentration of glucose solution, the faster the end-point is reached.
You are required to investigate the rate of colour change in five glucose solutions of different concentrations, W1 to W5, by finding the time taken to reach the end-point.
You are provided with the following:
30cm3 of glucose solutions, W1 to W5,
60cm3 of 1 mol dm-3 sulfuric acid, labelled S,
30cm3 of 0.04% potassium manganate (VII) solution, labelled P.
Sulfuric acid, S, and potassium manganate (VII) solution, P, are harmful. You are advised to wear the eye protection and gloves you have been given and wash off any spillages.
The 10cm3 syringe will need to be re-used with different solutions. Before re-using, wash the syringe thoroughly using distilled water provided, labelled washing water. Flush distilled water through the syringe and discard the waste into the container labelled waste.
Proceed as follows.
Stage 1
Label five boiling tubes, W1, W2, W3, W4 and W5.
Stage 2
Put 10cm3 of each glucose solution, W1, W2, W3, W4 and W5, into the correspondingly labelled boiling tube.
Put 5cm3 of solution S into each boiling tube.
Insert the rubber bung into boiling tube W1 and, with your finger holding the rubber bung in place, gently mix the solution in the boiling tube. Do not turn the boiling tube upside-down. Repeat for boiling tubes W2, W3, W4 and W5.
Stage 3
Start the stopwatch. The stopwatch should run continuously throughout the whole investigation. Do not stop the stopwatch until all start and end-point times for all glucose solutions have been recorded in stages 4, 5, 6, and 7.
Stage 4
Put 2cm3 of solution P in the boiling tube labelled W1. Immediately insert the rubber bung, mix well and record the start time in Table 1.1 on page 3. Record your readings in the following format, mm:ss, e.g. 2 minutes 15 seconds is recorded as 02:15.

3
©
©RI 2018 Preliminary Examination 9744/04 [Turn over
Stage 5
Repeat stage 4 with boiling tube W2, W3, W4 and W5. Record the start times in Table 1.1.
Stage 6
(a) Observe the boiling tubes W1, W2, W3, W4 and W5 and record, in Table 1.1, the time when each end-point is reached, using appropriate format. These are the raw data for Trial 1.
If the time taken to reach the end-point for any boiling tube is longer than 300 seconds, record ‘no change’. Complete the table to show the time taken, in seconds, to reach each end-point.
Table 1.1
Boiling tube W1 W2 W3 W4 W5 Start time
End time
Time taken to reach end-point /s
Stage 7
(b) In order to increase confidence in the data, repeat stages 1 to 6.
Record your results in Table 1.2, using appropriate format. These are the raw data for Trial 2. Complete the table to show the time taken, in seconds, to reach each end-point.
Table 1.2
Boiling tube W1 W2 W3 W4 W5 Start time
End time
Time taken to reach end-point /s
[4]

4
©RI 2018 Preliminary Examination 9744/04
(c) Prepare and complete a table in the space below to show the mean time taken to reach the end-point for each glucose solution.
[4]
(d) A sixth boiling tube should be set-up as a control. Describe how a control is set-up and explain
the reason for this.
…………………………………………………………………….………………………………………… …………………………………………………………….………………………………………………… …………………………………………………………………….………………………………………… …………………………………………………………….……………………………………………[2]

5
©
©RI 2018 Preliminary Examination 9744/04 [Turn over
(e) A student proceeded to repeat the experiment with known glucose concentrations. He recorded his results as shown below.
Present the above data in a graphical format.
Glucose concentration /% Time taken to reach end-point / s
5 115
10 88
15 62
20 36
25 10
.
[5]
(f) (i) Using the graph, estimate the concentration of solution W1.
Concentration of solution W1 : ……………………[1]

6
©RI 2018 Preliminary Examination 9744/04
(ii) Without extrapolating the graph, estimate the concentration of solution W5 using the
formula y = mx + c.
Show your working clearly, including how the values of m and c are calculated.
Concentration of solution W5 : ……………………[3]
[Total: 19]

7
©
©RI 2018 Preliminary Examination 9744/04 [Turn over
2 You are provided with a prepared slide showing a section of a root tip with cells at various stages of mitosis.
(a) Examine the slide carefully. Identify 2 cells at different stages of mitosis and make a large labelled drawing of each cell. Indicate the stage of mitosis for each of the cells drawn.
[6] A student viewed the slide under a microscope with a high-powered objective lens and measured the length of a chromosome using the eyepiece graticule. Fig. 2.1 shows the view that the student saw when looking down the microscope at the eyepiece graticule and the chromosome.
Fig. 2.1
Using a stage micrometer with 0.01mm divisions, the students found that the entire length of the eyepiece graticule on Fig. 2.1 matched 2 divisions on the stage micrometer.
(b)
Calculate the actual length of the chromosome shown in Fig. 2.1 in μm.
…………………………… μm [3]
chromosome

8
©RI 2018 Preliminary Examination 9744/04
(c) Using the slide provided, select a region with 100 actively dividing cells. As a guide, the region should contain cells in at least 2 different stages of the mitotic cell cycle. Count the number of cells in each stage of the mitotic cell cycle. Repeat the count for another chosen field of view.
(i) Prepare and complete a table in the space below to show the percentage of cells in each
stage of the mitotic cell cycle.
[5]
(b) The percentage of cells observed in each stage can be used to infer the duration of the stage.
(i) State the longest stage of the cell cycle and explain how you arrived at your conclusion. ………………………………………………………………………………….…………………… ………………………………………………………………………………….…………………… ………………………………………………………………………………….…………………… …………………………………………………………………………………….…………….. [2]
(ii) A student commented that an additional piece of information is required to estimate the duration of each stage. State what is this piece of information. ………………………………………………………………………………….…………………… …………………………………………………………………………………….…………….. [1]

9
©
©RI 2018 Preliminary Examination 9744/04 [Turn over
(iii) Another student commented that this method of estimating the duration of each stage has a huge margin of error. Other than the absence of 3 replicates, suggest why it is so and describe how you can improve on the accuracy of the results obtained. ………………………………………………………………………………….…………………… ………………………………………………………………………………….…………………… ………………………………………………………………………………….…………………… …………………………………………………………………………………….…………….. [2]
(c) In another experiment, the effect of temperature on cell division in root tips was investigated.
Samples of root were grown at T1 (20oC) and T2 (40oC). 200 cells were randomly selected and the number of dividing cells was recorded in Table 2.1.
The number of dividing cells in a random selection of 200 T1 (20oC) T2 (40oC)
22 69 46 48 35 58 33 53 20 67 28 42 37 72 31 57 39 68 23 49
Table 2.1
A t-test was used to find out about the nature of the difference in the number of dividing cells at T1 and T2. The calculated t-value is 6.423.
Using the formula and the probability table provided, state the conclusion can be drawn from this t-test.
……………………………………………………………………..………………….…………………… ……………………………………………………………………..………………….…………………… ……………………………………………………………………..………………….…………………… ……………………………………………………………………..………………….…………………… ……………………………………………………………………..………………….…………………… ……………………………………………………………………...…………………….…………….. [3]

10
©RI 2018 Preliminary Examination 9744/04
[Total: 22]

11
©
©RI 2018 Preliminary Examination 9744/04 [Turn over
3 Phosphatases are enzymes that catalyse the removal of phosphate groups from certain types of organic phosphate.
The principle of the reaction involving phenolphthalein diphosphate (XP) catalysed by phosphatase is as follows.
XP X + Pi
When colourless phenolphthalein diphosphate (XP) is catalysed by phosphatase enzyme, phenolphthalein (X) is released. Phenolphthalein then reacts with sodium carbonate giving a pink colouration. The colour intensity can be measured using a spectrophotometer and readings are obtained in absorbance value/A.
It is known that Q, an organic compound, is an inhibitor of phosphatase. Using the list of apparatus below, design an experiment to determine if Q is a competitive or a non-competitive inhibitor. Reagents and apparatus • 10% Solution of XP • 5% Phosphatase solution • 5% Inhibitor solution Q • 5% sodium carbonate solution • pH buffer (pH 7) • Distilled water • 10 cm3, 5 cm3 and 1 cm3 syringes • Glass rods • Test tubes and rack • Cuvettes • Spectrophotometer • Normal laboratory glassware, e.g. beakers, measuring cylinders, graduated pipettes, glass
rods, etc. Your plan should :
• have a clear and helpful structure such that the method you use is able to be repeated by anyone reading it.
• be illustrated by relevant diagrams, if necessary, to show for example the arrange of the apparatus used.
• identify the appropriate variable. • describe the method with the scientific reasoning used to decide the method so that the
results are as accurate and repeatable as possible. • include layout of results tables and graphs with clear headings and labels. • use the correct technical and scientific terms. • include reference to safety measures to minimise any risk associated with the proposed
experiment.
[Total: 14]
-END-
Phosphatase
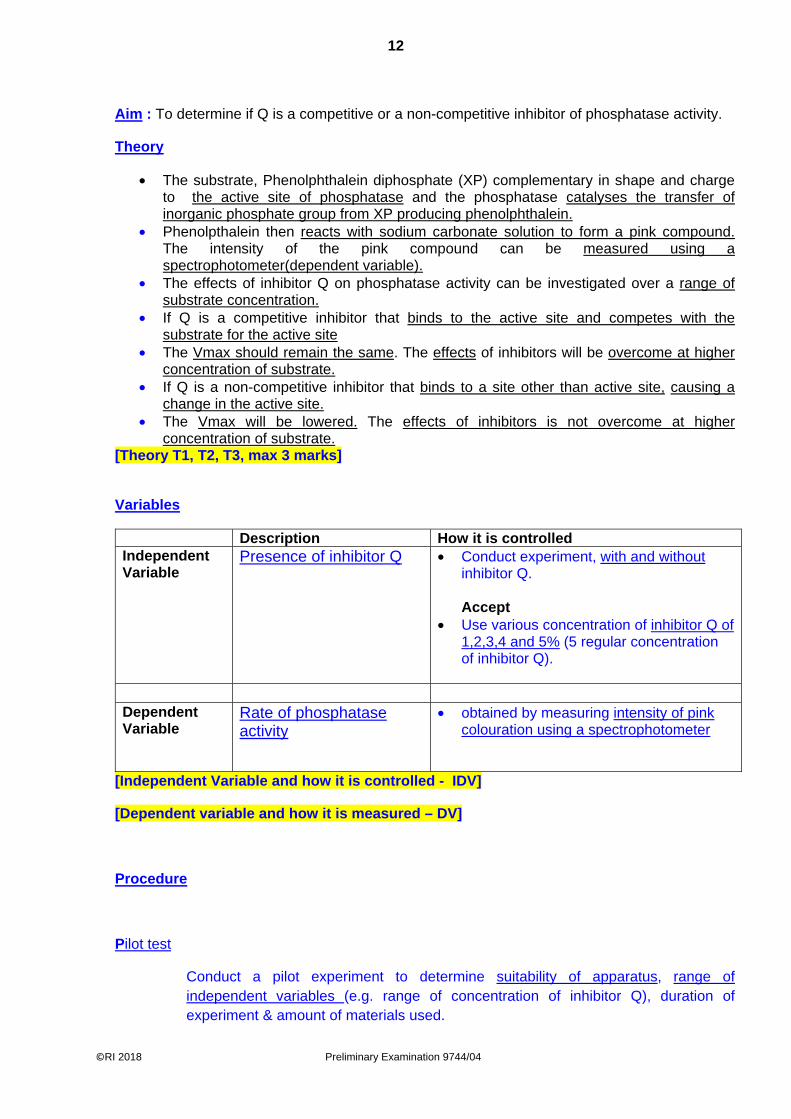
12
©RI 2018 Preliminary Examination 9744/04
Aim : To determine if Q is a competitive or a non-competitive inhibitor of phosphatase activity.
Theory
• The substrate, Phenolphthalein diphosphate (XP) complementary in shape and charge to the active site of phosphatase and the phosphatase catalyses the transfer of inorganic phosphate group from XP producing phenolphthalein.
• Phenolpthalein then reacts with sodium carbonate solution to form a pink compound. The intensity of the pink compound can be measured using a spectrophotometer(dependent variable).
• The effects of inhibitor Q on phosphatase activity can be investigated over a range of substrate concentration.
• If Q is a competitive inhibitor that binds to the active site and competes with the substrate for the active site
• The Vmax should remain the same. The effects of inhibitors will be overcome at higher concentration of substrate.
• If Q is a non-competitive inhibitor that binds to a site other than active site, causing a change in the active site.
• The Vmax will be lowered. The effects of inhibitors is not overcome at higher concentration of substrate.
[Theory T1, T2, T3, max 3 marks]
Variables
Description How it is controlled Independent Variable
Presence of inhibitor Q
• Conduct experiment, with and without inhibitor Q. Accept
• Use various concentration of inhibitor Q of 1,2,3,4 and 5% (5 regular concentration of inhibitor Q).
Dependent Variable
Rate of phosphatase activity
• obtained by measuring intensity of pink colouration using a spectrophotometer
[Independent Variable and how it is controlled - IDV]
[Dependent variable and how it is measured – DV]
Procedure
Pilot test
Conduct a pilot experiment to determine suitability of apparatus, range of independent variables (e.g. range of concentration of inhibitor Q), duration of experiment & amount of materials used.

13
©
©RI 2018 Preliminary Examination 9744/04 [Turn over
Numbered steps
Preparation of inhibitor solution
1. Using 10cm3 syringe, prepare 5 different concentrations of XP solution by following the dilution table below: (independent variable)
Concentration of XP solution /%
Volume of 10% XP solution used /cm3
Volume of distilled wused /cm3
2 2.0 8.0 4 4.0 6.0 6 6.0 4.0 8 8.0 2.0
10 10.0 0.0 [Dilution table, DT]
Preparation of enzyme reaction
2. Set up a water bath of 370C, using hot and cold water, and use a thermometer to monitor temperature. (constant variable, temperature)
3. Place inhibitor Q solution, XP solution and phosphatase solution seperately into the water bath and allow 1 min of equilibration time, so that solutions can attain temperature of water bath. (Equilibration time, ET)
4. Using a syringe add 1 cm3 of 2%, 4%, 6%, 8% and 10% XP solution to labelled test tubes. (range of substrate concentration)
5. Add 1 cm3 of 5% inhibitor Q solution to each test tube (independent variable, inhibitor Q)
6. Add 1 cm3 of 5% Phosphatase solution to each test tube. Mix well and incubate the mixture in the water bath. (constant variable, concentration of enzyme) (constant variable, volume of enzyme)
7. After 5 minutes, (constant variable, reaction time) transfer 1cm3 of reaction mixture (constant variable, volume of sample used to measure A) into a cuvette and measure the absorbance value/colour intensity of the pink solution using a spectrophotometer.(dependent variable, Absorbance of solution)
8. Repeat Step 3-8 using distilled water instead of inhibitor solution. 9. Record the colour intensity in absorbance value (A) for each concentration of inhibitor
Q solution in a table format. 10. Plot a graph of colour intensity in absorbance value/A against concentration of
inhibitor solution. [Controlled variable and how it is controlled CV1, CV2, CV3, max 3 marks]
[Equilibration time, ET]
Control
• Keep all variables constant, set up control experiment using distilled water instead of solution of inhibitor Q.
• This is to obtain baseline results, in the absence of inhibitors. [Controls and purpose, C]
14
©RI 2018 Preliminary Examination 9744/04
Repeats & replicates
• Conduct 3 replicates for each condition to check that no anomalies are present • Repeat entire experiment twice to check for reproducibility. [Repeat and replicates, RR]
Data Recording and Processing
Record and process data as follows: (table and graph should have same heading / unit)
Concentration of XP /%
Absorbance/A
With inhibitor Q Without inhibitor Trial
1 Trial
2 Trial
3 Average Trial
1 Trial
2 Trial
3 Average
2 4 6 8 10
[Data table : DT]
Graph showing effect of inhibitor Q on the rate of phosphatase activity at various concentration of substrate
[Expected graphs :G]
[Explanation of how to interpret graph to draw conclusion : I]
Risks & precautions
1. Wear gloves and goggles when handling XP solution, inhibitor Q solution and phosphatase solutions as they may be toxic.

15
©
©RI 2018 Preliminary Examination 9744/04 [Turn over
2. Do not touch electrical switch of the spectrophotometer with wet hands to prevent electrocution.
3. Wear oven mittens / insulating gloves when handling hot water to avoid scalding. [Description of Risk and Precautions]

-1
Apparatus and Reagents List All students will have (for Question 1): 1) Solutions W1, W2, W3, W4, W5, S, P 2) Boiling tubes (x5) 3) 10ml syringe (x1), 5ml syringe (x1), 3ml syringe (x1) Students doing Question 1 (without microscope): 1) Boiling tube rack (x1) 2) Beaker (x1) labelled “washing water” 3) Beaker (x1) labelled “waste” 4) Rubber bung (x5) 5) Safety Goggles 6) White paper 7) Stop Watch 8) Marker 9) Marker remover Students doing Question 2 (with microscope): 1) Light Microscope, and 2) Microscope Slide
On teachers’ bench 1) Gloves 2) Lens Cleansing Solution 3) Lens Paper
Solutions for each student: W1: 10% glucose solution (60cm3) W2: 20% glucose solution (60cm3) W3: 6% glucose solution (60cm3) W4: 15% glucose solution (60cm3) W5: 8% glucose solution (60cm3) S: 1 mol dm-3 sulfuric acid (90cm3) P: 0.04% potassium manganate (VII), KMnO4 (30cm3)