biological values of different types of brazilian...
TRANSCRIPT
Greener Journal of Agricultural Sciences, vol. 8, no. 5, pp. 090-099, May 2018
Greener Journal of Agricultural Sciences
Vol. 8(5), pp. 090-099, May, 2018
ISSN: 2276-7770; ICV: 6.15
Copyright ©2018, the copyright of this article is retained by the author(s)
DOI Link: http://doi.org/10.15580/GJAS.2018.5.033118054
http://gjournals.org/GJAS
Biological Values of different Types of Brazilian Propolis
Maria Cristina Affonso Lorenzon1*, Rosane Nora Castro2, Lucas de Oliveira Pires2, Adriano Soares Koshiyama3,
Kayo José Bardasson Bento4
1Universidade Federal Rural do Rio de Janeiro/UFRRJ, Instituto de Zootecnia/IZ, LaboratórioAbelha-Natureza, UFRRJ, km 7, Rod. 465, Seropédica, RJ, Brasil, CEP 23.890-000.
2Universidade Federal Rural do Rio de Janeiro/UFRRJ, Instituto de CiênciasExatas /ICE, km 7, Rod. 465, Seropédica, RJ, Brasil, CEP 23.890-000.
3University College London, Department of Computer Science, Gower St, London WC1E 6BT, England.
4Universidade Federal Rural do Rio de Janeiro/UFRRJ, Instituto de CiênciasExatas/ICE, UFRRJ, km 7, Rod. 465, Seropédica, RJ, Brasil, CEP 23.890-000.
E-mails:[email protected],2noraufrrj @gmail.com, 3luucasoliv@ outlook.com, 4as.koshiyama
@gmail.com, 5kayo_bardasson@ hotmail.com
ARTICLE INFO ABSTRACT
Article No.:033118054
Type: Research
DOI: 10.15580/GJAS.2018.5.033118054
The aim of this work was to investigate the organic proprieties in different kinds of ethanolic extracts directly from the market and prepared from raw propolis. The raw propolis was obtained by scraping it from the hives (type 1) and by using a collector to obtain it in strips (type 2). The analysis of phenolic and flavonoid contents was performed, and the oxidative index was obtained. The raw propolis obtained in cities of Southeastern Brazil presented a balsamic aroma, a dark green brownish color was predominant and the consistency was hard or malleable; its origin is from wild flora. Our study pointed out the high variation with on the organic value of propolis, which is a barrier to define a pattern from different types. Type 1 propolis, the easiest to collect, needs some care in good practices, and the commercial extracts need quality control.
Submitted: 31/03/2018
Accepted: 03/05/2018
Published: 28/05/2018
*Corresponding Author
Maria Cristina Affonso Lorenzon
E-mail: affonsoneta @gmail.com,
lorenzon_ufrrj@ yahoo.com.br
Keywords: Apis mellifera, beekeeping,
quality control, management
Lorenzon et al / Greener Journal of Agricultural Sciences 91
INTRODUCTION Propolis is a complex mixture prepared by bees within their hives as a protective barrier used for thermal insulation and, microbiological control (Castaldo and Capasso, 2002; Funakoshi-Tago et al., 2015). This product shows peculiar physico-chemical characteristics and biological proprieties, which are essential to bee life. It is produced in the hive from resinous, gummy and balsamic substances collected by the bees from various materials (leaves, buds, floral buds and plant secretions) from different plant species. After these components have been harvested in the field, they are assembled inside the colony where they are supplemented by varying amounts of wax, pollen, salivary secretions and enzymes (Athikomkulchai et al., 2013).
Since proprolis plays an important role on disease prevention regarding bee health, this knowledge has leveraged the application of this natural product for human therapies for centuries (Castaldo and Capasso, 2002; Wang et al., 2013; Freires et al., 2016; Rufatto et al., 2017). The biological proprieties of propolis are often related to the presence of polyphenolic substances, mainly of the class of phenylpropanoids and several classes of flavonoids; the quantification and identification of such substances are considered standards for evaluating the quality of propolis worldwide (Huang et al., 2014).
More than 300 chemical compounds have already been identified in different kinds of propolis, give them extremely variable characteristics and biological value (Pereira et al., 2015; Salgueiro and Castro, 2016). The vegetation is the determining factor in the chemical composition of propolis and it has direct action on the profile of the substances, while the extrinsic factors such as climate, seasonality, production season, and genetic variability of the beehive are also involved (Sforcin and Bankova, 2011). In addition, the method of harvesting, handling and storage may affect the profile of substances in propolis, as well as the natural quality of its properties.
In general, beekeepers use to harvest propolis from points where the bees seal the hive with this material. The most traditional and rudimentary method to harvest propolis is by scraping the propolis from certain parts of the hive. When this method is pursued, it is essential that good practices are put in place during the procedure to prevent impurities from mixing with the propolis. Other producers choose to obtain this product in strips or bands by means of a collecting net above the honey supers or, though adapted collectors under the outer cover. In Brazil, people use traps. The traps leave a substantial space in the supers for bees to fill up with propolis in a short period of time, and even though the final product does not have important impurities; during this time the colony suffers great stress due to exposure to the
environment. For the bee hive, the production of propolis ensures its survival, with the trade-off substantial energy consumption. Hence, this production requires special care to improve its harvesting, to maintain its quality and to preserve the sanity of the bees (Ghisalberti, 1979).
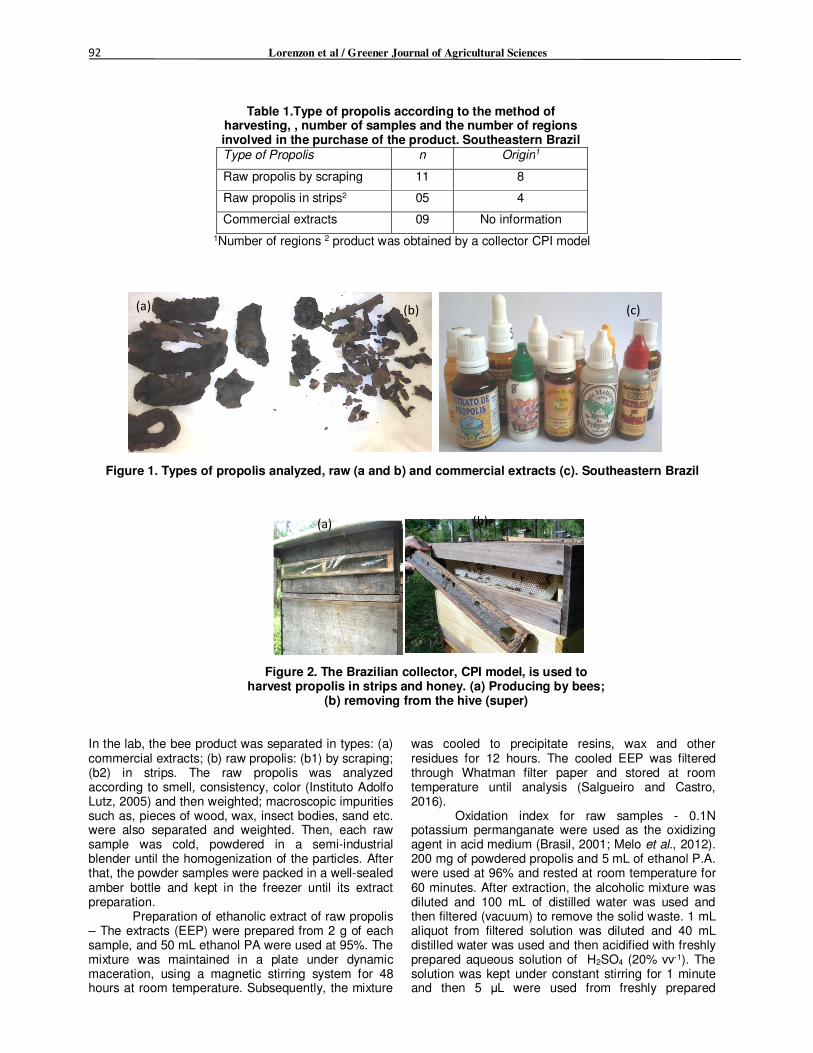
The production of Brazilian propolis lies somewhere between 49 and 150 tons per year. Consensus ranks Brazil as the third largest world producer (Salgueiro and Castro, 2016; Lima et al., 2016), attracting the attention of the international market such as Japan, whose consumption of alcoholic extracts reach up to 92%. Currently, most researches focus on the phytochemical characterization of propolis and its biological properties (Pereira et al., 2013. Bogdanov et al., 2014; Pereira et al., 2015; Naggar et al., 2016; Rufatto et al., 2017) and, in another scope, studies related to how to optimize the harvesting and extraction processes and also quality control of propolis are highlighted (Machado et al., 2016). To stimulate rational production, this study is aimed at evaluating samples of propolis by the analysis of polyphenolic substances (phenolic acids and flavonoids), relating the data with different methods of harvesting, to test if these methods affect the chemical profile of the samples. Such topic is utmost interest to producers and consumers, as well as to exporters and foreign buyers of Brazilian propolis. METHODOLOGY Over a period of 18 months, twenty five samples of propolis belonging to Africanized honey bees (Apis mellifera L.) were purchased from apiaries in eight regions of the state of Rio de Janeiro, in the Southeast region of Brazil. The types of propolis purchased were raw and hydroalcoholic extract (table 1). All raw samples varied according to the method of harvesting used by beekeepers (Papotti et al., 2010; Bankova et al.,2016): (a) propolis in pieces of irregular sizes, obtained by scraping internal parts of hives (Langstroth model) (type1); (b) propolis in stardardized pieces (in strips) (type 2), obtained from a trap called “intelligent collector of propolis” (CPI), placed above the honey supers; this model of trap has standardized spaces which are filled up by bees (Figures 1 and 2). During the purchase of raw propolis, the beekeepers informed that this production varies according to the season (commonly between July and September) and the storage of propolis varied between one week and one year. Before the analytical procedures, the samples were properly waterproofed and lightproofed with black plastic and stored in the freezer. By analyzing the labels of the commercial extracts of propolis there was no information about the harvest and concentration.
92 Lorenzon et al / Greener Journal of Agricultural Sciences
Table 1.Type of propolis according to the method of harvesting, , number of samples and the number of regions involved in the purchase of the product. Southeastern Brazil Type of Propolis n Origin1
Raw propolis by scraping 11 8
Raw propolis in strips2 05 4
Commercial extracts 09 No information 1Number of regions 2 product was obtained by a collector CPI model
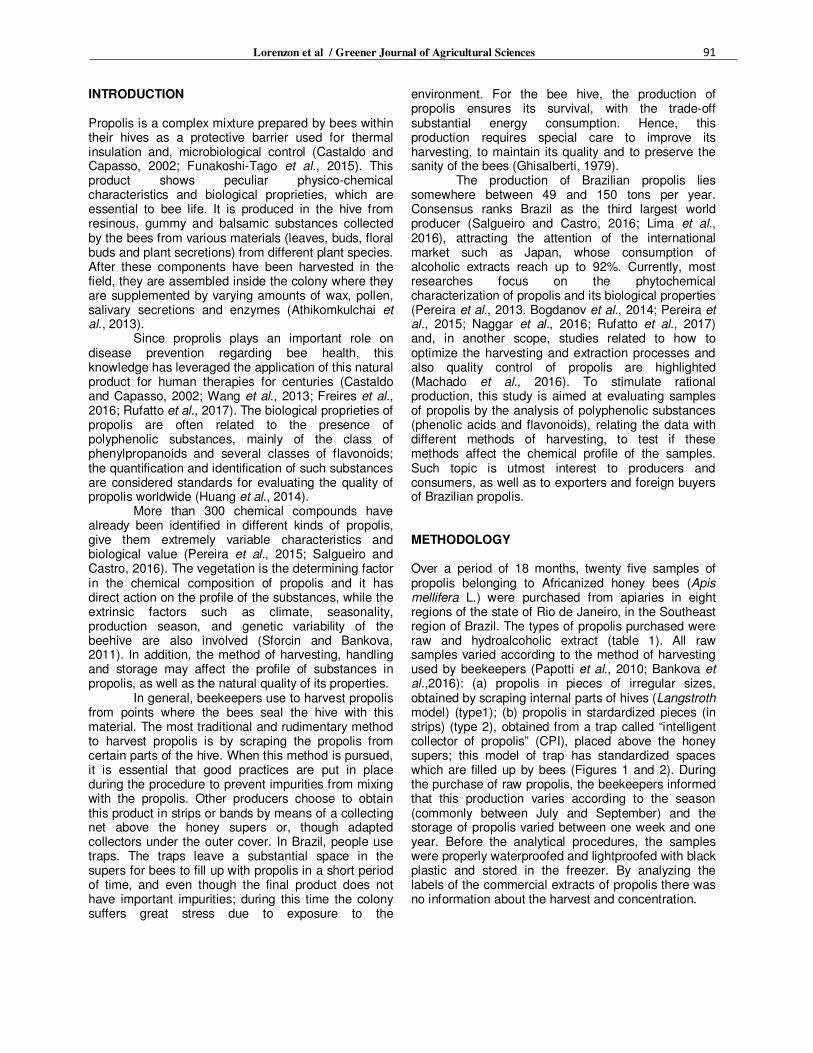
Figure 1. Types of propolis analyzed, raw (a and b) and commercial extracts (c). Southeastern Brazil
Figure 2. The Brazilian collector, CPI model, is used to harvest propolis in strips and honey. (a) Producing by bees;
(b) removing from the hive (super) In the lab, the bee product was separated in types: (a) commercial extracts; (b) raw propolis: (b1) by scraping; (b2) in strips. The raw propolis was analyzed according to smell, consistency, color (Instituto Adolfo Lutz, 2005) and then weighted; macroscopic impurities such as, pieces of wood, wax, insect bodies, sand etc. were also separated and weighted. Then, each raw sample was cold, powdered in a semi-industrial blender until the homogenization of the particles. After that, the powder samples were packed in a well-sealed amber bottle and kept in the freezer until its extract preparation.
Preparation of ethanolic extract of raw propolis – The extracts (EEP) were prepared from 2 g of each sample, and 50 mL ethanol PA were used at 95%. The mixture was maintained in a plate under dynamic maceration, using a magnetic stirring system for 48 hours at room temperature. Subsequently, the mixture
was cooled to precipitate resins, wax and other residues for 12 hours. The cooled EEP was filtered through Whatman filter paper and stored at room temperature until analysis (Salgueiro and Castro, 2016).
Oxidation index for raw samples - 0.1N potassium permanganate were used as the oxidizing agent in acid medium (Brasil, 2001; Melo et al., 2012). 200 mg of powdered propolis and 5 mL of ethanol P.A. were used at 96% and rested at room temperature for 60 minutes. After extraction, the alcoholic mixture was diluted and 100 mL of distilled water was used and then filtered (vacuum) to remove the solid waste. 1 mL aliquot from filtered solution was diluted and 40 mL distilled water was used and then acidified with freshly prepared aqueous solution of H2SO4 (20% vv-1). The solution was kept under constant stirring for 1 minute and then 5 µL were used from freshly prepared
(a) (b) (c)
(a) (b)
Lorenzon et al / Greener Journal of Agricultural Sciences 93
aqueous solution of K2MnO4 0.1 mol.L-1 . A stopwatch was used to measure the time required to discolor the solution of permanganate (from a purple color to yellow). In the evaluation of the oxidation index, values up to 22 seconds indicate antioxidant activity.
Total phenolic content for propolis extracts (TP) - This analysis was made for EEP and EEC extracts (prepared ethanolic and commercial extracts, respectively). The Folin–Ciocalteu method was used to determine the total phenolic content (Singleton et al., 1999; Salgueiro and Castro, 2016). The volume of 50 µL extract (1.0 mg.mL-1 in methanol) was mixed with 2.5 mL aqueous solution of Folin-Ciocalteu reagent (10% vv-1); then 2.0 mL of Na2CO3 (4% p v-1) were added. After incubation at 50°C for 5 minutes, the absorbance of the reaction mixture was measured at 760 nm against a water Milli-Q blank (UV-vis spectrophotometer). Gallic acid (0–0.100 mg mL-1) was used as a standard to produce the calibration curve (Y=0.12951*X + 0.12497, R = 0.999). The mean of three readings was used, and the total phenolic content was expressed in mg of gallic acid equivalent per honey per 100 milligrams of extract (mg GAE 100 mg-1).
Total flavonoid content for propolis extract (TF) -This analysis was performed for EEP and EEC extract (prepared ethanolic and commercial extracts, respectively). The total flavonoid content was estimated using the aluminum chloride colorimetric method (Mihai et al., 2012; Salgueiro et al., 2014; Salgueiro and Castro, 2016). An aliquot of 400 µL from the extract (1.0 mg mL-1 in methanol) and 200 µL of 2% methanolic aluminum chloride hexahydrate (AlCl3.6H2O) were mixed in a volumetric flask containing 5 mL of methanol. The volume was adjusted to 10 mL with spectroscopic methanol and the mixture was incubated for 30 minutes at room temperature. Then, absorbance was measured at 430 nm against a methanol blank. The flavonoid content of the extracts was compared against the quercetin standard (0-0.01 mg.mL-1) calibration curve (Y= 0.04078*X + 0.06553, R = 0.999). The mean of three readings was used and the total flavonoid content was expressed as milligrams of quercetin equivalent per 100 milligrams of extract (mg QE 100mg-1).
Statistical analysis - An exploratory analysis was conducted to understand the contents of phenolic, the contents of flavonoids and oxidative index under different types of propolis. This exploratory evaluation included histograms for distribution analysis, factor plots for location and dispersion assessment, and two-tail t-tests to check whether the average of a measurement under a condition (e.g., phenolic content
from commercial extract) is different from another (e.g., phenolic content from prepared ethanolic extract). All analyses were performed using the statistical software R (R Core Team, 2017). RESULT AND DISCUSSION Sensorial analysis of propolis In general, most raw propolis samples had balsamic and strong aroma, the dark-green brownish color predominated. The consistency is the characteristic that varies mostly among the samples: some are hard when there is some resistance to break the pieces manually, others are malleable, and gummy, soft to the touch, especially the ones in strips (type 2), which makes it difficult to macerate; a few were powdery. According to beekeepers, the majority of the samples result from the mixture of types of propolis, obtained in different seasons, with variation in time and storage conditions.
Propolis residues appeared only in eight of the eleven samples obtained by scraping (type 1), varied substantially, between 5 and 546 grams of residues (112.6 ±179.78 g). The main residues are powder and bodies of insects. The presence of powder indicated that the product has been stored improperly and has been attacked by wax moth (Galleria spp.); the carapace of insects must be from bees, a sign that bees have been crushed in the hive closure. Biological value of extracts The total phenolic content (TP), which deals with the sum of prepared and commercial ethanolic extracts (EET = PEE + CE) (table 2), reveals considerable variation in the sampling, the minimum and maximum contents are 0.92 and 122.68 mg GAE 100 mg-1, respectively. Analyzing the extracts, PEE and CE (Table 2) have great variation of TP; for PEE, TP contents range from 0.92 to 73.94 mg GAE 100mg-1, the average is 10.05; for CE, TP contents range from 2.74 to 122.68 mg GAE 100 mg-1, a variation much greater than that of PEE, and the average is 11.81. The total flavonoid contents (TF) range from 0.16 to 10.84 mg QE 100 mg-1. For PEE, TF contents range from 3.35 to 10.84 mg QE 100 mg-1, and the average is 7.26.; for CE, TF contents range between 0.16 and 9.13 mg QE 100mg-1, and the average is 5.27 (table 2), there were two samples no detectable flavonoid substances (zero).

94 Lorenzon et al / Greener Journal of Agricultural Sciences
Table 2. Exploratory analysis of the total phenolic (TP) and
flavonoid (TF) contents for prepared and commercial ethanolic extracts (PEE and CE, respectively). 2017.
Southeastern Brazil
Type Variable Median MAD N CIW
CE Phenolics content 11.81 9.41 27 3.682 CE Flavonoids content 5.27 1.65 18 0,788 PEE Phenolicscontent 10.05 4.43 48 1.298 PEE Flavonoids content 7.26 2.66 32 0.956 PEE Oxidative indices 5.50 2.03 45 0.615
TP – mg GAE 100-1mg from extract; TF– mg QE 100-1mg from extract; MAD – mean absolute deviation; CIW – confidence interval width from median.
Comparing the confidence intervals between the extracts prepared (PEE) and the commercial ones (CE) (Figure 3), apparently there is an overlap; thus, TP and TF do not differ significantly (p-value > 0.05) between the types of propolis tested.
The minimum and maximum oxidative indices are 2 and 9.81 seconds, they are well distributed, and the average is 5.50 seconds.
Figure 3. Confidence intervals: (a) phenolics contents (TP), (b) flavonoids contents (TF), (c) oxidation index (OI) for ethanolic extracts of propolis. Southeastern Brazil.
PEE – extract prepared from raw propolis; CE– commercial extracts. TP (mg GAE 100 mg-1extract); TF (mg QE 100mg-1extract); OI (seconds).
According to the Brazilian legislation (Brasil, 2001), the quality standard requires a minimum content of total flavonoids and phenolics contents. These values for raw propolis are 0.5% (mm-1) and 5.0% (mm-1), respectively. For the ethanolic extracts the values are 0.25% (mm-1) and 0.50% (mm-1), respectively. In our study, most of the samples show
values within the limits established by the current legislation for phenolic content, but 8% of commercial extracts (n = 2) show values less than 0.50% for total flavonoids, representing 22% in the total sampling. The maximum oxidation index is 22 seconds and all values of the study range within the limit proposed by legislation (Brasil, 2001) (table 3).
Table 3. Total phenolics (TP), total flavonoids (TF) and the oxidation index (OI) for prepared (type 1 and 2) and commercial ethanolic extracts. Values are average and standard error (±).
2017. Southeastern Brazil Propolis extracts Sub type TP (n) TF (n) OI (n)
Prepared from raw propolis
by scraping (type 1)
08.16 ± 04.48 (33) 6.25 ± 2.15 (22) 5.77 ± 2.06 (33)
In strips (type 2) 22.84 ± 25.50 (15) 8.09 ± 0.65 (10) 6.24 ± 2.56 (12)
Commercial - 39.17 ± 44.21 (27) 5.08 ± 2.66 (16) Not included
Average - 23.39 ± 19.87 6.47 ± 1.04 6.00 ± 0.35
TP- mg GAE100mg-1 extract; TF– mg QE 100-1mg from extract; OI in seconds

Lorenzon et al / Greener Journal of Agricultural Sciences 95
Comparing with other studies, total phenolic
contents from EET were higher than those reported by Righi et al. (2013), whose sampling was originated from seven different states of Brazil, ranging from 0.91 to 27.34 mg GAE 100mg-1 extract; the same occurs with the total flavonoid contents, ranging from 0.68 to 4.43 mg QE 100mg-1 extract in the previous reference. Comparing the PEE and CE results with the same reference, in our study we have the lowest value (no detectable = zero), which due to some samples of CE for flavonoid content (n=2). However, this does not occur with higher values in both types of extracts (PEE and CE). The results of total flavonoids contents were also different from those reported by Silva et al. (2006), who evaluated samples from seven different states of Brazil; they found values between 0.50 and 6.5 mg QE 100mg-1 extract.
Such variation of total phenolic and flavonoid contents reflects in the chemical composition of propolis extracts and also reveals deficiency in quality control on commercial extracts. Salgueiro and Castro (2016) pointed out that the chemical composition of in naturaand commercial extracts of Brazilian propolis were similar, despite this the multivariate analysis allowed the discrimination between them.
Currently, Brazilian green propolis is chosen for research in quality control for its known and appreciable antioxidant capacity and abundance in polyphenolic compounds.
Gardana et al. (2007) have analyzed the ethanolic extracts of Brazilian green propolis samples. They found values of TP and TF ranging between 0.7 and 12.0 mg GAE 100mg-1 extract and 1.7 and 14.6 mg QE 100mg-1 extract, respectively. According to Zhang et al. (2017), the amounts of TP and TF varied widely in different Brazilian green propolis samples, ranging from 8.75 to 14.86 mg g-1 and 3.84 to 6.76 mg g-1, respectively, in accordance with Mello and Hubinger (2012). Monroy et al. (2017) used supercritical carbon dioxide in study involved Brazilian propolis and high concentrations of specific chemical compounds were obtained in the 80% ethanol extract , the amounts of TP and TF respectively were 22.2 ± 1.1 mg GAE g-1 extract and 6.7 ± 0.5 mg QE g-1 extract.
In extensive research, Gardana and collaborators (2007) have also reported variation of the phenolic and flavonoid contents of ethanolic extracts of Italian propolis (TP 3.7 and 16.8 mg GAE 100mg-1, TF 0.7 and 9.9 mg QE 100 mg-1 extract), Polish propolis (TP 1.2 and 15.9 mg GAE 100 mg-1, TF 0.5 and 6.6mg QE 100 mg-1extract), French propolis (TP 1.5 and 13.0mg GAE 100 mg-1, TF 0.2 and 3.3mg QE 100 mg-
1extract) and Argentinian propolis (TP 3.1 and 19.0 mg GAE 100 mg-1; TF 0.3 and 5.5mg QE 100 mg-1extract). They recognized that total phenolic contents of propolis from tropical regions are higher than those found in temperate zones. In our study, the results confirm these results.
These results highlighted the complexity of chemical composition of propolis which favors its broad spectrum of therapeutic properties. As emphasized by Rufatto et al. (2017) phenolic compounds is a large class of plant secondary metabolites, showing a diversity of structures including phenolic acids, flavonoids, lignans, quinones, tannins, coumarins and others (Huang et al., 2010). Flavonoids act in different physiological processes, and perform various functions, including antimicrobial, as inhibitory effects on cancer cells, anti-inflammatory action and others (Barbosa et al., 2009; Kole et al., 2011). Biological Value of Prepared and Commercial Propolis Extracts (types 1 and 2) The prepared extracts (PEE) from raw propolis produced in strips (type 2) show a great variation for TP (table 3); this also occurs in the commercial extracts. The TF content for propolis-type 2 has the highest values and the smallest variation. No significant difference was observed between PEE type 1 and type 2 with respect to flavonoid level (TF) (p-value < 0.05). The oxidation index shows a great variation in PEE-type2 and suggests that this technique could enhance oxidation by exposure propolis to environmental radiation (figure 4). However, according to Cunha et al. (2004) the presence or absence of light did not affect the phenolic content.
Figure 4. Confidence interval: (a) phenolic contents (TP) and (b) flavonoid contents (TF),
(c) oxidation index PEE – extract prepared from raw propolis: (type1) by scraping, (type2) in strips.; CE– commercial extracts. TP (mg GAE 100 mg-1extract); TF (mg QE100mg-1extract); OI (seconds)

96 Lorenzon et al / Greener Journal of Agricultural Sciences
No significant difference is observed between
the prepared and commercial extracts, nor between the two types of extracts from raw propolis, with respect to phenolic and flavonoid levels and oxidative index.
The histograms (figure 5) show the distribution of the samples in three intervals for TP, four intervals for TF, five for OI, and three classes of extracts (PEE-
type1, PEE-type2 and CE). The profiles of TP content show PEE-type2 (propolis in strips) and CE (commercials extracts) samples distributed in more intervals than PEE-type1. PEE-type1 shows a peak with 20 samples in the lower interval showing uniformity in the sampling. However, the other types (PEE-type2 and CE) have some samples with higher intervals of TP contents.
Figures 5. Histograms: (A) phenolic contents (TP) and (B) flavonoid contents (TF), (C) oxidation index
PEE – extract prepared from raw propolis: (type1) by scraping, (type2) in strips; CE– commercial extracts. TP (mg GAE 100 mg-1extract); TF (mg QE 100mg-1extract); OI (seconds)

Lorenzon et al / Greener Journal of Agricultural Sciences 97
TF contents show PEE-type2 (in strips)
samples distributed in two intervals, which are the widest, showing uniformity in the sampling. PEE-type1 and CE (commercial) are similar, distributing the samples in three and four intervals, respectively; such variation reflects several factors influencing the TF content. However, a few samples of propolis type2 (in strips) obscure a profile.
Apparently, the oxidation index (OI) shows a wide distribution in the intervals for the two classes (PEE-type1 and PEE-type2). The surprising result is the concentration of the samples of PEE-type1 in the two lowest intervals, despite being more subject to the conditions of the harvests.
The wide variation of the composition of propolis is a serious barrier to define a regular pattern related to the collection method and the organic value, and even to the occurrence of samples in the same geographic region, as reported in this study. There are several factors also contributing to the variation of biological value of propolis as well: the geographical conditions of the forage sites by bees, the wild flora, the season of the year, the state of the bee colony and the conditions of hygiene and storage of propolis after harvest (eg. Inoue et al., 2007; Sousa et al., 2010; Bankova et al., 2016). Bedascarrasbur et al. (2006) have recommended the standardization of propolis for better use of its properties, providing that within the producing regions.
In Brazil, the majority of commercial extracts comes from different types of propolis, although obtaining propolis in strips is the most recommended practice (Breyer et al., 2016). In the scientific tests, most of the authors adopt the collector method that uses propolis in strips which results in less residues (Manrique and Egea, 2002), but does not represent the reality in the market.
According to Inoue et al. (2007), Wilson et al. (2015) and Regueira Neto et al. (2017), the seasonality is the factor that mostly interferes in the propolis variation. Souza et al. (2010) did not verify differences in the physico-chemical properties due to propolis harvesting and season. In Argentina, Bedascarrasbur et al. (2006) verified that the method of harvesting through a matrix mesh has obtained significantly higher contents of phenolics and flavonoids, when compared to the type of net and by scraping. These authors have emphasized that we should not indicate a method of harvesting propolis based on the quantitative production; there are local factors that interfere with the quantity and the quality of the production of this bee product. Thus, scraping pieces of the hive can be the most relevant method to obtain propolis for certain regions or times of the year.
In a regional study, Almeida et al. (2013) reported that the loss of propolis affects the health of the colony. Therefore, caution should be taken in the use of propolis traps, there are a few studies showing the relationship between the overproduction of propolis harvesting and the stress of the bee colony.
CONCLUSION AND RECOMMENDATION This study shows that the type of propolis, either by scraping or in strips, does not differ in the contents of phenolic and flavonoid. For this reason and in agreement with other references, it is recommended that the propolis harvesting, by scraping or in strips, requires attention in the adoption of good practices to reduce the residues (such as, the adoption of stainless tools, prevent insolation on the product in the field and reduce waste (soil, dust, dead bees, pieces of wood and traces of moths) and greater approach in the effects of the harvest on the bee colony. Competing interests To adapt the best type of bee product to the market with the quality required by the legislation. Thus, our team will be assisting producers who must achieve more competitive prices in the market of the evaluated product. Authors' contributions M Lorenzon, K Bourdsson– in this study she created cientific ideas that can subsidize family farming and the ecological keeping of honey bees. They made contacts with producers and collected samples carefully. And, they wrote the part of the manuscript related to beekeeping. R Castro, L. Pires – they performed on the organic analysis of the experiment and the preparation of the manuscript related to these analysis. A Koshiyama – He organized the database and suggested the best form of statistical analysis. He prepared the tables and figures and also helps the Statistical analyses. ACKNOWLEDGMENTS We are grateful to beekeepers for supporting this research and for the financial aid provided by scholarships from the postgraduate program. REFERENCES Almeida CT, Lorenzon MCA, Tassinari WS (2013).
Identificação de Fatores Associados à Ocorrência de Doenças de Abelhas Africanizadas (Apis mellifera L.) em Apiários do estado do Rio de Janeiro. Revista Bras. Med. Vet. 35,1: 33-40.
Athikomkulchai S, Awale S, Ruangrungsi N, Ruchirawat S, Kadota S (2013). Chemical constituents of Thai propolis.Fitoterapia. 88: 96–100. doi: 10.1016/j.fitote.2013.04.008

98 Lorenzon et al / Greener Journal of Agricultural Sciences
Bankova V, Bertelli D, Borba R, Conti BJ, Silva Cunha IB, Danert C et al. (2016) .Standard methods for Apis mellifera propolis Research. J Api Res. 1-49. doi.org/ 10.1080/00218839. 2016.1222661
Barbosa MH, Zuffi FB, Maruxo HB, Jorge LLR (2009). Ação terapêutica da própolis em lesões cutàneas. Acta Paul Enferm, 22: 318-22.
Bedascarrasbure E, Maldonado L, Morales WF, Alvarez A (2006). Propóleos argentinos, caracterización y normatización. Ediciones Magna: Argentina. 2006. 215p.
Bogdanov S (2014). Composition, Health, Medicine: A Review. Bee Product Science. 1-40.
Brasil (2001). Instrução Normativa n.3 de 19 de Janeiro de 2001. Anexo VII: Regulamento de Identidade e Qualidade de Extrato de Própolis. MAPA – Ministério da Agricultura, Pecuária e Abastecimento.
Breyer HFE, Breyer EDH, Cella I (2016). Produção e Beneficiamento da Própolis. Boletim técnico 138, EPAGRI. SC, Brasil,31p.
Castaldo S and Capasso F (2002). Propolis, an old remedy in modern medicine.Fitoterapia. 73: 1-6.
Cunha IBS, Sawayaa ACHF, Caetanob FM, Shimizua MT, Marcucci MC et al. (2004). Factors that Influence the Yield and Composition of Brazilian Propolis Extracts.J. Braz. Chem. Soc.15, 6: 964-970. doi.org/10.1590/S0103-50532004000600026.
Inoue HT, Sousa EA, Orsi RO, Funari SR, Barreto LMRC, Dib APS (2007). Produção de Própolis por Diferentes Métodos de Coleta. Arch. Latino Am. Prod. Anim. 15, 2: 65-69.
Freires IA, Queiroz VCPP, Furletti VF, Ikegaki M, Alencar SM et al. (2016). Chemical composition and antifungal potential of Brazilian propolis against Candida spp. J Mycol Med. 26, 2: 122-132. doi: 10.1016/j.mycmed.2016.01.003
Funakoshi-Tago M, Okamoto K, Izumi R, Tago K, Yanagisawa K, Narukawa Y et al. (2015). Anti-inflammatory activity of flavonoids in Nepalese propolis is attributed to inhibition of the IL-33 signaling pathway. Int Immuno Pharmacol. 25: 189–198. doi: 10.1016/j.intimp.2015.01.012.
Gardana C, Scaglianti M, Pietta P, Simonetti P (2007). Analysis of the Polyphenolic Fraction of Propolis From Different Sources by Liquid Chromatography-tandem Mass Spectrometry. J Pharm. Biomed. Anal. 45: 390-399. doi:10.1016/j.jpba.2007.06.022.
Ghisalberti E (1979). Propolis: A review. Bee World. 60, 1: 59-84.
Huang S, Zhang C-P, Wnag K, Li GQ, Hu F-L (2014). Recent Advances in the Chemical Composition of Propolis. Molecules. 19: 19610-19632. doi: 10.3390/molecules191219610.
Huang WY, Cai YZ, Zhang Y (2010). Natural phenolic compounds from medicinal herbs and dietary plants: potential use for cancer prevention. Nutr Cancer. 62: 1-20. doi: 10.1080/ 016355809 0319 1585
Instituto Adolfo Lutz (2005). Métodos físico-químicos para análise de alimentos. 4 ed. Ministério da Saúde, Brasília, Brazil. 1: 279-320.
Kole L, Giri B, Manna SK, Pal B, Ghosh S (2011). Biochanin-A, an isoflavon, showed anti-proliferative and anti-inflammatory activities through the inhibition of iNOS expression, p38-MAPK and ATF-2 phosphorylation and blocking NFkB nuclear translocation. Eur J Pharmacol. 653: 8-15. doi: 10.1016/j.ejphar.2010.11.026.
Lima M, Orsi RO, Costa GM and Malaspina O (2016). Brazilian Propolis Production by Africanized Bees (Apis mellifera). Bee World. 92:3, 58-68. doi:10.1080/0005772X.2015.1129229.
Machado BAS, Silva RPA, Barreto GA, Costa SS, Silva, DF et al. (2016). Chemical composition and biological activity of extracts obtained by supercritical extraction and ethanolic extraction of brown, green and red propolis derived from different geographic regions in Brazil. PlosOne.8. doi:10.1371/journal.pone.0145954.
Manrique AJ and Soares AEE (2002). Start of Africanized honey bee selection program for increased propolis production and its effect on honey production. Interciencia. 27: 312–316. Retrieved from http://www.interciencia.org/ v27_06/manrique.pdf.
Melo AAM, Matsuda AH, Almeida-Muradian LB (2012). Identidade e Qualidade de Própolis Proveniente de Quatro Regiões do Brasil. Rev. Inst. Adolfo Lutz. 71,3: 540-548.
Mello BC, Hubinger MD (2012). Antioxidant activity and polyphenol contents in Brazilian green propolis extracts prepared with the use of ethanol and water as solvents in different pH values. Int J Food Sci Tech. 47, 12: 2510–18. doi.org/10.1111/j.1365-2621.2012.03129.x
Mihai CM, Mărghitaş LA, Dezmirean DS, Chirilă F, Moritz RF, Schlüns H (2012). Interactions among flavonoids of própolis affect antibacterial activity against the honeybee pathogen Paenibacillus larvae. J Invertebr Pathol. 110, 1: 68–72. doi: 10.1016/j.jip.2012.02.009,
Monroy YM, Rodrigues RM, RodriguesVN, Sant’Ana AS, Silva, BS, Cabral FA (2017). Brazilian green propolis extracts obtained by conventional processes and by processes at high pressure with supercritical carbon dioxide, ethanol and water. J Supercrit Fluids. 130: 189–197 doi.org/10.1016/j.supflu.2017.08.006
Naggar YA, Sun J, Robertson A, Giesy JP, Wiseman S (2016).Chemical Characterization and Antioxidant Properties of Canadian Propolis. J Api Res. 55, 4: 305-314. doi.org/ 10.1080/ 00218839 .2016.1233700
Papotti, G., Bertelli, D., Rossi, M.C, Plessi M (2010). Use of HR-NMR to classify própolis obtained using different harvesting methods. J Food Sci Technol, 45, 8: 1610–1618. doi: 10.1111/j.1365-2621.2010.02310.x.
Pereira DS, Freitas CIA, Freitas MO, Maracajá, PB, Silva JBA, Da Silva RA, Silveira DC (2013). Histórico e Principais Usos da Própolis Apícola. ACSA – Agropecuária Científica no Semi-Árido. 9, 4: 22-26.

Lorenzon et al / Greener Journal of Agricultural Sciences 99
Pereira DS, Freitas CIA, Freitas MO, Maracajá PB, Silva JBA, Silva RA, Silveira CD (2015). Histórico e Principais Usos da Própolis Apícola. Agropecuária Científica no Semiárido. 11,2: 01-21.
R Core Team (2017). R: A language and environment for statistical computing. RFoundation for Statistical Computing, Vienna, Austria.URL https://www.R-project.org/.
Regueira Neto MS, Tintino SR, Pereira da Silva AR, Costa MS, Boligon AA et al. (2017). Seasonal variation of Brazilian red propolis: Antibacterial activity, synergistic effect and phytochemical screening Food Chem Toxicol .107: 572 -580. doi:org/10.1016/ j.fct.2017.03.052.
Rufatto LC, Santos SA, Marinho F, Henriques JAP et al. (2017). Red propolis: Chemical composition and pharmacological activity. Asian Pac J Trop Biomed. 7,7: 591–598.
Righi AA, Negri G, Salatino A (2013). Comparative chemistry of propolis from eight Brazilian localities. J. Evi.based Complemen Altern Med. 2013: 1-14. doi.org/10.1155/2013/267878
Salgueiro FB, Lira AF, Rumjanek VM, Castro RN (2014). Phenolic composition and antioxidant properties of Brazilian honeys. Quim Nova. 37,5: 1-6. doi.org/10.5935/0100-4042.20140132.
Salgueiro FB and Castro RN (2016). Comparação Entre a Composição Química e Capacidade Antioxidante de Diferentes Extratos de Própolis
Verde. Quim Nova. 39, 10: 1192-1199. doi.org/10.21577/0100-4042.20160136.
Silva RA, Rodrigues AE, Ribeiro, MCM, Custódio AR, Andrade NED and Pereira EW (2006). Características Físico-Químicas e Atividade Antimicrobiana de Extratos de Própolis da Paraíba, Brasil. Ciência Rural. 36: 1842-1848. doi.org/10.1590/S0103-84782006000600027.
Singleton VL, Orthofer R, Lamuela-Raventos RM (1999). Analysis of total phenols andother oxidation substrates and antioxidants by means of Folin-Ciocalteu reagent, Methods Enzymol. 299: 152–178. doi.org/10.1016/S0076-6879(99)99017-1.
Sforcin JM and Bankova V (2011).Propolis: Is There a Potential For the Development of New Drugs? J Ethno Pharmacol. 133, 2: 253-260. doi: 10.1016/j.jep.2010.10.032.
Souza EA, Inoue HT, Gomes SMA, Funari SRC, Orsi RO (2010). Physicochemical Proprieties of Propolis in Function of Seasonality and Production Method.Arch Zootecnia. 59,228: 571-576.
Wang K, Ping S, Huang S, Hu L, Xuan H, Zhang C, Hu F (2013). Molecular mechanisms underlying the in vitro anti-inflammatory effects of a flavonoid-rich ethanol extract from Chinese propolis (poplar type). J evi based Complement Alternat Med. 2013:127672. doi: 10.1155/2013/127672.
Cite this Article: Lorenzon MCA, Castro RN, Pires LO, Koshiyama AS, Bento KJB (2018). Biological Values of different Types of Brazilian Propolis. Greener Journal of Agricultural Sciences, 8(5): 090-099, http://doi.org/10.15580/GJAS.2018.5.033118054.