biological supplement trials - nrm north - nrm north · · 2014-03-31biological supplement trials...
TRANSCRIPT

Biological Supplement Trials
‘Formosa’ – Pasture
&
‘Oakdene’ - Cropping
Final Report
Produced by
Stephen Ives
November 2013

ii
Project Details Project Title: Biological Supplement Trials on Cropping and Pasture
Project Leader: Dr Stephen Ives
PO Box 287
Longford Tas 7301
Telephone: +61 (0) 4 0058 6163
Email: [email protected]
Collaborator: Tasmanian Institute of Agriculture
PO Box 46
Kings Meadows TAS 7249
Telephone: +61 (0) 3 6336 5372
Facsimile: +61 (0) 3 6336 5395
Mobile: +61 (0) 4 0791 2761
Partner - Cropping: Mr Bill Chilvers
Eskfield Farms Pty Ltd
PO Box 125
Evandale TAS 7212
Partner - Pasture: Mr Rob Henry
Woodrising Farms
767 Delmont Road
Cressy TAS 7302
NRM North: Adrian James Regional Landcare Facilitator/CFI Extension Officer Level 2 McKenzie Building 63-65 Cameron Street
Launceston TAS 7250
Funding Sources:
We acknowledge the funding support provided to undertake this research and extension
project by NRM North through the Australian Government.
iii
Contents 1 Introduction .....................................................................................................1
2 Methods ..........................................................................................................2 2.1 Formosa - Site .................................................................................................................................... 2 2.2 Formosa - Treatments ....................................................................................................................... 2 2.3 Formosa – Soil Sampling and Testing ................................................................................................ 4 2.4 Formosa – Pasture Yield and Biomass ............................................................................................... 5 2.5 Oakdene - Site ................................................................................................................................... 6 2.6 Oakdene - Treatments ....................................................................................................................... 6
2.6.1 Small Scale Biochar Trial........................................................................................................ 6 2.6.2 Large Scale Trial .................................................................................................................... 9
2.7 Oakdene – Soil Sampling and Testing .............................................................................................. 11 2.8 Oakdene – Crop Yield and Biomass ................................................................................................. 11
2.8.1 Small Scale Biochar Trial...................................................................................................... 11 2.8.2 Large Scale Trial .................................................................................................................. 11
3 Results ........................................................................................................... 13 3.1 Treatment Analysis .......................................................................................................................... 13 3.2 Formosa Pasture Trial ...................................................................................................................... 15
3.2.1 Soil pH and EC ...................................................................................................................... 15 3.2.2 Soil Carbon and Nitrogen .................................................................................................... 16 3.2.3 Pasture Biomass .................................................................................................................. 18
3.3 Oakdene Small Scale Biochar Cropping Trial ................................................................................... 18 3.3.1 Soil pH and EC ...................................................................................................................... 18 3.3.2 Soil Carbon and Nitrogen .................................................................................................... 20 3.3.3 Crop Growth ........................................................................................................................ 21
3.4 Oakdene Large Scale Cropping Trial ................................................................................................ 24 3.4.1 Soil pH and EC ...................................................................................................................... 24 3.4.2 Soil Carbon and Nitrogen .................................................................................................... 25 3.4.3 Crop Growth ........................................................................................................................ 28
4 Discussion ...................................................................................................... 29 4.1 Soil pH & EC ..................................................................................................................................... 29
4.1.1 Soil pH .................................................................................................................................. 29 4.1.2 Soil EC .................................................................................................................................. 30
4.2 Soil Carbon and Nitrogen................................................................................................................. 30 4.2.1 Soil total carbon .................................................................................................................. 30 4.2.2 Soil total nitrogen ................................................................................................................ 30
4.3 Plant growth .................................................................................................................................... 31
5 Conclusion ..................................................................................................... 32
6 References ..................................................................................................... 33
7 Budget and In Kind Contributions ................................................................... 34

Executive Summary Pasture and cropping trials were established at ‘Formosa’ and “Oakdene’ respectively to
determine the effects of biological (organic) and inorganic soil amendments on soil pH,
total nitrogen and total carbon in the top 10 cm of soil over a 2 – 3 year period. Applied
treatments included two different composts (both sites), inorganic fertiliser (both sites),
biologically enhanced manure digest liquid (Formosa), liquid poppy waste (Formosa),
solid poppy waste (Oakdene), cattle feedlot waste (Oakdene), biological supplement (a
bacterial formulation in a molasses solution - Oakdene), and biochar (small scale trial –
Oakdene).
The results showed a decrease in soil carbon and nitrogen under long term pasture in the
first eighteen months after application of compost concomitant with an increase in
pasture productivity. The increase in productivity may have been due to increased
nutrient release from an increase in activity of the soil fauna in response to the compost
applications. Although both soil carbon and nitrogen showed a subsequent increase up
until the end of the project, the results demonstrate that repeat application may be
necessary to maintain soil carbon over the longer term.
Annual cropping in the large scale trail showed mixed results with no clear distinction
between treatments within each year. This was despite the use of no-till techniques and
incorporation of amendments through ground disturbance with direct drill planting.
However, across the three years the compost from Woodrising Farms (WCP) showed
significantly higher soil carbon and nitrogen. The decline in the third year indicates that
similar to long term pasture, repeat applications may be necessary to maintain soil carbon
levels. This trial shows that applications may be required at least once every two years.
The addition of a carbon source to the soil in the form of biochar showed an increase in
both pH and nitrogen, nine months after application. However, this was short lived with
subsequent decreases over the following 2 years.
These series of trials has shown that a single application of organic amendments on both
cropping and long term pasture in an effort to increase soil carbon may not be effective in
the long term. However, the results have given an indication of the frequency that may be
required. Although longer term trials may provide the answers required to assist in
determining application frequency, fully characterising the amendments and their
behaviour in different soil types and environments for modelling may be a more cost
effective method.

Final report: Biological Supplement Trials
1
1 Introduction Organic fertilisers or organic soil amendments such as animal manures, crop residues,
composts and sewage sludge have been used in agriculture since cultivation of crops
began. They supply plant nutrients and improve soil properties. In recent times, modern
society has regarded agricultural residues and bi-products of urbanisation and
industrialisation as waste products for disposal. Therefore, amendment availability and
logistical limitations have often determined application timing and rate for agriculture use
rather than the demand for nutrients and organic matter. However, the use of organic
soil amendments has gained momentum in productive agriculture with the recent
emphasis on soil health and carbon sequestration together with increasing cost of
inorganic fertilisers.
Inorganic fertilisers are manufactured to specific formulations, enabling the calculation of
reasonably accurate and balanced application rates to satisfy plant requirements.
Conversely, most waste products used for soil amendments have not been manufactured
for this purpose and contain many nutrients in an ‘organic’ form with unknown or
misunderstood degradation or release rates.
However, this misunderstanding provides an opportunity to investigate the use of specific
waste products in productive agriculture with a view to tailor make products to satisfy the
economic and environmental requirements of the end user. A number of products are
available in Tasmania produced in commercial quantities including composts, cattle
feedlot waste, anaerobically digested and lime amended biosolids and biologically
enhanced liquid from manure digestion. Biochar is also being extensively trialled
throughout Australia, although commercial quantities are not yet available in Tasmania at
a price to be competitive with other amendments.
The main objective of this project was to determine whether or not a selected number of
these products have the potential to increase soil carbon stocks and improve soil pH over
the short to long term in both cropping and long term pasture.
Fully replicated trials were established at two locations in the Northern Midlands of
Tasmania:
• Large scale (>1 ha plots) trial on long term pasture at ‘Formosa’, Cressy in December 2010
• Large scale (>1 ha plots) trial on annual cropping at ‘Oakdene’, Midlands Highway, Perth in May 2011.
• Small scale (15 m2 plots) trial on annual cropping at ‘Oakdene’, Midland Highway, Perth in May 2011.

Final report: Biological Supplement Trials
2
2 Methods
2.1 Formosa - Site
The site was located at ‘Formosa’, 1903 Cressy Road, Cressy, Tasmania. Property ID
6751390, Title Reference 148118/1, Grid Reference 55G 509100m E, 5380600m S,
Elevation 154m (South west corner of Paddock No. 5). Refer to
Figure 1.
Figure 1 Biological Supplement Pasture Trial Site, ‘Formosa’, Cressy, Tasmania
2.2 Formosa - Treatments
The treatments selected for this site were Biological enhanced manure digest liquid, two
different compost products, inorganic fertiliser and liquid poppy waste. Refer to Table 1.
This paddock was a long term pasture with a mixed sward of Brome, Ryegrass, Sub and
White Clover and weed grasses winter grass and barley grass. All treatments were applied
in year 1 in the week 22nd to 24th December 2010 (Figure 2 and Figure 3).
The treatments were set out in a randomised complete block with 4 replicates.

Final report: Biological Supplement Trials
3
Table 1 Large scale plot trial for organic and inorganic treatments
Description Code Rate / ha Plot Size Replicates
Biologically enhanced
manure digest liquid MDL 200 L 29 m x 320 m 4
Renew Compost RCP 15 m3 29 m x 320 m 4
WRF Compost WCP 15 m3 29 m x 320 m 4
Inorganic fertiliser
(DAP) INF 250 kg 29 m x 320 m 4
Unamended control CTL N/A 29 m x 320 m 4
Liquid Poppy Waste LPW 200 L 29 m x 320 m 4
Figure 2 Spreading ‘Woodrising Compost’ at Formosa in December 2010
Final report: Biological Supplement Trials
4
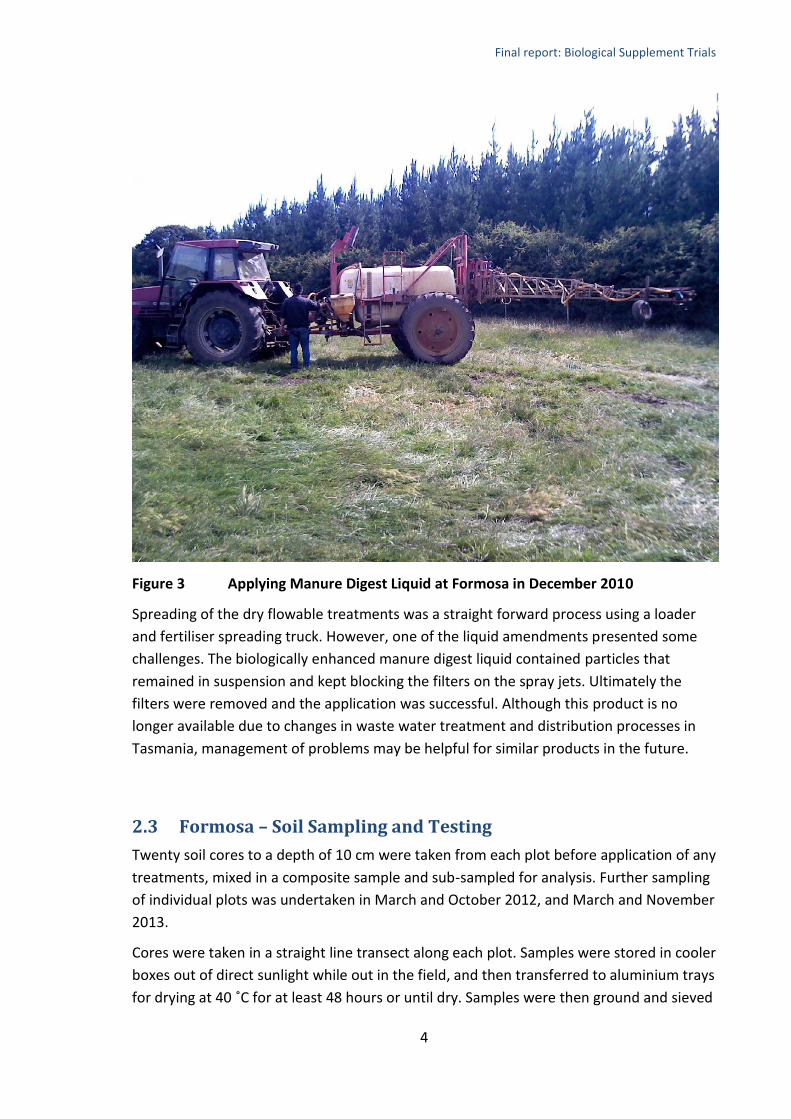
Figure 3 Applying Manure Digest Liquid at Formosa in December 2010
Spreading of the dry flowable treatments was a straight forward process using a loader
and fertiliser spreading truck. However, one of the liquid amendments presented some
challenges. The biologically enhanced manure digest liquid contained particles that
remained in suspension and kept blocking the filters on the spray jets. Ultimately the
filters were removed and the application was successful. Although this product is no
longer available due to changes in waste water treatment and distribution processes in
Tasmania, management of problems may be helpful for similar products in the future.
2.3 Formosa – Soil Sampling and Testing
Twenty soil cores to a depth of 10 cm were taken from each plot before application of any
treatments, mixed in a composite sample and sub-sampled for analysis. Further sampling
of individual plots was undertaken in March and October 2012, and March and November
2013.
Cores were taken in a straight line transect along each plot. Samples were stored in cooler
boxes out of direct sunlight while out in the field, and then transferred to aluminium trays
for drying at 40 ˚C for at least 48 hours or until dry. Samples were then ground and sieved
Final report: Biological Supplement Trials
5
to pass through a 2 mm sieve and sent to Agvita Analysis Laboratory in East Devonport,
Tasmania for analysis of pH (water), electrical conductivity, Total Carbon and Total
Nitrogen.
2.4 Formosa – Pasture Yield and Biomass
There are distinct limitations in monitoring pasture growth in a 30 ha paddock that is
continuously grazed. Due to available feed in other areas of the farm, animals were
locked out of the paddock for 4 weeks in March and October of year 1. A 2.5 m wide strip
was slashed across each plot to a height of 50 mm. After 4 weeks, a mower was used to
cut a strip 2 m long across each plot, clippings collected, dried at 56 ˚C and weighed for
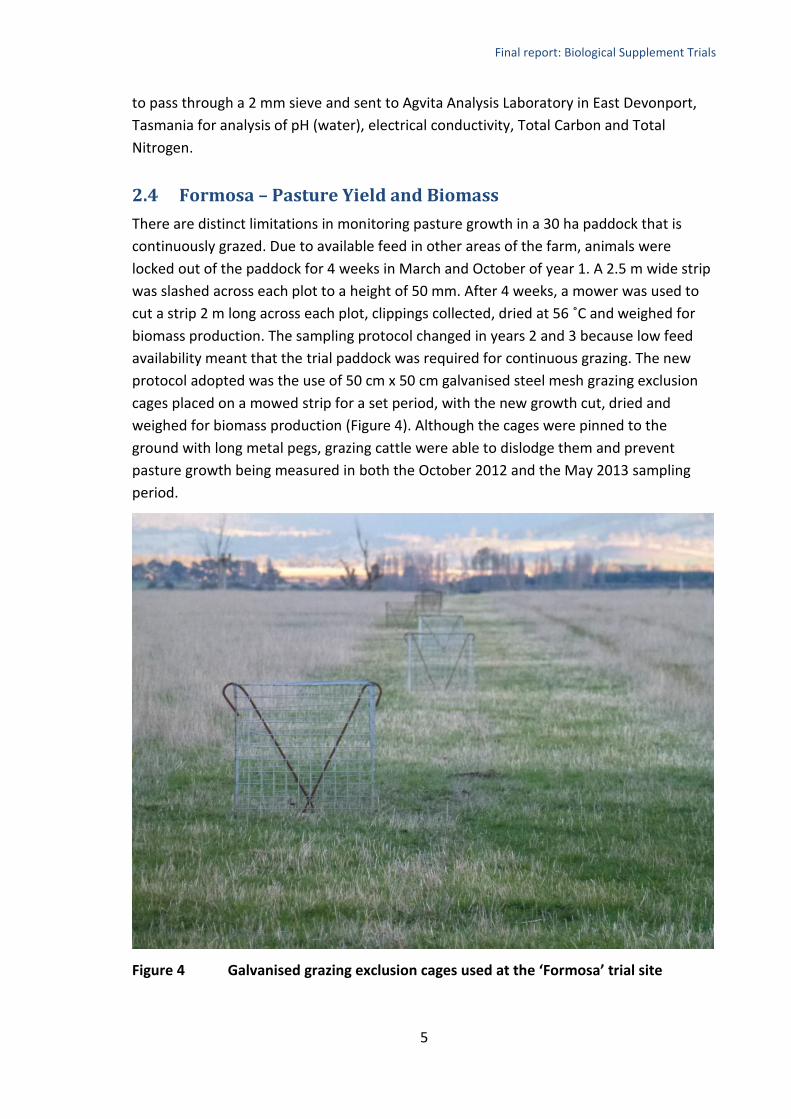
biomass production. The sampling protocol changed in years 2 and 3 because low feed
availability meant that the trial paddock was required for continuous grazing. The new
protocol adopted was the use of 50 cm x 50 cm galvanised steel mesh grazing exclusion
cages placed on a mowed strip for a set period, with the new growth cut, dried and
weighed for biomass production (Figure 4). Although the cages were pinned to the
ground with long metal pegs, grazing cattle were able to dislodge them and prevent
pasture growth being measured in both the October 2012 and the May 2013 sampling
period.
Figure 4 Galvanised grazing exclusion cages used at the ‘Formosa’ trial site
Final report: Biological Supplement Trials
6
2.5 Oakdene - Site
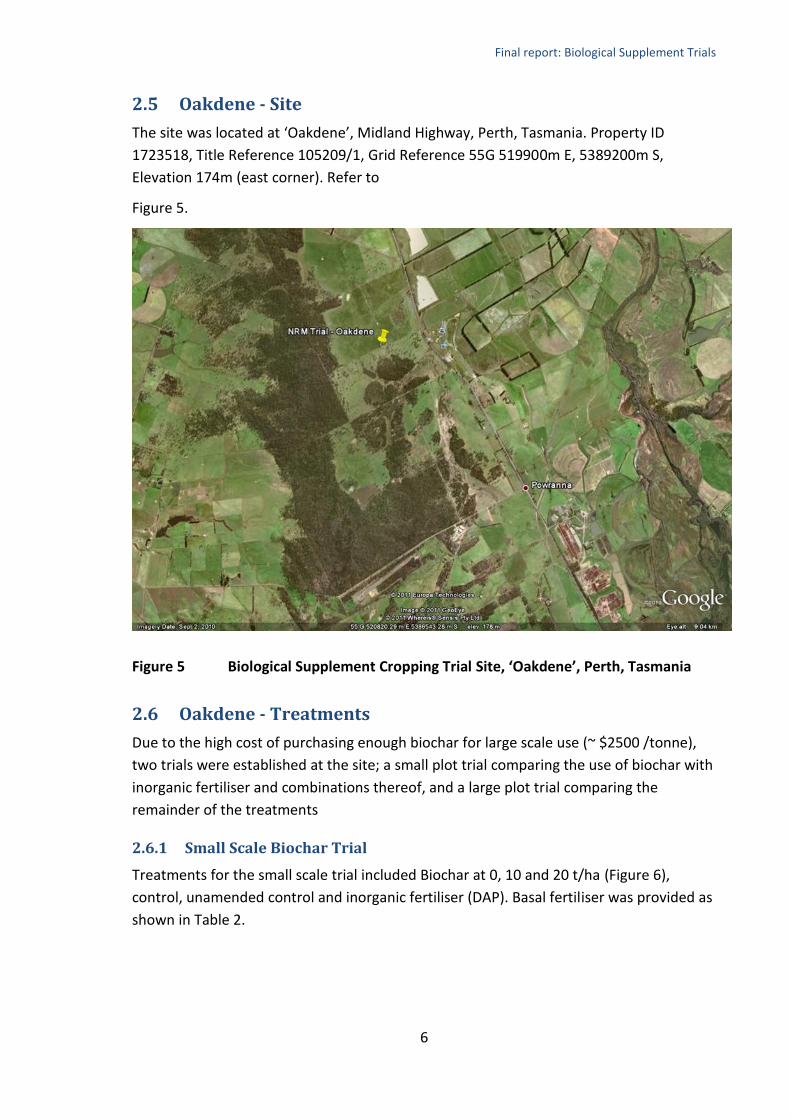
The site was located at ‘Oakdene’, Midland Highway, Perth, Tasmania. Property ID
1723518, Title Reference 105209/1, Grid Reference 55G 519900m E, 5389200m S,
Elevation 174m (east corner). Refer to
Figure 5.
Figure 5 Biological Supplement Cropping Trial Site, ‘Oakdene’, Perth, Tasmania
2.6 Oakdene - Treatments
Due to the high cost of purchasing enough biochar for large scale use (~ $2500 /tonne),
two trials were established at the site; a small plot trial comparing the use of biochar with
inorganic fertiliser and combinations thereof, and a large plot trial comparing the
remainder of the treatments
2.6.1 Small Scale Biochar Trial
Treatments for the small scale trial included Biochar at 0, 10 and 20 t/ha (Figure 6),
control, unamended control and inorganic fertiliser (DAP). Basal fertiliser was provided as
shown in Table 2.

Final report: Biological Supplement Trials
7
Figure 6 Biochar applied to soil surface before being turned in.
Table 2 Small plot trial for biochar and inorganic fertiliser treatments
Description Rate / ha Basal
Fertiliser
Plot Size Replicates
Biochar 0 120kg/ha
DAP 10 m x 1.5 m 5
Biochar 10 t 120kg/ha
DAP 10 m x 1.5 m 5
Biochar 20 t 120kg/ha
DAP 10 m x 1.5 m 5
Control N/A 120kg/ha
DAP 10 m x 1.5 m 5
Unamended control N/A Nil 10 m x 1.5 m 5
DAP 120 kg 120kg/ha
DAP 10 m x 1.5 m 5
Treatments were incorporated in the top 10cm as shown in Figure 7.
20 t/ha
10 t/ha

Final report: Biological Supplement Trials
8
Figure 7 Incorporation of all treatments in the small scale Biochar trial
Wheat variety ‘Revenue’ was planted at 92 kg/ha in year 1 (16th May 2011) with a small
plot planter and in year 2 and year 3 using a commercial planter for wheat and canola
respectively (Figure 8). All treatments were applied in year 1 (10th May 2011) with a basal

Final report: Biological Supplement Trials
9
fertiliser of 120 kg/ha DAP, and a further 240 kg/ha of DAP applied with seed at planting
for years 2 and 3.
The treatments were set out in a randomised complete block with 5 replicates.
Figure 8 Direct drilling year 2 wheat ‘Revenue’ at Oakdene
2.6.2 Large Scale Trial
The treatments selected for this site were Biological enhanced manure digest liquid, two
different compost products, cattle feedlot waste, inorganic fertiliser and solid poppy
waste. (Table 3 and Figure 9).
Wheat variety ‘Revenue’ was planted in years 1 and 2 at 92 kg/ha with Canola planted in
year 3. All treatments were applied in year 1 (10th May 2011) with a basal fertiliser of 120
kg/ha DAP, with a further 240 kg/ha of DAP applied with seed at planting for years 2 and
3.
The treatments were set out in a randomised complete block with 4 replicates.

Final report: Biological Supplement Trials
10
Table 3 Large scale plot trial for organic and inorganic treatments
Description Code Rate / ha Plot Size Replicates
Biologically enhanced
manure digest liquid MDL 200 L 20 m x 450 m 4
Renew Compost RCP 15 m3 20 m x 450 m 4
WRF Compost WCP 15 m3 20 m x 450 m 4
Inorganic fertiliser
(DAP) INF 125 kg 20 m x 450 m 4
Unamended control CTL N/A 20 m x 450 m 4
Cattle feedlot waste CFW 15 m3 20 m x 450 m 4
Solid Poppy Waste SPW 15 m3 20 m x 450 m 4
Figure 9 Poppy waste (1), Renew Compost (2), Cattle Feedlot Waste (3) and
Woodrising Compost (4) applied at Oakdene
1
3
2
4

Final report: Biological Supplement Trials
11
2.7 Oakdene – Soil Sampling and Testing
Twenty soil cores to a depth of 10 cm were taken from each plot of the large scale trial
before application of any treatments, mixed in a composite sample and sub-sampled for
analysis. Further sampling of individual plots of both the large (20 cores per plot) and
small (10 cores per plot) scale plots was undertaken in March 2012, March 2013 and
November 2013.
Cores were taken in a straight line transect along each plot. The beginning of each
transect for the large scale plots was identified with a GPS mark. Samples were stored in
cooler boxes out of direct sunlight while out in the field, and then transferred to
aluminium trays for drying at 40˚C for at least 48 hours or until dry. Samples were then
ground and sieved to pass through a 2 mm sieve and sent to Agvita Analysis Laboratory in
East Devonport, Tasmania for analysis of pH (water), electrical conductivity, Total Carbon
and Total Nitrogen.
2.8 Oakdene – Crop Yield and Biomass
2.8.1 Small Scale Biochar Trial
Plant density and vigour scores out of 10 were taken along with photos on 5th August
2011. Biomass samples were taken at GS30 in year 1 (14th September 2011) using 3 x 500
mm x 500 mm quadrats per plot. The sample from each plot was dried at 56 °C and
weighed. Harvest yields from the small scale biochar trial in year 1 were recorded from 2
x 500 mm x 500 mm quadrats per plot and also using a small plot harvester with yields
taken from whole plots. Harvest yields for year 2 were recorded using a 500 mm x 500
mm quadrat. The year 3 crop was still in a vegetative state at the completion of this
project, so only plant height and growth stage were recorded. Furthermore, results may
have been confounded because of cross contamination between treatments by the
commercial planter planting across the plots (1.5 m wide) in Year 3.
2.8.2 Large Scale Trial
Harvest yields from the large scale trial in year 1 were recorded from the yield monitor in
the commercial harvester from a 9.1 m wide pass up the centre of each plot with an
average length of 300 m. Harvest yields for year 2 were recorded using a 500 mm x 500
mm quadrat. However, no yield has been recorded for the canola crop for year 3 as it is
still in the vegetative state. Biomass has also not been recorded for year 3 as extensive
rain and a perceived micro nutrient deficiency of the canola (by the farmer) throughout
the growing period have resulted in a non-uniform emergence and growth (Figure 10).

Final report: Biological Supplement Trials
12
Figure 10 Large scale trial at Oakdene planted with Canola in year 3

Final report: Biological Supplement Trials
13
3 Results
3.1 Treatment Analysis
An analytical summary of treatments used at Formosa and Oakdene (including pre-trial
soil) is shown in
Table 4 and Table 5 respectively.
Table 4 Formosa treatment and soil analysis
Analyte FORMOSA
SOIL
RCP WCP LPW (mg/L)
Colwell P (mg/kg) 56.5 1022 2592 13300
Colwell K (mg/kg) 239 2822 9990 95500
Ca (mg/kg) 1938 6367 7490 NR
Mg (mg/kg) 193 3003 3155 9.67
Zn (mg/kg) 2.67 14.2 52.1 3.62
B (mg/kg) 0.11 3.59 11.8 5.38
S (mg/kg) 28.8 984 1083 9780
Cu (mg/kg) 0.27 1.86 1.31 0.27
Fe (mg/kg) 536 135 181 NR
Mn (mg/kg) 70.6 52.6 74.2 NR
Na (mg/kg) 61.1 893 240 NR
EC (dS/m) 0.34 1.67 4.43 NR
pH (H2O) 5.87 7.26 7.65 NR
pH (CaCl2) 5.53 7.01 7.40 NR
Cl (mg/kg) 59.5 200 2390 7130
Total N (%) 0.27 1.33 1.97 7140
Total C (%) 3.43 29.5 16.9 5700
C/N Ratio 12.6 22.1 8.47 NR
Note: NR indicates no result for analyte

Final report: Biological Supplement Trials
14
Table 5 Oakdene treatment and soil analysis
Analyte OAKDENE
SOIL
CFW SPW RCP WCP Biochar
Colwell P (mg/kg) 50.2 3052 2706 1022 2592 5100
Colwell K (mg/kg) 111 11686 8469 2822 9990 41500
Ca (mg/kg) 896 7213 46586 6367 7490 5500
Mg (mg/kg) 93.2 2853 8983 3003 3155 3000
Zn (mg/kg) 2.54 366 16.3 14.2 52.1 53.5
B (mg/kg) 0.49 4.32 25.2 3.59 11.8 8.14
S (mg/kg) 15.6 353 837 984 1083 1800
Cu (mg/kg) 0.23 3.52 1.14 1.86 1.31 11.89
Fe (mg/kg) 474 240 77.9 135 181 1418
Mn (mg/kg) 42.9 133 72.1 52.6 74.2 205.1
Na (mg/kg) 22.3 3458 338 893 240 300
EC (dS/m) 0.18 4.06 2.47 1.67 4.43 NR
pH (H2O) 5.28 7.33 8.73 7.26 7.65 NR
pH (CaCl2) 4.84 6.96 8.41 7.01 7.40 NR
Cl (mg/kg) 22.9 7987 488 200 2390 NR
Total N (%) 0.25 1.83 1.57 1.33 1.97 2.39
Total C (%) 3.24 18.1 31.4 29.5 16.9 NR
C/N Ratio 12.7 9.84 20 22.1 8.47 NR
Note: NR indicates no result for analyte. Biochar was produced from wheat stubble,
which may explain the high value for Colwell K.

Final report: Biological Supplement Trials
15
3.2 Formosa Pasture Trial
3.2.1 Soil pH and EC
Analysis of the top 10 cm for pH and EC showed no significant differences between
treatments either with all years combined or within each year (Refer to Figure 11 and
Figure 12). Interestingly the pH for the WCP treatment remained constant for the
duration of the trial.
Figure 11 Soil pH (H20) in the top 10 cm at the Formosa site
Note: Error bars indicate standard deviation of the means
The May 2012 sampling occurred in a very dry autumn, with subsequent samplings being in
wetter periods. The decrease in EC (Refer to Figure 12) over time suggests the downward
movement (or lack of) of the dissolved salts in the soil matrix during wet (and dry) periods.

Final report: Biological Supplement Trials
16
Figure 12 Soil EC in the top 10 cm at the Formosa site
Note: Error bars indicate standard deviation of the means
3.2.2 Soil Carbon and Nitrogen
The analysis of the top 10 cm of each of the treatments at the Formosa pasture site
showed significant differences between treatments for both soil carbon and nitrogen, but
only in the May 2012 sampling period. Refer to Figure 13 and Figure 14. Treatments MDL,
RCP and WCP were significantly lower in soil carbon and nitrogen than the control
treatment.

Final report: Biological Supplement Trials
17
Figure 13 Total carbon in the top 10 cm at the Formosa site
Note: Error bars indicate standard deviation of the means and different letters
indicate significant difference between treatments (P=0.002, LSD=0.46)
Figure 14 Total nitrogen in the top 10 cm at the Formosa site
Note: Error bars indicate standard deviation of the means and different letters
indicate significant difference between treatments (P=0.002, LSD=0.04)
Final report: Biological Supplement Trials
18
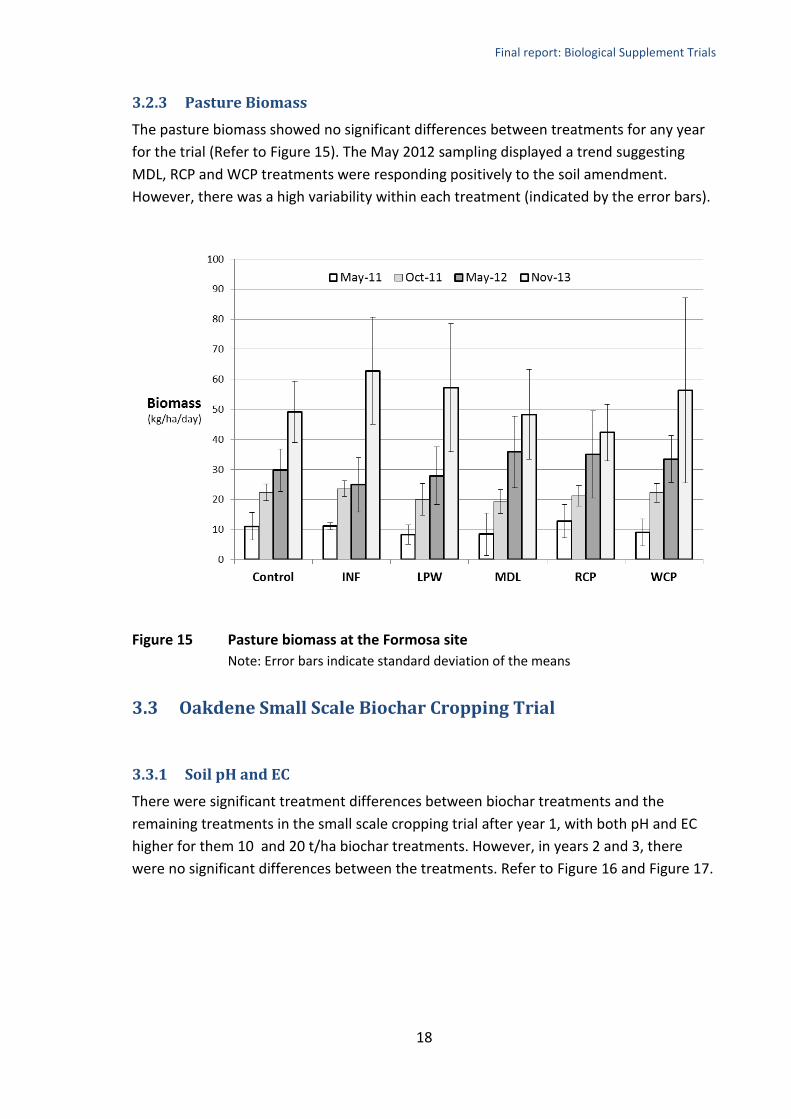
3.2.3 Pasture Biomass
The pasture biomass showed no significant differences between treatments for any year
for the trial (Refer to Figure 15). The May 2012 sampling displayed a trend suggesting
MDL, RCP and WCP treatments were responding positively to the soil amendment.
However, there was a high variability within each treatment (indicated by the error bars).
Figure 15 Pasture biomass at the Formosa site
Note: Error bars indicate standard deviation of the means
3.3 Oakdene Small Scale Biochar Cropping Trial
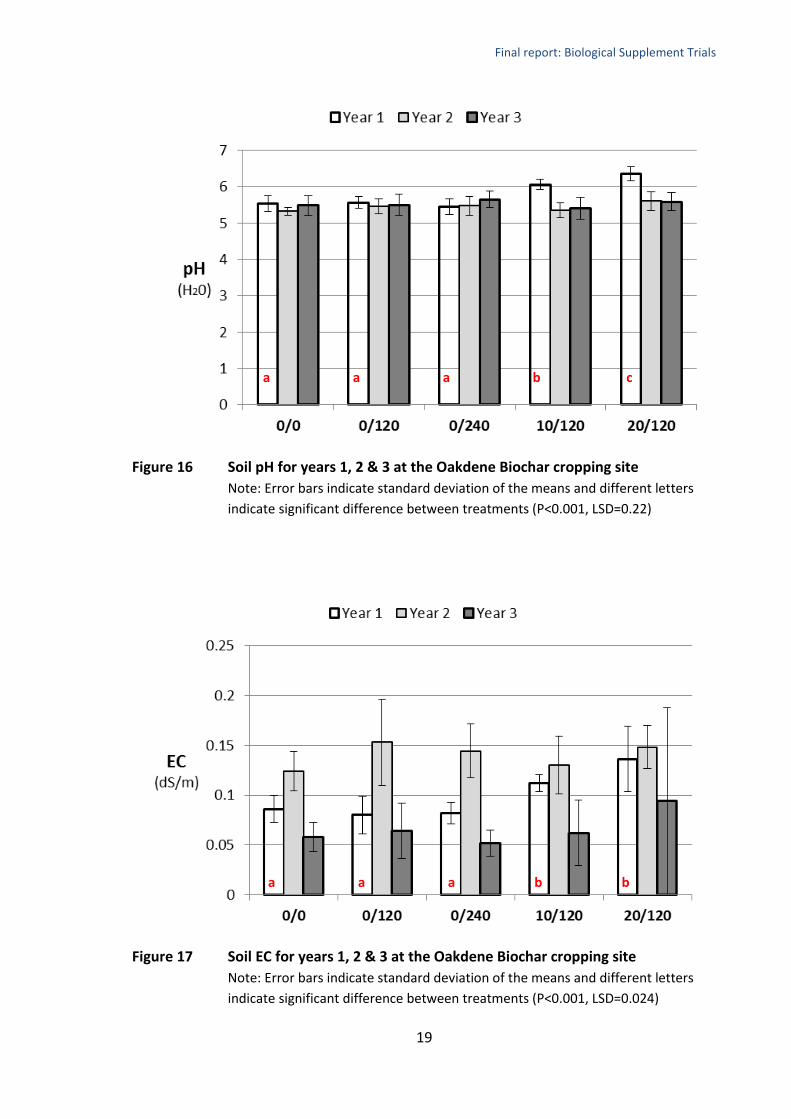
3.3.1 Soil pH and EC
There were significant treatment differences between biochar treatments and the
remaining treatments in the small scale cropping trial after year 1, with both pH and EC
higher for them 10 and 20 t/ha biochar treatments. However, in years 2 and 3, there
were no significant differences between the treatments. Refer to Figure 16 and Figure 17.
Final report: Biological Supplement Trials
19
Figure 16 Soil pH for years 1, 2 & 3 at the Oakdene Biochar cropping site
Note: Error bars indicate standard deviation of the means and different letters
indicate significant difference between treatments (P<0.001, LSD=0.22)
Figure 17 Soil EC for years 1, 2 & 3 at the Oakdene Biochar cropping site
Note: Error bars indicate standard deviation of the means and different letters
indicate significant difference between treatments (P<0.001, LSD=0.024)
a a a b b
a a a b c
Final report: Biological Supplement Trials
20
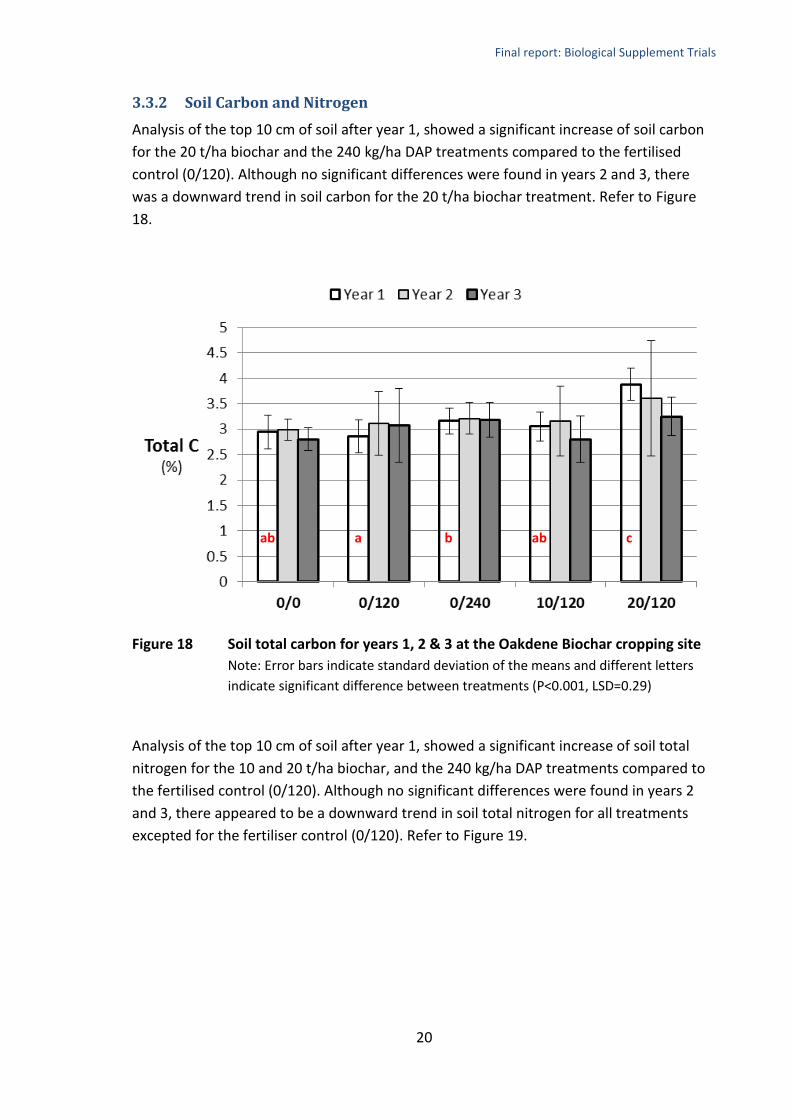
3.3.2 Soil Carbon and Nitrogen
Analysis of the top 10 cm of soil after year 1, showed a significant increase of soil carbon
for the 20 t/ha biochar and the 240 kg/ha DAP treatments compared to the fertilised
control (0/120). Although no significant differences were found in years 2 and 3, there
was a downward trend in soil carbon for the 20 t/ha biochar treatment. Refer to Figure
18.
Figure 18 Soil total carbon for years 1, 2 & 3 at the Oakdene Biochar cropping site
Note: Error bars indicate standard deviation of the means and different letters
indicate significant difference between treatments (P<0.001, LSD=0.29)
Analysis of the top 10 cm of soil after year 1, showed a significant increase of soil total
nitrogen for the 10 and 20 t/ha biochar, and the 240 kg/ha DAP treatments compared to
the fertilised control (0/120). Although no significant differences were found in years 2
and 3, there appeared to be a downward trend in soil total nitrogen for all treatments
excepted for the fertiliser control (0/120). Refer to Figure 19.
ab a b ab c

Final report: Biological Supplement Trials
21
Figure 19 Soil total nitrogen for years 1, 2 & 3 at the Oakdene Biochar cropping site
Note: Error bars indicate standard deviation of the means and different letters
indicate significant difference between treatments (P<0.001, LSD=0.02)
3.3.3 Crop Growth
Crop growth was assessed in the first year in terms of vigour and biomass at GS 30. The
biochar and fertilised treatments were all significantly more vigorous and had a higher
biomass than the unfertilised control (0/0). Refer to Figure 20 and Figure 21. However,
the biochar treatments were not significantly higher in biomass than the 240 kg/ha DAP
treatment (0/240).
At the end of year 1, the 10 and 20 t/ha biochar treatments and the 240 kg/ha DAP
treatments yielded significantly higher than the fertilised (0/120) and unfertilised (0/0)
control treatments (Refer to Figure 22). Although treatment differences appeared similar
at the end of year 2, the differences were not significant. In year 3, height of the canola
crop at GS 71 showed a difference between the 20t/ha Biochar treatment and all other
treatments, although not significant (P=0.082). Refer to Figure 23.
ab a b b c

Final report: Biological Supplement Trials
22
Figure 20 Year 1 wheat vigour rating for Oakdene Biochar trial at GS21-30
Note: Error bars indicate standard deviation of the means and different letters
indicate significant difference between treatments (P<0.001, LSD=0.68)
Figure 21 Year 1 biomass for Oakdene Biochar trial at GS21-30
Note: Error bars indicate standard deviation of the means and different letters
indicate significant difference between treatments (P<0.001, LSD=0.12)
a b bc cd d
a b c c c

Final report: Biological Supplement Trials
23
Figure 22 Year 1 & 2 wheat yield for Oakdene Biochar trial
Note: Error bars indicate standard deviation of the means and different letters
indicate significant difference between treatments (P<0.001, LSD=0.37)
Figure 23 Year 3 height of canola for Oakdene Biochar trial
Note: Error bars indicate standard deviation of the means
Final report: Biological Supplement Trials
24
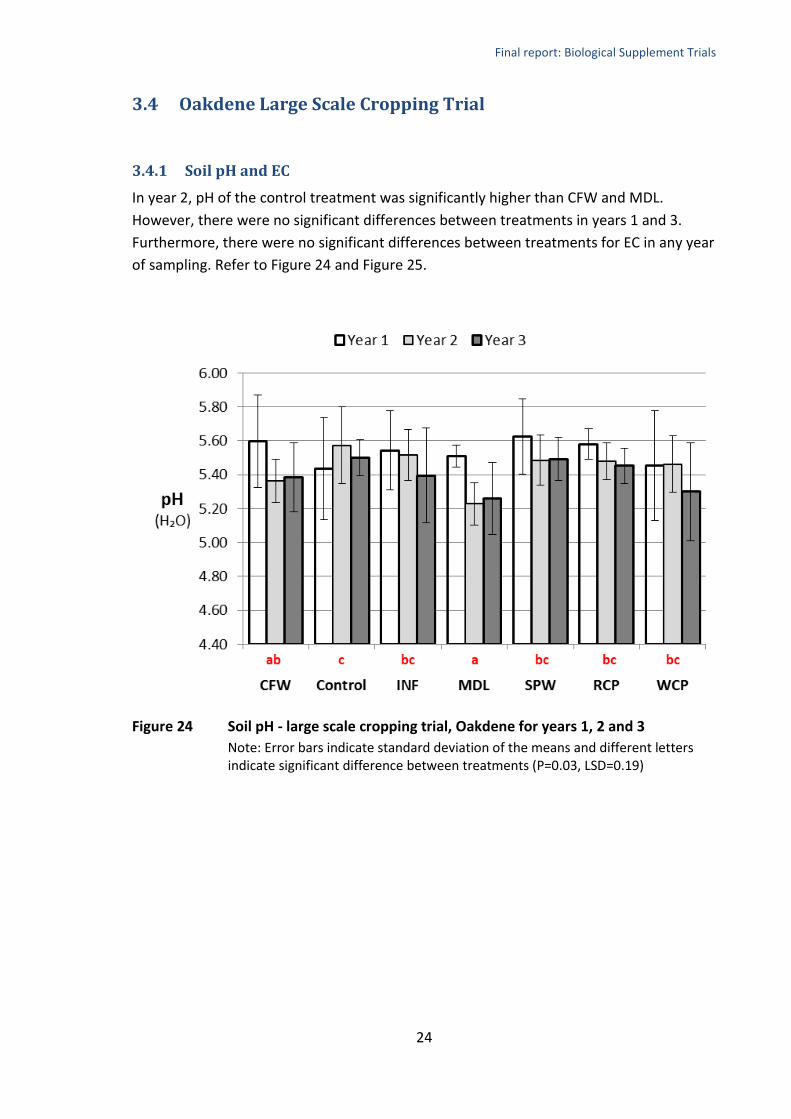
3.4 Oakdene Large Scale Cropping Trial
3.4.1 Soil pH and EC
In year 2, pH of the control treatment was significantly higher than CFW and MDL.
However, there were no significant differences between treatments in years 1 and 3.
Furthermore, there were no significant differences between treatments for EC in any year
of sampling. Refer to Figure 24 and Figure 25.
Figure 24 Soil pH - large scale cropping trial, Oakdene for years 1, 2 and 3
Note: Error bars indicate standard deviation of the means and different letters indicate significant difference between treatments (P=0.03, LSD=0.19)

Final report: Biological Supplement Trials
25
Figure 25 Soil EC at the large scale cropping trial, Oakdene for years 1, 2 and 3
Note: Error bars indicate standard deviation of the means
3.4.2 Soil Carbon and Nitrogen
There were no significant differences between treatments at the end of each cropping
year for soil total carbon and nitrogen. However, analysing the combined data for all
years showed that WCP treatment was significantly higher than any other treatment
(except INF with total carbon) for both anolytes. Refer to Figure 26 and Figure 27 for soil
total carbon, and Figure 28 and Figure 29 for soil total nitrogen.

Final report: Biological Supplement Trials
26
Figure 26 Soil total carbon - large scale trial, Oakdene for years 1, 2 & 3
Note: Error bars indicate standard deviation of the means
Figure 27 Soil total carbon – large scale trial, Oakdene for 3 years combined
Note: Error bars indicate standard deviation of the means and different letters indicate significant difference between treatments (P=0.028, LSD=0.45)

Final report: Biological Supplement Trials
27
Figure 28 Soil total nitrogen - large scale trial, Oakdene for years 1, 2 and 3
Note: Error bars indicate standard deviation of the means
Figure 29 Soil total nitrogen – large scale trial, Oakdene for 3 years combined
Note: Error bars indicate standard deviation of the means and different letters
indicate significant difference between treatments (P=0.045, LSD=0.03)
Final report: Biological Supplement Trials
28
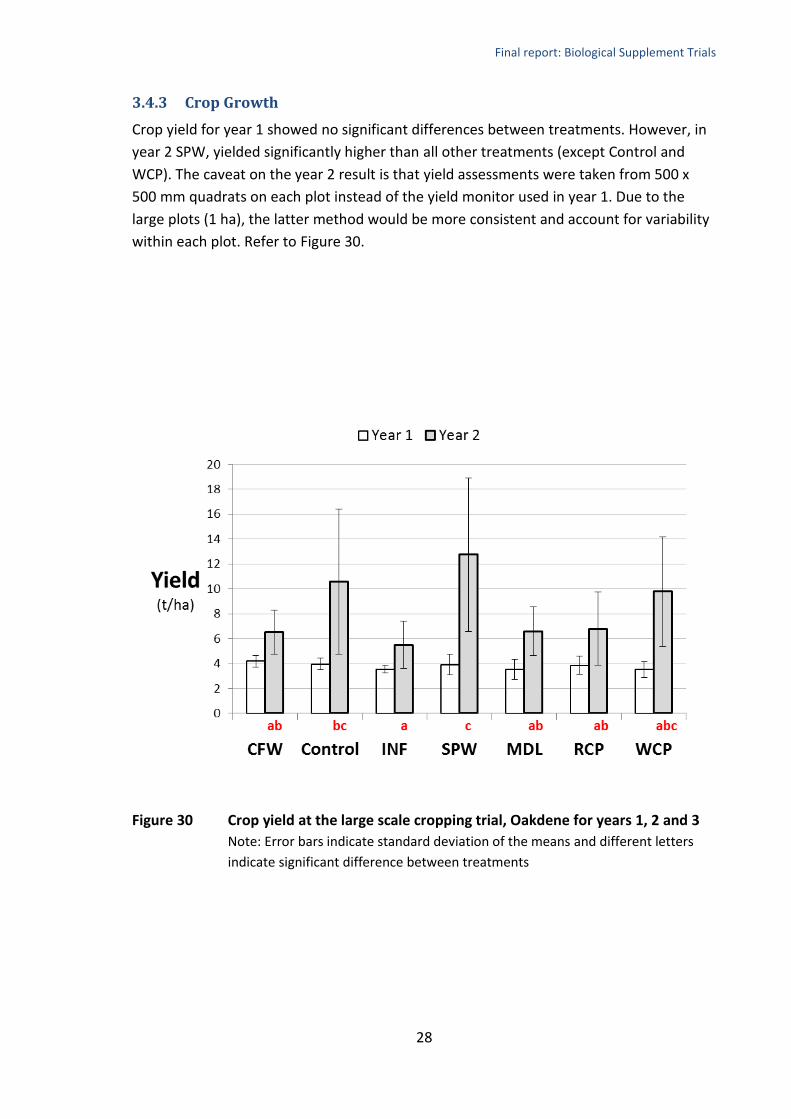
3.4.3 Crop Growth
Crop yield for year 1 showed no significant differences between treatments. However, in
year 2 SPW, yielded significantly higher than all other treatments (except Control and
WCP). The caveat on the year 2 result is that yield assessments were taken from 500 x
500 mm quadrats on each plot instead of the yield monitor used in year 1. Due to the
large plots (1 ha), the latter method would be more consistent and account for variability
within each plot. Refer to Figure 30.
Figure 30 Crop yield at the large scale cropping trial, Oakdene for years 1, 2 and 3
Note: Error bars indicate standard deviation of the means and different letters
indicate significant difference between treatments
Final report: Biological Supplement Trials
29
4 Discussion Many bio-resources used in agriculture for soil amendments have not been manufactured
for this purpose and contain many nutrients in an ‘organic’ form with unknown or
variable degradation or release rates. Bio-resources such as animal manures and other
organic materials are continually being investigated for use in agriculture (Dong et al.,
2005; Flavel and Murphy, 2006) and are often applied to soil in lieu of inorganic fertiliser
to supply essential plant nutrients (Golabi et al., 2007; Kidd et al., 2007). However, the
inherent difficulty with using alternative materials is the variation and availability of
nutrients depending on management, product composition and consistency. The main
objective of applying the range of bio-resources used in the pasture and cropping trials
reported was to determine any changes in soil carbon, nitrogen and pH over the short to
medium term.
A decrease soil organic carbon (SOC) can negatively affect soil physical functions including
structural stability, water holding capacity and thermal properties (Baldock and
Skjemstad, 1999). Such decreases can be exacerbated through conventional tillage and
irrigation (Gwenzi et al., 2009), which is why trials were conducted on pasture as well as
in a cropping situation.
4.1 Soil pH & EC
4.1.1 Soil pH
The soil pH of the pasture and cropping sites three years after applying treatments were
not significantly different to the pre-trial soil test. After year 1 the biochar trial did show a
significant increase in pH with the 20 t/ha Biochar + 120 kg/ha DAP. After year 2, the large
scale trial showed that the pH for Cattle Feedlot Waste (CFW) and manure digest liquid
(MDL) was significantly lower than all other treatments. Given that the pH of most of the
treatments pre-application was below 7.7 (except SPW at 8.73) and soil pH can change
depending on time of year, it was unlikely that there would be any significant increase in
pH as a result of the amendment applications. Although pH under pasture has been
known to decrease over time, the use of chemical fertilisers has also shown a decrease in
pH that is then addressed with a lime application. The decrease in pH for all treatments at
Formosa under long term pasture may have been due to the wet winter spring
experience in 2013.
Final report: Biological Supplement Trials
30
4.1.2 Soil EC
Although there were some significant differences between treatments in the small scale
biochar trial for EC, the absolute values are still within an acceptable range for crop
growth. The main point of measuring EC is to ensure that dissolved salts from the
amendments do not accumulate in the soil over time and create plant growth issues
associated with salinity.
4.2 Soil Carbon and Nitrogen
4.2.1 Soil total carbon
Total carbon measured at the Formosa site showed a decrease from pre-trial levels for all
organic treatments in year 2. This appeared to be inversely related to the crop growth for
the same period, which showed a trend increase in pasture yield for the same treatments
(not significant). However, by the end of the trial all treatments had shown an increase in
soil carbon from pre-trial levels. Previous research has shown that soil carbon can be
maintained under long term pasture although fluctuations can occur as a result of wet
and dry seasons.
In the cropping trial, soil carbon for the 20 t/ha biochar treatment was significantly higher
than the other treatments after the first year and higher than pre-trial levels. Although
biochar is added to soils (as a stable source of carbon) to increase soil carbon, this trial
was looking at the longevity of this type of treatment to maintain soil carbon levels. All
other treatments decreased from pre-trial levels after the first year as a result of the
cropping (all treatments were cultivated in). Only the 20 t/ha biochar treatment remained
above pre-trial soil carbon levels at the end of the three year trial. This suggests that in a
cropping regime, even adding biochar does not provide a long term solution for
maintaining soil carbon.
The large scale cropping trial, which was direct drilled, showed that the WCP treatment
significantly increased soil carbon more than the other treatments and more than pre-
trial levels. However, the results also show that a single application may only last for 2
years before re-application is needed.
4.2.2 Soil total nitrogen
Total nitrogen at the Formosa long term pasture site showed a decrease in the first year,
similar to the carbon trend. However, levels at the end of the trial were not lower than
pre-trail soil nitrogen.
In the biochar trial, the significant increase in Total N for the 20 t/ha biochar treatment
was not sustained over the length of the trial. However, similar to the soil carbon, the
high biochar treatment did not result in lower total N at the end of the trial than pre-trial
levels.

Final report: Biological Supplement Trials
31
Total nitrogen for the large scale cropping trial at Oakdene followed a similar trend to the
soil carbon, with WCP treatment being significantly higher across the three years.
4.3 Plant growth
Plant response to soil amendments has been regarded by Warman (1998), as being
influenced more by seasonal variation in soil moisture and temperature than by the
added amendment. Maynard and Hill (1994) also suggested that compost amendments
might not provide immediate effects to plants in one application, and that sustained
applications might result in cumulative effects. The results of the pasture and cropping
trials showed that increased yields can be obtained from applying 10 and 20 t/ha biochar
in the first year. However, the results suggest that single applications of soil amendments
over the longer term will not maintain consistent results.

Final report: Biological Supplement Trials
32
5 Conclusion The pasture and cropping trials established at ‘Formosa’ and “Oakdene’ respectively to
determine the effects of biological (organic) and inorganic soil amendments on soil pH,
total nitrogen and total carbon in the top 10 cm of soil over a 2 – 3 year period, showed
varied responses.
The results showed a decrease in soil carbon and nitrogen under long term pasture in the
first eighteen months after application of compost concomitant with an increase in
pasture productivity. The increase in productivity may have been due to increased
nutrient release from an increase in activity of the soil fauna in response to the compost
applications. Both soil carbon and nitrogen showed a subsequent increase up until the
end of the project. The results demonstrate that repeat application may be necessary to
maintain soil carbon over the longer term; however, longer term measurements would be
required to determine the appropriate application frequency.
Annual cropping in the large scale trail showed mixed results with no clear distinction
between treatments within each year. This was despite the use of no-till techniques and
incorporation of amendments through ground disturbance with direct drill planting.
However, across the three years the compost from Woodrising Farms (WCP) showed
significantly higher soil carbon and nitrogen. The decline in the third year indicates that
similar to long term pasture, repeat applications may be necessary to maintain soil carbon
levels. This trial shows that applications may be required at least once every two years.
The addition of a carbon source to the soil in the form of biochar showed an increase in
both pH and nitrogen, nine months after application. However, this was short lived with
subsequent decreases over the following 2 years.
These series of trials has shown that a single application of organic amendments on both
cropping and long term pasture in an effort to increase soil carbon may not be effective in
the long term. However, the results have given an indication of the frequency that may be
required. Although longer term trials may provide the answers required to assist in
determining application frequency, fully characterising the amendments and their
behaviour in different soil types and environments for modelling may be a more cost
effective method.

Final report: Biological Supplement Trials
33
6 References Baldock, J A and Skjemstad, J O (1999). Soil Organic Carbon/Soil Organic Matter. Soil
Analysis: an interpretation manual. K. I. Peverill, L. A. Sparrow and D. J. Reuter.
Collingwood, CSIRO Publishing: 159-170.
Dong, Y, Ouyang, Z and Liu, S (2005). "Nitrogen transformation in maize soil after
application of different organic manures." Journal of Environmental Sciences 17(2): 340-
343.
Flavel, T C and Murphy, D V (2006). "Carbon and Nitrogen Mineralization Rates after
Application of Organic Amendments to Soil." Journal of Environmental Quality 35(1): 183-
193.
Golabi, M H, Denney, M J and Lyekar, C (2007). "Value of Composted Organic Wastes As
an Alternative to Synthetic Fertilizers For Soil Quality Improvement and Increased Yield."
Compost Science & Utilization 15(4): 267-271.
Gwenzi, W, Gotosa, J, Chakanetsa, S and Mutema, Z (2009). "Effects of tillage systems on
soil organic carbon dynamics, structural stability and crop yields in irrigated wheat
(Triticum aestivum L.)–cotton (Gossypium hirsutum L.) rotation in semi-arid Zimbabwe."
Nutrient Cycling in Agroecosystems 83(3): 211-221.
Kidd, P S, Dominguez-Rodriguez, M J, Diez, J and Monterroso, C (2007). "Bioavailability
and plant accumulation of heavy metals and phosphorus in agricultural soils amended by
long-term application of sewage sludge." Chemosphere 66(8): 1458-1467.
Maynard, A A and Hill, D E (1994). "Impact of compost on vegetable yields." BioCycle 35:
66-67.
Warman, P R and Havard, K A (1998). "Yield, vitamin and mineral contents of organically
and conventionally grown potatoes and sweet corn." Agriculture, Ecosystems and
Environment 68: 207-216.
Final report: Biological Supplement Trials
34
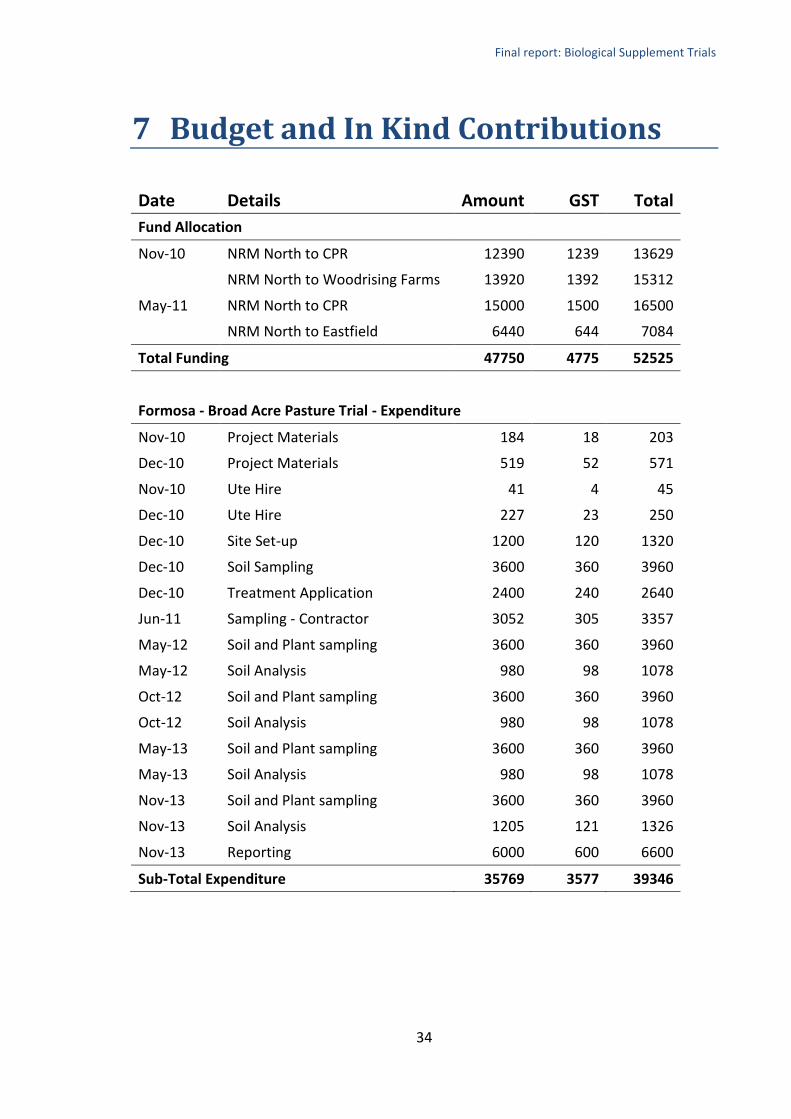
7 Budget and In Kind Contributions
Date Details Amount GST Total
Fund Allocation
Nov-10 NRM North to CPR 12390 1239 13629
NRM North to Woodrising Farms 13920 1392 15312
May-11 NRM North to CPR 15000 1500 16500
NRM North to Eastfield 6440 644 7084
Total Funding 47750 4775 52525
Formosa - Broad Acre Pasture Trial - Expenditure
Nov-10 Project Materials 184 18 203
Dec-10 Project Materials 519 52 571
Nov-10 Ute Hire 41 4 45
Dec-10 Ute Hire 227 23 250
Dec-10 Site Set-up 1200 120 1320
Dec-10 Soil Sampling 3600 360 3960
Dec-10 Treatment Application 2400 240 2640
Jun-11 Sampling - Contractor 3052 305 3357
May-12 Soil and Plant sampling 3600 360 3960
May-12 Soil Analysis 980 98 1078
Oct-12 Soil and Plant sampling 3600 360 3960
Oct-12 Soil Analysis 980 98 1078
May-13 Soil and Plant sampling 3600 360 3960
May-13 Soil Analysis 980 98 1078
Nov-13 Soil and Plant sampling 3600 360 3960
Nov-13 Soil Analysis 1205 121 1326
Nov-13 Reporting 6000 600 6600
Sub-Total Expenditure 35769 3577 39346

Final report: Biological Supplement Trials
35
Date Details Amount GST Total
Formosa Broad Acre Pasture Trial - In Kind Contributions
Insurance & Infrastructure 5309 531 5840
Dec-10 Inorganic Fertiliser 750 75 825
Dec-10 Woodrising Compost 900 90 990
Dec-10 Renew Compost 1350 135 1485
Dec-10 Poppy Waste 900 90 990
Dec-10 Microbial Wastewater 200 20 220
Dec-10 Treatment Application 2400 240 2640
May-11 Slashing sampling Area 255 26 281
Oct-11 Slashing sampling Area 255 26 281
May-12 Transport 450 45 495
Oct-12 Transport 450 45 495
May-13 Transport 450 45 495
Nov-13 Transport 450 45 495
Sub-Total In Kind Contributions 14119 1412 15531
Oakdene - Broad Acre Cropping Trial - Expenditure
Apr-11 Area Pegged Out 360
Nov-11 Renew Compost 900 90 990
Feb-12 Soil Sampling 3600 360 3960
May-12 Soil Analysis - Agvita 2030 203 2233
May-12 Soil Analysis - Agvita 480 48 528
Mar-13 Soil and Plant Sampling 3600 360 3960
May-13 Soil Analysis - Agvita 2030 203 2233
Nov-13 Soil and Plant Sampling 3600 360 3960
Nov-13 Soil Analysis - Agvita 2030 203 2233
Nov-13 Reporting 6000 600 6600
Sub-Total Expenditure 24630 2427 26697
Final report: Biological Supplement Trials
36
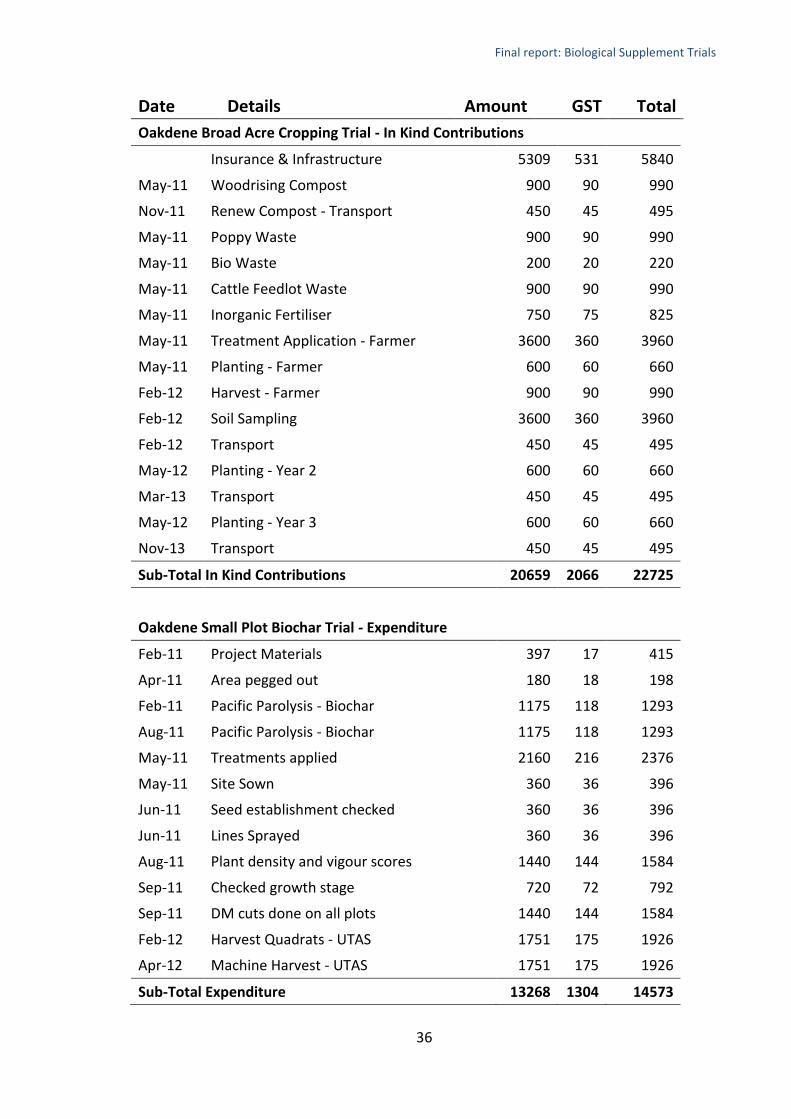
Date Details Amount GST Total
Oakdene Broad Acre Cropping Trial - In Kind Contributions
Insurance & Infrastructure 5309 531 5840
May-11 Woodrising Compost 900 90 990
Nov-11 Renew Compost - Transport 450 45 495
May-11 Poppy Waste 900 90 990
May-11 Bio Waste 200 20 220
May-11 Cattle Feedlot Waste 900 90 990
May-11 Inorganic Fertiliser 750 75 825
May-11 Treatment Application - Farmer 3600 360 3960
May-11 Planting - Farmer 600 60 660
Feb-12 Harvest - Farmer 900 90 990
Feb-12 Soil Sampling 3600 360 3960
Feb-12 Transport 450 45 495
May-12 Planting - Year 2 600 60 660
Mar-13 Transport 450 45 495
May-12 Planting - Year 3 600 60 660
Nov-13 Transport 450 45 495
Sub-Total In Kind Contributions 20659 2066 22725
Oakdene Small Plot Biochar Trial - Expenditure
Feb-11 Project Materials 397 17 415
Apr-11 Area pegged out 180 18 198
Feb-11 Pacific Parolysis - Biochar 1175 118 1293
Aug-11 Pacific Parolysis - Biochar 1175 118 1293
May-11 Treatments applied 2160 216 2376
May-11 Site Sown 360 36 396
Jun-11 Seed establishment checked 360 36 396
Jun-11 Lines Sprayed 360 36 396
Aug-11 Plant density and vigour scores 1440 144 1584
Sep-11 Checked growth stage 720 72 792
Sep-11 DM cuts done on all plots 1440 144 1584
Feb-12 Harvest Quadrats - UTAS 1751 175 1926
Apr-12 Machine Harvest - UTAS 1751 175 1926
Sub-Total Expenditure 13268 1304 14573
Final report: Biological Supplement Trials
37
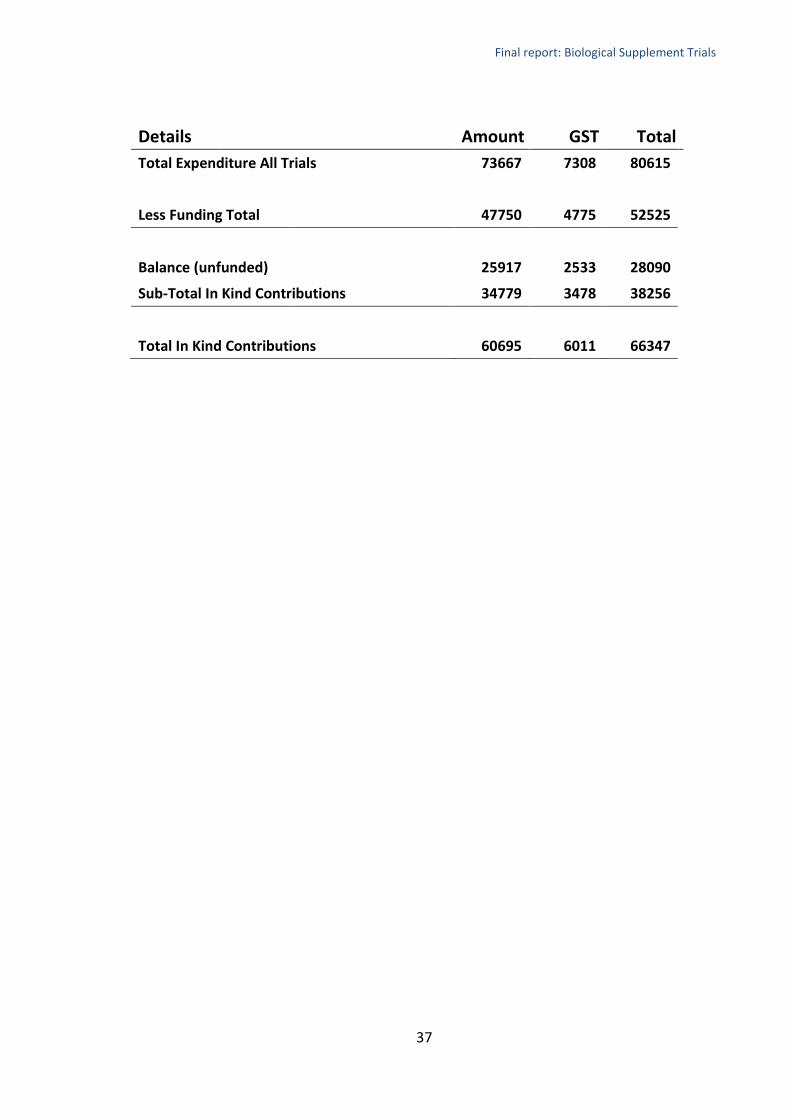
Details
Amount GST Total
Total Expenditure All Trials 73667 7308 80615
Less Funding Total 47750 4775 52525
Balance (unfunded) 25917 2533 28090
Sub-Total In Kind Contributions 34779 3478 38256
Total In Kind Contributions 60695 6011 66347