biological stressor identification · bluff creek tmdl biological stressor identification. march....
TRANSCRIPT

Bluff Creek TMDL
Biological Stressor Identification
Prepared for City of Chanhassen and Minnesota Pollution Control Agency March 2010
Bluff Creek TMDL
Biological Stressor Identification
Prepared for City of Chanhassen and Minnesota Pollution Control Agency March 2010
4700 West 77th
Street Minneapolis, MN 55435-4803 Phone: (952) 832-2600 Fax: (952) 832-2601

P:\Mpls\23 MN\27\2327I25 Bluff Creek Watershed TMDL\Work Files\Biotic TMDL – Stressor ID\Bluff Creek Stressor Identification i
Bluff Creek TMDL Biological Stressor Identification March 2010
Table of Contents
1.0 Introduction ............................................................................................................................................ 1 2.0 Background ............................................................................................................................................ 2 3.0 Define the Impairment ........................................................................................................................... 6
3.1 The Biological Impairment and Its Basis .................................................................................... 6 3.2 Specific Effects ........................................................................................................................... 9 3.3 The Investigation’s Purpose ...................................................................................................... 13 3.4 The Geographic Area Under Investigation ............................................................................... 13
4.0 Candidate Causes of Biological Impairment........................................................................................ 14 4.1 Eliminated Candidate Causes.................................................................................................... 14
4.1.1 Presence of Toxics ....................................................................................................... 14 4.1.2 Low Dissolved Oxygen ................................................................................................ 14 4.1.3 pH ................................................................................................................................. 19 4.1.4 Nutrients ....................................................................................................................... 19 4.1.5 Temperature ................................................................................................................. 26
4.2 Candidate Causes ...................................................................................................................... 34 4.2.1 Candidate Cause 1: Habitat Fragmentation ................................................................ 34 4.2.2 Candidate Cause 2: Sediment ..................................................................................... 37 4.2.3 Candidate Cause 3: Flow ............................................................................................ 47 4.2.4 Candidate Cause 4: Metals Contamination ................................................................. 53 4.2.5 Candidate Cause 5: Ionic Strength .............................................................................. 70
5.0 Evaluate Data From the Case ............................................................................................................... 78 5.1 Candidate Cause 1: Habitat Fragmentation ............................................................................. 79
5.1.1 Spatial Co-occurrence .................................................................................................. 79 5.1.2 Evidence of Exposure or Biological Mechanism ......................................................... 79 5.1.3 Symptoms .................................................................................................................... 79 5.1.4 Causal Pathway ............................................................................................................ 80 5.1.5 Temporal Sequence ...................................................................................................... 80
5.2 Candidate Cause 2: Sediment .................................................................................................. 80 5.2.1 Spatial/Temporal Co-occurrence ................................................................................. 80 5.2.2 Evidence of Exposure or Biological Mechanism ......................................................... 81 5.2.3 Symptoms .................................................................................................................... 81 5.2.4 Causal Pathway ............................................................................................................ 82 5.2.5 Temporal Sequence ...................................................................................................... 82

P:\Mpls\23 MN\27\2327I25 Bluff Creek Watershed TMDL\Work Files\Biotic TMDL – Stressor ID\Bluff Creek Stressor Identification ii
5.3 Candidate Cause 3: Flow ......................................................................................................... 82 5.3.1 Temporal Co-occurrence ............................................................................................. 82 5.3.2 Evidence of Exposure or Biological Mechanism ......................................................... 83 5.3.3 Causal Pathway ............................................................................................................ 84 5.3.4 Temporal Sequence ...................................................................................................... 84 5.3.5 Manipulation of Exposure ............................................................................................ 84
5.4 Candidate Cause 4: Metals Contamination .............................................................................. 84 5.4.1 Temporal Co-occurrence ............................................................................................. 84 5.4.2 Evidence of Exposure or Biological Mechanism ......................................................... 85 5.4.3 Symptoms .................................................................................................................... 86 5.4.4 Causal Pathway ............................................................................................................ 86 5.4.5 Temporal Sequence ...................................................................................................... 87
5.5 Candidate Cause 5: Ionic Strength ........................................................................................... 87 5.5.1 Temporal Co-occurrence ............................................................................................. 87 5.5.2 Temporal Sequence ...................................................................................................... 88 5.5.3 Causal Pathway ............................................................................................................ 88 5.5.4 Stressor Response Relationships From the Field ......................................................... 88 5.5.5 Symptoms .................................................................................................................... 88
6.0 Evaluate Data From Elsewhere ............................................................................................................ 89 6.1 Habitat Fragmentation .............................................................................................................. 89
6.1.1 Plausible Mechanism ................................................................................................... 89 6.1.2 Plausible Stressor Response ......................................................................................... 89
6.2 Sediment ................................................................................................................................... 89 6.2.1 Plausible Mechanism ................................................................................................... 89 6.2.2 Plausible Stressor Response ......................................................................................... 90
6.3 Flow .......................................................................................................................................... 91 6.3.1 Plausible Mechanism ................................................................................................... 91 6.3.2 Plausible Stressor Response ......................................................................................... 91
6.4 Metals Contamination ............................................................................................................... 92 6.4.1 Plausible Mechanism ................................................................................................... 92 6.4.2 Plausible Stressor Response ......................................................................................... 92
7.0 Identify Probable Causes ...................................................................................................................... 93 References ................................................................................................................................................... 95

P:\Mpls\23 MN\27\2327I25 Bluff Creek Watershed TMDL\Work Files\Biotic TMDL – Stressor ID\Bluff Creek Stressor Identification iii
List of Tables
Table 1 1999-2006 Evaluation of Bluff Creek Biological Attributes: B-1 ........................................................... 11 Table 2 2000 Evaluation of Bluff Creek Biological Attributes: 00MN008 and 00MN009 .................................... 12 Table 3 Bluff Creek Average IBI Metric Scores .................................................................................................. 12 Table 4 Invertebrate Metrics Indicating Presence of Toxic Chemicals and 1999-2005 Bluff Creek Values—
B-1 ........................................................................................................................................................ 14 Table 5 Bluff Creek Water Quality Data Summary for June 1-29, 1998: B-1 ...................................................... 24 Table 6 Summer Average Maximum and Average Daily Variation For 6 Reference Streams With Coldwater
Temperatures Within the Minnesota River Basin (MPCA 2008a) ............................................................ 31 Table 7 Habitat Summary of EUC-B1. ................................................................................................................ 45 Table 8 Bluff Creek Evidence Table for Habitat Fragmentation: Evidence Using Data From Bluff Creek ........... 79 Table 9 Bluff Creek Evidence Table for Sediment: Evidence Using Data From Bluff Creek ............................... 81 Table 10 Bluff Creek Evidence Table for Flow: Evidence Using Data From Bluff Creek ...................................... 83 Table 11 Bluff Creek Evidence Table for Metals: Evidence Using Data From Bluff Creek ................................... 86 Table 12 Bluff Creek Evidence Table for Ionic Strength: Evidence Using Data From Bluff Creek ........................ 87 Table 13 Bluff Creek Evidence Table for Habitat Fragmentation: Evidence Using Data From Elsewhere .............. 89 Table 14 Bluff Creek Evidence Table for Sediment: Evidence Using Data From Elsewhere .................................. 90 Table 15 Bluff Creek Evidence Table for Flow: Evidence Using Data From Elsewhere ........................................ 91 Table 16 Bluff Creek Evidence Table for Metals: Evidence Using Data From Elsewhere...................................... 92 Table 17 Bluff Creek Strength of Evidence Summary Table .................................................................................. 93
List of Figures
Figure 1 Stressor Identification Process .................................................................................................................. 1 Figure 2 Biological Sample Locations—Bluff Creek TMDL Study ......................................................................... 3 Figure 3 1999-2006 Bluff Creek IBI Summary—Stations B-1, 00MN008, and 00MN009 ....................................... 7 Figure 4 1997-2006 Bluff Creek IBI Summary—Stations B1-B5 ............................................................................ 8 Figure 5 1996-2005 Bluff Creek Average Discharge at Stations B-1, B-2, B-3, B-4, and B-5 ................................ 10 Figure 6 1997-2006 Minneapolis/St. Paul Cumulative Precipitation (Monthly Time Step) .................................... 10 Figure 7 1991-2008 Bluff Creek Dissolved Oxygen Data: B-1 and WOMP Stations............................................. 15 Figure 8 2008 Bluff Creek Daily Maximum, Average, and Minimum Dissolved Oxygen Concentrations at the
Highway 212 WOMP Station ................................................................................................................. 16 Figure 9 2008 Bluff Creek Continuous Dissolved Oxygen Concentrations at Pioneer Trail and Highway 212 ........ 17 Figure 10 1992-2005 Bluff Creek Macroinvertebrates: HBI Summary of B-1 ........................................................ 18 Figure 11 1993-2008 Bluff Creek pH Data: WOMP Station................................................................................... 19 Figure 12 1993-2008 Bluff Creek Total Phosphorus: WOMP Station ..................................................................... 20 Figure 13 1993-2008 Bluff Creek Total Dissolved Phosphorus: WOMP Station .................................................... 21 Figure 14 1993-2008 Bluff Creek Total Kjeldahl Nitrogen: WOMP Station ........................................................... 21 Figure 15 1993-2008 Bluff Creek Nitrate Nitrogen: WOMP Station ...................................................................... 22 Figure 16 1993-2008 Bluff Creek Nitrite Nitrogen: WOMP Station ....................................................................... 22 Figure 17 1993-2008 Bluff Creek Ammonia Nitrogen: WOMP Station .................................................................. 23 Figure 18 1998 Bluff Creek Periphyton Growth Study: B-1 ................................................................................... 24

P:\Mpls\23 MN\27\2327I25 Bluff Creek Watershed TMDL\Work Files\Biotic TMDL – Stressor ID\Bluff Creek Stressor Identification iv
Figure 19 1998 Bluff Creek June Flow Values ....................................................................................................... 25 Figure 20 1993-2008 Bluff Creek Unionized Ammonia: WOMP Station ............................................................... 26 Figure 21 1998 Bluff Creek Minimum, Average, and Maximum Daily Temperature Measurements ........................ 28 Figure 22 2008 Bluff Creek Minimum, Average, and Maximum Daily Temperature Measurements ........................ 28 Figure 23 1996-2005 Bluff Creek Temperature Data: B-1 ..................................................................................... 29 Figure 24 Comparison of 1998 and 2008 Bluff Creek Average Daily Flows During June 15 Through August 31
Period .................................................................................................................................................... 30 Figure 25 Comparison of 1998 and 2008 Bluff Creek Summer Daily Temperature Differences Between
Maximum and Minimum Temperatures .................................................................................................. 30 Figure 26 Percent of Total Individuals Represented by Brook Stickleback in Bluff Creek During 1999 -2006 .......... 33 Figure 27 Percent of Fish Species Represented by Brook Stickleback in Bluff Creek During 1999-2006 ................. 33 Figure 28 Large drop at downstream end of regional trail culvert ............................................................................. 34 Figure 29 Conceptual Model of Candidate Cause 1: Habitat Fragmentation ............................................................. 36 Figure 30 1993-2008 Bluff Creek Total Suspended Solids: WOMP Station ........................................................... 38 Figure 31 1993-2008 Bluff Creek Volatile Suspended Solids: WOMP Station ....................................................... 38 Figure 32 1993-2008 Bluff Creek Turbidity: WOMP Station ................................................................................. 39 Figure 33 Conceptual Model of Candidate Cause 2: Sediment ................................................................................. 41 Figure 34 Overview Map: Bluff Creek Channel Survey ............................................................................................ 41 Figure 35 Streambank Erosion is Undermining This Culvert at Site 1 ......................................................................... 49 Figure 36 Bluff Creek Stream Types: Bluff Creek TMDL Study ............................................................................ 43 Figure 37 Site 11 Noted Slope Failure ...................................................................................................................... 49 Figure 38 Severe Bank Erosion is Found at Site 20 ................................................................................................... 49 Figure 39 Bluff Creek Mean Annual TSS Compared With Number of Stoneflies at B-1 .......................................... 46 Figure 40 Increased Overland Flow Increases Ravine Erosion................................................................................... 497 Figure 41 2002-2008 Bluff Creek Average Daily Flows Compared With Bankfull Flow: WOMP Station ............... 48 Figure 42 Conceptual Model of Candidate Cause 3: Flow ......................................................................................... 49 Figure 43 1998-2008 Bluff Creek Average Daily Flows: WOMP Station ............................................................... 50 Figure 44 1998 Bluff Creek Discharge Data: B-1 and WOMP Station at Mile 3.5 .................................................. 50 Figure 45 1997 Bluff Creek Flows: WOMP Station ............................................................................................... 51 Figure 46 May Through December, 1997 Bluff Creek Flows: WOMP Station ........................................................ 52 Figure 47 1998 Bluff Creek Flows: WOMP Station ............................................................................................... 52 Figure 48 1999 Bluff Creek Flows: WOMP Station ............................................................................................... 53 Figure 49 1993-2008 Bluff Creek Total Lead Compared With Chronic Standard: WOMP Station .......................... 55 Figure 50. 1993-2008 Bluff Creek Total Lead: WOMP Station ............................................................................... 55 Figure 51. Lead versus Suspended Solids for Bluff Creek WOMP Site .................................................................... 56 Figure 52. Lead Water Quality Duration Curve for Bluff Creek WOMP Site ........................................................... 56 Figure 53 1993-2008 Bluff Creek Total Copper Compared With Chronic Standard: WOMP Station ...................... 57 Figure 54. 1993-2008 Bluff Creek Total Copper: WOMP Station ........................................................................... 57 Figure 55. Copper versus Suspended Solids for Bluff Creek WOMP Site ................................................................ 58 Figure 56. Copper Water Quality Duration Curve for Bluff Creek WOMP Site ........................................................ 58 Figure 57 1993-2008 Bluff Creek Total Zinc Compared With Chronic Standard: WOMP Station........................... 59 Figure 58. 1993-2008 Bluff Creek Total Zinc: WOMP Station ............................................................................... 59 Figure 59. Zinc versus Suspended Solids for Bluff Creek WOMP Site ..................................................................... 60 Figure 60. Zinc Water Quality Duration Curve for Bluff Creek WOMP Site ............................................................ 60 Figure 61 1993-2008 Bluff Creek Total Cadmium Compared With Chronic Standard: WOMP Station ................... 61

P:\Mpls\23 MN\27\2327I25 Bluff Creek Watershed TMDL\Work Files\Biotic TMDL – Stressor ID\Bluff Creek Stressor Identification v
Figure 62. 1993-2008 Bluff Creek Total Cadmium: WOMP Station ....................................................................... 61 Figure 63. Cadmium versus Suspended Solids for Bluff Creek WOMP Site ............................................................. 62 Figure 64. Cadmium Water Quality Duration Curve for Bluff Creek WOMP Site .................................................... 62 Figure 65 1993-2000 Bluff Creek Total Chromium Compared With Chronic Standard: WOMP Station ................. 63 Figure 66. 1993-2008 Bluff Creek Total Chromium: WOMP Station ...................................................................... 63 Figure 67. Chromium versus Suspended Solids for Bluff Creek WOMP .................................................................. 64 Figure 68. Chromium Water Quality Duration Curve for Bluff Creek WOMP Site................................................... 64 Figure 69 1993-2008 Bluff Creek Total Nickel Compared With Chronic Standard: WOMP Station ....................... 65 Figure 70. 1993-2008 Bluff Creek Total Nickel: WOMP Station ............................................................................ 65 Figure 71. Nickel versus Suspended Solids for Bluff Creek WOMP Site ................................................................. 66 Figure 72. Nickel Water Quality Duration Curve for Bluff Creek WOMP Site ......................................................... 66 Figure 73 Conceptual Model of Candidate Cause 4: Metals Contamination............................................................ 69 Figure 74 Number of Baetis brunneicolor Mayflies Observed at Bluff Creek Station B-1 and Mean Annual
Concentrations of Lead, Copper, and Zinc During 1999-2005 ................................................................. 70 Figure 75 1996-2005 Bluff Creek Specific Conductance Data: B-1 ........................................................................ 71 Figure 76 1993-2008 Bluff Creek Specific Conductance Data: WOMP Station ...................................................... 72 Figure 77. Specific Conductance versus Chloride for Bluff Creek WOMP Station ................................................... 72 Figure 78 Comparison of Bluff Creek Mean Annual Specific Conductance Values at B-1 and WOMP Stations ....... 73 Figure 79 1993-2008 Bluff Creek Chloride Data: WOMP Station .......................................................................... 74 Figure 80 Pictured Above is Heptagenia, a Mayfly ................................................................................................... 75 Figure 81. Hydropsyche Caddisflies.......................................................................................................................... 75 Figure 82. 1999-2005 IBI versus Specific Conductance: B1 ................................................................................... 75 Figure 83 Conceptual Model of Candidate Cause 5: Ionic Strength ........................................................................ 76 Figure 84 Comparison of Bluff Creek Mean Annual Specific Conductance Values and Mayfly Numbers at
Station B-1 ............................................................................................................................................ 77
List of Appendices
Appendix A Fish Data
Appendix B Comparison of Bluff Creek Specific Conductance Values and Mayfly Numbers
Appendix C Inventory and Assessment—Bluff Creek Lower Valley
Appendix D Scoring System for Types of Evidence
Appendix E Invertebrate Data

P:\Mpls\23 MN\27\2327I25 Bluff Creek Watershed TMDL\Work Files\Biotic TMDL – Stressor ID\Bluff Creek Stressor Identification 1
1.0 Introduction
In 2004, Bluff Creek was placed on the Minnesota Pollution Control Agency’s (MPCA) list of
impaired waters in need of a Total Maximum Daily Load (TMDL) study for impaired biota due to
low fish Index of Biotic Integrity (IBI) scores. Once water bodies are listed as impaired, stressors
causing impairment must be identified, and remediation efforts, including development of total
maximum daily loads (TMDL) for identified pollutants, need to be initiated. The Stressor
Identification process is a formal method developed by the Environmental Protection Agency (EPA)
by which the causes of biological impairment may be identified through a step-by-step procedure. In
this process, existing biological, chemical, physical, and land-use data are analyzed to determine
probable causes of impairment for aquatic organisms. This procedure lists candidate causes for
impairment, examines available data for each candidate, and characterizes the probable cause(s)
(Figure 1).
Figure 1 Stressor Identification Process
The Causal Analysis / Diagnosis Decision Information System (CADDIS) is an internet tool
developed by the EPA to guide the user through the Stressor Identification Process (Figure 1).
CADDIS was used to evaluate, identify, and rank the stressors causing the biological impairments in
Bluff Creek.

P:\Mpls\23 MN\27\2327I25 Bluff Creek Watershed TMDL\Work Files\Biotic TMDL – Stressor ID\Bluff Creek Stressor Identification 2
2.0 Background
Bluff Creek is a small tributary of the Lower Minnesota River. The stream begins at the headwaters
located near Trunk Highway 41 on the north and discharges into the Minnesota River Floodplain
(Figure 2). The catchment area at the outlet of Bluff Creek in Rice Lake is 6.4 square miles, the total
length of the main stem is 7.5 miles, the mean streamwise slope varies between 0.08 percent and
0.70 percent, and the creek is moderate to fully entrenched for most of its course (Riley-Purgatory-
Bluff Creek Watershed District, 1996). The watershed land use of the upper reaches is comprised of
a mix of forested upland and meadow. The middle reach notes a mix of land uses and is rapidly
urbanizing. The lower reach notes steep valley walls, is highly sinuous, and lined with trees. About
85 percent of the catchment is covered by high-relief, hummocky glacial deposits of loamy till, with
some localized organic deposits of muck. It is worth mentioning that Lusardi (1997) delineated
discontinuous scarps along the relatively flat middle reach referred to above. These scarps could be
tracking a former (in geologic time scale), relatively wide fluvial channel, which presumably has
been filled with sediment from the adjacent highly-erodible upland areas that the creek has not had
the capacity to transport downstream. The remaining lower 15 percent of the catchment is covered
by low-relief glacial deposits of loamy till in the upland areas, where the stream corridor is covered
by more recent slopewash deposits of sand and gravel material (Barr, 2006c).
Three historic periods can be distinguished based on land use in the Bluff Creek watershed. The first
corresponds to pre-European settlement, until the 1850s. Big woods of maple-basswood forest and
oak savanna extended across the watershed, and native prairie plants composed the understory
vegetation. Magner and Steffen (2001) argue that some stable degree of morphologic equilibrium
had been reached in the Minnesota River and tributaries prior to plowing of the prairie. The second
period was dominated by the introduction and intensification of agricultural practices, beginning in
the 1900s. Consistent with Zimmerman et al. (1993), it is reasonable to hypothesize that as more
water and sediment reached the stream, the channel morphology evolved toward a new equilibrium
configuration, which may or may not have been attained; cultivation patterns have been switching
from field to row crops. The last period corresponds to urban sprawl, beginning in the 1980s. A
preliminary analysis of LandSat imagery indicates that the mean percent imperviousness in the Bluff
Creek watershed has jumped from 3 percent in 1986 to 15 percent in 2002, with the highest
percentage increase between 1991 and 1998. This urban development, which is expected to continue
progressing at a rapid pace in the next twenty years, has likely generated another change in the

P:\Mpls\23 MN\27\2327I25 Bluff Creek Watershed TMDL\Work Files\Biotic TMDL – Stressor ID\Bluff Creek Stressor Identification 3
Figure 2 Biological Sample Locations—Bluff Creek TMDL Study

P:\Mpls\23 MN\27\2327I25 Bluff Creek Watershed TMDL\Work Files\Biotic TMDL – Stressor ID\Bluff Creek Stressor Identification 4
hydrologic and sediment supply boundary conditions of the stream, hence the channel has again
begun working toward a new morphologic equilibrium.
With the introduction of agricultural practices at the turn of the last century and later intensification
in the Bluff Creek watershed, more sediment and more water reached the stream. The United States
Army Corps of Engineers (2004) point out that the prairie and forest vegetation helped to hold soils
in place. Moreover, larger evapotranspiration losses and a lower drainage density predicts less
volume runoff and smaller peak flows before than after plowing of the prairie. The increase in
sediment supply from the upland areas to the stream must have been particularly important after row
crop cultivation became more dominant in the watershed, beginning in the 1950s. It is not clear
whether the longitudinal profile of Bluff Creek was subject to overall bed aggradation; the increase
in sediment supply may or may not have been compensated by the increase in frequency, magnitude,
and duration of water discharges above the threshold for fluvial motion of bed material. I t is
reasonable to expect, however, that the increase in sediment supply caused localized bed aggradation,
probably more pronounced in the middle reaches of the creek where the streamwise bed slope is less
steep and therefore the sediment transport capacity is smaller, as well as an increase in stream
sinuosity, especially in the downstream reach of the creek (Barr, 2006c).
It can be assumed that urban development has produced an even bigger increase in frequency,
magnitude, and duration of competent flows, so the positive trend continues. But contrary to what
happened until the 1980s, the amount of sediment delivered from the upland areas of the watershed
to the stream must have decreased; there is less surface area in the watershed that can be eroded. Pu t
simply, urban sprawl generates more water and less sediment. Nonetheless, ravine erosion in the
highly erodible watershed has increased causing the conveyance of substantial loads of sediment to
the stream. The anticipated morphodynamic response to the additional water from urbanization is the
overall promotion of channel incision combined with a bigger probability of streambank erosion due
to mass-wasting failures, rather than increased fluvial erosion of the channel banks or greater channel
migration rates; the ratio of floodprone width to bankfull width is about two for most of the water
course. It is not clear whether this in-stream sediment contribution results in an increased sediment
transport conveyance along the creek, or if the sediment is deposited within a few feet downstream
from its source. Lauer et al. (2006) indicate that eroding banks usually do not contribute sediment
such that a net increase in sediment results from the eroding banks on most single-thread rivers,
because the channel usually rebuilds a new bank on the opposite side of the channel from the eroding
bank. In this regard, point bars are observed in Bluff Creek (Barr, 2006c).

P:\Mpls\23 MN\27\2327I25 Bluff Creek Watershed TMDL\Work Files\Biotic TMDL – Stressor ID\Bluff Creek Stressor Identification 5
A 2007 inventory of Bluff Creek indicated ravine erosion contributes significant quantities of
sediment to Bluff Creek annually. Ravine erosion, for the most part, is occurring independently of
Bluff Creek, and is due to overland stormwater runoff and/or groundwater seepage. The majority of
the ravines with severe or moderate erosion are located between Stations B-1 and B-2 (Figure 2).
Much of the stream itself was observed to be stable, although some reaches of downcutting and bank
erosion were observed. Nonetheless, ravine erosion within the watershed results in sediment delivery
to Bluff Creek and a corresponding degradation of biological habitat.
Ravine erosion in the Bluff Creek watershed, pictured above, delivers
sediment to the stream which degrades biological habitat.

P:\Mpls\23 MN\27\2327I25 Bluff Creek Watershed TMDL\Work Files\Biotic TMDL – Stressor ID\Bluff Creek Stressor Identification 6
3.0 Define the Impairment
3.1 The Biological Impairment and Its Basis In 2002, Bluff Creek was listed on the 303(d) list of impaired waters for elevated turbidity levels
measured at the Metropolitan Council Environmental Services (MCES) Watershed Outlet Monitoring
Program (WOMP) station located on the main stem of the creek downstream of Highway 212. In
2004, Bluff Creek was placed on the Minnesota Pollution Control Agency’s (MPCA) list of impaired
waters in need of a Total Maximum Daily Load (TMDL) study for impaired biota due to low fish
Index of Biological Integrity (IBI) scores. For the Minnesota River Basin, biological impairment for
fish is defined as failing to meet the MRAP IBI impairment threshold score of 30 or greater out of a
possible score of 60. Only streams with a watershed area of at least 5 square miles are obligated to
meet the MRAP IBI impairment threshold.
Bluff Creek fish data collected by the Minnesota Department of Natural Resources (MDNR) and the
Riley-Purgatory-Bluff Creek Watershed District (RPBCWD) were evaluated to determine the reaches
of Bluff Creek that are considered to have impaired fish assemblages (Appendix A). Data were
collected by the Minnesota Department of Natural Resources (MDNR) from two locations on
July 22, 2000 as a part of a survey to characterize Twin Cities Metro Area streams. Both locations
noted a tributary watershed area greater than 5 square miles and, hence, both locations are obligated
to meet the state IBI impairment threshold of 30 or greater. Station 00MN009 (Figure 2) noted an
IBI score of 21.6, which is below the impairment threshold of 30 or greater, and Station 00MN008
(Figure 2) noted an IBI score of 31.2, which is above the impairment threshold of 30 or greater
(MDNR, 2000). The data (Figure 3) indicate the stream was impaired at the upstream location
(00MN009), but was not impaired at the downstream location (00MN008).
When the differences in data between the upstream and downstream locations are compared with
results of a recent study completed by the University of Minnesota (Dolph et al. 2010), the
significance of the differences becomes questionable. Dolph et al. (2010) found swings in IBI scores
of small streams in the St. Croix basin to be roughly 20 points and slightly more for small streams in
the Upper Mississippi River basin. They (Dolph et al. 2010) also note that greater variability of IBI
scores are found at sites that fail to capture more than 500 fish. Because Bluff Creek is a small
stream and less than 500 fish were captured in surveys, the differences found in the 2000 survey may
not be consistently repeated in future surveys due to variability. Although the data indicate the

P:\Mpls\23 MN\27\2327I25 Bluff Creek Watershed TMDL\Work Files\Biotic TMDL – Stressor ID\Bluff Creek Stressor Identification 7
downstream site was impaired and the upstream site was not impaired, the possibility that the score
differences may not be significant is also acknowledged.
Data were annually collected by RPBCWD from Station B-1 (Figure 2) during 1997 through 2006 to
determine the stream’s fish assemblage and also to determine whether the District’s ecological use
goals for the stream had been attained. Because Station B-1 notes a tributary watershed area greater
than 5 square miles, this location is obligated to meet the state IBI impairment criteria. No fish were
observed or collected during the 1997 and 1998 monitoring events, indicating severe impairment.
During 1999 through 2006, IBI scores at B-1 were consistently 16.8 (Figure 3) and were below the
impairment threshold during all 8 sampling years (Barr, 1998, 1999, 2000, 2001, 2002, 2003, 2004,
2005, 2006a, and 2006b).
0
10
20
30
40
50
60
1997 1998 1999 2000 2001 2002 2003 2004 2005 2006Year
IBI
An IBI score of 30 is the minimum IBI threshold for full support and no impairment
Station 00MN009
Station B-1
Station 00MN008
Figure 3 1999-2006 Bluff Creek IBI Summary—Stations B-1, 00MN008, and 00MN009
The consistent scores occurred at B-1 because only one or two species of fish were present each year.
Brook stickleback was consistently present and northern fathead minnow co-occurred during about

P:\Mpls\23 MN\27\2327I25 Bluff Creek Watershed TMDL\Work Files\Biotic TMDL – Stressor ID\Bluff Creek Stressor Identification 8
half of the events. B-1 noted a score of 16.8 and 00MN009 noted a score of 21.6 during 2000—both
were impaired.
Data collected by RPBCWD at additional upstream locations aid in the understanding of the stream’s
impairment and the stressors causing the biological impairment. RPBCWD annually collected data
from four stations upstream of Station B-1 to determine the stream’s fish assemblage and to
determine whether the District’s ecological use goals for the stream had been attained. Since the
watershed tributary to these locations is less than 5 square miles, they are neither expected nor
obligated to attain the fish IBI impairment threshold of 30 or greater. However, data from these
locations are considered in the Stressor Identification to help attain an understanding of the Bluff
Creek fish community and to identify stressors preventing attainment of the IBI impairment threshold
score of 30 or greater in downstream stream reaches. Data collected from upstream Stations B-2
through B-5 (Figure 2) during 1997 through 2006 noted IBI scores ranging from 12 through 38.4
(Figure 4) (Barr, 1998, 1999, 2001, 2002, 2003, 2004, 2005, 2006a). Stations with IBI scores greater
than 30 noted more native species, more minnow species, and more intolerant species as well as
fewer tolerant species than locations with IBI scores less than 30.
1997-2006 Bluff Creek IBI Summary
0
5
10
15
20
25
30
35
40
45
1997 1999 2001 2003 2005
Year
IBI
B1
B2
B3
B4
B5
IBI Impairment Threshold
Figure 4 1997-2006 Bluff Creek IBI Summary—Stations B1-B5

P:\Mpls\23 MN\27\2327I25 Bluff Creek Watershed TMDL\Work Files\Biotic TMDL – Stressor ID\Bluff Creek Stressor Identification 9
Flow and IBI scores during 1997 through 2005 were evaluated to determine whether changing IBI
scores were associated with changing flows. The absence of fish at B-1 and reduced IBI scores at
other Bluff Creek locations during 1997 through 1998 were associated with increased flows while
improved IBI scores at all Bluff Creek locations during 1999 were associated with decreased flows
(Figures 4 and 5). 1999 flows were, on average, lower than flows during other years (Figure 5). The
association of poorer IBI scores with increased flows and improved IBI scores with reduced flows
may be associated with changes in sediment loads to Bluff Creek. During years when increased
precipitation resulted in increased flows (e.g., 2002, See Figure 6), increased ravine erosion in the
watershed and increased sediment delivery to Bluff Creek are expected to occur. Conversely, during
years when reduced precipitation results in lower flows (e.g., 1999, See Figure 6), reduced ravine
erosion in the watershed and reduced sediment delivery to Bluff Creek are expected to occur.
Habitat fragmentation (i.e, the large drop at the downstream end of the regional trail culvert) further
exacerbates the impact of high flows on the fish at B-1 and is believed to play a role in the absence of
fish observed during 1997 and 1998. Discharge at the WOMP Station (Figure 2) reached 2,476 cfs
on April 13, 1997. It appears that when the high flows of 1997 moved fish downstream, habitat
fragmentation prevented the replenishing of the B-1 fish community and fish were absent from this
location.
3.2 Specific Effects The IBI was disaggregated and macroinvertebrate data were assessed to identify more specific effects
that appeared to indicate distinctive impairment mechanisms (See Tables 1 through 3; Fish data in
Appendix A; Invertebrate data in Appendix E). Specific effects associated with the impairment
observed at Stations B-1 and 00MN009 include a low number of native fish species, a high relative
abundance of the two most dominant invertebrate taxa, an absence of intolerant invertebrates, and an
absence of darters, insectivores, and simple lithophilic spawners. The data indicate environmental
degradation has occurred in the impaired reach. The absence of darters and simple lithophilic
spawners indicate the impaired stream reach may have habitat deficiencies due to siltation of coarse
substrates and excessive sedimentation or due to cold water temperatures. The absence of darters
may also indicate a loss of channel complexity from channelization. Because the downstream
unimpaired location noted darters, the data either indicate siltation of coarse substrates is not
problematic at the downstream location, the downstream channel is more complex, or that another
stressor (e.g., habitat fragmentation between the two locations) is the driving force in the fish
assemblage.

P:\Mpls\23 MN\27\2327I25 Bluff Creek Watershed TMDL\Work Files\Biotic TMDL – Stressor ID\Bluff Creek Stressor Identification 10
0.0
1.0
2.0
3.0
4.0
5.0
6.0
7.0
8.0
1996 1998 2000 2002 2004 2006
Dis
char
ge (c
fs)
B-1B-2B-3B-4B-5
Figure 5 1996-2005 Bluff Creek Average Discharge at Stations B-1, B-2, B-3, B-4, and B-5
0
5
10
15
20
25
30
35
40
45
1 3 5 7 9 11Month
Prec
ipita
tion
(Inch
es)
1997199819992000200120022003200420052006
Year Inches1997 - 34.451998 - 33.111999 - 30.552000 - 30.482001 - 34.202002 - 38.452003 - 22.732004 - 27.392005 - 33.412006 - 27.57
Figure 6 1997-2006 Minneapolis/St. Paul Cumulative Precipitation (Monthly Time Step)
P:\Mpls\23 MN\27\2327I25 Bluff Creek Watershed TMDL\Work Files\Biotic TMDL – Stressor ID\Bluff Creek Stressor Identification 11
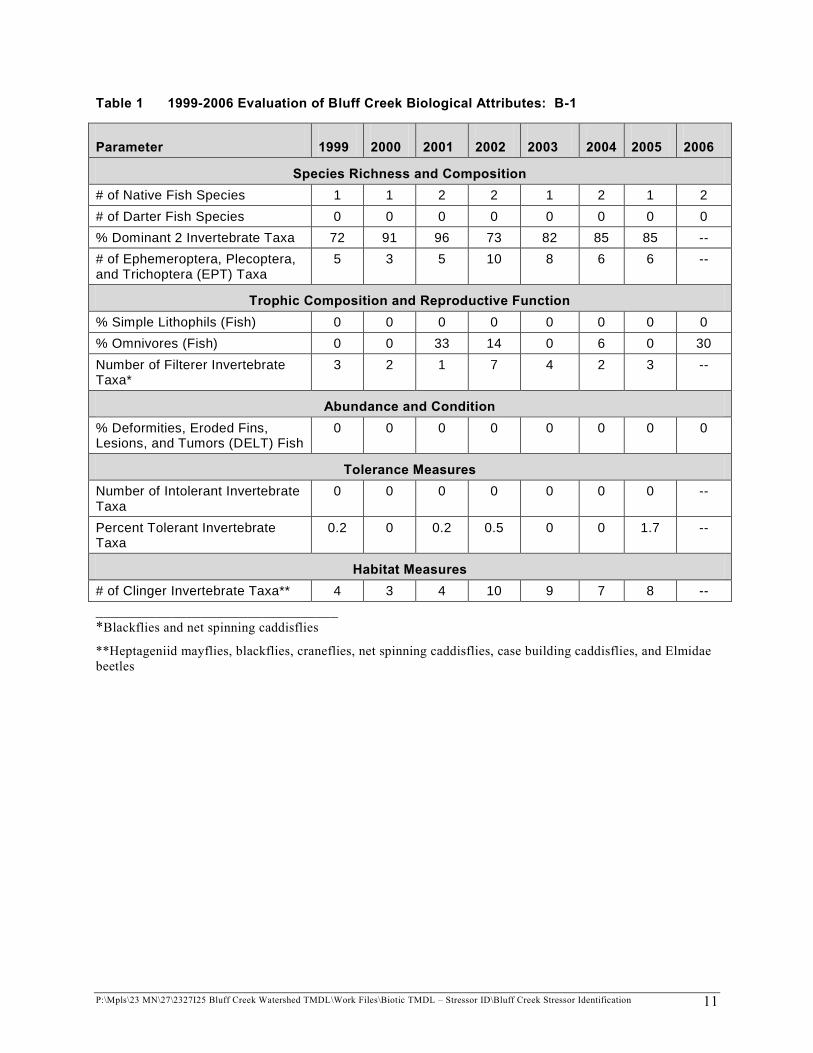
Table 1 1999-2006 Evaluation of Bluff Creek Biological Attributes: B-1
Parameter 1999 2000 2001 2002 2003 2004 2005 2006
Species Richness and Composition # of Native Fish Species 1 1 2 2 1 2 1 2
# of Darter Fish Species 0 0 0 0 0 0 0 0
% Dominant 2 Invertebrate Taxa 72 91 96 73 82 85 85 --
# of Ephemeroptera, Plecoptera, and Trichoptera (EPT) Taxa
5 3 5 10 8 6 6 --
Trophic Composition and Reproductive Function % Simple Lithophils (Fish) 0 0 0 0 0 0 0 0
% Omnivores (Fish) 0 0 33 14 0 6 0 30
Number of Filterer Invertebrate Taxa*
3 2 1 7 4 2 3 --
Abundance and Condition % Deformities, Eroded Fins, Lesions, and Tumors (DELT) Fish
0 0 0 0 0 0 0 0
Tolerance Measures Number of Intolerant Invertebrate Taxa
0 0 0 0 0 0 0 --
Percent Tolerant Invertebrate Taxa
0.2 0 0.2 0.5 0 0 1.7 --
Habitat Measures # of Clinger Invertebrate Taxa** 4 3 4 10 9 7 8 --
________________________________ *Blackflies and net spinning caddisflies
**Heptageniid mayflies, blackflies, craneflies, net spinning caddisflies, case building caddisflies, and Elmidae beetles

P:\Mpls\23 MN\27\2327I25 Bluff Creek Watershed TMDL\Work Files\Biotic TMDL – Stressor ID\Bluff Creek Stressor Identification 12
Table 2 2000 Evaluation of Bluff Creek Biological Attributes: 00MN008 and 00MN009
Parameter 00MN008 00MN009
Species Richness and Composition
# of Native Fish Species 4 2
# of Darter Fish Species 1 0
% Dominant 2 Invertebrate Taxa NA NA
# of Ephemeroptera, Plecoptera, and Trichoptera, (EPT) Taxa
NA NA
Trophic Composition and Reproductive Function
% Simple Lithophils (Fish) 0 0
% Omnivores (Fish) 28 8
Number of Filterer Invertebrate Taxa NA NA
Abundance and Condition
% Deformities, Eroded Fins, Lesions, and Tumors (DELT) Fish
0 0
Tolerance Measures
Number of Intolerant Invertebrate Taxa
NA NA
Percent Tolerant Invertebrate Taxa NA NA
Habitat Measures
# of Clinger Invertebrate Taxa NA NA
Table 3 Bluff Creek Average IBI Metric Scores
Site Metric Description
Score Score Score Site B-1 MN00MN008 00MN009
Metric 1999-2006 Averages 2000 2000 1 Total # of native species 1 3 1 2 # of darter species 1 3 1 3 # of sunfish species* 4 # of minnow species** 1 3 1 5 # of intolerant species 1 3 1 6 % of tolerant individuals 1 3 5 7 % of individuals omnivores 1 3 5 8 % of individuals insectivores 1 1 1 9 % of top carnivores* 10 Catch per unit effort by gear type 1 5 1 11 % of individuals simple lithophils 1 1 1 12 % of individuals w/ DELT 5 1 1
SITE IBI AVG. TOTAL
raw 14 26 18 adjusted** 16.8 31.2 21.6
*excluded as per Bailey, et al (1992) for sites < 100 square miles
**IBI score adjusted for exclusion of 2 metrics. Score x 1.2 = total site score

P:\Mpls\23 MN\27\2327I25 Bluff Creek Watershed TMDL\Work Files\Biotic TMDL – Stressor ID\Bluff Creek Stressor Identification 13
3.3 The Investigation’s Purpose The purpose of the investigation is to identify the stressors causing the stream’s biological
impairment. The investigation results will be used in the TMDL study to identify measures to attain
resolution to the impairment.
3.4 The Geographic Area Under Investigation Bluff Creek is located in Carver County near Chanhassen. The stream is tributary to the Minnesota
River. The investigation will be limited to identifying the probable cause of the biological
impairment from Station B-1 to 00MN008 (See Figure 2). Upstream sites B-2 through B-5 will be
evaluated during the investigation to help understand the Bluff Creek fish assemblage and to aid in
identifying stressors in the impaired downstream reach. However, this upstream portion of the
stream is not obligated to meet the IBI impairment threshold due to the small size of the tributary
watershed. The stream reach from 00MN008 to Rice Lake does not appear to be impaired per the
2000 MDNR data, but additional data collection is recommended to confirm this reach currently
meets the IBI impairment threshold.

P:\Mpls\23 MN\27\2327I25 Bluff Creek Watershed TMDL\Work Files\Biotic TMDL – Stressor ID\Bluff Creek Stressor Identification 14
4.0 Candidate Causes of Biological Impairment
This section begins by looking at possible candidate causes of the biological impairment of Bluff
Creek. Initially, we looked at all common candidate causes listed in CADDIS. Data were then used
to either validate or eliminate candidate causes. Candidate causes that were eliminated are discussed
followed by a discussion of candidate causes that were validated by the data.
4.1 Eliminated Candidate Causes 4.1.1 Presence of Toxics Presence of toxics was eliminated as a stressor because data indicate it is unlikely that toxics are
present in Bluff Creek. A component (metric) of the fish IBI can be used as an indicator of acute
toxicity. Decreases in the DELT (Deformities, Eroded Fins, Lesions, and Tumors) component of the
IBI are often associated with environmental degradation due to industrial pollutants. In the Bluff
Creek watershed, the seven monitoring sites (Figure 2) generally received a DELT score of 5 out of 5
throughout the monitoring period, indicating little possibility of the presence of toxic chemicals
(Barr, 1998, 1999, 2000, 2001, 2002, 2003, 2004, 2005, 2006a, 2006b).
The invertebrate community provides a second indicator of the presence of toxics. A comparison of
invertebrate metric values that indicate the presence of toxic chemicals with Bluff Creek values for
these metrics indicates little possibility of the presence of toxic chemicals in Bluff Creek (Table 4).
Table 4 Invertebrate Metrics Indicating Presence of Toxic Chemicals and 1999-2005 Bluff Creek Values—B-1
Invertebrate Metric Values That Indicate
Presence of Toxic Chemicals* 1999-2005
Bluff Creek Values—B-1 ICI** Median and 75
th Percentile
Values <14 to 18 23.4 to 31.2
EPT*** Median and 75th
Percentile Values
<2 to 4 6 to 7.5
_______________________ *Yoder et al., 1995
**ICI is the Invertebrate Community Index
***EPT is Ephemeroptera, Plecoptera, and Trichoptera
4.1.2 Low Dissolved Oxygen Low dissolved oxygen was eliminated as a stressor because water quality and biological data indicate
it is unlikely that low oxygen levels are present in Bluff Creek. Dissolved oxygen measurements

P:\Mpls\23 MN\27\2327I25 Bluff Creek Watershed TMDL\Work Files\Biotic TMDL – Stressor ID\Bluff Creek Stressor Identification 15
were collected from Station B-1 during 1991 through 2005 by the RPBCWD and from the WOMP
Station during 2003 through 2008 by MCES. The data consistently met the MPCA impairment
threshold of 5 mg/L and indicate that adequate oxygen was consistently present in the stream to fully
support all forms of aquatic life (Figure 7).
0
2
4
6
8
10
12
14
16
18
1/10/1991 2/18/1995 3/29/1999 5/7/2003 6/15/2007
Dis
solv
ed O
xyge
n (m
g/L)
MPCA Standard: <5 mg/L
Figure 7 1991-2008 Bluff Creek Dissolved Oxygen Data: B-1 and WOMP Stations
Dissolved oxygen was measured continuously (i.e., at 15-minute intervals) at the WOMP station
(Location shown in Figure 2) during September 9 through September 29, 2008. Daily maximum,
average, and minimum values shown in Figure 8 were consistently higher than the MPCA standard of
at least 5 mg/L. The data indicate adequate dissolved oxygen was consistently present in the stream
to fully support all forms of aquatic life.

P:\Mpls\23 MN\27\2327I25 Bluff Creek Watershed TMDL\Work Files\Biotic TMDL – Stressor ID\Bluff Creek Stressor Identification 16
0
2
4
6
8
10
12
14
9/4 9/9 9/14 9/19 9/24 9/29 10/4
Dis
solv
ed O
xyge
n (m
g/L)
MaximumAverageMinimumMPCA Standard
MPCA Standard > 5 mg/L
Figure 8 2008 Bluff Creek Daily Maximum, Average, and Minimum Dissolved Oxygen Concentrations at the Highway 212 WOMP Station
Continuous dissolved oxygen measurements were made at an upstream location, Pioneer Trail,
during July 18 through November 17, 2008. Dissolved oxygen concentrations at Pioneer Trail were
generally greater than 5 mg/L, but approximately 2 percent of the measurements were less than 5
mg/l due to diel changes (Figure 9). Plants in Bluff Creek added oxygen to the stream during the
daylight hours when they were photosynthesizing. However, during the night, the stream biota, both
plants and animals, depleted the stream of oxygen as they respired. The diel changes in Bluff Creek
depressed the stream’s oxygen level below 5 mg/L approximately 2 percent of the time and depressed
the stream’s oxygen level below 4 mg/L approximately 0.2 percent of the time. The data do not
indicate impairment to the stream based upon criteria currently under consideration by the MPCA for
assessing/listing waters impairment due to depressed dissolved oxygen:
“A stream is considered impaired if 1) more than 10 percent of the “suitable” (taken before 9
am) May through September measurements, or more than 10 percent of the total May through
September measurements, or more than 10 percent of the October through April measurements
violate the standard and 2) there are at least 3 total violations. A designation of “full support”
requires at least 20 “suitable” measurements from a set of monitoring data that adequately
represents at least two overall monitoring seasons” (MPCA, 2009a).

P:\Mpls\23 MN\27\2327I25 Bluff Creek Watershed TMDL\Work Files\Biotic TMDL – Stressor ID\Bluff Creek Stressor Identification 17
Concentrations at the downstream Highway 212 location were consistently higher than
concentrations at Pioneer Trail during the September 9 through September 29 period (Figure 9). The
data indicate the stream becomes more oxygenated as it flows downstream.
0
2
4
6
8
10
12
14
16
7/11 7/31 8/20 9/9 9/29 10/19 11/8 11/28
Dis
solv
ed
Oxy
gen
(m
g/l)
Pioneer Trail DODataHwy 212 DODataMPCA Standard
MPCA Standard > 5 mg/L
Figure 9 2008 Bluff Creek Continuous Dissolved Oxygen Concentrations at Pioneer Trail and Highway 212
Macroinvertebrate data provide further confirming evidence that adequate levels of oxygen have
consistently occurred in Bluff Creek. The macroinvertebrate community is exposed to the temporal
variations in stream water quality and "integrate" the quality of passing water. As such, they provide
evidence of long-term impacts of the stream’s water quality. Biotic indices, such as Hilsenhoff’s
Biotic Index (HBI) identify problems with low dissolved oxygen in streams. The HBI was used to
evaluate macroinvertebrate data collected from Station B-1 (Figure 2) during 1992 through 2005.
The HBI is a measure of organic and nutrient pollution, which causes lower dissolved oxygen levels,
especially at night, during the summer, and after a heavy rain (Hilsenhoff, 1982). Lower levels of
dissolved oxygen in turn affect the ability of each species of arthropod (i.e., aquatic insects,
amphipods, and isopods) to survive in a particular stream. As shown in Figure 10, HBI values during
1995 through 2005 were relatively consistent and ranged from 4.1 to 4.5 on a scale of 1 to 10 (1
indicates organisms with lowest tolerance to low oxygen conditions and 10 indicates organisms with

P:\Mpls\23 MN\27\2327I25 Bluff Creek Watershed TMDL\Work Files\Biotic TMDL – Stressor ID\Bluff Creek Stressor Identification 18
highest tolerance to low oxygen conditions) (Barr, 1996, 1997, 1998, 1999, 2000, 2001, 2002, 2003,
2004, 2005, 2006). On average, the invertebrate species living within Bluff Creek are very sensitive
to reductions in dissolved oxygen concentrations and would be eliminated if low oxygen conditions
were to occur in the stream. The data indicate little possibility that low oxygen concentrations have
been present in Bluff Creek during the period of record.
0.0
1.0
2.0
3.0
4.0
5.0
6.0
7.0
1992 1994 1996 1998 2000 2002 2004 2006
HB
I
Excellent Water Quality
Very Good Water Quality
Good Water Quality
Fair Water Quality
Fairly Poor Water Quality
Figure 10 1992-2005 Bluff Creek Macroinvertebrates: HBI Summary of B-1

P:\Mpls\23 MN\27\2327I25 Bluff Creek Watershed TMDL\Work Files\Biotic TMDL – Stressor ID\Bluff Creek Stressor Identification 19
4.1.3 pH pH was eliminated as a candidate stressor because data indicate the pH range observed in Bluff Creek
consistently supports all aquatic life. Metropolitan Council Environmental Services (MCES)
measured pH at the WOMP station (Figure 2) during 1993 through 2008. Mean pH during the period
of record was 8.0. Measurements during the period of record were within the MPCA standard which
protects all aquatic life (Figure 11).
6.0
6.5
7.0
7.5
8.0
8.5
9.0
9.5
3/16/93 3/16/96 3/16/99 3/16/02 3/16/05 3/16/08
pH S
U
MPCA Standard = 6.5 - 9.0
Figure 11 1993-2008 Bluff Creek pH Data: WOMP Station
4.1.4 Nutrients Although high nutrient concentrations have been observed in Bluff Creek, nutrients are eliminated as
a stressor because the data indicate their presence in the stream has not stressed the biological
community. High nutrient loadings entering a stream can accelerate primary production and increase
biological activities. When excess plants and algae result from the high nutrients, oxygen depletion
problems may result when the plants and algae die. Bacteria decomposing the plant tissue deplete
dissolved oxygen and at the same time release nutrients into the water column resulting in oxygen
poor conditions for aquatic life and a nutrient rich environment which fuels additional plant and

P:\Mpls\23 MN\27\2327I25 Bluff Creek Watershed TMDL\Work Files\Biotic TMDL – Stressor ID\Bluff Creek Stressor Identification 20
algae growth. Since excess plant growth and depleted oxygen levels have not been observed in Bluff
Creek (Figures 7 through 9), the data indicate high nutrient concentrations have not caused biological
impairment. The invertebrates inhabiting Bluff Creek are sensitive to low oxygen levels (Figure 10)
and would be eliminated by depleted oxygen levels. Invertebrate data provide further evidence that
excess nutrient loading to Bluff Creek has not caused stressful low oxygen levels.
Although high nutrient concentrations in Bluff Creek have not stressed the biological community,
their presence is an indication of anthropogenic impacts upon the stream. Phosphorus (total and total
dissolved) and nitrogen (total Kjeldahl, ammonia, nitrate, and nitrite) concentrations were measured
in Bluff Creek by MCES at the WOMP station (Figure 2) during 1993 through 2008. The data
indicate that high nutrient concentrations have been observed in Bluff Creek. Likely sources of the
high phosphorus and nitrogen concentrations observed in the stream are snowmelt and stormwater
runoff (Figures 12 through 17). High nutrient concentrations included both dissolved and particulate
nutrients and were generally accompanied by high total suspended solids and turbidity levels.
Although the nutrients have not stressed the biological community, the sediment concurrently added
to Bluff Creek with the nutrients is a stressor discussed in a later section.
0.0
1.0
2.0
3.0
4.0
5.0
6.0
3/16/93 3/16/96 3/16/99 3/16/02 3/16/05 3/16/08
Tota
l Pho
spho
rus
(mg/
L)
Figure 12 1993-2008 Bluff Creek Total Phosphorus: WOMP Station

P:\Mpls\23 MN\27\2327I25 Bluff Creek Watershed TMDL\Work Files\Biotic TMDL – Stressor ID\Bluff Creek Stressor Identification 21
0.0
0.1
0.2
0.3
0.4
0.5
0.6
0.7
0.8
0.9
3/16/93 3/16/96 3/16/99 3/16/02 3/16/05 3/16/08
Tota
l Dis
solv
ed P
hosp
horu
s (m
g/L)
Figure 13 1993-2008 Bluff Creek Total Dissolved Phosphorus: WOMP Station
0.0
2.0
4.0
6.0
8.0
10.0
12.0
3/16/93 3/16/96 3/16/99 3/16/02 3/16/05 3/16/08
Tota
l Kje
ldah
l Nitr
ogen
(mg/
L)
Figure 14 1993-2008 Bluff Creek Total Kjeldahl Nitrogen: WOMP Station

P:\Mpls\23 MN\27\2327I25 Bluff Creek Watershed TMDL\Work Files\Biotic TMDL – Stressor ID\Bluff Creek Stressor Identification 22
0.0
2.0
4.0
6.0
8.0
10.0
12.0
14.0
16.0
18.0
20.0
3/16/93 3/16/96 3/16/99 3/16/02 3/16/05 3/16/08
Nitr
ate
Nitr
ogen
(mg/
L)
Figure 15 1993-2008 Bluff Creek Nitrate Nitrogen: WOMP Station
0.00
0.05
0.10
0.15
0.20
0.25
0.30
0.35
0.40
3/16/93 3/16/96 3/16/99 3/16/02 3/16/05 3/16/08
Nitr
ite N
itrog
en (m
g/L)
Figure 16 1993-2008 Bluff Creek Nitrite Nitrogen: WOMP Station

P:\Mpls\23 MN\27\2327I25 Bluff Creek Watershed TMDL\Work Files\Biotic TMDL – Stressor ID\Bluff Creek Stressor Identification 23
0
2
4
6
8
10
12
14
16
18
3/16/93 3/16/96 3/16/99 3/16/02 3/16/05 3/16/08
Am
mon
ia N
itrog
en (m
g/L)
Figure 17 1993-2008 Bluff Creek Ammonia Nitrogen: WOMP Station
A periphyton growth study provides evidence that high nutrients in Bluff Creek are not causing
excessive plant growth. Study results indicate periods of high nutrients in Bluff Creek are associated
with storm events and a net decline of stream productivity due to scouring of periphyton from stream
substrates during periods of high flow. A periphyton growth study of Bluff Creek by RPBCWD
during 1998 documents growth and loss patterns in Bluff Creek. Periphyton growth and nutrient
levels were measured at Station B-1 (Figure 2) at weekly intervals during June 1 through June 29,
1998 (Table 5 and Figure 18). Normal periphyton growth was observed when stream flows were
normal and nutrient levels were relatively low. Periphyton growth increased aerial chlorophyll a on
the periphytometer sampling units from 0 on June 1 to a 9.68 µg/m2 on June 22 (Figure 18).
However, stream energy and sediment conveyed to the stream by stormwater runoff scoured
periphyton from Bluff Creek substrates resulting in a net loss of plant material following a 1.35-inch
rainstorm on June 27 through 28. Stormwater runoff conveyed to Bluff Creek during the storm
increased total phosphorus concentrations from 0.056 mg/L on June 22 to 1.8 mg/L on June 27 and
dissolved phosphorus from 0.024 mg/L on June 22 to 0.217 on June 28 (Table 5). Stormwater runoff
on June 27 also caused high levels of total Kjeldahl nitrogen (1.8 mg/L), total suspended solids
(1,300 mg/L), volatile suspended solids (124 mg/L), and turbidity (350 NTU) (Table 5). Flows
increased from 16.6 cfs on June 26 to 94.3 cfs on June 27 and then declined to 18.7 cfs on June 29

P:\Mpls\23 MN\27\2327I25 Bluff Creek Watershed TMDL\Work Files\Biotic TMDL – Stressor ID\Bluff Creek Stressor Identification 24
and 7.4 cfs on June 30 (Figure 19). The increased stream energy and sediment levels following the
rainstorm caused scour of periphyton within the stream as evidenced by a 40 percent decline in aerial
chlorophyll a from 9.68 µg/m2 on June 22 to 5.80 µg/m2 on June 29 (Figure 18). The data indicate
that although high nutrient concentrations accompanied by high sediment loads are found in Bluff
Creek for a brief period of time following storm events, accelerated plant growth does not occur. In
addition, scouring reduces stream periphyton resulting in a net loss of plant material following storm
events.
Table 5 Bluff Creek Water Quality Data Summary for June 1-29, 1998: B-1
Parameter 6/1 6/8 6/15 6/22 6/27 6/28 6/29 Total Phosphorus (mg/L) 0.089 0.040 0.049 0.056 1.80 0.44 --
Total Dissolved Phosphorus (mg/L) 0.46
Total Ortho Phosphorus (mg/L) -- 0.217
Soluble Reactive Phosphorus (mg/L) -- 0.035 0.037 0.024 -- -- 0.145
Total Kjeldahl Nitrogen (mg/L) 3.50
Ammonia Nitrogen (mg/L) 0.05 0.09
Total Suspended Solids (mg/L) 1,300 307
Volatile Suspended Solids (mg/L) 124 22
Turbidity (NTU) 350 55
0
2
4
6
8
10
12
5/25/1998 6/4/1998 6/14/1998 6/24/1998 7/4/1998
Chl
orop
hyll
a (u
g/m
2 )
Decline due to scour following 1.35 inch rainstorm
Figure 18 1998 Bluff Creek Periphyton Growth Study: B-1

P:\Mpls\23 MN\27\2327I25 Bluff Creek Watershed TMDL\Work Files\Biotic TMDL – Stressor ID\Bluff Creek Stressor Identification 25
0102030405060708090
100
6/1 6/8 6/15 6/22 6/29
Flow
- C
FS
Figure 19 1998 Bluff Creek June Flow Values
The presence of high nutrients in a stream can stress a biological community when unionized
ammonia concentrations reach toxic levels. Ammonia occurs in two forms, ionized and unionized.
Stream temperature and pH determine the partitioning of ammonia into the two forms. Ammonia
concentrations, pH, and temperature in Bluff Creek were measured by MCES at the WOMP station
during 1993 through 2008. Unionized ammonia concentrations were computed to determine whether
toxic concentrations of unionized ammonia have occurred in Bluff Creek during the period of record.
Only one instance of ammonia toxicity occurred during the 15-year data collection period. On
July 2, 1997, unionized ammonia reached 46.1 µg/L which exceeded the MPCA standard of 40 µg/L
(Figure 20). The high concentration occurred immediately after a storm event. Stormwater runoff
conveyed large quantities of sediment to the stream which not only caused the high unionized
ammonia concentration, but also caused high suspended solids concentrations (640 mg/L). Because
unionized ammonia has been below toxic levels since 1997, this parameter is not considered a
stressor to the stream’s biological community.

P:\Mpls\23 MN\27\2327I25 Bluff Creek Watershed TMDL\Work Files\Biotic TMDL – Stressor ID\Bluff Creek Stressor Identification 26
0
5
10
15
20
25
30
35
40
45
50
3/16/93 3/16/96 3/16/99 3/16/02 3/16/05 3/16/08
Uni
oniz
ed A
mm
onia
(ug/
L)
July 2, 1997 - 46.1 ug/L
MPCA Standard: <40 ug/L
Figure 20 1993-2008 Bluff Creek Unionized Ammonia: WOMP Station
The data indicate nutrients have not caused biological impairment. Neither excess plant growth nor
depleted oxygen levels have been observed in Bluff Creek. The invertebrates inhabiting Bluff Creek
are sensitive to low oxygen levels and would be eliminated by depleted oxygen levels. Data
collected from Bluff Creek indicate that although high nutrient concentrations accompanied by high
sediment loads are found in Bluff Creek for a brief period of time following storm events, accelerated
plant growth does not occur. In addition, scouring reduces stream periphyton resulting in a net loss
of plant material following storm events. Unionized ammonia has been below toxic levels since
1997 and is not considered a stressor to the biological community. Hence, nutrients are eliminated as
a candidate stressor to Bluff Creek.
4.1.5 Temperature Temperature was eliminated as a candidate cause of impairment because Bluff Creek temperature
data indicate warmer temperatures that can stress aquatic life are not found in Bluff Creek. The
stream’s mean summer maximum temperatures are within the range of reference streams within the

P:\Mpls\23 MN\27\2327I25 Bluff Creek Watershed TMDL\Work Files\Biotic TMDL – Stressor ID\Bluff Creek Stressor Identification 27
Minnesota River Basin. Bluff Creek temperature data indicate it is a stream with coldwater
temperature conditions.
Although temperature is eliminated as a candidate cause of stream impairment, temperature is, and
will be, an important consideration in impairment evaluation of Bluff Creek. Bluff Creek’s
impairment was determined by evaluating the stream’s fishery with the Minnesota River Basin IBI.
This IBI was developed from a mixture of streams with warmwater, coolwater, and coldwater
temperature conditions in the Minnesota River Basin. Mundahl et al. (1998) have indicated a
coldwater IBI is the appropriate tool to evaluate a stream with coldwater temperature conditions and
advised against using an IBI developed from a mixture of stream types (Mundahl et al., 1998).
Streams are classified into one of three categories based upon temperature. Coolwater streams have a
mean maximum daily temperature between 22 and 24°C during a normal summer, coldwater streams
normally have summer maximum daily means below 22°C, and warmwater streams exceed 24°C
(Lyons, 1992). During 1998, continuous temperature measurements by RPBCWD at Station B-1
occurred from June 1 through October 16. Bluff Creek’s 1998 summer (June 15 through August 31)
maximum daily mean temperature was 16.6°C (Figure 21) which is less than the coldwater stream
temperature threshold (Lyons, 1992). During 2008, continuous temperature measurements by MCES
at the WOMP Station (Figure 2) occurred from March 19 through year’s end. Bluff Creek’s 2008
summer (June 15 through August 31) maximum daily mean temperature was 16.4°C (Figure 22).
These data indicate Bluff Creek is a stream with coldwater temperature conditions.
Monthly temperature measurements by RPBCWD during March through October of 1996 through
2005 were below the coldwater threshold and provide further evidence that Bluff Creek is a stream
with coldwater temperature conditions. Station B-1 (Figure 2) noted a temperature range of 0.7 to
18.3°C during this period (Figure 23), which is below the coldwater threshold of 22°C. Upstream
Stations B-2 through B-5 (Figure 2) noted temperatures ranging from 0 to 22.5 °C during the period
of record:
B-2: 0 to 22.5° C
B-3: 0 to 21.6° C
B-4: 0 to 22.5° C
B-5: 0 to 21.9° C

P:\Mpls\23 MN\27\2327I25 Bluff Creek Watershed TMDL\Work Files\Biotic TMDL – Stressor ID\Bluff Creek Stressor Identification 28
0
5
10
15
20
25
30
1-Jun 1-Jul 31-Jul 30-Aug
Tem
pera
ture
(C)
Mean Daily
Max Daily
Max SummerDaily Mean
ColdwaterStreamThresholdMin Daily
1998 Maximum Summer Daily Mean = 16.6 C
Coldwater Stream Threshold: Maximum Summer Daily Mean Temperature <22 C
Figure 21 1998 Bluff Creek Minimum, Average, and Maximum Daily Temperature Measurements
0
5
10
15
20
25
30
1-Jun 21-Jun 11-Jul 31-Jul 20-Aug
Tem
pera
ture
(C)
Max Daily
Mean Daily
Min Daily
MaxSummerDaily Mean
ColdwaterStreamThreshold
Coldwater Stream Threshold: Maximum Summer Daily Mean Temperature <22 C
2008 Maximum Summer Daily Mean = 16.4 C
Figure 22 2008 Bluff Creek Minimum, Average, and Maximum Daily Temperature Measurements

P:\Mpls\23 MN\27\2327I25 Bluff Creek Watershed TMDL\Work Files\Biotic TMDL – Stressor ID\Bluff Creek Stressor Identification 29
0.0
2.0
4.0
6.0
8.0
10.0
12.0
14.0
16.0
18.0
20.0
06/15/94 07/04/96 07/24/98 08/12/00 09/01/02 09/20/04 10/10/06
Tem
pera
ture
(C)
Figure 23 1996-2005 Bluff Creek Temperature Data: B-1
The mean summer maximum temperature in Bluff Creek was nearly the same during 1998 (16.6°C)
and 2008 (16.4°C) despite flow differences during the two years (Figure 24). During 1998, the mean
summer daily flow was 8.6 cfs and during 2008 the mean summer daily flow was 1.3 cfs. The data
indicate that stream temperature is primarily determined by groundwater rather than surface flows.
Hence, during the period of record, the stream does not show evidence of anthropogenic temperature
alteration resulting from stormwater runoff.
Although on average, the stream temperature has remained stable over the period of record, reduced
stream flow in 2008 resulted in a slight increase in daily temperature variability. The summer
average daily temperature variation during 1998 was 3.2°C compared with 4.0 °C during 2008
(Figure 25). In 2008, solar radiation had a greater influence over daily temperature variability than
occurred in 1998 when streamflow, on average, was higher. However, the summer average daily
temperature variation in Bluff Creek (3.2 to 4.0 °C) is within the range observed for 6 coldwater
reference streams within the Minnesota River Basin (Table 6). The average daily temperature
variation for these 6 reference streams was 3.8 °C (Table 6).

P:\Mpls\23 MN\27\2327I25 Bluff Creek Watershed TMDL\Work Files\Biotic TMDL – Stressor ID\Bluff Creek Stressor Identification 30
0102030405060708090
100
6/15 6/30 7/15 7/30 8/14 8/29
Flow
- C
FS200819982008 Summer Mean1998 Summer Mean
Figure 24 Comparison of 1998 and 2008 Bluff Creek Average Daily Flows During June 15 Through August 31 Period
0
2
4
6
8
10
12
14
15-Jun 5-Jul 25-Jul 14-Aug
Dai
ly T
empe
ratu
re D
iffer
ence
(C) 1998
20081998 Mean2008 Mean
Figure 25 Comparison of 1998 and 2008 Bluff Creek Summer Daily Temperature Differences Between Maximum and Minimum Temperatures

P:\Mpls\23 MN\27\2327I25 Bluff Creek Watershed TMDL\Work Files\Biotic TMDL – Stressor ID\Bluff Creek Stressor Identification 31
Table 6 Summer Average Maximum and Average Daily Variation For 6 Reference Streams With Coldwater Temperatures Within the Minnesota River Basin (MPCA 2008a)
Stream Name
Stream Field Number
Mean Summer
Maximum Temperature
Summer Average Daily
Variation Little Chippewa River
03MN004 21.99 2.89
Dutch Charley Creek
03MN035 21.92 4.49
Lazarus Creek 03MN046 21.98 3.94
Tributary to Chippewa River
03MN056 11.85 2.32
Tributary to Perch Creek
03MN064 21.84 5.69
Nicollet Creek 03MN069 21.56 3.43
Bluff Creek has some coldwater temperature conditions that may support more of a coldwater fish
assemblage. Coldwater and warmwater streams can support substantially different fish assemblages.
For this reason, many of the metrics used in a warmwater version of the IBI may be inappropriate for
assessment of a stream with coldwater temperature conditions (Steedman, 1988; Lyons, 1992; Lyons
et al., 1996). In addition, the reduced taxa richness characteristic of coldwater fish assemblages has
made it difficult to devise very many potential metrics that successfully detect impairment within
streams with coldwater temperature conditions (Simon and Lyons, 1995; Lyons et al., 1996).
Consequently, some investigators have developed versions of the IBI that are being used to assess
both warmwater and coldwater assemblages within the same region (Hughes and Gammon, 1987;
Langdon, 1988; Steedman, 1988; Oberdorff and Hughes, 1992). Since coldwater fish assemblages
respond differently to impairment than do warmwater assemblages (Lyons, 1992; Lyons et al., 1996),
the combination of warmwater/coldwater IBIs might not be well-suited to detect impairment in
streams with coldwater temperatures. Mundahl and Simon (1998) recommend the use of a coldwater
IBI for assessment of streams with coldwater temperature conditions.
Bluff Creek’s biological impairment was based upon an evaluation using the Minnesota River Basin
IBI which was developed from streams with a combination of coldwater, coolwater, and warmwater
temperatures. Reference reaches used to develop the IBI included 5 streams with coldwater
temperature conditions, 6 streams with coolwater temperature conditions, and 17 streams with
warmwater temperature conditions (MPCA, 2008c).

P:\Mpls\23 MN\27\2327I25 Bluff Creek Watershed TMDL\Work Files\Biotic TMDL – Stressor ID\Bluff Creek Stressor Identification 32
High quality streams with coldwater temperatures are too cold to support the full complement of
species found in warmwater streams (Lyons et al., 1996). Most fish species are not adapted to thrive
in the cold summer water temperatures that characterize high quality streams with coldwater
temperature conditions (Becker, 1983; Lyons 1992). Streams with coldwater temperatures are harsh
environments where only a handful of species can live. Species-rich families such as the
catostomids, centrarchids, and percids have few or no members adapted for the bioenergetic and
reproductive thermal challenges of streams with coldwater temperatures (Hynes, 1970). As a result,
streams with coldwater temperatures have a depauperate fish fauna and lack many of the taxonomic
groups that are important in the much more species-rich warmwater streams.
Because the stream’s fishery is comprised of few species and brook stickleback, a stenothermal
(narrow temperature range) coolwater species, has been the dominant species in Bluff Creek during
the period of record, the data suggest possible temperature impacts on the stream’s fish assemblage .
As shown in Figures 26 and 27, brook stickleback comprised from 50 to 100 percent of the total
number of fish species and from 67 to 100 percent of the total number of individuals during the
period of record.
Currently, Bluff Creek is designated in as a Class 2B to protect aquatic life. Due to the temperatures
found in Bluff Creek, a Use Attainability Analysis is recommended to evaluate whether the current Use
Class or a different Use Class more reflective of the cold temperatures is suitable. Tiered Aquatic Life
Use should address stream Use Classes when developed for Minnesota. This work may help guide
future management of appropriate Bluff Creek fish populations. Until that time, the recommendations
in this document and in the forthcoming TMDL are based from the 2B status. Similar to all TMDL
Projects, the TMDL Report and Implementation Plan for Bluff Creek can be reevaluated and revised
as needed to reflect new policies, standards, classifications, and additional monitoring.

P:\Mpls\23 MN\27\2327I25 Bluff Creek Watershed TMDL\Work Files\Biotic TMDL – Stressor ID\Bluff Creek Stressor Identification 33
0
20
40
60
80
100
120
1998 2000 2002 2004 2006 2008% o
f Tot
al In
divi
dual
s R
epre
sent
ed b
y B
rook
St
ickl
ebac
k
B-100MN00800MN009
Figure 26 Percent of Total Individuals Represented by Brook Stickleback in Bluff Creek During 1999-2006
0
20
40
60
80
100
120
1995 2000 2005 2010Perc
ent o
f Fis
h Sp
ecie
s R
epre
sent
ed
by B
rook
e St
ickl
ebac
k
B-100MN00800MN009
Figure 27 Percent of Fish Species Represented by Brook Stickleback in Bluff Creek During 1999-2006

P:\Mpls\23 MN\27\2327I25 Bluff Creek Watershed TMDL\Work Files\Biotic TMDL – Stressor ID\Bluff Creek Stressor Identification 34
4.2 Candidate Causes 4.2.1 Candidate Cause 1: Habitat Fragmentation Habitat Fragmentation is considered a possible stressor because a large drop at the downstream end
of the regional trail culvert (Figure 28) interrupts the connectivity of Bluff Creek. This interruption
of connectivity prevents passage of fish between upstream and downstream reaches of Bluff Creek.
Such isolation may increase mortality due to isolation from food sources and prevent replenishment
of the species when disease or other stressors eliminate individual fish or species. Isolation may lead
to the demise of a fishery, including extinction (Letcher et al., 2007). Evaluation of Bluff Creek
stream reaches upstream and downstream of the culvert indicates upstream reaches (Stations B-1 and
00MN009 in Figure 2) were impaired while a downstream reach (Station 00MN008 in Figure 2) was
not impaired. During 2000, upstream reaches observed IBI scores of 16.8 at B-1 and 21.6 at
00MN009 while the downstream reach, 00MN008, noted an IBI score of 31.2 which is above the
impairment threshold of 30 or greater. The data indicate habitat fragmentation has adversely
impacted Bluff Creek’s fishery and has resulted in impairment of stream reaches located upstream of
the culvert.
Figure 28 Large drop at downstream end of regional trail culvert
The Bluff Creek fish assemblage during 2000 provides evidence of the impact of habitat
fragmentation on the stream’s fishery. During 2000, brook stickleback, a coolwater fish species,
comprised 25 percent of the fish species and 34 percent of the number of individuals collected from

P:\Mpls\23 MN\27\2327I25 Bluff Creek Watershed TMDL\Work Files\Biotic TMDL – Stressor ID\Bluff Creek Stressor Identification 35
00MN008, a station downstream from the culvert. In contrast, brook stickleback comprised from 50
to 100 percent of the number of fish species and from 92 to 100 percent of the number of individuals
collected from upstream locations B-1 and 00MN009 during 2000 (Figures 26 and 27). These data
indicate a more diverse fish assemblage was able to inhabit stream reaches downstream from the
culvert. The downstream reach included several eurythermal (inhabit a large temperature range)
species in addition to a stenothermal (inhabit a narrow temperature range) coolwater species. In
contrast, the isolated reaches upstream from the culvert observed fewer species than the downstream
reach and were dominated by a single stenothermal coolwater species. A conceptual model of
candidate Cause 1, habitat fragmentation, is shown in Figure 29. The model shows that the large
drop at the end of the regional trail culvert causes a loss of connectivity which reduces fish
migration, results in a reduced refuge for fish, and reduces sensitive species. Habitat fragmentation
reduces replenishment of species when climate changes, either wet or dry weather, cause changes in
the stream’s flow regime and species reductions due to either high or low flow conditions. The
reduction in fish taxa richness and reduction in number of fish resulting from habitat fragmentation
causes impairment.

P:\Mpls\23 MN\27\2327I25 Bluff Creek Watershed TMDL\Work Files\Biotic TMDL – Stressor ID\Bluff Creek Stressor Identification 36
Figure 29 Conceptual Model of Candidate Cause 1: Habitat Fragmentation

P:\Mpls\23 MN\27\2327I25 Bluff Creek Watershed TMDL\Work Files\Biotic TMDL – Stressor ID\Bluff Creek Stressor Identification 37
4.2.2 Candidate Cause 2: Sediment Sediment is considered a candidate stressor because high sediment loads and turbidity levels have
been consistently observed in Bluff Creek. As shown in Figure 30, total suspended solids
concentrations in excess of 1,000 mg/L have frequently occurred during the period of record.
Volatile suspended solids concentrations have consistently exceeded 100 mg/L (Figure 31).
Turbidity values have consistently exceeded the MPCA standard (25 NTU) throughout the period of
record (Figure 32). High sediment concentrations have been associated with snowmelt and
precipitation events. As shown in the conceptual model of candidate Cause 2, sediment is conveyed
to the stream from the watershed as well as from in-channel sources (Figure 33).
To further evaluate in-channel sediment contributions to Bluff Creek, RPBCWD prepared an order of
magnitude estimate of total in-channel sediment contribution to Bluff Creek in 2006. The estimate is
570,000 pounds per year (260 ton/year). For a total catchment area of 6.4 miles, the estimate of
570,000 pounds/year is equivalent to a sediment yield of 140 pounds per acre. This estimate
indicates the in-channel sediment contribution would represent almost 25 percent of the total
suspended solids yield measured in Bluff Creek between 1990 and 1996 (Barr, 2006c).
Results of a Bluff Creek inventory indicate the primary sources of sediment to Bluff Creek are
ravines and escarpments in the lower valley, primarily between Stations B-1 and B-2 (Figure 2).
RPBCWD performed a detailed inventory of stream erosion in the lower valley of Bluff Creek during
2007. The inventory consisted of a reconnaissance walk of the stream channel and visits to all of the
contributing ravines. During the visits, erosion sites were photographed, soil and vegetation
conditions were noted, storm sewer inlets documented, and erosion dimensions estimated.
2007 Bluff Creek inventory results indicated significant stream bank erosion as well as erosion in
contributing ravines and large slope failures in the valley that were not necessarily associated with a
ravine. An overview map of survey results is shown in Figure 34. Detailed results of the
investigation are presented in Appendix C.
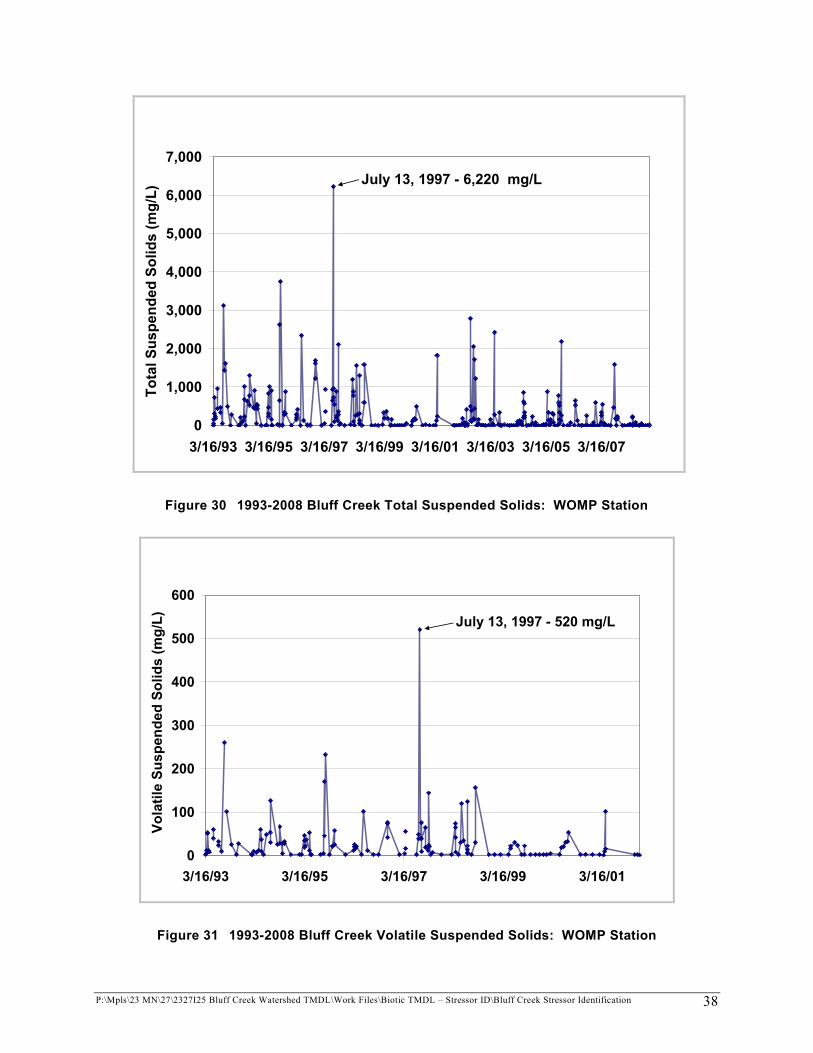
P:\Mpls\23 MN\27\2327I25 Bluff Creek Watershed TMDL\Work Files\Biotic TMDL – Stressor ID\Bluff Creek Stressor Identification 38
0
1,000
2,000
3,000
4,000
5,000
6,000
7,000
3/16/93 3/16/95 3/16/97 3/16/99 3/16/01 3/16/03 3/16/05 3/16/07
Tota
l Sus
pend
ed S
olid
s (m
g/L)
July 13, 1997 - 6,220 mg/L
Figure 30 1993-2008 Bluff Creek Total Suspended Solids: WOMP Station
0
100
200
300
400
500
600
3/16/93 3/16/95 3/16/97 3/16/99 3/16/01
Vola
tile
Susp
ende
d So
lids
(mg/
L) July 13, 1997 - 520 mg/L
Figure 31 1993-2008 Bluff Creek Volatile Suspended Solids: WOMP Station

P:\Mpls\23 MN\27\2327I25 Bluff Creek Watershed TMDL\Work Files\Biotic TMDL – Stressor ID\Bluff Creek Stressor Identification 39
0
1,000
2,000
3,000
4,000
3/16/93 3/16/96 3/16/99 3/16/02 3/16/05 3/16/08
Turb
idity
(NTU
)
0
1,000
2,000
3,000
4,000
Turb
idity
(NTR
U)
July 31, 1993 = 3,300 NTU
July 13, 1997 = 3,000 NTU
September 7, 2007 = 1,600 NTRU
August 14, 1995 = 1,400 NTU
MPCA Standard = 25 NTU
Figure 32 1993-2008 Bluff Creek Turbidity: WOMP Station
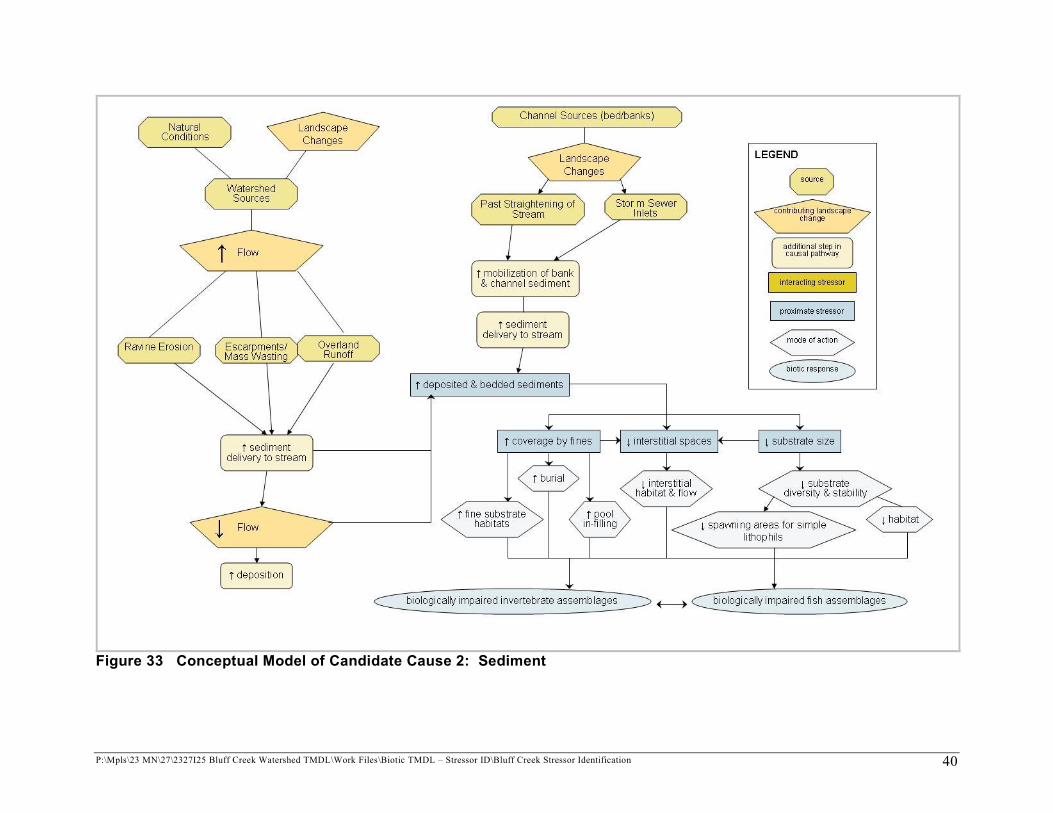
P:\Mpls\23 MN\27\2327I25 Bluff Creek Watershed TMDL\Work Files\Biotic TMDL – Stressor ID\Bluff Creek Stressor Identification 40
Figure 33 Conceptual Model of Candidate Cause 2: Sediment

P:\Mpls\23 MN\27\2327I25 Bluff Creek Watershed TMDL\Work Files\Biotic TMDL – Stressor ID\Bluff Creek Stressor Identification 41
Figure 34 Overview Map: Bluff Creek Channel Survey

P:\Mpls\23 MN\27\2327I25 Bluff Creek Watershed TMDL\Work Files\Biotic TMDL – Stressor ID\Bluff Creek Stressor Identification 42
The inventory results indicate much of the stream itself was stable, although downcutting and bank
erosion were observed in some reaches. Ravine erosion, for the most part, is occurring in the Bluff
Creek watershed rather than within Bluff Creek, and is due to overland runoff/or groundwater
seepage. The majority of the ravines with severe or moderate erosion are located between Stations
B-1 and B-2 and are upstream from the WOMP station (Figure 2). Streambank and ravine erosion
appear to be the primary sources of the suspended solids (Figures 30 and 31) and turbidity
(Figure 32) measured at the WOMP station (Figure 2).
Although erosion in ravines in the lower valley of Bluff Creek is the primary source of sediment to
the stream, streambank erosion also delivers sediment to the stream (Figure 35). A Rosgen stream
assessment was conducted on Bluff Creek to better understand the physical characteristics of the
stream. Bluff Creek is primarily a Type C and E stream (Figure 36). These stream types are highly
sensitive to disturbance; they have moderate (E) to very high (C) sediment supply, high (E) to very
high (C) streambank erosion potential, and very high vegetation controlling influence (RPBCWD,
1996).
Bluff Creek is a C stream type from Pioneer Trail
downstream to T.H. 101, where the floodplain is more
confined by the valley walls (Figure 36). The
C stream is typified by a somewhat wider and
shallower channel than the type E channel, with a
narrower floodplain. Reaches B-1 and B-2 are
Type C channels (Figure 36). The lower valley, with
primarily C stream type, is very vulnerable to bank
erosion problems. A 2007 survey of Bluff Creek
identified three streambank erosions sites. Site 1
(Figure 35 and pictured to the right) is an eroded bank
immediately downstream of the regional trail culvert
pictured in Figure 28. The stream channel has
downcut significantly below the culvert, and the culvert is being undermined.
Figure 35 Streambank erosion is undermining this culvert at Site 1.

P:\Mpls\23 MN\27\2327I25 Bluff Creek Watershed TMDL\Work Files\Biotic TMDL – Stressor ID\Bluff Creek Stressor Identification 43
Figure 36 Bluff Creek Stream Types: Bluff Creek TMDL Study

P:\Mpls\23 MN\27\2327I25 Bluff Creek Watershed TMDL\Work Files\Biotic TMDL – Stressor ID\Bluff Creek Stressor Identification 44
The second streambank erosion site, Site 11 [shown
on Figure 34 and pictured to the right (Figure 37)], is
located in the lower valley of Bluff Creek. This
location notes a slope failure immediately adjacent to
the stream. The third site, Site 20 [shown on
Figure 37 and pictured below (Figure 38)], consists of
an approximately 400-foot long reach of Bluff Creek
having severe bank erosion.
Past straightening of stream reaches has contributed
to the degradation of stream reaches and added to the
stream’s sediment problem. As shown in Figure 36,
several sections of the stream are Type E straightened
stream reaches. Reach B-3 notes a loss of
meandering due to straightening (Figure 36). Channel
straightening downstream of Reach B-4 (Figure 36)
together with an upstream railroad culvert have resulted
in degradation at this Type C reach.
The impact of sediment on the fish community in
Bluff Creek is evident from IBI scores from stream
stations upstream and downstream from the primary
sediment sources to Bluff Creek. As noted
previously, the primary sources of sediment to the
stream are ravines with severe or moderate erosion
that are located between Stations B-1 and B-2. IBI
scores from B-1 and B-2 were compared during the
years in which the highest and lowest mean annual
total suspended solids (TSS) concentrations were
observed in Bluff Creek. The highest mean annual TSS
was observed in 1997 (715 mg/L) and the lowest mean
annual TSS was observed in 1999 (97 mg/L). During
1997, no fish were observed or caught at Station B-1
while Station B-2 noted an IBI score of 24 which is
below the impairment threshold. During 1999, Station
Figure 37 Site 11 noted slope failure immediately adjacent to the stream
Figure 38 Severe bank erosion is found in the 400-foot reach of Bluff Creek at Site 20. Flow causes and determines the degree of streambank erosion in Bluff Creek.

P:\Mpls\23 MN\27\2327I25 Bluff Creek Watershed TMDL\Work Files\Biotic TMDL – Stressor ID\Bluff Creek Stressor Identification 45
B-1 noted an IBI score of 16.8, which is below the impairment threshold while Station B-2 noted an
IBI score of 38.4 which is above the impairment threshold. While both stations noted improved IBI
scores during the year in which lower TSS was measured, Station B-2 met the impairment standard
during 1999 while Station B-1 failed to meet the impairment standard. The data indicate sediment
from ravine erosion downstream of B-2 is a candidate cause of the stream impairment observed at
Station B-1.
Habitat data collected by the RPBCWD from B-1 during 2003 through 2006 provide evidence that
sediment is a stressor for the fish community. The number of locations with fine sediment was
divided by the total number of stations sampled to determine the percent of locations with fine
sediment. Fine sediment was found at 79 to 96 percent of sample locations (Table 7). The number
of locations with embeddedness was divided by the number of locations with coarse substrate (i.e.,
boulder, rubble, and gravel) to determine the percent of eligible locations with embeddedness. From
91 to 100 percent of locations observed sediment embeddedness and the percent embeddedness
observed at these locations ranged from 39 to 63 percent (Table 7).
Table 7 Habitat Summary of EUC-B1.
Mean Water Depth
Mean Depth of Fines
Max Depth of Fines
% of Locations With Fines
# Locations With Embed-dedness
% of Eligible locations with Embed-dedness
Mean % Embed-dedness
IBI Year cm cm cm % # % % Score 2003 21 3 13 80 46 100 43 16.8
2004 13 4 16 79 30 91 54 16.8
2005 9 5 17 96 39 100 39 16.8
2006 10 4 12 77 40 100 63 16.8
Lithophils are fish, such as white sucker, that require clean gravel or boulders for reproduction and
are adversely impacted by sediment deposits. Lithophils were not observed at B-1 during the period
of record. The lack of lithophils at B-1 (Table 3) was associated with the presence of fine and
bedded sediment (Table 7). The data indicate sediment is a stressor to the B-1 biological community.
As shown in Figure 33, suspended, deposited, and bedded sediment cause harm to the biological
community. Suspended sediment decreases visibility, decreases feeding efficiency, and increases gill
damage in fish. Abrasion reduces periphyton growth thereby reducing food availability. Sediment
causes a reduction in taxa with exposed gills, visual feeders, and herbivores and omnivores.

P:\Mpls\23 MN\27\2327I25 Bluff Creek Watershed TMDL\Work Files\Biotic TMDL – Stressor ID\Bluff Creek Stressor Identification 46
Invertebrates are also harmed by sediment, particularly sensitive invertebrates with exposed gills,
such as stoneflies. Invertebrate data collected from Bluff Creek indicates high concentrations of TSS
caused the disappearance of stoneflies while declining concentrations resulted in their reappearance
(Figure 39). Stonefly sampling during 1998 through 2004 consistently occurred during October.
Because the stonefly life cycle generally ranges from a few months to one year, changes in numbers
of stonefly nymphs in Bluff Creek over a seven year period cannot be explained by emergence of
adults from the stream. The data indicate changes in numbers of stonefly nymphs at B-1 during 1998
through 2004 are due to changes in sediment in Bluff Creek (Figure 39).
Bluff Creek Mean Annual TSS Compared With Number of Stoneflies At B-1
0100200300400500600700800
1995 2000 2005 2010
TSS
(mg/
L)
0
10
20
30
40
50
60
Annual Mean TSSStoneflies
Figure 39 Bluff Creek Mean Annual TSS Compared With Number of Stoneflies at B-1
Turbidity and total suspended solids data from Bluff Creek have measured the amount of fine
sediment plus organic material suspended in the water column (Figures 32 and 30, respectively). A
periphyton growth study has documented the role of sediments to scour periphyton from substrates
and thereby reduce available food for the stream’s biological community (Figure 18). A stream
survey has identified sediment sources to the stream (Figure 34). A habitat survey has documented
the presence of fine and bedded sediment in Bluff Creek (Table 7). Fish (Figure 3) and invertebrate
(Figure 39) data have documented the impact of sediment on the stream’s biological community.
These pieces of evidence indicate sediment is a candidate cause of the stream’s impairment.

P:\Mpls\23 MN\27\2327I25 Bluff Creek Watershed TMDL\Work Files\Biotic TMDL – Stressor ID\Bluff Creek Stressor Identification 47
4.2.3 Candidate Cause 3: Flow High flows are a problem for Bluff Creek because sediment input from bank and ravine erosion is
evident at high flows (Appendix C). Reduced IBI scores during 1997 through 1998 were associated
with increased flows while improved IBI scores during 1999 was associated with decreased flows
(Figure 5). Hence, flow is a candidate stressor. Management of flow should be included in
management measures to address the stream’s sediment problem.
To prevent the current problem from worsening with future development, management measures to
prevent anthropogenic flow increases should be employed now and in the future. Currently, there is
no long-term record of anthropogenic flow increases in Bluff Creek. Bankfull flow is the primary
parameter used to determine whether watershed development has resulted in the addition of increased
volumes of surface runoff. Bankfull flow is the maximum amount of discharge that a stream channel
can carry without overflowing. As a watershed urbanizes and surface runoff volume increases, the
frequency of bankfull flow increases. This increase causes an increase in streambank erosion. An
evaluation of Bluff Creek flow during 2002 through 2008 indicates bankfull discharge occurred twice
during the period and both occurrences were in 2005 [(i.e., 85 cfs on September 5 and 175 cfs on
October 5 (Figure 41)]. This is a frequency of once
every 4 years, which is less than the average return
interval of 1.5 years (Leopold, 1994; Dunne and
Leopold, 1978). To prevent the current bankfull
discharge frequency from increasing, management
measures to prevent anthropogenic flow increases
should be employed now and in the future.
Although there is no long-term record of
anthropogenic flow increases, higher flows have been
associated with declining IBI scores while lower
flows have been associated with improving IBI scores
(Figures 4 and 5). As shown in Figure 42, wet
weather, as well as watershed land cover alteration,
increase surface water inputs to Bluff Creek.
Increased surface runoff increases sediment input
from ravines as well as sediment input from streambank erosion. These increases in deposited and
bedded sediment to Bluff Creek cause stress to the biological community as shown in Figure 33.
Figure 40 Increased overland flow
increases ravine erosion, pictured above,
and increases sediment deposited and
bedded in Bluff Creek.

P:\Mpls\23 MN\27\2327I25 Bluff Creek Watershed TMDL\Work Files\Biotic TMDL – Stressor ID\Bluff Creek Stressor Identification 48
Hence, Figure 42 shows that flow interacts with sediment to cause impairment of the biological
community.
020406080
100120140160180200
2001 2002 2003 2004 2005 2006 2007 2008
Dis
char
ge -
CFS
Estimated Bankfull Flow = 72 cfs
Figure 41 2002-2008 Bluff Creek Average Daily Flows Compared With Bankfull Flow: WOMP Station
Bluff Creek has consistently observed adequate baseflow to support the stream’s biological
community during the period of record. As shown in Figure 43, Bluff Creek mean daily flows at the
WOMP Station (Figure 2) were at least 0.2 cfs during 1998 through 2008. Periods in which flow is
not shown on the graph were periods in which equipment problems occurred and flow was not
measured. According to Ball (1982), a discharge of at least 0.1 is required to support tolerant or very
tolerant forage fish or tolerant macroinvertebrates and a discharge of at least 0.2 cfs is required to
support intolerant forage fish, intolerant macroinvertebrates, or a valuable population of tolerant
forage fish. Mean daily flows were consistently above the threshold required for the support of both
tolerant and intolerant fish and invertebrates. Flow measurements at the WOMP Station and B-1
during 1998 indicate the two locations note nearly identical flows (Figure 44). Hence, flow data
from the WOMP station appear to be representative of flows at B-1. The data indicate Bluff Creek at
and downstream from B-1 has consistently observed adequate baseflow during the 1998 through

P:\Mpls\23 MN\27\2327I25 Bluff Creek Watershed TMDL\Work Files\Biotic TMDL – Stressor ID\Bluff Creek Stressor Identification 49
Figure 42 Conceptual Model of Candidate Cause 3: Flow

P:\Mpls\23 MN\27\2327I25 Bluff Creek Watershed TMDL\Work Files\Biotic TMDL – Stressor ID\Bluff Creek Stressor Identification 50
2008 period of record. The stream has not observed problematic low flow conditions and, therefore,
only high flows appear to be a stressor to the stream’s biological community.
1998-2008 Bluff Creek Flows: WOMP Station At Mile 3.5
0
50
100
150
200
250
1998 1999 2000 2001 2002 2003 2004 2005 2006 2007 2008
Dis
char
ge -
CFS
Figure 43 1998-2008 Bluff Creek Average Daily Flows: WOMP Station
0
20
40
60
80
100
120
12/28 2/26 4/27 6/26 8/25 10/24 12/23
Dis
char
ge -
CFS
WOMP StationStation B-1
Figure 44 1998 Bluff Creek Discharge Data: B-1 and WOMP Station at Mile 3.5

P:\Mpls\23 MN\27\2327I25 Bluff Creek Watershed TMDL\Work Files\Biotic TMDL – Stressor ID\Bluff Creek Stressor Identification 51
High flows not only increase sediment loading to Bluff Creek, but also exacerbate the stress to the
biological community caused by habitat fragmentation. The impact of extremely high flows on the
biological community is evident from data collected during 1997 and 1998. Discharge at the WOMP
Station (Figure 2) reached 2,476 cfs on April 13, 1997 (Figure 45) and generally ranged from 25 to
100 cfs during May through December of 1997 (Figure 46). No fish were observed or collected at B-
1 during 1997 (Figure 4). Although flows were lower in 1998 (Figure 47) than 1997 (Figures 45 and
46), no fish were collected from B-1 during 1998 (Figure 4). It appears that when the high flows of
1997 moved fish downstream from the regional trail culvert, the habitat fragmentation prevented the
fish from returning to the upstream location and replenishing the fish community. During 1999,
flows were lower than 1997 through 1998 and fish were once again observed at B-1 (Figures 47, 4,
and 5) due to replenishment of the fish community. Hence, Figure 42 shows that flow interacts with
habitat fragmentation to cause impairment of the biological community.
0
500
1000
1500
2000
2500
3000
12/27 2/25 4/26 6/25 8/24 10/23 12/22
Dis
char
ge -
CFS
Figure 45 1997 Bluff Creek Flows: WOMP Station

P:\Mpls\23 MN\27\2327I25 Bluff Creek Watershed TMDL\Work Files\Biotic TMDL – Stressor ID\Bluff Creek Stressor Identification 52
0
20
40
60
80
100
120
12/27 2/25 4/26 6/25 8/24 10/23 12/22
Dis
char
ge -
CFS
Figure 46 May Through December, 1997 Bluff Creek Flows: WOMP Station
0
20
40
60
80
100
120
12/28 2/26 4/27 6/26 8/25 10/24 12/23
Dis
char
ge -
CFS
Figure 47 1998 Bluff Creek Flows: WOMP Station

P:\Mpls\23 MN\27\2327I25 Bluff Creek Watershed TMDL\Work Files\Biotic TMDL – Stressor ID\Bluff Creek Stressor Identification 53
0
50
100
150
200
250
12/29 2/27 4/28 6/27 8/26 10/25 12/24
Dis
char
ge -
CFS
Figure 48 1999 Bluff Creek Flows: WOMP Station
4.2.4 Candidate Cause 4: Metals Contamination Metals contamination is considered a candidate stressor because lead, copper, and zinc have failed to
meet MPCA standards for Bluff Creek. However, because MCES sample collection methods (MCES
2003) and analyses methods did not include the EPA “clean hands/dirty hands” method, the rigorous
ultra clean protocols of this method were not employed in sample collection and analysis. Hence,
there is the possibility that some level of contamination occurred and the high values are a result of
contamination rather than the addition of pollutants to the stream. Additional monitoring using the
“clean hands/dirty hands” method for both sample collection and analysis is recommended to confirm
that lead, copper, and zinc are candidate stressors of Bluff Creek.
Metals data collected from the MCES WOMP station during 1993 through 2008 were analyzed and
the analyses results depicted in Figures 49 through 72 which show analyses results for each of the six
metals species: lead, copper, zinc, cadmium, chromium, nickel. Four types of graphs are shown for
each of the six metals species.
Concentrations of metals plotted on the y-axis and sample collection date plotted on the
x-axis for each metals species. The Class 2B chronic standard is also shown for each

P:\Mpls\23 MN\27\2327I25 Bluff Creek Watershed TMDL\Work Files\Biotic TMDL – Stressor ID\Bluff Creek Stressor Identification 54
metals species. The chronic standard is the highest concentration of a toxicant to which
aquatic organisms can be exposed indefinitely with no harmful effects, or to which humans or
wildlife consumers of aquatic organisms can be exposed for a lifetime with no harmful
effects. Because the standard varies with total hardness, the chronic standard values for
Bluff Creek were calculated from equations provided for each metals species in Minn. R.
Pt. 7050.0222, subpart 4 (Figures 49, 53, 57, 61, 65, 69).
Concentrations of metals plotted on the y-axis and hardness on the x-axis with three Class
2B standards - chronic, maximum, and final acute values (FAV) – shown for each metals
species. Chronic standard (CS) is the highest concentration of a toxicant to which aquatic
organisms can be exposed indefinitely with no harmful effects, or to which humans or
wildlife consumers of aquatic organisms can be exposed for a lifetime with no harmful
effects. Maximum standard (MS) is a concentration that protects aquatic organisms from
potential lethal effects of a short-term “spike” in toxicant concentrations. The MS is always
equal to one half the final acute value. Final acute value (FAV) is the concentration that
would kill about half of the exposed individuals of a very sensitive aquatic species. The FAV
is most often used as an “end-of-pipe” effluent limit to prevent an acutely toxic condition in
the effluent or the mixing zone (Figures 50, 54, 58, 62, 66, 70).
Relationship between metals concentrations and total suspended solids (TSS) for each
metals species– this graph indicates whether or not metals are conveyed to Bluff Creek
via total suspended solids (Figures 51, 55, 59, 63, 67, and 71).
Relationship between metals concentrations and flow duration interval for each metals
species – this graph indicates the flow range in which the highest concentrations are
observed (Figures 52, 56, 60, 64, 68, 72).

P:\Mpls\23 MN\27\2327I25 Bluff Creek Watershed TMDL\Work Files\Biotic TMDL – Stressor ID\Bluff Creek Stressor Identification 55
0
10
20
30
40
50
60
70
80
Jan-93 Mar-97 Apr-01 May-05
Tota
l Lea
d (u
g/L)
Bluff Creek Total LeadMPCA Chronic Std
Figure 49 1993-2008 Bluff Creek Total Lead Compared With Chronic Standard: WOMP Station
0.0
0.1
1.0
10.0
100.0
1000.0
0 100 200 300 400 500Hardness (mg/L)
Tota
l Lea
d (u
g/L)
Bluff Creek TotalLeadChronic Standard
Maximum Standard
Final Acute Value
Figure 50. 1993-2008 Bluff Creek Total Lead: WOMP Station

P:\Mpls\23 MN\27\2327I25 Bluff Creek Watershed TMDL\Work Files\Biotic TMDL – Stressor ID\Bluff Creek Stressor Identification 56
Figure 51. Lead versus Suspended Solids for Bluff Creek WOMP Site
Figure 52. Lead Water Quality Duration Curve for Bluff Creek WOMP Site

P:\Mpls\23 MN\27\2327I25 Bluff Creek Watershed TMDL\Work Files\Biotic TMDL – Stressor ID\Bluff Creek Stressor Identification 57
1993-2008 Bluff Creek Total Copper: WOMP Station
0
10
20
30
40
50
60
70
80
90
Jan-93 Mar-97 Apr-01 May-05
Tota
l Cop
per (
ug/L
) Bluff CreekTotal Copper
MPCAChronic Std
Figure 53 1993-2008 Bluff Creek Total Copper Compared With Chronic Standard: WOMP Station
1993-2008 Bluff Creek Total Copper: WOMP Station
0
20
40
60
80
100
120
140
0 100 200 300 400 500Total Hardness (mg/L)
Tota
l Cop
per (
ug/L
)
Bluff Creek TotalCopper
ChronicStandard
MaximumStandard
Final AcuteValue
Figure 54. 1993-2008 Bluff Creek Total Copper: WOMP Station

P:\Mpls\23 MN\27\2327I25 Bluff Creek Watershed TMDL\Work Files\Biotic TMDL – Stressor ID\Bluff Creek Stressor Identification 58
Figure 55. Copper versus Suspended Solids for Bluff Creek WOMP Site
Figure 56. Copper Water Quality Duration Curve for Bluff Creek WOMP Site

P:\Mpls\23 MN\27\2327I25 Bluff Creek Watershed TMDL\Work Files\Biotic TMDL – Stressor ID\Bluff Creek Stressor Identification 59
0
50
100
150
200
250
300
350
400
450
Jan-93 Mar-97 Apr-01 May-05
Tota
l Zin
c (u
g/L)
Bluff Creek Total Zinc
MPCA Chronic Std
Figure 57 1993-2008 Bluff Creek Total Zinc Compared With Chronic Standard: WOMP Station
0
100
200
300
400
500
600
700
800
0 100 200 300 400 500Hardness (mg/L)
Tota
l Zin
c (u
g/L) Bluff Creek
Total ZincChronicStandardMaximumStandardFinal AcuteValue
Figure 58. 1993-2008 Bluff Creek Total Zinc: WOMP Station

P:\Mpls\23 MN\27\2327I25 Bluff Creek Watershed TMDL\Work Files\Biotic TMDL – Stressor ID\Bluff Creek Stressor Identification 60
Figure 59. Zinc versus Suspended Solids for Bluff Creek WOMP Site
Figure 60. Zinc Water Quality Duration Curve for Bluff Creek WOMP Site

P:\Mpls\23 MN\27\2327I25 Bluff Creek Watershed TMDL\Work Files\Biotic TMDL – Stressor ID\Bluff Creek Stressor Identification 61
0.0
0.5
1.0
1.5
2.0
2.5
3.0
3.5
4.0
Jan-93 Mar-97 Apr-01 May-05
Tota
l Cad
miu
m (u
g/L)
Bluff Creek TotalCadmium
MPCA Chronic Std
Figure 61 1993-2008 Bluff Creek Total Cadmium Compared With Chronic Standard: WOMP Station
0.0
0.1
1.0
10.0
100.0
0 100 200 300 400 500Total Hardness (mg/L)
Tota
l Cad
miu
m (u
g/L)
Bluff Creek TotalCadmiumChronic Standard
Maximum Standard
Final Acute Value
Figure 62. 1993-2008 Bluff Creek Total Cadmium: WOMP Station

P:\Mpls\23 MN\27\2327I25 Bluff Creek Watershed TMDL\Work Files\Biotic TMDL – Stressor ID\Bluff Creek Stressor Identification 62
Figure 63. Cadmium versus Suspended Solids for Bluff Creek WOMP Site
Figure 64. Cadmium Water Quality Duration Curve for Bluff Creek WOMP Site

P:\Mpls\23 MN\27\2327I25 Bluff Creek Watershed TMDL\Work Files\Biotic TMDL – Stressor ID\Bluff Creek Stressor Identification 63
0
100
200
300
400
500
600
700
Jan-93 Mar-97 Apr-01 May-05
Tota
l Chr
omiu
m (u
g/L)
Bluff Creek TotalChromium
MPCA TrivalentChromium ChronicStd.
Figure 65 1993-2000 Bluff Creek Total Chromium Compared With Chronic Standard: WOMP Station
0
1
10
100
1000
10000
100000
0 100 200 300 400 500Total Hardness (mg/L)
Tota
l Chr
omiu
m (u
g/L)
Bluff Creek TotalChromiumChronic Standard
Maximum Standard
Final Acute Value
Figure 66. 1993-2008 Bluff Creek Total Chromium: WOMP Station

P:\Mpls\23 MN\27\2327I25 Bluff Creek Watershed TMDL\Work Files\Biotic TMDL – Stressor ID\Bluff Creek Stressor Identification 64
Figure 67. Chromium versus Suspended Solids for Bluff Creek WOMP Site
Figure 68. Chromium Water Quality Duration Curve for Bluff Creek WOMP Site
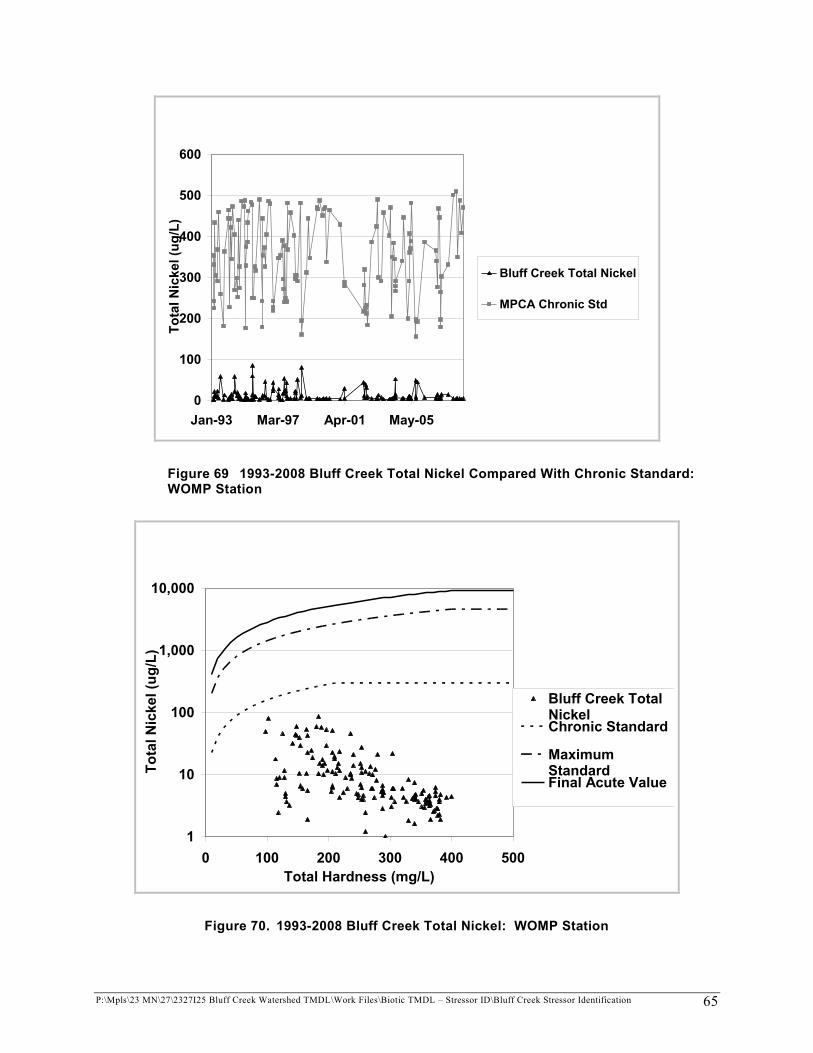
P:\Mpls\23 MN\27\2327I25 Bluff Creek Watershed TMDL\Work Files\Biotic TMDL – Stressor ID\Bluff Creek Stressor Identification 65
0
100
200
300
400
500
600
Jan-93 Mar-97 Apr-01 May-05
Tota
l Nic
kel (
ug/L
)
Bluff Creek Total Nickel
MPCA Chronic Std
Figure 69 1993-2008 Bluff Creek Total Nickel Compared With Chronic Standard: WOMP Station
1
10
100
1,000
10,000
0 100 200 300 400 500Total Hardness (mg/L)
Tota
l Nic
kel (
ug/L
)
Bluff Creek TotalNickelChronic Standard
MaximumStandardFinal Acute Value
Figure 70. 1993-2008 Bluff Creek Total Nickel: WOMP Station

P:\Mpls\23 MN\27\2327I25 Bluff Creek Watershed TMDL\Work Files\Biotic TMDL – Stressor ID\Bluff Creek Stressor Identification 66
Figure 71. Nickel versus Suspended Solids for Bluff Creek WOMP Site
Figure 72. Nickel Water Quality Duration Curve for Bluff Creek WOMP Site

P:\Mpls\23 MN\27\2327I25 Bluff Creek Watershed TMDL\Work Files\Biotic TMDL – Stressor ID\Bluff Creek Stressor Identification 67
Water quality data collected by the MCES at the WOMP Station (Figure 2) during 1993 through
2008 indicate nickel and chromium have consistently met all three MPCA standards, but lead,
copper, zinc, and cadmium failed to meet one or more standards:
Lead—failed to meet the chronic standard at a frequency of 10 percent but always met the
maximum standard and FAV (Figures 49 through 50)
Copper—failed to meet the chronic standard at a frequency of 7 percent, failed to meet the
maximum standard at a frequency of 2 percent, and failed to meet the FAV at a frequency of
1 percent (Figures 53 and 54).
Zinc—failed to meet the chronic standard at a frequency of 2 percent, failed to meet the
maximum standard at a frequency of 2 percent, and failed to meet the FAV at a frequency of
1 percent (Figures 57 and 58)
Cadmium—failed to meet the chronic standard at a frequency of 0.3 percent but always met
the maximum standard and FAV (Figures 61 and 62).
The data indicate lead, copper, and zinc are candidate stressors of Bluff Creek. Research studies
have shown that high concentrations of these metals species have the following adverse impacts on
fish:
Lead—Fish exposed to high levels of lead have exhibited muscular and neurological
degeneration and destruction, growth inhibition, mortality, reproductive problems, and
paralysis (Eisler, 1988).
Copper—High concentrations of copper have been toxic to fish (Owen, 1981).
Zinc—Growth, survival, and reproduction can all be adversely affected by elevated zinc
levels (Eisler, 1993).
An analysis of the relationship between flow duration intervals and metals concentrations (i.e., lead,
copper, and zinc) indicates highest metals concentrations consistently occurred during high flows
[(i.e., flows occurring at a frequency of less than 20 percent (Figures 52, 56, 60, and 64)]. An
analysis of the relationship between total suspended solids and metals concentrations (i.e. lead,
copper, and zinc) indicates metals concentrations in Bluff Creek are related to total suspended solids
(Figures 51, 55, 59, and 63). The data indicate metals are entering Bluff Creek with sediment during

P:\Mpls\23 MN\27\2327I25 Bluff Creek Watershed TMDL\Work Files\Biotic TMDL – Stressor ID\Bluff Creek Stressor Identification 68
periods of high flow. Because “clean hands/dirty hands” methodology was not employed during
collection and analyses of metals samples, the potential for contamination is acknowledged. For this
reason, paired biological and metals monitoring using “clean hands/dirty hands” methodology for
sampling and analysis is recommended to confirm metals contamination as well as adverse impacts
of metals contamination on Bluff Creek biota.
As shown in Figure 73, metals harm the biological community by increasing mortality, increasing
susceptibility to other stressors, reducing reproductive success, and increasing deformities and
disease. Harm occurs whether metals occur as particulate metals (i.e., sorbed to particles and bound
to abiotic ligands) or dissolved metals (i.e., are found in membrane permeable organometallic
compounds). Particulate metals are ingested and absorbed in the gut, increasing the tissue
concentration of metals. As tissue concentration of metals increases, protein damage increases,
membrane destabilization occurs, and bioaccumulation may occur. Free metal ions enter organisms
through passive diffusion through the gill epithelium or through increased binding and uptake at the
gill epithelium. Once ingested, free metals ions reduce the uptake of nutrients, impair blood ion
regulation, and increase tissue concentrations of metals. As tissue concentrations of metals increase,
protein damage and membrane destabilization occurs. The end result of exposure to high metals
concentrations is a biologically impaired fish and invertebrate community.
A comparison of metals concentrations and mayfly numbers in Bluff Creek during 1999 through
2005 provides evidence of the harm that high metals concentrations may be causing to the mayfly
community of Bluff Creek. Numbers of Baetis brunneicolor from Station B-1 consistently increased
when metals concentrations declined and decreased when metals concentrations increased during
1999 through 2005 (Figure 74). The direct response of this mayfly species to changing metals
concentrations provides evidence that metals contamination is a candidate cause of the stream’s
biological impairment. Studies by Clements et al. (1990), Newman et al. (1991), and Cain et al.
(2000) confirm that species of mayflies, including Baetis brunneicolor, are highly sensitive to metals.
A 100 percent reduction in Baetis brunneicolor was observed after 10 days of exposure to 25 µg/L
copper (Newman et al., 1991). Collection of additional paired biological metals and monitoring data
is recommended. The additional paired biological and metals monitoring data will best guide
implementation efforts.

P:\Mpls\23 MN\27\2327I25 Bluff Creek Watershed TMDL\Work Files\Biotic TMDL – Stressor ID\Bluff Creek Stressor Identification 69
Figure 73 Conceptual Model of Candidate Cause 4: Metals Contamination

P:\Mpls\23 MN\27\2327I25 Bluff Creek Watershed TMDL\Work Files\Biotic TMDL – Stressor ID\Bluff Creek Stressor Identification 70
0
200
400
600
800
1000
1200
1999 2000 2001 2002 2003 2004 2005Year
Num
ber
0
10
20
30
40
50
60
Lead
, Cop
per,
and
Zinc
C
once
ntra
tions
(ug/
L)
Baetis brunneicolor LeadCopperZinc
Figure 74 Number of Baetis brunneicolor Mayflies Observed at Bluff Creek Station B-1 and Mean Annual Concentrations of Lead, Copper, and Zinc During 1999-2005
4.2.5 Candidate Cause 5: Ionic Strength Ionic strength is considered a candidate stressor because relatively high (>1,000 µmhos/cm @ 25° C)
specific conductance levels have been measured in Bluff Creek. Minnesota Rule Chapter 7050
(Minn. R. 7050) specifies standards applicable to Minnesota streams to protect aquatic life. Bluff
Creek is required to meet the most restrictive water quality standard for Classes 2B, 2C, or 2D; 3A,
3B, 3C, or 3D; 4A and 4B or 4C; and 5 (Minn. R. Pt. 7050.0220 and Minn. R. Pt. 7050.040). Hence,
the specific conductance standard applicable to Bluff Creek is the standard specified for Class 4A
waters – values are not to exceed 1,000 µmhos/cm @ 25° C (Minnesota Rule Chapter 7050.0224
Subpart 2). RPBCWD measured specific conductance at Station B-1 (Figure 2) monthly during
March through October of 1996 through 2005. Although nearly all measurements were less than the
MPCA Class 4A standard of 1,000 µmhos/cm @ 25°C, a couple of measurements exceeded this
standard—1,104 µmhos/cm @ 25°C on March 18, 1997 and 1,251 µmhos/cm @ 25°C on March 19,
2002 (Figure 75). MCES measured specific conductance at the WOMP station (Figure 2) during
1993 through 2008. Although nearly all measurements met the MPCA Class 4A standard, three
measurements exceeded the standard—1,090 µmhos/cm @ 25°C on March 21, 2006,
1,040 µmhos/cm @ 25°C on March 19, 2008, and 1,017 µmhos/cm @ 25°C on March 28, 2008. As

P:\Mpls\23 MN\27\2327I25 Bluff Creek Watershed TMDL\Work Files\Biotic TMDL – Stressor ID\Bluff Creek Stressor Identification 71
shown in Figure 76, concentrations of specific conductance and chloride appear to vary concurrently
and as shown in Figure 77, specific conductance levels increased with increasing chloride
concentrations. The relationship between chloride concentrations and specific conductance levels
indicate that road salts are reaching Bluff Creek during snowmelt runoff in sufficient quantity to
occasionally elevate specific conductance levels above the MPCA Class 4A standard (Figures 75
through and 77).
0
200
400
600
800
1,000
1,200
1,400
08/19/93 02/05/96 07/24/98 01/09/01 06/28/03 12/14/05 06/01/08
Spec
ific
Con
duct
ance
(um
ho/c
m @
25
C)
MPCA Standard: <1,000 umhos/cm@25C
Figure 75 1996-2005 Bluff Creek Specific Conductance Data: B-1

P:\Mpls\23 MN\27\2327I25 Bluff Creek Watershed TMDL\Work Files\Biotic TMDL – Stressor ID\Bluff Creek Stressor Identification 72
0
200
400
600
800
1000
1200
3/16/1993
3/16/1994
3/16/1995
3/16/1996
3/16/1997
3/16/1998
3/16/1999
3/16/2000
3/16/2001
3/16/2002
Spec
ific
Con
duct
ance
(uhm
o/cm
@ 2
5 C
)
0
50
100
150
200
250
300
Chl
orid
e C
once
ntra
tions
(mg/
L)
Cond data
MPCA Standard
Chloride data
MPCA Standard < 1,000 uhmho/cm@ 25C
Figure 76 1993-2008 Bluff Creek Specific Conductance Data: WOMP Station
0
200
400
600
800
1000
1200
0 50 100 150 200Chloride Concentration (mg/L)
Spec
ific
Con
duct
ance
(uhm
o/cm
@ 2
5 C
)
Figure 77. Specific Conductance versus Chloride for Bluff Creek WOMP Station

P:\Mpls\23 MN\27\2327I25 Bluff Creek Watershed TMDL\Work Files\Biotic TMDL – Stressor ID\Bluff Creek Stressor Identification 73
During 1995 through 2005, specific conductance levels at Station B-1 were consistently higher than
levels at the downstream WOMP station. In 2000, mean annual specific conductance levels were
800 µmhos/cm @ 25°C at Station B-1 and 577 µmhos/cm @ 25°C at the downstream WOMP station
(Figure 78). As noted previously, in 2000 the IBI at B-1 failed to meet the impairment threshold
while a downstream station, 00MN008 located near the WOMP station, met the IBI impairment
threshold (Figure 3).
0
100
200
300
400
500
600
700
800
900
1990 1995 2000 2005 2010
Spec
ific
Cond
ucta
nce
(um
hos/
cm @
25
C)
WOMP
B-1
Figure 78 Comparison of Bluff Creek Mean Annual Specific Conductance Values at B-1 and WOMP Stations
The chloride standards applicable to Bluff Creek are the standards specified for Class 2B waters
(Minnesota Rule Chapter 7050.022 Subpart 2). Chloride data collected from the MCES WOMP
station (Figure 2) during 1999 through 2008 indicate chloride concentrations in Bluff Creek exceeded
the MPCA chronic standard for a Class 2B stream on only one occasion (March 12, 2002, see Figure
79) during the period of record and all values met the MPCA maximum and final acute value (FAV)
standards. Hence, despite the relationship between chloride and specific conductance shown in
Figure 77, chloride does not appear to be the ion causing the stream’s high specific conductance
values, except for one occasion during 2002.

P:\Mpls\23 MN\27\2327I25 Bluff Creek Watershed TMDL\Work Files\Biotic TMDL – Stressor ID\Bluff Creek Stressor Identification 74
0
200
400
600
800
1,000
1,200
1,400
1,600
1,800
2,000
2/1/99 2/1/02 2/1/05 2/1/08
Chl
orid
e (m
g/L)
MPCA Final Acute Value = 1720 mg/L
MPCA Maximum Standard = 860 mg/L
MPCA Chronic Standard = 230 mg/L
Figure 79 1993-2008 Bluff Creek Chloride Data: WOMP Station
Specific conductance, or electrical conductivity, is an indication of the amount of dissolved minerals
or total dissolved solids in water. Elevated conductivity
can be toxic to biological organisms through effects on
osmoregulation (Wichard et al, 1973; McCulloch et al,
1993; and Ziegler et al, 2007). Aquatic insects, such as
mayflies (Ephemeroptera), have relatively high
cuticular permeability and regulate ion uptake and
efflux using specialized external chloride cells on their
gills and integument and internally via Malpighian
tubules (Komnick, 1977, Gaino and Rebora, 2000).
Large increases in certain ions can disrupt water
balance and ion exchange processes and cause
organism stress or death. Impacts of elevated
conductivity vary with species. Heptagenia (Figure
80) is a more sensitive mayfly species than Baetis and mayflies are more sensitive than caddisflies,
such as Ceratopsyche and Hydropsyche (Figure 81) (EPA, 2008).
Figure 80 Pictured above is Heptagenia, a mayfly
species sensitive to ionic strength. Heptagenia was
found in Bluff Creek during 2002, 2004, and 2005.

P:\Mpls\23 MN\27\2327I25 Bluff Creek Watershed TMDL\Work Files\Biotic TMDL – Stressor ID\Bluff Creek Stressor Identification 75
A linear regression of average annual specific
conductance values and IBI scores at Station B-1 during
1999 through 2005 indicates the two variables are related,
but the relationship does not support the hypothesis that
ionic strength is a candidate stressor (Figure 82).
Increasing IBI scores were observed with increasing
specific conductance levels (R2 of 0.79 and p-value of
0.02). The relationship indicates increasing specific
conductance levels resulted in increasing IBI scores, the
opposite effect expected from a candidate cause of
impairment.
20
21
22
23
24
25
26
27
28
29
700 720 740 760 780 800 820 840Specific Conductance (umhos/cm @ 25C)
IBI
IBI = (0.045 * Specific Conductance) - 9.69 R2 = 0.79 p-value = 0.02
Figure 82. 1999-2005 IBI versus Specific Conductance: B1
As shown in Figure 83, increased ionic strength (i.e., increased specific conductance levels) causes
increased osmotic stress, increased ion exchange, increased competition for anionic gill sites,
Figure 81 Hydropsyche caddisflies
pictured above are more tolerant to high
conductivity levels than mayflies.
Hydropsyche were observed nearly
annually in Bluff Creek since 1997.

P:\Mpls\23 MN\27\2327I25 Bluff Creek Watershed TMDL\Work Files\Biotic TMDL – Stressor ID\Bluff Creek Stressor Identification 76
Figure 83 Conceptual Model of Candidate Cause 5: Ionic Strength

P:\Mpls\23 MN\27\2327I25 Bluff Creek Watershed TMDL\Work Files\Biotic TMDL – Stressor ID\Bluff Creek Stressor Identification 77
increased toxicity of specific ions, and decreased bioavailability of essential elements. Biologically
impaired fish and invertebrate assemblages may result from increased ionic strength.
Specific conductance is a candidate cause because specific conductance values have occasionally
exceeded MPCA criteria. In addition, concurrent changes in chloride and specific conductance
values and an apparent relationship between the two constituents indicate a plausible mechanism for
the high levels of ionic strength observed in the stream – the addition of salt during highway deicing
events. However, several pieces of evidence weaken the case for specific conductance as a candidate
cause. Most specific conductance values have met MPCA criteria. All but one chloride value met
MPCA criteria. Impacts from occasional ionic strength increases in Bluff Creek are not shown by
invertebrate data because Bluff Creek has consistently noted the presence of several
macroinvertebrates that are sensitive to increased ionic stress. The presence of Heptagenia, a mayfly
species particularly sensitive to increased ionic strength, indicates ionic strength increases have not
adversely impacted the biological community (Figure 84). Changes in Baetis brunneicolor numbers
do not appear to be associated with changes in ionic strength (Figure 84). However, confounding
stressors such as metals contamination make it difficult to determine the impacts of ionic strength
from Baetis brunneicolor numbers.
0
100
200
300
400
500
600
700
800
900
1995 2000 2005 2010
Spec
ific
Con
duct
ance
(um
hos/
cm @
25
C)
0
200
400
600
800
1,000
1,200
Num
ber o
f May
flies
Mean SpecificConductance B-1
Heptagenia sp.
Baetis intercalaris
Baetisbrunneicolor
Baetis flavistriga
Figure 84 Comparison of Bluff Creek Mean Annual Specific Conductance Values and Mayfly Numbers at Station B-1

P:\Mpls\23 MN\27\2327I25 Bluff Creek Watershed TMDL\Work Files\Biotic TMDL – Stressor ID\Bluff Creek Stressor Identification 78
5.0 Evaluate Data From the Case
Physical and water quality data as well as biological data from Bluff Creek were evaluated to
determine the strength of evidence for the candidate causes of Bluff Creek’s impairment. The types
of evidence used in the evaluation were:
Spatial/Temporal Co-occurrence—Biological effect observed where and when the cause is
observed and not observed where and when the cause is absent.
Evidence of Exposure or Biological Mechanism—Measurements of the biota show that
relevant exposure to the cause has occurred, or that other biological mechanisms linking the
cause to the effect have occurred
Causal Pathway—Steps in the pathways linking sources to the cause can serve as
supplementary or surrogate indicators that the cause and the biological effect are likely to
have co-occurred
Stressor-Response Relationships from the Field—As exposure to the cause increases,
intensity or frequency of the biological effect increases; as exposure to the cause decreases,
intensity or frequency of the biological effect decreases
Manipulation of Exposure—Field experiments or management actions that increase or
decrease exposure to a cause must increase or decrease the biological effect
Laboratory Tests of Site Media—Controlled exposure in laboratory tests to causes (usually
toxic substances) present in site media should induce biological effects consistent with the
effects observed in the field.
Temporal Sequence—The cause must precede the effect.
Verified Predictions—Knowledge of a cause’s mode of action permits prediction and
subsequent confirmation of previously unobserved effects.
Symptoms—Biological measurements (often at lower levels of biological organization than
the effect) can be characteristic of one or a few specific causes.

P:\Mpls\23 MN\27\2327I25 Bluff Creek Watershed TMDL\Work Files\Biotic TMDL – Stressor ID\Bluff Creek Stressor Identification 79
The CADDIS system for scoring types of evidence (Appendix B) was used to evaluate the evidence
from the case. Evaluation results follow for parameters supported by evidence.
5.1 Candidate Cause 1: Habitat Fragmentation 5.1.1 Spatial Co-occurrence – In 2000, two locations upstream of the regional trail culvert
noted an impaired fish community and the downstream location did not. Impairment at the upstream
location co-occurred with habitat fragmentation. An unimpaired fishery at the downstream location
co-occurred with no habitat fragmentation. The evidence was compatible with spatial co-occurrence
and a score of + was given (Table 8).
Table 8 Bluff Creek Evidence Table for Habitat Fragmentation: Evidence Using Data From Bluff Creek
Parameter
Candidate Cause 1 Habitat Fragmentation
Score Score Interpretation Spatial Co-Occurrence + The effect occurs where or when the candidate
cause occurs, or the effect does not occur where or when the candidate cause does not occur.
Evidence of Exposure or Biological Mechanism
++ Data show that exposure or the biological mechanism is clear and consistently present.
Symptoms D Symptoms or species occurrences observed at the site are diagnostic of the candidate cause.
Causal Pathway ++ Data show that all steps in at least one causal pathway are present.
Temporal Sequence + The candidate cause occurred prior to the effect.
5.1.2 Evidence of Exposure or Biological Mechanism – In 2000, the fish species
richness and composition upstream from the regional trail culvert was poor in comparison to the
downstream location. The upstream location was exposed to habitat fragmentation while the
downstream location was not. The upstream location was impaired and the downstream location was
not impaired. The evidence is compatible with exposure or biological mechanism (i.e., fish exposed
to habitat fragmentation were negatively impacted, resulting in impairment). A score of ++ was
given for evidence of exposure or biological mechanism (Table 8).
5.1.3 Symptoms – As shown in Figures 26 and 27, stream reaches upstream from the regional
trail culvert (i.e., Stations B-1 and 00MN009) observed fewer species than a downstream location
(i.e., 00MN008) not exposed to habitat fragmentation. A single species, brooke stickleback,

P:\Mpls\23 MN\27\2327I25 Bluff Creek Watershed TMDL\Work Files\Biotic TMDL – Stressor ID\Bluff Creek Stressor Identification 80
comprised from 50 to 100 percent of species collected from locations upstream from the regional trail
culvert, but only 25 percent of species collected from a downstream location. Brooke stickleback,
comprised from 92 to 100 percent of individuals collected from locations upstream from the regional
trail culvert, but only 34 percent of individuals collected from a downstream location. A score of D
was given for symptoms because the difference in number of species at locations upstream and
downstream from the regional trail culvert is diagnostic of impairment due to habitat fragmentation
(Table 8).
5.1.4 Causal Pathway All steps in the causal pathway of habitat fragmentation and fish impairment were present throughout
the period of record (i.e., 1997 through 2006). Habitat fragmentation occurred throughout this period
and fisheries impairment was annually observed. Because the data show that all steps of the causal
pathway of habitat fragmentation causing fish impairment, a score of ++ was given (Table 8).
5.1.5 Temporal Sequence Habitat fragmentation annually preceded fisheries impairment during the period of record (i.e., 1997
through 2006). Hence, a score of + was given for temporal sequence (Table 8).
5.2 Candidate Cause 2: Sediment 5.2.1 Spatial/Temporal Co-occurrence High sediment loads and an impaired biological community consistently co-occurred in Bluff Creek
Station B-1 during the period of record (i.e., 1997 through 2006). The evidence supports temporal
co-occurrence of sediment and an impaired biological community (Table 9).
A comparison of IBI scores of Station B-2, located upstream from the predominant sediment sources
to the stream, and IBI scores of Station B-1, located downstream from the predominant sediment
sources, indicated B-2 was unimpaired while B-1 was impaired. The evidence supports spatial co-
occurrence of sediment and impairment of the stream’s fishery. A score of + was given for
temporal/spatial co-occurrence (Table 9).

P:\Mpls\23 MN\27\2327I25 Bluff Creek Watershed TMDL\Work Files\Biotic TMDL – Stressor ID\Bluff Creek Stressor Identification 81
Table 9 Bluff Creek Evidence Table for Sediment: Evidence Using Data From Bluff Creek
Parameter
Candidate Cause 2 Sediment
Score Score Interpretation Spatial/Temporal Co-Occurrence
+ The effect occurs where or when the candidate cause occurs, or the effect does not occur where or when the candidate cause does not occur.
Evidence of Exposure or Biological Mechanism
++ Data show that exposure or the biological mechanism is clear and consistently present.
Symptoms D Symptoms or species occurrences observed at the site are diagnostic of the candidate cause.
Causal Pathway ++ Data show that all steps in at least one causal pathway are present.
Temporal Sequence + The candidate cause occurred prior to the effect.
5.2.2 Evidence of Exposure or Biological Mechanism The Bluff Creek biological community was consistently exposed to high sediment during the period
of record (i.e., 1997 through 2006) and an impaired biological community consistently occurred.
Suspended solids and turbidity data (Figures 30 and 32, respectively) show that sediment plus
organic material has consistently been suspended in the water column. A habitat survey has
documented the consistent presence of fine and bedded sediment in the stream (Table 7). Fish
(Figure 3) and invertebrate (Figure 39) data have documented the adverse impact of the sediment on
the stream’s biological community. The evidence is compatible with exposure or biological
mechanism (i.e., fish exposed to sediment were negatively impacted resulting in impairment). A
score of ++ was given for evidence of exposure or biological mechanism (Table 9).
5.2.3 Symptoms The presence of stoneflies in Bluff Creek when sediment concentrations have declined and the
disappearance of stoneflies when sediment concentrations have increased is a symptom of the
adverse impact of sediment on the stream’s biological community. As shown in Figure 39, declines
in mean annual TSS at B-1 were accompanied by the presence of stoneflies, while increases in mean
TSS were accompanied by the absence of stoneflies. Stoneflies are sensitive to water quality and are
eliminated when high concentrations of sediment are present. A score of D was given for symptoms
because the direct response of stoneflies to sediment changes in the stream is diagnostic of
impairment due to sediment (Table 9).

P:\Mpls\23 MN\27\2327I25 Bluff Creek Watershed TMDL\Work Files\Biotic TMDL – Stressor ID\Bluff Creek Stressor Identification 82
5.2.4 Causal Pathway All steps in the causal pathway of sediment and fish impairment were present throughout the period
of record (i.e., 1997 through 2006). Suspended sediment was consistently measured in the water
column (Figures 30 through 32), fine and bedded sediment was consistently measured at B-1 (Table
7), and fish impairment consistently occurred (Figure 3). Because the data show that all steps of the
causal pathway of sediment causing fish impairment, a score of ++ was given (Table 9).
5.2.5 Temporal Sequence Sediment (suspended, deposited, and/or bedded) was annually present in the stream prior to the
measurement of fisheries impairment during the period of record (i.e., 1997 through 2006). Hence, a
score of + was given for temporal sequence (Table 9).
5.3 Candidate Cause 3: Flow 5.3.1 Temporal Co-occurrence Increased flows during 1997 and 1998 were associated with the absence of fish at B-1 and reduced
flows during 1999 were associated with the presence of fish at B-1. Discharge at the WOMP Station
(Figure 2) reached 2,476 cfs on April 13, 1997 (Figure 44). Average discharge during 1997 and 1998
was higher than average discharge during 1999 (Figure 5). Although average discharge during 1999
was lower than 1997 and 1998, a significant flow event occurred on May 12 when discharge reached
200 cfs (Figure 46). Although fish were observed at B-1 in 1999, it appears that the high flow event
in May caused impairment (Figure 5). The flow and fish data from 1997 through 1999 are
compatible with temporal co-occurrence of flow and biological impairment. Hence, a score of + was
given for temporal co-occurrence (Table 10).

P:\Mpls\23 MN\27\2327I25 Bluff Creek Watershed TMDL\Work Files\Biotic TMDL – Stressor ID\Bluff Creek Stressor Identification 83
Table 10 Bluff Creek Evidence Table for Flow: Evidence Using Data From Bluff Creek
Parameter
Candidate Cause 3 Flow
Score Score Interpretation Temporal Co-Occurrence + The effect occurs where or when the candidate cause
occurs, or the effect does not occur where or when the candidate cause does not occur.
Evidence of Exposure or Biological Mechanism
+ Data show that exposure or the biological mechanism is weak or inconsistently present.
Causal Pathway ++ Data show that all steps in at least one causal pathway are present.
Temporal Sequence + The candidate cause occurred prior to the effect.
Manipulation of Exposure +++ The effect is eliminated or reduced when exposure to the candidate cause is eliminated or reduced or the effect starts or increases when exposure to the candidate cause starts or increases.
5.3.2 Evidence of Exposure or Biological Mechanism A comparison of flow measurements and IBI scores during 1997 through 1999 (Figures 4 and 5)
indicates the fish community was exposed to higher flows during 1997 and 1998 than 1999. High
flows during 1997 and 1998 were associated with the absence of fish at B-1. Although fish were
observed in 1999, a high flow event during May caused impairment (Figure 4). The data indicate
exposure to high flows have adversely impacted the biological community and that high flows are a
biological mechanism causing impairment.
While changes in flow were associated with changes in IBI scores during 1997 through 1999,
changes in flow were not associated with changes in IBI scores during 2000 through 2005. The IBI
score at B-1 remained constant during this period despite changes in flow. Although the 1997
through 1999 data indicate high flows adversely impacted the fish community, the flow threshold at
which no adverse impact to the fish occurs is not known. Hence, it is not known whether flows
occurring during the 2000 through 2005 period are the cause of the observed impairment of the fish
community. This unknown aspect of flow as a stressor (i.e., impairment flow threshold) and the lack
of change in IBI scores with changing flows during 2000 through 2005 indicate that exposure (i.e., to
high flows) or biological mechanism is weak or inconsistently present. Hence, a score of + was
given for evidence of exposure or biological mechanism for flow (Table 10).

P:\Mpls\23 MN\27\2327I25 Bluff Creek Watershed TMDL\Work Files\Biotic TMDL – Stressor ID\Bluff Creek Stressor Identification 84
5.3.3 Causal Pathway All steps in the causal pathway of high flows and impairment were present during the 1997 through
1999 period. Increased flows during 1997 and 1998 were associated with the absence of fish at B-1
and reduced flows during 1999 were associated with the presence of fish at B-1. Although flows
were lower during 1999 than 1997 and 1998, a significant flow event occurred on May 12 when
discharge reached 200 cfs. Although fish were observed, it appears that the high flow event in May
caused impairment during 1999. Because the data show that all steps of the causal pathway of high
flows causing fish impairment were present, a score of ++ was given (Table 9).
5.3.4 Temporal Sequence As shown in Figures 4 and 5, increased flows during 1997 and 1998 preceded reduced IBI scores.
Decreased flows during 1999 preceded improved IBI scores. As shown in Figures 44 through 47,
high flow events preceded the impaired fishery annually during 1997 through 1999. The evidence
was compatible and a score of + was given for temporal sequence (Table 10).
5.3.5 Manipulation of Exposure Flow data from 1997 through 1999 show that a reduction in flow results in a reduction of adverse
impacts to the fish community. Average discharge during 1997 and 1998 was higher than 1999 and
no fish were observed at B-1 during 1997 and 1998. Average discharge was lower in 1999 and fish
were observed at B-1. Although a high flow event during May adversely impacted the fish
community and impairment occurred, the effect (impairment) was reduced in 1999 as compared with
1997 and 1998. The evidence was compatible and a score of +++ was given for manipulation of
exposure (Table 10).
5.4 Candidate Cause 4: Metals Contamination 5.4.1 Temporal Co-occurrence
High concentrations of lead, copper, and zinc observed at the WOMP station co-occurred with an
impaired biological community in Bluff Creek Station B-1:
Lead—failed to meet the chronic standard at a frequency of 10 percent (Figures 49 through
50). An evaluation of lead concentrations during years in which fish data were collected
indicates lead failed to meet the chronic standard during 1997, 1998, 2001, 2004, and 2005
(Figures 49 and 50)

P:\Mpls\23 MN\27\2327I25 Bluff Creek Watershed TMDL\Work Files\Biotic TMDL – Stressor ID\Bluff Creek Stressor Identification 85
Copper—failed to meet the chronic standard at a frequency of 7 percent, failed to meet the
maximum standard at a frequency of 2 percent, and failed to meet the FAV at a frequency of
1 percent (Figures 53 and 54). An evaluation of copper concentrations during years in which
fish samples were collected as well as within 3 years of sample collection indicates copper
concentrations exceeded the chronic standard during 1994, 1995, 1997, 1998, 2001, 2002,
2004, and 2005; exceeded the maximum standard during 1994, 1995, 1997, 1998, 2002,
2004, and 2005; and exceeded the FAV standard during 1994, 1995, and 1998 (Figures 53
and 54).
Zinc—failed to meet the chronic standard at a frequency of 2 percent, failed to meet the
maximum standard at a frequency of 2 percent, and failed to meet the FAV at a frequency of
1 percent (Figures 57 and 58). An evaluation of zinc concentrations during years in which
fish data were collected as well as within 3 years of sample collection indicates zinc
concentrations exceeded the chronic standard during 1994, 1995, 1996, 1998 and 2005;
exceeded the maximum standard during 1994, 1995, 1996, and 1998; and exceeded the FAV
standard during 1995 (Figures 57 and 58)
Because high metals concentrations can adversely impact fish for up to 3 years, it appears that high
metals concentrations potentially impacted the fish community during the 1997 through 2006 period
in which fish data were collected. The evidence supports temporal co-occurrence of metals and an
impaired biological community. Hence, a score of + was given for temporal co-occurrence (Table
11).
5.4.2 Evidence of Exposure or Biological Mechanism
A comparison of metals concentrations and IBI scores during 1997 through 2006 (Figures 3, 49, 50,
53, 54, 57, 58) indicates the fish community was exposed to metals contamination during 1997
through 2006 and was impaired. The data indicate exposure to metals contamination has adversely
impacted the biological community and that metals contamination is a biological mechanism causing
impairment. Hence, a score of ++ was given for evidence of exposure or biological mechanism for
metals contamination causing impairment (Table 11).

P:\Mpls\23 MN\27\2327I25 Bluff Creek Watershed TMDL\Work Files\Biotic TMDL – Stressor ID\Bluff Creek Stressor Identification 86
Table 11 Bluff Creek Evidence Table for Metals: Evidence Using Data From Bluff Creek
Parameter
Candidate Cause 4 Metals Contamination
Score Score Interpretation Spatial/Temporal Co-Occurrence
+ The effect occurs where or when the candidate cause occurs, or the effect does not occur where or when the candidate cause does not occur.
Evidence of Exposure or Biological Mechanism
++ Data show that exposure or the biological mechanism is clear and consistently present.
Symptoms D Symptoms or species occurrences observed at the site are diagnostic of the candidate cause.
Causal Pathway ++ Data show that all steps in at least one causal pathway are present.
Temporal Sequence + The candidate cause occurred prior to the effect.
5.4.3 Symptoms The direct response of Baetis brunneicolor to changing concentrations of three types of metals –
lead, copper, and zinc – during 1999 through 2005 is symptomatic of harm from metals
contamination. During 1999 through 2005, numbers of Baetis brunneicolor from Station B-1
consistently increased when metals concentrations declined and decreased when metals
concentrations increased (Figure 74). Baetis brunneicolor, a mayfly, is adversely impacted by metals
contamination. The direct response by Baetis brunneicolor to changing metals concentrations is
diagnostic of metals contamination as a candidate cause of impairment. A score of D was given for
symptoms (Table 11).
5.4.4 Causal Pathway Throughout the period of record, high metals concentrations were associated with high flows and
high concentrations of total suspended solids (Figures 51, 52, 55, 56, 59, and 60). Hence, it appears
that metals contamination resulted from the conveyance of metals to Bluff Creek by sediment during
periods of high flow. When the fish community was impacted by metals contamination, fish
impairment was observed. All steps in the causal pathway of metals contamination and fish
impairment occurred during the period of record for fish data (i.e., 1997 through 2006). Because the
data show that all steps of the causal pathway of metals contamination causing fish impairment were
present during 1998 and 2005, a score of ++ was given (Table 11).

P:\Mpls\23 MN\27\2327I25 Bluff Creek Watershed TMDL\Work Files\Biotic TMDL – Stressor ID\Bluff Creek Stressor Identification 87
5.4.5 Temporal Sequence Metals contamination was present in Bluff Creek prior to impairment of the fish community during
1997 through 2006 (Figures 3, 49, 50, 53, 54, 57, 58). Hence, a score of + was given for temporal
sequence (Table 11).
5.5 Candidate Cause 5: Ionic Strength 5.5.1 Temporal Co-occurrence Specific conductance measurements exceeded MPCA standards on few occasions during the period
of record. Impairment in the fisheries community has been noted during both periods when ionic
strength could potentially be a stressor due to high specific conductance levels which may impact a
biological community for up to 3 years. High specific conductance levels were observed on March
18, 1997 and March 19, 2002. Impaired fisheries communities were observed during 1997 through
1999 and during 2002 through 2005. However, fisheries impairment has also been observed during
years in which ionic strength is not a potential stressor because high specific conductance values
were not observed within 3 years of the impaired fisheries community (i.e., 2000, 2001, 2005, and
2006). Because the effect and impaired fisheries community occurred during years in which the
candidate cause, ionic strength, did not occur (i.e., 2000, 2001, 2005, and 2006), a score of --- was
given (Table 12).
Table 12 Bluff Creek Evidence Table for Ionic Strength: Evidence Using Data From Bluff Creek
Parameter
Candidate Cause 4 Metals Contamination
Score Score Interpretation Spatial/Temporal Co-Occurrence
--- The effect does not occur where or when the candidate cause occurs or the effect occurs where or when the candidate cause does not occur.
Temporal Sequence 0 The temporal relationship between the candidate cause and the effect is uncertain.
Causal Pathway ++ Data show that all steps in at least one causal pathway are present.
Stressor Response Relationships From the Field
-- A strong effect gradient is observed relative to exposure to the candidate cause, at spatially linked sites, but the relationship is not in the expected direction.
Symptoms R Symptoms or species occurrences observed at the site are contrary to the candidate cause.

P:\Mpls\23 MN\27\2327I25 Bluff Creek Watershed TMDL\Work Files\Biotic TMDL – Stressor ID\Bluff Creek Stressor Identification 88
5.5.2 Temporal Sequence During periods of time when ionic strength could potentially be a stressor due to high specific
conductance levels within 3 years of the observance of an impaired fisheries community, the
candidate cause, ionic strength, preceded the effect, impaired fisheries community. However, during
periods of time when ionic strength could not potentially be a stressor due to a lack of high specific
conductance levels within 3 years of the observance of an impaired fisheries community, the
candidate cause, ionic strength, did not precede the effect, impaired fisheries. Hence, a score of 0
was given for temporal sequence (Table 12).
5.5.3 Causal Pathway A temporal comparison of specific conductance and chloride indicates their levels vary concurrently
(i.e., increasing chloride levels occur concurrently with increasing specific conductance levels). The
data show that all steps in a causal pathway are present (i.e., application of salts during highway
deicing causes increased specific conductance levels in Bluff Creek). A score of ++ was given for
causal pathway (Table 12).
5.5.4 Stressor Response Relationships From the Field A regression analysis of specific conductance and IBI scores from Station B-1 during 1999 through
2005 indicate a positive relationship between increasing specific conductance and increasing IBI
score. The R2 of the regression was 0.79 and the p-value was 0.02. Because this evidence refutes the
hypothesis that ionic strength is a candidate cause, a score of -- is given for stressor response
relationships from the field (Table 12). This finding strongly weakens the case for ionic strength as a
candidate cause.
5.5.5 Symptoms Heptagenia sp., a mayfly species sensitive to ionic strength, was found in Bluff Creek during 2002,
2004, and 2005. This species occurrence is contrary to the candidate cause. Hence, this finding
refutes the case for the candidate cause and a score of R is given for symptoms. The score of R
eliminates ionic strength from further consideration as a candidate stressor.

P:\Mpls\23 MN\27\2327I25 Bluff Creek Watershed TMDL\Work Files\Biotic TMDL – Stressor ID\Bluff Creek Stressor Identification 89
6.0 Evaluate Data From Elsewhere
Data from other studies were evaluated to determine whether a plausible mechanism and stressor
response could be identified for four candidate causes—habitat fragmentation, sediment, flow, and
metals contamination.
6.1 Habitat Fragmentation 6.1.1 Plausible Mechanism Results of a study of impacts of low-head dams on species richness in Wisconsin first order streams
indicate habitat fragmentation is a plausible mechanism for biological impairment. Study results
indicate downstream dams have a significant effect on species richness (Cumming, 2004). These
data indicate habitat fragmentation in Bluff Creek is a plausible mechanism for the stream’s impaired
fish assemblage. Hence, a score of + was given for plausible mechanism (Table 13).
Table 13 Bluff Creek Evidence Table for Habitat Fragmentation: Evidence Using Data From Elsewhere
Parameter
Candidate Cause 1 Habitat Fragmentation
Score Score Interpretation Plausible Mechanism + A plausible mechanism exists.
Plausible Stressor Response
+ The stressor-response relationship in the case agrees qualitatively with stressor-response relationships from other field, laboratory, and or modeling studies.
6.1.2 Plausible Stressor Response Results of a study by Letcher et al. indicate impairment is a plausible response to habitat
fragmentation in Bluff Creek. Study results indicate the isolation of a stream’s fish assemblage that
results from habitat fragmentation may lead to the demise of a fishery, including extinction (Letcher
et al., 2007). Hence, a score of + was given for plausible stressor response (Table 13).
6.2 Sediment 6.2.1 Plausible Mechanism Data from several studies indicate sediment is a plausible mechanism for biological impairment of
Bluff Creek.

P:\Mpls\23 MN\27\2327I25 Bluff Creek Watershed TMDL\Work Files\Biotic TMDL – Stressor ID\Bluff Creek Stressor Identification 90
Reproduction: Caux et al. (1997) and Rowe et al. (2003) noted changes in salmonid
community composition associated with increased turbidity, such as cascading trophic effects
affecting fish community composition, high mortality of eggs from decreased gas exchange,
and physiological and behavioral changes in juvenile and adult fish. A high percentage of
fine sediment is also inversely related to embryos and fry (U.S. EPA 1998).
Prey Availability: Fine sediments also disrupted trophic interactions, due to smothering,
scour, and lack of habitat (Caux et al 1997). Highly embedded substrates, low abundance of
boulders and gravel affect fish through decreased integrated flow (decreasing prey
abundance) and decreased cover (Rowe et al. 2003).
Because the results of studies completed by Caux et al. (1997), Rowe et al. (2003) and U.S. EPA
(1998) indicate sediment is a plausible mechanism for Bluff Creek’s impaired fishery, a score of + is
given for plausible mechanism (Table 14).
Table 14 Bluff Creek Evidence Table for Sediment: Evidence Using Data From Elsewhere
Parameter
Candidate Cause 2
Sediment
Score Score Interpretation Plausible Mechanism + A plausible mechanism exists.
Plausible Stressor Response
+ The stressor-response relationship in the case agrees qualitatively with stressor-response relationships from other field, laboratory, and or modeling studies.
6.2.2 Plausible Stressor Response Results from several studies indicate fisheries impairment is a plausible stressor response to
sediment. Rabeni et al. (1995) and Rashleigh et al. (2003) found that sediment impacted the fish
assemblage found in streams. Specifically they found that herbivores, benthic insectivores and
simple lithophilous spawners were most sensitive to siltation while other guilds were not. These
results were repeatable in both intraregional comparisons among sites of similar size and character,
and in interregional comparisons of streams which varied in characteristics beside siltation.
Rashleigh et al. (2003) found that the number of benthic invertivore, cyprinid, and lithophilic species
appeared to be negatively associated with many substrate characteristics that are indicative of
sedimentation.

P:\Mpls\23 MN\27\2327I25 Bluff Creek Watershed TMDL\Work Files\Biotic TMDL – Stressor ID\Bluff Creek Stressor Identification 91
Caux et al. (1997) recommend substrate not exceed 10% fine material (<2mm) for Canadian
salmonids. U.S. EPA (1998) set in-stream summer criteria for percent fines (<6.5mm) of <30% for
viable salmonid fry emergence. The D50 (Knopp 1993) values of at least 37 mm and ideally 69 mm
are ideal targets for mean particle size diameter for western mountain streams. Fisheries impairment
was the biological response to sediment found in the Groundhouse River. Specifically, Site 3 in the
Groundhouse River had almost 60% fines (vs. 15% for site 2, located upstream from the sediment
source), greater than 50% embedded substrates, and a D50 value of 1 mm. Site 3 noted fisheries
impairment (MPCA, 2008b).
Because evidence from Caux et al. (1997), U.S. EPA (1998), Knopp 1993), MPCA (2008), Rabeni et
al. (1995 ), and Rashleigh et al. (2003 ) indicate impairment is a plausible response of Bluff Creek’s
fishery to sediment, a score of + is given for plausible stressor response (Table 14).
6.3 Flow 6.3.1 Plausible Mechanism Results of a study by Cogo et al. (1996) revealed that erosion increased substantially with increased
flow rates. Wirtz et al (2009) determined that increasing flow velocity causes higher turbulence and
increased sediment concentration. Because evidence from Cogo et al. (1996) and Wirtz et al. (2009)
indicate flow is a plausible mechanism for Bluff Creek’s impaired fishery, a score of + is given for
plausible mechanism (Table 15).
Table 15 Bluff Creek Evidence Table for Flow: Evidence Using Data From Elsewhere
Parameter
Candidate Cause 3 Flow
Score Score Interpretation Plausible Mechanism + A plausible mechanism exists.
Plausible Stressor Response
+ The stressor-response relationship in the case agrees qualitatively with stressor-response relationships from other field, laboratory, and or modeling studies.
6.3.2 Plausible Stressor Response Results of a study by Guenther (1999) indicated adverse changes in native fishes, aquatic insects, and
freshwater mussels were related to increased stream flow and associated hydrologic and habitat
changes. Habitat fragmentation was found to contribute to the adverse changes to the stream’s fish
community associated with flow increases. Two darter species and one sculpin species were found to

P:\Mpls\23 MN\27\2327I25 Bluff Creek Watershed TMDL\Work Files\Biotic TMDL – Stressor ID\Bluff Creek Stressor Identification 92
have greater extinction probabilities and reduced colonization probabilities in fragmented streams
(Guenther, 1999). A study by Fischer et al. (2000) indicated elevated discharges triggered upstream
longitudinal and lateral dispersion of bullheads. Because evidence from Guenther (1999) and Fischer
et al. (2000) indicate impairment is a plausible response of Bluff Creek’s fishery to increased flows, a
score of + is given for plausible stressor response (Table 15).
6.4 Metals Contamination 6.4.1 Plausible Mechanism Research studies indicate metals contamination is a plausible mechanism for impairment of the Bluff
Creek fisheries assemblage. Owen (1981) found that high concentrations of copper have been toxic
to fish. Because evidence from Owen (1981) indicates metals contamination is a plausible
mechanism for impairment, a score of + is given for plausible stressor mechanism (Table 16).
Table 16 Bluff Creek Evidence Table for Metals: Evidence Using Data From Elsewhere
Parameter
Candidate Cause 4 Metals Contamination
Score Score Interpretation Plausible Mechanism
+ A plausible mechanism exists.
Plausible Stressor Response
+ The stressor-response relationship in the case agrees qualitatively with stressor-response relationships from other field, laboratory, and or modeling studies.
6.4.2 Plausible Stressor Response A biologically impaired fish assemblage is a plausible response to metals contamination in Bluff
Creek. Fish exposed to high levels of lead have exhibited muscular and neurological degeneration
and destruction, growth inhibition, mortality, reproductive problems, and paralysis (Eisler, 1988).
Growth, survival, and reproduction can all be adversely affected by elevated zinc levels (Eisler,
1993). Because evidence from Eisler (1988 and 1993) indicates an impaired fish assemblage is a
plausible response to metals contamination, a score of + is given for plausible stressor response
(Table 16).

P:\Mpls\23 MN\27\2327I25 Bluff Creek Watershed TMDL\Work Files\Biotic TMDL – Stressor ID\Bluff Creek Stressor Identification 93
7.0 Identify Probable Causes
The strength of evidence for the four candidate causes – habitat fragmentation, sediment, flow, and
metals contamination - is summarized in Table 17.
Table 17 Bluff Creek Strength of Evidence Summary Table
Parameter
Candidate Cause 1 Habitat
Fragmentation
Candidate Cause 2
Sediment
Candidate Cause 3
Flow
Candidate Cause 4 Metals
Contamination Spatial/Temporal Co-Occurrence
+ + + +
Evidence of Exposure or Biological Mechanism
++ ++ + ++
Symptoms D D NA D
Causal Pathway ++ ++ ++ ++
Temporal Sequence
+ + + +
Manipulation of Exposure
NA NA +++ NA
Plausible Mechanism
+ + + +
Plausible Stressor Response
+ + + +
Consistency of Evidence
+ + + +
Coherence of Evidence
+ + + +
The probable causes of impairment of Bluff Creek are habitat fragmentation, sediment, flow, and
metals contamination. The evidence for habitat fragmentation, sediment, and metals contamination
is strongest followed by flow. The probable causes established in this stressor identification process
– habitat fragmentation, sediment, flow, and metals – will be addressed in more detail in the Bluff
Creek Watershed TMDL and Implementation Plan.
Because “clean hands/dirty hands” methodology was not employed during collection and analyses of
metals samples, the potential for contamination is acknowledged. For this reason, paired biological
and metals monitoring using “clean hands/dirty hands” methodology for sampling and analysis is

P:\Mpls\23 MN\27\2327I25 Bluff Creek Watershed TMDL\Work Files\Biotic TMDL – Stressor ID\Bluff Creek Stressor Identification 94
recommended to confirm metals contamination as well as adverse impacts of metals contamination
on Bluff Creek biota.
Due to the cold temperatures found in Bluff Creek, a Use Attainability Analysis is recommended to
evaluate whether the current Use Class or a different Use Class more reflective of the cold temperatures is
suitable.

P:\Mpls\23 MN\27\2327I25 Bluff Creek Watershed TMDL\Work Files\Biotic TMDL – Stressor ID\Bluff Creek Stressor Identification 95
References
Bailey, P. A., J.W. Enblom, S.R. Hanson, P.A. Renard, and K. Schmidt. 1994. Minnesota River Assessment Project 1990-1992: A Fish Community Analysis of the Minnesota River Basin. In Minnesota River Assessment Project Report Volume III Biological and Toxicological Assessment. Report to the Legislative Commission on Minnesota Resources. Minnesota Pollution Control Agency.
Barr Engineering Company. 1996. Riley-Purgatory-Bluff Creek Watershed District Water Management Plan Prepared in Accordance With the Metropolitan Surface Water Management Act and Watershed Law – Minnesota Statues, Chapters 103B and 103D. Prepared for Riley-Purgatory-Bluff Creek Watershed District.
Barr Engineering Co. 1997. (Draft). Engineer’s Report for Bluff Creek Corridor Feasibility Study. Bluff Creek Water Management Plan, Project #1997-1, Prepared for Riley-Purgatory-Bluff Creek Watershed District.
Barr Engineering Company. 1998. 1997 Engineer’s Annual Report – Riley-Purgatory-Bluff Creek Watershed District. Prepared for Riley-Purgatory-Bluff Creek Watershed District.
Barr Engineering Company. 1999. 1998 Engineer’s Annual Report – Riley-Purgatory-Bluff Creek Watershed District. Prepared for Riley-Purgatory-Bluff Creek Watershed District.
Barr Engineering Company. 2000. 1999 Engineer’s Annual Report – Riley-Purgatory-Bluff Creek Watershed District. Prepared for Riley-Purgatory-Bluff Creek Watershed District.
Barr Engineering Company. 2001. 2000 Engineer’s Annual Report – Riley-Purgatory-Bluff Creek Watershed District. Prepared for Riley-Purgatory-Bluff Creek Watershed District.
Barr Engineering Company. 2002. 2001 Engineer’s Annual Report – Riley-Purgatory-Bluff Creek Watershed District. Prepared for Riley-Purgatory-Bluff Creek Watershed District.
Barr Engineering Company. 2003. 2002 Engineer’s Annual Report – Riley-Purgatory-Bluff Creek Watershed District. Prepared for Riley-Purgatory-Bluff Creek Watershed District.
Barr Engineering Company. 2004. 2003 Engineer’s Annual Report – Riley-Purgatory-Bluff Creek Watershed District. Prepared for Riley-Purgatory-Bluff Creek Watershed District.
Barr Engineering Company. 2005. 2004 Engineer’s Annual Report – Riley-Purgatory-Bluff Creek Watershed District. Prepared for Riley-Purgatory-Bluff Creek Watershed District.
Barr Engineering Company. 2006a. 2005 Engineer’s Annual Report – Riley-Purgatory-Bluff Creek Watershed District. Prepared for Riley-Purgatory-Bluff Creek Watershed District.
Barr Engineering Company. 2006b. Unpublished data collected for Riley-Purgatory-Bluff Creek Watershed District.
Barr Engineering Company. 2006c. In Channel Sediment Contribution – Bluff Creek.

P:\Mpls\23 MN\27\2327I25 Bluff Creek Watershed TMDL\Work Files\Biotic TMDL – Stressor ID\Bluff Creek Stressor Identification 96
Barr Engineering Company. 2007. Inventory and Assessment – Bluff Creek Lower Valley. Prepared for Riley-Purgatory-Bluff Creek Watershed District
Becker, G.C. 1983. Fishes of Wisconsin. University of Wisconsin Press, Madison.
Brynildson, O.M. and J.W. Hunt. 1975. Influence of Organic Pollution on the Density and Production of Trout in a Wisconsin Stream. Technical Bulletin 81, Wisconsin Department of Natural Resources, Madison.
Cain, D.J., W.G. Wallace, and S.N. Luoma. 2000. Metal Concentrations and Intracellular Distributions in Benthic Insects Naturally Exposed to Mine Waste. Presentation at North American Benthological Society Annual Meeting on May 29, 2000 in Bioassessment II.
Caux, P.Y., D.J. Moore, and D. MacDonald. 1997. Ambient Water Quality Guidelines (Criteria) for Turbidity, Suspended, and Benthic Sediments. Prepared by Cadmus Group, Inc. and MacDonald Environmental Services, Ltd., for British Columbia Ministry of Environment, Lands, and Parks.
Clements, William H., Donald S. Cherry, and John Cairns, Jr. 19990. Macroinvertebrate Community Responses to Copper in Laboratory and Field Experimental Streams . Arch. Environ. Contam. Toxicol. 19:361-365.
Cogo, N.P., G.R. Foster, and W.C. Moldenhauer. 1996. Flow Rates-Soil Erosion Relationships as Affected by Wheat Residue Cover: An Attempt to Define Slope Length Limits for Conservation Tillage. Revista Brasileira de Ciencia Do Solo. Vol. 20(3):475-483.
Cumming, G.S. 2004. The Impact of Low-Head Dams on Fish Species Richness in Wisconsin, USA. Ecological Applications 14:1495-1506.
Dolph, C.L., A. Sheshukov, C.J. Chizinski, B. Vondracek, and B. Wilson. 2010. The Index of Biological Integrity and the Bootstrap Revisited: an Example from Minnesota Streams . Ecological Indicators 10:527-537.
Dunne, T. and L.B. Leopold. 1978. Water in Environmental Planning. W. H. Freeman Co. San Francisco, CA. 818pp.
Engelund, F., and Hansen, E. (1967). A monograph on sediment transport in alluvial systems . Technisk Vorlag, Copenhagen, Denmark.
Eisler, R. 1988. Lead Hazards to Fish, Wildlife, and Invertebrates: A Synoptic Review . U.S. Fish Wildl. Serv. Biol. Rep. 85 ( 1.4).
Eisler, 1986. Chromium Hazards to Fish, Wildlife, and Invertebrates: A Synoptic Review. U.S. Fish Wildl. Serv. Biol Rep 85 (1.6).
Eisler, R. 1993. Zinc Hazards to Fish, Wildlife, and Invertebrates: A Synoptic Review . U.S. Fish Wildl. Serv. Biol. Rep. 10.
Fischer, Sabine and Helmut Kummer. 2000. Effects of Residual Flow and Habitat Fragmentation on Distribution and Movement of Bullhead (Cottus gobio L.) in an Alpine Stream. Hydrobiologia Vol. 422-23:305-317

P:\Mpls\23 MN\27\2327I25 Bluff Creek Watershed TMDL\Work Files\Biotic TMDL – Stressor ID\Bluff Creek Stressor Identification 97
Gaino, E., and M. Rebora. 2000. The Duct Connecting Malpighian Tubules and Gut: An Ultrastructural and Comparative Analysis in Various Ephemeroptera Nymphs (Pterygota). Zoomorphology 120:99-106.
Guenther, C.B. 2005. Response of Fish Assemblages to Habitat Fragmentation Caused by Downstream Impoundments Within the Upper Wabash River Basin, Indiana . Ph.D. Thesis. Purdue University.
Hilsenhoff, W.L. 1982. Using a Biotic Index to Evaluate Water Quality in Streams . Technical Bulletin No. 132. Department of Natural Resources, Madison, Wisconsin.
Hughes, R.M. and J.R. Gammon. 1987. Longitudinal changes in fish assemblages and water quality in the Willamette River, Oregon, Transactions of the American Fisheries Society, 116, 196-209.
Hynes, H.B.N. 1970. The Ecology of Running Waters. University of Toronto Press, Toronto.
Hynes, H.B.N. 1960. The Biology of Polluted Waters. Liverpool University Press, Liverpool, U.K.
Karr, J.R. and I.J. Schlosser. 1978. Water Resources and the Land-Water Interface. Science 201:229-234.
Klein, R.D. 1979. Urbanization and Stream Quality Impairment. Water Resources Bulletin 15 (4):948-963.
Knopp, C. 1993. Testing Indices for Cold Water Fish Habitat. Final Report for the North Coast Regional Water Quality Board.
Komnick, H. 1977. Chloride Cells and Chloride Epithelia of Aquatic Insects. International Review of Cytology 49:285-329.
Langdon, R. 1988. The Development of Fish Population-Based Biocriteria in Vermont, in T.P. Simon, L.L. Holst, and L.J Shepard (Eds.), Proceedings of the First National Workshop on Biocriteria. EPA 905-9-89-003. U.S. Environmental Protection Agency, Region 5, Environmental Sciences Division, Chicago. 12-25.
Lauer, W., Wong, M., and Mohseni, O. (2006). Sediment production model for the South Branch of the Buffalo River watershed. Project Report No. 473, Prepared for Houston Engineering, Inc. and Buffalo-Red River Watershed District, St. Anthony Falls Laboratory, 112 pp.
Leonard, P.M. and D.J. Orth. 1986. Application and Testing of an Index of Biotic Integrity in Small, Coolwater Streams. Transactions of the American Fisheries Society 115:401-404.
Leopold, L.B. 1994. A View of the River. Harvard University Press. Cambridge, Massachusetts.
Letcher, B.H., K.H. Nislow, J.A. Coombs, M.J. O’Donnell, and T. L. Dubreuil. 2007. Population Response to Habitat Fragmentation in a Stream-Dwelling Brook Trout Population. PLoS ONE 2(11):e1139. doi:10.1371/journal.pone.0001139.

P:\Mpls\23 MN\27\2327I25 Bluff Creek Watershed TMDL\Work Files\Biotic TMDL – Stressor ID\Bluff Creek Stressor Identification 98
Lusardi, B.A. (1997). Surficial geologic map of the Shakopee quadrangle, Carver, Scott, and Hennepin Counties, Minnesota. Scale 1:24,000. Minnesota Geological Survey map M-87 (ftp://mgssun6.mngs.umn.edu/pub2/m-87/M87.pdf).
Lyons, J., L. Wang, and T.D. Simonson. 1996. Development and Validation of an Index of Biotic Integrity for Stream with coldwater temperatures in Wisconsin. North American Journal of Fisheries Management. 16:241-256.
Lyons, J. 1992. Using the Index of Biotic Integrity (IBI) to Measure Environmental Quality in Warmwater Streams of Wisconsin. General Technical Report NC-149. U.S. Forest Service, North Central Experiment Station, St. Paul, Minnesota.
MacDonald, T.E., Parker, G., and Leuthe, D.P. (1991). Inventory and analysis of stream meander problems in Minnesota. Project Report No. 321, Prepared for Legislative Commission on Minnesota Resources, State of Minnesota, St. Anthony Falls Hydraulic Laboratory, 38 pp.
Magner, J., and Steffen, L. (2001). Stream morphological response to climate and land use in the Minnesota River Basin. Proceedings of the Seventh Federal Interagency Sedimentation Conference, Reno, Nevada, Volume 2, XI–89-XI–96.
McCulloch, W.L., W.L. Goodfellow, and J.A. Black. 1993. Characterization, Identification and Confirmation of Total Dissolved Solids as Effluent Toxicants. Environmental Toxicology and Risk Assessment. 2:213-227.
Minnesota Department of Natural Resources. 2000. Bluff Creek Monitoring Data. http://www.pca.state.mn.us/data/eda/STresults.cfm?stID=00MN0080&stOR=MPCAB and http://www.pca.state.mn.us/data/eda/STresults.cfm?stID=00MN009&stOR=MPCAB
Minnesota Pollution Control Agency (MPCA). 2008a. Minnesota River Basin Fish Database.
Minnesota Pollution Control Agency (MPCA). 2008b. Draft Groundhouse River TMDL for Fecal Coliform and Biota (Sediment) Impairment: Appendix D. Biological Data Assessment.
MPCA. 2009a. Draft Bluff Creek Stressor ID – MPCA Preliminary Comments.
MPCA. 2009b. Minnesota Administrative Rules Chapter 7050, Waters of the State. Web Document Accessed: September 3, 2009. https://www.revisor.leg.state.mn.us/rules/?id=7050&view=chapter.
MPCA. 2009c. Minnesota River Basin Temperature Data.
Metropolitan Council Environmental Services. 2003. Quality Assurance Program Plan: Stream Monitoring. Environmental Monitoring and Assessment Section, Water Resources Assessment Section.
Mundahl, Neal D. and Thomas P. Simon. 1998. Development and Application of an Index of Biotic Integrity for Coldwater Streams of the Upper Midwestern United States . P. 383-515. In Thomas P. Simon (ed.) Assessing the Sustainability and Biological Integrity of Water Resources Using Fish Communities. CRC Press, Boca Raton, FL.

P:\Mpls\23 MN\27\2327I25 Bluff Creek Watershed TMDL\Work Files\Biotic TMDL – Stressor ID\Bluff Creek Stressor Identification 99
Newman, Michael C. and Alan W. McIntosh. 1991. Metal Ecotoxicology: Concepts and Applications. Published by CRC Press Inc. 399 pages.
Oberdorff, T. and R.M. Hughes. 1992. Modification of an index of biotic Integrity Based on Fish Assemblages to Characterize Rivers of the Seine-Normandale Basin, France, Hydrobiologia, 228, 117-130.
Owen, C.A. 1981. Copper Deficiency and Toxicity: Acquired and Inherited, in Plants, Animals, and Man. Noyes Publications, New Jersey.
Komnick, H. 1977. Chloride Cells and Chloride Epithelia of Aquatic Insects. International Review of Cytology 49:285-329.
Letcher, B.H., K.H. Nislow, J.A. Coombs, M.J. O’Donnell, T. Dubreuill. 2007. Population Response to Habitat Fragmentation in Stream-Dwelling Brook Trout Population. Plosone (Nov 2007), issue, p.1-11.
McCulloch, W.L., W.L. Goodfellow, and J.A. Black. 1993. Characterization, Identification and Confirmation of Total Dissolved Solids as Effluent Toxicants . Environmental Toxicology and Risk Assessment. 2:213-227.
Pond, G.J., M.E. Passmore, T.A. Borsuk, L. Reynolds, and C.J. Rose. 2008. Downstream Effects of Mountaintop Coal Mining: Comparing Biological Conditions Using Family- and Genus-Level Macroinvertebrate Bioassessment Tools. J.N. Am. Benthol. Soc. 27(3):717-737.
Rabeni, C. F. and M. A. Smale. 1995. Effects of Siltation on Stream Fishes and the Potential Mitigating Role of the Buffering Riparian Zone. Hydrobiologia 303:211-219. F. Schiemer, M. Zalewski & J. E. Thorpe (eds), The Importance of Aquatic-Terrestrial Ecotones for Freshwater Fish. 1995. Kluwer Academic Publishers. Printed in Belgium.
Rashleigh, B. and J. G. Kennen. 2003. Beyond the Indices: Relations of Habitat and Fish Characteristics in the Georgia Piedmont. Proceedings of the 2003 Georgia Water Resources Conference, held April 23-24, 2003, at the University of Georgia. Kathryln J. Hatcher, editor, Institute of Ecology, the University of Georgia, Athens, Georgia.
Rowe, M., D. Essig, and B. Jessup. 2003. Guide to Selection of Sediment Targets for Use in Idaho TMDLs. Idaho Department of Environmental Quality. Boise, ID.
Sadig, M. 1992. Toxic Metal Chemistry in Marine Environments. Marcel Dekker. New York.
Simon, T.P. and J. Lyons. 1995. Application of the Index of Biotic Integrity to Evaluate Water Resource Integrity in Freshwater Ecosystems in Biological Assessment and Criteria Tools For Water Resource Planning and Decision Making. Edited by W.S. Davis and T. P. Simon. Lewis Publishers. Boca Raton, FL. 414pp.
Sindayigaya, E., R.V. Cauwnbergh, H. Robberecht, and H. Deelstra. 1994. Copper, Zinc, Manganexe, Iron, Lead, Cadmium, Mercury, and Arsenic in Fish From Lake Tanganyika, Burundi. The Science of the Total Environment. 144:103-115.

P:\Mpls\23 MN\27\2327I25 Bluff Creek Watershed TMDL\Work Files\Biotic TMDL – Stressor ID\Bluff Creek Stressor Identification 100
Steedman, R.J. 1988. Modification and Assessment of an Index of Biotic Integrity to Quantify Stream Quality in Southern Ontario, Canadian Journal of Fisheries and Aquatic Sciences, 45, 492-501.
Teller, J.T., and Clayton, L. (1983). Glacial Lake Agassiz. Geological Association of Canada, Special Paper 26, 451 pp.
Threinen, C.W. and R. Poff. 1963. The Geography of Wisconsin’s Trout Streams. Transactions of the Wisconsin Academy of Sciences, Arts, and Letters 52:57-75.
United States Environmental Protection Agency. 1998. Garcia River Sediment Total Maximum Daily Load. U.S. EPA Region IX. Web Document Accessed 10-28-2003: www.krisweb.com/krismattole/krisbd/html/biblio/regional/misc/fgarciatmdl.pdf
United States Environmental Protection Agency. 2008. Water Chemistry Associations With Benthic Macroinvertebrates: Ionic Stress. US EPA Region 3 Freshwater Biology Team, Wheeling, WVl TDS Webinar April 8, 2008.
Warren, C.E. 1971. Biology and Pollution Control. Saunders, Philadelphia.
Wichard, W., P.T.P. Tsui, and H. Komnick. 1973. Effect of different salinities on the Coniform Chloride Cells of Mayfly Larvae. Journal of Insect Physiology 19:1825-1835.
Wright, H.E. (1990). Geologic history of Minnesota Rivers. Educational Series 7, Minnesota Geological Survey and University of Minnesota, St. Paul, Minnesota, 20 pp.
Yoder, C.O. and E. T. Rankin. 1995. Biological Response Signatures and the Area of Degradation Value: New Tools For Interpreting Multimetric Data in Biological Assessment and Criteria Tools For Water Resource Planning and Decision Making. Edited by W.S. Davis and T. P. Simon. Lewis Publishers. Boca Raton, FL. 414pp.
Ziegler, C.R., G.W. Suter, B.J. Kefford, K.A. Schofield, and G.J. Pond. 2007. Common Candidate Cause: Ionic Strength. US EPA Causal Analysis and Diagnosis Decision Information System . US Environmental Protection Agency, Washington, DC.
Zimmerman, J.K.H., Vondracek, B., and Westra, J. (2003). Agricultural land use effects on sediment loading and fish assemblages in two Minnesota (USA) watersheds. Environmental Management, 32(1), 93-105.

Appendices

Appendix A
Fish Data


FISH SURVEY RECORD MDNR
Field Number: B-2 00MN009
Stream Name: Bluff Creek
Location: 00MN009
43.3 fish per 100m
Length Range Weight Number Anomalies
Species Name (mm) (g)
Brook Stickleback 28-72 60 0
Fathead Minnow 25-45 5 0

Appendix B
Comparison of Bluff Creek Specific Conductance Values and Mayfly
Numbers

Table B-1. Comparison of Average Specific Conductance Values and Mayfly Numbers at B-1 During 1999-2005
Average Annual Specific Conductance B-1 Parameter 1999 2000 2001 2002 2003 2004 2005
Average Annual Specific Conductance (umhos/cm @ 25 C 773 800 720 781 820 820 800
Mayflies B-1 Taxa 1999 2000 2001 2002 2003 2004 2005
Baetis brunneicolor 402 536 444 348 1088 676 251
Baetis flavistriga 48 16 10
Baetis intercalaris 4
Heptagenia sp. 4 4 2

Appendix C
2007 Inventory and Assessment—Bluff Creek Lower Valley

C-1

C-2
2007 Inventory and Assessment - Bluff Creek Lower Valley
Site 1
Site Description: This site includes the downstream end of the regional trail crossing culvert and an eroded bank immediately downstream of the culvert. The stream channel has downcut significantly below the culvert, and the culvert is being undermined. Left unchecked, the culvert may begin to fail.
Large drop and undermining at downstream end of regional trail culvert
Large bank failure downstream of culvert outlet on left bank
Site 2
Site Description:
Approximately 1,000 foot long main ravine with 600 foot long side ravine on the north side of the valley. Main ravine receives drainage via a corrugated metal pipe from Mandan Circle, with severe erosion below the discharge point. A large sand deposit exists about halfway down the main ravine. The tributary ravine receives drainage from C.R. 101 and has numerous sub-tributary ravines.
Large headcut in main ravine below pipe outlet from Mandan Circle
Tributary ravine has exposed tree roots and many smaller sub-tributary ravines

C-3
2007 Inventory and Assessment - Bluff Creek Lower Valley
Site 3
Site Description:
Approximately 850 foot long main ravine on the north side of the valley with moderate erosion. The ravine receives drainage from an 18-inch corrugated metal pipe from Creekwood Drive. The pipe conveys discharge from a pond on the north side of Creekwood Drive. There are several headcuts along the ravine, but no severe slope failures. A sand deposit is present at the bottom of the ravine.
Headcut followed by sand deposit in lower part of ravine
Headcutting in the upper part of the ravine
Site 4
Site Description:
Approximately 750 foot long main ravine with 600 foot secondary ravine on the north side of the valley. Main ravine has moderate erosion, while the secondary ravine requires additional investigation. The main ravine receives drainage from a 24-inch above-ground corrugated metal pipe that originates from the east end of the Bluff Creek Golf Course parking lot. The ravine bottom is well armored and fairly broad, with occasional slope failures along the banks.
Lower part of ravine has well-armored channel bottom with occasional slope failures
Pipe inlet from east end of golf course parking lot is in poor condition

C-4
2007 Inventory and Assessment - Bluff Creek Lower Valley
Site 5
Site Description:
Approximately 500 foot long, steep ravine on the south side of the valley with minor erosion. This ravine has a small watershed, with Hesse Valley Road at the head of the ravine.
Looking down into short, steep ravine Yard waste dumping onto failed slope
Site 6
Site Description:
Approximately 600 foot long ravine on the north side of the valley with severe erosion. The ravine originates from a point approximately 150 feet south of the Bluff Creek golf course parking lot. The ravine is narrow and incised, with a significant headcut approximately 1/3 distance from the bottom. Ravine terminates in a steep gully leading to the creek, with an adjacent failure on the creek bank.
Large headcut in lower part of ravine Looking up toward the top of the ravine

C-5
2007 Inventory and Assessment - Bluff Creek Lower Valley
Site 7
Site Description:
Approximately 700 foot long ravine on the north side of the valley with severe erosion. The mouth of the ravine is near that of Ravine 6, while the head of the ravine is approximately 300 feet west of the Bluff Creek golf course parking lot. The ravine is narrow and incised, with several significant headcuts. A 12-inch pipe drains to this ravine. A trickle of surface water flow was observed, but groundwater seepage may also be a contributing factor. A sand deposit was observed at the bottom of the ravine near the creek.
Large headcut in middle part of ravine Crack foretells impending slope failure
Site 8
Site Description:
Approximately 500 foot long ravine on the south side of the valley with minor erosion. The ravine originates near Hesse Farm Road and has a small tributary watershed. Although it is steep, there is only minor erosion evident in this ravine.
Looking down the ravine Looking up toward the top of the ravine

C-6
2007 Inventory and Assessment - Bluff Creek Lower Valley
Site 9
Site Description:
Approximately 400 foot long ravine on the south side of the valley with minor erosion. The ravine originates about 300 feet north of Hesse Farm Road and has a small tributary watershed. Although it is very steep, there is only minor erosion evident in this ravine.
Looking down the ravine Yard waste dumping in ravine
Site 10
Site Description:
Approximately 450 foot long ravine on the north side of the valley with severe erosion. . Lower half of ravine is deeply eroded and has been for some time, with vegetation re-established on portions of the eroded slopes. Exposed soils are dense sandy clay, with some strata resembling sandstone.
30 foot deep slope failure area Typical failed sidewall

C-7
2007 Inventory and Assessment - Bluff Creek Lower Valley
Site 11
Site Description:
This site consists of a very large slope failure on the north valley wall. A much smaller slope failure is nearby immediately adjacent to the creek. The larger slope failure has been present for many years, and the lower embankment has largely revegetated with grasses and small trees. The upper, more vertical banks continue to slowly erode. The original failure may have been induced by groundwater seepage or streambank erosion, but the upper vertical bank is probably no longer influenced by these factors.
Large slope failure has revegetated the lower bank
Bank failure on creek
Site 12
Site Description:
Approximately 1000 foot long ravine on the north side of the valley with a 225 foot tributary ravine, both having severe erosion. The lower 350 feet of the ravine is relatively stable, indicating that the ravine may be the result of a headcut that has been slowly migrating up the valley wall.
Severe erosion in upper part of main ravine Lower extent of ravine is relatively stable with a sandy channel

C-8
2007 Inventory and Assessment - Bluff Creek Lower Valley
Site 13
Site Description:
Approximately 650 foot long ravine on the west side of the valley with moderate erosion. The head of the ravine is at a hobby farm and apparently serves as a dumping area for yard waste and building materials. A minor bank failure is present near the mouth of the ravine at Bluff Creek, but does not appear likely to develop into a more severe erosion problem.
Yard waste and building materials at the head of the ravine
Some debris present at midpoint of ravine
Site 14
Site Description:
This site consists of a very large slope failure on the west valley wall, directly north of Site 13. The failure is approximately 300 feet across. Wet soils on the lower part of the failure indicate that groundwater probably plays a role in this failure. The upper vertical bank is comprised of very dense sandy clay. Timber debris and sand from the failure has accumulated at a bend in Bluff Creek.
Large slope failure has wet soils on lower area, very dense sandy clay soils on upper bank.
Timber debris and sand deposit at channel bend

C-9
2007 Inventory and Assessment - Bluff Creek Lower Valley
Site 15
Site Description:
Approximately 1,000 foot long ravine on the east side of the valley with severe erosion in the form of slope failures along the ravine. The head of the ravine is split, and each side is advancing. A new 12-inch plastic drain pipe has been installed in the east branch of the split in an attempt to curb the erosion, with fill and geotextile placed in the eroded ravine. A gully has formed in the fill material, however. A path crosses the ravine with a bridge, but the bridge abutments will soon be affected by the erosion. The lower part of the ravine is older and more stable, with a well developed channel carrying flow to Bluff Creek.
Looking down the ravine from golf cart bridge New pipe outlet from golf course
Site 16
Site Description:
This site consists of a large slope failure on the east valley wall. The failure is approximately 200 feet across and 80 feet high. Groundwater probably plays a role in this failure. The upper vertical bank is comprised of very dense sandy clay. An abandoned drain pipe is evident at the top of the ravine.
Large slope failure has wet soils on lower area, very dense sandy clay soils on upper bank.
Upper vertical bank is very dense clayey sand or soft sandstone

C-10
2007 Inventory and Assessment - Bluff Creek Lower Valley
Site 17
Site Description:
Approximately 380 foot long ravine on the east side of the valley with moderate erosion. The head of the ravine originates at the same hobby farm as site 13, with yard waste present. Some headcutting is evident, especially near the top and bottom of the ravine. The middle portion is relatively stable.
Looking up toward the head of the ravine, some headcutting present
Middle portion of ravine is fairly stable.
Site 18
Site Description:
Approximately 1,000 foot long ravine on the east side of the valley with severe erosion in the form of slope failures and headcutting along the ravine. Portions of the ravine are older, with vegetation present on the bottom and side slopes. Groundwater seepage may play a role in the frequent slope failures, or they may occur following significant flood events. There is another nearby slope failure about 150 feet north of this ravine. Stabilization of this failure could be accomplished at the same time.
Looking down the ravine Pipe outlet

C-11
2007 Inventory and Assessment - Bluff Creek Lower Valley
Site 19
Site Description:
Approximately 250 foot long ravine on the west side of the valley with moderate erosion. The head of the ravine originates at the same hobby farm as site 13, with brushy debris at the head of the ravine. A slope failure also exists near the head of the ravine.
Slope failure near head of ravine
Site 20
Site Description:
This site consists of an approximately 400 foot long reach of Bluff Creek having severe bank erosion. The erosion is occurring primarily on the east side of the valley wall where the stream abuts it. The stream is highly meandering in this reach, with some downed timber which tends to exacerbate the problem.
Bank erosion on outside of bend

C-12
2007 Inventory and Assessment - Bluff Creek Lower Valley
Site 21
Site Description:
Approximately 725 foot long ravine on the west side of the valley with minor to moderate erosion. The lower half of the ravine has moderate erosion, while the upper half has minor erosion. Some headcutting and bank erosion is evident throughout the ravine.
Looking up toward the head of the ravine, some headcutting and slope erosion present
Site 22
Site Description:
Site consists of two parallel 350 foot long ravines on the west side of the valley near Highway 212. The southern ravine has minor erosion while the northern ravine has moderate erosion.
Minor erosion present in the southern ravine

Appendix D
Summary Table of System for Scoring Types of Evidence


Appendix E
Invertebrate Data Summary

1992 Bluff Creek Invertebrate Data Collected October 2, 1992
Station: 14 (B1)
Taxa
No.
Specimens
Class Order Family Genus and Species
INSECTA Ephemeroptera (mayflies) Baetidae Baetis brunneicolor (nymphs) 12
Baetis sp. C 1
Trichoptera (caddisflies) Hydropsychidae Hydropsyche betteni 12
Limnephilidae Hesperophylax designatus 3
Coleoptera (beetles) Dryopidae (adults) Helichus sp. 6
Hydrophilidae (adult) Cymbiodyta sp. 1
CRUSTACEA Decopoda Astacidae Orconectes virilis 1
Amphipoda Gammaridae Gammarus limnaeus 117
HIRUDINEA 3
Total Specimens 156
1993 Bluff Creek Invertebrate Data Collected September 27, 1993
Station: 14 (B1)
Taxa
No.
Specimens
Class Order Family Genus and Species
INSECTA Coleoptera (beetles) Dryopidae (adults) Helichus sp. 1
Diptera (true flies) Tipulidae Tipula sp. (larvae) 1
Ephemeroptera (mayflies) Baetidae Baetis brunneicolor (nymphs) 50
Trichoptera (caddisflies) Hydropsychidae Cheumatopsyche sp. (larvae) 1
Hydropsyche betteni (larvae) 13
CRUSTACEA Amphipoda Gammaridae Gammarus limnaeus 57
MALACOSTRACA Terrestrial Isopoda 1
MOLLUSCA Gastropoda Lymnaeidae 1
Total Specimens 125

1994 Bluff Creek Invertebrate Data Collected October 6, 1994
Station: 14 (B1)
Taxa
No.
Specimens
Class Order Family Genus and Species
INSECTA Coleoptera (beetles) Dytiscidae (adult) 2
Elmidae Dubiraphia sp. (adults) 5
Diptera (true flies) Chironomidae 4
Tipulidae Tipula sp. (larvae) 1
Ephemeroptera (mayflies) Baetidae Baetis brunneicolor (nymphs) 16
Baetis vagans (nymphs) 2
Heptageniidae Stenacron sp. 1
Trichoptera Hydropsychidae Hydropsyche betteni (larvae) 23
Lepidostomatidae Lepidostoma sp. 1
CRUSTACEA Amphipoda Talitridae Hyalella azteca 42
Isopoda Asellidae Asellus sp. 1
MOLLUSCA Gastropoda Lymnaeidae Lymnaea stagnalis 1
HIRUDINEA 2
Total Specimens 101

1995 Bluff Creek Invertebrate Data Collected October 11, 1995
Station: 14 (B1)
Taxa
No.
Specimens
Class Order Family Genus and Species
INSECTA Hemiptera (true bugs) Gerridae Gerris sp. 1
Coleoptera (beetles) Dryopidae (adults) Helichus sp. 4
Dytiscidae (adult) Agabus sp. 1
Psephenidae Ectopria (larvae) 1
Trichoptera (caddisflies) Hydropsychidae Cheumatopsyche sp. (larvae) 11
Hydropsyche bettini (larvae) 5
Diptera (true flies) Chironomidae (larvae) 3
Chironomidae (pupa) 1
Simulidae Simulium corbis (larvae) 2
Tipulidae Tipula sp. (larvae) 1
CRUSTACEA Amphipoda Gammaridae Gammarus fasciatus (?) 836
MALACOSTRACA Terrestrial Isopoda 2
OLIGOCHAETA 3
Total Specimens 871

1996 Bluff Creek Invertebrate Data collected October 9, 1996
Station: B-1 B-2 B-3 B-4 B-5
Taxa
No.
Specimens
No.
Specimens
No. of
Specimens
No. of
specimens
No. of
specimens
Class Order Family Genus and Species
INSECTA Ephemeroptera (mayflies) Baetidae Baetis brunneicolor (nymphs) 50
Baetis flavistriga ( nymphs) 1
Baetis vagans (nymphs) 1
Heptageniidae Stenacron sp. (nymphs) 2
Coleoptera (beetles) Dryopidae Helichus (adults) 11 1 14
Dytiscidae Agabus sp. (adult) 2 1
Laccophilus sp. ( adult) 18
Laccornis sp. (adults) 1
Liodessus sp. (adults) 3
Hydrophilidae Helophorus sp. (adults) 1 3
Helocombus sp. (adults) 2
Tropisternus sp. (adults) 1 4
Staphylinidae (adult) Unable to Identify to Genus/Species 1
Trichoptera (caddisflies) Leptoceridae Nectopsyche sp. (larvae) 2 6
Limnophilidae Limnephilus sp. (larvae) 1
Diptera (true flies) Chironomidae Chironomidae (larvae) 15
Chironomidae (pupa) 1
Culicidae Anopheles sp. (larvae) 27
Culex sp. (larvae) 2 153
Culicidae pupae 1
Empididae Hemerodromia sp. (larvae) 1
Simuliidae Simulium corbis (larvae) 2
Stratiomyidae Odontomyia sp. (larvae) 1
Tipulidae Tipula sp. (larva) 2
Hemiptera (true bugs) Belostomatidae Belostoma sp. (adults) 1 2
Odonata Coenagrionidae Enallagma sp. (nymphs) 2
CRUSTACEA Amphipoda Gammaridae Gammarus sp. 205 67 167
Isopoda Asellidae Asellus 8
ANNELIDA Hirudinea 2 1
Oligochaeta 49
ENTOGNATHA Collembola Isotomidae 1
MOLLUSCA Gastropoda Hydrobiidae Amnicola sp. 1 1
Physidae Aplexa hypnorum 2
Physa sp. 1 22 106
Planorbidae Planorbula sp. 8
Pelecypoda Sphaeriidae Sphaerium sp. 2 89
Total Specimens 294 114 660

1997 Bluff Creek Invertebrate Data collected October 3 and 4, 1997
Station: B-1 B-2 B-3 B-4 B-5
Taxa
No.
Specimens
No.
Specimens
No. of
Specimens
No. of
specimens
No. of
specimens
Class Order Family Genus and Species
INSECTA Ephemeroptera (mayflies) Baetidae Baetis brunneicolor (nymphs) 245 94 404 288 2
Callibaetis spp. 5
Unidentifiable Baetis (nymphs) 1
Caenidae Caenis ( nymphs) 2
Heptageniidae Heptagenia sp. (nymphs) 1 1
Unidentifiable heptageniids (nymphs) 3
Coleoptera (beetles) Curculionidae (terrestrial?) Unable to Identify to Genus/Species 2
Dryopidae Unable to Identify to Genus/Species 1
Helichus (adults) 19 4
Dytiscidae Laccophilus (adult) 4 68 16
Hydroporinae (adults) 5 88 8
Colymbetinae (adults) 4
Unidentified Dytiscidae (adults,larvae) 1
Elmidae Unable to Identify to Genus/Species 3
Optioservus (larvae) 2
Optioservus spp.
Halipidae Peltodytes (adults) 1
Haliplus (adults) 1 6
Hydrophilidae Unable to Identify to Genus/Species 1 6
Tropisternus (adults) 2
Trichoptera (caddisflies) Unable to Identify to Family Unable to Identify to Genus/Species 1
Hydropsychidae Hydropsyche betteni (larvae) 11 3 1
Cheumatopsyche (larvae) 3 23 28 2
Unidentifiable hydropsychidae (larvae) 2 15 1
Limnophilidae Unable to Identify to Genus/Species 1
Diptera (true flies) Athericidae Unable to Identify to Genus/Species 1
Chironomidae Tanypodinae 3 6 13 1
Tanytarsini 3 1
Chironomidae (larvae) 6 6
Chironomidae (pupa) 7 6 1
Culicidae Unable to Identify to Genus/Species 2
Simuliidae Unable to Identify to Genus/Species 50 19 16 52 1
Simulium (pupae) 11 1
Stratiomyidae Unable to Identify to Genus/Species 1
Unidentifiable stratiomyid (larvae) 2
Tabanidae Unable to Identify to Genus/Species 2
Tipulidae Tipula (larva) 3
Higher Diptera (larvae) Unable to Identify to Genus/Species 2
Higher Diptera (pupae) Unable to Identify to Genus/Species 6 2

1997 Bluff Creek Invertebrate Data collected October 3 and 4, 1997 (Continued)
Station: B-1 B-2 B-3 B-4 B-5
Taxa
No.
Specimens
No.
Specimens
No. of
Specimens
No. of
specimens
No. of
specimens
Class Order Family Genus and Species
Hemiptera (true bugs) Belostomatidae Belostoma (adults) 22 6
Gerridae Limnoporus (?) (adults) 2
Aquarius (adults) 2 14 18
Pleidae
Neoplea (adults) 14 2
Odonata
Aeshnidae
Anax spp. 1 2 12
Aeshna spp. 1
Corduliidae
Somatochlora spp. 1
Coenagrionidae 1
Argia
Enallagma (nymphs) 34 16
Probably Ishnura (small) 14 12
Plecoptera 3
Lepidoptera
Pyralidae
Acentria spp.
ARACHNIDA
Spiders 2
CRUSTACEA
Malacostraca (crayfish)
Amphipoda
Gammaridae
Gammarus 198 180 700 215
Talitridae
Hyalella azteca 4 246 101
Decapoda
Astacidae
Orconectes
Isopoda 3
Terrestrial Porcellio or Cylisticus 2
Asellidae
Asellus 2 16
ANNELIDA
Hirudinea 2 2
Oligochaeta 3 4 4 4

1997 Bluff Creek Invertebrate Data collected October 3 and 4, 1997 (Continued)
Station: B-1 B-2 B-3 B-4 B-5
Taxa
No.
Specimens
No.
Specimens
No. of
Specimens
No. of
specimens
No. of
specimens
Class Order Family Genus and Species
MOLLUSCA
Gastropoda
Hydrobiidae
Amnicola 1 8
Lymnaeidae 1
Stagnicola 2
Physidae 2
Physa 7 9 140 8 20
Planorbidae
Valvatidae
Unidentified slug 2
Unidentified snails 1
Pelecypoda
Sphaeriidae 1 14 14 6 7
Total Specimens 579 405 1,814 833 80

1998 Bluff Creek Invertebrate Data collected October, 1998.
Station: B-1 B-2 B-3 B-4 B-5
Taxa
No.
Specimens
No.
Specimens
No. of
Specimens
No. of
specimens
No. of
specimens
Class Order Family Genus and Species
INSECTA DRY
Ephemeroptera (mayflies)
Baetidae
Baetis brunneicolor (nymphs) 79 16 8
Callibaetis spp. 1
Unidentifiable Baetis (nymphs) 1
Gerridae
Gerris (adults) 1
Heptageniidae
Stenacron (nymphs) 1
Heptagenia 1
Coleoptera (beetles)
Dryopidae
Helichus (adults) 19 10 2 4
Dytiscidae
Laccophilus (adult) 2 1
Elmidae
Dubiraphia (larvae) 1
Stenelmis (larvae) 4
Optioservus (larvae) 5
Halipidae
Haliplus (adults) 1
Hydrophilidae
Tropisternus (adults) 2 1
Trichoptera (caddisflies)
Brachycentridae
Brachycentrus occidentalis 1
Hydropsychidae
Hydropsyche betteni (larvae) 4 32 10 29
Ceratopsyche slossonae (larvae) 20 2
Cheumatopsyche (larvae) 3 1 4
Unidentifiable hydropsychidae (larvae) 8
Diptera (true flies) Chironomidae
Chironominae
Rheotanytarsus (larvae) 2 1
Tanypodinae 5
Tanytarsini 2
Chironomidae (larvae) 3
Culicidae
Pupae 1
Psychodidae 2
Tipulidae

Dicranota spp. 1
Tipula (larva) 3

1998 Bluff Creek Invertebrate Data collected October, 1998 (Continued)
Station: B-1 B-2 B-3 B-4 B-5
Taxa
No.
Specimens
No.
Specimens
No. of
Specimens
No. of
specimens
No. of
specimens
Class Order Family Genus and Species
Diptera (true flies) Higher Diptera (pupae) 2
Hemiptera (true bugs)
Belostomatidae
Belostoma (adults) 3 9 13
Corixidae
Sigara (adults) 6
Gerridae
Limnoporus (?) (adults) 4
Aquarius (adults) 2
Calopterygidae
Calopteryx (nymphs) 1
Plecoptera
Capniidae 1
Filipalpia spp. 2
DIPLOPODA (MILLIPEDS) 6
CRUSTACEA
Malacostraca (crayfish)
Amphipoda
Gammaridae
Gammarus 307 1500 980 165
Talitridae
Hyalella azteca 9
Cladocera 1
Isopoda
Asellidae
Asellus 1 3
ANNELIDA
Hirudinea 1 2 1
Oligochaeta 2 1
MOLLUSCA
Gastropoda
Lymnaeidae 1 1 2
Physidae
Physa 1 4 19
Valvatidae
Unidentified slug 3 1 4
Pelecypoda
Sphaeriidae 2 10 4
Total Specimens 463 1,600 1,020 285 0

1999 Bluff Creek Invertebrate Data collected October 4 and 5, 1999.
Station: B-1 B-2 B-3 B-4 B-5
Taxa
No.
Specimens
No.
Specimens
No. of
Specimens
No. of
specimens
No. of
specimens
Class Order Family Genus and Species
INSECTA
x Ephemeroptera (mayflies)
Baetidae
Baetis brunneicolor (nymphs) 402 1
Gerridae
Gerris (adults) 1
Aquarius (adults) 2
x Coleoptera (beetles)
Dryopidae
Helichus (adults) 5 5
Dytiscidae 2
Laccophilus (adult) 1
Unidentified Dytiscidae (adults,larvae) 2
Elmidae
Dubiraphia (adults) 4
Stenelmis (adults) 1 2
Optioservus (larvae) 13
Halipidae
Haliplus (adults) 1
Hydrophilidae
Enochrus (adults) 1
Staphylinidae (adults) 1
Tropisternus (adults) 1 2 1
Trichoptera (caddisflies)
Hydropsychidae
Hydropsyche betteni (larvae) 20 45 12
Ceratopsyche slossonae (larvae) 2 3
Cheumatopsyche (larvae) 11 5
Phyryganeidae
Psilostomis 3 3
Diptera (true flies)
Chironomidae 4
Orthocladinae 36 1
Chironominae
Diamesa spp. 4
Tanypodinae 5
Tanytarsini 2
Chironomidae (larvae) 2 33 6
Chironomidae (pupa) 1
Culicidae
Pupae 1
Simuliidae 4
Stratiomyidae

1999 Bluff Creek Invertebrate Data collected October 4 and 5, 1999 (Continued)
Station: B-1 B-2 B-3 B-4 B-5
Taxa
No.
Specimens
No.
Specimens
No. of
Specimens
No. of
specimens
No. of
specimens
Class Order Family Genus and Species
Diptera (true flies) Unidentifiable stratiomyid (larvae) 2
Tabanidae 1 3
Higher Diptera (larvae) 2
Hemiptera (true bugs)
Belostomatidae
Belostoma (adults) 6 6 5
Corixidae
Sigara (adults) 6
Trichocorixa (adults) 4
Gerridae
Aquarius (adults) 9
Gerris (adults) 2
Nepidae
Ranatra (adults) 1
Megaloptera
Corydalidae
Chauliodes spp. 1
Sialidae
Odonata
Aeshnidae
Aeshna spp. 1 4 2
Corduliidae
Neurocordulia 1
Calopterygidae
Calopteryx (nymphs) 1
Plecoptera
Filipalpia spp. 18
ARACHNIDA
Spiders 3
Subclass Acari
DIPLOPODA (MILLIPEDS) 1
CRUSTACEA
Malacostraca (crayfish)
Amphipoda
Gammaridae
Gammarus 1200 294 296 231
Talitridae
Hyalella azteca 1
Cladocera 1
Isopoda
Terrestrial Porcellio or Cylisticus 2 1
Asellus 4
ANNELIDA
Hirudinea 1 16

1999 Bluff Creek Invertebrate Data collected October 4 and 5, 1999 (Continued)
Station: B-1 B-2 B-3 B-4 B-5
Taxa
No.
Specimens
No.
Specimens
No. of
Specimens
No. of
specimens
No. of
specimens
Class Order Family Genus and Species
Oligochaeta 12
HYDROIDEA
Hydridae
Hydra 1
MOLLUSCA
Gastropoda
Lymnaeidae 2
Physidae
Physa 6 54 8
Valvatidae
Unidentified slug 4 1
Pelecypoda
Sphaeriidae 10 41 1
TURBELLARIA (flatworms)
Dugesia" type 9 8
Total Specimens 1,693 389 349 454 49

2000 Bluff Creek Invertebrate Data collected October 3 and 4, 2000.
Station: B-1 B-2 B-3 B-4 B-5
Taxa
No.
Specimens
No.
Specimens
No. of
Specimens
No. of
specimens
No. of
specimens
Class Order Family Genus and Species
INSECTA
x Ephemeroptera (mayflies)
Baetidae
Baetis brunneicolor (nymphs) 536
x Coleoptera (beetles) unidentified larvae 8
Trichoptera (caddisflies)
Unidentified larvae 16
Diptera (true flies)
Chironomidae
Chironominae
Diamesa spp. 72
Tanytarsini
Chironomidae (larvae) 32
Simuliidae
Simulium tuberosum 40
Tipulidae 16
Plecoptera
Undetermined 49
Amphipoda
Gammaridae
Gammarus 2,400
MOLLUSCA
Gastropoda
PhysidaePhysa 64
Total Specimens 3,233 0 0 0 0

2001 Bluff Creek Invertebrate Data collected October 1 and 2, 2001.
Station: B-1 B-2 B-3 B-4 B-5
Taxa
No.
Specimens
No.
Specimens
No. of
Specimens
No. of
specimens
No. of
specimens
Class Order Family Genus and Species
INSECTA
Ephemeroptera (mayflies)
Baetidae
Baetis brunneicolor (nymphs) 444 64 8
Caenidae
Caenis (nymphs) 2
Coleoptera (beetles) unidentified larvae
Dryopidae
Helichus (adults) 16 16 8 24
Dytiscidae
Agabetes 2 2
Laccophilus (adult) 4 16
Elmidae
Stenelmis (adults) 6
Stenelmis (larvae) 4
Optioservus (larvae) 4 48
Halipidae
Haliplus (adults) 4
Hydrophilidae
Tropisternus (adults) 2 12 8
Trichoptera (caddisflies)
Hydropsychidae
Hydropsyche betteni (larvae) 102 2
Ceratopsyche alhedra (?) (larvae) 2
Ceratopsyche slossonae (larvae) 12 4
Cheumatopsyche (larvae) 82 6
Phryganeidae
Ptilostomis spp. 2 14
Limnophilidae
Hesperophylax 4
Limnephilus 8
Phyryganeidae
Psilostomis 4
Diptera (true flies)
Chironomidae
Tanytarsini 8
Unidentified chironomidae 16 18
Simuliidae
Simulium vittatum (larvae) 2
Tipulidae 2
Tipula (larva) 6
Higher Diptera (larvae) 4 4
Hemiptera (true bugs)
Belostomatidae

2001 Bluff Creek Invertebrate Data collected October 1 and 2, 2001.
Station: B-1 B-2 B-3 B-4 B-5
Taxa
No.
Specimens
No.
Specimens
No. of
Specimens
No. of
specimens
No. of
specimens
Class Order Family Genus and Species
Belostoma (adults) 2 6
Corixidae
Sigara (adults) 2 16
Gerridae
Aquarius (adults) 6 4
Pleidae
Neoplea (adults) 2 4
Odonata
Aeshnidae
Anax spp. 2 4
CRUSTACEA
Malacostraca (crayfish) 14
Amphipoda
Gammaridae
Gammarus 1820 132 616 396
Talitridae
Hyalella azteca 2 4
Isopoda
Terrestrial Porcellio or Cylisticus 2
Collembola
Undetermined adults 4
ANNELIDA
Hirudinea
Erpobella punctata 2 4 4
MOLLUSCA
Gastropoda
Hydrobiidae
Amnicola 2
Physidae
Aplexa hypnorum 28
Physa 8 40 120 200
Planorbidae
Helisoma spp. 24
Helisoma anthrosa 2
Unidentified slug 2
Succinea (terrestrial)
Pelecypoda
Sphaeriidae
Pisidium 5 8 8
Sphaerium 5 8 8
TURBELLARIA (flatworms)
Dugesia" type 4
Tricladida
Total Specimens 2,358 588 884 686 0

2002 Bluff Creek Invertebrate Data collected October 2 through 4, 2002.
Station: B-1 B-2 B-3 B-4 B-5
Taxa
No.
Specimens
No.
Specimens
No. of
Specimens
No. of
specimens
No. of
specimens
INSECTA
Ephemeroptera (mayflies)
Baetidae
Baetis brunneicolor (larvae) 348 472 48 184 8
Baetis flavistriga (nymphs) 48
Baetis intercalaris 4
Heptageniidae
Heptagenia 4
Coleoptera (beetles) unidentified larvae 2
Dryopidae
Helichus (adults) 22 32 12
Dytiscidae
Coptotomus (adult) 1
Laccophilus (adult) 8 4
Neobidessus (adults) 2
Elmidae
Optioservus (larvae) 80 16
Halipidae
Haliplus (adults) 4
Hydrophilidae
Tropisternus (adults) 4 8
Trichoptera (caddisflies)
Hydropsychidae
Hydropsyche betteni (larvae) 10 296 56 104 4
Ceratopsyche alhedra (?) (larvae) 2 64 24
Ceratopsyche slossonae (larvae) 2 24
Cheumatopsyche (larvae) 2 136 76
Unidentifiable hydropsychidae (larvae) 2 32
Phryganeidae
Ptilostomis spp. 2 8 8 2
Polycentropodidae
Polycentropus sp. 1
Diptera (true flies)
Athericidae
Atherix 8
Chironomidae
Unidentified chironomidae 8 16 24 18
Simuliidae
Simulium tuberosum 70 64 8
Simulium vittatum (larvae) 2 32 20 2
Tipulidae (undetermined larvae)
Tipula (larva) 4 12 1
Hemiptera (true bugs)
Belostomatidae

2002 Bluff Creek Invertebrate Data collected October 2 through 4, 2002.
Station: B-1 B-2 B-3 B-4 B-5
Taxa
No.
Specimens
No.
Specimens
No. of
Specimens
No. of
specimens
No. of
specimens
Belostoma (adults) 10 40 128 8
Corixidae
Trichocorixa (adults) 12
Gerridae
Aquarius (adults) 8 2 1
Pleidae
Neoplea (larvae) 8
Odonata
Aeshnidae
Anax spp. 2 4
Coenagrionidae
Probably Ishnura (small) 4 8
DIPLOPODA (MILLIPEDS) 16
CRUSTACEA
Malacostraca (crayfish)
Amphipoda
Gammaridae
Gammarus 260 56 1696 1568
Talitridae
Hyalella azteca 120 16 6
Isopoda
Asellus 4 8 4 18
Collembola
ANNELIDA
Hirudinea
Erpobella punctata 4 8 6
Glossophonia complanata 8 8
Oligochaeta 16 12
Earthworms 2 2 2
MOLLUSCA
Gastropoda
Lymnaeidae 4
Physidae
Physa 14 16 16 24
Planorbidae
Helisoma spp. 48
Valvatidae
Unidentified slug 2
Pelecypoda
Sphaeriidae
Pisidium 12 8 48 50
Sphaerium 12 8 48 50
Total Specimens 838 1,532 2,152 2,157 211

2003 Bluff Creek Invertebrate Data collected October 6 through 7, 2003.
Station: B-1 B-2 B-3 B-4 B-5
Taxa
No.
Specimens
No.
Specimens
No. of
Specimens
No. of
specimens
No. of
specimens
INSECTA
Ephemeroptera (mayflies)
Baetidae
Baetis brunneicolor (larvae) 1,088
Baetis flavistriga (nymphs) 16
Coleoptera (beetles) unidentified larvae
Dryopidae
Postelichus (adults) 16
Dytiscidae
Agabetes 2
Elmidae
Optioservus (adults) 4
Optioservus (larvae) 2
Trichoptera (caddisflies)
Hydropsychidae
Hydropsyche betteni (larvae) 12
Ceratopsyche slossonae (larvae) 36
Unidentifiable hydropsychidae (larvae) 8
Phryganeidae
Ptilostomis spp. 6
Limnophilidae
Hesperophylax 2
Diptera (true flies)
Chironomidae
Chironomidae (larvae) 76
Simuliidae
Simulium tuberosum 16
Tipulidae (undetermined larvae)
Antocha 2
Tipula (larva) 12
Higher Diptera (larvae) 2
Hemiptera (true bugs)
Belostomatidae
Belostoma (adults) 10
Gerridae
Aquarius (adults) 4
Pseudoleon
Plecoptera
Undetermined (probably Capniidae) 48
DIPLOPODA (MILLIPEDS) 2
CRUSTACEA
Malacostraca (crayfish)
Amphipoda
Gammaridae
Gammarus 688

2003 Bluff Creek Invertebrate Data collected October 6 through 7, 2003.
Station: B-1 B-2 B-3 B-4 B-5
Taxa
No.
Specimens
No.
Specimens
No. of
Specimens
No. of
specimens
No. of
specimens
ANNELIDA
Oligochaeta 2
MOLLUSCA
Gastropoda
Physidae
Physa 112
Unidentified slug
Limax 2
Total Specimens 1,064 0 0 0

2004 Bluff Creek Invertebrate Data collected October 7 through 8, 2004.
Station: B-1 B-2 B-3 B-4 B-5
Taxa
No.
Specimens
No.
Specimens
No. of
Specimens
No. of
specimens
No. of
specimens
INSECTA
Ephemeroptera (mayflies)
Baetidae
Baetis brunneicolor (larvae) 676 372 104 24
Baetis flavistriga (nymphs)
Baetis vagans (nymphs)
Baetis intercalaris
Baetis fondalis
Centroptilium
Callibaetis spp.
Baetis propinquus group
Pseudocloeon spp.
Unidentifiable Baetis 8
Caenidae
Caenis (larvae)
Gerridae
Gerris (adults)
Aquarius (adults) 2
Ephemerellidae
Ephemerella (nymphs)
Heptageniidae
Stenacron (larvae))
Stenacron (nymphs)
Heptagenia 4 32
Unidentifiable heptageniids
Coleoptera (beetles) unidentified larvae
Gyrinidae
Gyrinus (adults)
Dryopidae
Postelichus (adults) 12 12 16 4
Helichus (adults)
Psephenidae
Ectopria (larva)
Dytiscidae
Agabetes (adults) 4
Coptotomus (adult)
Ilybius (larva)
Laccophilus (larvae) 8
Laccophilus (adult)
Laccornis (adults)
Liodessus (adults)
Neobidessus (adults)
Hydroporus (adults)
Colymbetinae (adults)

2004 Bluff Creek Invertebrate Data collected October 7 through 8, 2004.
Station: B-1 B-2 B-3 B-4 B-5
Taxa
No.
Specimens
No.
Specimens
No. of
Specimens
No. of
specimens
No. of
specimens
Unidentified Dytiscidae (adults,larvae)
Elmidae
Dubiraphia (adults)
Dubiraphia (larvae)
Gonielmis (adults)
Stenelmis (adults) 4
Stenelmis (larvae)
Macronychus (larvae)
Optioservus (adults) 12 8
Optioservus (larvae) 4 104
Optioservus spp.
Unidentified larvae
Halipidae
Peltodytes (adults) 2
Haliplus (adults)
Scirtidae (=Helodidae)
Scirtes
Elodes (larvae)
Hydrophilidae
Crinitis (adult)
Enochrus (adults)
Helocombus (adults)
Staphylinidae (adults)
Tropisternus (adults)
Lampyridae
Unidentified larva
Trichoptera (caddisflies)
Unidentified larvae
Brachycentridae
Brachycentrus occidentalis
Hydropsychidae
Hydropsyche betteni (larvae) 128 8 16
Ceratopsyche alhedra (?) (larvae)
Ceratopsyche bifida group (larvae)
Hydropsyche simulans (?)
Hydropsyche sparna
Hydropsyche morosa
Hydropsyche dicantha
Ceratopsyche riola (larvae)
Hydropsyche slossonae (larvae) 72
Ceratopsyche (larvae)
Cheumatopsyche (larvae) 4 280 42
Unidentifiable hydropsychidae (larvae)
Hydroptilidae
Hydroptila (larva)

2004 Bluff Creek Invertebrate Data collected October 7 through 8, 2004.
Station: B-1 B-2 B-3 B-4 B-5
Taxa
No.
Specimens
No.
Specimens
No. of
Specimens
No. of
specimens
No. of
specimens
Hydroptilidae (pupa)
Leptoceridae
Oecetis spp. 4
Nectopsyche (larvae)
Phryganeidae
Ptilostomis spp. 20 64
Limnophilidae
Hesperophylax 2
Limnephilus
Undermeterined larvae 4
Philopotamidae
Chimarra obscura (larvae)
Polycentropodidae
Polycentropus sp.
Phyryganeidae
Psilostomis
Psychomyiidae
Psychomyia (larvae)
Diptera (true flies)
Athericidae
Atherix
Atheriz (larvae)
Ceratopogonidae
Chaobodidae (phantom midges)
Eucorethra (pupae)
Chironomidae
Orthocladinae
Thienemanniella
Nanocladius
Corynoneura (larvae)
Chironominae
Diamesa spp. 2
Glyptotendipes (larvae)
Polypedilum (larvae)
Rheotanytarsus (larvae)
Tanypodinae
Procladius (larvae)
Tanytarsini
Chironomidae (larvae) ,undetermined 48 120 2 38
Chironomidae (pupa)
Culicidae
Anopheles (larvae)
Anopheles (pupae)
Culex (larvae)

2004 Bluff Creek Invertebrate Data collected October 7 through 8, 2004.
Station: B-1 B-2 B-3 B-4 B-5
Taxa
No.
Specimens
No.
Specimens
No. of
Specimens
No. of
specimens
No. of
specimens
Pupae
Dixidae
Dixa
Psychodidae
Empididae
Hemerodromia (larvae)
Unidentifiable empidid (larva)
Simuliidae
Simulium tuberosum 36 6
Simulium vittatum (larvae) 24 56 16
Simulium vittatum (pupae)
Simulium corbis (larvae)
Simulium jenningsi (larvae)
Simulium (pupae) 2
Stratiomyidae
Odontomyia
Unidentifiable stratiomyid (larvae)
Tabanidae
Chrysops (larvae)
Tipulidae (undetermined larvae)
Antocha
Dicranota spp.
Helius (larva)
Limnophila (larva)
Limonia
Tipula (larva) 40 16 2
Higher Diptera (larvae)
Higher Diptera (pupae)
Hemiptera (true bugs)
Belostomatidae
Belostoma (adults) 24 2
Corixidae
Hesperocorixa (larvae)
Sigara (larvae) 16 12
Sigara (adults)
Probably Corisella
Trichocorixa (adults)
Unidentified immatures
Gerridae
Limnoporus (adults)
Aquarius (adults) 4
Trepobates (adults)
Gerris (adults)
Mesoveliidae
Mesovelia (adults)

2004 Bluff Creek Invertebrate Data collected October 7 through 8, 2004.
Station: B-1 B-2 B-3 B-4 B-5
Taxa
No.
Specimens
No.
Specimens
No. of
Specimens
No. of
specimens
No. of
specimens
Notonectidae
Notoecta (adults)
Nepidae
Ranatra (adults)
Ranatra (larvae)
Pleidae
Paraplea (adults)
Neoplea
Veliidae
Rhagovelia (adults)
Megaloptera
Corydalidae
Chauliodes spp.
Sialidae
Sialis (larva)
Odonata
Aeshnidae
Anax spp.
Aeshna spp.
Corduliidae
Neurocordulia
Calopterygidae
Calopteryx (larvae)
Coenagrionidae
Argia
Enallagma (larvae)
Ishnura
Probably Ishnura (small)
Unidentified
Pseudoleon
Plecoptera
Filipalpia spp.
Undetermined (probably Capniidae) 24 8
Lepidoptera 4
Pyralidae
Acentria spp.
ARACHNIDA
Spiders
Subclass Acari
Limnesia
Unionicola
DIPLOPODA (MILLIPEDS) 2 12
CRUSTACEA
Malacostraca (crayfish)
Amphipoda

2004 Bluff Creek Invertebrate Data collected October 7 through 8, 2004.
Station: B-1 B-2 B-3 B-4 B-5
Taxa
No.
Specimens
No.
Specimens
No. of
Specimens
No. of
specimens
No. of
specimens
Cambarus diogenes
Gammaridae
Gammarus 572 92 400 92
Talitridae
Hyalella 40 120 22
Cladocera
Copepoda
Decapoda
Astacidae
Orconectes (crayfish)
Isopoda
Terrestrial Porcellio or Cylisticus
Lirceus
Asellidae
undertermined terrestrial isopod
Asellus 24 16 14
Collembola
Entomobryidae
Undetermined entomobryiid springtail
ANNELIDA
Hirudinea
Erpobella punctata 4 8 2
Glossophonia complanata
Nephalopsis
Helobdella stagnalis
Oligochaeta 16 4 8 8
Undermeterined oligochaetes
Earthworms
HYDROIDEA
Hydridae
Hydra
MOLLUSCA
Gastropoda
Ancylidae
Ferrisia
Hydrobiidae
Amnicola
Lymnaeidae 2
Fossaria
Stagnicola
Physidae
Aplexa
Physa 28 76 40 12
Planorbidae
Gyraulus

2004 Bluff Creek Invertebrate Data collected October 7 through 8, 2004.
Station: B-1 B-2 B-3 B-4 B-5
Taxa
No.
Specimens
No.
Specimens
No. of
Specimens
No. of
specimens
No. of
specimens
Lymnaea
Helisoma spp.
Helisoma anthrosa
Helisoma trivolvis
Promenetus
Planorbula 8
Valvatidae
Valvata sp.
Valvata sincera
Valvata tricarinata
Unidentified slug
Limax 2
Succinea (terrestrial)
Pelecypoda
Sphaeriidae
Pisidium 72 28
Sphaerium
Total Specimens 1,474 1,480 978 350

2005 Bluff Creek Invertebrate Data collected October 10 through 11, 2005.
Station: B-1 B-2 B-3 B-4 B-5
Taxa
No.
Specimens
No.
Specimens
No. of
Specimens
No. of
specimens
No. of
specimens
INSECTA
Ephemeroptera (mayflies)
Baetidae
Baetis brunneicolor (larvae) 251 266 400 72
Baetis flavistriga (nymphs) 10
Undetermined Baetidae
(broken,small,etc) 34 32
Unidentifiable Baetis 4
Heptageniidae
Heptagenia 2 8
Coleoptera (beetles) unidentified larvae
Dryopidae
Helichus (adults) 24 2 8 10
Elmidae
Dubiraphia (larvae) 2
Optioservus (adults) 3 8
Optioservus (larvae) 8 42
Halipidae
Peltodytes (adults) 2
Trichoptera (caddisflies)
Hydropsychidae
Hydropsyche betteni (larvae) 1 60 8 6
Hydropsyche slossonae (larvae) 2
Cheumatopsyche (larvae) 3 26 4 2
Phryganeidae
Ptilostomis spp. 18 36
Limnophilidae
Hesperophylax 1
Chironomidae
Chironomidae (larvae) ,undetermined 2 12
Simuliidae
Simulium vittatum (larvae) 3 64 164 12
Tipulidae (undetermined larvae)
Tipula (larva) 5 22
Hemiptera (true bugs)
Belostomatidae
Belostoma (adults) 4 8 4
Corixidae
Hesperocorixa (larvae) 1
Sigara (larvae) 6 10
Corisella 2
Trichocorixa (larvae) 2 4 4 24

2005 Bluff Creek Invertebrate Data collected October 10 through 11, 2005.
Station: B-1 B-2 B-3 B-4 B-5
Taxa
No.
Specimens
No.
Specimens
No. of
Specimens
No. of
specimens
No. of
specimens
Gerridae
Aquarius (adults) 1
Pleidae
Neoplea 2
Odonata
Aeshnidae
Anax spp. 1
Coenagrionidae
Ishnura 1 4
DIPLOPODA (MILLIPEDS) 1
CRUSTACEA
Malacostraca (crayfish)
Amphipoda
Gammaridae
Gammarus 190 132 76 86
Talitridae
Hyalella 7 44 148 34
Isopoda
Asellidae
Asellus 1 6 26
ANNELIDA
Hirudinea
Erpobella punctata 6 8 4
Oligochaeta (undetermined) 2 4 24 4
MOLLUSCA
Gastropoda (terrestrial snail) 4 12
Physidae
Aplexa 2
Physa 8 56 4
Planorbidae
Gyraulus 2
Unidentified slug 4
Terrestrial snail
Pelecypoda
Sphaeriidae
Pisidium 1 28 16
Total Specimens 518 782 1012 345