biological and physical-chemical methods for treatment of
TRANSCRIPT

BIOLOGICAL AND PHYSICAL-CHEMICAL METHODS FOR TREATMENT OF
SEMICONDUCTOR MANUFACTURING EFFLUENTS
By
Victor Manuel Gamez Grijalva
Copyright © Victor Manuel Gamez Grijalva 2009
A Dissertation Submitted to the Faculty of the
DEPARTMENT OF CHEMICAL AND ENVIRONMENTAL ENGINEERING
In Partial Fulfillment of the Requirements
For the Degree of
DOCTOR OF PHILOSOPHY
WITH A MAJOR IN ENVIRONMENTAL ENGINEERING
In the Graduate College
THE UNIVERSITY OF ARIZONA
2009

UMI Number: 3356417
Copyright 2009 by Gamez Grijalva, Victor Manuel
All rights reserved
INFORMATION TO USERS
The quality of this reproduction is dependent upon the quality of the copy
submitted. Broken or indistinct print, colored or poor quality illustrations and
photographs, print bleed-through, substandard margins, and improper
alignment can adversely affect reproduction.
In the unlikely event that the author did not send a complete manuscript
and there are missing pages, these will be noted. Also, if unauthorized
copyright material had to be removed, a note will indicate the deletion.
______________________________________________________________
UMI Microform 3356417Copyright 2009 by ProQuest LLC
All rights reserved. This microform edition is protected against unauthorized copying under Title 17, United States Code.
_______________________________________________________________
ProQuest LLC 789 East Eisenhower Parkway
P.O. Box 1346 Ann Arbor, MI 48106-1346
2
THE UNIVERSITY OF ARIZONA
GRADUATE COLLEGE
As members of the Dissertation Committee, we certify that we have read the dissertation prepared by Victor Manuel Gamez Grijalva entitled Biological and Physical-Chemical Methods for Treatment of Semiconductor Manufacturing Effluents and recommend that it be accepted as fulfilling the dissertation requirement for the Degree of Doctor of Philosophy. Date: 04/20/09
Reyes Sierra-Alvarez Date: 04/20/09
James A. Field Date: 04/20/09
James A. Farrell Date: 04/20/09
Farhang Shadman Final approval and acceptance of this dissertation is contingent upon the candidate’s submission of the final copies of the dissertation to the Graduate College. I hereby certify that I have read this dissertation prepared under my direction and recommend that it be accepted as fulfilling the dissertation requirement. Date: 04/20/09 Dissertation Director: Reyes Sierra-Alvarez
3
STATEMENT BY AUTHOR
This dissertation has been submitted in partial fulfillment of requirements for an advanced degree at the University of Arizona and is deposited in the University Library to be made available to borrowers under rules of the Library. Brief quotations from this dissertation are allowable without special permission, provided that accurate acknowledgment of source is made. Requests for permission for extended quotation from or reproduction of this manuscript in whole or in part may be granted by the copyright holder.
SIGNED: Victor Manuel Gamez Grijalva

4
ACKNOWLEDGEMENTS
To my advisors Dr. Reyes Sierra and Dr. Jim Field, for all their guidance, support,
patience, and above all, for their invaluable friendship.
To Dr. Farhang Shadman and Dr. James Farrell for being part of my dissertation’s
committee.
To Dr. Chris L. Ober, and his research group at Cornell University, for their guidance and
the material provided for the development of this study.
To the Semiconductor Research Corporation/Sematech Engineering Research Center for
Environmentally Benign Semiconductor Manufacturing for their funding and support in
the development of this research.
To the Consejo Nacional de Ciencia y Tecnologia (CONACYT) for their scholarship
which helped to the development of this study.
And very special thanks to all my friends here in Tucson: Irail, David, Antonia, Brenda,
Glendy, Luis, and Marco; all of you have a very special place in my heart. You were my
Tucson family, thank you for all the good moments we had together.

5
DEDICATION
To my wife Monserrat, thank you for your friendship and love, your love was the fuel
that kept me going. This couldn’t have been done without you by my side.
To my family, parents and sister, being away from you was hard, but your continuous
support helped me during all the good and bad times, I always had you in my heart.
I love you all.

6
TABLE OF CONTENTS
LIST OF FIGURES ...........................................................................................................13
LIST OF TABLES .............................................................................................................18
ABSTRACT .......................................................................................................................21
1. INTRODUCTION .........................................................................................................23
1.1. Environmental Impact of the Semiconductor Industry ............................................23 1.2. Copper Chemical Mechanical Planarization (Cu-CMP) ..........................................24
1.2.1. Physico-Chemical Treatment of CMP Effluents .............................................26 1.2.1.1. Chemical Coagulation – Flocculation .......................................................26 1.2.1.2. Chemical Precipitation ..............................................................................27 1.2.1.3. Precipitation with Hydroxides ..................................................................28 1.2.1.4. Precipitation with Sulfides ........................................................................29 1.2.1.5. Ion Exchange ............................................................................................30
1.2.2. Biological Approaches .....................................................................................31 1.2.2.1. Biosorption ................................................................................................33 1.2.2.2. Metal Reduction ........................................................................................34 1.2.2.3. Precipitation with Biosulfides ...................................................................35
1.2.2.3.1.Sulfate Reducing Bacteria ...................................................................36 1.2.2.3.2.Biochemistry of Sulfate Reduction .....................................................37 1.2.2.3.3.Types of Electron Donors ...................................................................38 1.2.2.3.4.Sulfide Precipitation and Selectivity ...................................................39
1.3. Photolitography and Perfluoroalkylsulfonate Surfactants (PFAS) ..........................39 1.3.1. Physico-Chemical Treatment of PFOS and other Fluorinated Chemicals. ......42 1.3.2. Biological Treatment of PFOS and other Fluorinated Chemicals ...................43
1.4. Objectives and Research Approach .........................................................................49 1.4.1. Simultaneous Removal of Copper and Organics from Semiconductor Simulated Wastewater. ..............................................................................................49 1.4.2. Simultaneous Removal and Recovery of Heavy Metals by Means of a Coupled Crystallization Reactor – Sulfate Reducing Bioreactor system. .................51 1.4.3. Anaerobic Biodegradation of Citrate under Methanogenic and Sulfate Reducing Conditions. .................................................................................................51 1.4.4. Toxicity of Chelating Agents in CMP Effluents to Microorganisms Found in Wastewater Treatment Plants. ...............................................................................52
7
TABLE OF CONTENTS - Continued
1.4.5. Environmental Compatibility and Treatability of New PFOS/PFAS-free PAGs ..........................................................................................................................53
1.4.5.1. Evaluation of the Toxicity of Newly-Developed PAGs to Microorganisms and Eukaryote Cells. ...................................................................53 1.4.5.2. Biodegradability of Newly-Developed PAGs under Conditions Found in Wastewater Treatments Plants. ..........................................................................54 1.4.5.3. Evaluation of Potential Environmental Impact of New PAGs utilizing Software Modeling.................................................................................................55 1.4.5.4. Physicochemical Methods for Treatment of Newly Developed PAGs. ...56
2. RECOVERY OF COPPER FROM WASTEWATER BY MEANS OF A SULFATE REDUCING BIOREACTOR AND A CRYSTALLIZATION REACTOR .........................................................................................................................58
2.1. Abstract ....................................................................................................................58 2.2. Introduction ..............................................................................................................59 2.3. Materials and Methods .............................................................................................61
2.3.1. Microorganisms ...............................................................................................61 2.3.2. Reactors ............................................................................................................61 2.3.3. Reactor Influent ...............................................................................................65 2.3.4. Activity Assays ................................................................................................66
2.3.4.1. Methanogenic Activity Assay ...................................................................67 2.3.4.2. Sulfidogenic Activity Assay .....................................................................68
2.3.5. Analytical Methods ..........................................................................................69 2.3.6. Sand Characterization ......................................................................................71 2.3.7. Chemicals .........................................................................................................72
2.4. Results ......................................................................................................................72 2.4.1. Reactor Performance ........................................................................................73
2.4.1.1. Period I ......................................................................................................73 2.4.1.2. Period II ....................................................................................................74 2.4.1.3. Period III ...................................................................................................76 2.4.1.4. Period IV ...................................................................................................77 2.4.1.5. Period V ....................................................................................................78 2.4.1.6. Period VI ...................................................................................................79
2.4.2. Sulfidogenic and Methanogenic Activity Assays ............................................81 2.4.3. Sand Characterization ......................................................................................81
2.5. Discussion ................................................................................................................99

8
TABLE OF CONTENTS - Continued
2.5.1. Organic Removal ...........................................................................................100 2.5.2. Copper Toxicity .............................................................................................104 2.5.3. Sulfide Toxicity .............................................................................................105 2.5.4. Copper Removal ............................................................................................107 2.5.5. Copper Crystallization on Sand Granules ......................................................109
3. SIMULTANEOUS REMOVAL AND RECOVERY OF HEAVY METALS FROM WASTEWATER BY MEANS OF A SULFATE REDUCING BIOREACTOR AND A CRYSTALLIZATION REACTOR .........................................112
3.1. Abstract ..................................................................................................................112 3.2. Introduction ............................................................................................................113 3.3. Materials and Methods ...........................................................................................116
3.3.1. Microorganisms .............................................................................................116 3.3.2. Reactor ...........................................................................................................116 3.3.3. Reactor Influent .............................................................................................119 3.3.4. Analytical Methods ........................................................................................120 3.3.5. Sand Characterization ....................................................................................122 3.3.6. Chemicals .......................................................................................................123 3.3.7. Calculations....................................................................................................123
3.4. Results ....................................................................................................................125 3.4.1. Reactor Performance ......................................................................................126
3.4.1.1. Period I and Period III .............................................................................126 3.4.1.2. Period II ..................................................................................................127
3.4.2. Sand Characterization ....................................................................................129 3.5. Discussion ..............................................................................................................141
3.5.1. Reactor Performance ......................................................................................141 3.5.2. Soluble Metal .................................................................................................143 3.5.3. Total Metal Removal .....................................................................................145
3.5.3.1. Homogeneous Nucleation .......................................................................146 3.5.3.2. Heterogeneous Precipitation ...................................................................148
4. ANAEROBIC DEGRADATION OF CITRATE UNDER SULFATE REDUCING AND METHANOGENIC CONDITIONS .................................................151
4.1. Abstract ..................................................................................................................151 4.2. Introduction ............................................................................................................152 4.3. Materials and Methods ...........................................................................................154

9
TABLE OF CONTENTS - Continued
4.3.1. Microorganisms .............................................................................................154 4.3.2. Basal Media ...................................................................................................154 4.3.3. Biodegradation Batch Bioassays....................................................................155 4.3.4. Acetogenic Assays .........................................................................................156 4.3.5. Carbon Distribution Experiments ..................................................................157 4.3.6. Analytical Methods ........................................................................................158 4.3.7. Chemicals .......................................................................................................160
4.4. Results ....................................................................................................................160 4.4.1. Methanogenic and Sulfate-Reducing Activities of the Anaerobic Consortia 160 4.4.2. Citrate Degradation in the Presence of Sulfate ..............................................160 4.4.3. Citrate Degradation in the Absence of Sulfate ..............................................162 4.4.4. Carbon Distribution Experiments ..................................................................163 4.4.5. Rates of Citrate and Metabolite Degradation and Formation ........................164
4.5. Discussion ..............................................................................................................173 4.5.1. Citrate Degradation Pathway .........................................................................173 4.5.2. Acetogenesis ..................................................................................................176 4.5.3. Sulfate Reduction ...........................................................................................176 4.5.4. Methanogenesis..............................................................................................178
5. TOXICITY OF EDTA ON METHANOGENIC AND SULFATE REDUCING SLUDGE: EFFECT AND MECHANISMS ....................................................................180
5.1. Abstract ..................................................................................................................180 5.2. Introduction ............................................................................................................181 5.3. Material and Methods ............................................................................................183
5.3.1. Microorganims ...............................................................................................183 5.3.2. Continuous Experiment .................................................................................183 5.3.3. Batch Experiments .........................................................................................185
5.3.3.1. Methanogenic Batch Toxicity Assays ....................................................185 5.3.3.2. Sulfidogenic Batch Toxicity Assays .......................................................186
5.3.4. Analytical Methods ........................................................................................187 5.3.5. Chemicals .......................................................................................................188
5.4. Results ....................................................................................................................189 5.4.1. Impact of EDTA in the Operation of a Continuous Flow Sulfidogenic Bioreactor .................................................................................................................189
10
TABLE OF CONTENTS - Continued
5.4.2. Inhibition of Methanogens and Sulfate Reducing Bacteria by EDTA in Shaken Batch Bioassays ..........................................................................................193
5.4.2.1. EDTA and Sulfate-Reducing Bacteria ....................................................193 5.4.2.2. Methanogenic Inhibition by EDTA ........................................................195
5.5. Discussion ..............................................................................................................198 5.5.1. Effect of EDTA on Sulfate Reducing Bacteria ..............................................198 5.5.2. Granular Methanogenic Sludge and EDTA Toxicity ....................................203
6. ENVIRONMENTAL EVALUATION OF PFOS-FREE PAGS: TOXICITY, BIODEGRADABILITY AND PHYSICO-CHEMICAL TREATMENT. ......................206
6.1. Abstract ..................................................................................................................206 6.2. Introduction ............................................................................................................207 6.3. Materials and Methods ...........................................................................................213
6.3.1. Microorganisms .............................................................................................213 6.3.2. Toxicity Assays ..............................................................................................213
6.3.2.1. Methanogenic Toxicity ...........................................................................214 6.3.2.2. Mitochondrial Toxicity Test ...................................................................215 6.3.2.3. Microtox Assay .......................................................................................216
6.3.3. Biodegradation Assays...................................................................................218 6.3.4. Physico-Chemical Treatment .........................................................................219
6.3.4.1. Activated Carbon Adsorption .................................................................219 6.3.4.2. Fenton’s Oxidation..................................................................................221 6.3.4.3. Reduction with Zero Valent Iron ............................................................221
6.3.5. Analytical Techniques ...................................................................................222 6.3.5.1. Gas Chromatography ..............................................................................222 6.3.5.2. Suppressed Conductivity Ion Chromatography (IC) ..............................223 6.3.5.3. HPLC-DAD ............................................................................................224 6.3.5.4. Fluoride Analysis ....................................................................................224 6.3.5.5. Mass Spectrometry ..................................................................................224 6.3.5.6. Volatile Suspended Solids ......................................................................225
6.3.6. Chemicals .......................................................................................................225 6.4. Results ....................................................................................................................226
6.4.1. Toxicity Assays ..............................................................................................226 6.4.1.1. MTT Test ................................................................................................226 6.4.1.2. Microtox® Test .......................................................................................228 6.4.1.3. Methanogenic Toxicity Test ...................................................................229
11
TABLE OF CONTENTS - Continued
6.4.2. Biodegradability .............................................................................................231 6.4.3. Physical and Chemical Treatment .................................................................244
6.4.3.1. Adsorption to Granular Activated Carbon ..............................................244 6.4.3.2. Chemical Reduction with ZVI ................................................................248 6.4.3.3. Chemical Reaction with Fenton’s Reagents ...........................................253
6.5. Discussion ..............................................................................................................260 6.5.1. Toxicity Tests.................................................................................................260 6.5.2. Biodegradation Tests .....................................................................................265 6.5.3. Physico-Chemical Treatment .........................................................................271
6.5.3.1. Adsorption to Granular Activated Carbon ..............................................271 6.5.3.2. Reduction with Zero Valent Iron ............................................................272 6.5.3.3. Advanced Oxidation with Fenton’s Reagent ..........................................273
7. ENVIRONMENTAL PROPERTIES OF NON‐PERFLUORINATED SURFACTANTS: EPA PBT PROFILER AS MODEL FOR ANALYSIS ....................276
7.1. Abstract ..................................................................................................................276 7.2. Introduction ............................................................................................................277 7.3. Materials and Methods ...........................................................................................279
7.3.1. PAG Compounds ...........................................................................................279 7.3.2. Modeling Software.........................................................................................279 7.3.3. PBT Profiler ...................................................................................................280
7.3.3.1. Environmental Persistence ......................................................................284 7.3.3.2. Bioconcentration .....................................................................................286 7.3.3.3. Chronic Toxicity .....................................................................................286
7.3.4. EPI Suite ........................................................................................................287 7.3.5. Experimental Methods ...................................................................................288
7.3.5.1. Determination of Kow. ...........................................................................289 7.4. Results and Discussion ..........................................................................................290
7.4.1. Physical Properties .........................................................................................290 7.4.2. Octanol-Water Partition Coefficient, Water Solubility and Soil Adsorption Coefficient................................................................................................................293
7.4.2.1. Octanol-Water Partition Coefficient .......................................................293 7.4.2.2. Water Solubility ......................................................................................296 7.4.2.3. Soil Adsorption Coefficient (Koc) ..........................................................298
7.4.3. Persistence......................................................................................................300 7.4.4. Bioaccumulation ............................................................................................305

12
TABLE OF CONTENTS - Continued
7.4.5. Toxicity ..........................................................................................................307 7.4.6. Fate of a Chemical in Sewage Treatment Plants ...........................................311 7.4.7. Overall Performance of the Modeling Software ............................................314
8. CONCLUSIONS .........................................................................................................315
8.1. Concerning Removal of Copper and Organics from Semiconductor Effluents ....315 8.2. Concerning the Study of Degradability and Toxicity of Compounds Found in CMP Wastewaters (Citric Acid and EDTA) ....................................................................317 8.3. Concerning the Evaluation of the Environmental Impact of Newly-Developed PAGs ................................................................................................................................318
REFERENCES ................................................................................................................322
13
LIST OF FIGURES
Figure 1.1. Schematic representation of bioreactor (BR) and seeded crystallization reactor (SCR) system. ..................................................................................................50
Figure 2.1. Sulfide concentration in the bioreactor effluent (in ppm) during the different periods of operation. ......................................................................................83
Figure 2.2. Reactor performance during the different periods. Sulfate concentration (in ppm) for influent, and effluent. ..............................................................................84
Figure 2.3. Acetate concentration (in ppm) detected in the bioreactor effluent during the various periods of operation. ..................................................................................85
Figure 2.4. Reactor performance during the different periods. Methane production. .......86
Figure 2.5. pH values in the bioreactor effluent during the various experimental periods. .........................................................................................................................87
Figure 2.6. Reactor performance during the different periods. COD concentration (in ppm) of citrate in the influent, sulfide in the effluent of the bioreactor, methane out, and acetate in the effluent of the bioreactor. .........................................................88
Figure 2.7. Reactor performance during the different periods. Conversion of the influent COD to: sulfide, residual acetate, and methane. ............................................89
Figure 2.8. System performance for the different periods. Total copper concentration influent, soluble copper concentration effluent. ..........................................................91
Figure 2.9. System performance for the different periods. Soluble copper concentrations in effluent crystallization reactor/influent bioreactor, effluent bioreactor. ....................................................................................................................92
Figure 2.10. System performance for the different periods. Total copper concentrations in effluent crystallization reactor/influent bioreactor, effluent bioreactor. ....................................................................................................................93
Figure 2.11. Sand retention capacity. Period II (927 ppm Sulfide, HRT 0.34 and 0.75 days), Period IV (789 ppm Sulfide, HRT 0.33 days), Period VI (231 ppm sulfide, HRT 0.34 days). ...........................................................................................................94
Figure 2.12. SEM images and EDS analyses of (A) sand before treatment, (B) sand after treatment with copper in period II. ......................................................................96
Figure 2.13. XRD analysis for the coated sand.. ...............................................................97

14
LIST OF FIGURES-Continued
Figure 2.14. SEM images from sand granules before, after 1 day, after 2 days, after 1 week, after 2 weeks of treatment in period VI. ............................................................98
Figure 3.1. Sulfide concentration in the BR effluent during the different periods of operation. ...................................................................................................................131
Figure 3.2. Reactor performance during the different periods. Methane production. .....131
Figure 3.3. Reactor performance during the different periods. Conversion of the influent COD to: sulfide, methane, and acetate. ........................................................132
Figure 3.4. pH values in the BR effluent during the various experimental periods. .......132
Figure 3.5. Concentration of Cu and Ni as a function of time for period II. Influent: Total Cu, total Ni. ......................................................................................................134
Figure 3.6. Concentration of soluble copper as a function of time for period II. Midpoint, Effluent......................................................................................................135
Figure 3.7. Concentration of total copper as a function of time for period II. Influent, Midpoint, Effluent......................................................................................................135
Figure 3.8. Concentration of soluble nickel as a function of time for period II. Midpoint, Effluent......................................................................................................136
Figure 3.9. Concentration of total nickel as a function of time for period II. Influent, Midpoint, Effluent......................................................................................................136
Figure 3.10. SEM images from sand granules before, after 1 day, and at the end of treatment in period II. ................................................................................................138
Figure 3.11. EDS analyses of sand before treatment, sand after one day of treatment; sand after treatment with copper and nickel in period II. ..........................................139
Figure 3.12. XRD analysis for the coated sand. ..............................................................140
Figure 4.1. Time course for the degradation of citrate by methanogenic sludge in assays supplied with sulfate, in the presence of BES and absence of BES ...............168
Figure 4.2 Time course for the degradation of citrate by sulfate reducing sludge in assays supplied with sulfate, in the presence of BES, and absence of BES.. ............169
Figure 4.3. Time course for the degradation of citrate by methanogenic sludge in assays lacking sulfate, in the presence of BES and absence of BES ........................170
15
LIST OF FIGURES-Continued
Figure 4.4. Time course for the degradation of citrate by sulfate reducing sludge in assays lacking sulfate, in the presence of BES, and absence of BES.. ......................171
Figure 4.5. Time course for carbon distribution. Sulfate reducer sludge. Methanogenic sludge.. ...............................................................................................172
Figure 4.6. Overview of the main pathways of citrate degradation occurring in SRS and MS.. .....................................................................................................................175
Figure 5.1 Chemical structure of ethylenediaminetetraacetic acid (EDTA). ...................181
Figure 5.2. Time course of continuous experiment on the effect of EDTA on sulfate-reducing bacteria. .......................................................................................................191
Figure 5.3. EDTA inhibition towards sulfate reducing bacteria in shaken batch bioassays. ...................................................................................................................191
Figure 5.4. Total copper concentrations in the system: influent, crystallization reactor effluent, bioreactor effluent. ..........................................................................192
Figure 5.5. Soluble copper concentrations in the system: influent, crystallization reactor effluent, bioreactor effluent. ..........................................................................192
Figure 5.6. Sulfide concentration vs. time for a batch experiment with an EDTA concentration of 2 mM and different Ca2+ concentrations: 0 mM, 0.2 mM, 2 mM, 4 mM, control treatment lacking EDTA. ...................................................................194
Figure 5.7. Effect of Ca2+ addition on the inhibitory effect of 2 mM EDTA towards sulfate reducing bacteria in anaerobic granular sludge. Relative sulfate reducing activity vs. Ca concentration determined in shaken batch bioassays. ........................194
Figure 5.8. Inhibition of hydrogen consuming methanogens activity in granular sludge by EDTA in the presence and absence of calcium (II). ..................................197
Figure 5.9. Inhibition of hydrogen consuming methanogens activity in granular sludge by calcium(II).. ...............................................................................................197
Figure 6.1. PAGs that will be studied in this project.. .....................................................211
Figure 6.2. PAG counterions tested in this study. ............................................................212
Figure 6.3. Activity vs concentration for PAGs and counterions observed in the MTT assay. ..........................................................................................................................228
Figure 6.4. Time course for Lactone PAG degradation under aerobic conditions. .........237
16
LIST OF FIGURES-Continued
Figure 6.5. Time course for oxygen consumption determined in batch aerobic biodegradation assays with the Lactone PAG. . ........................................................237
Figure 6.6 Time course for fluoride released (as percentage of total fluoride) determined in batch aerobic biodegradation assays with Lactone PAG. ..................238
Figure 6.7. Time course for Lactone PAG degradation under anaerobic conditions. .....238
Figure 6.8. Time course for Sweet PAG degradation under aerobic conditions. ............239
Figure 6.9. Time course for oxygen consumption in batch aerobic biodegradation assays with the Sweet PAG. ......................................................................................239
Figure 6.10. Time course for fluoride released (as percentage of total fluoride) determined in batch aerobic biodegradation assays with the Sweet PAG. ...............240
Figure 6.11. Ion chromatogram obtained for abiotic control in Lactone PAG aerobic degradation assay (day 98).........................................................................................240
Figure 6.12. Ion chromatogram obtained for autoclaved control in Lactone PAG aerobic degradation assay (day 98). ...........................................................................241
Figure 6.13. Ion chromatogram obtained for aerobic treatment in Lactone PAG degradation assay (day 98).........................................................................................241
Figure 6.14. Ion chromatogram obtained for freshly prepared Sweet PAG standard. .....242
Figure 6.15. Ion chromatogram obtained for abiotic and autoclaved controls in Sweet PAG aerobic degradation assay (day 77). .......................................................242
Figure 6.16. Ion chromatogram obtained for aerobic treatment in Sweet PAG aerobic degradation assay (day 77).........................................................................................243
Figure 6.17. SF1 adsorption isotherm onto GAC.. ..........................................................245
Figure 6.18. SF2 adsorption isotherm onto GAC.. ..........................................................246
Figure 6.19. PF1 adsorption isotherm onto GAC.. ..........................................................246
Figure 6.20. Lactone PAG adsorption isotherm onto GAC. ............................................247
Figure 6.21. Sweet PAG adsorption isotherm onto GAC. ...............................................247
Figure 6.22. Peak shifting at three different times for SF2 PAG treatment with ZVI. Chromatogram obtained at 265 nm. . .........................................................................250
17
LIST OF FIGURES-Continued
Figure 6.23. Time line for the conversion of SF2 PAG with ZVI/H2 at 30oC temperature. . .............................................................................................................251
Figure 6.24. Proposed reduction of SF2 PAG with ZVI as indicated by MS/MS results. ........................................................................................................................251
Figure 6.25. MS/MS spectrum for SF2 PAG, m/z = 264.8. ............................................252
Figure 6.26. MS/MS spectrum for reduced SF2 PAG, m/z = 240.1 ................................252
Figure 6.27. Time course of fluoride release following treatment of the various PAG compounds with the Fenton’s reagent. ......................................................................255
Figure 6.28. Time course of PAG removed following treatment of the various PAG compounds with the Fenton’s reagent. Measurements based on IC.. ........................255
Figure 6.29. MS/MS spectrum for SF2 PAG after treatment with Fenton’s Reagent. ....256
Figure 6.30. MS/MS spectrum for PF1 PAG after treatment with Fenton’s Reagent. ....256
Figure 6.31. MS/MS spectrum for Lactone PAG after treatment with Fenton’s Reagent. .....................................................................................................................257
Figure 6.32. MS/MS spectrum for Sweet PAG after treatment with Fenton’s Reagent. .....................................................................................................................257
Figure 6.33. Suggested degradation pathways for PF1 treated with Fenton’s reagent according to results obtained by MS/MS. ..................................................................258
Figure 6.34. Suggested degradation pathways for SF2 treated with Fenton’s reagent according to results obtained by MS/MS. ..................................................................258
Figure 6.35. Suggested degradation pathways for Lactone PAG and Sweet PAG treated with Fenton’s reagent according to results obtained by MS/MS. ..................259
Figure 6.36. Hydrolyzed form of Sweet PAG.. ...............................................................267
Figure 7.1. Comparison between Log Kow values calculated by chromatography vs Log Kow predicted by KOWWIN. ...........................................................................295

18
LIST OF TABLES
Table 1.1. Solubility constants of metals for different ligands. .........................................28
Table 1.2. Performance characteristics of major physico-chemical methods for the removal and recovery of heavy metals. .......................................................................32
Table 1.3. Biological mechanisms for removal of heavy metals. ......................................36
Table 1.4. Some SRB genus and their electron donors. .....................................................38
Table 1.5. Summary of physico-chemical and biological treatments for highly fluorinated sulfonates. ..................................................................................................48
Table 2.1. Periods of experiment and operational conditions. ...........................................65
Table 2.2. Specific methanogenic and sulfidogenic activities of the anaerobic sludge. ....81
Table 2.3. COD balance for the different periods ..............................................................90
Table 2.4. Sulfur balance for the different periods ............................................................90
Table 2.5 Copper balance for the different periods. ..........................................................95
Table 2.6 Mass balance for copper recovered in sand. ......................................................95
Table 3.1. Sulfur balance for the different periods. .........................................................133
Table 3.2. COD balance for the different periods. ...........................................................133
Table 3.3. Copper and nickel average concentrations and removal efficiencies on the system. .......................................................................................................................137
Table 3.4. Mass balance for copper and nickel recovered in sand. .................................137
Table 3.5. Molar balance on metal precipitates ...............................................................137
Table 4.1. Methanogenic and sulfidogenic activities for the different inocula. ..............166
Table 4.2. Carbon distribution for the different conditions at three different times (beginning, middle and end of experiment). ..............................................................166
Table 4.3. Maximum production-consumption rates for citrate, acetate, sulfide and methane under different conditions. ..........................................................................167
Table 4.4. Maximum rates of Production and consumption for the different carbon distribution studies. ....................................................................................................167
Table 5.1. pH values for treatments with Ca2+ an EDTA for toxicity on methanogens. .196
Table 6.1. Sulfonate PAGs and counterions studied ........................................................212
19
LIST OF TABLES-Continued
Table 6.2. Inhibitory concentrations determined for the PAG compounds and two PAG counterions in the MTT test. .............................................................................227
Table 6.3. Inhibitory concentrations determined for the PAG compounds and two PAG counterions in the Microtox® Toxicity Test. ...................................................229
Table 6.4. Inhibitory concentrations determined for the PAG compounds and two PAG counterions in the methanogenic toxicity assays utilizing hydrogen as substrate. ....................................................................................................................230
Table 6.5. Inhibitory concentrations determined for the PAG compounds and two PAG counterions in the methanogenic assays utilizing acetate as substrate. ............231
Table 6.6. Fluoride released in the different experiments expressed as percent of total initial fluorine content of PAG. .................................................................................235
Table 6.7. PAG removed (expressed as a percent of initial concentration) in various biodegradation assays after extended incubation .......................................................236
Table 6.8. COD Balance for Lactone PAG and Sweet PAG aerobic experiment. ..........236
Table 6.9. MS/MS analysis on different treatments for Lactone PAG and Sweet PAG, negative mode. Numbers represent m/z (mass over charge) ratio of fragments observed. ...................................................................................................243
Table 6.10. Experimental Langmuir and Freundlich constants for the adsorption of different PAGs onto granular activated carbon at 30OC and pH 7.2. ........................245
Table 6.11. Final mass balance for PAGs treated with ZVI and H2 at 30oC for 72 hours. ..........................................................................................................................249
Table 6.12. Mass balance for PAGs at the end of treatment with Fenton’s reagent based on IC. ...............................................................................................................254
Table 6.13. MS/MS analysis of Fentons treatment of PAG, negative mode. ..................254
Table 7.1. SMILES notation for the PAGs studied. ........................................................282
Table 7.2. Parameters studied by the PBT Profiler and their estimation methodology. ..285
Table 7.3. EPI Suite programs and their respective parameters estimated. .....................288
Table 7.4. Boiling point, melting point, and vapor pressure for acid form and sodium salt of PAGs as estimated by MPBPWIN. .................................................................292
Table 7.5. Chromatographic retention times obtained for the different PAGs. ...............294
20
LIST OF TABLES-Continued
Table 7.6. Estimation of log Kow for the ionic PAGs .....................................................294
Table 7.7. Water solubility estimations based on two different models and data obtained by direct measurement. ...............................................................................297
Table 7.8. Koc values estimated for the different PAGs by PCKOCWIN program. ......300
Table 7.9. Persistence criteria for EPA’s policy statement on a new PBT category for Premanufacture Notices .............................................................................................301
Table 7.10. The persistence criteria for EPA’s final rule for Toxic Release Inventory reporting, and the PBT Profiler criteria. ....................................................................301
Table 7.11. PBT Profiler persistence estimates for the different PAGs and PAG counterions. ................................................................................................................302
Table 7.12. Overall persistence estimated using the EPA PBT Profiler. .........................303
Table 7.13. Bioaccumulation criteria for EPA’s PBT Profiler. .......................................305
Table 7.14. Bioconcentration factors (BFC) estimated for each PAG and PAG counterion using the PBT Profiler. ............................................................................306
Table 7.15. Chronic toxicity values for fish estimated by EPA’s PBT Profiler. .............309
Table 7.16. Removal percentages in a sewage treatment plant as predicted by STPWIN program. .....................................................................................................313
21
ABSTRACT
Semiconductor manufacturing is one of the most advancing, growing and evolving
industries. The production of semiconductors presents several challenges, both
technologically and environmentally. The amount and complexity of the chemical
substances utilized in the manufacturing process has been growing exponentially, and
new chemicals are often introduced to the process and the environment. Two steps of this
process play a special important role in the introduction of new chemical and demand of
natural resources: Chemical Mechanical Planarization (CMP) and Photolithography.
Wastewaters from the semiconductor manufacturing are complex and have several
chemicals in different concentrations. Heavy metals, acids, chelators, surfactants and
other chemicals are found in semiconductor effluents. Part of the scope of this study is to
evaluate and remediate wastewaters produced in semiconductor manufacturing.
During the development of this project it was found that copper can be
successfully removed and recovered from CMP wastewaters by the use of a sulfate
reducing bioreactor and a crystallization reactor, promoting precipitation of copper
sulfides on the surface of silica sand. High removal and recovery efficiencies were found
as result of the study. Another finding include that citrate is a readily biodegradable
compound which can be successfully utilized as electron donor for anaerobic processes
such as methanogenesis and sulfate reductions. However other important chelator, like
EDTA, can cause toxicity to these microorganisms and affect important biological
processes. PFOS is an important chemical for the semiconductor industry; however, the
22
physical and chemical properties make this compound persistent in the environment and
bioaccumulative. New substitutes for PFOS were tested and evaluated for their
environmental impact. It was found that perfluorination plays an important role in the
chemical properties of PFOS and removal of this characteristic improves the
environmental performance of the new substitutes. Evaluation of these new chemicals
was also performed by simulation and modeling. The software utilized in this study
identified properties like toxicity and octanol-water partition coefficient accurately. On
the other hand biodegradability was poorly estimated and new models are suggested for
evaluation of this property for compounds with characteristics similar to the ones studied
here (specifically high fluorination).
23
1. INTRODUCTION
1.1. Environmental Impact of the Semiconductor Industry
Semiconductor manufacturing is a high-resource demanding industry. The
semiconductor industry has become one of the fastest growing industries, and this high
rate of growth puts an ever higher strain on natural resources. It is with no doubt one of
the most resource demanding industries in terms of energy and water. Millions of cubic
meters of water are used daily by this industry (Stanley and Ogden 2003). Treatment and
recycling of this resource has become essential in terms of both economical and
environmental impact for these fabs.
The advancement and introduction of new technologies in the manufacturing of
Integrated Circuits (IC) brings along the introduction of new chemicals and materials
(Banerjee et al. 2005). New materials must meet complex technological requirements,
and their production should be economically viable in order to introduce such materials
to mass production. However, the evaluation of the environmental impact that these
materials may have usually comes as a second thought or after some issues become
apparent and pose an environmental problem. This presents an increasing need to
establish and determine the environmental impact of the variety of compounds that this
industry releases to the environment.
Semiconductor manufacturing includes a series of highly advanced technological
processes. Two of these processes, i.e., chemical mechanical planarization (CMP) and
photolithography, are the main focus of this dissertation since they are important
24
contributors to the environmental impact of the industry. This project focuses on the
development of methods for the treatment of effluents generated by both processes as
well as on the evaluation of the environmental impact of important chemicals utilized in
the manufacturing processes.
1.2. Copper Chemical Mechanical Planarization (Cu-CMP)
Copper chemical mechanical planarization (Cu-CMP) is one of the most water-
demanding and energy intensive processes in the semiconductor industry. It is estimated
that the water used in this process alone, accounts for 30-40% of the water consumed in
the whole process of semiconductor manufacturing (Golden et al. 2000). The wastewater
produced contains high concentrations of Cu, generally ranging from 5 to 100 mg/L
soluble Cu+2 (Maag et al. 2000). In addition to copper, Cu-CMP effluents also contain
high loads of organic matter (Golden et al. 2000). Common organic compounds found in
Cu-CMP wastewater are complexing agents (EDTA, oxalic acid, citric acid), surfactants
(poly-acrylic acid, alkyl sulfates), corrosion inhibitors (eg. benzotriazole), and others
(Golden et al. 2000). Heavy metals and biodegradable organic contaminants have to be
removed before releasing the wastewater to the environment.
Depending on whether the IC manufacturing facility discharges directly (after on-
site treatment) into a water body (direct discharge) or into the publicly-owned treatment
works (POTW) (indirect discharge), the Cu-contaminated effluents are regulated by
different rules in the USA. State and local limitations on Cu discharge may vary, but

25
typical Cu limits for direct and indirect discharge are on the order of 10 μg/L and 1 mg/L,
respectively (Maag et al. 2000). In order to comply with these regulations existing
effluent treatment facilities at semiconductor manufacturing fabs must be able to handle
heavy metals. As a consequence, manufacturers are increasingly facing the need to install
treatment facilities in order to comply with environmental regulations for Cu discharge.
Organic materials should also be taken into account when designing treatment
systems for CMP wastewaters. Some of these components, like EDTA, citrate and some
surfactants, could effectively affect the chemistry of removal of copper. In the
semiconductor industry citrate and EDTA are used for their chelating and buffering
properties. They are mainly used in the chemical mechanical planarization (CMP) step of
the fabrication, and are important components of the wastewaters generated by this
process (Golden et al. 2000). Citrate is an easily biodegradable compound (Antranikian
and Giffhorn 1987) and can potentially serve to increase the biological oxygen demand
(BOD) of the wastewater, which is a parameter often regulated as well when wastewaters
are directly discharged into water bodies. EDTA, on the other hand, is known to be
recalcitrant and not degraded in typical wastewater treatment plants (Nortemann 1999;
Tucker et al. 1999). However, EDTA also presents other concerns due to its properties:
metal mobilization, and toxicity can occur when EDTA is released into the environment.
Several techniques have been used for the treatment of heavy metals (i.e. Cu) and
organics; the selection of which technique is used depends strongly on the characteristics
of the influent treated and the effluent properties that are wanted to achieve. Taking this
into account and looking at the properties of the wastewater, the use of both physico-
26
chemical (coagulation, settling, clarification, ion exchange etc.) and biological techniques
(biosorption, aerobic and anaerobic treatment, etc) can be applied.
1.2.1. Physico-Chemical Treatment of CMP Effluents
In the semiconductor industry, different physico-chemical methods are considered
for Cu-CMP wastewater treatment, most commonly involving effluent pretreatment by
coagulation and flocculation, followed by micro or ultrafiltration and, subsequent
removal of Cu by cation exchange (Golden et al. 2000; Mendicino and Brown 1998). One
of the main problems concerning physico-chemical treatment of metals is the generation
of large volumes of metal-bearing sludges or brines that may require future disposal in
hazardous waste sites (Golden et al. 2000). A brief explanation of the different techniques
that can be utilized for removal of copper, as well as the effect that organics have on them
will be explained.
1.2.1.1. Chemical Coagulation – Flocculation
Chemical coagulation is the process in which the suspended particles are
destabilized by changing the particles charge, and then the particles are driven to
aggregate with each other forming bigger size particles that are more settable than the
original ones. The next step in this process is flocculation, and then the particles are
removed by means of settling or filtration.

27
The most common coagulants are inorganic and include aluminum sulfate, ferrous
or ferric chloride, etc. Studies have been made with other kind of coagulants such as
polyaluminium chloride (PAC) and polymer with excellent results in the removal of silica
particles and reduction of water turbidity (Charerntanyarak 1999; Lin and Yang 2004).
Heavy metals removal above 90% can be accomplished by this method (Charerntanyarak
1999).
Other trends in coagulation include some mechanisms where particle
destabilization is carried without the addition of coagulant. Electrocoagulation and
electrodecantation are two of these coagulant independent mechanisms, which use
electric fields to agglomerate the charged silica particles. Some studies have been done
for electrocoagulation that show very good results in the removal of suspended particles
and copper ion (99% removal) (Lai and Lin 2003).
1.2.1.2. Chemical Precipitation
Chemical precipitation is one of the most widely used mechanisms to remove
heavy metals (Lanouette 1977; Peters et al. 1984; Veeken and Rulkens 2003). Treatment
methods based on chemical precipitation are currently used in around 90% of the
treatment plants treating industrial wastewaters containing heavy metals (Schiewer and
Volesky 2000). Basically precipitation consists in the addition of one ligand that
complexes the metal and makes it less soluble in water. Several different ligands could be
applied for chemical precipitation, including hydroxide (OH-), carbonate (CO32-),

28
phosphate (PO43-) and sulfide (S2-) (Table 1.1). The selection of the proper ligand should
be made considering the characteristics of the wastewater to be treated and the nature and
concentrations of the metals to be removed.
Table 1.1. Solubility constants of metals for different ligands (Benjamin 2002; Kaksonen 2004).
Metal Solubility Products (Log Ksp) OH- CO3
2- PO43- S2-
Ag+ -7.7 -11.1 -17.6 -49.0 Cd2+ -14.3 -13.7 -32.6 -28.9 Co2+ -15.9 -12.8 Cu+ -19.4 -9.6 -35.1 -36.0 Fe2+ -15.9 -10.6 -36.0 -16.8 Fe3+ -37.1 Hg2+ -25.4 -22.5 -52.0 Ni2+ -17.2 -6.8 -31.3 -18.5 Pb2+ -13.1 -44.5 -28.1 Zn2+ -15.6 -10.3 -36.7 -22.0
1.2.1.3. Precipitation with Hydroxides
Precipitation with hydroxides its one of the most widely used techniques, due to
its low cost and relativity ease of control by controlling pH (Eccles 1999; Peters et al.
1984; Veeken and Rulkens 2003). The technique is based in the fact that several metals
have low solubility at high pH, precipitating as metal hydroxides (Table 1.1).
Different chemicals are used to increase the pH, including: caustic soda (NaOH),
quicklime (CaO), hydrated lime (Ca(OH)2), and ammonium hydroxide (NH4OH)
(Lanouette 1977; Peters et al. 1984). The optimum pH at which each metal precipitates
29
could vary due to many different variables such as value of the solubility constant,
presence of other binding ligands in solution, complexing agents, and even the valence
state of each metal (Kaksonen 2004). The final concentration of heavy metals achieved
with hydroxide precipitation is relativity high (0.5 – 2 mg/L) and has some interference
with chelating agents (Veeken et al. 2003b).
One of the main disadvantages of hydroxide precipitation is that the precipitate is
a gelatinous sludge, which is difficult to dewater (Lanouette 1977). In order to dewater
the produced sludge, additional processes might be needed, such as coagulation-
flocculation, sedimentation or/and filtration (Lanouette 1977). Another important
disadvantage of hydroxide precipitation is its poor selectivity, meaning that if pH is
simply raised several metal hydroxides might precipitate simultaneously (Eccles 1999),
and the sludge formed could not be used for metal recovery (Veeken et al. 2003b). So if
selectivity is one of the objectives, an efficient pH control should be performed.
1.2.1.4. Precipitation with Sulfides
Compared to hydroxide precipitation, precipitation of heavy metals using sulfide
as the ligand has several advantages, being the most important ones: higher removal
efficiencies and less dependence on chelating agents present in the contaminated water
(Hammack et al. 1994; Veeken et al. 2003b). However, sulfide precipitation is not widely
used as a physico-chemical method due to the fact that is a more expensive process
(chemical costs) (Kaksonen 2004; Lanouette 1977), and also that an excess of sulfide in
the effluent could lead to toxicity and corrosion problems (Veeken et al. 2003b).

30
Sulfide precipitation has several advantages over hydroxide precipitation,
including considerably lower solubility products than the corresponding hydroxides
(Table 1.1), less pH sensitivity, less interference by chelating agents than hydroxides
precipitates, better selectivity, and the produced sulfide metals can be treated by existing
metallurgical processes for metal recovery (Kaksonen 2004; Peters et al. 1984; Veeken et
al. 2003b).
The disadvantages of using sulfide for metal precipitation include the toxic effects
of sulfide if present in excess, and the needed for removal of sulfide before releasing
water into the environment that increases costs (Lanouette 1977). Some measures have
been proposed to avoid these disadvantages, including the use of FeS as source of sulfide
(Lanouette 1977; Peters et al. 1984), and the use of sulfide selective electrodes for sulfide
control (Veeken et al. 2003b). However, the commercial application of physico-chemical
methods using sulfide for metal precipitation is limited.
Several studies have been performed using sulfides for precipitation of metals.
Veeken et al. (2003b), using a sulfide-selective electrode to control aqueous sulfide
concentrations by continuous measuring, obtained removal efficiencies of 99.9% for
copper and other metals.
1.2.1.5. Ion Exchange
Ion exchange is a process in which a solution containing ions is passed through a
packed bed containing ion exchange resin beads that absorb the ions in solution and

31
replace them with other ions that are less dangerous. This technique is widely used for the
removal of hardness in water. Different kinds of resins could be used for treatment. The
three most important are: strong acid resins, which exchange virtually all cations from
wastewater; weak acid resins, with higher affinity for hardness than strong acid resins;
and chelating resins, which are specialized in breaking down chelating complexes in
solution and absorbing free metals (Jenkins et al. 2004). The decision of which of these
resins should be used is not simple and depends mostly on the characterization of the
actual wastewater. In order to choose between these resins, it is advisable to perform tests
and operate pilot plants under several parameter conditions to determine the best choice
to reach the desired objectives (Jenkins et al. 2004).
1.2.2. Biological Approaches
Environmental biotechnologies have been shown to offer interesting potentials for
metal removal and recovery (Lovley 2000). Biological treatment could also provide an
attractive approach to effectively meet regulatory challenges associated with Cu-CMP.
Microbial processes for the removal of metals from aqueous streams generally rely on
immobilization mechanisms, most notably biosorption by microbial or exopolymers
(biosorption) (Schiewer and Volesky 2000; White et al. 1995); reduction of metals to less
soluble forms (Lloyd and Lovley 2001) and, chemical precipitation with biogenic
products, e.g., oxalates, phosphates, or sulfides (Gadd 2000). Attempts to treat CMP
wastewaters using biological approaches are very scarce.
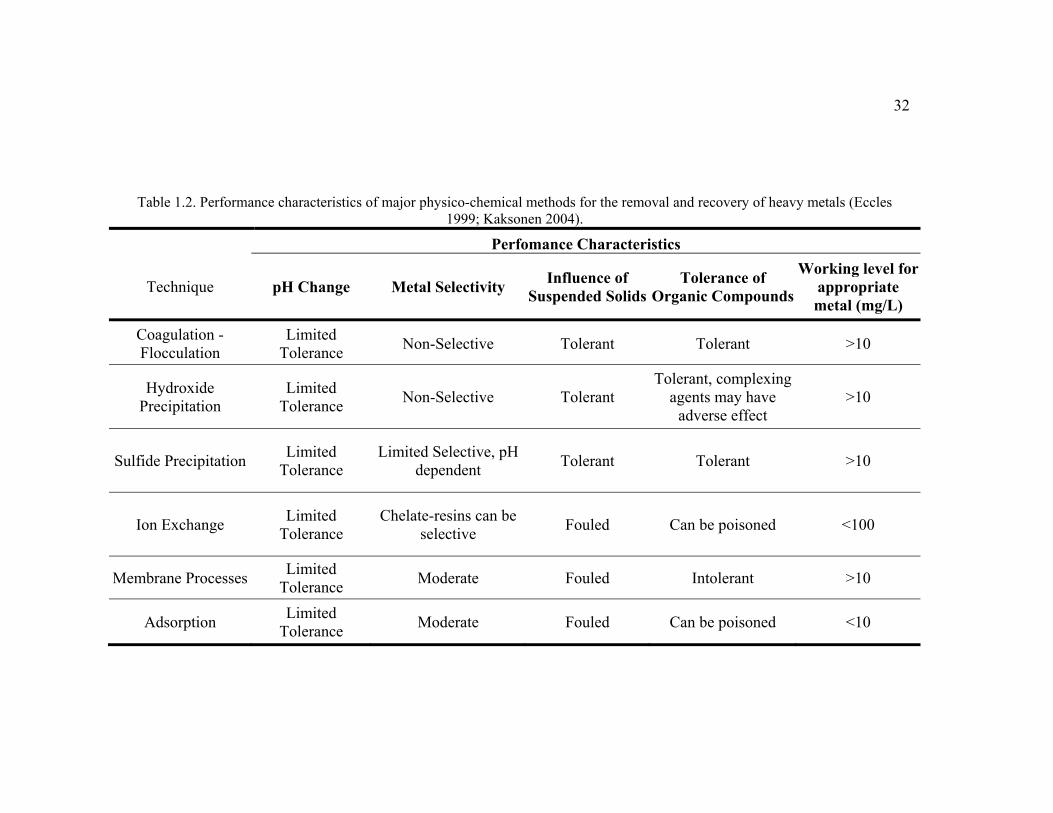
32
Table 1.2. Performance characteristics of major physico-chemical methods for the removal and recovery of heavy metals (Eccles 1999; Kaksonen 2004).
Perfomance Characteristics
Technique pH Change Metal Selectivity Influence of Suspended Solids
Tolerance of Organic Compounds
Working level for appropriate metal (mg/L)
Coagulation - Flocculation
Limited Tolerance Non-Selective Tolerant Tolerant >10
Hydroxide Precipitation
Limited Tolerance Non-Selective Tolerant
Tolerant, complexing agents may have
adverse effect >10
Sulfide Precipitation Limited Tolerance
Limited Selective, pH dependent Tolerant Tolerant >10
Ion Exchange Limited Tolerance
Chelate-resins can be selective Fouled Can be poisoned <100
Membrane Processes Limited Tolerance Moderate Fouled Intolerant >10
Adsorption Limited Tolerance Moderate Fouled Can be poisoned <10

33
1.2.2.1. Biosorption
The term biosorption is often used to define the uptake of heavy metals by
biological material, removing them from solution (Gadd 1990). However, the term should
be differentiated from the term bioaccumulation. The difference relies in that
bioaccumulation depends on metabolic activity, while biosorption does not (Schiewer
and Volesky 2000). Therefore a better definition of biosorption would be the passive (i.e.
not metabolically mediated) removal of heavy metals by biological materials (Schiewer
and Volesky 2000).
Since biosorption is metabolic independent either dead or live biomass could be
used for biosorption (Schiewer and Volesky 2000). The use of each one has its own
advantages and disadvantages. Including the advantages of live biomass it can be found:
self renewing properties, major uptake level of heavy metals due to active transport into
the cell, and some metabolic products of living cells can bind to metals or precipitate
them facilitating removal (Schiewer and Volesky 2000). However, the use of live
biomass presents some disadvantages like the cost of providing nutrients, and toxicity of
heavy metals to living cells (Schiewer and Volesky 2000). These problems are avoided if
dead biomass is used. Since it has been proved that heavy metal uptake of dead biomass
compares to live biomass, and that the costs of nutrient supply fairly exceeds the costs of
obtaining nonliving biomass, the latter is most commonly studied for industrial
applications (Schiewer and Volesky 2000).
34
Generally biosorption is used as a polishing process rather than a main removal
process. This is especially true when high metal concentrations are found in contaminated
waters (above 100 mg/L) (Schiewer and Volesky 2000). If waters containing high loads
of heavy metals were treated, the use of high biosorbent quantities would be needed,
increasing costs.
Several factors affect the performance of a biosorption process such as: cell wall
composition, presence of chelators, pH, buffer type, ionic strength, metal concentration,
culture age, among others (Stanley and Ogden 2003). To optimize the application of this
process, the mechanisms of biosorption, and the effects that each variable has on it,
should be studied and well understood (Schiewer and Volesky 2000).
Stanley and Ogden (2003) in a study to remove copper from semiconductor
wastewaters, reported removal efficiencies of 100% for a new biosorbant. However, the
removal efficiency lowered after regeneration of the biosorbant to efficiencies around
90%.
1.2.2.2. Metal Reduction
Mobility, bioavailibility and hence toxicity of heavy metals has a strong
dependence on its redox state. If reduction of a heavy metal to a lower redox state occurs,
its mobility and toxicity can be reduced offering interesting options for remediation
(Gadd 2000). Metal reduction can take place either by direct metal reduction, meaning
that the microorganisms use the metal as its terminal electron acceptor in the respiration

35
process, or by using other substances as electron acceptors that, after being reduced, react
with the oxidized metals abiotically, producing reduced metals and reestablishing the
original oxidized compound. These compounds are called electron shuttles. Usually
humic substances, such as that found in soils, serve as electron shuttles (Lovley and
Coates 1997) Microorganisms capable of dissimilatory metal reduction have a diverse
phylogeny and physiology, however, most of them can utilize Fe3+ and S0 as terminal
electron acceptors (Lovley and Coates 1997)..
Reduction can serve as a remediation technique either by production of a less
soluble form of the metal (reduction of Cr6+ to Cr3+, U6+ to U4+) or by volatilization of the
reduced form (reduction of Hg2+ to Hg0) (Lovley and Coates 1997). Reductive
precipitation appears to be particularly promising for the remediation of Cr6+, U6+, Hg2+,
among others (Abdelouas et al. 2000; Battaglia-Brunet et al. 2002; Gadd 2000; Lloyd
2003; Lovley and Coates 1997; Smith and Gadd 2000; Turick et al. 1997; von Canstein et
al. 1999).
1.2.2.3. Precipitation with Biosulfides
The mechanism of heavy metal removal by biogenic sulfides follows the same
principle that the chemical precipitation process with sulfide addition. However, it differs
in the fact that in this case sulfate reducing bacteria (SRB) are responsible for the
formation of sulfide. SRB are anaerobes, which grow usually under mesophilic
conditions and at neutral pH (White et al. 1997).

36
Table 1.3. Biological mechanisms for removal of heavy metals (adapted from (Kaksonen 2004)). Mechanism Organisms Metals remediated
Biosorption Plants, algae, bacteria, fungi, yeast,
peat, agricultural byproducts, biopolymers
Most of them
Intracellular uptake and accumulation Plants, algae, bacteria, yeasts Most of them
Complexation Microorganisms, algae, peat, immobilized siderophores Most of them
Oxidation Oxidizing microorganisms Fe2+, Mn2+
Reduction Reducing microorganisms Fe3+, Hg2+, Cr6+, Mn4+, U6+, Tc7+ and Co3+
Methylation and volatilization Methylating microorganisms, fungi Hg2+, Cd2+, Pb2+, As, Se, Te
Extracellular precipitation
Phosphate liberating microorganisms, sulfate- and sulfur-reducers, pH
increasing microorganisms Most of them
1.2.2.3.1. Sulfate Reducing Bacteria
SRB are for the most part strict anaerobes that can reduce sulfate (SO42-) to
sulfide (S2-) using a variety of organic compounds or hydrogen as electron donors
(Madigan et al. 2003b). Not long ago it was thought that SRB were obligate anaerobes,
however, recently some pure cultures have been isolated which can grow in the presence
of oxygen, and furthermore use oxygen as electron acceptor. Nevertheless, oxygen is not
able to support growth, and it is believed that respiration of oxygen is mainly a
mechanism of oxygen removal (Madigan et al. 2003b).

37
SRB are mainly mesophilic with a maximum growth rate occurring at neutral pH
(White et al. 1997). However, some extremophilic SRB species have been isolated from
different environments. These extremophilic SRB include thermophiles, psycrophiles,
halophiles, alkaliphiles and acidophiles, growing with different electron donors, but
mainly lactate, pyruvate and hydrogen (Lens et al. 2003).
The variety of organic compounds that some SRB are capable to transform opens
a promising perspective for remediation. Some SRB are known to metabolize some
organic compounds such as aromatics and chlorinated compounds that are known to be
toxic for microorganisms (Hulshoff Pol et al. 1998). Other SRB strains have been found
capable of removing metals by direct reduction; some of these metals are molybdenum,
selenium, chromium, and uranium (Lens et al. 2003).
1.2.2.3.2. Biochemistry of Sulfate Reduction
All SRB are unique in their characteristic use of sulfate as a terminal electron
acceptor. The ability of using the reduction of sulfate to sulfide for energy generation is
restricted to SRB (Madigan et al. 2003c).
Sulfate is a very stable ion that must be activated prior to reduction. ATP is
involved in the activation of sulfate. A series of reactions that involve different enzymes
takes place in order to reduce sulfate. First the enzyme ATP sulfurylase catalyzes the
reaction of sulfate attachment to ATP, forming adenosine phosphosulfate (APS), after
this the enzyme APS reductase promotes the reduction of sulfate to sulfite (SO32-). The
38
mechanism of sulfite reduction to sulfide is not yet well understood, however an enzyme
called sulfite reductase plays an important role in it (Madigan et al. 2003c).
1.2.2.3.3. Types of Electron Donors
SRB can utilize a broad range of electron donors, including a variety includes
simple organic compounds (short-chain fatty acids, some primary alcohols), complex
organic compounds (aromatics, long-chain fatty acids), and even inorganic compounds
(H2) (Eccles 1999; Lens et al. 2003; Madigan et al. 2003c). SRB are generally classified
in two groups depending on their ability to degrade acetate: non-acetate oxidizers, and
acetate oxidizers. The first group oxidizes the organics compounds to the level of acetate,
excreting it to the environment. The second group is able to oxidize the organic
compounds and acetate all the way to CO2 (Madigan et al. 2003b). Some strains are able
to grow chemolithoautotrophically with H2 as electron donor and CO2 as carbon source
(Madigan et al. 2003b).
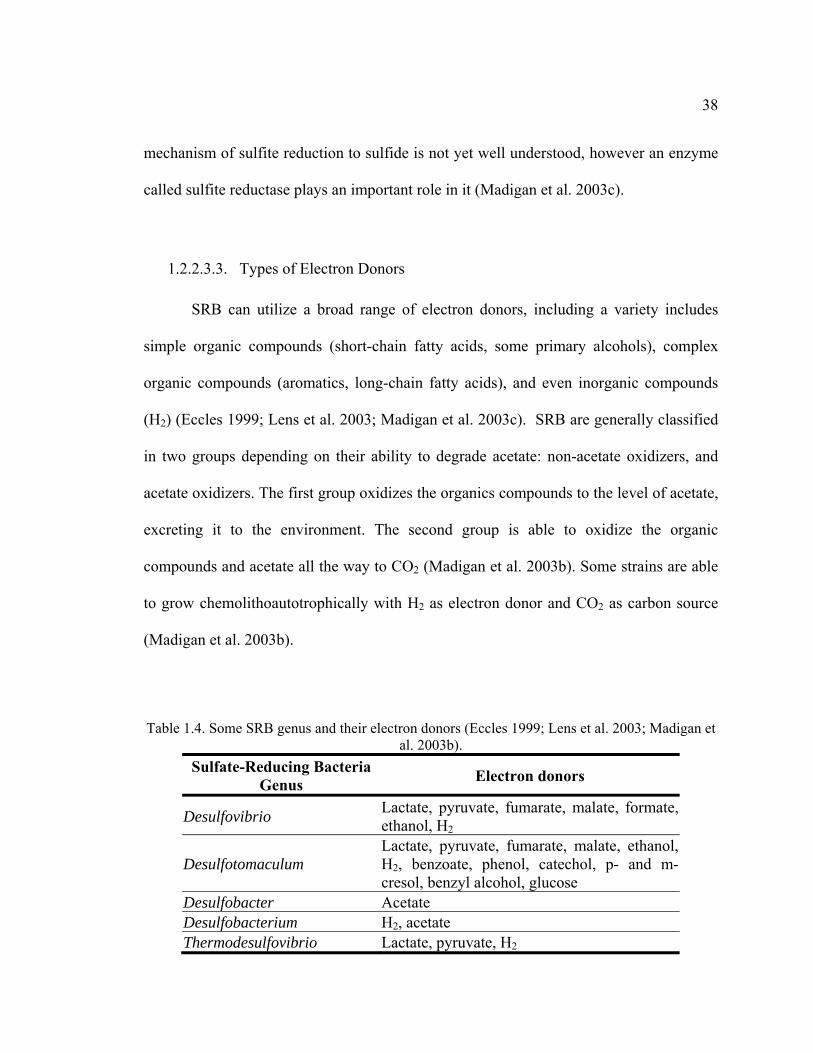
Table 1.4. Some SRB genus and their electron donors (Eccles 1999; Lens et al. 2003; Madigan et al. 2003b).
Sulfate-Reducing Bacteria Genus Electron donors
Desulfovibrio Lactate, pyruvate, fumarate, malate, formate, ethanol, H2
Desulfotomaculum Lactate, pyruvate, fumarate, malate, ethanol, H2, benzoate, phenol, catechol, p- and m-cresol, benzyl alcohol, glucose
Desulfobacter Acetate Desulfobacterium H2, acetate Thermodesulfovibrio Lactate, pyruvate, H2

39
1.2.2.3.4. Sulfide Precipitation and Selectivity
The main advantages of sulfate reduction for the removal of metals are the low
effluent concentrations, less dependence on chelating agents present in the contaminated
water, and selectivity (Hammack et al. 1994; Veeken et al. 2003b). Another advantage is
that sulfate reduction could represent an economic promise for metal removal. Metal
sulfides produced during metal removal can be treated to recover partially or completely
the metal of interest, selectivity will favor the recovery of metals.
This project considers the application of anaerobic sulfate reducing bacteria
(SRB) for the biomineralization of Cu in CMP aqueous streams by precipitation as highly
insoluble metal sulfides. Removal of organic content usually found in CMP wastewaters
is other of the objectives for this treatment process.
1.3. Photolitography and Perfluoroalkylsulfonate Surfactants (PFAS)
Besides CMP, many other processes are involved in the production of an
Integrated Circuit, with many other chemicals also involved in these processes. An
important step in the fabrication is the creation of a 3D structure that is built to create the
circuit. Lithography is a technique used in semiconductor fabrication which involves the
transfer of a pattern to a polymer film and then engraving this pattern in an underlying
thin conductor or dielectric film, also known as wafer, which after several cycles creates
a three dimensional structure of the circuit. Photolitography is the process in which light
is used to transfer such pattern (photomask) to a photosensitive resist (Thompson 1994).
40
This process broadly includes six steps: wafer preparation; photoresist application or
coating; exposure to light, UV radiation or electron beams; development of the pattern by
the addition of a developing solution; etching, where the substrate or film not protected
by the resist is removed; and striping, where all the resist is taken out of the wafer
(Thompson 1994).
Photoactive acid generators (PAG) are light sensitive compounds that are used to
alter the solubility of photoresists in regions exposed to UV or e-beam radiation
(Thompson 1994). Perfluorooctanesulfonate (PFOS) is the most widely used PAG in the
semiconductor industry and it is also used as an antireflective coating (ARC) and
surfactant in the developing solution (Tang et al. 2006). When the resist and the ARC are
applied around 90-93% of the solution is drained and incinerated (Brooke et al. 2004).
However, up to 40% of the ARC solution might end up drained to the wastewaters in
some facilities (Brooke et al. 2004). Concentrations of PFOS and related compounds in
the process solutions vary in the range of 0.2-1% (Brooke et al. 2004; Tang et al. 2006).
Nevertheless, these concentrations are dramatically lowered once the wastewater is sent
to a municipal wastewater treatment plant, due to dilution with other processes
wastewaters (Tang et al. 2006).
PFOS and related long-chain perfluorinated compounds are under increased
scrutiny as priority environmental contaminants. This is due to recent reports of their
detection in environmental and biological matrices, as well as, concerns regarding their
persistence and toxicity (Berthiaume and Wallace 2002; Hu et al. 2002; Kannan et al.
2001). PFOS has a significant bioaccumulation potential and this chemical has been
41
detected in part-per-billion levels in animals worldwide (Giesy and Kannan 2001;
Kannan et al. 2001), including remote locations such as Siberia and Antarctica, and in the
international blood bank (Calafat et al. 2006; Kannan et al. 2004). In response to the
increasing concern about the public health risks associated to PFOS, a major
manufacturer, 3M, recently ceased production of this chemical and the US Environmental
Protection Agency is moving forward with a ban to its manufacture and use.
Nevertheless, PFOS and other long chain perfluorinated materials are vital to
semiconductor manufacturing and there is some urgency in finding a replacement family
of materials, because any commercial use may take as long as 10 years to become fully
qualified. The goal of the semiconductor industry is to phase out and replace these
materials with substitutes that have similar or better performance attributes and are
environmentally compatible. Efforts to develop alternatives to PFOS have focused on
performance issues, and information on the environmental compatibility of new non-
PFOS/non-PFAS PAGs is presently lacking. However most replacements found are
PFAS materials (eg. perfluorobutane sulfonate or PFBS) and present most of the same
environmental challenges as PFOS such as recalcitrance, although, they are less
bioaccumulative (Martin et al. 2003). So it is of great importance to develop non-
perfluorinated PAGs with outstanding lithographic properties. Once developed,
understanding the environmental impact and treatment technologies for these new
materials will be important.
42
1.3.1. Physico-Chemical Treatment of PFOS and other Fluorinated Chemicals
PFOS degradation by chemical or biological means has not been observed under
environmental conditions, and it presents a very high chemical stability even at high
temperatures (Key et al. 1998; Tang et al. 2006). In fact some of the uses for PFOS have
been as a flame retardant (Brooke et al. 2004; Hori et al. 2006; Tang et al. 2006). This
recalcitrance is attributed mainly to the great strength of the carbon-fluorine bond (bond
energy of 485 kJ/mol), which provides stability to the compound.
Data for the physico-chemical treatment of PFOS in the literature is scarce.
Membrane processes such as reverse osmosis have shown potential for the removal of
PFOS from water (Tang et al. 2006). However, reverse osmosis is a technique where
PFOS is only concentrated but not destroyed, so further treatment is needed for the
concentrated waste. Other techniques involving concentrated PFOS wastes, either in a
solid or liquid media, would suffer from the same problem.
Only partial degradation of PFOS by chemical treatment has been reported in the
literature. A study by Hori et al. (2006), used zerovalent iron (ZVI) in subcritical water
(350oC) to degrade PFOS, however PFOS was not completely degraded to CO2 and F-.
Other studies involving ultrasonic irradiation showed also partial degradation of PFOS,
however several partially fluorinated subproducts were also found (Moriwaki et al.
2005). Both of these techniques suffer from the lack of complete degradation of PFOS
and their applicability is doubtful due to their high energy demand.
43
A new promising technique utilizing boron-doped diamond film electrodes has
been demonstrated to degrade PFOS and achieve almost complete mineralization (Carter
and Farrell 2008). Carter and Farrell (2008), using this technique on both a rotating disk
electrode reactor and a parallel plate flow-through reactor, found a complete degradation
of PFOS, with only traces of trifluoroacetic acid (TFA) as residual product (less than 3%
of the initial PFOS mass). Fluoride was recovered in an 11:1 molar ratio on the rotating
disk electrode, and 14:1 molar ratio in the parallel plate reactor. The reaction rates
followed a zeroth order in PFOS concentration for the rotating disk, and first order in the
parallel plate reactor. The authors suggest that the mechanism of PFOS oxidation is most
likely direct electron transfer.
1.3.2. Biological Treatment of PFOS and other Fluorinated Chemicals
Organohalogens are compounds generally persistent in the environment.
However, recent studies have shown that, although slow, biodegradation of these
compounds is feasible and can be of importance to their environmental fate (Fetzner
1998; Janssen et al. 2005; Parsons et al. 2008; Smidt and de Vos 2004).
Depending on the environmental conditions to which the organohalogens are
presented, their degradation may follow different pathways. Under aerobic conditions,
organohalogens usually follow a similar metabolic degradation pathway to their non-
halogenated analogues (Alexander 1999). However, this pathway is usually obstructed by
halogen substitution which leads to the accumulation of partly degraded metabolites,

44
resulting in that aerobic degradation usually follows a cometabolic process, without
apparent yielding of useful energy (Parsons et al. 2008). Under anaerobic conditions,
biodegradation has been identified to occur in some cases with catabolic reactions similar
to those occurring aerobically (Fetzner 1998). The difference in these cases is made by
the final electron acceptor utilized, usually nitrates and sulfate, instead of oxygen.
The most important part of the degradation of organohalogens, is the reactions
that lead to dehalogenation. There are different reactions that lead to dehalogenation, in
both aliphatic and aromatic substrates (Fetzner 1998; Janssen et al. 2005). Haloacid
dehalogenation, halohydrin dehalogenation, haloalkane dehalogenation, and reductive
dehalogenation, are among these reactions. One of the most important, under anaerobic
conditions, is reductive dehalogenation (Field and Sierra-Alvarez 2004; Parsons et al.
2008). From a thermodynamically point of view, reductive dehalogentation (and more
specifically reductive defluorination) is a feasible reaction from which microorganisms
should be able to obtain energy to grow (Parsons et al. 2008). Although less information
is available on the Gibbs free energy values of fluorinated compounds, current data
shows that the Gibbs free energy available from defluorination is similar, or slightly
lower, than the quantity available from dechlorination (Parsons et al. 2008). However,
whether organisms can harness this energy is another question (Parsons et al. 2008).
The structural properties of fluorinated organics play an important role on their
biodegradability and environmental fate. A property of special importance is the number
of fluorine substitutions that the organic molecule has (Key et al. 1997). Direct
defluorination (such as reductive defluorination, and hydrolytic defluorination) has been
45
reported only in a few cases and for tri-, di-, and monofluorinated compounds. However,
this kind of transformation is too slow to be of environmental importance for higher
fluorinated chemicals (Key et al. 1997). Usually degradation of higher fluorinated
compounds occurs by attacking the functional group, or bond, attached to the fluorinated
moiety, rather than direct defluorination (Key et al. 1997).
Perfluorinated chemicals are more persistent in the environment than their lower
fluorinated counterparts. Several studies have been done on the biological removal of
perfluorinated compounds such as PFOS and PFOA. Schroder (2003), studied the
degradation of a series of perfluorinated surfactants (PFOS, PFOA and some partially
fluorinated nonionic surfactants). In this study they observed rapid biodegradation, in
wastewater samples, of the partly fluorinated chemicals to carboxylic acids, under
aerobic conditions. Removal of PFOS and PFOA was also observed under anaerobic
conditions. However, no metabolites were observed nor fluoride concentration increase
was noted. This could indicate that removal of PFOS was not due to biodegradation, but
mostly due to physical processes, like adsorption or precipitation. Studies by Ochoa-
Herrera and Sierra-Alvarez (2008) have shown that PFOS can be adsorbed to anaerobic
sludge. In another study by Meesters and Schroder (2004), with sludge from German
wastewater treatment plants (WTP), removal of PFOS and PFOA was observed under
anaerobic conditions after 26 d. However, no metabolites or defluorination was observed.
While some of the perfluorinated chemicals may undergo limited biodegradation,
extensive defluorination has yet to be observed (Key et al. 1997).

46
Although complete biological degradation of perfluorinated chemicals like PFOS
has not been found, there are some studies that prove that lower fluorination allows for
biological degradation. Key et al. (1998) proved partial degradation of H-PFOS
(1H,1H,2H,-2H-perfluorooctane sulfonate; C6F13C2H4SO3-) by Pseudomonas sp. Strain
D2. Partial degradation of H-PFOS occurred more readily under anaerobic conditions.
Other highly fluorinated compound that has been observed to degrade is 1H,1H,2H,2H-
perfluorodecanol (8:2 fluorotelomer alcohol). Hagen et al. (1981), observed that
1H,1H,2H,2H-perfluorodecanol, degrades to PFOA on adult male rats. The first detailed
report on the aerobic biodegradation of 1H,1H,2H,2H-perfluorodecanol, with a microbial
consortium enriched from soil and sediments was provided by Dinglasan et al. (2004).
They observed that this fluorotelomer alcohol was completely degraded to 8:2
fluorotelomercarboxylic acid, 8:2 fluorotelomer unsaturated carboxylic acid, and PFOA.
A similar study on the degradation by domestic sewage sludge of 1H,1H,2H,2H-
perfluorodecanol found the same metabolites, among others, and found a fluoride release
of 12% (Wang et al. 2005a; Wang et al. 2005b). PFOA was also a main degradation
product of 1H,1H,2H,2H-perfluorodecanol, in this study. These studies show that non-
perfluorinated chemicals can be defluorinated and degraded to shorter chain products by
microorganisms found in WTP.
It has also been proven that highly halogenated hydrocarbons are more readily
degraded under anaerobic conditions (Field and Sierra-Alvarez 2004). A study of the
reductive defluorination of PFOS utilizing vitamin B12 and Ti(III)-Citrate showed that
partial dehalogenation was feasible in branched isomers of PFOS; whereas linear PFOS
47
was not dehalogenated (Ochoa-Herrera et al. 2008). This implies that structural properties
of perfluorinated chemicals also affect defluorination.
Based on these two premises, that lower fluorination and certain structural
configurations promote biodegradability and make for more environmentally friendly
compounds, this project aims to develop new PFOS-free (and PFAS-free) PAGs and
investigate the environmental behavior of these PFOS-free alternatives. The
development of PFOS-free ionic and non-ionic PAGs will be conducted by Dr. Chris
Ober and his research group in Cornell University. They will synthesize new PFOS- and
PFAS-free photoacid generators, which should improve the environmental behavior
compared to PFOS. The chemical structure of the compounds (PAGs) evaluated in this
research are shown in Figure 1. Our objective will be to evaluate key environmental
properties of the novel PAGs, i.e., 1) their bioaccumulation potential; 2) susceptibility to
biodegradation by microorganisms commonly found in wastewater treatment systems;
and 3) toxic effects.

48
Table 1.5. Summary of physico-chemical and biological treatments for highly fluorinated sulfonates.
Approach Treatment Chemical
Removal (Biological or
Chemical degradation)
Mineralization (Fluoride
released %) Literature
Physico-Chemical
Reverse osmosis PFOS NA NA (Tang et al. 2006)
Activated carbon PFOS, PFBS NA NA (Ochoa-Herrera
and Sierra-Alvarez 2008)
ZVI in subcritical water PFOS, PFHS
>99.46% for PFOS,
94.77% for PFHS
Up to 51.4% for PFOS, up to
52.3% for PFHS
(Hori et al. 2008; Hori et al.
2006)
Ultrasonic irradiation PFOS, PFOA Partial (up to 60% for PFOS)
Partial (up to 51% for PFOS)
(Moriwaki et al. 2005)
Boron-doped diamond film electrodes PFOS Complete
degradation
11:1-14:1 fluoride to PFOS
molar ratio
(Carter and Farrell 2008)
Biomimetic Reduction Technical PFOS Partial Partial (up to 18%)
(Ochoa-Herrera et al. 2008)
Biological
Biodegradation w/ microbial consortium from
sediments and soil, and domestic sewage sludge
1H,1H,2H,2H-Perfluorodecanol
To below detection limits
Partial (approx. 12%)
(Wang et al. 2005a; Wang et
al. 2005b)
Biodegradation w/ Pseudomonas sp. Strain D2 H-PFOS Partial Partial (up to
10.9%) (Key et al.
1998) NA = Not Applicable
PFHS = Perfluorohexanesulfonate

49
1.4. Objectives and Research Approach
The main objectives of this project are:
1. To evaluate the feasibility of the simultaneous removal of copper and organics
removal from semiconductor wastewaters by means of a coupled sulfate
reducing bioreactor – crystallization reactor.
2. To study the biodegradability and microbial toxicity of complexing agents
found in CMP wastewaters (i.e. citric acid, EDTA, etc.).
3. To evaluate the environmental compatibility and treatability of novel
PFOS/PFAS-free PAGs. Key environmental properties considered will
include: a) their bioaccumulation potential; b) susceptibility to biodegradation
by microorganisms commonly found in wastewater treatment systems; c)
toxic effects; and d) treatability by conventional physico-chemical processes.
In order to reach the objectives proposed here, different approaches were
established. These approaches were distributed in five different tasks, which will attack
each objective. These tasks are described below.
1.4.1. Simultaneous Removal of Copper and Organics from Semiconductor Simulated
Wastewater
The objective of this task is to demonstrate that copper and organics found in
semiconductor wastewater can be removed in a coupled crystallization reactor – sulfate
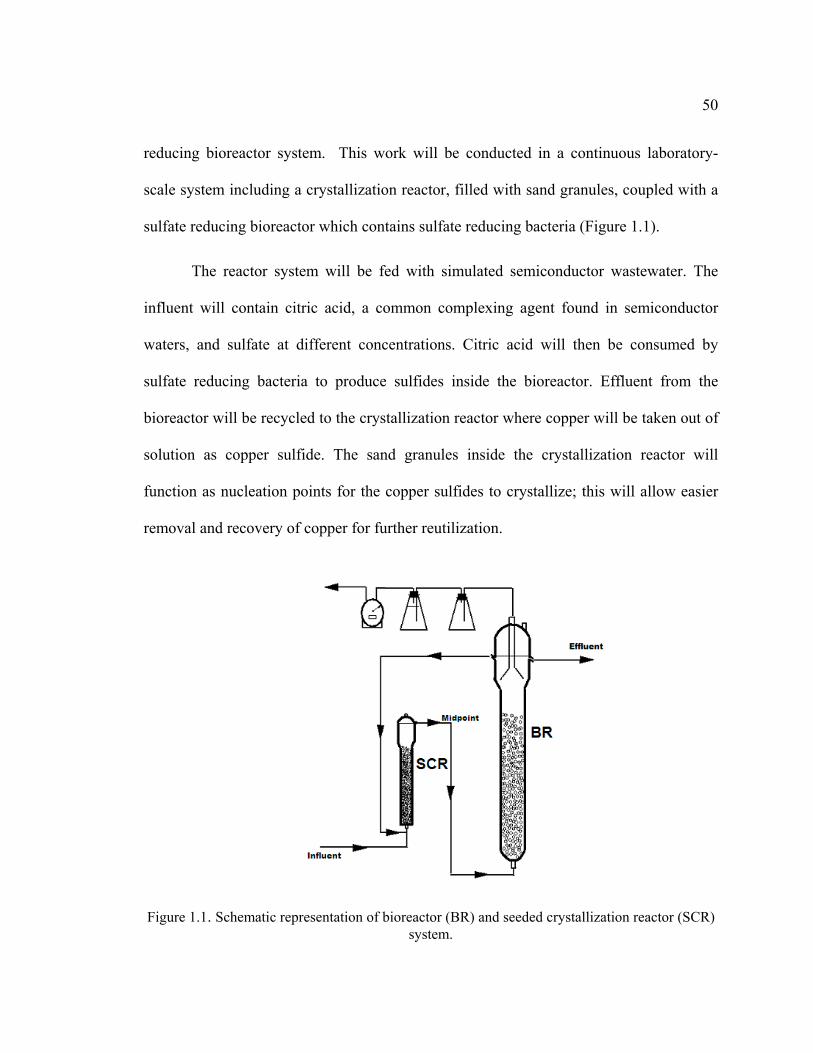
50
reducing bioreactor system. This work will be conducted in a continuous laboratory-
scale system including a crystallization reactor, filled with sand granules, coupled with a
sulfate reducing bioreactor which contains sulfate reducing bacteria (Figure 1.1).
The reactor system will be fed with simulated semiconductor wastewater. The
influent will contain citric acid, a common complexing agent found in semiconductor
waters, and sulfate at different concentrations. Citric acid will then be consumed by
sulfate reducing bacteria to produce sulfides inside the bioreactor. Effluent from the
bioreactor will be recycled to the crystallization reactor where copper will be taken out of
solution as copper sulfide. The sand granules inside the crystallization reactor will
function as nucleation points for the copper sulfides to crystallize; this will allow easier
removal and recovery of copper for further reutilization.
Figure 1.1. Schematic representation of bioreactor (BR) and seeded crystallization reactor (SCR) system.
51
1.4.2. Simultaneous Removal and Recovery of Heavy Metals by Means of a Coupled
Crystallization Reactor – Sulfate Reducing Bioreactor system
The objective of this task is to demonstrate the feasibility of simultaneous
removal of heavy metals from wastewaters when two or more than two metals are
present. To accomplish this a continuous system consisting of a crystallization reactor
and a sulfate reducing bioreactor will be fed with simulated wastewater containing nickel
and copper as model for heavy metals, and citric acid as electron donor for sulfate
reduction.
The system will remove the metals in the crystallization reactor by precipitation
with biogenic sulfides. Precipitation will occur on the surface of sand granules to promote
nucleation and allow for easy recovery. Soluble and total concentrations of metals, as
well as levels of citric acid, sulfide, and sulfate will be measured to determine the
efficiency of the system.
1.4.3. Anaerobic Biodegradation of Citrate under Methanogenic and Sulfate
Reducing Conditions
The metabolic pathway of anaerobic degradation of citrate under anaerobic
conditions will be studied in this task. Citrate is a common component of CMP
wastewaters. Batch bioassays will be performed under sulfate-reducing, methanogenic
and fermentative conditions. Little is known of the degradation pathway of citrate under
these conditions.

52
Sulfate reducing conditions will be obtained by adding determined quantities of
sulfate in order to obtain a sulfate to COD ratio of 1.8, which is known to be a condition
where sulfate reduction is favored over methanogenesis. In these assays, methanogenesis
will be inhibited by addition of bromoethanesulfonate (BES). Methanogenesis and
fermentation will be studied in bioassays lacking sulfate. Fermentative conditions will be
achieved by adding BES to prevent methanogenesis. For this study two different
microbial consortia will be used, a sulfate reducing inoculum and a methanogenic
inoculum.
In order to study the fate of citrate under anaerobic conditions, an analysis of the
final products of citrate degradation will be performed by measuring, acetate, carbon
dioxide and citric acid, which based on literature reviews are the main degradation
products of organic compounds.
1.4.4. Toxicity of Chelating Agents in CMP Effluents to Microorganisms Found in
Wastewater Treatment Plants
Complexing agents (i.e. EDTA, NTA, DPTA) are important components of CMP
slurries which are utilized to prevent precipitation of copper removed from the wafers.
There exists concern about the possible inhibitory impact of these agents to microbial
communities in biological wastewater treatment systems. The objective of this task is to
study the toxicity of chelating agents in CMP effluents to different microorganisms
commonly found in wastewater treatment plants, i.e., methanogens in anaerobic treatment
53
systems and aerobic heterotrophs in activated sludge processes. The mechanism of
inhibition will also be studied in this task.
1.4.5. Environmental Compatibility and Treatability of New PFOS/PFAS-free PAGs
Any new substitute for PFOS will have to demonstrate better environmental
behavior in order to be a feasible candidate for replacement. New PAGs developed by Dr
Chris Ober in Cornell University considered in this study are only partially fluorinated.
This design has the potential to allow for less persistence and bioaccumulation in the
environment. In this task we will evaluate the environmental behavior (i.e. toxicity,
bioaccumulation, biodegradability, treatment methods) of the new non-PFOS PAGs.
Different sub-tasks are developed to approach this objective.
1.4.5.1. Evaluation of the Toxicity of Newly-Developed PAGs to Microorganisms
and Eukaryote Cells
The toxicity of the new PAGs and metabolites from their microbial conversion
will be evaluated utilizing three different assays: the methanogenic inhibition test, the
Mitochondrial Toxicity Test (MTT), and the Microtox® assay.
The methanogenic inhibition assays measures the toxicity of a determined
compound to anaerobic methanogenic microorganisms. The inhibition is measured by
exposing the microorganisms to different concentrations of the compound to analyze, and
then measuring the rate of production of methane and comparing this to a control. This
54
test is good for correlating toxicity of a compound to microorganisms usually found in
wastewater treatment plants.
The MTT measures the activity of the mitochondria inside eukaryotic cells.
Mitochondria are responsible of energy production inside the cells. Cells are exposed to
the compound to be analyzed, and the mitochondrial activity is measured by colorimetric
methods and compared to a negative control which has not been exposed to the toxicant.
A dose-response curve is then prepared and the results analyzed. This test correlates well
with other types of mammal cells (Liu et al. 1997; Mosmann 1983).
Microtox® is a commercially available test that measures the toxic effect of
chemical compounds toward a bioluminescent bacterium (Vibrio fischeri) which light
intensity correlates to the amount of inhibition imposed by the toxicant. Results are
compared to a control and results are analyzed in a dose-response curve. Microtox® test
results for a variety of organic and inorganic chemicals have shown a good correlation
with inhibitory concentrations determined in assays with aquatic organisms (eg. fish and
crustaceans) (Dezwart and Slooff 1983; Nacci et al. 1986; Steinberg et al. 1995).
1.4.5.2. Biodegradability of Newly-Developed PAGs under Conditions Found in
Wastewater Treatments Plants
Any replacement for PFOS will have to be less persistent under normal
environmental conditions. The new PAGs considered in this study are only partially
fluorinated. It has been studied that reductive dehalogenation is an important degradation

55
pathway for highly halogenated hydrocarbons (Field and Sierra-Alvarez 2004). However,
lower halogenated hydrocarbons are generally susceptible to attack by monooxygenases
(Field and Sierra-Alvarez 2004). Another interesting approach for the biodegradation of
the non-perfluorinated PAGs is to take advantage of ammonia monooxygenases (AMO)
of nitrifying microorganisms. Nitrification processes are a common part of most WTP, so
no modification of existing processes would be necessary.
To study the biodegradability of the new PAGs, batch experiments simulating
conditions usually found in wastewater treatment plants will be performed. These include
aerobic (primary metabolism and cometabolic) oxidation and anaerobic reductive
dehalogenation. Mineralization of PAGs will be followed by measuring fluoride release
into solution with a fluoride selective electrode. Biotransformation of PAGs will be
monitored by high performance liquid chromatography (HPLC) with UV or suppressed
conductivity detection.
1.4.5.3. Evaluation of Potential Environmental Impact of New PAGs utilizing
Software Modeling
Persistence, bioaccumulation and toxicity are the main factors that present
environmental concern for many compounds released into the environment. Direct
measurement of these properties can be challenging, especially when long term exposure
to the compound being studied is needed, and when high costs for testing is also a
concern. Models have been developed to estimate the environmental properties of
56
pollutants based on various characteristics of the compound studied. Such characteristics
may include: structure, molecular weight, partition coefficients, etc., being structural
characteristics the most utilized.
In order to accomplish this task the new PAGs will be studied with the help of
two models the EPA PBT Profiler (www.pbtprofiler.net). The PBT Profiler is a model
recommended by the US-EPA to study new compounds when experimental data is not
available. The only input to this model is the structure of the compound being modeled.
However, its application is limited and may not be completely suited to highly fluorinated
compounds. The second model studied in this task was the EPA EPI Suite. This model is
a simulator that predicts physical properties of organic compounds, such as, boiling and
melting points, volatility, partition coefficients, etc. As with the PBT Profiler, the only
input needed for the use of this simulator is the structure of the compound to be studied.
1.4.5.4. Physicochemical Methods for Treatment of Newly Developed PAGs
Activated carbon adsorption is amongst the most common physico-chemical
methods for treatment of organic pollutants. Other methods applied for the treatment of
recalcitrant compounds include advanced chemical oxidation and advanced chemical
reduction. The feasibility of treatment of the new developed PAGs using conventional
physico-chemical methods are studied in this task. The adsorption of the new PAGs to
granular activated carbon (GAC) will be analyzed in this task with the creation of
isotherms in batch assays. Degradation of new PAGs will be studied under reductive and

57
oxidative conditions. For reductive degradation, the new PAGs will be treated with ZVI
under normal conditions (35 oC) in batch assays. Advance chemical oxidation of the new
PAGS will be studied utilizing Fenton’s reagent. The study will be carried on batch
assays with different concentrations of hydrogen peroxide and iron.
58
2. RECOVERY OF COPPER FROM WASTEWATER BY MEANS OF A SULFATE
REDUCING BIOREACTOR AND A CRYSTALLIZATION REACTOR
2.1. Abstract
High levels of metal and organic contaminants are common in wastewaters from the semiconductor industry. Environmental biotechnologies have been shown to offer interesting potentials for metal removal and recovery, linked to organics removal. The goal of this research is to investigate the feasibility of an innovative system configuration that combines a crystallization reactor and a sulfate-reducing anaerobic bioreactor for the simultaneous removal of heavy metals and organic matter in a simulated semiconductor effluent wastewater. Removal of heavy metals is stimulated by biogenic sulfides produced by sulfate reducing bacteria inside an expanded granular sludge bed (EGSB) bioreactor. Heavy metals are then deposited in sand granules inside a separate fluidized bed containing fine sand (crystallization reactor). The sand offers surfaces for the nucleation of metal sulfides and subsequent crystal growth. Metal sulfides can then be recovered from the sand granules in a purified form. To evaluate this system, wastewater containing copper with levels ranging from 76.9 to 83.4 mg Cu2+/L and citric acid with concentrations of either 2667 or 840 mg/L, were used. Removal efficiencies of 97.0-100.0% and 99.9% were observed during this study for dissolved organic matter and copper, respectively. Soluble copper was removed in the crystallization reactor with efficiencies around 99.9%. Crystals of copper sulfide on the sand granules consisted of covellite (CuS).
59
2.2. Introduction
Anaerobic biological treatment is a well-established technology for the treatment
of organic contaminated wastewaters. For many years the main focus of this type of
technologies has been the degradation of organic contaminants, including some
xenobiotic compounds (Lens et al. 1998). The main advantages of anaerobic treatment as
compared to aerobic treatment are the lower production of biomass, and the generation of
biogas. Anaerobic treatments can experience problems when sulfate is present in
significant concentrations in the wastewater. Usually when the ratios of the chemical
oxygen demand (COD) to sulfate are below 10, failures with anaerobic systems have
been observed (methanogenesis outcompeted by sulfate reduction) (Hulshoff Pol et al.
1998). Production of hydrogen sulfide (H2S) causes different problems, toxicity,
corrosion, reduced biogas quality, and increased concentration of COD in the effluent,
are considered among the most important problems in the anaerobic treatment of sulfate-
containing wastewaters (Colleran et al. 1995; Rinzema and Lettinga 1988).
Sulfate reduction was considered more of a problem than a solution for biological
anaerobic treatment. However, recently, the interest in sulfate reduction as a specific
treatment for wastewaters with heavy metal contamination and with or without organic
content, e.g., wastewaters from semiconductor manufacturing; acid mine drainage
(AMD); wastewaters from galvanic processes, has grown (Lens et al. 2003). High
concentrations of sulfate are not uncommon in effluents contaminated with heavy metals.
However, if sulfate is not present, sulfate supplementation is also an option. Sulfate
reduction as a method for the remediation of waters contaminated with heavy metals

60
offers many advantages, e.g. very low levels of heavy metals are reached by heavy metal
precipitation with sulfides. Also sulfides prevent toxic effects by metals by making them
less bioavailable. And it also opens the possibility to remove, in just one step, heavy
metals and organic contaminants.
Heavy metals are known to be toxic to microorganisms, including sulfate-
reducing bacteria (SRB) (Fang 1997; Hollingsworth et al. 2005; Karri et al. 2006; Sani et
al. 2001; Utgikar et al. 2003). That is the reason why it is important to find a way in
which heavy metals do not cause microbial inhibition. To prevent toxic effects by heavy
metals in AMD, Hammack et al. (1994) precipitated the metals upstream from the
bioreactor by mixing the contaminated stream with H2S-rich biogas in a settler. However,
there are several problems with this design, including the additional cost of pumping gas,
and the fact that it is well know that metal sulfides produce a sludge that is difficult to
dewater (Lanouette 1977), increasing costs if the recovery of metals is desired.
The objective of this study is to develop a system where metals and organic
contaminants are removed simultaneously. To reach this objective a combined sulfate-
reducing bioreactor-crystallization reactor system will be used. Sulfide generated in the
bioreactor will be mixed with the influent inside the crystallizer. The metals precipitated
will be deposited in sand granules located inside the crystallization reactor to allow easy
recovery. The sand granules will function as nucleation points to facilitate and accelerate
metal removal. With this system configuration (Figure 1.1), inhibition by heavy metals
will be avoided by removing the metals before the influent enters the bioreactor.
61
2.3. Materials and Methods
2.3.1. Microorganisms
Sulfate reducing granular sludge was obtained from a laboratory-scale EGSB
operated at 30º C under non-limiting sulfate conditions for approx 500 days. The electron
donors utilized during this time were a mixture of ethanol, citrate, and isopropyl alcohol
(IPA) (Hollingsworth 2004). The sludge had an initial content of volatile suspended
solids (VSS) of 6.12%. The initial methanogenic activities of the sludge were 7.1 and 8.3
mg CH4-COD/g VSS/day, for hydrogen and acetate as electron donors, respectively. The
initial sulfidogenic activities of the sludge were 87.3 and 521.0 mg H2S-COD/gVSS/day,
for hydrogen and acetate as electron donors, respectively.
2.3.2. Reactors
Continuous flow experiments were performed in two glass reactors. Figure 1.1
presents a schematic drawing of the reactor system consisting of a crystallization reactor
(SCR) and an Expanded Granular Sludge Bed (EGSB) bioreactor (BR). Both reactors
were operated simultaneously during copper removal, while the BR was operated alone
in periods in which copper was not added. The system was located in a climate-controlled
chamber maintained at 30±2˚C. The BR had a working volume of 2.9 L. The reactor
dimensions for the BR were: length to taper 85 cm; length taper 2 cm; length upper part
23 cm; total length of 110 cm; top inner diameter (ID) of 104 mm, and bottom ID of 52
mm. The SCR had a working volume of 0.4 L. The SCR dimensions were: length to
62
taper 58 cm; length taper 1 cm; length upper part 19 cm; total length of 78 cm; top ID of
52 mm, and bottom ID of 20 mm. The initial VSS concentration for the bioreactor was 19
g VSS/L. The CR was filled with different amounts of silica sand, two periods of 75
grams and one period of 100 grams where samples of sand were extracted from the
reactor.
To increase the upflow velocity in the reactors and maintain sludge bed
fluidization, effluent recirculation was applied using a Cole-Parmer Masterflex L/S®
Variable Speed Digital Economy Drive Pump Model 7524-50 equipped with a Cole-
Parmer L/S® Two-Channel Easy-Load® II Pump Head. The recycle rate (i.e., recycling
flow/effluent flow) in both reactors was maintained at a recycle ratio of 15, the recycle
rate was calculated dividing the recycling flow by the effluent flow. The synthetic
wastewater was supplied using the same pump set-up. The pumps were operated with
Cole-Parmer Masterflex C-Flex tubing for the recycle flow and Cole-Parmer Masterflex
Tygon tubing for the medium flow.
Biogas from the reactors was collected and passed through two 2-liter Erlenmeyer
flasks designed to remove H2S and CO2 from the CH4 in the gas stream. The first flask
was empty, preventing any backflow of sodium hydroxide into the reactors, while the
second flask was filled with 1M NaOH, which removed the H2S and CO2. Following the
scrubbing of the biogas, the remaining CH4 gas flow was passed through a wet-type
precision gas meter manufactured by Schlumberger Industries.
Throughout the reactor experiments, a 20% excess of sulfate was added to the
influent so that theoretically, 100% COD removal could be achieved. In addition, excess
63
sulfate was maintained at a COD/sulfate ratio in the influent at a value of approximately
0.56 (g COD/g SO42-). Research has shown that non-limiting sulfate conditions will
favor SRB in competition with methanogens (Lens et al. 1998).
Both reactors were monitored daily for effluent pH, liquid volumetric flow rate,
and gaseous methane flow rate. The system influent and effluent, and effluent of CR
only, were sampled daily or every other day. Influent analyses included: sulfate
concentration, citrate concentration, total copper concentration (when applicable), and
pH. Effluent analyses included: sulfate concentration, sulfide concentration, citrate
concentration, acetate concentration, soluble and total copper concentration (when
applicable) and pH. While effluent from CR analyses included total and soluble copper
concentrations only.
The H2S concentration in the biogas stream was calculated from the H2S
concentration in the liquid assuming equilibrium between the gas and liquid phases. A
dissociation constant of 6.99 was utilized for hydrogen sulfide (Benjamin 2002). A
dimensionless Henry’s factor of 0.36 was also used for the calculations (Metcalf and
Eddy 2003). CO2 concentrations in the biogas were assumed to be 30% of the total
methane flow rate. The amount of undissociated hydrogen sulfide was determined using
the equation:
(2-1)
[ ] [ ]
0
*2
2
α1FH
SHSH+∗
=

64
where:
[H2S]: concentration of undissociated hydrogen sulfide in liquid (mol/L)
[H2S]*: concentration of total sulfur input to the system resulting in hydrogen sulfide
formation (mol/L)
H: Henry’s factor (dimensionless)
F: stripping factor (volume biogas per volume liquid) (dimensionless)
α0: 110
1)( +− apKpH
pKa: dissociation constants of hydrogen sulfide (dimensionless)
The amount of hydrogen sulfide stripped in the biogas was then determined using the
amount of undissociated hydrogen sulfide in the reactor using the following equation:
[ ] [ ] FHSHSH 2gas2 ∗∗=
where:
[H2S]gas: amount of hydrogen sulfide stripped per liquid volume (mol/L liquid)
Mass balances in sand were performed after each period. By calculating the total
copper fed to the system and using the removal efficiency for the crystallization reactor,
an approximate of the copper deposited in the sand is calculated. This value is then
compared to the dry sand mass weight before and after each period.
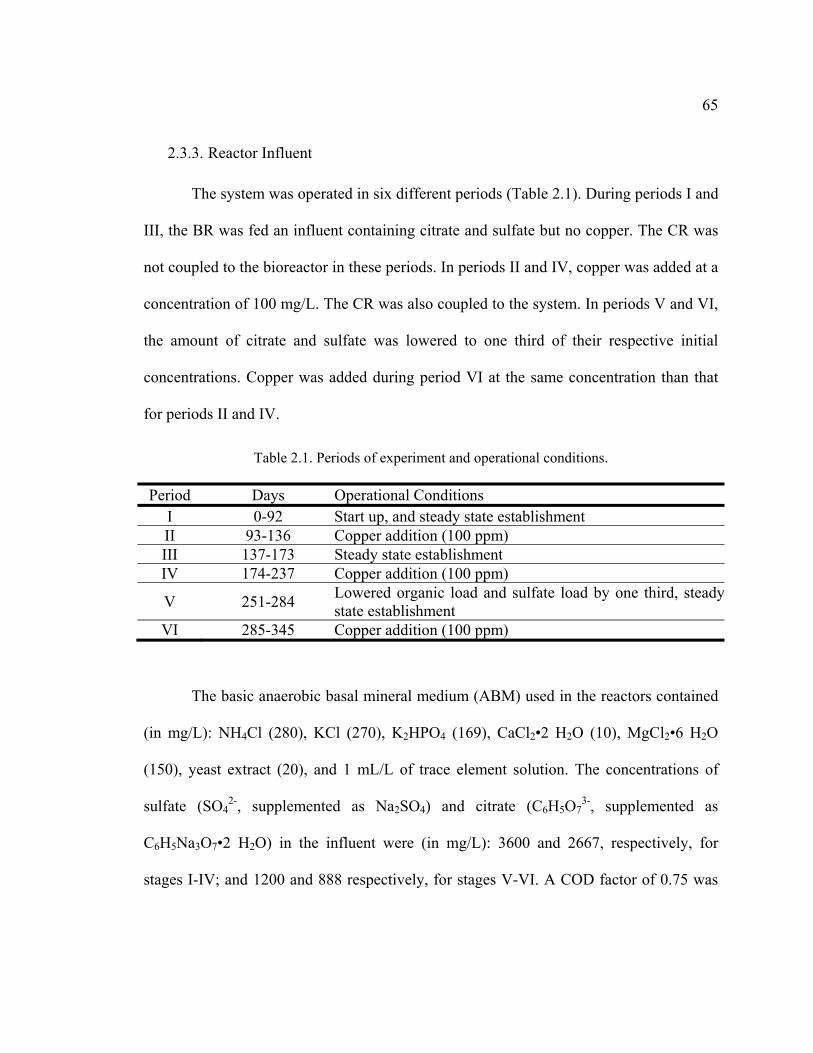
65
2.3.3. Reactor Influent
The system was operated in six different periods (Table 2.1). During periods I and
III, the BR was fed an influent containing citrate and sulfate but no copper. The CR was
not coupled to the bioreactor in these periods. In periods II and IV, copper was added at a
concentration of 100 mg/L. The CR was also coupled to the system. In periods V and VI,
the amount of citrate and sulfate was lowered to one third of their respective initial
concentrations. Copper was added during period VI at the same concentration than that
for periods II and IV.
Table 2.1. Periods of experiment and operational conditions.
Period Days Operational Conditions I 0-92 Start up, and steady state establishment II 93-136 Copper addition (100 ppm) III 137-173 Steady state establishment IV 174-237 Copper addition (100 ppm)
V 251-284 Lowered organic load and sulfate load by one third, steadystate establishment
VI 285-345 Copper addition (100 ppm)
The basic anaerobic basal mineral medium (ABM) used in the reactors contained
(in mg/L): NH4Cl (280), KCl (270), K2HPO4 (169), CaCl2•2 H2O (10), MgCl2•6 H2O
(150), yeast extract (20), and 1 mL/L of trace element solution. The concentrations of
sulfate (SO42-, supplemented as Na2SO4) and citrate (C6H5O7
3-, supplemented as
C6H5Na3O7•2 H2O) in the influent were (in mg/L): 3600 and 2667, respectively, for
stages I-IV; and 1200 and 888 respectively, for stages V-VI. A COD factor of 0.75 was
66
used for citric acid. The concentration of copper (II) added in the stages II, IV and VI was
100 mg/L. Divalent copper was supplemented as CuCl2 • 2 H2O.
The trace element solution contained (in mg/L): H3BO3 (50), FeCl2•4 H2O (2000),
ZnCl2 (50), MnCl2•4H2O (50), (NH4)6Mo7O24•4H2O (50), AlCl3•6 H2O (90), CoCl2•6
H2O (2000), NiCl2•6 H2O (50), CuCl2•2 H2O (30), NaSeO3•5 H2O (100), EDTA (1000),
Resazurin (200) and 36% HCl (1 mL/L). The initial pH of the reactor medium was not
adjusted further, and the typical value ranged between 7.7 and 8.0.
The pH in the reactor effluent was maintained between 7.5 and 8.0 by adjusting
the influent bicarbonate (NaHCO3) concentration. The purpose of maintaining high pH
values was to prevent toxicity issues with sulfides by lowering the concentration of
undissociated H2S. The main toxicity component in sulfate reducing bioreactors occurs
from undissociated hydrogen sulfide, which increases as pH decreases (Lens et al. 2003;
Oude Elferink et al. 1994). The NaHCO3 concentration was adjusted as needed and
ranged between 6 g/L (initial value) and 9 g/L; but for the majority of reactor operation,
the concentration was maintained at 9 g/L.
2.3.4. Activity Assays
All activity assays were incubated in a climate-controlled chamber at 30±2˚C in
an orbital shaker (75 rpm). Methanogenic bioassays and sulfidogenic bioassays were
conducted in triplicate. Activity assays were conducted after reactor initiation (Day 44).

67
2.3.4.1. Methanogenic Activity Assay
Maximum specific methanogenic activity measurements were performed in 120
mL serum flasks sealed with butyl rubber septa using hydrogen or acetate as electron
donor. Anaerobic sludge (1.5 g VSS/L) was transferred to serum flasks containing 30
mL of basal medium. When hydrogen was used as the electron donor, serum flasks were
flushed with H2/CO2 (80/20, v/v) for 5 min and then incubated at 30±2˚C. On the
following day, the headspace was flushed with H2/CO2 (80/20, v/v) and the flasks were
incubated for 1 hour, prior to the determination of the methane production rate.
When acetate was used as the electron donor, sodium acetate (C2H3NaO2) was
added to the medium with a final concentration of 3.4 g COD/L. Serum flasks were then
flushed with N2/CO2 (80/20, v/v) for 5 min and then incubated at 30±2˚C. On the
following day, the headspace was flushed with N2/CO2 (80/20, v/v) and the flasks were
incubated for 1 hour, prior to the determination of the methane production rate.
Following incubation, the methane content in the headspace of each flask was
determined at equal intervals of 8 hours during 4 days. The maximum specific
methanogenic activities were calculated from the slope of the cumulative methane
production (mL) versus time (days) and the biomass concentration at the end of the
assays, as the mean value of triplicate assays.
The anaerobic basal mineral medium (pH 7.2) used in methanogenic bioassays
contained (in mg/L): NH4Cl (280), NaHCO3 (5000), K2HPO4 (250), CaCl2•2 H2O (10),
68
MgCl2•6 H2O (100), MgSO4•7 H2O (100); yeast extract (100), and 1 mL/L of trace
element solution.
2.3.4.2. Sulfidogenic Activity Assay
Maximum specific sulfidogenic activity measurements were performed in 333 mL
serum flasks sealed with butyl rubber septa using hydrogen or acetate as electron donor.
Anaerobic sludge (1.5 g VSS/L) was transferred to serum flasks containing 85 mL of
basal medium. The compound 2-bromoethane sulfonate was added to inhibit
methanogenic activity during sulfidogenic activity test. When hydrogen was used as the
electron donor, serum flasks were flushed with H2/CO2 (80/20, v/v) for 5 min and then
incubated at 30±2˚C. On the following day, the headspace was flushed with H2/CO2
(80/20, v/v) and the flasks were incubated for 1 hour, prior to the determination of the
sulfide production rate.
When acetate was used as the electron donor, sodium acetate (C2H3NaO2) was
added to the medium with a final concentration of 3.4 g COD/L. Serum flasks were then
flushed with N2/CO2 (80/20, v/v) for 5 minutes and then incubated at 30±2˚C. On the
following day, the headspace was flushed with N2/CO2 (80/20, v/v) and the flasks were
incubated for 1 hour, prior to the determination of the sulfide production rate.
Following incubation, the fluid sulfide concentrations in each flask were
determined at periodic intervals (2 hours) during the subsequent 28 hours. The maximum
specific sulfidogenic activities were calculated from the slope of the cumulative sulfate
69
reduction (mg) versus time (days) and the biomass concentration at the end of the assays,
as the mean value of triplicate assays.
The anaerobic basal medium (pH 7.2) utilized in the sulfate reducing bioassays
consisted of (in mg/L): NH4Cl (280), NaHCO3 (4000), K2HPO4 (600), NaH2PO4•2 H2O
(796), CaCl2•2 H2O (10), MgCl2•6 H2O (83), Na2SO4 (5920), yeast extract (20), and 1
mL/L of trace element solution. The basal medium was also supplied with the specific
methanogenic inhibitor, 2-bromoethane sulfonate (6330 mg/L), to avoid substrate
utilization by methanogens.
2.3.5. Analytical Methods
The acetate concentration in liquid samples from the reactor and methane
concentration from the headspace for the batch bioassays were determined by gas
chromatography using an HP5290 Series II system (Agilent Technologies, Palo Alto,
CA) equipped with a flame ionization detector (GC-FID). The GC was fitted with a
Nukol fused silica capillary column (30 m length x 0.53 mm ID, Supelco, St. Louis,
MO). The carrier gas was helium at a flow rate of 11 mL/min and a split flow of
84 mL/min. For acetate measurements the temperatures of the column, the injector port
and the detector were 140, 180 and 275°C, respectively. For methane the temperatures of
the column, injector port, and the detector were 140, 180, and 250°C, respectively.
Samples for measuring methane content (100 μL) in the headspace were collected using a
pressure-lock gas syringe.
70
Sulfide was fixed by the addition of zinc acetate and then analyzed
colorimetrically by the methylene blue method (Truper and Schlegel 1964). COD was
determined by oxidation with dichromate and analyzed using the colorimetric micro-
method described in Standard Methods for Examination of Water and Wastewater
(APHA 2005). Due to the high affinity of sulfide to form metal sulfides with low
solubility in water, minimal modifications were done to this method to avoid these
precipitates. Avoidance of precipitates at the end of the digestion was achieved by
agitating the samples manually every 20 min. Digestions were carried out at temperatures
of 150oC for 2 to 3 hours; however, higher times were considered if precipitate was still
present. Volatile suspended solids were determined according to Standard Methods for
Examination of Water and Wastewater (APHA 2005). Sulfate and citrate were
determined by ion chromatography with suppressed conductivity using a DIONEX
system equipped with a Dionex AS11-HC4 column (Dionex, Sunnydale, CA) and a
conductivity detector. The mobile phase had a gradient of 0.67 mM KOH/min going
from 20 mM to 30 mM at a flow rate of 1.2 mL/min. The column was maintained at room
temperature. The injection volume was 25 μl. The pH was determined immediately after
sampling with an Orion model 310 PerpHecT pH-meter with a PerpHecT ROSS glass
combination electrode.
Samples collected for copper analysis were acidified and diluted (5 μg/L to 5
mg/L) with 10% nitric acid and stored in polyethylene containers to prevent metal
precipitation and absorption to surfaces. Samples collected for soluble copper
concentrations were membrane filtered (0.45 μm), while samples collected for total

71
copper content were not membrane filtered. Metal extraction was performed on the total
copper samples using the microwave assisted digestion method described in Standard
Methods for Examination of Water and Wastewater (APHA 2005). Metal extraction was
conducted in a microwave digestion system (MDS2100, CEM Corporation, Matthews,
NC).
The concentration of copper in liquid samples was determined using an ASX500
autosampler (CETAC Technologies, Omaha, NE) and an Agilent 7500a ICP-MS. The
analytical system was operated at an Rf power of 1500 watts, a plasma gas flow of 15
L/min and a carrier gas flow of 1.2 L/min. The acquisition parameters used were: copper
measured at m/z 65; 3 points per peak; 1.5 s dwell time; number of repetitions = 7.
2.3.6. Sand Characterization
Sand particles characteristics were analyzed using Scanning Electron Microscopy
(SEM) and Energy Dispersive Spectroscopy (EDS), and X-ray diffraction techniques.
Sand samples collected from the CR were allowed to air dry prior to analysis, and then
they were examined using a variable pressure SEM (Hitachi S-2460N). Compositional
data were obtained using a Thermo-Noran EDS detector. No coating of the sand was
done. X-ray diffraction (XRD) analysis was achieved with a Scintag XDS 2000 model
XRD operated at 10 - 70° at 2θ, a continuous scan rate of 2°C/min, 40mM, 40kV. Peaks
were analyzed with ICDD (International Center for Diffraction Data) cards.
72
2.3.7. Chemicals
All chemicals used were reagent grade or better. Sodium citrate tribasic,
dihydrate (CAS 68-04-2; >99%), cupric chloride dihydrate (CAS 7447-39-4; 99.8%),
sodium sulfate (CAS 7757-82-6; 99%+) and sand (white quartz, 50-70 mesh; CAS
14808-60-7) were obtained from Sigma-Aldrich Corp. (St. Louis, MO, USA).
2.4. Results
The feasibility of the coupled sulfate reducing bioreactor-crystallization reactor
system to simultaneously remove organic contaminants and heavy metals was studied
during this experiment. Divalent Copper was used as a model for heavy metal. An
influent containing sulfate and citrate as an organic contaminant was fed to the system.
Citrate was chosen as the model for organic contaminants in this experiment due to its
importance as a component of the Chemical Mechanical Planarization process (CMP)
wastewaters. These wastewaters also contain high concentrations of copper. During three
different periods copper was also fed to the system. It was during these periods that the
crystallization reactor was coupled to the bioreactor. Inside the crystallization reactor the
influent of the system and the recirculate from the bioreactor were mixed.
The experiment consisted of 6 different periods (Table 2.1). During periods I-IV
the theoretical volumetric loads of COD and sulfate were 6.06 g COD/Lreactor/day and
10.9 g SO42-/Lreactor/day, respectively. For periods V and VI the volumetric load rates of
both COD and sulfate were lowered to one third of the original values, resulting in
73
theoretical values 2.03 g COD/Lreactor/day and 3.63 g SO42-/Lreactor/day, for COD and
sulfate respectively. The concentration of copper was the same for the three different
periods with a value of 100 mg/L. Measured values of COD, SO42-, and copper
volumetric load rates are presented in Tables 2.2-2.4.
2.4.1. Reactor Performance
The performance of the BR-CR system is presented in Figures 2.1-2.10, and
Tables 2.2-2.4. The results are presented in six different periods; the days of each period
are presented in Table 2.1. Since biogas production was always very low, results for the
volatilization of H2S in the biogas are considered negligible and are not presented. For
periods were copper was added to the influent, the results (efficiencies, effluent
concentrations) are presented for the CR, the BR, and the total system (CR and BR
added).
2.4.1.1. Period I
Start up of the reactor and steady state establishment occurred during period I.
During this period the Hydraulic Retention Time (HRT) was of 0.33 days. The Organic
Loading Rate (OLR) and Sulfate Loading Rate (SLR) averaged 5.96 ± 0.12 g
COD/Lreactor/day and 11.76 ± 1.44 g SO42-/Lreactor/day, respectively.

74
Sulfate reduction outcompeted methanogenesis, barely leaving substrate for
methane generation. Sulfide in the effluent accounted for 98.7% of the COD fed to the
reactor, while methane accounted for nearly 0.2% of the COD. Acetate, a biodegradation
product of citrate, was detected in the effluent at very low concentrations (29.3 ± 26.4
mg/L) that accounted for 1.5% of the initial COD (Figure 2.7 and Table 2.1). Sulfide
concentration in the effluent as a function of time is shown in Figure 2.1. Sulfide reached
fairly high concentrations that averaged levels of 980 ± 72 mg S2-/L (Table 2.4). The
sulfur balance for the system during this period showed very good consistency (Table
2.4). The pH during this period varied between 7.4-8.2, some measurements reached
values of 8.4, but this could be mainly to sampling errors (Figure 2.5).
2.4.1.2. Period II
During period II, the crystallization reactor was coupled to the bioreactor and
copper removal efficiency was studied. The crystallization reactor was filled with silica
sand. The HRT averaged 0.34 days, with a period of 20 days with and average of 0.75
days due to vacation break. The mean OLR was 6.00 ± 0.08 g COD/Lreactor/day, and the
SLR averaged 13.68 ± 1.65 g SO42-/Lreactor/day for the HRT of 0.34 days. The mean OLR
was g COD/Lreactor/day, and the SLR averaged 6.85 ± 0.95 g SO42-/Lreactor/day for the
HRT of 0.75 days.
During this period, sulfate reduction did not seem to be affected by the presence
of copper and accounted for nearly 97.4% of COD degradation. Methane production
75
accounted for only 0.01% of COD removal (Figure 2.6). Citric acid was not detected in
the effluent so the degradation was of more then 99.9 %. The residual concentration of
acetate remained fairly constant compared to period I and averaged 0.098 ± 0.069 g
COD/Lreactor/day, equivalent to nearly 1.62 % of COD fed. Sulfide concentration in the
effluent was lowered due to the precipitation of sulfur as copper sulfide and averaged 927
± 69 mg S2-/L. The sulfur balance shows that approximately 42.9 ± 3.3 mg/L of sulfide
were precipitated in the crystallization reactor. The pH during this period ranged between
values of 7.4 and 8.2 with some values reaching values of 8.4, but these values are mainly
due to sampling and measurement errors.
Copper had an average value in the influent of 83.39 ± 7.83 mg/L (Figure 2.8).
The crystallization reactor had removal efficiencies of 99.96% and 102.29% for soluble
and total copper, respectively. Effluent concentrations from the crystallization reactor
averaged values of 80 ± 74 μg/L for soluble copper, and 393 ± 179 μg/L for total copper
(Table 2.5). Removal efficiencies for soluble and total copper observed in the bioreactor
were –0.06% and –2.95% respectively, indicating that resolubilization of copper occurred
in the bioreactor. The removal efficiency for the total system was 99.9 ± 0.06% for
soluble copper and 99.34 ± 0.65% for total copper. The system effluent concentrations of
soluble and total copper were 84 ± 47 and 552 ± 542 μg/L, respectively (Table 2.5). A
mass balance for the copper removed was performed after treatment. Initial and final
mass of sand were measured and compared to the removal of copper measured in
crystallization reactor. The results showed that the sand mass increased by 23.88 grams.
The copper removed by the crystallization reactor, expressed as copper sulfide, would
76
have a mass of 26.38 grams, which is in close agreement with the mass balance (Table
2.6).
2.4.1.3. Period III
Period III served to establish new steady state conditions. Copper was removed
from the influent and only sulfate and citrate were fed to the reactor. The crystallization
reactor was also decoupled from the system, so only the bioreactor worked during these
days. The HRT during this period averaged 0.34 days. The OLR was of 6.06 ± 0.06 g
COD/Lreactor/day, and the SLR was of 10.8 ± 1.92 g SO42-/Lreactor/day.
After the steady state establishment, COD removal due to sulfate reduction
suffered a rather small decrease in performance. In period III, sulfate reduction counted
for only 94.9% of substrate degradation compared to 97.4% in the previous period.
Sulfide concentration in the effluent had an average value of 950.4 ± 95.7 mg S2-/L
(Figure 2.1). In this period, reactivation of methanogenesis was observed, however
formation of methane was still extremely low. A steadily increase in methane generation
occurred during the first 20 days of period III, reaching its maximum in day 169 (Figure
2.4). The average methane production was of 0.014 ± 0.024 g COD/Lreactor/day, which
accounted for nearly 0.2 % of the initial COD. This level is comparable with the methane
production obtained in period I (Table 2.3). The residual concentration of acetate in the
effluent reached a maximum during this period. Levels of nearly 100 mg/L were
observed between days 165-169 (Figure 2.3). Typical values for the previous periods
77
were in the range of 10 to 40 mg/L. One explanation for this behavior could be errors in
storage and conservation of samples. The average acetate concentration was 0.16 ± 0.10 g
COD/Lreactor/day. This value accounted for nearly 2.6 % of the initial COD (Table 2.3).
During this period the pH varied from 7.44 to 8.10 (Figure 2.5).
2.4.1.4. Period IV
Copper removal efficiency and the capacity of sand to retain CuS were studied
during period IV. In this period the amount of total copper treated in the system was
39.42 grams of copper while in period II was 17.54 grams. The HRT averaged a value of
0.34 days. The OLR had an average value of 6.04 ± 0.06 g COD/Lreactor/day. Sulfate was
fed at a rate of 9.66 ± 1.41 g SO42-/Lreactor/day.
In period IV, only 82.8 % of the initial substrate was converted to sulfide. Sulfide
concentration in the effluent averaged 789 ± 119 mg/L, the lowest for this SLR (Figure
2.1). However this value seem to correlate very well with the removal of sulfate
measured, so measurement errors do not appear to be an issue (Table 2.4). Even though
sulfate reduction was lowered during this period, methanogenesis did not seem to be
affected by the presence of copper. The production rate for methane averaged 0.018 ±
0.048 g COD/Lreactor/day, with almost no change compared to the previous period, this
counts for 0.3% of the initial substrate. The concentration of acetate in the effluent was
also lower for this period than for the other previous three, and average 1.02% of the
influent COD. The average acetate remaining concentration in the effluent was 18.9 ±
78
14.6 mg/L, which is the lowest for this OLR. Citrate was not observed during
measurements in the effluent. During this period the pH of the effluent varied between
values of 7.5 and 8.2.
The average copper (II) concentration fed to the system was 78.84 ± 8.86 mg/L.
The crystallization reactor had removal efficiencies in period IV of 100.57% for soluble
copper and 80.66% for total copper. Effluent concentrations from the crystallization
reactor averaged values of 59 ± 28 μg/L, and 1798 ± 773 μg/L for soluble and total
copper, respectively (Table 2.5). Removal efficiencies for soluble and total copper
observed in the bioreactor were –0.69% and 19.61% respectively. The average removal
efficiencies in the system for soluble and total copper were of 99.88 ± 0.09% and 98.95 ±
0.51%, respectively. The average system effluent concentration for soluble copper was of
93 ± 73 μg/L. The total copper concentration in the effluent of the system had a mean
value of 769 ± 373 μg/L (Table 2.5). A final mass balance was performed to the sand.
The difference in mass for the sand was of 51.23 grams. According to the estimation
made for the copper removed in the crystallization reactor, the amount of copper sulfide
generated should have been of 47.81 grams (Table 2.6). The exceeding mass could have
been due to trace metals and biomass precipitated or retained in the sand.
2.4.1.5. Period V
After two periods with copper at an OLR of 6.0 g COD/Lreactor/day, it was decided
to decrease the OLR and SLR in order to see the efficiency in copper removal and the
79
ability of sand to retain copper at lower concentrations of sulfide. Period V consisted in
the establishment of steady state at this new operation conditions. The sulfate reducing
bioreactor worked alone in this period. In this stage, the HRT was of 0.33 days. The OLR
was reduced to 1.92 ± 0.04 g COD/Lreactor/day, and the SLR had an average value of 3.66
± 0.30 g SO42-/Lreactor/day.
During this period, sulfate reduction accounted for 95.7% of the total COD
(Figure 2.7). The concentration of sulfide in the effluent averaged 294 ± 43 mg/L (Figure
2.1). As in previous periods, the production rate of methane was very low, averaging
0.015 ± 0.020 g COD/Lreactor/day, which corresponds to 0.412% of the initial COD
(Figure 2.4 and Table 2.3). Acetate could not be detected in the effluent during period V
since its concentration fell below the detection limit (5 mg/L) (Figure 2.3). The effluent
pH ranged from 7.6 to 8.2 (Figure 2.5).
2.4.1.6. Period VI
Removal efficiency of copper at lower sulfide concentrations was studied in
period VI. Also the crystal growth in the sand surface was observed (Table 2.6). The
HRT averaged 0.33 days. The average values for the OLR and the SLR were 1.91 ± 0.02
g COD/Lreactor/day, and 2.91 ± 0.9 g SO42-/Lreactor/day, respectively.
Sulfate reduction accounted for nearly 90.4 % of the influent COD. Sulfide
effluent concentration decreased to a level of 231 ± 56 mg/L. The decrease of 62 mg/L
with respect to the previous period agreed with the sulfide expected to precipitate as

80
copper sulfide (Table 2.4). The production rate of methane accounted for only 0.005 ±
0.007 g COD/Lreactor/day, equivalent to 0.26 % of substrate degradation. Acetate was not
detected in this period. The pH presented a little decrease and ranged between values of
7.8 and 8.0.
The average concentration for copper in the influent was 76.93 ± 17.07 mg/L.
Removal efficiencies for the crystallization reactor in this period averaged 100.22% for
soluble copper and 34.32% for total copper, this is the lower efficiency observed for the
crystallization reactor compared to the two previous periods. Effluent concentrations
from the crystallization reactor averaged values of 45 ± 37 μg/L, and 4765 ± 2543 μg/L
for soluble and total copper, respectively (Table 2.5). Removal efficiencies for soluble
and total copper observed in the bioreactor were –0.29% and 63.20% respectively.
During this period, the system had a removal efficiency of 99.92 ± 0.08%, and 97.52 ±
1.67% for soluble and total copper, respectively. The effluent concentration of soluble
copper was 56 ± 51 μg/L the lower for the three different periods of copper feeding.
However, the total copper concentrations averaged 1773 ± 107 μg/L, which unlike the
soluble copper was the higher value of the three periods of copper treatment. The
difference of mass in the sand before and after treatment was of 44.00 grams. The copper
removed in the crystallization reactor, expressed as copper sulfide, should have a value of
20.28 grams. This disagreement is discussed latter in this document.

81
2.4.2. Sulfidogenic and Methanogenic Activity Assays
Sulfidogenic and methanogenic assays were performed to the anaerobic sludge at
the beginning of the study. Hydrogen and acetate were used as substrate for this assays.
The results obtained are showed in Table 2.2.
Table 2.2. Specific methanogenic and sulfidogenic activities of the anaerobic sludge.
Electron Donor
Methanogenic Activity
(mg CH4-COD/gVSS/day)
Sulfidogenic activity
(mg H2S-COD/gVSS/day)
Acetate 8.3 ± 1.1 520.9 ± 6.8 Hydrogen 7.1 ± 0.4 87.3 ± 25.6
The results show a low methanogenic activity compared to the sulfidogenic
activity. There is no apparent preference for the electron donor in methanogenic activity.
However, for sulfidogenic activity, the sludge seems to have preference for acetate as
substrate instead of hydrogen.
2.4.3. Sand Characterization
The sand in the crystallization reactor was analyzed to study and characterize the
components present on its surface and the chemical form in which they precipitated.
Figure 2.12 shows the scanning electron microscopy (SEM) images with its respective
electron dispersive spectroscopy (EDS) analyses for sand before and after treatment for
period II. The properties of the sand surface can be clearly seen in these two images. The

82
clean sand presents an uneven rough surface, and the EDS analysis clearly shows the
absence of copper and sulfur in the sand. However, after treatment and copper
precipitation the surface presents a smooth coating which according to the EDS analysis
is formed of copper and sulfur (Figure 2.12). To determine the structure of this coating,
the sand obtained from the crystallization reactor was analyzed by X-ray diffraction
(XRD) (Figure 2.13). The XRD results showed that the sand was coated with crystals of a
mineral of divalent copper sulfide called covellite (CuS). To further characterize the
crystal growth on the sand surface, sand samples were collected from the crystallization
reactor in Period VI after 1 day, 2 days, 1 week, and 2 weeks of operation. Figure 2.14
shows that crystal growth is evident after 1 day, and it can be seen that after two weeks
the sand surface is completely coated. Furthermore, it is also clear that crystal growth is
not uniform. During the first day of operation, crystals are only present in certain
nucleation points, at the second day these crystals have grown around these points. The
sand granule appears completely coated after one week of operation.
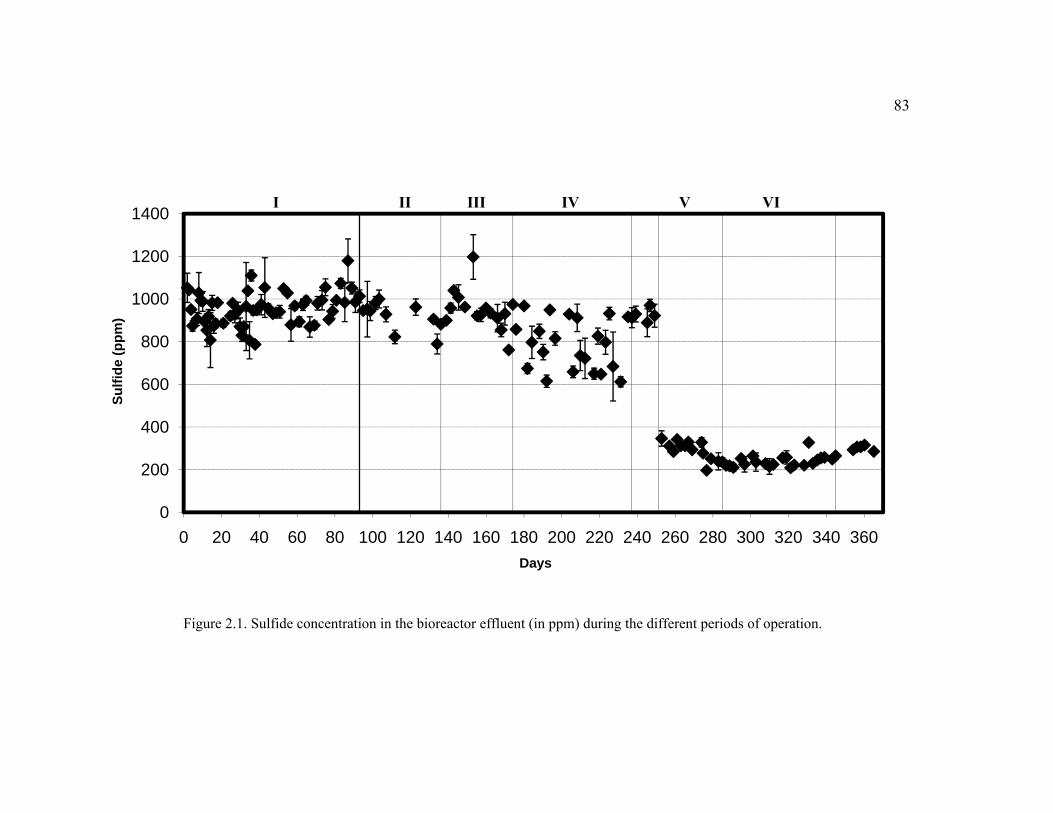
83
Figure 2.1. Sulfide concentration in the bioreactor effluent (in ppm) during the different periods of operation.
0
200
400
600
800
1000
1200
1400
0 20 40 60 80 100 120 140 160 180 200 220 240 260 280 300 320 340 360
Sulfi
de (p
pm)
Days
I II III IV V VI
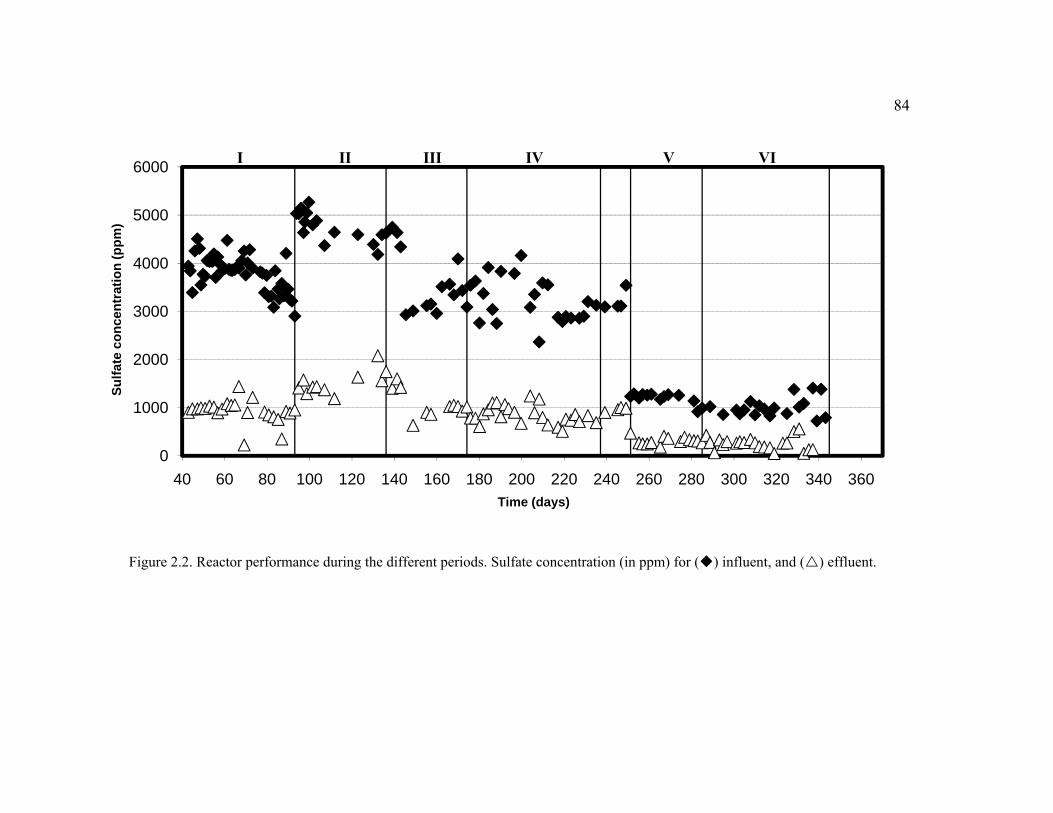
84
Figure 2.2. Reactor performance during the different periods. Sulfate concentration (in ppm) for ( ) influent, and ( ) effluent.
0
1000
2000
3000
4000
5000
6000
40 60 80 100 120 140 160 180 200 220 240 260 280 300 320 340 360
Sulfa
te c
once
ntra
tion
(ppm
)
Time (days)
I II III IV V VI

85
Figure 2.3. Acetate concentration (in ppm) detected in the bioreactor effluent during the various periods of operation.
0
20
40
60
80
100
120
0 20 40 60 80 100 120 140 160 180 200 220 240 260 280 300 320 340 360
Ace
tate
(ppm
)
Time (days)
I II III IV V VI
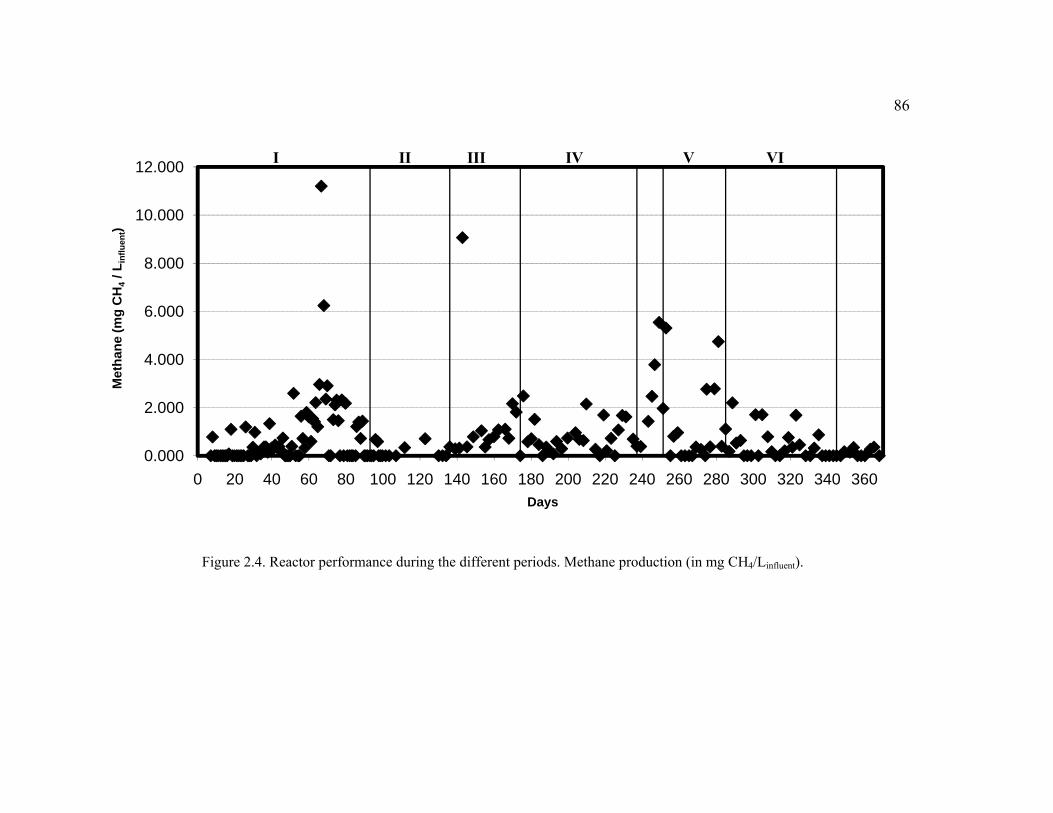
86
Figure 2.4. Reactor performance during the different periods. Methane production (in mg CH4/Linfluent).
0.000
2.000
4.000
6.000
8.000
10.000
12.000
0 20 40 60 80 100 120 140 160 180 200 220 240 260 280 300 320 340 360
Met
hane
(mg
CH
4/ L
influ
ent)
Days
I II III IV V VI
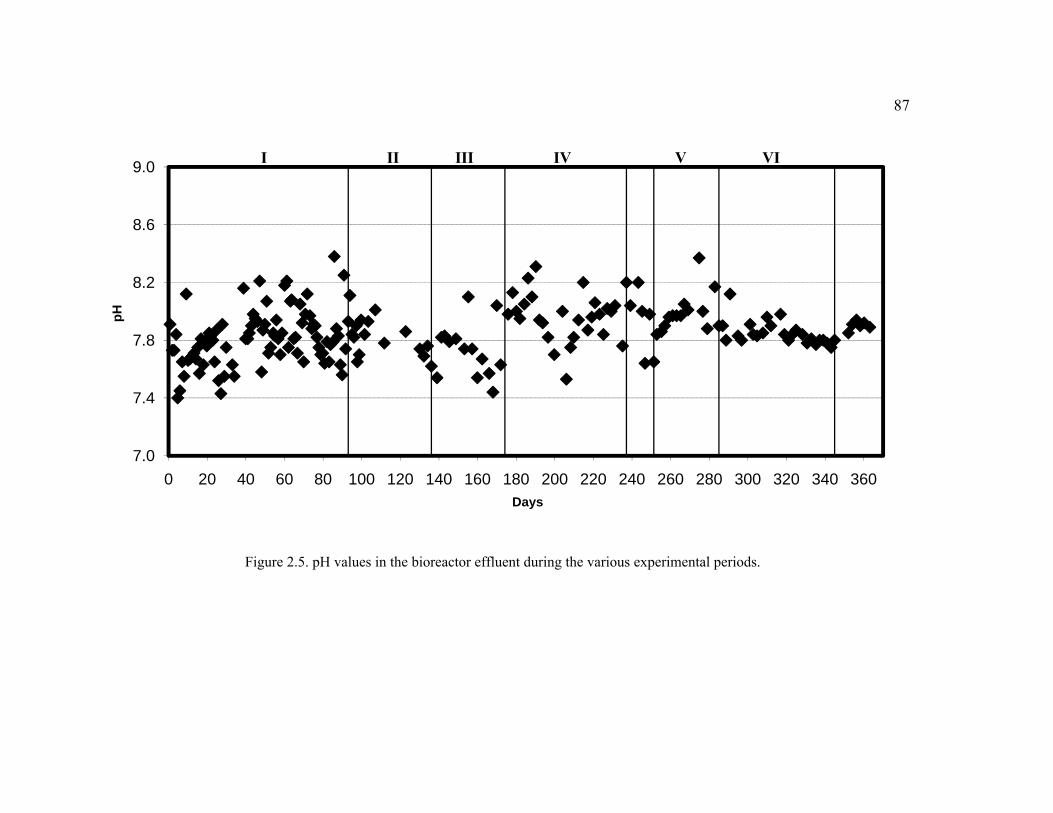
87
Figure 2.5. pH values in the bioreactor effluent during the various experimental periods.
7.0
7.4
7.8
8.2
8.6
9.0
0 20 40 60 80 100 120 140 160 180 200 220 240 260 280 300 320 340 360
pH
Days
I II III IV V VI
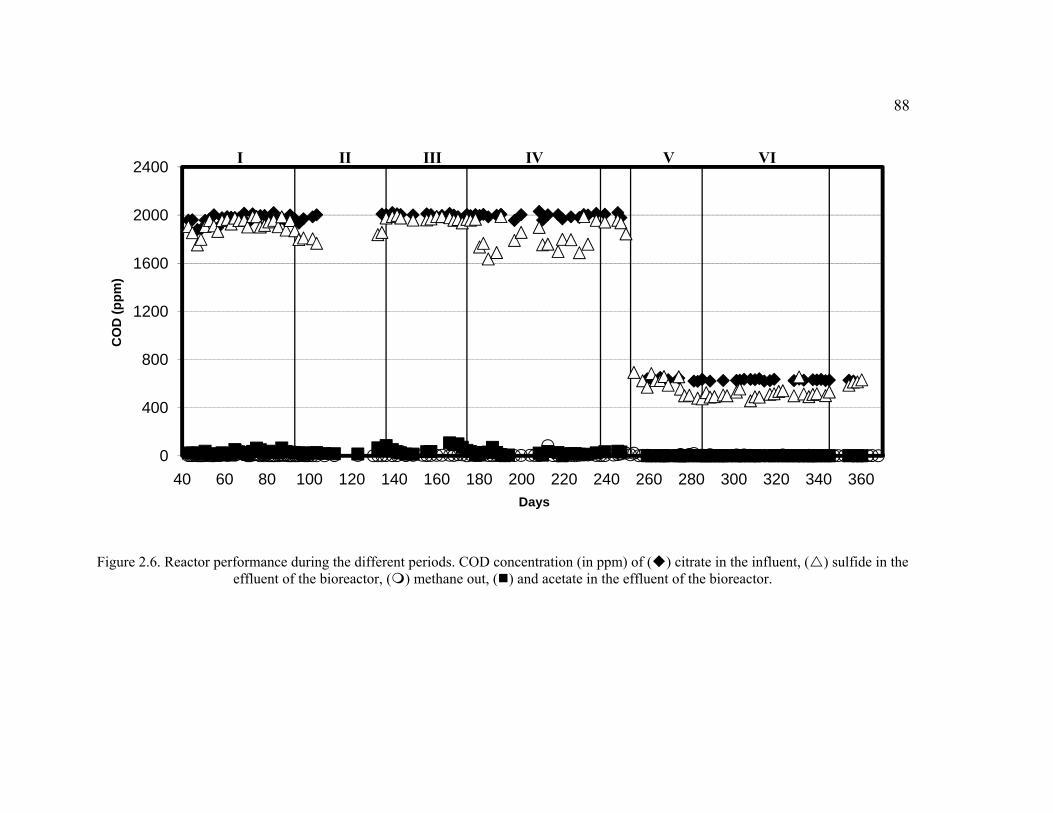
88
Figure 2.6. Reactor performance during the different periods. COD concentration (in ppm) of ( ) citrate in the influent, ( ) sulfide in the effluent of the bioreactor, ( ) methane out, ( ) and acetate in the effluent of the bioreactor.
0
400
800
1200
1600
2000
2400
40 60 80 100 120 140 160 180 200 220 240 260 280 300 320 340 360
CO
D (p
pm)
Days
I II III IV V VI

89
Figure 2.7. Reactor performance during the different periods. Conversion of the influent COD to: ( ) sulfide, ( ) residual acetate, ( ) and methane.
0
20
40
60
80
100
120
40 60 80 100 120 140 160 180 200 220 240 260 280 300 320 340 360
(%) o
f tot
al C
OD
in in
fluen
t
Time (days)
I II III IV V VI
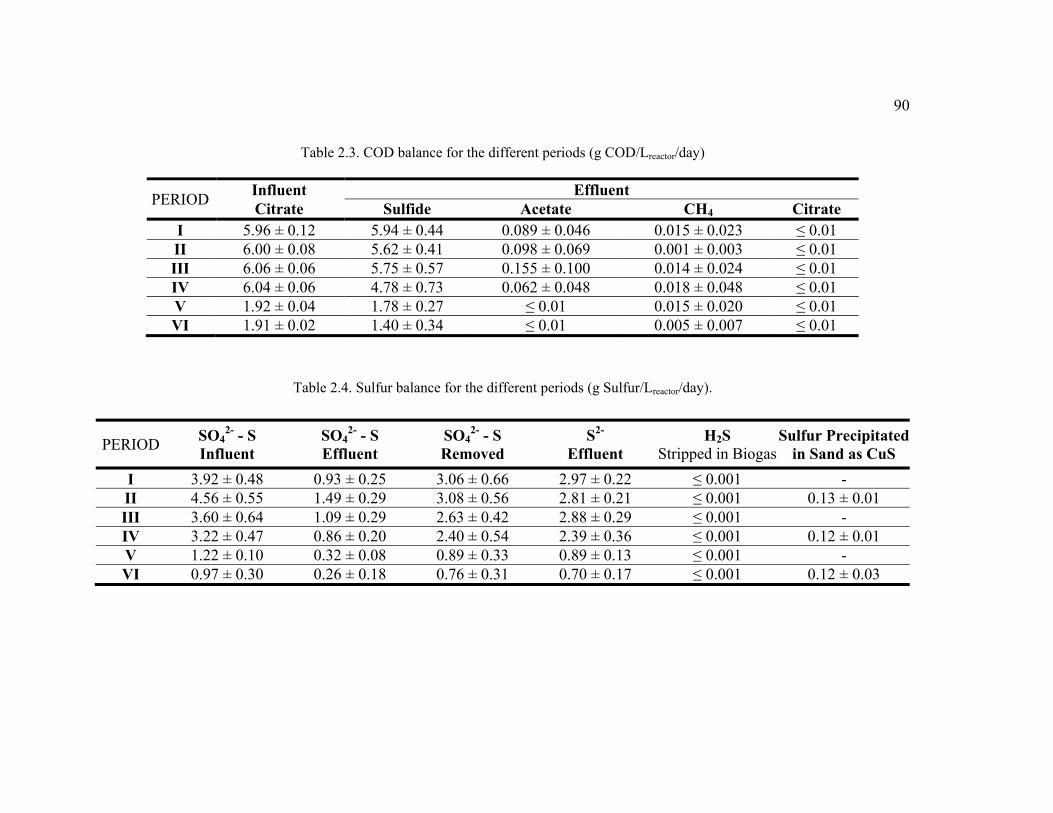
90
Table 2.3. COD balance for the different periods (g COD/Lreactor/day)
PERIOD Influent Effluent Citrate Sulfide Acetate CH4 Citrate
I 5.96 ± 0.12 5.94 ± 0.44 0.089 ± 0.046 0.015 ± 0.023 ≤ 0.01 II 6.00 ± 0.08 5.62 ± 0.41 0.098 ± 0.069 0.001 ± 0.003 ≤ 0.01 III 6.06 ± 0.06 5.75 ± 0.57 0.155 ± 0.100 0.014 ± 0.024 ≤ 0.01 IV 6.04 ± 0.06 4.78 ± 0.73 0.062 ± 0.048 0.018 ± 0.048 ≤ 0.01 V 1.92 ± 0.04 1.78 ± 0.27 ≤ 0.01 0.015 ± 0.020 ≤ 0.01 VI 1.91 ± 0.02 1.40 ± 0.34 ≤ 0.01 0.005 ± 0.007 ≤ 0.01
Table 2.4. Sulfur balance for the different periods (g Sulfur/Lreactor/day).
PERIOD SO42- - S
Influent SO4
2- - S Effluent
SO42- - S
Removed S2-
Effluent H2S
Stripped in BiogasSulfur Precipitated
in Sand as CuS I 3.92 ± 0.48 0.93 ± 0.25 3.06 ± 0.66 2.97 ± 0.22 ≤ 0.001 - II 4.56 ± 0.55 1.49 ± 0.29 3.08 ± 0.56 2.81 ± 0.21 ≤ 0.001 0.13 ± 0.01 III 3.60 ± 0.64 1.09 ± 0.29 2.63 ± 0.42 2.88 ± 0.29 ≤ 0.001 - IV 3.22 ± 0.47 0.86 ± 0.20 2.40 ± 0.54 2.39 ± 0.36 ≤ 0.001 0.12 ± 0.01 V 1.22 ± 0.10 0.32 ± 0.08 0.89 ± 0.33 0.89 ± 0.13 ≤ 0.001 - VI 0.97 ± 0.30 0.26 ± 0.18 0.76 ± 0.31 0.70 ± 0.17 ≤ 0.001 0.12 ± 0.03

91
Figure 2.8. System performance for the different periods. ( ) Total copper concentration influent, ( ) soluble copper concentration effluent.
0
10000
20000
30000
40000
50000
60000
70000
80000
90000
100000
40 60 80 100 120 140 160 180 200 220 240 260 280 300 320 340 360
Cop
per (
ppb)
Time (days)
I II III IV V VI
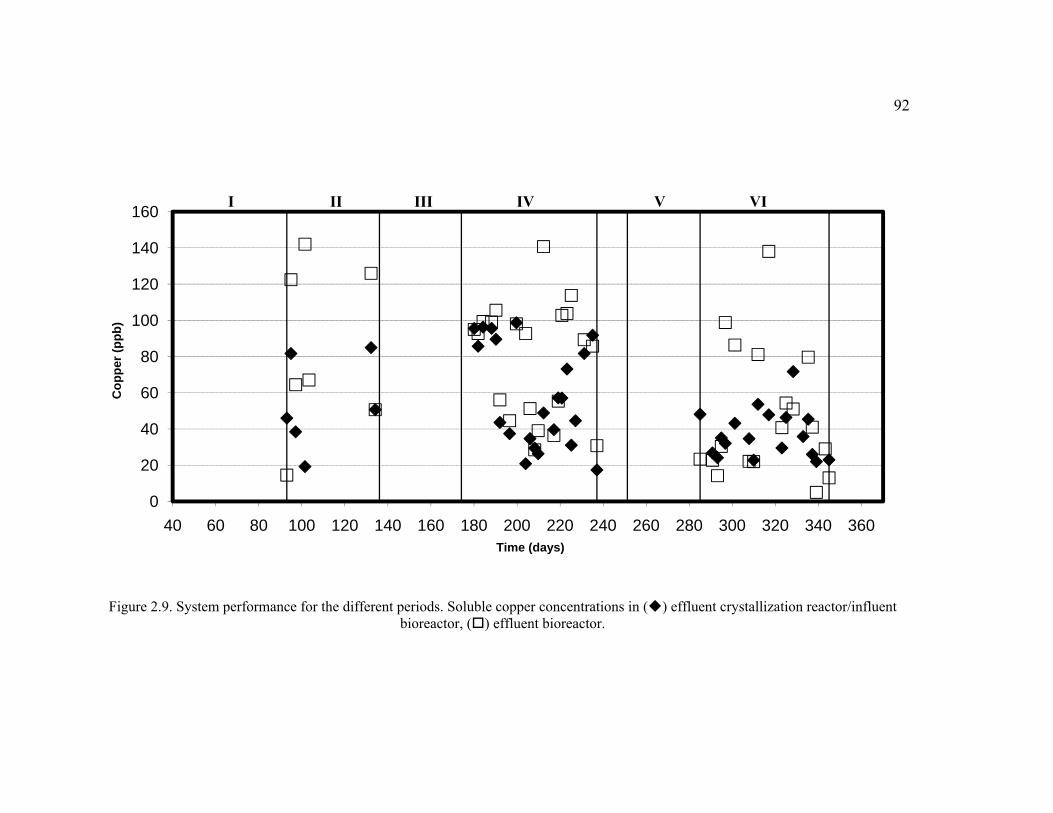
92
Figure 2.9. System performance for the different periods. Soluble copper concentrations in ( ) effluent crystallization reactor/influent bioreactor, ( ) effluent bioreactor.
0
20
40
60
80
100
120
140
160
40 60 80 100 120 140 160 180 200 220 240 260 280 300 320 340 360
Cop
per (
ppb)
Time (days)
I II III IV V VI
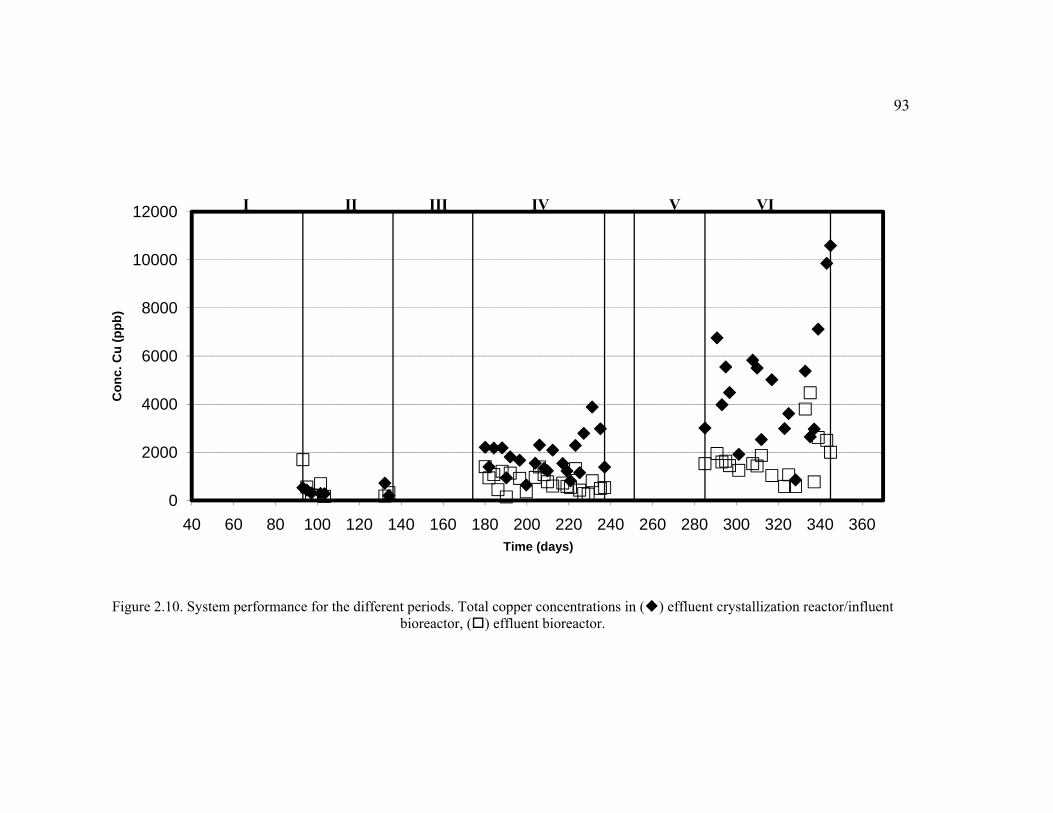
93
Figure 2.10. System performance for the different periods. Total copper concentrations in ( ) effluent crystallization reactor/influent bioreactor, ( ) effluent bioreactor.
0
2000
4000
6000
8000
10000
12000
40 60 80 100 120 140 160 180 200 220 240 260 280 300 320 340 360
Con
c. C
u (p
pb)
Time (days)
I II III IV V VI
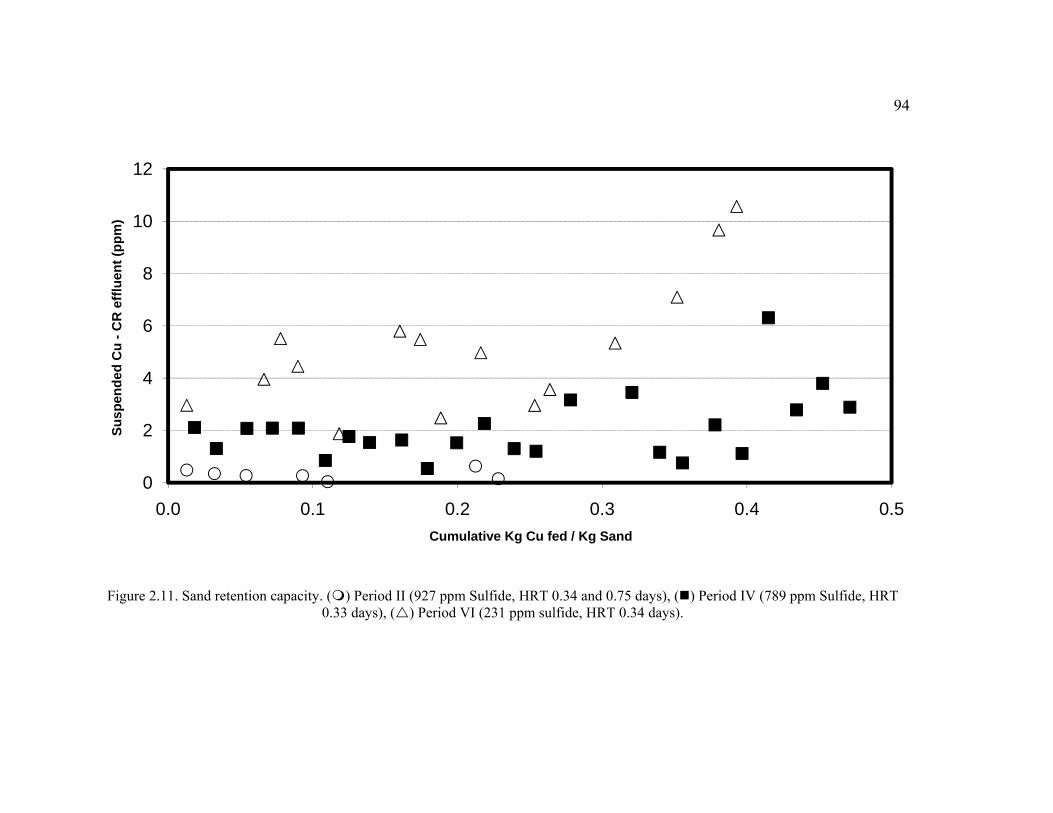
94
Figure 2.11. Sand retention capacity. ( ) Period II (927 ppm Sulfide, HRT 0.34 and 0.75 days), ( ) Period IV (789 ppm Sulfide, HRT 0.33 days), ( ) Period VI (231 ppm sulfide, HRT 0.34 days).
0
2
4
6
8
10
12
0.0 0.1 0.2 0.3 0.4 0.5
Susp
ende
d C
u -C
R e
fflue
nt (p
pm)
Cumulative Kg Cu fed / Kg Sand
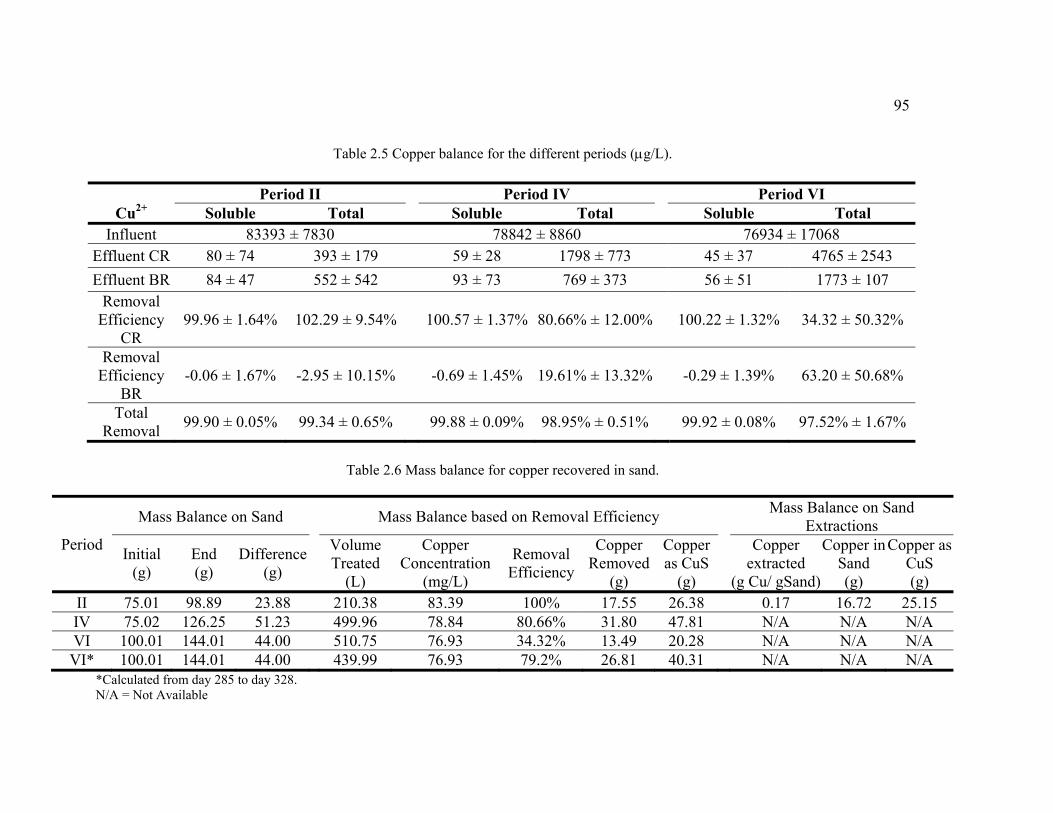
95
Table 2.5 Copper balance for the different periods (μg/L).
Table 2.6 Mass balance for copper recovered in sand.
Period
Mass Balance on Sand Mass Balance based on Removal Efficiency Mass Balance on Sand Extractions
Initial (g)
End (g)
Difference (g)
Volume Treated
(L)
Copper Concentration
(mg/L)
Removal Efficiency
Copper Removed
(g)
Copper as CuS
(g)
Copper extracted
(g Cu/ gSand)
Copper in Sand (g)
Copper as CuS (g)
II 75.01 98.89 23.88 210.38 83.39 100% 17.55 26.38 0.17 16.72 25.15 IV 75.02 126.25 51.23 499.96 78.84 80.66% 31.80 47.81 N/A N/A N/A VI 100.01 144.01 44.00 510.75 76.93 34.32% 13.49 20.28 N/A N/A N/A VI* 100.01 144.01 44.00 439.99 76.93 79.2% 26.81 40.31 N/A N/A N/A
*Calculated from day 285 to day 328. N/A = Not Available
Period II Period IV Period VI Cu2+ Soluble Total Soluble Total Soluble Total
Influent 83393 ± 7830 78842 ± 8860 76934 ± 17068 Effluent CR 80 ± 74 393 ± 179 59 ± 28 1798 ± 773 45 ± 37 4765 ± 2543 Effluent BR 84 ± 47 552 ± 542 93 ± 73 769 ± 373 56 ± 51 1773 ± 107
Removal Efficiency
CR 99.96 ± 1.64% 102.29 ± 9.54% 100.57 ± 1.37% 80.66% ± 12.00% 100.22 ± 1.32% 34.32 ± 50.32%
Removal Efficiency
BR -0.06 ± 1.67% -2.95 ± 10.15% -0.69 ± 1.45% 19.61% ± 13.32% -0.29 ± 1.39% 63.20 ± 50.68%
Total Removal 99.90 ± 0.05% 99.34 ± 0.65% 99.88 ± 0.09% 98.95% ± 0.51% 99.92 ± 0.08% 97.52% ± 1.67%
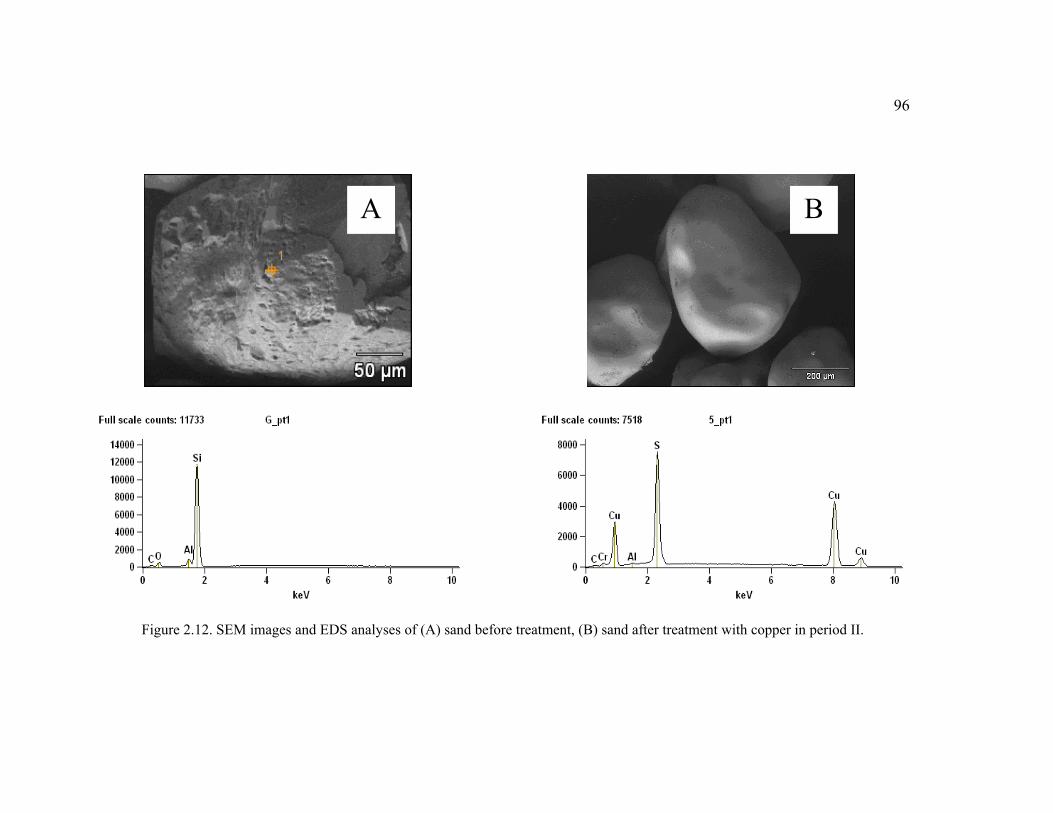
96
Figure 2.12. SEM images and EDS analyses of (A) sand before treatment, (B) sand after treatment with copper in period II.
A B
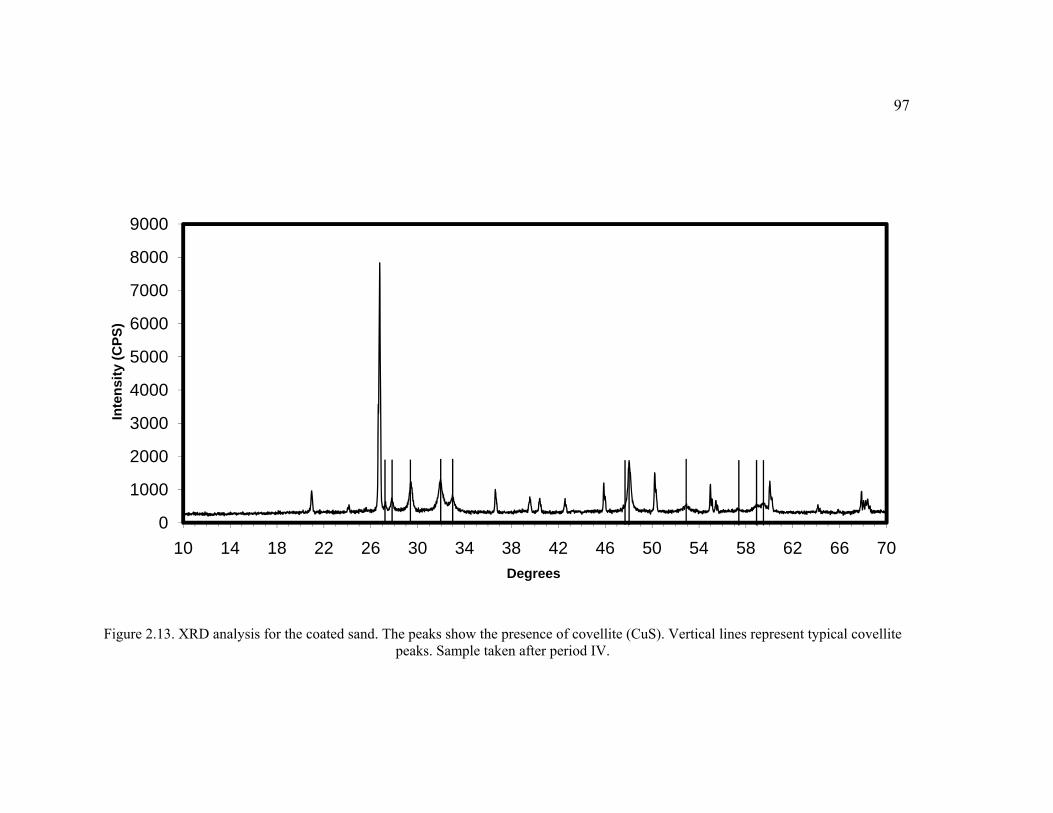
97
Figure 2.13. XRD analysis for the coated sand. The peaks show the presence of covellite (CuS). Vertical lines represent typical covellite peaks. Sample taken after period IV.
0
1000
2000
3000
4000
5000
6000
7000
8000
9000
10 14 18 22 26 30 34 38 42 46 50 54 58 62 66 70
Inte
nsity
(CPS
)
Degrees
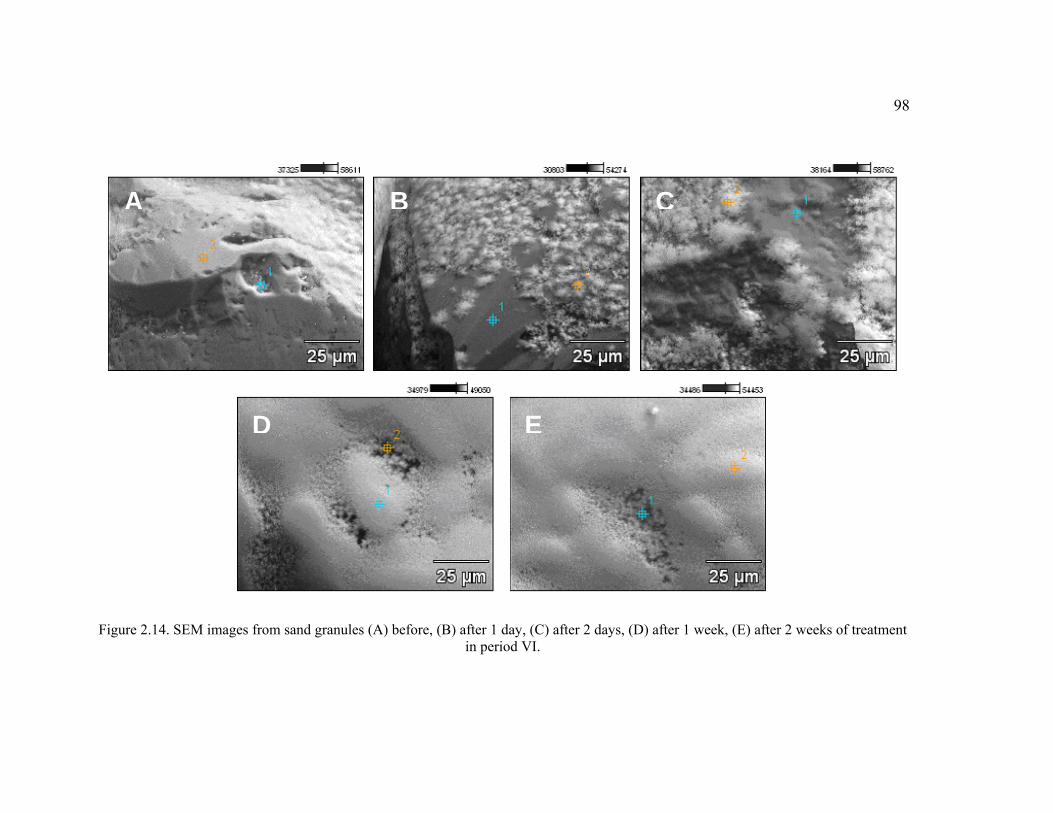
98
Figure 2.14. SEM images from sand granules (A) before, (B) after 1 day, (C) after 2 days, (D) after 1 week, (E) after 2 weeks of treatment
in period VI.
A B C
D E

99
2.5. Discussion
The focus of this research is to evaluate the feasibility of removal and recovery of
heavy metals from contaminated wastewaters using an innovative system configuration,
which includes a crystallization reactor and a sulfate-reducing bioreactor. The purpose of
the crystallization reactor is to facilitate removal and recovery of heavy metals by
precipitation of metal sulfides onto sand granules, which provide surfaces for nucleation.
Besides facilitating recovery, the crystallization reactor also reduces metal concentrations
in the wastewater entering the bioreactor, preventing or minimizing microbial inhibition
by heavy metals. The main objective of the bioreactor is to remove organic contaminants
and to provide biogenic sulfides to the crystallization reactor.
In our study, copper was used as model for metal precipitation and recovery and
citrate was utilized as the electron donating substrate. Citrate is a common contaminant in
chemo mechanical planarization (CMP) effluents (Golden et al. 2000), a wastewater
stream generated during semiconductor manufacturing, which contains high
concentrations of copper. Besides, citrate is known as a chelating agent and could be
used to remediate soils contaminated with heavy metals (Thomas et al. 2000), the
leachate then could be treated with this technique. The reactor system was operated for
350 days and its performance under different copper and sulfate feeding conditions
(Table 2.1) was evaluated. The results obtained during the various operational periods
are discussed in this section.
100
2.5.1. Organic Removal
Citrate was fed to the system at an average concentration of 2 g Citrate-COD/L,
with an average OLR of 6.00 g COD/Lreactor/day. Removal of citrate in the bioreactor
was always nearly complete for all the periods. Citrate concentrations in the system
effluent always fell below detection limits for all the periods. Aerobic and anaerobic
degradation of citrate has been probed in several studies (Antranikian and Giffhorn 1987;
Bott 1997; Bott et al. 1995; Thomas et al. 2000). Aerobic degradation of citrate happens
mainly via the tricarboxylic acid cycle (Antranikian and Giffhorn 1987). However, in
anaerobic bacteria this cycle is not complete and degradation of citrate follows a different
pathway a “citrate fermentation” pathway (Antranikian and Giffhorn 1987; Bott 1997;
Bott et al. 1995). The main products of this fermentation depend on the type of
microorganism, but usually acetate and formate are produced (Bott 1997).
The results observed during system operation show that some organic COD was
present in the effluent stream, mainly in the form of acetate. Residual concentrations of
acetate were observed in the levels of 0.02 g/L, however some measurements revealed
residual concentrations of acetate up to 0.10 g/L (Figure 2.3). A study by Gamez et al.
(2008), suggests that acetate is the main product of citrate fermentation. The study also
suggests that citrate degrades to acetate without the intervention of an external electron
acceptor and that acetate is used as substrate for sulfate-reduction (Gamez et al. 2008).
This is also supported by the specific sulfate reduction activity of the sludge, which
shows a high activity with acetate as substrate, while when H2 is used as electron donor
the specific activity is considerable lower (Table 2.2). In a review of previous research on

101
the microbial degradation of citrate, Bott (1997) suggests that the main products of
anaerobic degradation of citrate are acetate and formate. Even though formate was not
measured in this study, COD balances show that if formate was produced, the residual
concentration of formate in the effluent should have been negligible.
Production of acetate as a metabolite of citric acid degradation is of main
importance for this study since is well known that not all sulfate-reducers are able to
utilize acetate for sulfate reduction (Lens et al. 2003; Madigan et al. 2003b), and that
methanogens compete with sulfate reducers for acetate utilization (Bhattacharya et al.
1996; Colleran et al. 1995; Oude Elferink et al. 1994). Some sulfate-reducers that are not
capable of acetate degradation include members of the genus Desulfovibrio,
Desulfomicrobium, Desulfotomaculum, among others (Madigan et al. 2003b). Previous
studies investigating the competition between methanogens and sulfate reducers show
conflicting results, including those where sulfate-reducers outcompete methanogens
(Bhattacharya et al. 1996; Colleran et al. 1995; Oude Elferink et al. 1994), and those
where, even under non-limiting sulfate conditions, methanogens outcompeted sulfate-
reducers for acetate utilization (Lens et al. 1998). Usually sulfate-reducers outcompete
methanogens when hydrogen is the only electron donor. However, the outcome of
competition for acetate may vary depending on the conditions and type of inocula (Visser
et al. 1996).
Results obtained from the different periods of this study (Table 2.3 and Figure
2.7) show that sulfate-reducers outcompeted methanogens and that acetate was
successfully degraded in the bioreactor. During Period I, sulfate-reduction and
102
methanogenesis accounted for nearly 98.7% and 0.2% of the COD degradation,
respectively. Similar trends were found for the different periods, where methanogenesis
did not play an important role in the degradation of citrate and subsequent acetate
consumption. The acetate remaining in the effluent accounted for 1-4% of the initial
COD in all the periods, so degradation of acetate was successful. During periods V and
VI, when the initial substrate concentration was lowered (one third of initial amount)
acetate was completely consumed by the microorganisms present in the reactor. Two
factors are considered to be determinant for the observed ability of sulfate reducers to
outcompete methanogens in our study. First, the initial sulfate reducing and
methanogenic activities measured for the sludge (see Section 2.3.1) show that the
microorganisms were adapted to non-sulfate limiting conditions and that sulfate reducers
were already outcompeting methanogens. The sulfidogenic activities also show that the
sludge was already adapted to acetate utilization. Taking into account that citrate
degradation pathway leads to acetate production, the use of citrate, as organic substrate,
should not have had any different results that those previously observed. A second
condition that also favored sulfate-reduction was the low COD to sulfate ratio (0.56 g/g)
maintained throughout the experiment. Reports in the literature indicate that the
competition between sulfate-reducers and methanogens for acetate utilization appears to
depend on several factors like pH, COD to sulfate ratio, loading rates, acetate
concentrations, etc. Among those parameters, the COD to sulfate ratio appears to be
particularly important in determining the fate of acetate in sulfate reducing environments.
Bhattacharya (1996), showed that when the influent acetate-COD/SO42- ratios are 0.71

103
g/g or lower, sulfate reducers outcompeted methanogens, while for ratios exceeding 3.56
g/g methanogens outcompeted sulfate reducers. Biomass retention can also affect
competition between methanogens and sulfate-reducers. Some studies showed that
biomass retention promotes dominance of acetate consuming methanogens over sulfate
reducers (Visser et al. 1993). This may look contradictory with the results obtained.
However, a report presented by Omil et al. (1996) where the effect of upward velocity of
UASB reactors on sulfate-reduction was studied, showed that for upward velocities of 6
m/h sulfate reducers where washed out of the reactor; nevertheless, for upward velocities
around 2 m/h, 93-97% of the substrate degradation was made by SRB. The upward
velocity for the reactor in this study was 2.3 m/h, so the results seem to agree with that
study.
A trend can be observed for the different periods. In any period, citrate was not
observed in the measurements of the effluent stream. However, when COD is calculated
adding the different measured concentrations in the effluent the total value does not
always correlate with the apparent citrate removal. Even tough, this discrepancy might be
related to measurement errors, Francis et al. (1992) reported that speciation of metal-
citrate complexes played an important role in citrate degradation. It is well known that
citrate forms complexes with heavy metals such as copper. The study explained that
bioavailability of the metal-citrate complex depended on the type of complex formed
(bidentate or tridentate), and that the lack of biodegradation was not a major function of
metal toxicity. Formation of copper sulfide outcompetes the formation of copper-citrate
complex in the crystallization reactor due to its lower formation constant (10-36.9 for CuS
104
vs. 104.35 for the copper-citrate complex) (Benjamin 2002; Thomas et al. 2000), so
copper-citrate complex does not play an important role in reducing the bioavailability of
citrate in the bioreactor. On the other hand, copper may have affected the microbial
activity in some way; this will be explained in the next section.
2.5.2. Copper Toxicity
In our study, sulfate-reduction and methanogenesis activities presented a rather
small decrease during the periods where copper was added to the system (periods II, IV,
and VI). Toxicity might be an issue if high concentrations of copper are found in the
bioreactor. However, the decrease in metabolic activities does not appear to be caused by
copper inhibition. Soluble copper concentrations in the bioreactor were considerably
lower than those reported to have an inhibitory effect on microorganisms (84, 93, and 56
μg/L, for periods II, IV, and VI, respectively) due to the effective removal of soluble
copper in the crystallization reactor (around 100% for all periods, see Table 2.5).
Reported values for copper toxicity for methanogens range from a few mg/L to as much
as 100 mg/L (Fang 1997; Hollingsworth et al. 2005; Sani et al. 2001; Utgikar et al. 2003).
Karri et al. (2006) reported values for the 50% inhibition concentration (IC50) of soluble
copper to acetoclastic methanogens and sulfate-reducers of 20.7 and 32.3 mg/L
respectively.
Nonetheless, in our study, inhibition of sulfate-reduction was highest when the
concentration of total copper in the bioreactor was highest. Utgikar et al. (2002) proved
that coating by metal sulfides onto the cell surface creates inhibition by decreasing

105
substrate transport trough the cell membrane. However, in that study there is no report of
the amount of metal sulfides precipitated per gram of VSS that caused inhibition. The
concentration of total copper in the system seems to be low to cause this kind of
inhibition, and no other symptoms of inhibition were detected in the system (e.g. increase
in residual acetate concentration). So there is a possibility that reoxidation of residual
sulfide in effluent samples taken might have caused this apparent inhibition.
2.5.3. Sulfide Toxicity
Average levels of total sulfide in the bioreactor ranged from 720 to 980 mg/L for
periods I through IV, and in levels from 231 to 294 mg/L of total sulfide for periods V
and VI (Figure 2.1). Previous studies show that sulfide is toxic to many microorganisms.
For anaerobic treatment, accumulation of high H2S concentrations can cause inhibition
and even process failure (Lens et al. 2003). All sulfide species have an inhibitory effect
on microorganisms. However, the unionized form of sulfide is the main toxic species
(Oude Elferink et al. 1994). The pKa for the first dissociation of H2S is 6.99 (Benjamin
2002); this explains why a small variation in pH around the neutral range can show a
great change in the toxic effects of hydrogen sulfide. Some studies show that the type of
inocula used also affects the outcome of H2S inhibition. Methanogens are more sensitive
than other microorganisms to sulfide toxicity (Oleszkiewicz et al. 1989). For
methanogens, 50% inhibition was found at unionized sulfide levels ranging from 50 to
252 mg H2S/L, with pH ranging from 6.2 to 8.0. For sulfate reducers, 50% inhibition was
106
found at levels ranging from 80 to 450 mg H2S/L of unionized sulfide; in the same pH
range (Visser 1995). The pH value of the bioreactor effluent in our study ranged from 7.4
to 8.2, this would indicate levels of unionized sulfide ranging from 100 mg/L to 130
mg/L for periods I-IV and levels between 30 and 40 mg/L for periods V-VI. No
significant methanogenic activity was observed in any period, which gives good
agreement with literature reports. Nevertheless, sulfide levels seem to be high for sulfate-
reducers and based on previous research some kind of inhibition should be expected. The
study results show no apparent inhibition due to high sulfide concentrations. Visser et al.
(1996) found that for granular sludge sulfide inhibition is lower than that for suspended
sludge. These studies show that inhibition by sulfide for suspended sludge is determined
by the concentration of the unionized H2S, and 50% inhibition was found at
concentrations of unionized sulfide ranging from 50 to 130 mg/L. However, for granular
sludge, the extent of the inhibitory effect of sulfide is related to the total sulfide
concentration, and not only to the concentration of the unionized specie, 50% inhibition
was found at levels of 250 and 90 mg/L of unionized sulfide. So concentrations of
unionized sulfide in the bioreactor seem to be low to cause an important effect in granular
sulfate reducer sludge. This might represent an explanation for the results obtained in this
experiment where granular sludge was used in the bioreactor.
107
2.5.4. Copper Removal
Simulated wastewater containing copper was treated with the crystallization
reactor- bioreactor system during three different periods (II, IV and VI). Average influent
copper concentrations for the different periods were 83.39, 78.84, and 76.93 mg/L of total
copper for periods II, IV, and VI respectively. The system configuration used in this
experiment (Figure 1.1) was an innovative approach for the removal of metals. A
previous experiment performed by Hollingsworth (2004), used this system to remove
copper from simulated semiconductor wastewaters with influent copper concentrations as
high as 75 mg/L, presenting high removal efficiencies. The first report found using this
type of configuration was as a method for drinking water softening and calcium
carbonate removal in wastewater (van Langerak and Hamelers 1997).
Total and soluble removal efficiencies for the system ranged between 97.5% and
99.9% during all the periods. Effluent soluble copper concentrations of 84, 93 and 56
μg/L were reported for periods II, IV, and VI, respectively. Total copper concentrations
in the effluent reported average levels of 552, 769 and 1773 μg/L for periods II, IV, and
VI, respectively (Table 2.5). This compares favorably with previous experiments using
sulfate reduction for the removal of copper. Hammack et al. (1994) reported efficiencies
of 99% for the removal of copper using a counter-current metal precipitator in
conjunction with an acid neutralizing reactor (using limestone) and a sulfidogenic
bioreactor. Other experiment using a configuration with four precipitators and settlers,
utilizing biogenic sulfide as ligand reported efficiencies of 99.9% for the removal of
copper, and effluents with copper concentrations of 420 μg/L (Tabak et al. 2003).
108
Removal of copper of 99% (540 μg/L) was obtained using gas sparging and supernatant
mixing with biogenic sulfides in synthetic wastewaters (Bhagat et al. 2004).
Soluble copper was successfully removed almost completely in the crystallization
reactor, specific removal efficiencies for the crystallization reactor were around 100% for
all the periods. The bioreactor had no significant contribution for the removal of soluble
copper. Soluble copper concentration was almost always higher after leaving the
bioreactor (Figure 2.9). Even though the difference is not significant, some kind of
resolubilization might have taken place, but the differences are so small that even the
sampling technique could have played a role in this result. However, when specific
efficiencies in total copper removal for the crystallization reactor and the bioreactor are
compared, great differences are observed for the different periods. In period II the
removal efficiency for total copper was nearly 100%, however in period IV this
efficiency lowered to 80.7%. This difference might have been because of two reasons.
The first is that in period II two different HRT were used, 0.34 and 0.75 days, while in
period IV the HRT was always of 0.33 days. The higher HRT might have caused lower
total copper concentrations in the crystallization reactor effluent, by facilitating copper
sulfide deposition to the sand granules. This might have increased removal efficiency.
Other factor that could have played a role is the cumulative mass of copper removed per
mass of sand in the crystallization reactor. In period II, only 0.22 g Cu/g sand were fed to
the system. On the other hand for period IV this value was almost 0.48 g Cu/ g sand
(Figure 2.11). This factor is more obvious when analyzing period VI. Figure 2.11 shows
that after an amount around 0.25 g Cu/g sand are fed to the system a “breakthrough” of
109
total copper occurs in the crystallization reactor. Several factors may cause this
breakthrough, such as a rapid rise in homogeneous precipitation versus heterogeneous
precipitation, or attrition of precipitated copper. Whatever the reason that caused this
behavior, this suggests that the sand reached its retention capacity under those conditions.
This also affects the average removal efficiency by lowering it to almost 34% in period
VI. For period IV this breakthrough is not as obvious. This might be because higher
levels of sulfide were used in that period compared to period VI.
Mass balances for sand granules present good correlation for periods II and IV
(Table 2.6). However for period VI the balance does not correlate with the apparent
copper removed. This apparent disagreement is mainly due to the copper breakthrough
observed for this period (Figures 2.10 and 2.11). The higher concentrations of total
copper measured after day 328, decreased the overall removal efficiency for the period,
but this numbers are not representative. If an average removal efficiency is calculated
only for the days before the breakthrough occurred, an average removal efficiency of
total copper of 79.2% is obtained, and then a mass of 40.31 g of copper sulfide is
estimated to have been removed in the crystallization reactor, which correlates very good
with the mass balance for the sand.
2.5.5. Copper Crystallization on Sand Granules
Sand granules were characterized by SEM-EDS, and XRD analysis. Sand samples
were collected from the crystallization reactor after each period. For the sand samples in
110
period II, SEM images and EDS analyses were performed (Figure 2.12). SEM images
show a rough surface of the sand before treatment, and a smooth coated surface after
treatment. EDS analyses show that this coating is mainly made of copper and sulfide.
Even though this information corroborates that copper is being precipitated in the sand,
no specific information of the crystalline characteristics of the sand can be obtained. For
period IV, samples were taken at the end of the period and an XRD analysis was
performed to the samples. The results show that an actual crystalline formation occurred
on the sand surface. The mineral formed is a form of divalent copper sulfide called
covellite (Figure 2.13). To further study the mineral growth onto the sand surface
samples were obtained at different intervals of time during period VI. SEM images from
these samples show that mineral growth was not evenly distributed on the sand surface
and that mineral growth occurred mainly around some nucleation points.
Previous studies have been done to remove copper using sulfide precipitation
(Bhagat et al. 2004; El Bayoumy et al. 1999; Hammack et al. 1994; Jong and Parry 2003;
Tabak et al. 2003; Veeken et al. 2003a). However, most of them use a settler or a
filtration process to remove the copper sulfide precipitate. The pH in our system was
always above neutral range, and some reports indicate that for copper sulfide to form
crystalline precipitates the solution needs to be acidic. If the pH is alkaline or neutral a
brownish-black precipitate is formed and remains colloidal (Vogel 1996). Veeken et al.
(2003), working at a pH of 6.0, reported difficulties with copper sulfides precipitates
while trying to selective precipitate different metals. They indicated that a “cloudiness”
was formed when precipitating copper, and that CuS particles smaller than 0.45 μm were

111
formed. The formation of these small particles of copper sulfides is mainly due to the
extremely low solubility constant of CuS (10-36). The mixing, of moderate concentrations
of sulfide and copper, results in high supersaturation and high nucleation rates.
Mersmann (1999) postulates that the particle size distribution depends on the outcome of
the competition between nucleation and crystal growth. High supersaturation promotes
nucleation, so smaller particles are formed. However, local supersaturation can be
minimized if high specific surface for crystal growth is offered. In our system, sand
granules offer this specific surface, allowing copper sulfides to crystallize on the sand
surface. This process is called heterogeneous nucleation. In a crystallization reaction a
high supersaturation condition leads to high rates of homogeneous nucleation. In
homogeneous nucleation the compound starts crystallizing without the help of an external
compound. In heterogeneous nucleation impurities are present and serve as nucleation
points. The detailed mechanisms of homogeneous and heterogeneous nucleation are out
of scope for this study. However, some studies show that if enough surface area for
nucleation is provided by the impurities, heterogeneous nucleation can outcompete
homogeneous nucleation (Mersmann 1999; Sear 2006). In our study the sand granules
offer that area for nucleation, and by providing it they allow copper sulfide to crystallize
on the sand surface, allowing an easier recovery.
112
3. SIMULTANEOUS REMOVAL AND RECOVERY OF HEAVY METALS FROM
WASTEWATER BY MEANS OF A SULFATE REDUCING BIOREACTOR AND A
CRYSTALLIZATION REACTOR
3.1. Abstract
More than 50% of the sites listed in the National Priority List have some problem involving heavy metals. Heavy metals are an integral part of wastewaters from several industries like the semiconductor industry, and electroplating industry. Effluents from these industries are complex; however, they are generally composed of heavy metals like copper, nickel, chromium and, sometimes, organic contaminants. The goal of this research is to investigate the feasibility of an innovative system configuration that combines a crystallization reactor and a sulfate-reducing anaerobic bioreactor for the simultaneous removal and recovery of heavy metals and organic contaminants in a simulated metal contaminated effluent wastewater, containing copper and nickel at concentrations of 38.1 mg/L, and 37.3 mg/L, respectively. Removal of heavy metals is stimulated by biogenic sulfides produced by sulfate reducing bacteria inside an expanded granular sludge bed (EGSB) bioreactor. Heavy metals are then removed and recovered inside a seeded crystallization reactor (SCR) containing fine silica sand. Citric acid, a common compound found in semiconductor wastewaters was used as the electron donor to promote sulfate reduction in the bioreactor, with organic loads of 2 g COD/Lreactor/day. Sulfate for sulfate reduction was provided at a rate of 3.66 to 3.99 g SO4
2-/Lreactor/day. A hydraulic retention time (HRT) of 0.33 days for the total system was maintained throughout the study. Total metal removal efficiencies of around 93.0% were observed during this study for both copper and nickel. Soluble copper and nickel were removed in the crystallization reactor with efficiencies around 99.8%. Removal efficiencies of 31.3% and 40.6% were observed in the SCR for total copper and nickel respectively. The system proved to be highly efficient for the removal of soluble and total metals.
113
3.2. Introduction
Heavy metal contamination is becoming increasingly significant both as a public
health problem and as an economic issue (White et al. 1997). The importance of metals
as an environmental contaminant can be appreciated by considering that more than 50%
of the sites listed in the National Priority List have some problem involving heavy metals
(White et al. 1997). Also it is reported that in the mid 90’s at least 100,000 priority
contaminated sites in the European Union had a metal problem (White et al. 1997).
Chemical Mechanical Planarization (CMP) is a fundamental process in the
semiconductor manufacturing, and is also one of the most demanding processes in terms
of water; with 30 to 40% of the water used in the industry accounted for by this process
(Golden et al. 2000). The exact composition of CMP wastewater depends on individual
fabs, but they are usually composed of organic chemicals such as: complexing agents,
surfactants, corrosion inhibitors, and others (Golden et al. 2000). All these chemicals
need to be removed in order to discharge them to the environment or be utilized in other
processes of the fab. However, one of the components which presents the most concern
and that is found in these wastewaters is copper, with concentrations generally ranging
from 5 to 100 mg/L (Maag et al. 2000). Removal of copper from these wastewaters must
be achieved to levels of 10 μg/L to 1 mg/L of soluble copper depending of the type of
discharge required (Maag et al. 2000).
Designing of treatment systems for heavy metals is highly dependent on the
amount of contamination that the wastewaters have. For metals like copper if
concentrations are found to be high enough (>1 g/L) usually precipitation with

114
hydroxides is the preferred technology (Choi et al. 2006; Van Hille et al. 2005).
However, this kind of treatment becomes ineffective at lower metal concentrations (Van
Hille et al. 2005). Another big disadvantage of hydroxide precipitation is the high
volume of sludge produced, which tend to be gelatinous and difficult to dewater
(Lanouette 1977; Van Hille et al. 2005). The sludge produced will need further treatment
such as coagulation-flocculation, sedimentation or/and filtration (Lanouette 1977).
For wastewaters with lower concentrations of metals other technologies are
utilized that do not rely on precipitation. One technology heavily utilized for those
conditions is ion exchange (Choi et al. 2006). However, this technique presents some
drawbacks as well. Ion exchange is a technology that tends to be heavily affected by the
chemicals found in the wastewater. Treatment columns are potentially subjected to
fouling by suspended solids, and organic chemicals can poison the resins utilized in this
technology making it non-effective (Eccles 1999; Kaksonen 2004). Both of the
aforementioned components are found in CMP wastewaters in the semiconductor
industry in significant concentrations (Golden et al. 2000). That is why it is advisable to
perform tests and operate pilot plants under several different conditions to determine the
best design to reach the desired metal concentrations (Jenkins et al. 2004). Furthermore,
exhausted resins would need to be disposed or regenerated, with the corresponding
addition to the overall treatment cost.
An optimal treatment technology for CMP wastewater treatment should present
the advantages of the aforementioned treatment strategies while minimizing the
disadvantages. Metal precipitation with sulfides is one of such technology. Unlike
115
hydroxide precipitation, sulfide precipitation is less dependent on organic components,
such as chelating agents, present on the contaminated water (Hammack et al. 1994;
Veeken et al. 2003b). Furthermore the lower solubility of metal sulfides when compared
to the corresponding metal hydroxides increases the removal efficiency, even at low
metal concentrations, and makes it less dependent on pH (Table 1.3 in Chapter 1). The
recovered metal sulfides can be easily treated with existing metallurgical processes for
metal recovery which will offset the total cost of the treatment (Kaksonen 2004; Peters et
al. 1984; Veeken et al. 2003b).
The aim of this research is to evaluate the potential of a sulfate reducing expanded
anaerobic granular sludge bed (EGSB) bioreactor (BR) coupled to a seeded
crystallization reactor (SCR) to remove and recover metals from contaminated water.
Removal of metals will be stimulated by biogenic sulfides produced by sulfate reducing
bacteria (SRB) inside the EGSB. SRB will use the organic contaminants of CMP to
promote sulfate reduction. In order to facilitate metal removal and recovery, the SCR will
be used to carry out the precipitation reaction (Figure 1.1). It has been previously
reported that seeding crystallization reactions suppresses the formation of homogeneous
precipitation of fines (Van Hille et al. 2005) which will help to improve removal
efficiencies. The primary research objective is to evaluate the feasibility of attaining
simultaneous removal of metals along with other organic wastewater contaminants.
116
3.3. Materials and Methods
3.3.1. Microorganisms
Sulfate reducing granular sludge was obtained from a laboratory-scale EGSB
operated at 30ºC under non-limiting sulfate conditions for approx 500 days (Chapter 2).
The sludge had an initial content of volatile suspended solids (VSS) of 6.12%. The initial
sulfidogenic activities of the sludge were 87.3 and 521.0 mg H2S-COD/g VSS/day, for
hydrogen and acetate as electron donors, respectively. The initial methanogenic activities
of the sludge were 7.1 and 8.3 mg CH4-COD/g VSS/day, for hydrogen and acetate as
electron donors, respectively.
3.3.2. Reactor
Continuous flow experiments were performed in two glass reactors. Figure 1.1
presents a schematic drawing of the reactor system consisting of a seeded crystallization
reactor (SCR) and an Expanded Granular Sludge Bed (EGSB) bioreactor (BR). Both
reactors were operated simultaneously during metal removal, while the BR was operated
alone in periods in which metal was not added. The system was located in a climate-
controlled chamber maintained at 30±2˚C. The BR had a working volume of 2.9 L. The
reactor dimensions for the BR were: length to taper 85 cm; length taper 2 cm; length
upper part 23 cm; total length of 110 cm; top inner diameter (ID) of 104 mm, and bottom
ID of 52 mm. The SCR had a working volume of 0.4 L. The SCR dimensions were:
117
length to taper 58 cm; length taper 1 cm; length upper part 19 cm; total length of 78 cm;
top ID of 52 mm, and bottom ID of 20 mm. The SCR was filled with approximately 150
g of silica sand. Samples of sand were extracted from the reactor for metal extraction at
the end of metal exposure. The initial volatile suspended solids (VSS) concentration for
the BR was 19 g VSS/L. Previous to the development of this experiment, the BR was
operated for 500 days (day 0 to 500) with citric acid (1.91–6.1 g COD/L/day) and non-
limiting concentrations of sulfate (COD/Sulfate = 0.56), at a temperature of 30oC, and
hydraulic retention times ranging from 8 to 18 h. During this stage the BR was coupled
with the SCR for different periods of copper removal, with copper ranging from
concentrations of 5 mg/L to 100 mg/L.
To increase the upflow velocity in the reactors and maintain sludge bed
fluidization, effluent recirculation was applied using a Cole-Parmer Masterflex L/S®
Variable Speed Digital Economy Drive Pump Model 7524-50 equipped with a Cole-
Parmer L/S® Two-Channel Easy-Load® II Pump Head (Vernon Hills, IL.). The recycle
rate (i.e., recycling flow/effluent flow) in both reactors was maintained at a recycle ratio
of 2, the recycle rate was calculated dividing the recycling flow by the effluent flow. The
synthetic wastewater was supplied using the same pump set-up. The pumps were
operated with Cole-Parmer Masterflex C-Flex tubing for the recycle flow and Cole-
Parmer Masterflex Tygon tubing for the medium flow (Vernon Hills, IL.).
Biogas from the reactors was collected and passed through two 2-liter Erlenmeyer
flasks designed to remove H2S and CO2 from the CH4 in the gas stream. The first flask
was empty, preventing any backflow of sodium hydroxide into the reactors, while the

118
second flask was filled with 1M NaOH, which removed H2S and CO2. Following the
scrubbing of the biogas, the remaining CH4 gas flow was passed through a wet-type
precision gas meter manufactured by Schlumberger Industries.
Throughout the reactor experiments, a 20% excess of sulfate was added to the
influent so that theoretically, 100% COD removal could be achieved. In addition, excess
sulfate was maintained at a COD/sulfate ratio in the influent at a value of approximately
0.56 (g COD/g SO42-).
Both reactors were monitored daily for effluent pH, liquid volumetric flow rate,
and gaseous methane flow rate. The system influent and effluent, and effluent of SCR
only, were sampled daily or every other day. Influent analyses included: sulfate
concentration, citrate concentration, total copper and nickel concentration (when
applicable), and pH. Effluent analyses included: sulfate concentration, sulfide
concentration, citrate concentration, acetate concentration, soluble and total copper and
nickel concentration (when applicable), and pH. While effluent from SCR analyses
included total and soluble copper and nickel concentrations only.
The H2S concentration in the biogas stream was calculated from the H2S
concentration in the liquid assuming equilibrium between the gas and liquid phases. A
dissociation constant of 6.99 was utilized for hydrogen sulfide (Benjamin 2002). A
dimensionless Henry’s factor of 0.36 was also used for the calculations (Metcalf and
Eddy 2003). CO2 concentrations in the biogas were assumed to be 30% of the total
methane flow rate. The amount of undissociated aqueous hydrogen sulfide was

119
determined using the equation presented in the materials and methods section of Chapter
2.
Mass balances in the sand of the SCR were performed after the period of metal
treatment. By calculating the total copper and nickel fed to the system and using the
removal efficiency for the SCR, an approximate of the amount of copper and nickel
deposited in the sand was calculated. This value was then compared to the dry sand mass
weight before and after the treatment period.
3.3.3. Reactor Influent
The basic anaerobic basal mineral medium (ABM) used in the reactors contained
(in mg/L): NH4Cl (280), KCl (270), K2HPO4 (169), CaCl2•2 H2O (10), MgCl2•6 H2O
(150), yeast extract (20), and 1 mL/L of trace element solution. The concentrations of
sulfate (SO42-, supplemented as Na2SO4) and citrate (C6H5O7
3-), supplemented as
C6H5Na3O7•2 H2O) in the influent were (in mg/L): 1,200 and 888, respectively. A COD
factor of 0.75 was used for citrate (g citrate-COD/g citrate dry weight). The theoretical
concentrations of copper (II) and nickel (II) added was 50 mg/L for each one. Divalent
copper was supplemented as CuCl2•2 H2O. Divalent nickel was supplied as NiCl2•6 H2O.
The trace element solution contained (in mg/L): H3BO3 (50), FeCl2•4 H2O (2000),
ZnCl2 (50), MnCl2•4H2O (50), (NH4)6Mo7O24•4H2O (50), AlCl3•6 H2O (90), CoCl2•6
H2O (2000), NiCl2•6 H2O (50), CuCl2•2 H2O (30), NaSeO3•5 H2O (100), EDTA (1000),
resazurin (200) and 36% HCl (1 mL/L). The initial pH of the reactor medium was not
120
adjusted further, and the typical value ranged between 7.7 and 8.0. The pH in the reactor
effluent was maintained around 7.5-8.0 by utilizing sodium bicarbonate (NaHCO3) as
buffer with a concentration of 9 g/L.
3.3.4. Analytical Methods
The acetate concentration in liquid samples from the reactor was determined by
gas chromatography using an HP5290 Series II system (Agilent Technologies, Palo Alto,
CA) equipped with a flame ionization detector (GC-FID). The GC was fitted with a
Nukol fused silica capillary column (30 m length x 0.53 mm ID, Supelco, St. Louis,
MO). The carrier gas was helium at a flow rate of 11 mL/min and a split flow of 84
mL/min. For acetate measurements the temperatures of the column, the injector port and
the detector were 140, 180 and 275°C, respectively. Preparation of acetate samples
consisting of centrifuging 1.8 mL of liquid extracted directly from the reactor. Samples
were centrifuged in eppendorf centrifuge tubes for 10 min at 10000 rpm. A volume of 1.5
mL was then obtained from the centrifuged samples and 20 μL of ultra pure formic acid
was added to acidify the sample. Injections of sample were carried out with an HP 7673A
GC autosampler with an injection volume of 5μL. Acetate was the only measured
compound, since previously it was determined to be the main metabolic product of citrate
fermentation (Chapter 4). Limit detection of 5 mg/L was achieved with a maximum
measured concentration of 400 mg/L.

121
Sulfide was fixed by the addition of zinc acetate and then analyzed
colorimetrically by the methylene blue method (Truper and Schlegel 1964). To prevent
volatilization of H2S, samples were not centrifuged or filtered and measurement occurred
immediately after sampling. Samples were diluted to achieve concentrations in the range
of 0.01 to 1 mg/L. COD was determined by oxidation with dichromate and analyzed
using the colorimetric micro-method described in Standard Methods for Examination of
Water and Wastewater (APHA 2005). Due to the high affinity of sulfide to form metal
sulfides with low solubility in water, minimal modifications were done to this method to
avoid these precipitates. Avoidance of precipitates at the end of the digestion was
achieved by agitating the samples manually every 20 min. Digestions were carried out at
temperatures of 150oC for 2 to 3 hours; however, higher times were considered if
precipitate was still present. This measure also facilitated sulfide oxidation.
Sulfate and citrate were determined by ion chromatography with suppressed
conductivity using a Dionex 500 system fitted with a Dionex IonPac AS11-HC4
analytical column (4 x 250 mm) and a AG11 guard column (4 mm x 40 mm) (Dionex,
Sunnydale, CA). The mobile phase had a gradient of 0.67 mM KOH/min going from 20
to 30 mM at a flow rate of 1.2 mL/min. Sulfate and citrate retention times were of 4.5 and
11.8 min approximately, with a detection limit of 1 mg/L for both sulfate and citrate. The
column was maintained at room temperature. The injection volume was 25 μL.
The pH was determined immediately after sampling with an Orion model 310
PerpHecT pH-meter with a PerpHecT ROSS glass combination electrode. Volatile
122
suspended solids were determined according to Standard Methods for Examination of
Water and Wastewater (APHA 2005).
Samples collected for copper analysis were acidified and diluted (5 to 5,000 μg/L)
with 10% nitric acid and stored in polyethylene containers to prevent metal precipitation
and adsorption to surfaces. Samples collected for soluble copper and nickel
concentrations were membrane filtered (0.45 μm), while samples collected for total
copper and nickel content were not membrane filtered prior to the acidification or
digestion. Metal extraction was performed on the total copper and nickel samples using
the microwave assisted digestion method described in Standard Methods for Examination
of Water and Wastewater (APHA 2005). Metal extraction was conducted in a microwave
digestion system (MDS2100, CEM Corporation, Matthews, NC). The concentration of
copper and nickel in liquid samples was determined using an ASX500 autosampler
(CETAC Technologies, Omaha, NE) and an Agilent 7500a ICP-MS. The analytical
system was operated at an Rf power of 1500 watts, a plasma gas flow of 15 L/min, and a
carrier gas flow of 1.2 L/min. Detection limit was of 5 μg/L.
3.3.5. Sand Characterization
Sand particles characteristics were analyzed using Scanning Electron Microscopy
(SEM) and Energy Dispersive Spectroscopy (EDS), and X-ray diffraction techniques.
Sand samples collected from the SCR were allowed to air dry prior to analysis, and then
they were examined using a variable pressure SEM (Hitachi S-2460N). Compositional

123
data were obtained using a Thermo-Noran EDS detector. No coating of the sand was
done. X-ray diffraction (XRD) analysis was achieved with a Scintag XDS 2000 model
XRD operated at 10 - 70° at 2θ, a continuous scan rate of 2°C/min, 40mM, 40kV. Peaks
were analyzed with ICDD (International Center for Diffraction Data) cards.
3.3.6. Chemicals
All chemicals used were reagent grade or better. Sodium citrate tribasic,
dihydrate (CAS 68-04-2; >99%), cupric chloride dihydrate (CAS 7447-39-4; 99.8%),
nickel chloride hexahydrate (CAS 7791-20-0; >99%), sodium sulfate (CAS 7757-82-6;
>99%) and sand (white quartz, particle size from 210 to 297 μm; CAS 14808-60-7) were
obtained from Sigma-Aldrich Corp. (St. Louis, MO, USA).
3.3.7. Calculations
Calculations of metal removal efficiencies in the system were based on soluble
and total metal concentrations measured at the influent, midpoint, and effluent of the
system. Results obtained for efficiencies are averages of the efficiencies calculated at
each sampling event.
System efficiency was calculated using the following equation:
(3-1)

124
Where: ES = System efficiency Cin = Influent metal concentration Ceff = Effluent metal concentration
Efficiency for the SCR was obtained using the following formula:
(3-2)
Where: ESCR = SCR metal removal efficiency Cin = Influent metal concentration CMP = Midpoint metal concentration Ceff = Effluent metal concentration Qin = Influent volumetric flow rate QR = Recirculate volumetric flow rate QMP = Midpoint volumetric flow rate (Qin + QR)
BR efficiency for each sampling event was calculated by the following equation:
(3-3)
Where: EBR = BR metal removal efficiency Cin = Influent metal concentration CMP = Midpoint metal concentration Ceff = Effluent metal concentration Qin = Influent volumetric flow rate Qeff = Effluent volumetric flow rate QMP = Midpoint volumetric flow rate (Qin + QR)
The same equations were applied for calculations of soluble and total
concentrations of copper and nickel.

125
3.4. Results
Copper and nickel were simultaneously removed in the SCR and BR system.
Precipitation and crystallization of metals occurred in the form of metal sulfides. Sulfide
was produced biologically from the reduction of sulfate linked to oxidation of citrate
which was fed as the electron donor. This study is composed of three different periods.
The first and last periods (days 500-527 and 587-600 respectively) where only citrate and
sulfate were supplied in the medium served to assess the performance of the reactor in the
absence of heavy metal addition. During the second period (days 527-587), copper and
nickel (38.1 and 37.3 mg/L respectively) were fed to the system. It was during this period
that the SCR was coupled to the BR. Inside the SCR, the influent of the system and the
effluent recirculation from the BR were mixed.
During the three different periods, the average organic loading rate (OLR) ranged
from 1.97 to 2.04 g COD/Lreactor/day. The sulfate loading rate (SLR) had average values
ranging from 3.66 to 3.99 g SO42-/Lreactor/day. The system was operated with a hydraulic
retention time (HRT) of 0.33 days. The effluent pH during the various periods varied
between 7.58-7.89 (Figure 3.4). Measured values of COD, SO42-, copper and nickel
volumetric load rates are presented in Tables 3.1-3.3.
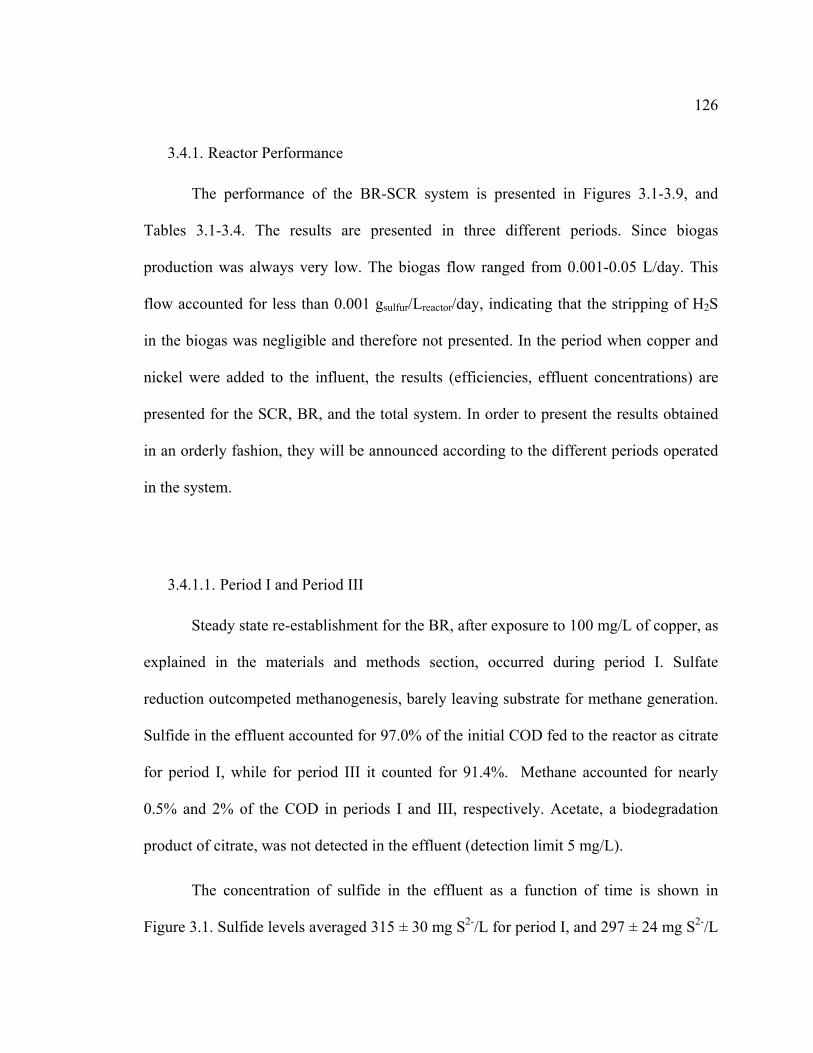
126
3.4.1. Reactor Performance
The performance of the BR-SCR system is presented in Figures 3.1-3.9, and
Tables 3.1-3.4. The results are presented in three different periods. Since biogas
production was always very low. The biogas flow ranged from 0.001-0.05 L/day. This
flow accounted for less than 0.001 gsulfur/Lreactor/day, indicating that the stripping of H2S
in the biogas was negligible and therefore not presented. In the period when copper and
nickel were added to the influent, the results (efficiencies, effluent concentrations) are
presented for the SCR, BR, and the total system. In order to present the results obtained
in an orderly fashion, they will be announced according to the different periods operated
in the system.
3.4.1.1. Period I and Period III
Steady state re-establishment for the BR, after exposure to 100 mg/L of copper, as
explained in the materials and methods section, occurred during period I. Sulfate
reduction outcompeted methanogenesis, barely leaving substrate for methane generation.
Sulfide in the effluent accounted for 97.0% of the initial COD fed to the reactor as citrate
for period I, while for period III it counted for 91.4%. Methane accounted for nearly
0.5% and 2% of the COD in periods I and III, respectively. Acetate, a biodegradation
product of citrate, was not detected in the effluent (detection limit 5 mg/L).
The concentration of sulfide in the effluent as a function of time is shown in
Figure 3.1. Sulfide levels averaged 315 ± 30 mg S2-/L for period I, and 297 ± 24 mg S2-/L
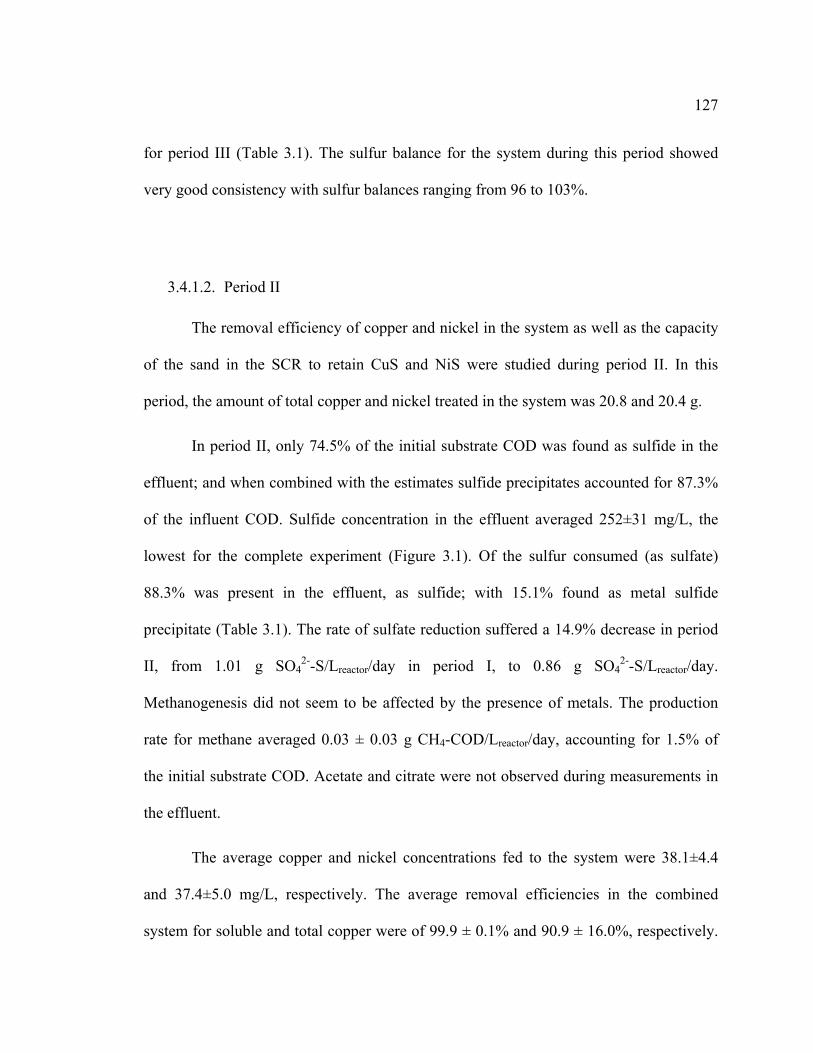
127
for period III (Table 3.1). The sulfur balance for the system during this period showed
very good consistency with sulfur balances ranging from 96 to 103%.
3.4.1.2. Period II
The removal efficiency of copper and nickel in the system as well as the capacity
of the sand in the SCR to retain CuS and NiS were studied during period II. In this
period, the amount of total copper and nickel treated in the system was 20.8 and 20.4 g.
In period II, only 74.5% of the initial substrate COD was found as sulfide in the
effluent; and when combined with the estimates sulfide precipitates accounted for 87.3%
of the influent COD. Sulfide concentration in the effluent averaged 252±31 mg/L, the
lowest for the complete experiment (Figure 3.1). Of the sulfur consumed (as sulfate)
88.3% was present in the effluent, as sulfide; with 15.1% found as metal sulfide
precipitate (Table 3.1). The rate of sulfate reduction suffered a 14.9% decrease in period
II, from 1.01 g SO42--S/Lreactor/day in period I, to 0.86 g SO4
2--S/Lreactor/day.
Methanogenesis did not seem to be affected by the presence of metals. The production
rate for methane averaged 0.03 ± 0.03 g CH4-COD/Lreactor/day, accounting for 1.5% of
the initial substrate COD. Acetate and citrate were not observed during measurements in
the effluent.
The average copper and nickel concentrations fed to the system were 38.1±4.4
and 37.4±5.0 mg/L, respectively. The average removal efficiencies in the combined
system for soluble and total copper were of 99.9 ± 0.1% and 90.9 ± 16.0%, respectively.

128
Total system efficiencies for soluble and total nickel were 99.8 ± 0.1% and 90.8±16.4%,
respectively. Removal efficiencies for soluble and total copper observed in the BR were
0.1 ± 0.3% and 59.6 ± 23.6%, respectively, while for soluble and total nickel they were
0.2 ± 0.3% and 50.2 ± 32.8%, respectively.
The SCR removed 99.8 ± 0.3% for soluble copper and 31.3 ± 19.3% for total
copper. For nickel, the removal efficiencies in the SCR were 99.6 ± 0.3% for soluble
nickel and 40.6 ± 33.6% for total nickel. Soluble and total copper concentrations in the
SCR effluent averaged 49 ± 35 μg/L, and 18,539 ± 10,248 μg/L, respectively. Average
concentrations for soluble and total nickel in the SCR effluent were 94 ± 51 μg/L and
18,213 ± 9,861 μg/L, respectively (Table 3.3).
According to the estimation, based on the removal efficiencies, made for the
copper and nickel removed in the SCR, the amount of copper and nickel sulfides
generated should have been of 22.57 g. A final mass balance was also performed on
metals precipitated on the sand. The difference in mass of the sand before and after
period II was of 30.44 grams. Based on metal extraction on sand, 33.7 g of metals
combined were recovered (Table 3.4).
Based on the amount of metals introduced in the system, a total of 20.8 g for
copper and 20.4 g for nickel; and the total removal efficiency of the system, 90.9 for
copper and 90.8 for nickel; the total amount of metal removed in the system was 37.43 g.
Assuming that this metals precipitated as CuS and NiS, that is one mol of sulfide per mol
of metal (Table 3.5), the total mass retained by the system was 57.1 g, of which 28.5 were
129
from copper sulfides and 28.6 g from nickel sulfides. The sand retained a total of 30.4 g
of combined copper and nickel sulfides (Table 3.4) which corresponds to a retention
efficiency of 53.5%.
3.4.2. Sand Characterization
The sand in the SCR was analyzed to study and characterize the components
present on its surface and the chemical form in which they precipitated. Figure 3.10
shows the scanning electron microscopy (SEM) images of the sand at three different
times; at the beginning, after one day of treatment, and at the end of treatment. The EDS
analyses for sand before and after treatment for period II are shown in Figure 3.11. The
properties of the sand surface can be clearly seen in these figures. The clean sand (before
treatment) presents an uneven rough surface with angular edges (Figure 3.10a), and the
EDS analysis clearly shows the absence of copper, nickel, and sulfur in the sand (Figure
3.11a). However, after one day of treatment a small amount of deposition can be seen on
the surface of the sand (Figure 3.10b) as evidenced by the appearance at small peak for
the elements S, Cu and Ni (Figure 3.11c). Traces of Ni and S are also evident after one
day even on one scatting of the sand surface with no apparent precipitation (Figure
3.11b). As deposition continued for the entire period II, the evidence for Cu, Ni and S
becomes compelling with large peaks for the elements (Figure 3.11d). The formation of
precipitates is clearly visible. The precipitation on the sand surface is not uniform. During
the first day of operation, precipitation occurs only around certain points; at the end of the
experiment the sand granule appears completely covered with metal sulfides as it is

130
shown by the EDS analysis performed in the surface of the sand (Figure 3.11d).
Precipitation growth appears to continue from the initiation points; eventually each
growth point mixes together accounting for complete surface coverage. An XRD analysis
was performed on the coated sand in duplicate. The results show that the main crystalline
structure is that of the silica sand core. Other crystalline forms are secondary and almost
non-existent (Figure 3.12). The results therefore indicate metals are largely precipitating
as amorphous rather than crystalline material.
F
F
Figure 3.1. Su
Figure 3.2. Re
00000000001
Met
hane
(mg
CH
4/Li
nfflu
ent)
ulfide concen
eactor perform
.0
.1
.2
.3
.4
.5
.6
.7
.8
.9
.0
500
I
ntration in the
mance during
520
I
I
BR effluent (operation
g the differentinfluent).
540
Time (
(in mg S2-/L) n.
t periods. Met.
560
(Days)
II
II
during the di
thane product
580
ifferent period
tion (in mg C
600
III
III
131
ds of
H4/L
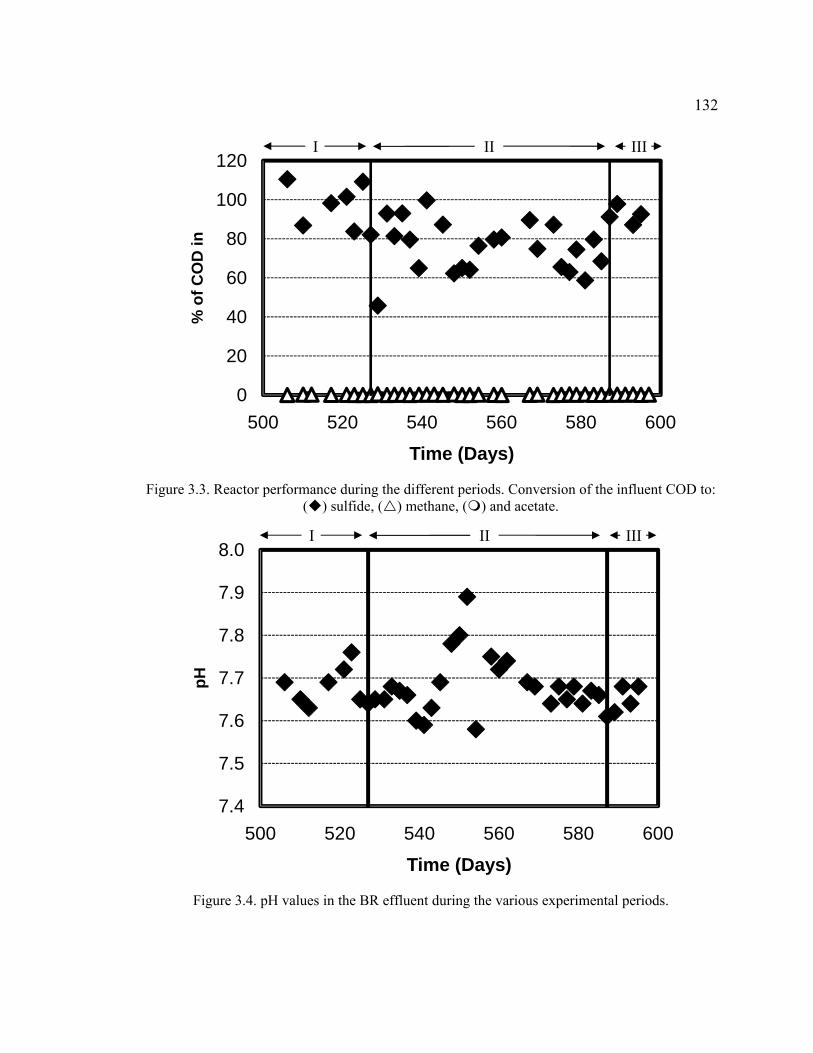
132
Figure 3.3. Reactor performance during the different periods. Conversion of the influent COD to:
( ) sulfide, ( ) methane, ( ) and acetate.
Figure 3.4. pH values in the BR effluent during the various experimental periods.
0
20
40
60
80
100
120
500 520 540 560 580 600
% o
f CO
D in
Time (Days)
7.4
7.5
7.6
7.7
7.8
7.9
8.0
500 520 540 560 580 600
pH
Time (Days)
I III II
I III II
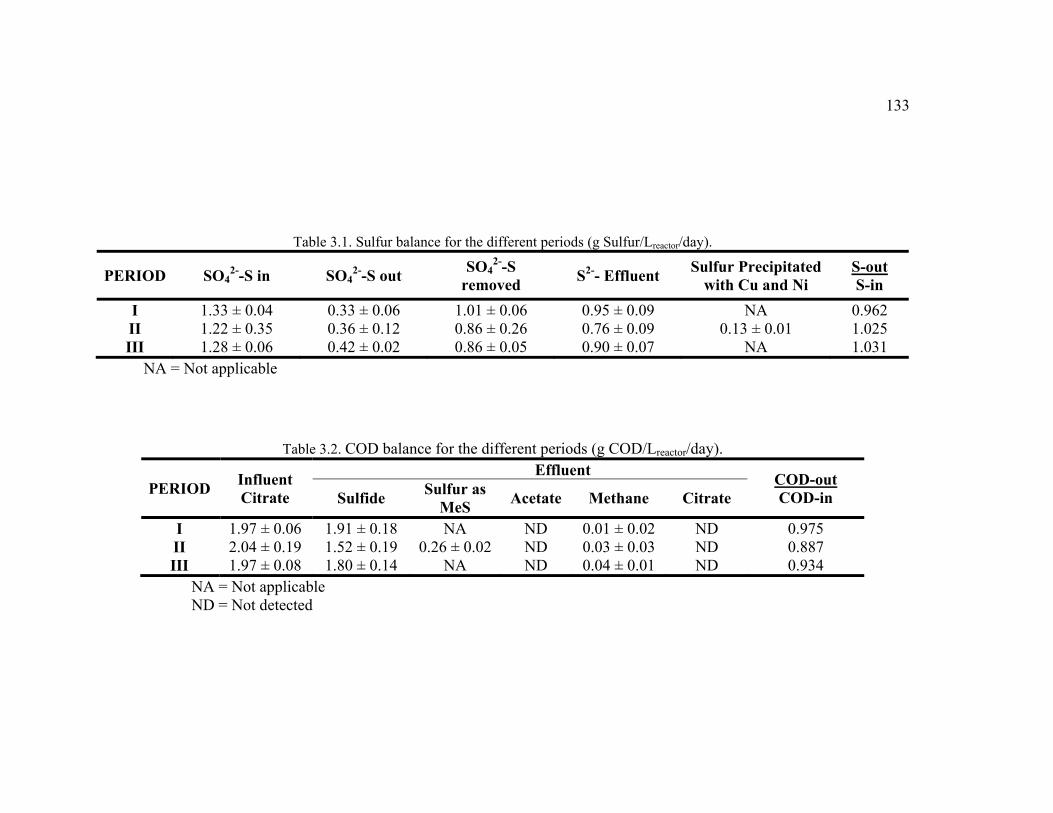
133
Table 3.1. Sulfur balance for the different periods (g Sulfur/Lreactor/day).
PERIOD SO42--S in SO4
2--S out SO42--S
removed S2-- Effluent Sulfur Precipitated with Cu and Ni
S-out S-in
I 1.33 ± 0.04 0.33 ± 0.06 1.01 ± 0.06 0.95 ± 0.09 NA 0.962 II 1.22 ± 0.35 0.36 ± 0.12 0.86 ± 0.26 0.76 ± 0.09 0.13 ± 0.01 1.025 III 1.28 ± 0.06 0.42 ± 0.02 0.86 ± 0.05 0.90 ± 0.07 NA 1.031
NA = Not applicable
Table 3.2. COD balance for the different periods (g COD/Lreactor/day).
PERIOD Influent Citrate
Effluent COD-out COD-in Sulfide Sulfur as
MeS Acetate Methane Citrate
I 1.97 ± 0.06 1.91 ± 0.18 NA ND 0.01 ± 0.02 ND 0.975 II 2.04 ± 0.19 1.52 ± 0.19 0.26 ± 0.02 ND 0.03 ± 0.03 ND 0.887 III 1.97 ± 0.08 1.80 ± 0.14 NA ND 0.04 ± 0.01 ND 0.934
NA = Not applicable ND = Not detected
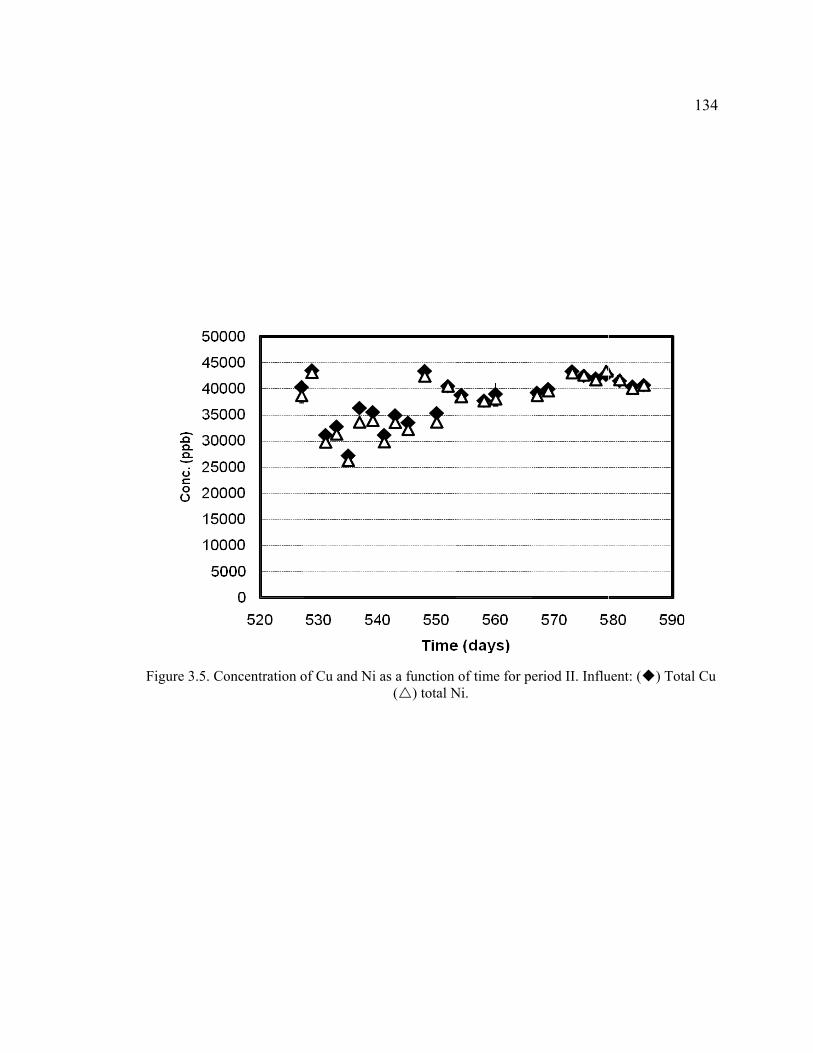
F
Figure 3.5. Co
oncentration oof Cu and Ni a
as a function ( ) total N
of time for peNi.
eriod II. Influuent: ( ) Tot
134
tal Cu

Figure 3.6. C
Figure 3.7. C
Concentration
Concentration
n of soluble co
n of total coppMid
opper as a fun( ) Effluen
per as a functidpoint, ( ) E
nction of timent.
ion of time foEffluent.
e for period II
or period II. (
I. ( ) Midpo
) Influent, (
135
oint,
( )

F
Figure 3.8. Co
Figure 3.9. C
oncentration o
Concentration
of soluble nick
n of total nickMid
kel as a functEffluent.
kel as a functidpoint, ( ) E
tion of time fo
on of time foEffluent.
or period II. (
r period II. (
) Midpoint
) Influent, (
136
t, ( )
( )

137
Table 3.3. Copper and nickel average concentrations and removal efficiencies on the system.
Copper Nickel Soluble Total Soluble Total
Influent Concentration (μg/L) 38,143 ± 4,420 37,347 ± 4,945 SCR Concentration (μg/L) 49 ± 35 18,539 ± 10248 94 ± 51 18,213 ± 9861BR Concentration (μg/L) 43 ± 25 2,768 ± 3750 76 ± 36 2,658 ± 3822
SCR Removal Efficiency (%) 99.8± 0.3 31.3 ± 19.3 99.6 ± 0.3 40.6 ± 33.6 BR Removal Efficiency (%) 0.1 ± 0.3 59.6 ± 23.6 0.2 ± 0.3 50.2 ± 32.8
System Removal Efficiency (%) 99.9 ± 0.1 90.9 ± 16.0 99.8 ± 0.1 90.8 ± 16.4
Table 3.4. Mass balance for copper and nickel recovered in sand. Mass Balance on Sand
(for the two metals) Mass Balance based on Removal Efficiency Mass Balance on Sand
Extractions
Initial (g) End (g) Difference
(g) Element Volume Treated
(L)
Metal Concentration
(mg/L)
Removal Efficiency
(%)
Metal Removed
(g)
Metal as MeS (g)
Metal extracted
(g Me/ g Sand)
Metal in Sand
(g)
Metal as MeS (g)
148.57 179.01 30.44 Cu 544.9 38.14 31.3 6.50 9.79 0.0555 9.94 14.95 Ni 544.9 37.35 40.6 8.26 12.78 0.0678 12.14 18.77
Table 3.5. Molar balance on metal precipitates
Mass precipitated (g/Lreactor/day)
Moles precipitated (Mole/Lreactor/day)
Molar ratio Metals Sulfur
Sulfur 0.13 0.0041 0.921 Copper 0.12 0.0018
Nickel 0.11 0.0019

138
Figure 3.10. SEM images from sand granules (A) before, (B) after 1 day, and (C) at the end of treatment in period II. Squares in figures (A) and (C) represent sampling area for EDS study.
Points 1 and 2 in figure (B) represent sampling points for EDS.

139
Figure 3.11. EDS analyses of (A) sand before treatment, (B) sand after one day of treatment; EDS on clean surface (point 1 in Figure 3.11B), (C) sand after one day of treatment; EDS on crystal-like points (point 2 in Figure 3.11B), (D) sand after treatment with copper and
nickel in period II.
A B
C D
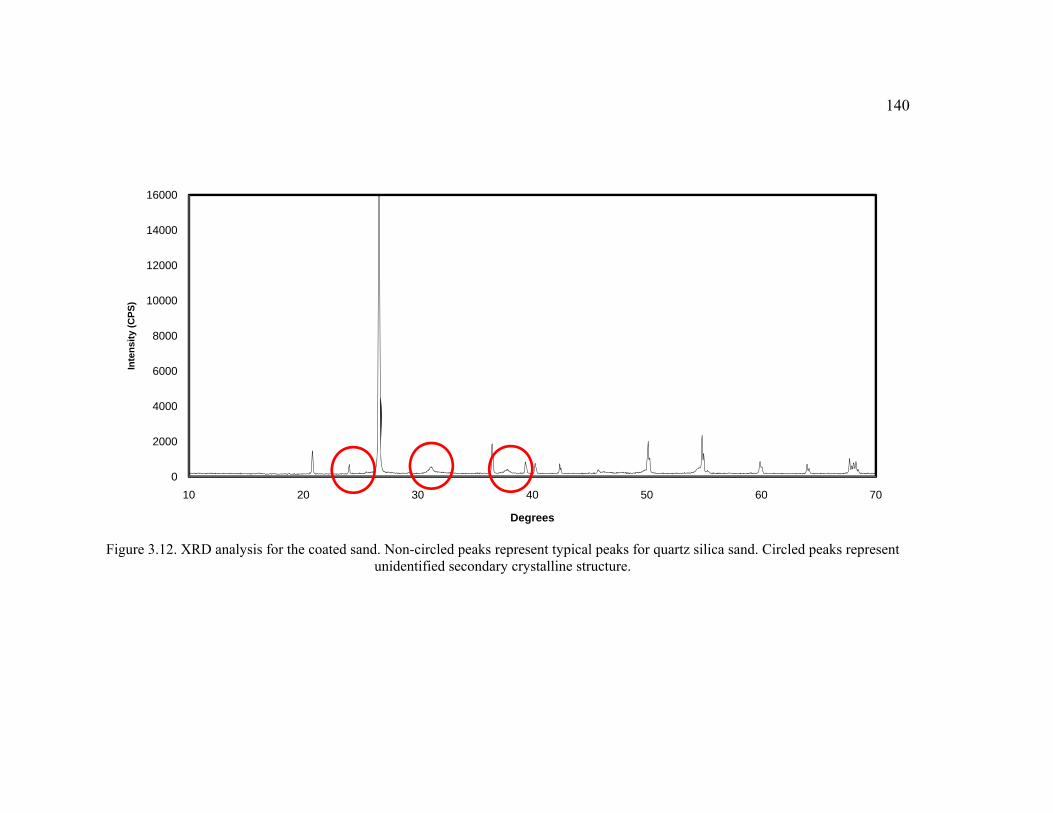
140
Figure 3.12. XRD analysis for the coated sand. Non-circled peaks represent typical peaks for quartz silica sand. Circled peaks represent
unidentified secondary crystalline structure.
0
2000
4000
6000
8000
10000
12000
14000
16000
10 20 30 40 50 60 70
Inte
nsity
(CPS
)
Degrees

141
3.5. Discussion
The feasibility of simultaneous heavy metal precipitation using a coupled SCR
and a BR was studied. The system is designed so precipitation of metals occurs inside the
SCR. In this study the ability of sand granules to serve as nucleation points for formation
of metal sulfide crystals, as well as if crystal formation occurs on the sand surface was
evaluated in this study. The results are compared to the performance observed in other
studies where only one metal is precipitated, and the effects of simultaneous precipitation
on the removal of metals inside the SCR, are determined. For the purpose of this study,
copper and nickel were used as the target contaminants for removal and recovery. Citrate,
a compound easily found in nature and readily biodegradable (Antranikian and Giffhorn
1987) was chosen as organic contaminant.
3.5.1. Reactor Performance
The reactor was maintained operational during three different periods, being the
first and third periods metal-free. Copper and nickel were fed simultaneously to the
system during the second period. Organics were loaded to the BR in the form of citrate at
an average rate of approximately 2 g COD/Lreactor/day. A high organic removal of around
100% was observed in the reactor (Table 3.2). As observed in other studies acetate is the
main product of citrate anaerobic degradation (Chapter 4). However, neither citrate nor
acetate was detected in the effluent of the system. This is expected since citrate has been
proven to degrade readily under anaerobic conditions (Antranikian and Giffhorn 1987).

142
Observation of Table 3.2 shows that most of the COD in the influent was recovered in the
form of sulfide in periods I and III. On period II the aqueous sulfide concentration
decreased. Nevertheless, this value is lower due to the precipitation of sulfide with the
metals present in this period.
It is well known that methanogens and sulfate reducers compete for citrate and
acetate utilization (Bhattacharya et al. 1996; Colleran et al. 1995; Oude Elferink et al.
1994). However, results obtained in this study show a complete out-competition of
sulfate reducers over methanogens. Previous studies on this competition show conflicting
results. Out-competition of both sulfate reducers and methanogens has been observed
even under non-limiting sulfate conditions (Bhattacharya et al. 1996; Colleran et al. 1995;
Lens et al. 1998; Oude Elferink et al. 1994). Many different parameters can affect the
result of the competition between methanogens and sulfate reducers like pH, COD to
sulfate ratio, loading rates, acetate concentrations, etc. For this study a main factor
favoring sulfate reducers was the low COD to sulfate ratio (0.56 g/g) at to which the BR
was exposed throughout this experiment, and in previous studies, totaling an amount of
time of approximately 600 days. Studies by Bhattacharya et al. (1996), show that when
the influent COD to sulfate ratio is lower than 0.71 g/g, sulfate reducers outcompete
methanogens, while for ratios exceeding 3.56 g/g methanogens outcompete sulfate
reducers. The long exposure of the BR to these conditions favored sulfate reduction over
methanogenesis.
Heavy metals are known to inhibit microorganisms and this effect has been
studied heavily in the past (Fang 1997; Hollingsworth et al. 2005; Karri et al. 2006; Ram

143
et al. 2000; Utgikar et al. 2001). Previous studies also suggest that heavy metals are more
toxic when in their soluble form (Jin et al. 1998). The results presented in Figure 3.3 and
Tables 3.1 and 3.2 show that approximately an inhibition of 14.9% is seen in sulfate
reduction in the BR even after the end of exposure of the system to metals.
One of the main objectives of the SCR is to prevent direct contact between high
metal concentrations and the biomass present in the BR so as to prevent toxicity. Soluble
metals were removed to a great extent in the SCR, so they should not have a negative
effect on the performance of the BR. However, results show that a considerable amount
of non soluble metal sulfides were not retained in the SCR so they were carried to the BR
(Table 3.3). Inhibition due to cell membrane obstruction by non-soluble metal sulfides
has been reported elsewhere (Utgikar et al. 2002). These metal sulfides carried to the BR
may have induced the reduction in activity by attaching to the bacterial floccules and
preventing contact between the bacterial cell and the aqueous medium.
3.5.2. Soluble Metal
Simulated wastewater containing copper and nickel with average influent
concentrations of 38.1 ± 4.4 and 37.4 ± 5.0 mg/L, respectively, was treated with the SCR-
BR system. The system configuration used in this experiment was an innovative
approach for the removal of metals. A previous experiment studied by Sierra-Alvarez et
al. (2007), used this system to remove copper from simulated semiconductor wastewaters
with influent copper concentrations as high as 75 mg/L, presenting high removal

144
efficiencies. Concentrations up to 100 mg/L of copper were achieved in a similar system
in the experiment presented in Chapter 2 with removal efficiencies around 99.9% for
soluble copper. The first report found using this type of configuration was as a method
for drinking water softening and calcium carbonate removal in wastewater (van Langerak
and Hamelers 1997).
Soluble metal removal occurred mainly in the SCR with removal efficiencies of
soluble metals above 99% for both copper and nickel (Table 3.3). In this study soluble
metals are considered to be those particles or complexes able to pass a 45μm filter. Little
to no soluble metal removal or dissolution from precipitant occurred inside the BR. Metal
sulfides are known to have low solubility in water (Benjamin 2002). Due to this low
solubility when copper and nickel in the influent are put in contact with water with high
sulfide content, instantaneous precipitation occurs, hence the efficient removal of soluble
heavy metals inside the SCR.
Residual soluble copper concentration was consistently present at a lower
concentration than nickel both in the midpoint (after SCR) as well as in the effluent of the
system (Table 3.3). This is expected when comparing the solubility constants of both
nickel and copper sulfides. Copper sulfide has a solubility constant of 10-36.0 and nickel
sulfide a solubility constant of 10-18.5 (Benjamin 2002; Kaksonen 2004). Sulfur and metal
mass balances indicate that the ratio of metal to sulfur in the metal sulfides formed is 1:1
(Table 3.5). Based on this result, and the concept of solubility constant, it is expected that
if the sulfide concentration at which copper and nickel are exposed is the same, then
nickel concentrations must be higher due to its respective higher solubility constant.

145
3.5.3. Total Metal Removal
The study of total metal removal efficiency serves to determine the capacity of the
system to effectively immobilize the metal input on the system. It will also serve the
purpose of establishing on which part of the system most of this immobilization is
occurring. By design is desirable that most of the total metal is retained in the SCR
facilitating later removal and avoiding any negative outcome that the input of metals may
have in the BR to sulfate reducing bacteria, as previously discussed.
Total metal removal in the system had an efficiency of 90.9% for copper and a
similar 90.8% for nickel (Table 3.3). Nevertheless, less than half of the removed total
metal occurred inside the SCR. Metal removal inside the SCR for this study was of only
31.3% and 40.6% for both copper and nickel sulfides, respectively. This is low compared
to more than 90% reported in other studies with similar systems (Sierra-Alvarez et al.
2007), and the efficiency observed for some periods of the experiment presented in
Chapter 2, with only copper as contaminant metal. The decrease in removal inside the
SCR may be related to the simultaneous precipitation of both nickel and copper, which
may have interfered with the effectiveness of the sand inside the SCR.
The main objective of the SCR was to retain the metal sulfides formed inside the
reactor. In Chapter 2 it is demonstrated that the main form of total metal removal inside
the SCR for copper was crystallization of copper sulfides on the sand surface. However,
XRD analyses in this study do not show a clear crystal structure formed on the sand
surface (Figure 3.12). The lack of crystalline structure on the sand surface does not
eliminate the possibility of crystallization occurring elsewhere in the system.

146
Crystallization is a complex process affected by several parameters like hydrodinamics,
local supersaturation, residence time, and others (Al-Tarazi et al. 2005). The
aforementioned parameters usually determine the type of crystallization that occurs,
either homogeneous or heterogeneous, as well as the rate of nucleation and crystal
growth. Particles formed in the aqueous medium, can also agglomerate on the sand
surface, in the form of amorphous precipitation. All the previous processes affect the
ultimately efficiency that the SCR has, to retain metal sulfides.
3.5.3.1. Homogeneous Nucleation
In homogeneous nucleation the compound starts crystallizing without the help of
an external agent (particles). During the current experiment a brownish and cloudy
precipitant was formed inside the SCR as the recycling stream and the influent stream
went inside the reactor. The presence of cloudiness in the reactor may also indicate that
homogeneous nucleation is an important precipitation process occurring in the system
alongside with precipitation on sand surfaces.
Homogeneous nucleation has been observed before in experiments with nickel
and copper sulfides. Veeken et al. (2003), working at a pH of 6.0, reported difficulties
with copper sulfides precipitates while trying to selective precipitate different metals.
They report the formation of a cloudy precipitant with copper sulfide particles smaller
than 0.45 μm being formed. Fines formation has also been reported for nickel sulfides on
fluidized seeded reactors (Lewis and Swartbooi 2006). Some reports indicate that for
147
metal sulfides to form crystalline precipitates the solution needs to be acidic (low pH). If
the pH is alkaline or neutral, a colloidal precipitate is formed and stays in that condition
(Vogel 1996). The pH in the system presented here was always above neutral range
(Figure 3.4), which will favor homogeneous nucleation of both copper and nickel
sulfides.
The formation of these small particles of metal sulfides is mainly due to the
extremely low solubility constant of metal sulfides. The concentrations of Cu, Ni and
sulfide found in this experiment create conditions of high supersaturation. For systems
such as the one presented here where instantaneous precipitation occur due to high
supersaturation, hydrodynamic factors, such as micromixing become much more
important and effectively affects particle size distribution (Van Hille et al. 2005).
Comparisons of the system presented here with the only-copper system presented in
Chapter 2 shows that although fine formation is obvious in this system, hydrodynamic
factors did not play an important role. In the previous system with the same flow
parameters fine formations was not significant, this indicates that other factors affected
fines formation.
Lewis and Swartbooi (2006) found that nickel sulfide fines did not aggregate after
being formed, and the same occurred for copper sulfides. Visual observations of the
system indicate that fine formation clearly occurred inside the SCR. On the other hand,
results from total and soluble metal concentrations also indicate that aggregation of
particles was high enough to increase the particle size above 45 μm (to analyze soluble
metals the sample was filtered through a 45 μm membrane). However, the increment in
148
size could have been not enough to promote particle settling so particles were carried
outside the SCR. Fine formation clearly contributed to the low efficiency removal of
metal sulfides, but as observed in Figures 3.10 and 3.11, some metal was still retained by
the sand, and other mechanisms beside fine formation could have affected removal
efficiency.
3.5.3.2. Heterogeneous Precipitation
High rates of homogeneous nucleation are found in systems with supersaturation.
In heterogeneous nucleation impurities are present and serve as nucleation points. Some
studies show that if enough surface area for nucleation is provided by the impurities,
heterogeneous nucleation can outcompete homogeneous nucleation (Mersmann 1999;
Sear 2006; Van Hille et al. 2005). In this system, sand granules should provide enough
surface area to promote heterogeneous nucleation, as observed in Chapter 2.
Unlike the behavior observed for soluble metals where the removal efficiency and
effluent concentrations were relatively constant throughout the experiment, the efficiency
removal of total copper and nickel presented a different behavior than that of soluble
metals. The concentration of total metals for the MP (effluent of the SCR) shows a
noticeable tendency to increase for both copper and nickel through the duration of the
experiment (Figures 3.7 and 3.9). Total copper increases at a rate of 0.366 mg/L/day
(r2=0.4791), while total nickel increases at a rate of 0.339 mg/L/day (r2=0.4982). This
149
may be an indication of the structure of the metal sulfides present in the surface of the
sand.
SEM, EDS and XRD analyses were performed in order to study the structure and
composition of the precipitate on the sand surface. EDS studies show that the surface of
the sand at the beginning of the experiment was completely metal free. However after
just one day of treatment SEM images show the presence of some precipitates on the
clean sand surface (Figure 3.10b). Furthermore, EDS studies show that visible
precipitates are composed of nickel, copper and sulfur (Figure 3.11c). Crystal structures
usually present a well defined structure with rigid planes or smooth surfaces (Mullin
2001). SEM images of the sand show the absence of such characteristics (Figure 3.10c).
XRD studies show that the sand has none or very little crystalline structure besides the
inherent crystalline structure of the sand. This indicates the absence of a significant
amount of formed crystalline metal sulfides. XRD techniques have a low sensitivity and
concentrations above 2% are needed to detect a crystalline structure. Results obtained for
Cu only medium (Chapter 2) show that under similar, hydrodynamic and chemical,
conditions covellite formed in enough quantities to be detected by this technique.
The results obtained by EDS and SEM show that simultaneous precipitation of
both copper and nickel sulfides occurred in the system. The fact that no crystalline
structure is observed may indicate that some kind of interference may be occurring that
may have affected the crystal formation process observed in previous studies as the one
done by Sierra-Alvarez (2007), and the one presented in Chapter 2. The effectiveness of

150
those systems was in great part due to the formation of covellite crystals on the sand
surface. Crystals have a more rigid structure and are less prone to attrition.
The lack of a crystalline structure for the metal sulfides in the system promotes
attrition due to the friction at which the sand granules are exposed in the fluidized bed.
Previous experiments show that fine formation due attrition is significant for nickel
hydroxyl–carbonate systems, and has been studied in nickel sulfide systems (Lewis and
Swartbooi 2006). Figures 3.10 and 3.11 show that at the end of the experiment the sand
presents an uneven rough surface composed of mainly metal sulfides meaning that
amorphous precipitation is occurring. Due to its rough surface sand granules are more
prone to attrition due to friction between them inside the fluidized bed in the SCR.
Metal sulfides removed from the surface could have been carried away as fine
suspended particles from the SCR into the BR. Low concentrations of total metal in the
effluent of the BR (Table 3.3) indicate that metal sulfides were then retained by the
biofilms in the BR. Physical entrapment or agglomeration of metal sulfides between the
microbial floccules in the BR may explain this phenomenon. Previous studies indicate
that entrapment of metal sulfides by biofilms is a common phenomena (Utgikar et al.
2002; White and Gadd 2000).
151
4. ANAEROBIC DEGRADATION OF CITRATE UNDER SULFATE REDUCING
AND METHANOGENIC CONDITIONS
4.1. Abstract
Citrate is an important component of metal processing effluents such as chemical mechanical planarization wastewaters of the semiconductor industry. Citrate can serve as an electron donor for sulfate reduction applied to promote the removal of metals, and it can also potentially be used by methanogens that coexist in anaerobic biofilms. The objective of this study was to evaluate the degradation of citrate with sulfate-reducing and methanogenic biofilms. During batch bioassays, the citrate, acetate, methane and sulfide concentrations were monitored. The results indicate that independent of the biofilm or incubation conditions used, citrate was rapidly fermented with specific rates ranging from 566 to 720 mg chemical oxygen demand (COD) consumed per gram volatile suspended solids per day. Acetate was found to be the main fermentation product of citrate degradation, which was later degraded completely under either methanogenic or sulfate reducing conditions. However, if either sulfate reduction or methanogenesis was infeasible due to specific inhibitors (2-bromoethane sulfonate), absence of sulfate or lack of adequate microorganisms in the biofilm, acetate accumulated to levels accounting for 90–100% of the citrate-COD consumed. Based on carbon balances measured in phosphate buffered bioassays, acetate, CO2 and hydrogen are the main products of citrate fermentation, with a molar ratio of 2:2:1 per mol of citrate, respectively. In bicarbonate buffered bioassays, acetogenesis of H2 and CO2 increased the yield of acetate. The results taken as a whole suggest that in anaerobic biofilm systems, citrate is metabolized via the formation of acetate as the main metabolic intermediate prior to methanogenesis or sulfate reduction. Sulfate reducing consortia must be enriched to utilize acetate as an electron donor in order to utilize the majority of the electron-equivalents in citrate.
152
4.2. Introduction
Citric acid (C6H8O7) is a common metabolite of living cells and is also a
ubiquitous compound abundant in nature; therefore, it is not surprising to find a large
variety of bacteria capable of citrate degradation. Citrate is mainly used in the food
industry and it was originally synthesized from citrus fruits, which have high contents of
this compound (Antranikian and Giffhorn 1987).
Citrate is also a naturally occurring chelating agent that forms soluble
multidentate complexes with metals. The ability of citrate to bind to metals is of special
interest to metal processing industries like the metallurgical, electroplating, nuclear, and
the semiconductor industry (Chen and Huang 2007; Francis et al. 1992; Golden et al.
2000; Juang et al. 2006; Thomas et al. 2000). In the semiconductor industry citrate is
mainly used in the chemical mechanical planarization (CMP) step of the fabrication, and
is an important component of the wastewaters generated by this process (Golden et al.
2000). In the nuclear industry, as well as in the electroplating industry, it is generally
found in the waste stream chelating metals of interest such as uranium, copper, and nickel
(Chen and Huang 2007; Francis et al. 1992; Juang et al. 2006). Citrate has also been
applied to the remediation of heavy metal laden soils, by mobilization and concentration
of the metals (Thomas et al. 2000).
Knowledge of the mechanism of citrate degradation is of importance for the
biological treatment of metal processing wastewaters. Citrate can potentially serve as an
electron donor for sulfate reduction applied to promote the removal of metals (Foucher et
al. 2001; Hulshoff Pol et al. 2001; Quan et al. 2003; Tabak et al. 2003), and it can also
153
potentially be used by methanogens that coexist in anaerobic biofilms. Complete
degradation of citrate to CO2 by aerobic bacteria is known to proceed via the tricarboxylic
acid (TCA) cycle (Antranikian and Giffhorn 1987). Under anaerobic conditions, bacteria
cannot fully oxidize citrate with the TCA cycle due to the limited possibilities of
recycling reduced electron carriers. In order to degrade citric acid without elemental
oxygen, bacteria have developed unique fermentation pathways such as the production of
pyruvate, acetate and carbon dioxide, referred to as the ‘‘citrate fermentation’’ pathway
(Antranikian and Giffhorn 1987; Antranikian and Gottschalk 1989; Bott et al. 1995). The
pathway is initiated by citrate lyase that converts citrate to oxaloacetate and acetate.
Subsequently, oxaloacetate is converted to pyruvate and CO2 by oxaloacetate
decarboxylase (Antranikian and Giffhorn 1987).
The objective of this study is to evaluate the degradation of citrate under sulfate-
reducing and methanogenic conditions. Two microbial consortia were studied. One was a
sulfate-reducing granular sludge (SRS) obtained from a laboratory-scale citrate- fed
bioreactor, which had the ability to utilize acetate as an electron-donor for sulfate
reduction. The other consortium was a methanogenic granular sludge (MS) obtained from
a full-scale bioreactor treating recycled paper effluent. The time course of citrate
utilization and the formation of intermediates and end-products (i.e., acetate, methane,
sulfide) was monitored in the batch bioassays conducted under sulfate-reducing and
methanogenic conditions. Additional studies were performed to study the carbon and
chemical oxygen demand (COD) balances.
154
4.3. Materials and Methods
4.3.1. Microorganisms
Methanogenic granular sludge (MS) and the sulfatereducing granular sludge
(SRS) were obtained from an industrial upflow granular sludge bed (UASB)
methanogenic bioreactor treating recycle paper wastewater (Eerbeek, The Netherlands),
and from a laboratory-scale expanded granular sludge blanket (EGSB) bioreactor treating
citrate for the removal of copper, respectively. The latter bioreactor was operated for
approximately 750 days with citric acid (2.1–6.1 g/L) and non-limiting concentrations of
sulfate (COD/sulfate = 0.56), at a temperature of 30oC, and hydraulic retention times
ranging from 8 to 18 h. The content of volatile suspended solids (VSS) in MS and SRS
was 13.7 and 6.1% (wet weight), respectively. The microbial cultures were elutriated to
remove the fines from biofilm granules and stored under nitrogen gas at 4oC.
4.3.2. Basal Media
The basic anaerobic basal mineral medium used in the all the experiments
contained (in mg/L): NH4Cl (280), KCl (270), K2HPO4 (169), CaCl2 •2H2O (10), MgCl2 •
6H2O (150), yeast extract (20), and 1 mL/L of trace element solution. The trace element
solution contained (in mg/L): H3BO3 (50), FeCl2 • 4H2O (2,000), ZnCl2 (50), MnCl2 •
4H2O (50), (NH4)6Mo7O24 •4H2O (50), AlCl3•6H2O (90), CoCl2•6H2O (2,000), NiCl2
•6H2O (50), CuCl2 •2H2O (30), NaSeO3•5H2O (100), EDTA (1,000), resazurin (200) and
36% HCl (1 mL/L).

155
For all the studies the pH of the medium was adjusted to a value of 7.2. Potassium
phosphate dibasic was used as a buffer at a concentration of 8,700 mg/L for the carbon
distribution studies. Sodium bicarbonate was used as a buffer at a concentration of 5,000
mg/L for all the other experiments.
4.3.3. Biodegradation Batch Bioassays
The degradation of citrate (1,800 mg/L) was studied in the presence and absence
of sulfate (1,334 mg/L). Some assays were supplied with 2-bromoethane sulfonate (BES,
6,300 mg/L), a methanogenic inhibitor, to study the degradation of citrate by sulfate-
reducing bacteria only. Background controls were not supplied with citrate to determine
the endogenous production of sulfide, acetate, and methane.
The experiments were performed in 330 mL serum flasks sealed with rubber
septa. The anaerobic sludge was previously acclimated for 24 h under the conditions of
the experiment and then transferred to flasks (1.5 g VSS/L) containing 200 mL of the
mineral medium. The headspace of the serum flasks was flushed with N2/CO2 (80/20, v/v)
for 5 min and then flasks were incubated at 30 ± 2oC. Methane, sulfide, and acetate
production, as well as citrate consumption, were measured one to three times a day,
depending on the activity observed for each experiment.
Methane production was calculated from the volume of the headspace and the
methane percentage composition in the biogas as determined with a gaslock syringe. Net
cumulative methane, sulfide, and acetate production were calculated by subtracting
156
background production in the endogenous control to obtain the net production in the test
flask.
The maximum production and degradation rates for methane, acetate, sulfide, and
citrate were calculated from the slope of the cumulative consumption or production for
each case (mg COD) versus time (days) and the biomass concentration at the end of the
assays, as the mean value of duplicate assays.
4.3.4. Acetogenic Assays
An experiment was performed to study the autotrophic acetogenic activity of the
utilized sludge using only H2 as electron donor. No sulfate was provided, and
methanogenesis was inhibited by adding BES to the mineral medium. The anaerobic
basal mineral medium (pH 7.2) used in acetogenic bioassays contained (in mg/L): NH4Cl
(280), KCl (270), K2HPO4 (169), CaCl2•2H2O (10), MgCl2•6H2O (150), yeast extract
(20), and 1 mL/L of trace element solution. The medium contained 5,000 mg/L of sodium
bicarbonate as buffer and carbon source.
The experiments were performed in 160 mL serum flasks with rubber septa. The
sludge was previously acclimated for 24 h under the conditions of the experiment and
then transferred to flasks (3 g VSS/L) containing 50 mL of the mineral medium.
The headspace of the flasks was then flushed with H2/CO2 (80/20, v/v) for 10 min
to assure that the atmosphere was completely replaced. The flasks were then incubated at
30 ± 2oC. Acetate production was then measured and the maximum specific acetogenic
157
activities were calculated from the slope of the cumulative acetate production (mg) versus
time (days) and the biomass concentration at the end of the assays, as the mean value of
triplicate assays.
4.3.5. Carbon Distribution Experiments
In order to study the distribution of the citrate’s carbon on the different
metabolites and products, a study was conducted using a sulfate-free medium.
Methanogenesis was inhibited using BES. The medium contained citrate and BES with a
concentration of 2,752 and 6,330 mg/L, respectively.
The experiments were performed in 330 mL serum flasks sealed with rubber
septa. The anaerobic sludge was previously acclimated for 24 h under the conditions of
the experiment and then transferred to flasks (1.5 g VSS/L) containing 150 mL of the
mineral medium. The headspace of the serum flasks was flushed with N2 gas for 5 min
and then flasks were incubated at 30 ± 2oC. Acetate and CO2 production, as well as citrate
consumption, were measured one to three times a day, depending on the activity observed
for each experiment. CO2 production was calculated from the volume of the headspace
and the CO2 percentage composition in the headspace as determined with a gas-lock
syringe. Then this concentration was converted to total CO2 using the following
expressions:

158
(4-1)
(4-2)
where: Tot CO2 = Total inorganic carbon in system (mmol/Lliquid); PCO2 = Partial
pressure of CO2 (atm); F = VH/VL; VH = Volume of headspace (l); VL = Volume of liquid
(l); T = Temperature (oK); R = Universal gas constant (atm L/mol/K); H = Dimensionless
Henry’s constant (1.2); α0 = Molar fraction of H2CO3 of dissolved inorganic carbon
species; Ka1, Ka2 = Acidity constants for CO2 (10-6.35 and 10-10.33, respectively).
Net cumulative acetate and CO2 production were calculated by subtracting
background production in the endogenous control to obtain the net production in the test
flask. The concentrations of acetate, CO2 and citric acid were plotted in a concentration
(mM) versus time (days) graph. The CO2 was plotted as mmoles of total inorganic carbon
per liter of liquid.
4.3.6. Analytical Methods
The acetate concentration in liquid samples and the methane concentration in the
flask headspace for the batch bioassays were determined by gas chromatography (GC)
using an HP5290 Series II system (Agilent Technologies, Palo Alto, CA) equipped with a
flame ionization detector and a Nukol fused silica capillary column (30 m length 9 0.53
( )FRTP
COTOTxH
CO
+=
0
2
12α
[ ] [ ]2211
0
1
1
++
×++
=
HKaKa
HKaα

159
mm ID, Supelco, St Louis, MO). The carrier gas was helium at a flow rate of 11 mL/min
and a split flow of 84 mL/min. For acetate measurements the temperatures of the column,
injector port, and detector were 140, 180 and 275oC, respectively. For methane the
temperatures of the column, injector port, and the detector were 140, 180, and 250oC,
respectively. CO2 was analyzed by gas chromatography using an HP5290 Series II system
equipped with a thermal conductivity detector and a Carboxen 1010 Plot column (30 m
length x 0.32 mm I.D., Supelco, St. Louis, MO). Helium was used as carrier gas at a flow
rate of 18.2 mL/min and a split flow of 33.5 mL/min. The temperature of the column was
250oC, with a temperature for the injector port and the detector of 230oC.
Sulfide was analyzed colorimetrically by the methylene blue method (Truper and
Schlegel 1964). Citrate was analyzed by ion chromatography with suppressed
conductivity using a DIONEX DX-500 system equipped with an AS11-HC4 column
(Dionex, Sunnydale, CA). The mobile phase had a gradient of 0.67 mM KOH/min going
from 20 to 30 mM at a flow rate of 1.2 mL/min. The column was maintained at room
temperature. The injection volume was 25 μl. The VSS content in sludge samples was
determined according to Standard Methods for Examination of Water and Wastewater
(APHA 2005). The pH was determined before and after each experiment with an Orion
model 310 PerpHecT pH-meter with a PerpHecT ROSS glass combination electrode.

160
4.3.7. Chemicals
All chemicals used were reagent grade or better. Sodium citrate tribasic, dihydrate
(C6H5Na3O7 • 2H2O, >99%), sodium sulfate (Na2SO4, >99%), and 2-bromoethane
sulfonate (98%) were obtained from Sigma–Aldrich Corp. (St Louis, MO, USA).
4.4. Results
4.4.1. Methanogenic and Sulfate-Reducing Activities of the Anaerobic Consortia
The SRS consortium used in the study had low methanogenic activities tested
with H2 and acetate as electron donors (Table 4.1). The methanogenic activities observed
for the MS consortium were considerably higher. The sulfidogenic activities of the SRS
indicated low activities with H2 and formate, but high activity with acetate as electron
donor. The results confirm that the SRS primarily links the oxidation of acetate to sulfate
reduction.
4.4.2. Citrate Degradation in the Presence of Sulfate
The MS and SRS were fed with citrate (1,000 mg citrate-COD/L) to study its
degradation under nonsulfate- limiting conditions (1.8 g SO42- /g COD) in the presence
and absence of the methanogenic inhibitor BES. Figures 4.1 and 4.2 show that citrate was
rapidly depleted from the medium after only 40 h of incubation in all the assays.
161
However, the microbial consortia behaved differently with respect to the final fate of the
reducing equivalents in citrate.
An initial accumulation of acetate was observed in the SRS independent of the
presence or absence of BES (Fig. 4.2). However, the acetate concentration steadily
decreased after approximately 30 h, and this decrease coincided with an increase in the
sulfide levels. The final concentration of sulfide corresponded to approximately 80% of
the citrate-COD consumed. By the end of the experiment, there was no detectable
residual of acetate. The results indicate conversion of citrate to acetate and subsequent
use of acetate for sulfate reduction. Methanogenic conversion of the acetate was not
evident in this consortium since no methane formation occurred in the absence of BES.
When MS was used, the pattern was distinct. In this case, the final fate of citrate
depended on the presence or absence of BES. In the absence of BES, citrate was
converted to acetate to a large extent at the beginning of the experiment, but after 40 h,
the acetate was transformed stoichiometrically to methane (Fig. 4.1). In the presence of
BES, citrate was stoichiometrically converted into acetate, a metabolite that accumulated
in the medium. A little bit of methane (up to 5% of the citrate-COD) was also observed
since BES did not inhibit methanogenesis completely. No sulfide production was
observed under any of the conditions studied with MS even though sulfate was supplied
in excess. The results indicate conversion of citrate to acetate and subsequent conversion
to methane. If methanogenesis was blocked by BES there was accumulation of acetate.
The methanogenic consortium was incapable of degrading acetate by sulfate reduction
(or any other electron donor).
162
4.4.3. Citrate Degradation in the Absence of Sulfate
The degradation of citrate by the two microbial consortia was also studied under
methanogenic and fermentative conditions in the absence of SO42-
as an external electron
acceptor. Figures 4.3 and 4.4 show the results obtained during these experiments,
indicating rapid citrate degradation in the absence of sulfate.
Again differences between the two types of consortia were observed with respect
to the final fate of the electron-equivalents in citrate. The MS followed a similar trend to
that observed under conditions in which sulfate was provided. The determining factor in
the fate of citrate was again found to be the presence or absence of BES. When BES was
provided, the final metabolite of citrate degradation was acetate, which was recovered in
near stoichiometric yields. However, when methanogenesis was not inhibited, the final
product was methane, after temporal accumulation of acetate, reaching a maximum
concentration around 40 h after the initiation of the experiment.
The SRS only converted citrate to acetate, which was not degraded further in the
absence of sulfate due to the low methanogenic activity in the consortium. Consequently,
BES had no impact on the outcome. Without SO42-, citrate was converted completely to
acetate, which accounted for 100% of the citrate-COD consumed.
163
4.4.4. Carbon Distribution Experiments
In order to better determine the stoichiometry of citrate fermentation, an
experiment was performed to measure the CO2 production from citrate while selectively
inhibiting methanogenesis. For this study, bicarbonate was removed as the selected buffer
and phosphate was used instead. This was done with the objective of avoiding any
interference a high background of bicarbonate might cause in measuring net production
of CO2. Likewise, exogenous inorganic C should be avoided to prevent acetogenesis of
any H2.
The results obtained in assays with MS and SRS show a similar trend where both,
acetate as well as CO2, are generated from citrate consumption (Fig. 4.5). Table 4.2
shows the carbon balances for the different sets of experiments at three different times.
At the end of the experiment, citrate is almost completely consumed in the case of SRS
and completely removed in the case of MS. The corresponding average acetate and CO2
concentrations are 51.5 and 26.2 mM of carbon for SRS, and 57.9 and 29.9 mM of
carbon for the MS, respectively. These results indicate that the carbon derived from
citrate is distributed between acetate and CO2 in a molar ratio of 2:1, and that these are the
only two metabolites containing carbon from citrate fermentation, since they account for
the initial carbon concentration added in the form of citrate. The data at the final time
point in Table 4.2 corresponds to a molar ratio of 1.96 and 1.99 mol acetate and CO2 per
mol citrate consumed, respectively, for the SRS; and a molar ratio of 2.01 and 2.06 mol
acetate and CO2 per mol citrate consumed, respectively, for the MS.

164
4.4.5. Rates of Citrate and Metabolite Degradation and Formation
Maximum specific activities observed during the degradation of citrate are
summarized in Table 4.3. Citrate degradation rates were similar in all the experiments
without any dependence on the type of sludge used or whether sulfate was present or
absent. Likewise the rates were not impacted by the presence or absence of BES. In all
cases, citrate was rapidly fermented with specific rates ranging from 566 to 720 mg COD
consumed/g VSS/day. Acetate accumulated as the major end-product in four bioassays
(MS spiked with BES in the presence and absence of SO42-; SRS without SO4
2- in the
presence and absence of BES). In those assays, the acetate production rates (Table 4.3)
accounted for 72 to 87% of the COD flux of citrate consumption. The lowest
accumulations of acetate occurred in the bioassays with the SRS and SO42- which is
consistent with the fact that the acetate production rate was nearly equal to the rate of
sulfate reduction production (which primarily used acetate as the electron).
The acetate accumulations were higher in the bioassays with the MS due to the
fact that the methanogenic activity was lower than the acetate production rate. The rates
of acetate consumption were in the same order of magnitude as sulfate reduction and
methanogenesis in the SRS and MS, respectively. These finding are in agreement with
the observation that acetate was the main electron donor for sulfide and methane
formation, respectively.
Table 4.4 summarizes the rates of acetate-C and CO2-C formation in the
phosphate buffered bioassays. The ratio of the acetate-C to CO2-C formation rates is

165
almost exactly equally to two. The fluxes are therefore consistent with the stoichiometries
which indicated 2 mol of acetate and 2 mol of CO2 formed per mol of citrate.

166
Table 4.1. Methanogenic and sulfidogenic activities for the different inocula.
Sludge Electron donor
Methanogenic activity (mg CH4-COD/gVSS/day)
Sulfidogenic activity (mg H2S-COD/gVSS/day)
Acetogenic activity (mg acetate-COD/gVSS/day)
Sulfate reducing
Acetate 8.3 ± 1.1 520.9 ± 6.8 NA H2 7.1 ± 0.4 87.3 ± 25.6 115.8 ± 2.44
Formate 19.5 ± 1.8 89.5 ± 4.46 NM
Methanogenic Acetate 174.3 ± 0.8 1.1 ± 0.1 NA H2 125.9 ± 34.7 3.8 ± 0.2 12.1 ± 0.80
NM not measured; NA not applicable
Table 4.2. Carbon distribution for the different conditions at three different times (beginning, middle and end of experiment).
CONCENTRATION (mM of Carbon)
Time
(hours) Citrate Acetate CO2 TOTAL Carbon
Ratio Acetate/CO2
Sulfate Reducer Sludge
2.0 86.55 ± 0.55 0.26 ± 0.15 0.34 ± 0.79 87.16 NA 59.5 54.65 ± 2.53 22.00 ± 1.09 10.04 ± 1.25 86.69 2.19 107.0 7.54 ± 5.51 51.50 ± 2.89 26.15 ± 1.44 85.19 1.97
Methanogenic sludge
2.0 86.37 ± 3.48 0.91 ± 0.22 0.04 ± 0.02 87.33 NA 59.5 22.27 ± 18.32 39.93 ± 7.03 20.61 ± 7.50 82.80 1.94 107.0 0.00 ± 0.00 57.88 ± 0.13 29.87 ± 0.86 87.74 1.94

167
Table 4.3. Maximum production-consumption rates for citrate, acetate, sulfide and methane under different conditions.
Maximum Rate of Production-Consumption (in mg COD / gVSS day)
Experiment Citrate Acetate CH4 H2S
Consumption Production Consumption Production Production
Sulfate Red. sludge
Sulfate BES 712.3 245.7 238.0 --- 252.4
No BES 638.2 219.7 167.0 --- 274.9
No Sulfate BES 601.3 524.0 --- --- ---
No BES 694.0 524.4 --- --- ---
Methanogenic Sludge
Sulfate BES 719.8 515.6 --- 12.6 ---
No BES 665.1 506.6 124.2 99.5 ---
No sulfate BES 566.0 416.2 --- 25.6 ---
No BES 633.2 414.6 116.4 137.8 ---
Table 4.4. Maximum rates of Production and consumption for the different carbon distribution studies .
Maximum Rates of Production-Consumption (mM of Carbon/day)
Consumption Production Ratio Acetate/CO2Citrate Acetate CO2
Sulfate Reducer sludge 16.56 10.90 5.30 2.06
Methanogenic Sludge 36.79 25.10 13.45 1.87
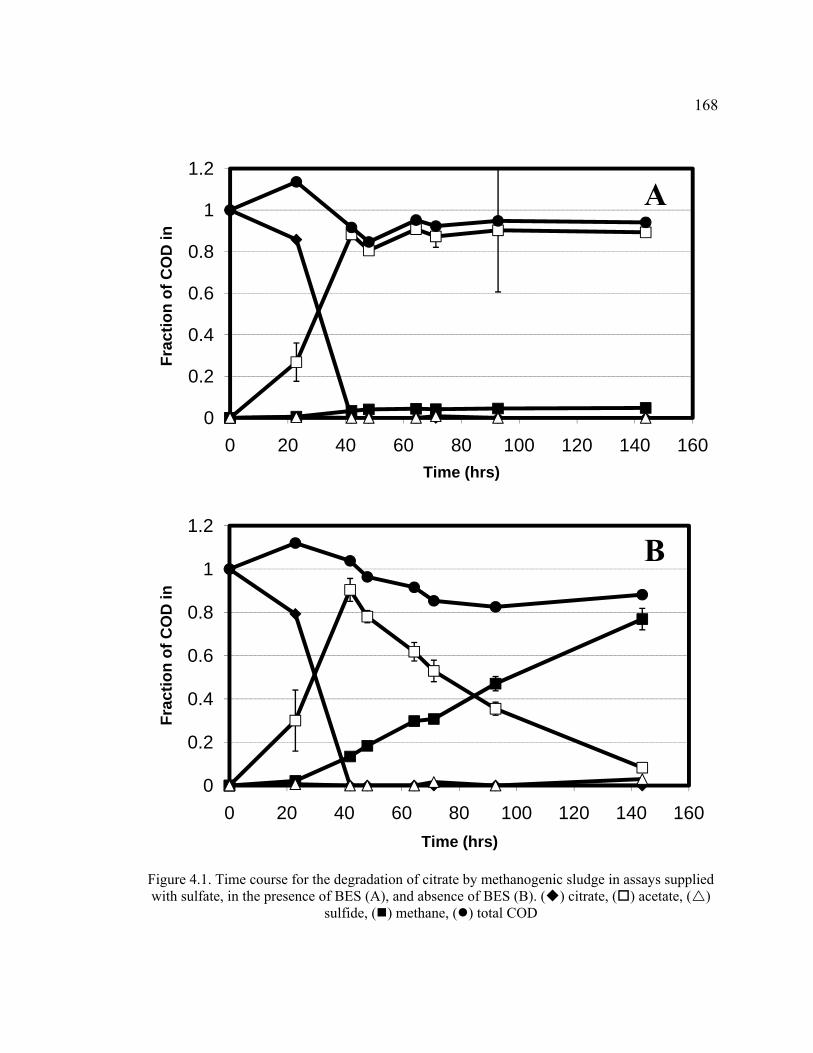
168
Figure 4.1. Time course for the degradation of citrate by methanogenic sludge in assays supplied with sulfate, in the presence of BES (A), and absence of BES (B). ( ) citrate, ( ) acetate, ( )
sulfide, ( ) methane, ( ) total COD
0
0.2
0.4
0.6
0.8
1
1.2
0 20 40 60 80 100 120 140 160
Frac
tion
of C
OD
in
Time (hrs)
0
0.2
0.4
0.6
0.8
1
1.2
0 20 40 60 80 100 120 140 160
Frac
tion
of C
OD
in
Time (hrs)
A
B

169
Figure 4.2 Time course for the degradation of citrate by sulfate reducing sludge in assays supplied
with sulfate, in the presence of BES (A), and absence of BES (B). ( ) citrate, ( ) acetate, ( ) sulfide, ( ) methane, ( ) total COD.
0
0.2
0.4
0.6
0.8
1
1.2
0 20 40 60
Frac
tion
of C
OD
in
Time (hrs)
0
0.2
0.4
0.6
0.8
1
1.2
0 20 40 60
Frac
tion
of C
OD
in
Time (hrs)
B
A
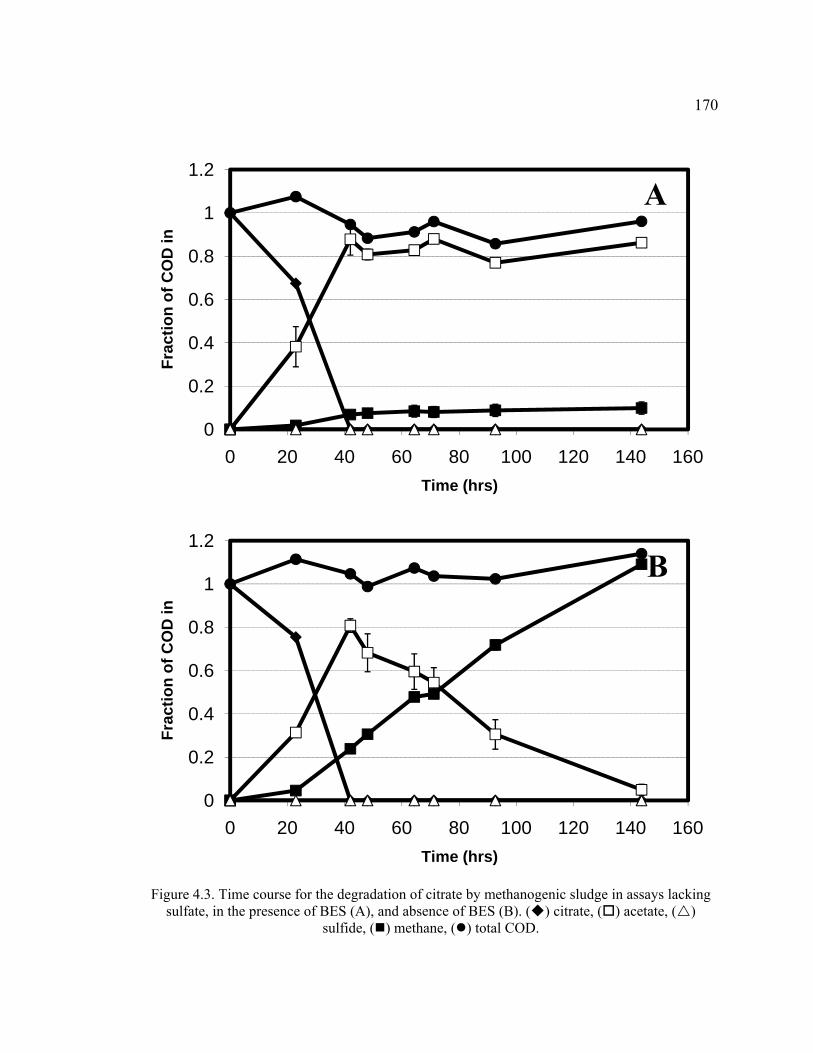
170
Figure 4.3. Time course for the degradation of citrate by methanogenic sludge in assays lacking
sulfate, in the presence of BES (A), and absence of BES (B). ( ) citrate, ( ) acetate, ( ) sulfide, ( ) methane, ( ) total COD.
0
0.2
0.4
0.6
0.8
1
1.2
0 20 40 60 80 100 120 140 160
Frac
tion
of C
OD
in
Time (hrs)
0
0.2
0.4
0.6
0.8
1
1.2
0 20 40 60 80 100 120 140 160
Frac
tion
of C
OD
in
Time (hrs)
B
A
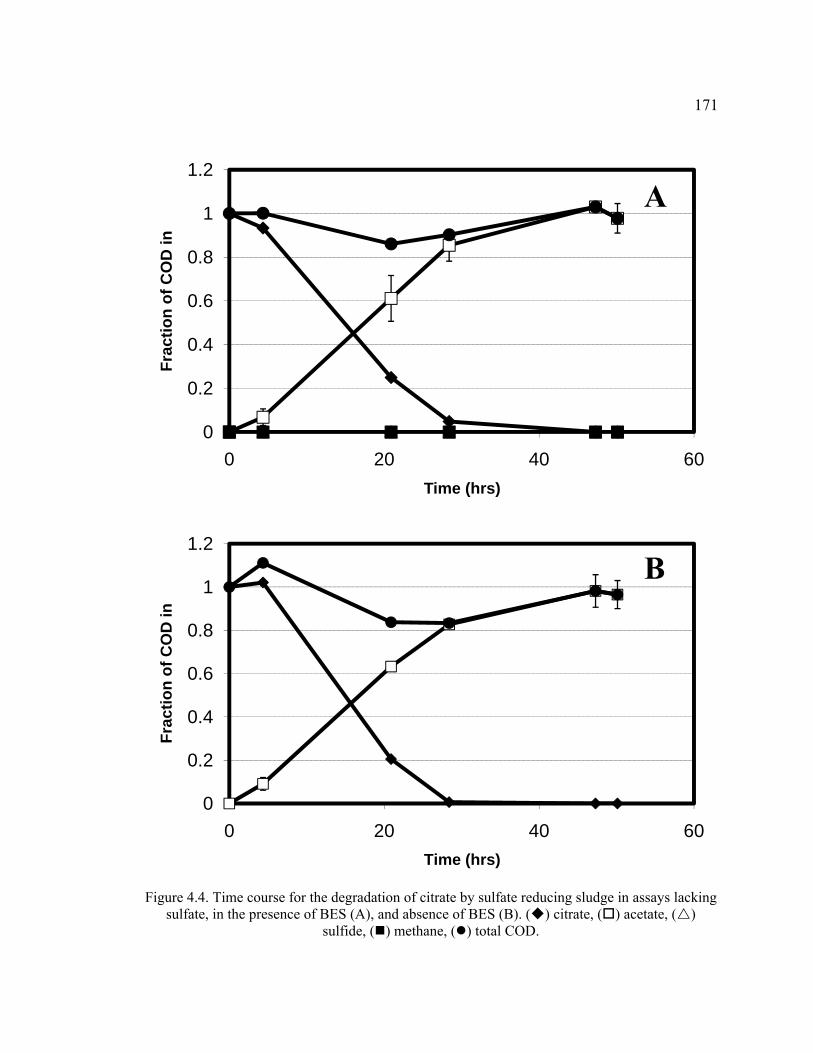
171
Figure 4.4. Time course for the degradation of citrate by sulfate reducing sludge in assays lacking
sulfate, in the presence of BES (A), and absence of BES (B). ( ) citrate, ( ) acetate, ( ) sulfide, ( ) methane, ( ) total COD.
0
0.2
0.4
0.6
0.8
1
1.2
0 20 40 60
Frac
tion
of C
OD
in
Time (hrs)
0
0.2
0.4
0.6
0.8
1
1.2
0 20 40 60
Frac
tion
of C
OD
in
Time (hrs)
B
A
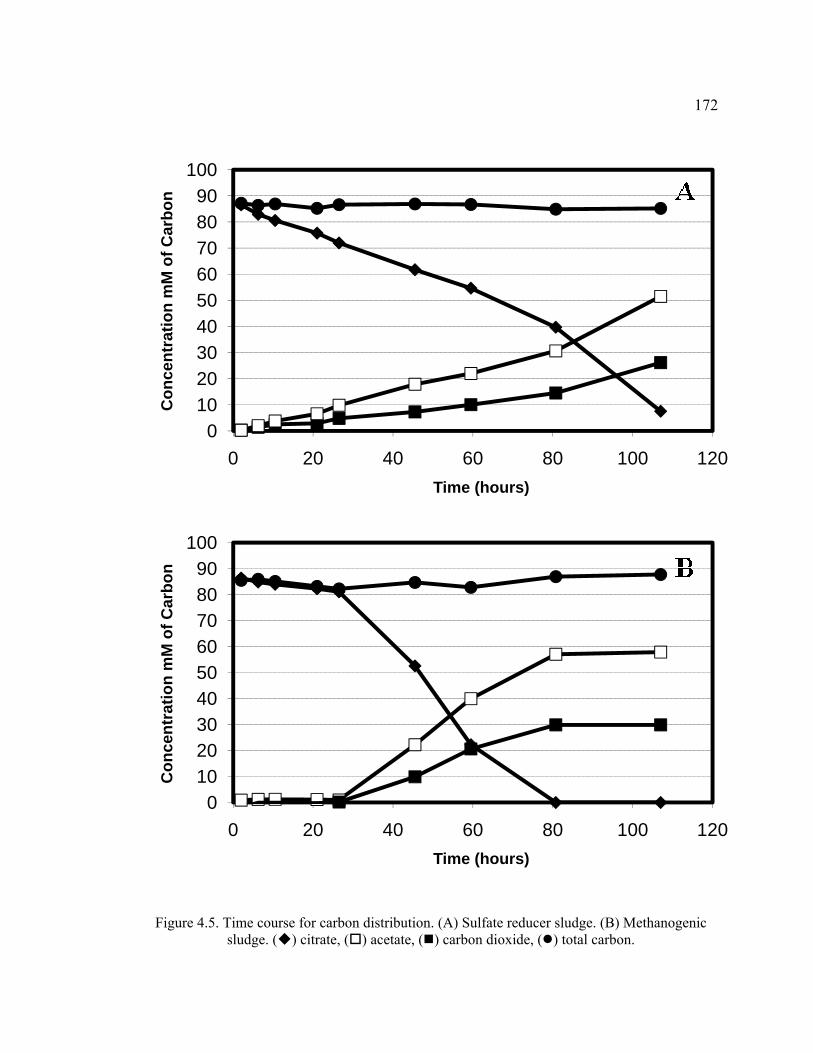
Figure 4.5. Ts
0102030405060708090
100C
once
ntra
tion
mM
of C
arbo
n
0102030405060708090
100
Con
cent
ratio
n m
M o
f Car
bon
Time course fsludge. ( ) c
0 2
0 2
for carbon discitrate, ( ) ac
20
20
tribution. (A)cetate, ( ) car
40Tim
40Tim
) Sulfate redurbon dioxide,
60me (hours)
60me (hours)
ucer sludge. (B, ( ) total car
80
80
B) Methanogerbon.
100
100
172
enic
120
120
173
4.5. Discussion
In this study, rapid degradation of citrate was observed independent of the sludge
used, or incubation conditions. Similar rates were evident in all cases (Table 4.3). This
behavior might be explained by the fact that citrate fermenters in the methanogenic and
sulfate-reducing consortia were similar, having fast growth rates which were enriched
rapidly upon exposure to citrate. For example, Clostridium sphenoides was consistently
enriched in pasteurized mud samples with citrate as the sole carbon source (Walther et al.
1977). The capacity to degrade citrate in the absence of O2 is found among lactic acid
bacteria (Hugenholtz 1993), enterobacteria (Bott 1997), selected clostridia (Walther et al.
1977) and the phototrophic bacterium, Rhodopseudomonas gelatinosa (Schaab et al.
1972). These organisms differ in the strategies used to degrade citrate (Antranikian and
Giffhorn 1987).
4.5.1. Citrate Degradation Pathway
In methanogenic and sulfate-reducing sludge, acetate was found to be the main
product of citrate metabolism. In bioassays where the further catabolism of acetate was
blocked (absence of sulfate in SRS or the specific methanogenic inhibitor BES in MS),
acetate was recovered in nearly stoichiometric yields. In such cases, acetate accounted for
90–100% the COD of the citrate metabolized. Furthermore, carbon distribution
experiments with BES (to block methanogenesis), showed that acetate and CO2 were the
only carbon containing products derived from citric acid (Fig. 4.5). The stoichiometry
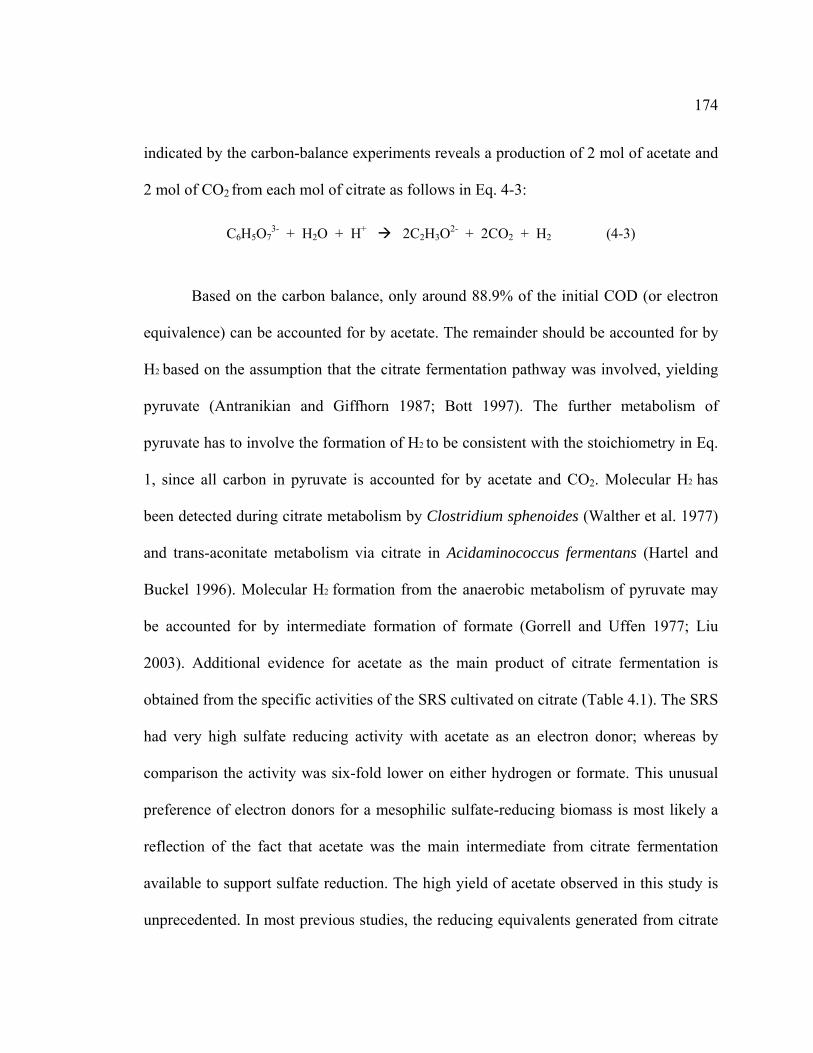
174
indicated by the carbon-balance experiments reveals a production of 2 mol of acetate and
2 mol of CO2 from each mol of citrate as follows in Eq. 4-3:
C6H5O73- + H2O + H+ 2C2H3O2- + 2CO2 + H2 (4-3)
Based on the carbon balance, only around 88.9% of the initial COD (or electron
equivalence) can be accounted for by acetate. The remainder should be accounted for by
H2 based on the assumption that the citrate fermentation pathway was involved, yielding
pyruvate (Antranikian and Giffhorn 1987; Bott 1997). The further metabolism of
pyruvate has to involve the formation of H2 to be consistent with the stoichiometry in Eq.
1, since all carbon in pyruvate is accounted for by acetate and CO2. Molecular H2 has
been detected during citrate metabolism by Clostridium sphenoides (Walther et al. 1977)
and trans-aconitate metabolism via citrate in Acidaminococcus fermentans (Hartel and
Buckel 1996). Molecular H2 formation from the anaerobic metabolism of pyruvate may
be accounted for by intermediate formation of formate (Gorrell and Uffen 1977; Liu
2003). Additional evidence for acetate as the main product of citrate fermentation is
obtained from the specific activities of the SRS cultivated on citrate (Table 4.1). The SRS
had very high sulfate reducing activity with acetate as an electron donor; whereas by
comparison the activity was six-fold lower on either hydrogen or formate. This unusual
preference of electron donors for a mesophilic sulfate-reducing biomass is most likely a
reflection of the fact that acetate was the main intermediate from citrate fermentation
available to support sulfate reduction. The high yield of acetate observed in this study is
unprecedented. In most previous studies, the reducing equivalents generated from citrate
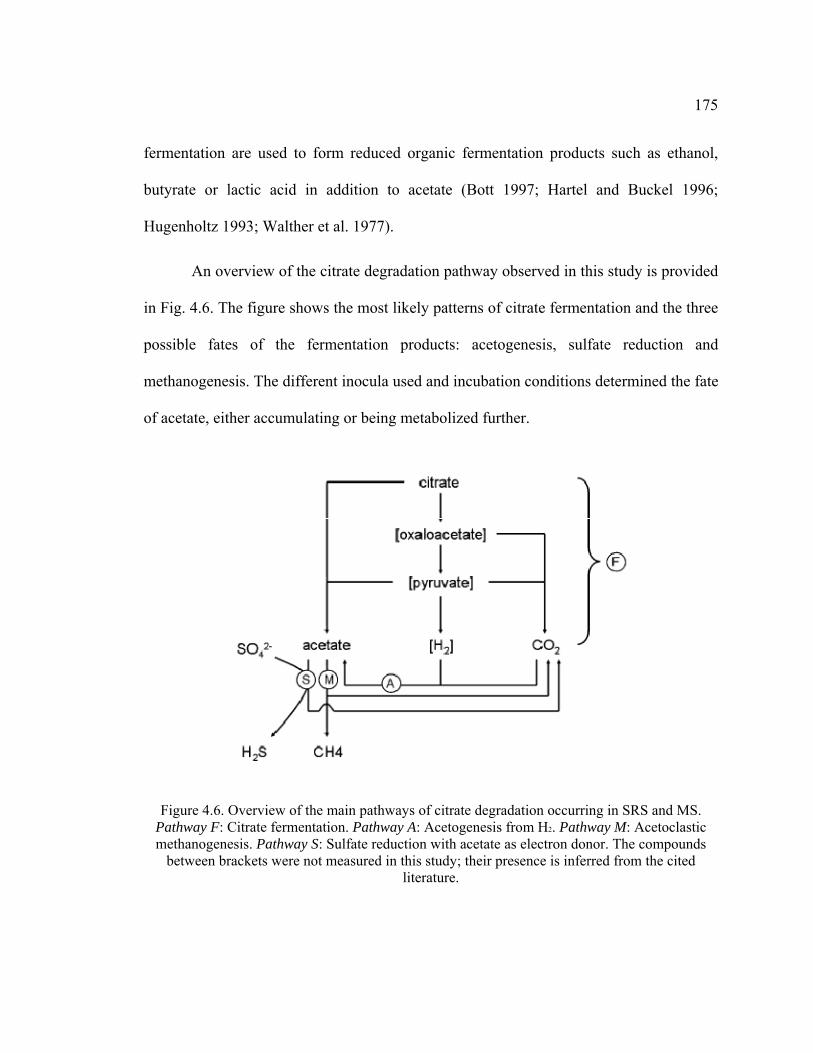
175
fermentation are used to form reduced organic fermentation products such as ethanol,
butyrate or lactic acid in addition to acetate (Bott 1997; Hartel and Buckel 1996;
Hugenholtz 1993; Walther et al. 1977).
An overview of the citrate degradation pathway observed in this study is provided
in Fig. 4.6. The figure shows the most likely patterns of citrate fermentation and the three
possible fates of the fermentation products: acetogenesis, sulfate reduction and
methanogenesis. The different inocula used and incubation conditions determined the fate
of acetate, either accumulating or being metabolized further.
Figure 4.6. Overview of the main pathways of citrate degradation occurring in SRS and MS. Pathway F: Citrate fermentation. Pathway A: Acetogenesis from H2. Pathway M: Acetoclastic methanogenesis. Pathway S: Sulfate reduction with acetate as electron donor. The compounds
between brackets were not measured in this study; their presence is inferred from the cited literature.

176
4.5.2. Acetogenesis
The COD balance appears to be in disagreement with the carbon balance since
acetate consistently accounted for 100% of the COD with the SRS consortium when
sulfate reduction was blocked; and acetate accounted from 90 to 96% of the COD with
the MS consortium when methanogenesis was blocked. These values do not agree with
89% maximum acetate yield according to the carbon balance. However, the discrepancy
has a simple explanation. The COD balance studies were performed in bicarbonate
buffered assays; whereas, the carbon balance studies were performed in phosphate
buffered assays. With the large excess of inorganic C in the bicarbonate buffered assays
and with methanogenesis and sulfate reduction blocked, acetogenesis from H2/CO2 would
be promoted (Breznak and Kane 1990; Dolfing 1988). Moreover, acetogenic activity was
demonstrated in SRS and MS (Table 4.1). The activity was highest in SRS which had the
highest yield of acetate. By contrast in the phosphate buffered systems, the endogenous
CO2 production was probably too low to support significant acetate production via
acetogenesis.
4.5.3. Sulfate Reduction
The sulfate-reducing consortium had no appreciable methanogenic activity;
therefore, the main product of citrate degradation was acetate and H2. However, when
sulfate was provided as final electron acceptor, acetate which had initially accumulated
was subsequently degraded. This was feasible since the consortium had the capacity to
177
couple sulfate reduction with acetate degradation. The COD equivalents in the acetate
were recovered almost completely in sulfides formed. Moreover, the rate of acetate
consumption was only slightly lower than the rate of sulfide production in COD
equivalence (Table 4.3). The differences being due to the fact that aside from acetate, H2
probably also contributed as an electron donor for sulfate reduction. Taken as a whole,
the data indicates that mostly acetate and to a small extent H2 but not citrate itself were
the electron donors for sulfate reduction.
Some species of sulfate-reducing bacteria are known to utilize acetate for sulfate
reduction, i.e., members of the genus Desulfobacter (Madigan et al. 2003b). The SRS
originated from a sulfate-reducing bioreactor treating citrate. Since acetate is the main
intermediate it is therefore safe to assume that sulfate reducers that can link acetate to
sulfate reduction had enriched in the sludge. The sulfate-reducing sludge had no
significant methane producing activity under any condition, not even in the absence of
BES and sulfate; this could be explained by the fact that methanogens were out competed
in the sulfate reducing bioreactor.
The ability of mesophilic anaerobic sludge to utilize acetate as an electron donor
for sulfate reduction is not common, and is only observed after prolonged bioreactor
operation favoring sulfate reduction (Visser et al. 1993). Most species of sulfate-reducing
bacteria are not capable of acetate degradation to support sulfate reduction (Kaksonen
2004; Lens et al. 2003; Madigan et al. 2003b). This is of special importance when
considering a biotreatment technology such as sulfate reduction for wastewaters
containing citric acid, like those from the semiconductor industry. The degradation of
178
citric acid under anaerobic conditions leads primarily to acetate production (88.8% of the
initial COD), which may not be degraded further by most sulfate reducing bacteria.
Therefore, to properly utilize most of the electron equivalence in citrate, the sulfate
reducing consortium must be enriched to utilize acetate as an electron donor for sulfate
reduction.
4.5.4. Methanogenesis
The main pathway of anaerobic citrate degradation in MS was also initiated by
the formation of acetate. The main product of citrate degradation was either methane or
acetate depending on whether the system was inhibited by BES or not. The presence or
absence of sulfate did not alter these fates due to the inability of MS to perform sulfate
reduction with acetate as an electron donor. The link between methanogenesis and acetate
degradation is evident on Table 4.3 where the degradation rate for acetate is comparable
to the production rate for methane, which was similar to the methanogenic activity found
for that sludge (Table 4.1).
The final products from the anaerobic degradation of citric acid will depend on
the competition between methanogens and sulfate reducers for acetate. The outcome of
this competition varies in different studies. In some studies sulfate-reducers out compete
methanogens (Bhattacharya et al. 1996; Colleran et al. 1995; Oude Elferink et al. 1994).
In other studies, methanogens outcompeted sulfate-reducers (Lens et al. 1998) sometimes
in conditions where sulfate is non-limiting. The competition between sulfate-reducers and

179
methanogens for acetate utilization appears to depend on several factors like pH, COD to
sulfate ratio, loading rates, acetate concentrations, etc. Among those parameters, the COD
to sulfate ratio appears to be particularly important in determining the fate of acetate in
sulfate reducing environments. Bhattacharya et al. (1996) showed that when the influent
acetate-COD/SO42- ratios are 0.71 g/g or lower, sulfate-reducers out competed
methanogens, while for ratios exceeding 3.56 g/g methanogens out competed sulfate
reducers. So if anaerobic treatment is the remediation technology selected for citric acid
containing wastewaters, the competition between these two processes is of utmost
importance on the outcome and success of the selected technology.
180
5. TOXICITY OF EDTA ON METHANOGENIC AND SULFATE REDUCING
SLUDGE: EFFECT AND MECHANISMS
5.1. Abstract
Ethylenediaminetetraacetic acid (EDTA) is a synthetic hexadentate chelator widely used in industries where free concentrations of heavy metals must be controlled. Industrial cleaning, paper manufacturing, and semiconductor manufacturing are amongst the industries which make heavy use of EDTA. This chelator has also been applied to remediation of heavy metal laden soils. However, there exists concern that increasing concentration of EDTA in water bodies and wastewater treatment plants may present some effect in microorganisms present in these waters.
The objective of this study was to evaluate the effect that EDTA has on anaerobic microorganisms, specifically methanogens and sulfate reducing bacteria (SRB). Experiments were carried out in batch and continuous conditions. Results obtained in this study showed that EDTA has an inhibitory effect to SRB with an IC 50 of 1.72 mM of EDTA. However, when Ca2+ was present at equimolar ratios or higher with EDTA, inhibition was completely suppressed, which indicates that Ca2+ presented antagonistic effects. EDTA inhibitory effect on methanogens was less important, with a maximum observable inhibition of 40% at the highest EDTA concentrations tested of 40 mM. When combined with Ca2+, EDTA presented higher inhibition however this was likely due to the low pH values observed in these experiments. It is presumed that the interaction of EDTA and the cell membrane has some impact on the different results obtained for SRB and methanogens.
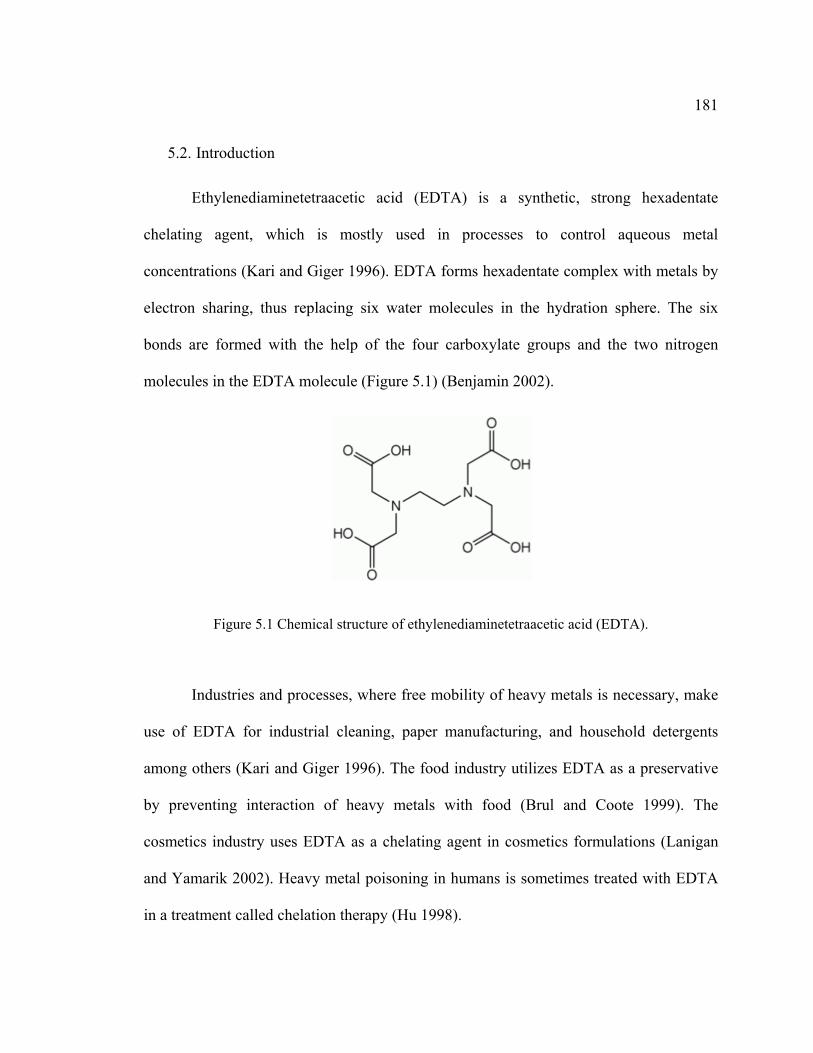
181
5.2. Introduction
Ethylenediaminetetraacetic acid (EDTA) is a synthetic, strong hexadentate
chelating agent, which is mostly used in processes to control aqueous metal
concentrations (Kari and Giger 1996). EDTA forms hexadentate complex with metals by
electron sharing, thus replacing six water molecules in the hydration sphere. The six
bonds are formed with the help of the four carboxylate groups and the two nitrogen
molecules in the EDTA molecule (Figure 5.1) (Benjamin 2002).
Figure 5.1 Chemical structure of ethylenediaminetetraacetic acid (EDTA).
Industries and processes, where free mobility of heavy metals is necessary, make
use of EDTA for industrial cleaning, paper manufacturing, and household detergents
among others (Kari and Giger 1996). The food industry utilizes EDTA as a preservative
by preventing interaction of heavy metals with food (Brul and Coote 1999). The
cosmetics industry uses EDTA as a chelating agent in cosmetics formulations (Lanigan
and Yamarik 2002). Heavy metal poisoning in humans is sometimes treated with EDTA
in a treatment called chelation therapy (Hu 1998).
182
Due to its chelating property, EDTA has also been used for the remediation of
heavy metal-laden soils, since it improves the mobilization of heavy metals (Nortemann
1999). However, some problems arise when EDTA is released into the environment.
EDTA is known to be recalcitrant and is poorly degraded in conventional wastewater
treatment plants (Nortemann 1999; Tucker et al. 1999). The low biodegradability of
EDTA combined with its high mobility in water makes EDTA one of the most prevalent
organic contaminants measured in many surface waters (Nortemann 1999; Tucker et al.
1999). EDTA concentrations between 10 and 100 nM have been found in groundwater,
rivers and lakes (Nowack et al. 1997). EDTA has also been found in municipal
wastewater treatment plants with concentrations up to 18 μM (Kari and Giger 1996).
Although EDTA does not present any toxic effect to mammals at the concentrations
found in these waters (Nortemann 1999).
The ability of EDTA to form highly stable complexes with a variety of metals is
of special interest to semiconductor manufacturing, specifically in the chemical
mechanical planarization (CMP) process, where this property prevents the metals
removed from the wafer to be deposited again in the wafer’s surface. This is why is one
of the most widely used chelating agents in this industry (Maketon et al. 2008) and is
often present in the wastewaters coming from this process (Golden et al. 2000).
The objective of this study is to assess the toxicity of the chelating agent EDTA to
different microorganisms commonly found in wastewater treatment plants, i.e.,
methanogens in anaerobic treatment systems and sulfate-reducing bacteria. The effect
and mechanisms of EDTA on methanogenic and sulfate-reducing microorganisms was
183
studied in batch assays. The effect on sulfate-reducing bacteria was also tested on a
continuous experiment carried out in an expanded sludge bed reactor.
5.3. Material and Methods
5.3.1. Microorganims
Methanogenic granular sludge and sulfate reducing granular sludge were obtained
from industrial anaerobic bioreactors treating recycle paper wastewater (Eerbeek, The
Netherlands) and from a lab-scale bioreactor treating citrate for the removal of copper
(see Chapter 2), respectively. The content of volatile suspended solids (VSS) in the
methanogenic and sulfidogenic sludge was 13.7 and 6.1%, respectively. The microbial
cultures were elutriated to remove the fines and stored under nitrogen gas at 4°C.
5.3.2. Continuous Experiment
The effect of EDTA (2 mM) on sulfate-reducing bacteria was tested in a
continuous expanded sludge bed reactor. Previous to the realization of the experiment the
reactor had been operating under sulfate reducing conditions for 600 days (Chapters 2
and 3). The reactor was fed with a simulated Cu-CMP wastewater, containing citrate as
electron donor and sulfate as electron acceptor in a 1.8 sulfate to COD (chemical oxygen
demand) ratio to ensure sulfate reducing conditions. The concentrations of sulfate (SO42-,
supplemented as Na2SO4) and citrate (C6H5O73-, supplemented as C6H5Na3O7•2 H2O) in

184
the influent were (in mg/L): 1200 and 888 respectively. The basic anaerobic basal
mineral medium (ABM) used in the reactors contained (in mg/L): NH4Cl (280), KCl
(270), K2HPO4 (169), CaCl2•2 H2O (10), MgCl2•6 H2O (150), yeast extract (20), and 1
mL/L of trace element solution (Chapter 2). The influent was supplemented with 2.00
mM EDTA and 1.57 mM of copper for approximately 8 days. Subsequently, EDTA and
copper addition was omitted to study residual effects of the chelator on the performance
of the reactor system. Citrate, COD, sulfide, methane, total and soluble copper, and pH
were monitored during this stage of the study.
Continuous flow experiments were performed in two glass reactors. Figure 1.1
presents a schematic drawing of the reactor system consisting of a crystallization reactor
(SCR) and an Expanded Granular Sludge Bed (EGSB) bioreactor (BR). The system was
located in a climate-controlled chamber maintained at 30±2˚C. The bioreactor had a
working volume of 2.9 L. The crystallization reactor had a working volume of 0.4 L. To
increase the upflow velocity in the reactors and maintain sludge bed fluidization, effluent
recirculation was applied using a Cole-Parmer Masterflex L/S® Variable Speed Digital
Economy Drive Pump Model 7524-50 equipped with a Cole-Parmer L/S® Two-Channel
Easy-Load® II Pump Head. The recycle rate (i.e., recycling flow/effluent flow) in both
reactors was maintained at a recycle ratio of 15, the recycle rate was calculated dividing
the recycling flow by the effluent flow.

185
5.3.3. Batch Experiments
Batch experiments included toxicity assays studying the effect of EDTA on both
methanogenic and sulfate-reducing microorganisms. The addition of cations such as
calcium to study the effect of EDTA as a complex followed the previous experiments.
The addition of these cations, and the set up of the experiments was the same for the
different microorganisms used as described below.
5.3.3.1. Methanogenic Batch Toxicity Assays
Maximum specific methanogenic activity measurements were performed in 160
mL serum flasks sealed with butyl rubber septa using hydrogen as electron donor.
Anaerobic sludge (1.5 g VSS/L) was transferred to serum flasks containing 50 mL of
basal medium. Serum flasks were flushed with H2/CO2 (80/20, v/v) for 5 min and then
incubated at 30±2˚C, and were left to acclimate overnight. After 24 hours, the headspace
was flushed and pressurized to 1.5 atm with H2/CO2 (80/20, v/v) and dosed with the
corresponding concentrations of EDTA or calcium. After dosing the flasks were
incubated for 2-3 hours, prior to the determination of the methane production rate.
Following incubation, the methane content in the headspace of each flask was
determined at equal intervals of 3-4 hours during 2 days. The maximum specific
methanogenic activities were calculated from the slope of the cumulative methane
production (mL) versus time (days) and the biomass concentration at the end of the
assays, as the mean value of triplicate assays. The effect of the non-complexed EDTA, or
the addition of calcium, was determined in a dose-response curve by comparing the

186
specific methanogenic activities of each case to the methanogenic activity observed in a
control test.
The anaerobic basal mineral medium (pH 7.2) used in methanogenic bioassays
contained (in mg/L): NH4Cl (280), NaHCO3 (4000), K2HPO4 (250), CaCl2•2 H2O (10),
MgCl2•6 H2O (100), MgSO4•7 H2O (100); yeast extract (100), and 1 mL/L of trace
element solution (Chapter 2). The trace element solution contained (in mg/L): H3BO3
(50), FeCl2•4 H2O (2000), ZnCl2 (50), MnCl2•4H2O (50), (NH4)6Mo7O24•4H2O (50),
AlCl3•6 H2O (90), CoCl2•6 H2O (2000), NiCl2•6 H2O (50), CuCl2•2 H2O (30), NaSeO3•5
H2O (100), EDTA (1000), Resazurin (200) and 36% HCl (1 mL/L).
5.3.3.2. Sulfidogenic Batch Toxicity Assays
Experiments to study the toxicity of EDTA on sulfate-reducing bacteria were
performed in 333 mL serum flasks sealed with butyl rubber septa using citrate as electron
donor with concentration ranging from 400 – 667 mg of citrate/L (300-500 mg citrate-
COD/L). Citrate was used as electron donor due to the great specific activity that the
bacteria utilized had for this chemical. The sludge (1.5 g VSS/L), obtained from the
continuous reactor mentioned previously, was transferred to serum flasks containing 200
mL of basal medium. The serum flasks were flushed with N2/CO2 (80/20, v/v) for 5 min.
Due to the high specific activity no overnight acclimation was necessary and EDTA, as
well as calcium when specified, were dosed immediately after the experiment set up.
Following dosing, the bottles were incubated at 30 ± 2oC and the sulfide production rate
was determined.

187
The sulfide concentrations in liquid samples obtained from each flask were
determined at periodic intervals (2 hours) during the subsequent 28 hours. The maximum
specific sulfidogenic activities were calculated from the slope of the cumulative sulfide
production (mg) versus time (days) and the biomass concentration at the end of the
assays, as the mean value of triplicate assays. Calculations also included sulfide
concentration in the gas phase a dimensionless Henry’s factor of 0.36 was utilized for the
experiment (Benjamin 2002).
The anaerobic basal medium (pH 7.2) utilized in the sulfate reducing bioassays
consisted of (in mg/L): NH4Cl (280), NaHCO3 (4,000), K2HPO4 (600), NaH2PO4•2 H2O
(796), CaCl2•2 H2O (10), MgCl2•6 H2O (83), Na2SO4 (5,920), yeast extract (20), and 1
mL/L of trace element solution.
5.3.4. Analytical Methods
The methane concentration in the headspace of the batch bioassays was
determined by gas chromatography using an HP5290 Series II system (Agilent
Technologies, Palo Alto, CA) equipped with a flame ionization detector (GC-FID). The
GC was fitted with a Nukol fused silica capillary column (30 m length x 0.53 mm ID,
Supelco, St. Louis, MO). The carrier gas was helium at a flow rate of 11 mL/min and a
split flow of 84 mL/min. The temperatures of the column, injector port, and the detector
were 140, 180, and 250°C, respectively. Samples for measuring methane content (100
μL) in the headspace were collected using a pressure-lock gas syringe.
188
Sulfide was fixed by the addition of zinc acetate and then analyzed
colorimetrically by the methylene blue method (Truper and Schlegel 1964). Liquid
samples taken for sulfide determination where not filtered or centrifuged to prevent
volatilization of hydrogen sulfide. COD was determined by oxidation with dichromate
and analyzed using the colorimetric micro-method described in Standard Methods for
Examination of Water and Wastewater (APHA 2005). To facilitate sulfide oxidation, the
method was adapted by agitating the samples manually every 20 min. Volatile suspended
solids were determined according to Standard Methods for Examination of Water and
Wastewater (APHA 2005). Sulfate and citrate were determined by ion chromatography
with suppressed conductivity using a DIONEX 500 system equipped with a Dionex
AS11-HC4 column, a Dionex AG11-HC4 guard column (Dionex, Sunnydale, CA). The
mobile phase had a gradient of 0.67 mM KOH/min going from 20 mM to 30 mM at a
flow rate of 1.2 mL/min. The column was maintained at room temperature. Sulfate and
citrate retention times were of 4.5 and 11.8 min approximately. The injection volume was
25 μL. The pH was determined immediately after sampling with an Orion model 310
PerpHecT pH-meter with a PerpHecT ROSS glass combination electrode.
5.3.5. Chemicals
All chemicals used were reagent grade or better. Ethylenediaminetetraacetic acid
disodium salt, dihydrate (CAS 6381-92-6; ~99%), cupric chloride dihydrate (CAS 7447-
39-4; 99.8%), Sodium citrate tribasic dihydrate (CAS 68-04-2; >99%), sodium sulfate

189
(CAS 7757-82-6; >99%) and calcium chloride dihydrate (CAS 10035-04-8; >99%) were
obtained from Sigma-Aldrich Corp. (St. Louis, MO, USA).
5.4. Results
Batch experiments to measure the toxicity of EDTA on methanogenic and sulfate-
reducing microorganisms, as well as continuous experiments to study the effect of EDTA
on sulfate-reducing bacteria were carried out in this study. The results obtained are
presented below.
5.4.1. Impact of EDTA in the Operation of a Continuous Flow Sulfidogenic
Bioreactor
The effect of EDTA on sulfate-reducing bacteria was measured in a continuous
system consisting of an EGSB BR. The system was fed with citrate as electron donor and
sulfate as electron acceptor. The microorganisms in the system were well adapted to the
utilization of citrate as electron donor for sulfate reduction, with almost a 100% yield for
sulfate reduction and no methanogenesis (Chapter 2). The system was feed with EDTA at
a concentration of 2 mM for about 8 days. Figure 5.2 shows the results obtained in this
experiment as a plot of measured concentrations of COD vs. time. During the duration of
this experiment, pH, organic load rate, and hydraulic retention time remained unaltered.
After EDTA feeding was initiated, and immediate reduction on sulfide production
was observed in the bioreactor, sulfide concentration in the effluent of the reactor
decreased from an initial value of 304.5 mg S2-/L to 38.4 mg S2-/L in a time lapse of 9.35
190
days. Along with the reduction on sulfide production, decreasing citrate degradation was
also measured. Citrate in the effluent increased from non detection to 752.8 mg Citrate/L
in a time lapse of 9.35 days. No accumulation of intermediate biodegradation products
of citrate (i.e. acetate) was observed in the system. After feeding EDTA to the system for
8 days, the addition of EDTA stopped and the capability of the system to recover was
analyzed. After suspending EDTA feeding, the system achieved complete recovery in
less than 2 days, and complete citrate degradation as well as sulfate degradation to levels
prior to EDTA addition was observed (Figure 5.2). Complete recovery of the COD, fed
as citrate, in the form of sulfide was also observed in the effluent of the system. Acetate,
a compound monitored as intermediate citrate biodegradation product, was not detected.
No visual effects were observed in the sludge morphology.
Soluble and total copper were measured at three different sampling points in the
system, at the entrance to the system, in the effluent of the crystallization reactor (mid
point), and at the effluent of the system. Soluble and total copper in the influent had an
average concentration of 80.4 mg/L (1.27 mM) of copper. On the other hand copper at
the effluent of the crystallization reactor presented different values of soluble and total
copper throughout the duration of the experiment. Concentrations of soluble copper
increased during the course of the study. Copper concentrations went from 0.8 mg/L in
day 5.5 to 30.0 mg/L in day 15.9. A similar trend was observed for soluble and total
copper at the end of the crystallization reactor and in the system’s effluent. Due to the
limited amount of samples and low quantity of copper introduced to the system, copper
extractions to the sand inside the crystallization reactor were not performed.
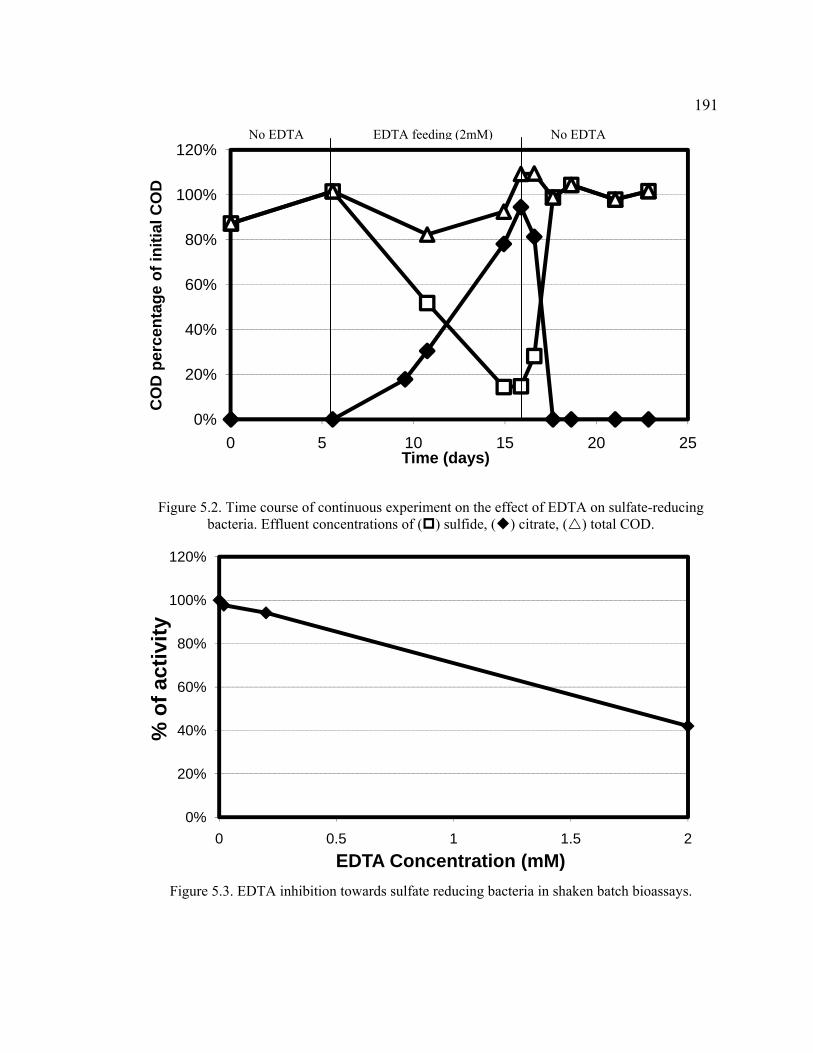
191
0%
20%
40%
60%
80%
100%
120%
0 5 10 15 20 25
CO
D p
erce
ntag
e of
initi
al C
OD
Time (days)
Figure 5.2. Time course of continuous experiment on the effect of EDTA on sulfate-reducing bacteria. Effluent concentrations of ( ) sulfide, ( ) citrate, ( ) total COD.
Figure 5.3. EDTA inhibition towards sulfate reducing bacteria in shaken batch bioassays.
0%
20%
40%
60%
80%
100%
120%
0 0.5 1 1.5 2
% o
f act
ivity
EDTA Concentration (mM)
No EDTA No EDTA EDTA feeding (2mM)

192
0
10
20
30
40
50
60
70
80
90
100
0 5 10 15 20 25
Cop
per c
once
ntra
tion
(mg/
L)
Time (days)
Figure 5.4. Total copper concentrations in the system: ( ) influent, ( ) crystallization reactor effluent, ( ) bioreactor effluent.
Figure 5.5. Soluble copper concentrations in the system: ( ) influent, ( ) crystallization reactor effluent, ( ) bioreactor effluent.
0
10
20
30
40
50
60
70
80
90
100
0 5 10 15 20 25
Cop
per c
once
ntra
tion
(mg/
L)
Time (days)
No EDTA No EDTA EDTA feeding (2 mM)
No EDTA No EDTA EDTA feeding (2mM)
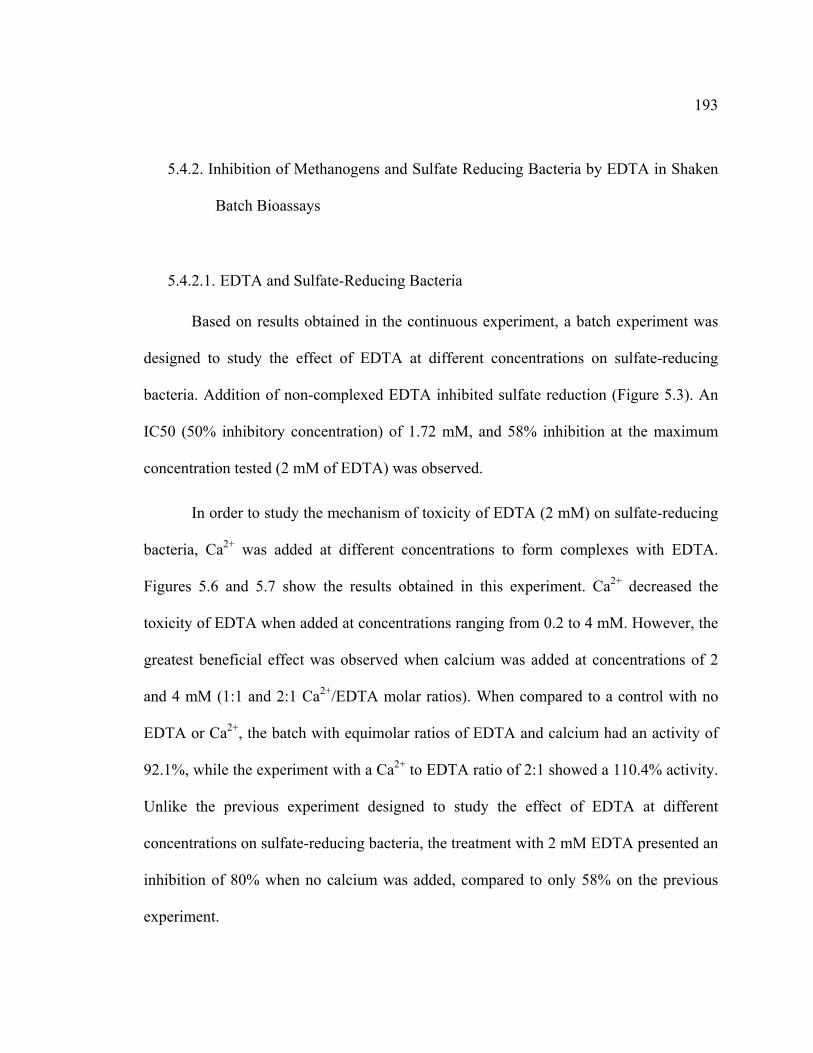
193
5.4.2. Inhibition of Methanogens and Sulfate Reducing Bacteria by EDTA in Shaken
Batch Bioassays
5.4.2.1. EDTA and Sulfate-Reducing Bacteria
Based on results obtained in the continuous experiment, a batch experiment was
designed to study the effect of EDTA at different concentrations on sulfate-reducing
bacteria. Addition of non-complexed EDTA inhibited sulfate reduction (Figure 5.3). An
IC50 (50% inhibitory concentration) of 1.72 mM, and 58% inhibition at the maximum
concentration tested (2 mM of EDTA) was observed.
In order to study the mechanism of toxicity of EDTA (2 mM) on sulfate-reducing
bacteria, Ca2+ was added at different concentrations to form complexes with EDTA.
Figures 5.6 and 5.7 show the results obtained in this experiment. Ca2+ decreased the
toxicity of EDTA when added at concentrations ranging from 0.2 to 4 mM. However, the
greatest beneficial effect was observed when calcium was added at concentrations of 2
and 4 mM (1:1 and 2:1 Ca2+/EDTA molar ratios). When compared to a control with no
EDTA or Ca2+, the batch with equimolar ratios of EDTA and calcium had an activity of
92.1%, while the experiment with a Ca2+ to EDTA ratio of 2:1 showed a 110.4% activity.
Unlike the previous experiment designed to study the effect of EDTA at different
concentrations on sulfate-reducing bacteria, the treatment with 2 mM EDTA presented an
inhibition of 80% when no calcium was added, compared to only 58% on the previous
experiment.

194
Figure 5.6. Sulfide concentration vs. time for a batch experiment with an EDTA concentration of
2 mM and different Ca2+ concentrations: ( ) 0 mM, ( ) 0.2 mM, ( ) 2 mM, ( ) 4 mM, ( ) control treatment lacking EDTA.
Figure 5.7. Effect of Ca2+ addition on the inhibitory effect of 2 mM EDTA towards sulfate
reducing bacteria in anaerobic granular sludge. Relative sulfate reducing activity vs. Ca concentration determined in shaken batch bioassays.
0
20
40
60
80
100
120
140
160
0.0 0.5 1.0 1.5 2.0 2.5
Sulfi
de C
ocen
trat
ion
(mg/
L)
Time (days)
0%
20%
40%
60%
80%
100%
120%
0.0 1.0 2.0 3.0 4.0
% o
f act
ivity
Ca2+ Concentration (mM)
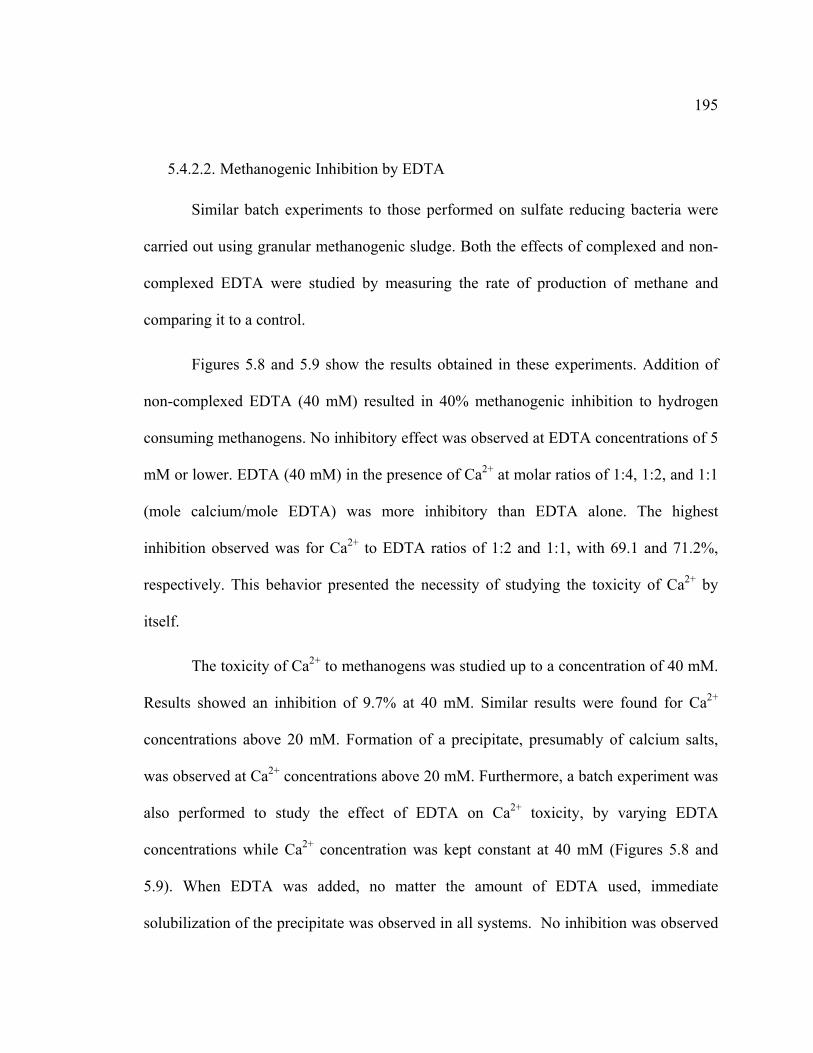
195
5.4.2.2. Methanogenic Inhibition by EDTA
Similar batch experiments to those performed on sulfate reducing bacteria were
carried out using granular methanogenic sludge. Both the effects of complexed and non-
complexed EDTA were studied by measuring the rate of production of methane and
comparing it to a control.
Figures 5.8 and 5.9 show the results obtained in these experiments. Addition of
non-complexed EDTA (40 mM) resulted in 40% methanogenic inhibition to hydrogen
consuming methanogens. No inhibitory effect was observed at EDTA concentrations of 5
mM or lower. EDTA (40 mM) in the presence of Ca2+ at molar ratios of 1:4, 1:2, and 1:1
(mole calcium/mole EDTA) was more inhibitory than EDTA alone. The highest
inhibition observed was for Ca2+ to EDTA ratios of 1:2 and 1:1, with 69.1 and 71.2%,
respectively. This behavior presented the necessity of studying the toxicity of Ca2+ by
itself.
The toxicity of Ca2+ to methanogens was studied up to a concentration of 40 mM.
Results showed an inhibition of 9.7% at 40 mM. Similar results were found for Ca2+
concentrations above 20 mM. Formation of a precipitate, presumably of calcium salts,
was observed at Ca2+ concentrations above 20 mM. Furthermore, a batch experiment was
also performed to study the effect of EDTA on Ca2+ toxicity, by varying EDTA
concentrations while Ca2+ concentration was kept constant at 40 mM (Figures 5.8 and
5.9). When EDTA was added, no matter the amount of EDTA used, immediate
solubilization of the precipitate was observed in all systems. No inhibition was observed
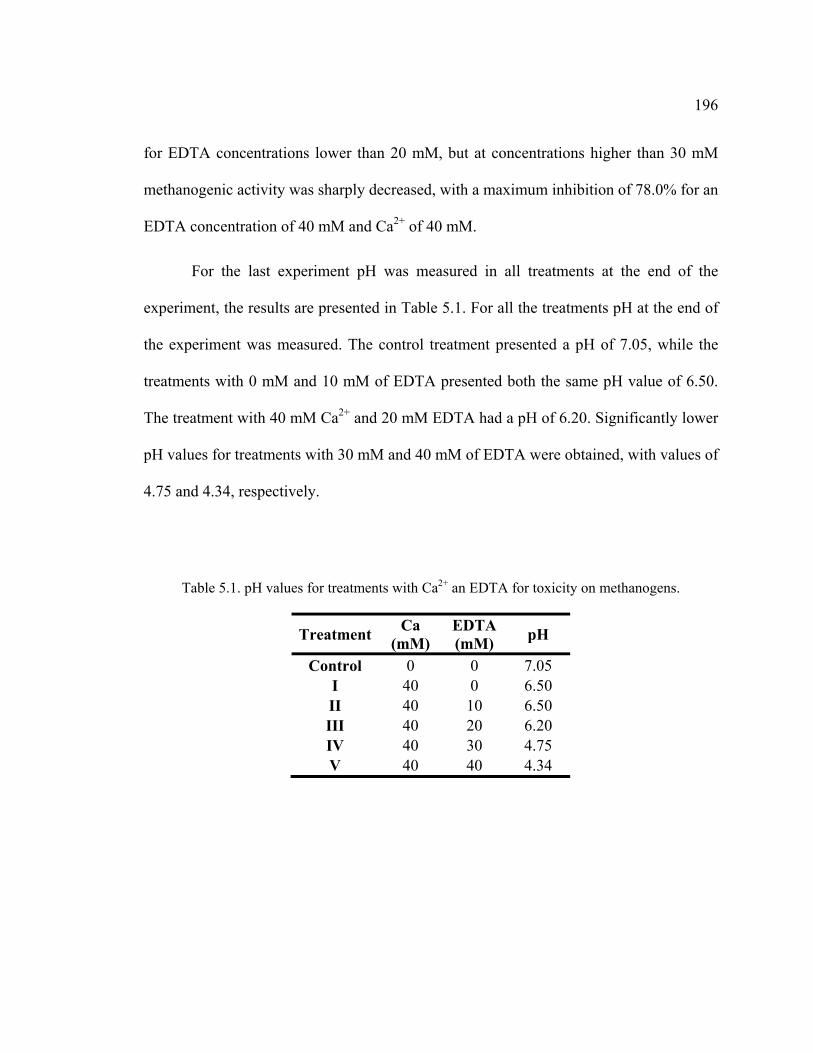
196
for EDTA concentrations lower than 20 mM, but at concentrations higher than 30 mM
methanogenic activity was sharply decreased, with a maximum inhibition of 78.0% for an
EDTA concentration of 40 mM and Ca2+ of 40 mM.
For the last experiment pH was measured in all treatments at the end of the
experiment, the results are presented in Table 5.1. For all the treatments pH at the end of
the experiment was measured. The control treatment presented a pH of 7.05, while the
treatments with 0 mM and 10 mM of EDTA presented both the same pH value of 6.50.
The treatment with 40 mM Ca2+ and 20 mM EDTA had a pH of 6.20. Significantly lower
pH values for treatments with 30 mM and 40 mM of EDTA were obtained, with values of
4.75 and 4.34, respectively.
Table 5.1. pH values for treatments with Ca2+ an EDTA for toxicity on methanogens.
Treatment Ca (mM)
EDTA (mM) pH
Control 0 0 7.05 I 40 0 6.50 II 40 10 6.50 III 40 20 6.20 IV 40 30 4.75 V 40 40 4.34
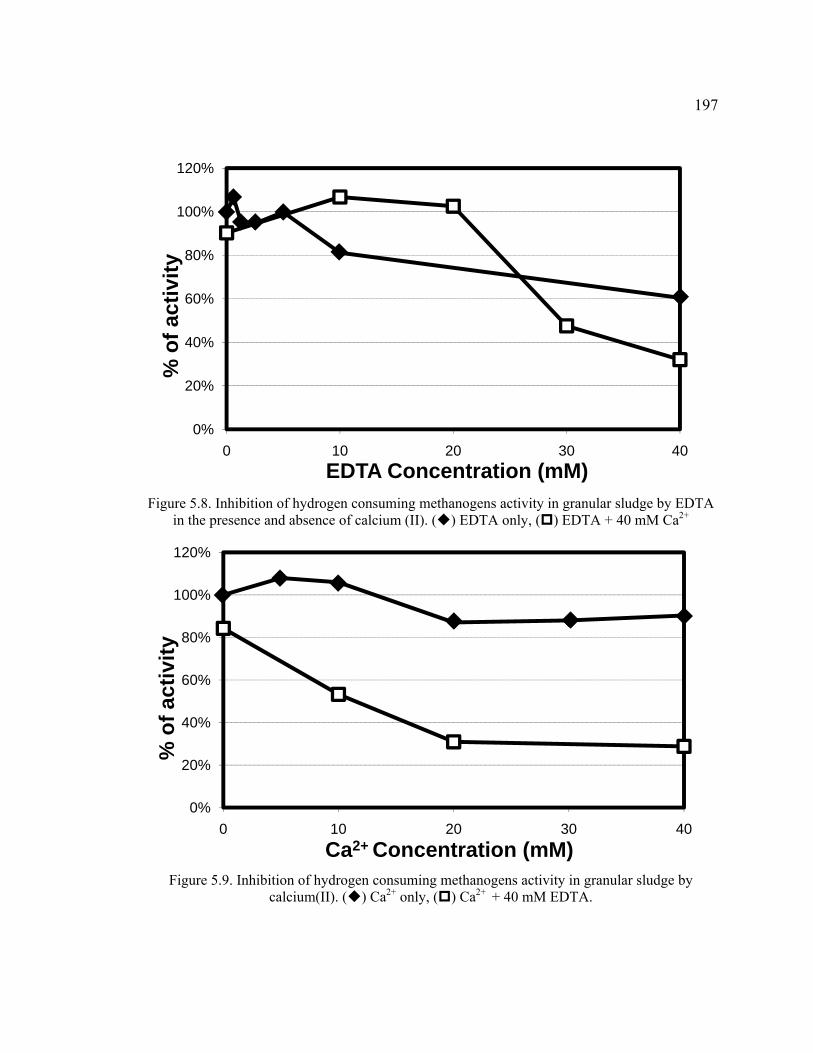
197
Figure 5.8. Inhibition of hydrogen consuming methanogens activity in granular sludge by EDTA
in the presence and absence of calcium (II). ( ) EDTA only, ( ) EDTA + 40 mM Ca2+
Figure 5.9. Inhibition of hydrogen consuming methanogens activity in granular sludge by
calcium(II). ( ) Ca2+ only, ( ) Ca2+ + 40 mM EDTA.
0%
20%
40%
60%
80%
100%
120%
0 10 20 30 40
% o
f act
ivity
EDTA Concentration (mM)
0%
20%
40%
60%
80%
100%
120%
0 10 20 30 40
% o
f act
ivity
Ca2+ Concentration (mM)
198
5.5. Discussion
The effect of EDTA on anaerobic microorganisms was studied in these
experiments. Different behaviors were observed depending upon the nature of the
microorganisms involved. The results obtained are discussed here.
5.5.1. Effect of EDTA on Sulfate Reducing Bacteria
Direct inhibition of sulfate reduction after addition of EDTA was observed in both
batch and continuous experiments (Figures 5.2 and 5.3). On the other hand, EDTA in the
form of a Ca-EDTA complex presented low inhibition at equimolar ratios, while no
inhibition was observed at higher ratios of Ca2+ to EDTA.
As observed in Figure 5.2, feeding of EDTA caused inhibition of sulfate reduction
on the bioreactor system at a 2 mM concentration. Due to this inhibition sulfide
production steadily decreased, while citrate degradation stopped as well. A COD balance
shows that all the COD introduced to the system in the form of citrate was recovered at
the end in either citrate or sulfide form (Figure 5.2). When sulfate reduction was inhibited
completely, no fermentation of citrate occurred. Furthermore, when EDTA feeding
stopped, immediate recovery was observed and complete citrate degradation was rapidly
restored. A complete recovery of the sulfate reducing activity to levels observed before
EDTA addition indicated reversible inhibition, meaning that while the chelator stopped
metabolic activity, it did not kill the microorganisms, or destroyed any cellular structure
that may have been vital to sulfate reducing activity.

199
In the continuous experiment, EDTA is expected to be present in the form of an
EDTA-Cu complex (Kf = 6.0 x 10¹⁸). However, soluble copper results show that at after 5
days of treatment copper was not present in concentrations high enough for the EDTA-
Cu complex to be of stoichiometric importance, meaning that EDTA was mostly in its
free form. This is expected when looking at the equilibrium constant for the EDTA-Cu
complex and the solubility constant of the copper sulfide precipitate (Ks = 1.1 x 10-36)
(Benjamin 2002). When the reaction of formation of the EDTA-Cu complex is expressed
as ionization, similar to a “solubility constant”, the equilibrium constant has a value of
1.7 x 10⁻¹⁹ (1/Kf). Comparison of the previous value to that of the solubility constant of
copper sulfide shows that sulfide has a greater attraction to copper than EDTA, so in the
presence of sulfide and EDTA, copper would still form copper sulfide precipitate.
Furthermore, previous studies have shown that copper complexes are less toxic than free
copper so it is unlikely that, even though copper is toxic to anaerobic bacteria, it was the
main cause of inhibition of the SRB in the continuous system (Aquino and Stuckey
2007). Further evidence that copper addition to this particular system does not cause
inhibition is found in studies in Chapter 2. The system design prevents free copper to
reach the SRB inside the BR, by promoting copper sulfide precipitation inside the CR.
The fact that inhibition of sulfate reduction occurred immediately after EDTA addition,
instead of after soluble copper concentration increased in the system, points to the
conclusion that EDTA, and not copper is responsible for SRB inhibition. Soluble copper
increase in the system effluent can be attributed to the decrease of aqueous sulfide
concentration.
200
Ca2+ presented an antagonistic relationship with EDTA on the inhibition of sulfate
reduction (Figure 5.6). Addition of Ca2+ in stoichiometric proportions (1:1, Ca/EDTA) or
higher eliminated almost completely the inhibitory effect of 2 mM EDTA (Figure 5.7).
Henneken et al. (1995), observed a similar behavior in a study of EDTA degradation on
aerobic conditions. Their study reported aerobic cell growth only when metals (Mg and
Ca) were in molar excess. However, no growth was observed on metal deficient media
(EDTA at 1.7 mM was utilized in this study). They suggested strong interactions between
EDTA and functional metal ions of the cell wall as the reason behind the results obtained.
Complexation of essential metals by EDTA may have been responsible for the
inhibition observed in continuous and batch bioassays. EDTA is a well known chelating
agent. It forms strong complexes with a different series of heavy metals like iron, copper,
and cobalt (Benjamin 2002). Heavy metals are known to be toxic at relatively high levels
to microorganisms, including sulfate-reducing bacteria (Fang 1997; Hollingsworth et al.
2005; Karri et al. 2006; Sani et al. 2001; Utgikar et al. 2003). However, at low levels,
essential metals are required by all organisms in order to accomplish specific catalytic
functions. The lack of these catalytic functions may cause a reduction or a total stop of
metabolic activity in any microorganism, including sulfate-reducing bacteria. By
chelating these important cofactors, and in this way preventing them from realizing their
catalytic function, EDTA may create inhibition, which may be reinitiated when those
metals become available again.
ATP sulfurylase is an important enzyme in sulfate reduction, it activates sulfate
with ATP and introduces it into the reductive metabolic pathway of sulfate (Gavel et al.
201
1998; Taguchi et al. 2004). It has been demonstrated that cobalt and zinc function as
metal cofactors for this enzyme and are necessary for the activity of the enzyme (Gavel et
al. 1998; Taguchi et al. 2004). Adenylylsulfate reductase and sulfite reductase are the
other known enzymes participating in sulfate reduction; they are flavoenzymes with an
ironsulfur cluster (Fe4-S4) (Dahl and Truper 2001; Fritz et al. 2000). Due to the nature of
the enzymes it seems more probable that any interaction of EDTA will occur with the
cobalt and zinc metal cofactors, which are divalent cations, than with the iron sulfur
complexes.
The data of the effect of EDTA on ATP sulfurylase seems not to be conclusive.
Gavel et al (1998), noticed that after 72 h of treatment with 5 mM of EDTA the enzyme
activity was reduced by 10-15%. On the other hand, Taguchi et al (2004), did not notice
any Zn released from the enzyme after treatment with 50mM EDTA, suggesting that the
sulfurylase-metal complex is strong enough to prevent EDTA extraction. In the
experiment presented in this study EDTA inhibited sulfate reduction up to 58% with an
EDTA concentration of 2 mM. However when Ca2+ was added inhibition of EDTA was
reduced. This could indicate that in fact complexation of metal cofactors by EDTA could
be the reason behind this inhibition. Stability constants of metal complexes can provide
more information on this inhibition mechanism.
Stability factors for EDTA-Metal complex are defined as:
(5-1)
[ ][ ][ ]EDTAMe
EDTAMeK f−
=

202
Where Kf is the stability formation constant, [Me] is metal concentration, [EDTA]
is EDTA concentration and [Me-EDTA] is the complex concentration. The stability
formation constant for Zn has a value of 3.2 x 10¹⁶, for Co is 4.0 x 10¹⁸, and for Ca 5.0 x
1010 (Benjamin 2002). Cobalt and zinc will present more attraction to form an EDTA-Me
complex than calcium, this indicates that at equilibrium it is unlikely that calcium would
replace the zinc or cobalt in an EDTA-Me complex. However, enzymes are not the only
metal carriers on bacteria; usually metals are also found in cell walls.
EDTA is used in the food industry as food additives to potentiate food
preservatives by permeating the outer wall of gram-negative bacteria (Brul and Coote
1999). Gram-negative bacteria’s outer wall or lipopolysacharide layer (LPS), contains
anionic groups (phosphate, carboxyl) as part of the lipid component. These anionic
groups give stability to the outer wall by electrostatic interactions with divalent cations,
such as Mg2+ (Helander et al. 1997). EDTA interaction with these metals destabilizes the
outer wall and releases LPS molecules, thus increasing permeability of the outer wall
(Helander et al. 1997). On a study on the transfer of xenobiotics through the cell
membrane of luminous bacteria, Medvedeva (1999) found that EDTA at high
concentrations presented a negative effect on these microorganisms. The study found that
some cells had deformities on their periplasmic space caused by the local ‘blowing’ of
the outer membrane of the cell wall. At low concentrations EDTA did not present these
effects although higher cell permeability was observed at long-term exposures
(Medvedeva 1999). Cations found on cell wall are varied and some of them may have
stability constants lower than calcium (like magnesium Kf = 4.9 x 10⁸), which will
203
explain why calcium lowered the inhibition of EDTA on SRB. Most SRB are gram-
negative, and would be affected by EDTA (Madigan et al. 2003b).
5.5.2. Granular Methanogenic Sludge and EDTA Toxicity
EDTA presented inhibition to methanogenic granular sludge. However, unlike the
results obtained for the sulfate-reducing bacteria, EDTA was less inhibitory for the
methanogenic granular sludge. Inhibitions of 60% were obtained for 40 mM of non-
complexed EDTA, while for sulfate-reducing bacteria the same level of inhibition was
obtained with only a concentration of 2 mM of non-complexed EDTA. Granular sludge
tends to be more resistant to toxicity of any chemical than suspended sludge (Hulshoff
Pol et al. 1998). This is due to the protective nature of the granule. Cells inside the
granule would be protected to direct contact to any external agent by the outer cells in the
granule. This protection to direct contact lowers the effect of an agent to create acute
toxicity. In the case of this experiment EDTA would only affect the outer cells in the
granule while the inner cells would be protected. A larger dose of EDTA would then be
needed to cause the same amount of acute inhibition than on suspended sludge.
While for sulfate reducer sludge the addition of calcium ion prevented EDTA
inhibition, for granular methanogenic sludge it enhanced it. This behavior presented the
possibility that Ca2+ was also inhibiting the production of methane in the granular sludge
and a batch experiment to measure the inhibition of Ca2+ was done. The results obtained
show an inhibition of methane production at Ca2+ levels above 20 mM. As observed in
the experiment, at this levels precipitation started to occur, probably due to calcium salts

204
formation. Hulshoff Pol et al (1998) observed that although Ca2+ ions did not present
direct effect on granular sludge; at Ca2+concentrations above 400 mg/L (~ 10 mM)
formation of calcium salts prevented the transport of substrate and products due to the
precipitation of salts on the surface of the granules, reducing then the activity. The same
was observed on the remediation of metal contaminated wastewaters with sulfide
precipitation (Utgikar et al. 2002). The same mechanism of inhibition may have occurred
with Ca2+ in the experiments performed here.
Assuming that calcium precipitation was the main mechanism of inhibition, then
calcium ion would not present any inhibitory effect on methanogenic sludge. The latter
has been stated previously by some studies (Hulshoff Pol et al. 1998), and others have
even reported increased activity due to the presence of Ca2+ ions (Tada et al. 2005). The
low effect of Ca2+ on methanogenic activity, combined with the levels of EDTA
inhibition observed, would suggest that the synergistic relationship between EDTA and
Ca2+ would then be due to other mechanisms besides direct effect of either EDTA or
Ca2+.
EDTA was fed to the batch experiments as a disodium salt. EDTA is an acid
capable of releasing four protons when fully deprotonated. The acidity constants of
EDTA show that, at neutral pH, EDTA will be present as a combination of H2EDTA2-
and HEDTA3- (acidity constants for EDTA are 2.0, 2.7, 6.2 and 10.3). However, with the
formation of the EDTA-Ca complex, EDTA releases both protons decreasing pH in the
process. The experiments performed in this experiment had a buffer capacity of
approximately 50 mM (4000 mg of sodium bicarbonate). On experiments with low

205
concentrations of EDTA (less than 10 mM), the acidity released by the formation of the
EDTA-Ca complex would be absorbed by the buffer present in the medium. On the other
hand, for higher EDTA concentrations the buffering capacity is not high enough and pH
becomes important. Values of pH were obtained for the EDTA-Ca experiment and it was
observed that for EDTA concentrations of 30 and 40 mM pH was lowered from a value
of 7.05 for the control, to a value of 4.75 and 4.34 for 30 and 40 mM, respectively. The
pH plays an important role in methanogenic activity; low pH values will inhibit
methanogenic bacteria. Previous studies have shown that methanogenesis functioned in a
pH range between 6.6 and 7.8, however the process presented problems at a pH lower
than 6.1 (Lay et al. 1997). The results obtained in this study showed that pH and not
EDTA concentration was the main factor responsible for methanogenic inhibition.
Observation of the results obtained showed that EDTA was less toxic to
methanogens, this would be probably due to the lack of a cellular structure similar to the
gram-negative bacteria in SRB. Methanogens which are archaeas, have a cell structure
similar to gram-positive bacteria. Some methanogens, like Methanobrevibacter
ruminantium, present a thick outer wall and contains pseudopeptidoglycan, a common
feature in gram-positive bacteria (Madigan et al. 2003a).
206
6. ENVIRONMENTAL EVALUATION OF PFOS-FREE PAGS: TOXICITY,
BIODEGRADABILITY AND PHYSICO-CHEMICAL TREATMENT
6.1. Abstract
Photolithography is an important step in the semiconductor manufacturing. Photo Acid Generators (PAGs) and specifically Perfluorooctane sulfonate (PFOS) are integral part of this process and thus important for the semiconductor industry. However, PFOS has emerged as a priority environmental contaminant due to its recalcitrance and bioaccumulation. New families of chemicals are needed to substitute PFOS and other related perfluorinated chemicals in the semiconductor manufacturing. Evidence suggests that lower fluorination and structural changes promote biodegradability. The objective of this study is to evaluate the environmental biodegradability and toxicity of a new family of non-perfluorinated PAGs. New PAGs were studied for toxicity with the Mitochondrial Toxicity Test (MTT) assay, the Microtox test and methanogenic toxicity. No significant toxicity of the new PAGs was found with IC50 values above 300 μM for all PAGs, with the exception of Sweet PAG, which presented IC50 values between 70 and 160 μM to methanogens. However, it was found that common PAG counterions like diphenyliodonium and triphenylsulfonium, with IC50 levels below 100 μM, presented toxicity of one to two orders of magnitude higher than that of the PAGs. Biodegradability tests performed on the new PAGs showed increased degradability thanks to lower fluorination and structural changes (e.g. replacement of aromatic moieties by aliphatic structures). The most promising results were observed with PAGs which were not perfluorinated and did not present other known recalcitrant groups (e.g. aromatic). Lactone PAG and Sweet PAG presented 100% removal in aerobic treatments, and fluoride release levels of 9% of initial fluorine content for Lactone PAG, and 17% for Sweet PAG. Granular activated carbon isotherms were also conducted on the new PAGs. The results indicated that new PAGs have similar affinity to that of perfluorobutane sulfonate (PFBS) and PFOS, with Sweet PAG being the PAG with the most affinity for adsorption. New PAGs were also treated with zero valent iron (ZVI) reduction. Of all the PAGs treated only SF2 was susceptible to transformation by ZVI with 100% conversion to an unidentified product. Lastly the Fenton reaction was evaluated. New PAGs were degraded by the Fenton reaction. All new PAGs were removed by 100% after 15 min of treatment. The fluorine in SF1 and PF1 was mineralized by 100% and 50% with Fenton treatment. All the results obtained in this study suggest that lower fluorination number corresponds to more environmentally benign PAGs.
207
6.2. Introduction
Integrated circuits are an intricate system of 3d structures produced by an
important process called lithography. This is a technique used in semiconductor
fabrication which involves the transfer of a pattern to a polymer film and then engraving
this pattern in a wafer, which after several cycles creates a three dimensional structure of
the circuit. When light is used as an agent to create such a pattern, the process is called
photolitography (Thompson 1994). This process broadly includes six steps: wafer
preparation; photoresist application or coating; exposure to light, UV radiation or electron
beams; development of the pattern by the addition of a developing solution; etching,
where the substrate or film not protected by the resist is removed; and striping, when all
the resist is taken out of the wafer (Thompson 1994).
One of the main compounds utilized in photolithography are photoactive acid
generators (PAG). PAGs are light sensitive compounds that are used to alter the solubility
of photoresists in regions exposed to UV or e-beam radiation (Thompson 1994).
Perfluorooctanesulfonate (PFOS) is the most used PAG in the semiconductor industry
(Tang et al. 2006). Usually most of the PAG is disposed of via discharge and incineration
(around 90-93%) (Brooke et al. 2004). Nonetheless, up to 40% of the solution used in this
process might end up being discharged to the wastewaters in some facilities (Brooke et
al. 2004). Concentrations of PFOS and related compounds in the process waters vary in
the range of 0.2-1% (Brooke et al. 2004; Tang et al. 2006) and these concentrataions are
greatly diluted once the wastewater is sent to a municipal wastewater treatment plant
(Tang et al. 2006).
208
Reports of the detection of PFOS and related long-chain perfluorinated
compounds in environmental and biological matrices together with reports on the
persistence and toxicity of these chemicals (Berthiaume and Wallace 2002; Hu et al.
2002; Kannan et al. 2001) have increased their scrutiny as priority environmental
contaminants. Furthermore, PFOS has been reported to bind to human blood serum,
specifically to the protein albumin (Poulsen et al. 2005). PFOS has been reported to affect
the neuroendocrine system in rats, which has lead to its classification as an endocrine
disruptor (Austin et al. 2003). PFOS has also been detected in part-per-billion levels in
animals worldwide (Giesy and Kannan 2001; Kannan et al. 2001), including remote
locations such as Siberia and Antarctica, and in the international blood bank (Calafat et
al. 2006; Kannan et al. 2004).
PFOS is a recalcitrant chemical for which degradation by any means, either
chemical or biological, under environmental conditions has not been reported (Key et al.
1998; Tang et al. 2006). The high stability of PFOS is commonly attributed to its
perfluorination. Carbon-fluorine bonds are one of the strongest bonds in organic
chemistry with a bond energy of 485 kJ/mol, compared to a carbon-hydrogen bond
energy of 440 kJ/mol.
Degradation of PFOS by biological means has not been reported. Nevertheless, by
changing some of the characteristics that make PFOS recalcitrant, such as
perfluorination, studies have found improved degradability. Key et al. (1998) proved
partial degradation of H-PFOS (1H,1H,2H,-2H-perfluorooctane sulfonate;
C6F13C2H4SO3-) by Pseudomonas sp. strain D2. Partial degradation of H-PFOS
209
occurred more readily under aerobic conditions. Highly halogenated hydrocarbons tend
to be more readily degraded under anaerobic conditions (Field and Sierra-Alvarez 2004).
An important pathway for halogenated hydrocarbons degradation is reductive
dehalogenation (Field and Sierra-Alvarez 2004). Ochoa-Herrera et al. (2008) studied
degradation of PFOS utilizing vitamin B12 and Ti(III), the results showed dehalogenation
of branched PFOS isomers. No dehalogenation was observed with linear PFOS isomer,
emphasizing the importance of structural changes on promoting degradation.
Data for the physico-chemical treatment of PFOS in the literature is scarce.
Physical approaches for the removal of PFOS include membrane processes such as
reverse osmosis (Tang et al. 2006). While chemical approaches include zerovalent iron
(ZVI) in subcritical water (350oC) (Hori et al. 2006); and ultrasonic irradiation (Moriwaki
et al. 2005). All of these techniques suffer from the lack of complete degradation of
PFOS, or, in the case of reverse osmosis, a production of PFOS concentrated waste. The
applicability of all these techniques is doubtful due to their high energy demand.
Despite the environmental concerns that it presents, PFOS and other long chain
perfluorinated materials are vital to semiconductor manufacturing and there is some
urgency in finding a replacement family of chemicals. New materials with similar or
better performances must be found out in order to replace existing materials. The goal is
to introduce new materials which are more environmentally compatible.
Based on the hypothesis that lower fluorination has the potential to allow for less
persistence and bioaccumulation in the environment, this project aims to develop new
PAGs which do not rely on perfluorination while at the same time retaining outstanding

210
lithographic properties, and investigate the environmental behavior of these PAG
alternatives. The chemical structure of the PAG compounds and counterions evaluated, as
well as their molecular formulas, and molecular weights are shown in Figures 6.1 and 6.2
and Table 6.1. The new non-perfluorinated chemicals were developed and synthesized by
Dr. C. L. Ober and his research group from the Cornell University (Ayothi et al. 2006;
Ayothi et al. 2007). The objective here will be to evaluate key environmental properties
of the novel PAGs, i.e., 1) their bioaccumulation potential; 2) susceptibility to
biodegradation by microorganisms commonly found in wastewater treatment systems; 3)
toxic effects; and 4) treatability by physical and chemical means.
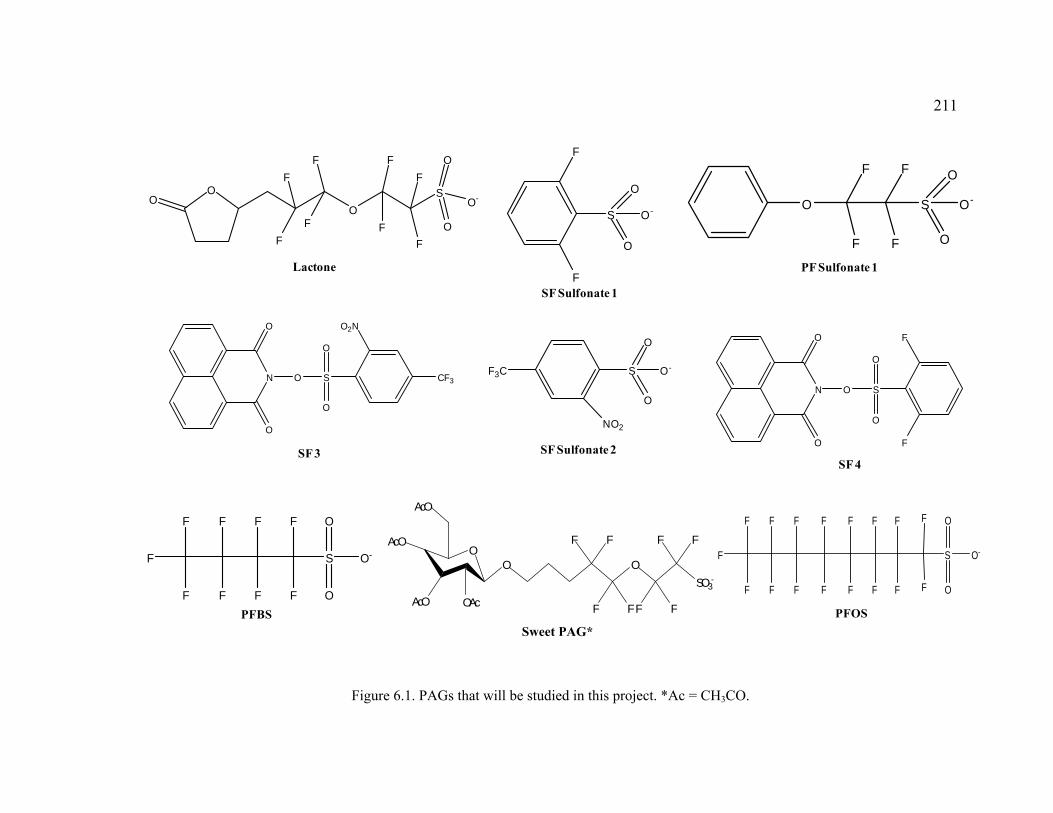
211
Figure 6.1. PAGs that will be studied in this project. *Ac = CH3CO.
F
F
S
O
O
O-
SF Sulfonate 1
NO2
SF3C
O
O
O-
SF Sulfonate 2
O
F
F
F
F
S
O
O
O-
PF Sulfonate 1
N O
O
O
S
O
O
O2N
CF3
SF 3
N O
O
O
S
O
O
F
F
SF 4
F
F
F
F
F
F
F
F
F
S
O
O
O-
PFBS
S
F
F F
F
F
F
F
F F
F
F F
FF
F
F F O
O
O-
PFOS
OO
OS
O
O
O-
F
FF
F
F
F
F
F
Lactone
I+S+
Triphenylsulfonium Diphenyliodonium
OO
F F
F F
O
F F
F F
SO3-
AcO
AcO
AcO OAc
Sweet PAG*
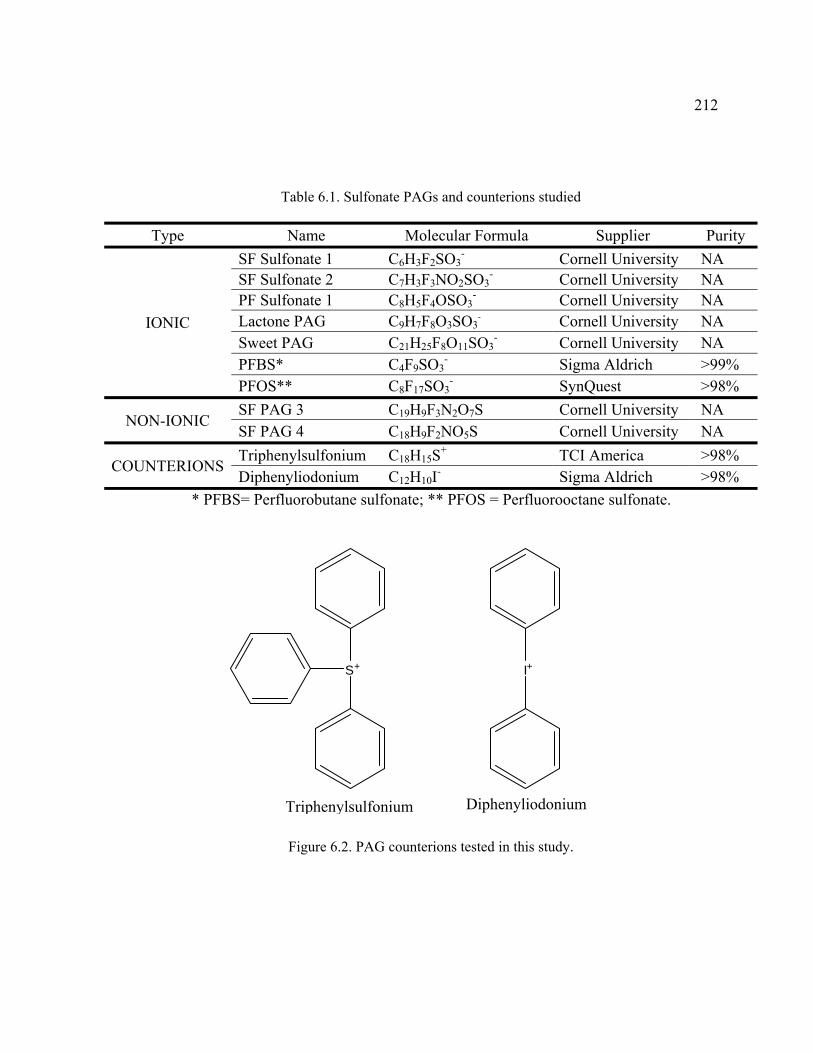
212
Table 6.1. Sulfonate PAGs and counterions studied
Type Name Molecular Formula Supplier Purity
IONIC
SF Sulfonate 1 C6H3F2SO3- Cornell University NA
SF Sulfonate 2 C7H3F3NO2SO3- Cornell University NA
PF Sulfonate 1 C8H5F4OSO3- Cornell University NA
Lactone PAG C9H7F8O3SO3- Cornell University NA
Sweet PAG C21H25F8O11SO3- Cornell University NA
PFBS* C4F9SO3- Sigma Aldrich >99%
PFOS** C8F17SO3- SynQuest >98%
NON-IONIC SF PAG 3 C19H9F3N2O7S Cornell University NA SF PAG 4 C18H9F2NO5S Cornell University NA
COUNTERIONS Triphenylsulfonium C18H15S+ TCI America >98% Diphenyliodonium C12H10I- Sigma Aldrich >98%
* PFBS= Perfluorobutane sulfonate; ** PFOS = Perfluorooctane sulfonate.
Figure 6.2. PAG counterions tested in this study.
S+ I+
Triphenylsulfonium Diphenyliodonium
213
6.3. Materials and Methods
6.3.1. Microorganisms
The toxicity of the new compounds to methanogenic microorganisms was tested
on methanogenic granular sludge obtained from industrial anaerobic bioreactors treating
recycle paper wastewater (Eerbeek, The Netherlands). The content of volatile suspended
solids (VSS) in the methanogenic sludge was 13.7% wet weight. The microbial cultures
were elutriated to remove the fines and stored under nitrogen gas at 4°C.
Mixed cultures were utilized for all biodegradation studies. In the case of aerobic
and cometabolic studies, activated sludge (AS) obtained from the Ina Road wastewater
treatment plant (Tucson, Arizona) was utilized. The AS had a VSS concentration of
0.664% wet weight. For anaerobic degradation anaerobically digested sewage sludge
(ADSS) also obtained from the Ina Road wastewater treatment plant (Tucson, Arizona)
was used. ADSS had a VSS concentration of 1.18% wet weight.
6.3.2. Toxicity Assays
Toxicity was one of the factors included in the environmental evaluation of new
PAGs. Along with the new PAGs the counterions usually used in the semiconductor
industry or the PAGs were also evaluated for toxicity: diphenyliodonium and
triphenylsulfonium. The toxicity of the new PAGs and metabolites from their microbial
conversion was evaluated utilizing three different assays: the methanogenic inhibition
test, the Mitochondrial Toxicity Test (MTT), and the Microtox® assay.

214
6.3.2.1. Methanogenic Toxicity
The methanogenic inhibition assays measures the toxicity of a determined
compound to anaerobic methanogenic microorganisms. The inhibition is measured by
exposing the microorganisms to different concentrations of the compound to analyze, and
then measuring the rate of production of methane and comparing this to a control lacking
the compound. This test is good for correlating toxicity of a compound to
microorganisms usually found in wastewater treatment plants. For this test two different
electron donors were utilized: acetate and hydrogen.
Methanogenic toxicity assays were performed in 160 mL serum flasks sealed with
rubber septa. Hydrogen and acetate were utilized as electron donors in this experiment.
Anaerobic methanogenic sludge (1.5 g VSS/L) was then transferred to serum flasks
containing 50 mL of basal medium. To achieve anaerobic conditions the headspace of the
serum flasks was flushed with N2/CO2 (80/20, v/v) for 5 min. For hydrogen as electron
donor the headspace and the medium in each flask was flushed with H2/CO2 (80/20, v/v)
gas for 5 min. When acetate was used as the electron donor, sodium acetate (NaC2H3O2)
was added to the medium with a final concentration of 2 g COD/L. The serum flasks
were then incubated and shaken overnight at 30±2ºC, and the headspace was flushed
again at the next day. Different concentrations of toxicant were added to different bottles
using concentrated stock solutions; the methane production was then measured over an
interval of 1 to 4 days. The maximum specific methanogenic activities were calculated

215
from the slope of the cumulative methane production (mL) versus time (days) and the
biomass concentration at the end of the assays, as the mean value of triplicate assays. The
different methane production rates were then compared to a negative control (no toxicant
added) and a dose-response curve was prepared to determine inhibition levels. Inhibition
Concentration (IC) values were calculated for 20% inhibition (IC20), 50% inhibition
(IC50), and 80% inhibition (IC80) using linear regression between the most proximate
experimental values to the inhibition desired.
6.3.2.2. Mitochondrial Toxicity Test
The MTT measures the metabolic activity of the mitochondria inside eukaryotic
cells. Mitochondria are responsible of energy production inside the cells. Cells are
exposed to the compound to be analyzed, and the mitochondrial activity is measured by
colorimetric methods and compared to a negative control which has not been exposed to
the toxicant. A dose-response curve is then prepared and the results analyzed. Although
concentrations of most PAGs exceeding 1,000 μM were assayed, lower concentrations of
PFOS, SF3, and SF4 were tested due to the low aqueous solubility of the latter
compounds.
MTT stock solution is prepared by dissolving 4 mg/mL of 3-(4,5-dimethylthiazol-
2-yl)-2,5-diphenyl tetrazolium bromide in 1x PBS and filtered to sterilize and remove any
amount of insoluble residue present. PBS 1x solution contains (g/L): NaCl (8), KCl (0.2),
216
Na2HPO4 (1.44), KH2PO4 (0.24), pH is adjusted with HCl to 7.4. The MTT assay
described here was adapted from (Mosmann 1983).
For the MTT assay, UROtsa cells, which are SV-40 T-antigen immortalized
urothelial cells derived from human ureter epithelium were utilized. Cells were cultured
and grown until arriving to optimal conditions (cell density between 60-80%). At this
point they were dosed with a concentrated liquid stock solution of the target chemical.
Following the dose, the cells were incubated for 24 hours. Afterwards, 1 mL of working
MTT solution (1:10 dilution of MTT stock solution in phosphate buffered saline solution,
PBS) was added to all wells of an assay, and plates were incubated at 37°C for 30 min to
4 hours. At the end of the incubation period, the medium was discarded by siphoning and
1 mL of dimethyl sulfoxide (DMSO) was used to dissolve all the converted MTT
precipitate. After a few minutes at room temperature, 0.1 mL of the DMSO and
converted MTT solution were transferred to a 96 well plate the absorbance at a
wavelength of 550 nm was measured on a microplate reader. Results were plotted against
concentration in a dose response curve. All MTT measurements and assays were
performed with the help of Sarah Buffington and Xing-Hui Zheng, in the Department of
Pharmacology and Toxicology in the University of Arizona.
6.3.2.3. Microtox Assay
Microtox® is a commercially available test that measures the toxic effect of
chemical compounds toward a bioluminescent bacterium (Vibrio fischeri). The light
217
intensity emitted by the bacterium correlates to the amount of inhibition imposed by the
toxicant. Results are compared to a control (lacking target chemical) and the results are
analyzed in a dose-response curve. Microtox® test results for a variety of organic and
inorganic chemicals have shown a good correlation with inhibitory concentrations
determined in assays with aquatic organisms (e.g. fish and crustaceans) (Dezwart and
Slooff 1983; Nacci et al. 1986; Steinberg et al. 1995).
A detailed procedure of this test is described in the Microtox® manual. A brief
description of the process utilized in this study is presented here. At first samples are
prepared by adding 0.3 mL of Microtox® Osmotic Adjustment Solution (OAS) to 3 mL
of sample. A preparation of serial dilutions followed by diluting the solution prepared
before with Microtox® diluent. Microorganisms, Vibrio fischeri a bioluminescent marine
microorganism was used in the Microtox® assay, were reconstituted by adding 1 mL of
Microtox® reconstituting solution to one vial of Microtox® acute reagent
(microorganisms). Incubation for 15 min followed reconstitution. After incubation 10 μL
of acute reagent, which contains the microorganisms used in this technology, were added
to 0.5 mL of diluent previously placed in vials for dosing. Initial readings of
bioluminescence were taken and dosage followed by adding 0.5 mL of the target
chemical previously diluted. Bioluminescence was measured after 5 min, 15 min, and 30
min of incubation time utilizing a Microtox® Model 500 analyzer. The highest
concentration tested for PAGs was 11.25 mM, with the exception of PFOS, SF3 and SF4
which had lower concentrations for the same reasons exposed in the previous section. A
dose-response curve was then prepared with the results obtained. IC50 and IC80 values
218
were calculated utilizing the software Microtox OMNI by Strategic Diagnostic (Newark,
DE).
6.3.3. Biodegradation Assays
Aerobic, anaerobic and cooxidation studies were conducted in batch assays. The
experiments were performed in 330 mL serum flasks sealed with rubber septa and
aluminum screw cap. Both AS and ADSS were previously acclimated for 24 hours in a
basal medium (pH 7.2) containing (in mg/L): (NH4)HCO3 (500), K2HPO4 (250), KH2PO4
(125), MgSO4 7H2O (100), CaCO3 (10), yeast extract (10), NaHCO3 (1000), and 1 mL/L
of trace element solution (for full composition see Chapter 2). Subsequently, the sludge
(1.5 g VSS/L) was transferred to flasks containing 100 mL of the mineral medium. PAGs
were added after sludge from aqueous stock solutions. For aerobic and cooxidation
studies, the headspace of the serum flasks was flushed with a gas mixture of O2/He/CO2
(20/60/20, v/v/v) for 10 min. Afterwards methane was supplied to cooxidative assays
until reaching a concentration of 10% methane in the headspace. Methane was
replenished with a frequency of two weeks for the first two months of treatment. Later on
the experiment, methane was replenished every two months. For anaerobic conditions the
headspace was flushed with N2/CO2 (80/20, v/v) for 10 min. All flasks were incubated at
30±2°C
Fluoride released as well as PAG consumption were determined for all sets.
Oxygen consumption and methane production were only measured for Lactone PAG and

219
Sweet PAG. Methane production and oxygen concentration were calculated from the
volume of the headspace and the percentage composition in the biogas as determined by
gas chromatography. Net cumulative methane production, oxygen consumption and
fluoride released were calculated by subtracting background production, consumption or
release in the endogenous control.
Sterilization of heat-killed and abiotic treatments was achieved by autoclaving of
the treatment sets. Bottles with mineral medium were autoclaved at 121 oC for 30 min.
Sludge was autoclaved at 121 oC for 35 min. After 24 hrs of the first sterilization, sludge
was autoclaved a second time at 121 oC for 35 min.
6.3.4. Physico-Chemical Treatment
Physico-Chemical treatment of the new PAGs was studied for three different
processes: advanced chemical oxidation with Fenton’s reagents, advanced chemical
reduction with zero valent iron (ZVI), and adsorption to granular activated carbon.
6.3.4.1. Activated Carbon Adsorption
Isotherms were set up for all PAGs. Granular activated carbon (GAC) was
utilized as sorbent. A total of 0.1 grams of GAC were placed together with 100 mL of
liquid at pH 7.2 containing varying concentrations of PAG (0-150 mg/L), and a mixture
of dibasic and monobasic potassium phosphate salts at a total phosphate concentration of

220
3 mM as buffer. All the assays were performed in 160 mL serum bottles and capped with
rubber butyl septa and aluminum caps. Control treatments were setup for possible
adsorption of PAGs on glassware or other abiotic mechanisms that may have contributed
to compound loss. The bottles were shaken and stored at 30oC for one day and then the
concentrations of PAG were measured in the liquid phase. Liquid samples were
centrifuged prior measurement of the PAG concentration. The results were then plotted
and adjusted to Langmuir and Freundlich isotherm models.
The Langmuir model is defined by:
(6-1)
Where Cs describes the concentration of PAG in sorbent (mg PAG/mg sorbent);
Ce is defined as the concentration of PAG in liquid (mg/L); a, b are Langmuir parameters,
where a represents the maximum achievable load and b is the adsorption reaction
constant.
The Freundlich model is defined as:
(6-2)
Where K is the Freundlich adsorption constant and n gives an estimation of the
sorption intensity. In the Freundlich equation, K indicates capacity of adsorption; while n
hints towards intensity of adsorption. Ce and Cs have the same meaning than in the
Langmuir isotherm.
E
ES bC
abCC+
=1
nES KCC
1=
221
6.3.4.2. Fenton’s Oxidation
Advanced chemical oxidation with Fenton’s reagent was carried out for all PAGs.
A solution containing 5 mM of ferrous sulfate heptahydrate, and 200 mg/L of PAG was
prepared for each different PAG. All the assays were performed in 160 mL serum bottles
and capped with rubber butyl septa. A final pH of 4.0 was obtained by acidification with
nitric acid. A solution of 30% hydrogen peroxide was added to the treatment slowly to
prevent generation of heat. A total of 2 mL of such solution was added to the treatment, 1
mL at the beginning of the experiment, and the rest 15 minutes after. The experiment was
performed at 25oC and was not shaken. PAG concentration as well as fluoride released
were measured at different intervals and plotted versus time. Controls with iron only and
hydrogen peroxide only were also prepared.
6.3.4.3. Reduction with Zero Valent Iron
For Zero Valent Iron (ZVI) treatment, 45 mL of a solution at pH 6.5, containing
dibasic and monobasic potassium phosphate salts as buffer (5 mM), was prepared and
added to 1 g of ZVI in 160 mL serum bottles. The headspace was then flushed with a gas
mixture of H2/CO2 (80/20 v/v) and sealed with a rubber butyl septa and an aluminum cap.
Hydrogen in the headspace avoids corrosion of the iron surface which decreases the rate
of reaction, and facilitates reduction of the target compound (Keum and Li 2004).
Immediately after flushing, 5 mL of a stock solution of PAG was added to achieve a final
concentration of 200 mg/L. The flasks were shaken and stored at a temperature of 30oC
222
for 2 to 4 days. PAG concentrations as well as fluoride released were measured at
different intervals of time. Samples were filtered with a 45μm cellulose nitrate filter.
Controls with no ZVI were also prepared.
6.3.5. Analytical Techniques
6.3.5.1. Gas Chromatography
Methane and oxygen concentrations were measured using a gas chromatograph
(HP5290 Series II GC system, Agilent Technologies, Palo Alto, CA). For methane, the
GC was equipped with a flame ionization detector (GC-FID) and fitted with a Nukol
fused silica capillary column (30 m length x 0.53 mm ID, Supelco, St. Louis, MO). The
carrier gas was helium at a flow rate of 11 mL/min and a split flow of 84 mL/min. The
temperatures of the column, injector port, and the detector were 140, 180, and 250°C,
respectively. In the case of oxygen measurements, the GC was equipped with a Thermal
Conductivity Detector (GC-TCD) and a Carboxen 1010 Plot column (30 m length x 0.32
mm I.D., Supelco, St. Louis, MO). Helium was used as carrier gas with a flow rate of
18.2 mL/min and a split flow of 33.5 mL/min. The temperature of the column was 90°C,
with a temperature for the injector port and the detector of 150°C and 200°C,
respectively. Samples were collected using a pressure-lock gas syringe.
223
6.3.5.2. Suppressed Conductivity Ion Chromatography (IC)
PF1, PFOS, PFBS, as well as Lactone PAG for the chemical treatments, were
quantified using an ICS-3000 ion chromatography system (DIONEX, Sunnyvale, CA)
suppressed conductivity detector equipped with an AMMS III suppressor. The
chromatograph was fitted with a separation column (Acclaim Polar Advantage II, C18,
DIONEX) and a guard column (Acclaim PA2, 5 µm) operating at 35ºC (all the system
from Dionex, Sunnydale, CA). A mixture of 20 mM boric acid (pH 9.0) and 95%
acetonitrile was used as the mobile phase at a flow rate of 1 mL/min. Retention times for
PF1 was 6.5 min, PFBS had a retention time of 6.7 min, PFOS presented a retention time
of 13.7 min, and Lactone PAG had a time of 10 min.
The concentrations of SF1, Lactone PAG, and Sweet PAG in the biodegradation
experiments were measured by IC with suppressed conductivity using a DIONEX DX-
500 system equipped with a Dionex AS11-HC column and an AG11-HC guard column.
The system also used an ASRS® 300 conductivity suppressor (all the system from
Dionex, Sunnydale, CA). The mobile phase had a gradient of 0.67 mM KOH/min going
from 20 mM to 30 mM at a flow rate of 1.2 mL/min. The column was maintained at room
temperature. The injection volume was 25 μL. Retention time for SF1 was 12.3 min, for
Lactone PAG 40.0 min, and 31.2 min for Sweet PAG.

224
6.3.5.3. HPLC-DAD
A high performance liquid chromatograph (Hewlett-Packard 1090 HPLC) with a
diode array detector (DAD) was used to measure SF2 and PF1 PAGs. The chromatograph
was equipped with a separation column (Acclaim Polar Advantage II, C18) operating at
room temperature and a guard column (Acclaim PA2, 5 µm). The mobile phase was a
mixture of phosphate buffer (20 mM, pH 3.0) and acetonitrile (70%), pumped to the
system at a flow rate of 1 mL/min. SF2 and PF1 PAG were detected at 205 nm for SF2
and PF1, and 325 nm for SF2 only. The injection volume was 25 μL. Retention time for
SF2 was 18.5 min, while for PF1 was 23.2 min.
6.3.5.4. Fluoride Analysis
Fluoride was measured using a VWR SympHony fluoride-selective combination
electrode. Samples were centrifuged prior to measurement. Centrifuged samples were
then diluted 50% with ISA solution to buffer ion strength. Calibration standards were also
diluted with this solution.
6.3.5.5. Mass Spectrometry
Mass spectrometry analysis was conducted in a doubly-focusing JEOL HX110A
sector (EB) mass spectrometer (Peabody, MA). Negative ionization was employed to
detect ionic PAGs, and any other degradation products. Helium was used as a collision
225
gas and a 35% relative collision energy was applied in the MS/MS experiments. MS/MS
spectra were recorded within a mass range of m/z 75–1000 using a scan time of 0.2 s.
6.3.5.6. Volatile Suspended Solids
Volatile suspended solids were determined according to Standard Methods for
Examination of Water and Wastewater (APHA 2005).
6.3.6. Chemicals
All chemicals used were reagent grade or better. Perfluorobutane sulfonic acid
potassium salt, PFBS (CAS 375-73-5; >97%); Diphenyliodonium chloride, DPI (CAS
1483-72-3; >98%); 3-(4,5-dimethyl-2-thiazolyl)-2,5-diphenyl-2H-tetrazolium bromide
(CAS 298-93-1; ~98%); iron sulfate heptahydrate (CAS 7782-63-0; >99%); hydrogen
peroxide (CAS 7722-84-1; 30% in H2O); and zero valent iron (powder, -325 mesh, CAS
7439-89-6; 97% purity), were obtained from Sigma-Aldrich Corp. (St. Louis, MO).
Perfluorooctane sulfonic acid potassium salt, PFOS, (CAS 2795-39-3; 98% purity) was
purchased from SynQuest Laboratories (Alachua, FL). Triphenylsulfonium bromide, TPS
(CAS 3353-89-7; >98%) was obtained from TCI America (Portland, OR). Granular
activated carbon Filtrasorb 400 (F400) was obtained from Calgon Carbon Corporation,
(Pittsburg, PA). All Microtox reagents were obtained from Strategic Diagnostics
(Newark, DE). PAGs were a kind gift from Dr. Chris Ober at Cornell University (Ithaca,
NY).
226
6.4. Results
The environmental impact of new PFOS/PFAS free PAGs was evaluated. PFOS
and PFBS, two commercial perfluorinated PAGs, were also examined as reference
compounds. The various compounds were evaluated for toxicity (i.e., methanogenic
assays, Microtox® and mitochondrial toxicity test), biodegradability (i.e, anaerobic,
aerobic, aerobic cooxidation), and treatability by physic-chemical methods (i.e., activated
carbon adsorption, Fenton oxidation, reduction by zero-valent iron).
6.4.1. Toxicity Assays
All the new PFOS-free PAGs as well as the counterions usually found in the
semiconductor industry were tested for toxicity in three different tests: MTT assay,
methanogenic toxicity, and Microtox® test. The results will be presented for each test
and further discussed. Trends in toxicity, if any, will also be analyzed in this section.
6.4.1.1. MTT Test
All PAGs as well as their respective counterions were tested with the MTT assay,
and the results including IC20, IC50 and IC80, as well as the inhibition obtained at the
maximum concentration tested, are presented in Table 6.2. Of all the PAGs tested, only
PF1, SF3 and Lactone PAG presented any significant toxicity. However, the latter
compounds were only inhibitory at relatively high concentrations (≥ 161 μM). Other
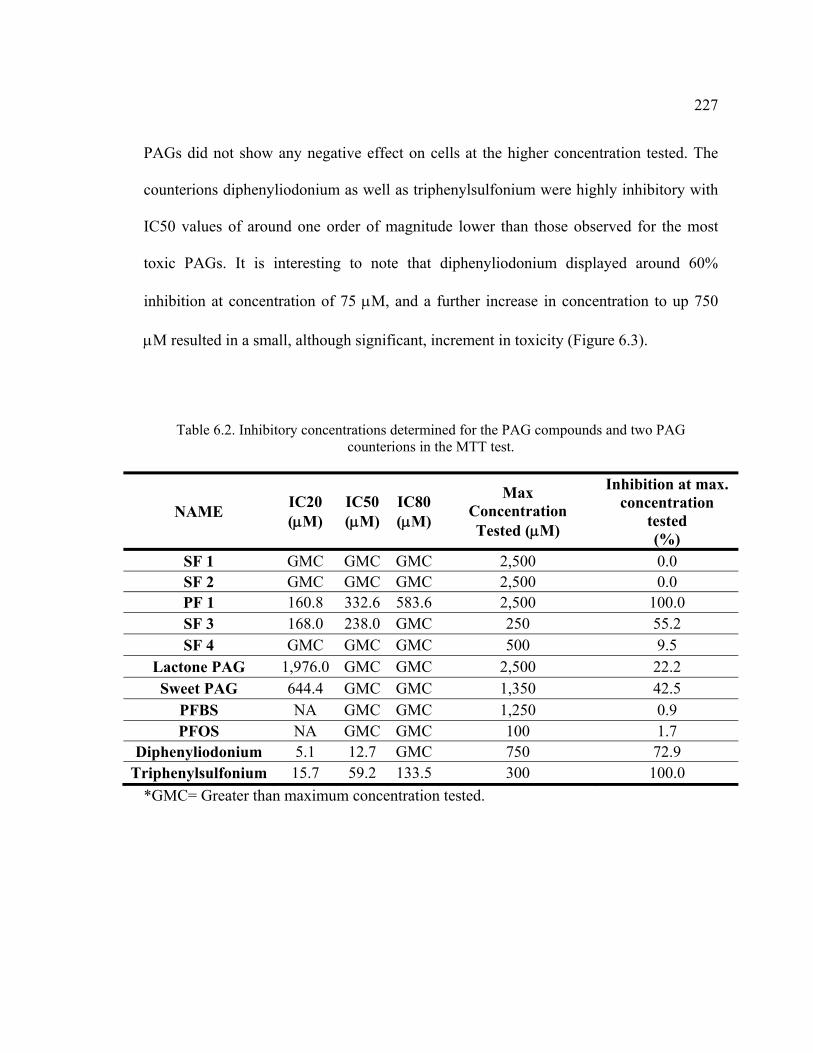
227
PAGs did not show any negative effect on cells at the higher concentration tested. The
counterions diphenyliodonium as well as triphenylsulfonium were highly inhibitory with
IC50 values of around one order of magnitude lower than those observed for the most
toxic PAGs. It is interesting to note that diphenyliodonium displayed around 60%
inhibition at concentration of 75 μM, and a further increase in concentration to up 750
μM resulted in a small, although significant, increment in toxicity (Figure 6.3).
Table 6.2. Inhibitory concentrations determined for the PAG compounds and two PAG counterions in the MTT test.
NAME IC20 (μM)
IC50 (μM)
IC80 (μM)
Max Concentration Tested (μM)
Inhibition at max. concentration
tested (%)
SF 1 GMC GMC GMC 2,500 0.0 SF 2 GMC GMC GMC 2,500 0.0 PF 1 160.8 332.6 583.6 2,500 100.0 SF 3 168.0 238.0 GMC 250 55.2 SF 4 GMC GMC GMC 500 9.5
Lactone PAG 1,976.0 GMC GMC 2,500 22.2 Sweet PAG 644.4 GMC GMC 1,350 42.5
PFBS NA GMC GMC 1,250 0.9 PFOS NA GMC GMC 100 1.7
Diphenyliodonium 5.1 12.7 GMC 750 72.9 Triphenylsulfonium 15.7 59.2 133.5 300 100.0
*GMC= Greater than maximum concentration tested.
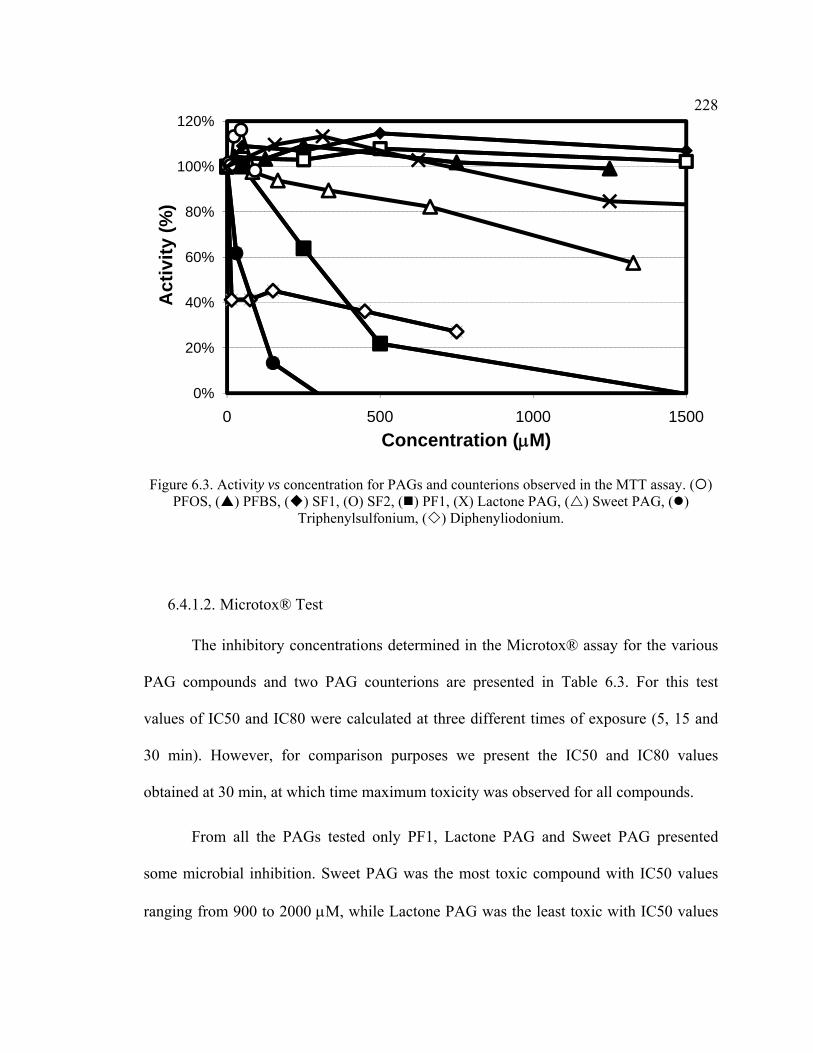
228
Figure 6.3. Activity vs concentration for PAGs and counterions observed in the MTT assay. ( )
PFOS, ( ) PFBS, ( ) SF1, (O) SF2, ( ) PF1, (X) Lactone PAG, ( ) Sweet PAG, ( ) Triphenylsulfonium, ( ) Diphenyliodonium.
6.4.1.2. Microtox® Test
The inhibitory concentrations determined in the Microtox® assay for the various
PAG compounds and two PAG counterions are presented in Table 6.3. For this test
values of IC50 and IC80 were calculated at three different times of exposure (5, 15 and
30 min). However, for comparison purposes we present the IC50 and IC80 values
obtained at 30 min, at which time maximum toxicity was observed for all compounds.
From all the PAGs tested only PF1, Lactone PAG and Sweet PAG presented
some microbial inhibition. Sweet PAG was the most toxic compound with IC50 values
ranging from 900 to 2000 μM, while Lactone PAG was the least toxic with IC50 values
0%
20%
40%
60%
80%
100%
120%
0 500 1000 1500
Act
ivity
(%)
Concentration (μM)
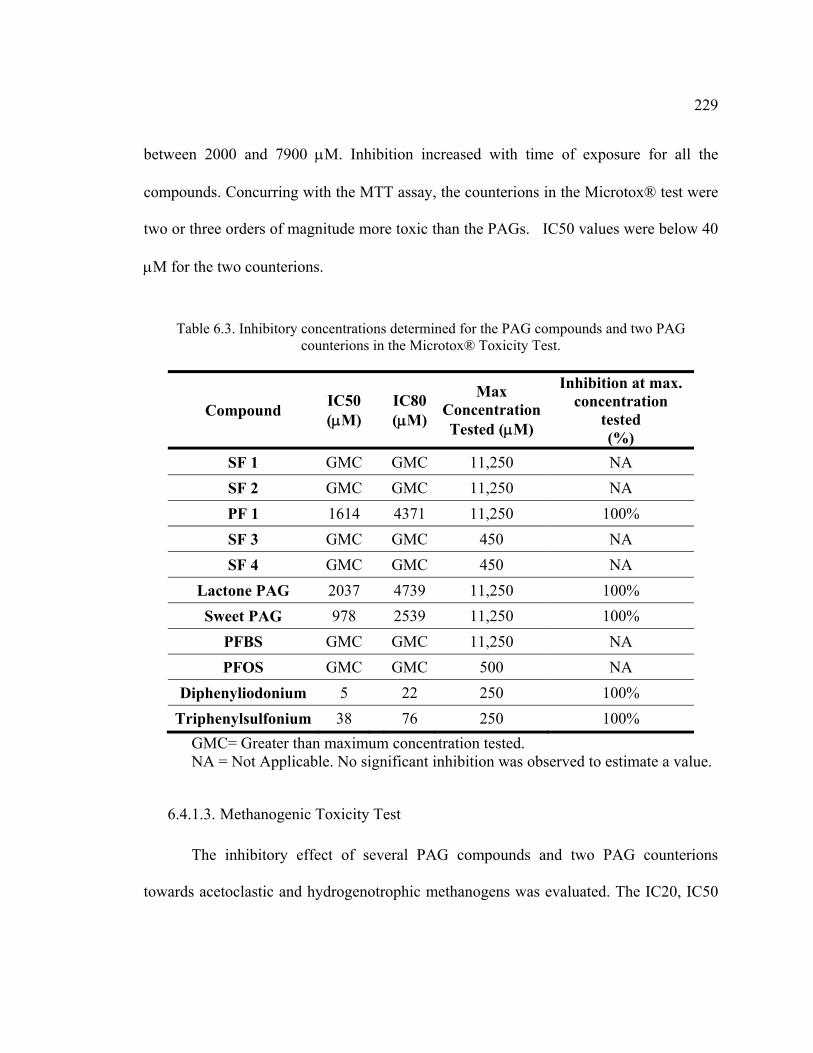
229
between 2000 and 7900 μM. Inhibition increased with time of exposure for all the
compounds. Concurring with the MTT assay, the counterions in the Microtox® test were
two or three orders of magnitude more toxic than the PAGs. IC50 values were below 40
μM for the two counterions.
Table 6.3. Inhibitory concentrations determined for the PAG compounds and two PAG
counterions in the Microtox® Toxicity Test.
Compound IC50 (μM)
IC80 (μM)
Max ConcentrationTested (μM)
Inhibition at max. concentration
tested (%)
SF 1 GMC GMC 11,250 NA SF 2 GMC GMC 11,250 NA PF 1 1614 4371 11,250 100% SF 3 GMC GMC 450 NA SF 4 GMC GMC 450 NA
Lactone PAG 2037 4739 11,250 100% Sweet PAG 978 2539 11,250 100%
PFBS GMC GMC 11,250 NA PFOS GMC GMC 500 NA
Diphenyliodonium 5 22 250 100% Triphenylsulfonium 38 76 250 100%
GMC= Greater than maximum concentration tested. NA = Not Applicable. No significant inhibition was observed to estimate a value.
6.4.1.3. Methanogenic Toxicity Test
The inhibitory effect of several PAG compounds and two PAG counterions
towards acetoclastic and hydrogenotrophic methanogens was evaluated. The IC20, IC50
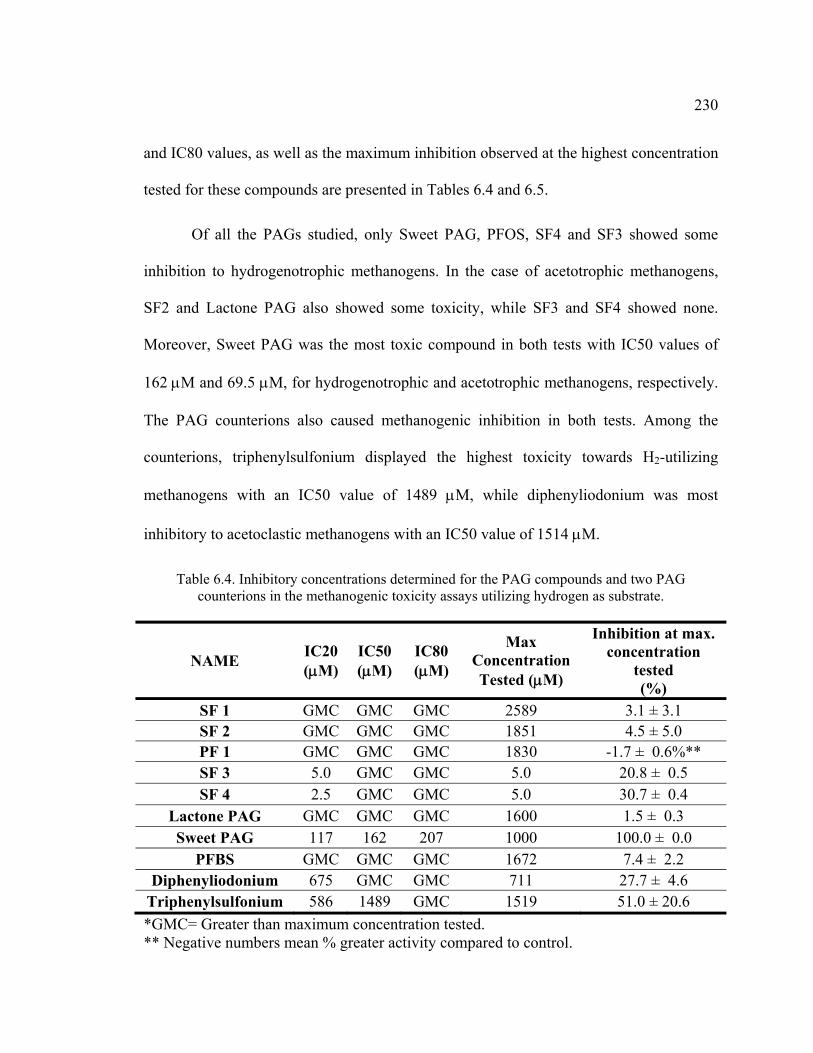
230
and IC80 values, as well as the maximum inhibition observed at the highest concentration
tested for these compounds are presented in Tables 6.4 and 6.5.
Of all the PAGs studied, only Sweet PAG, PFOS, SF4 and SF3 showed some
inhibition to hydrogenotrophic methanogens. In the case of acetotrophic methanogens,
SF2 and Lactone PAG also showed some toxicity, while SF3 and SF4 showed none.
Moreover, Sweet PAG was the most toxic compound in both tests with IC50 values of
162 μM and 69.5 μM, for hydrogenotrophic and acetotrophic methanogens, respectively.
The PAG counterions also caused methanogenic inhibition in both tests. Among the
counterions, triphenylsulfonium displayed the highest toxicity towards H2-utilizing
methanogens with an IC50 value of 1489 μM, while diphenyliodonium was most
inhibitory to acetoclastic methanogens with an IC50 value of 1514 μM.
Table 6.4. Inhibitory concentrations determined for the PAG compounds and two PAG counterions in the methanogenic toxicity assays utilizing hydrogen as substrate.
NAME IC20 (μM)
IC50 (μM)
IC80 (μM)
Max Concentration Tested (μM)
Inhibition at max. concentration
tested (%)
SF 1 GMC GMC GMC 2589 3.1 ± 3.1 SF 2 GMC GMC GMC 1851 4.5 ± 5.0 PF 1 GMC GMC GMC 1830 -1.7 ± 0.6%** SF 3 5.0 GMC GMC 5.0 20.8 ± 0.5 SF 4 2.5 GMC GMC 5.0 30.7 ± 0.4
Lactone PAG GMC GMC GMC 1600 1.5 ± 0.3 Sweet PAG 117 162 207 1000 100.0 ± 0.0
PFBS GMC GMC GMC 1672 7.4 ± 2.2 Diphenyliodonium 675 GMC GMC 711 27.7 ± 4.6
Triphenylsulfonium 586 1489 GMC 1519 51.0 ± 20.6 *GMC= Greater than maximum concentration tested. ** Negative numbers mean % greater activity compared to control.
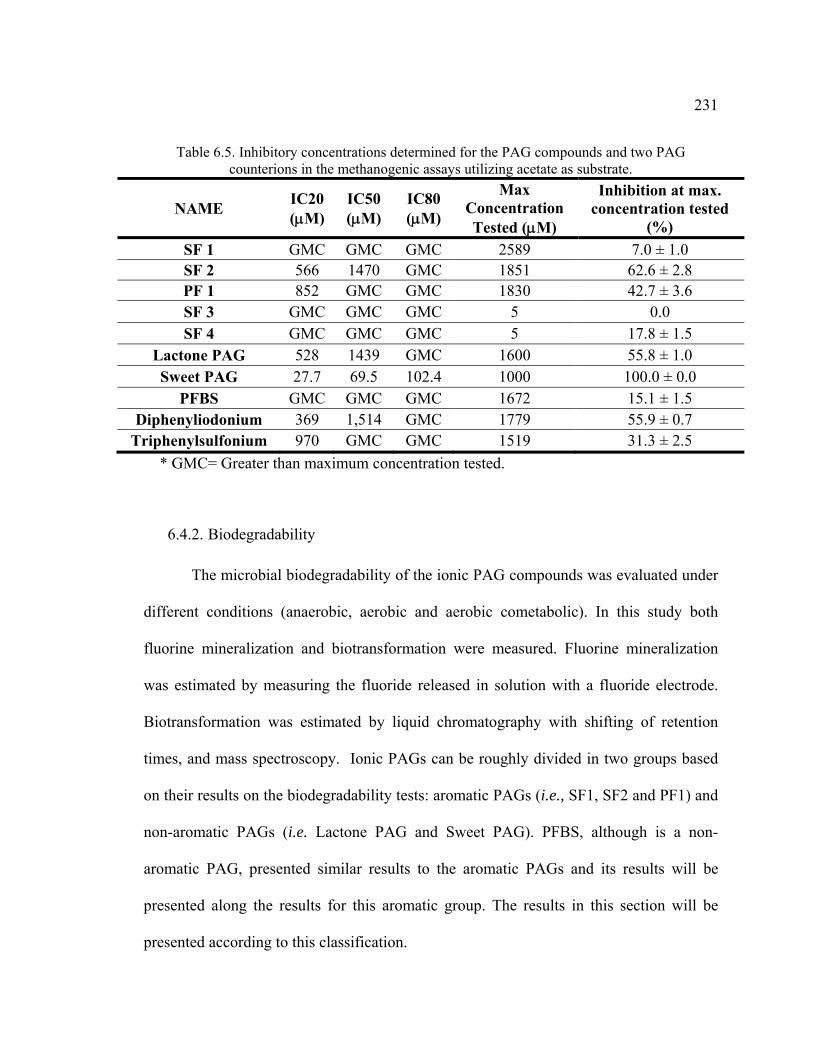
231
Table 6.5. Inhibitory concentrations determined for the PAG compounds and two PAG counterions in the methanogenic assays utilizing acetate as substrate.
NAME IC20 (μM)
IC50 (μM)
IC80 (μM)
Max Concentration Tested (μM)
Inhibition at max. concentration tested
(%) SF 1 GMC GMC GMC 2589 7.0 ± 1.0 SF 2 566 1470 GMC 1851 62.6 ± 2.8 PF 1 852 GMC GMC 1830 42.7 ± 3.6 SF 3 GMC GMC GMC 5 0.0 SF 4 GMC GMC GMC 5 17.8 ± 1.5
Lactone PAG 528 1439 GMC 1600 55.8 ± 1.0 Sweet PAG 27.7 69.5 102.4 1000 100.0 ± 0.0
PFBS GMC GMC GMC 1672 15.1 ± 1.5 Diphenyliodonium 369 1,514 GMC 1779 55.9 ± 0.7
Triphenylsulfonium 970 GMC GMC 1519 31.3 ± 2.5 * GMC= Greater than maximum concentration tested.
6.4.2. Biodegradability
The microbial biodegradability of the ionic PAG compounds was evaluated under
different conditions (anaerobic, aerobic and aerobic cometabolic). In this study both
fluorine mineralization and biotransformation were measured. Fluorine mineralization
was estimated by measuring the fluoride released in solution with a fluoride electrode.
Biotransformation was estimated by liquid chromatography with shifting of retention
times, and mass spectroscopy. Ionic PAGs can be roughly divided in two groups based
on their results on the biodegradability tests: aromatic PAGs (i.e., SF1, SF2 and PF1) and
non-aromatic PAGs (i.e. Lactone PAG and Sweet PAG). PFBS, although is a non-
aromatic PAG, presented similar results to the aromatic PAGs and its results will be
presented along the results for this aromatic group. The results in this section will be
presented according to this classification.

232
The fluoride release and compound removal determined in biodegradation assays
with the aromatic PAG compounds (i.e., SF1, SF2 and PF1), as well as to PFBS are
shown in Tables 6.6 and 6.7, respectively. Under anaerobic conditions, only SF2 showed
complete biotransformation, with 100% of the compound removed after 14 days. This
biotransformation occurred via the reduction of the nitro group to an amino group. This
was observed by shifting of retention times during chromatographic studies, as well as,
with mass spectroscopy analysis. These results are similar to the results obtained with
chemical reduction by ZVI (section 6.4.3.2). This reduction was also observed in the
killed sludge control, although it was not observed in the medium only control. In the
biodegradation experiment, fluoride release was only detected in anaerobic incubations
with SF2 (9.2% of the initial F after 501 days), while no release was observed in any of
the controls. In contrast with the results of SF2 anaerobic bioassays, no significant
biotransformation was observed for any of the aromatic PAGs in aerobic or cometabolic
assays, after 369 and 565 days of incubation, respectively. Moreover, a low fluoride
release (2.2-2.6% after 565 days) was only detected for SF1 and PF1 in aerobic
cometabolic assays (Table 6.6). Although fluoride was released, chromatographic studies
did not show significant decrease of SF1 or PF1 concentrations.
The fluoride release and compound removal determined in biodegradation assays
with the Lactone PAG and Sweet PAG are also shown in Tables 6.6 and 6.7,
respectively. Experiments showed a rapid degradation of Lactone PAG and Sweet PAG
under aerobic conditions (Figures 6.4 and 6.8). Complete biodegradation of both
compounds was observed in 15 days. Abiotic and autoclaved controls for Lactone PAG

233
did not present PAG removal in this time frame. Fluoride measurements showed fluoride
release to up to 9.9% for Lactone PAG after 99.1 days (Figure 6.6). Aerobic, as well as
cometabolic, treatment for Lactone PAG presented an early high rate of fluoride released,
which kept constant until day 15. After this point the rate started decreasing until it
almost completely stopped after day 40. Although autoclaved treatment for Lactone PAG
did not present fluoride release at the start up of the experiment, it did after day 15, with
an increasing rate up to day 40 after which the rate decreased. This may indicate growth
of cells which were not killed after autoclaving, or contamination of samples which
introduced microorganisms to the experiments, although it seems that the first option was
most likely.
Sweet PAG was completely removed in the biotic treatment after 7 days. On the
other hand, it was also found to be removed in autoclaved and abiotic controls during the
first 15 days; although during the first 7 days there was not much change yet compared to
the biotic treatment (Figure 6.8). Fluoride measurements showed fluoride release to up to
17.5% for Sweet PAG after 75.6 days (Figures 6.10). Fluoride release was only observed
in complete treatments under aerobic conditions, while no fluoride released was observed
in the controls. Measurements up to day 75.6 showed a constant rate of fluoride released.
Uptake accounting for oxygen consumption demonstrated that there was some
PAG degradation linked to oxygen, with up to 18.9% consumption of the original COD
for Lactone PAG, and 13.7% for Sweet PAG (Table 6.8). Calculations of the COD
consumed were done by subtracting the endogenous O2 consumption measured for a
control lacking the PAG from the O2 consumed determined in the treatment spiked with
234
the target compound. The difference was then divided by the original COD supplied to
the treatment in the form of PAG (Figures 6.5 and 6.9).
Figures 6.11 to 6.13 show the chromatograms obtained at the end of the
experiment of Lactone PAG degradation (98 days). Figure 6.11 shows the abiotic control,
on this experiment Lactone PAG is observed along with a non-identified chemical, which
is a probable Lactone PAG byproduct formed by Lactone PAG chemical degradation.
Figures 6.12 and 6.13 show the results obtained for the biotic and autoclaved sets. On
these figures it is clearly observed that in the autoclaved treatment there is a higher
variety of byproducts, while in the biotic treatment there are only two degradation
byproducts. A chromatogram for freshly prepared Sweet PAG can be observed in Figure
6.14, while chromatograms obtained for the different treatments, after 77 days of
treatment, can be observed in Figures 6.15 and 6.16. Chromatograms obtained for abiotic
and autoclaved treatments presented the same results (Figure 6.15). It can be observed
that a new peak, different from that of Sweet PAG, appeared for both cases. Biotic
treatments also had a degradation peak, which was unique because it was different from
those observed for the control and autoclaved treatments (Figure 6.16). Table 6.9 shows
the fragments detected by MS/MS during the same studies for both Lactone PAG and
Sweet PAG, after 20 and 30 days of treatment respectively.
Under anaerobic conditions Lactone PAG did not present any observable
degradation after 99 days of incubation (Figure 6.7). Methane production or fluoride
release was not observed either (data not shown). On the other hand, 100% Sweet PAG
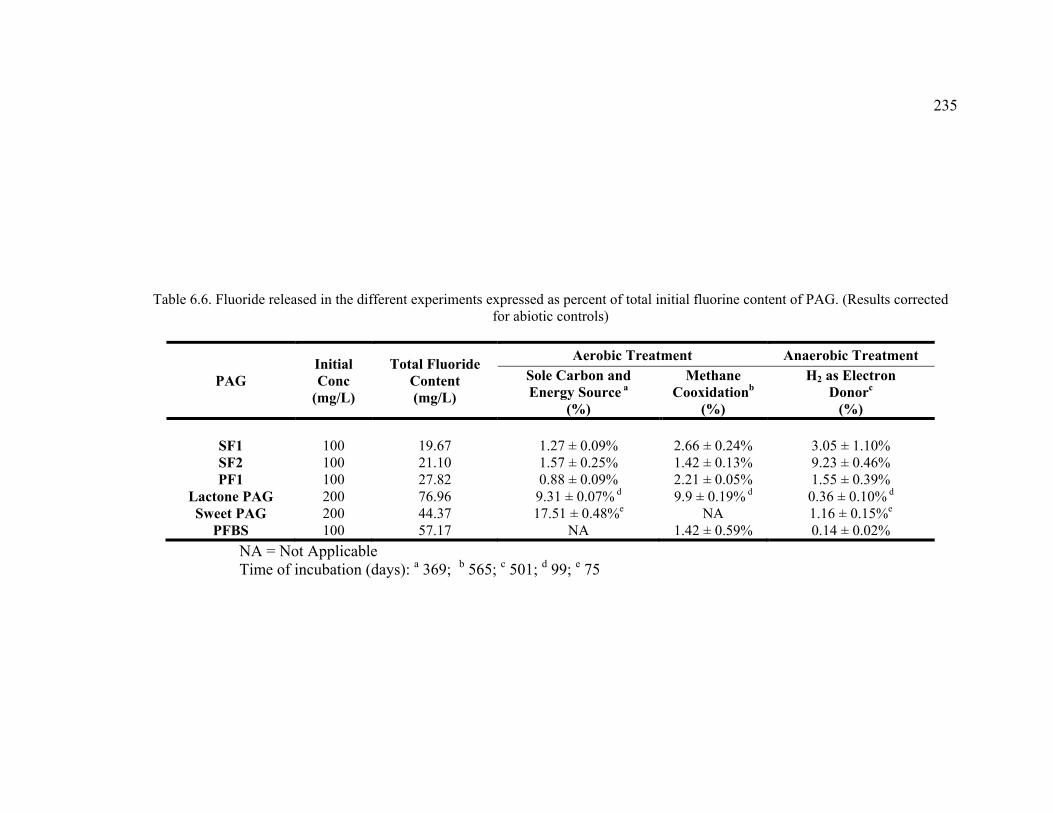
235
Table 6.6. Fluoride released in the different experiments expressed as percent of total initial fluorine content of PAG. (Results corrected for abiotic controls)
PAG Initial Conc
(mg/L)
Total Fluoride Content (mg/L)
Aerobic Treatment Anaerobic Treatment Sole Carbon and Energy Source a
(%)
Methane Cooxidationb
(%)
H2 as Electron Donorc
(%)
SF1
100
19.67
1.27 ± 0.09%
2.66 ± 0.24%
3.05 ± 1.10% SF2 100 21.10 1.57 ± 0.25% 1.42 ± 0.13% 9.23 ± 0.46% PF1 100 27.82 0.88 ± 0.09% 2.21 ± 0.05% 1.55 ± 0.39%
Lactone PAG 200 76.96 9.31 ± 0.07% d 9.9 ± 0.19% d 0.36 ± 0.10% d Sweet PAG 200 44.37 17.51 ± 0.48%e NA 1.16 ± 0.15%e
PFBS 100 57.17 NA 1.42 ± 0.59% 0.14 ± 0.02% NA = Not Applicable Time of incubation (days): a 369; b 565; c 501; d 99; e 75
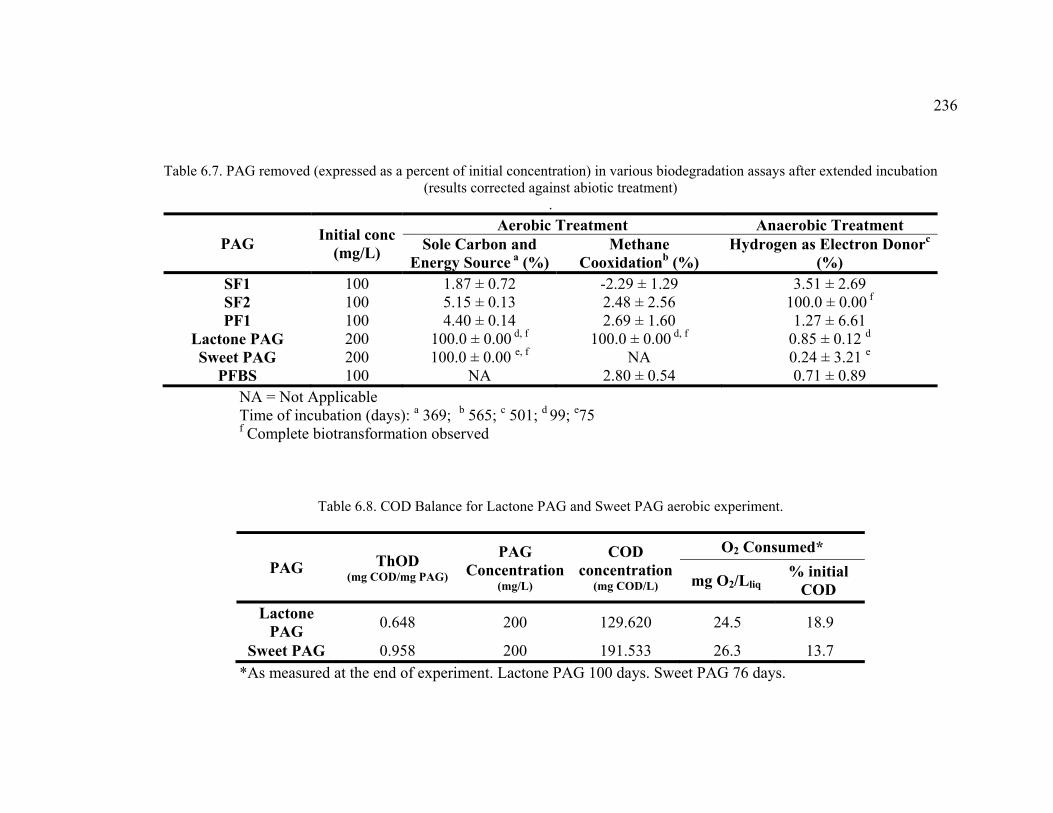
236
Table 6.7. PAG removed (expressed as a percent of initial concentration) in various biodegradation assays after extended incubation
(results corrected against abiotic treatment) .
PAG Initial conc (mg/L)
Aerobic Treatment Anaerobic Treatment Sole Carbon and
Energy Source a (%)Methane
Cooxidationb (%) Hydrogen as Electron Donorc
(%) SF1 100 1.87 ± 0.72 -2.29 ± 1.29 3.51 ± 2.69 SF2 100 5.15 ± 0.13 2.48 ± 2.56 100.0 ± 0.00 f PF1 100 4.40 ± 0.14 2.69 ± 1.60 1.27 ± 6.61
Lactone PAG 200 100.0 ± 0.00 d, f 100.0 ± 0.00 d, f 0.85 ± 0.12 d Sweet PAG 200 100.0 ± 0.00 e, f NA 0.24 ± 3.21 e
PFBS 100 NA 2.80 ± 0.54 0.71 ± 0.89 NA = Not Applicable
Time of incubation (days): a 369; b 565; c 501; d 99; e75 f Complete biotransformation observed
Table 6.8. COD Balance for Lactone PAG and Sweet PAG aerobic experiment.
PAG ThOD (mg COD/mg PAG)
PAG Concentration
(mg/L)
COD concentration
(mg COD/L)
O2 Consumed*
mg O2/Lliq % initial COD
Lactone PAG 0.648 200 129.620 24.5 18.9
Sweet PAG 0.958 200 191.533 26.3 13.7 *As measured at the end of experiment. Lactone PAG 100 days. Sweet PAG 76 days.
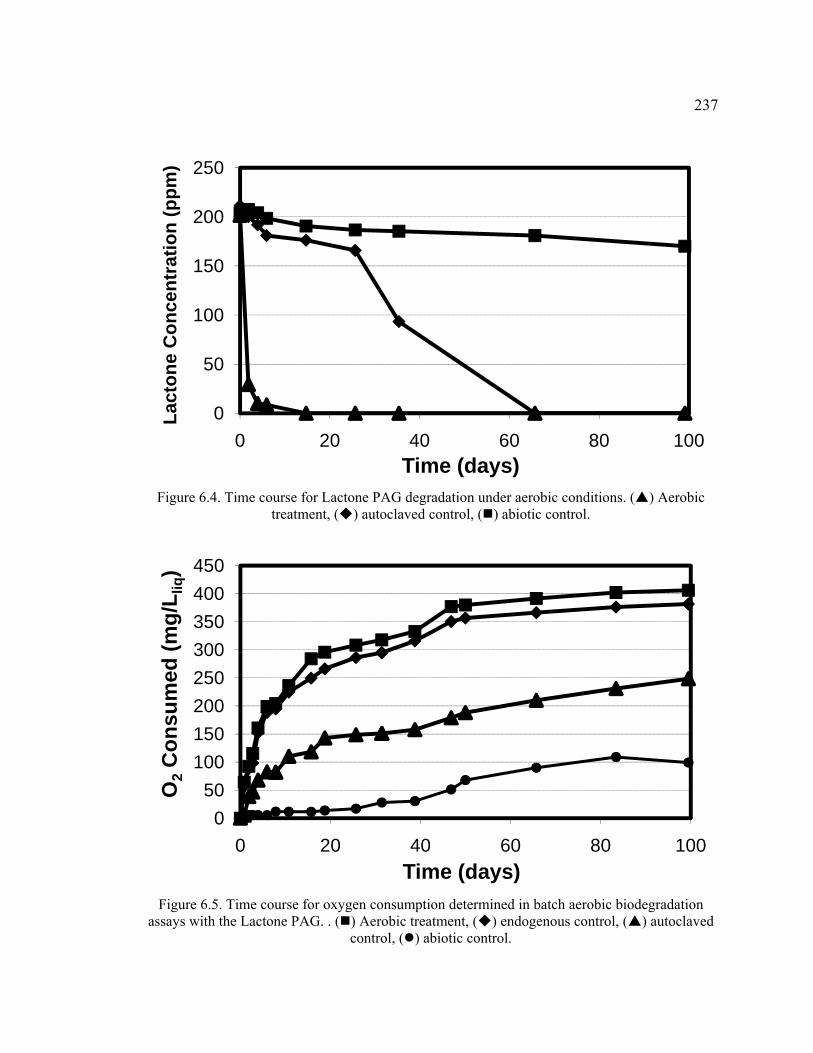
237
Figure 6.4. Time course for Lactone PAG degradation under aerobic conditions. ( ) Aerobic
treatment, ( ) autoclaved control, ( ) abiotic control.
Figure 6.5. Time course for oxygen consumption determined in batch aerobic biodegradation
assays with the Lactone PAG. . ( ) Aerobic treatment, ( ) endogenous control, ( ) autoclaved control, ( ) abiotic control.
0
50
100
150
200
250
0 20 40 60 80 100
Lact
one
Con
cent
ratio
n (p
pm)
Time (days)
050
100150200250300350400450
0 20 40 60 80 100
O2
Con
sum
ed (m
g/L l
iq)
Time (days)

238
Figure 6.6 Time course for fluoride released (as percentage of total fluoride) determined in batch aerobic biodegradation assays with Lactone PAG. ( ) Aerobic treatment, ( ) autoclaved control,
( ) abiotic control.
Figure 6.7. Time course for Lactone PAG degradation under anaerobic conditions. ( ) Aerobic
treatment, ( ) autoclaved control, ( ) abiotic control.
0.0%
2.0%
4.0%
6.0%
8.0%
10.0%
12.0%
0 20 40 60 80 100
% o
f flu
orid
e R
elea
sed
Time (days)
0
50
100
150
200
250
0 10 20 30 40
Lact
one
Con
cent
ratio
n(p
pm)
Time (days)
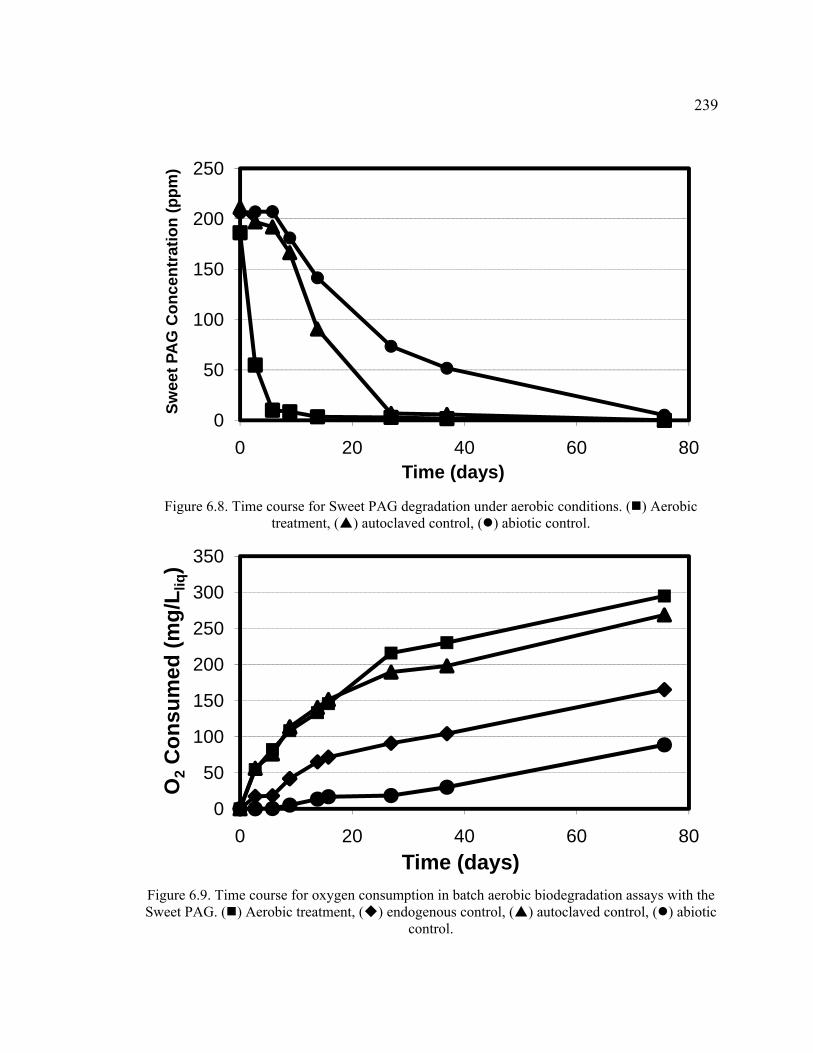
239
Figure 6.8. Time course for Sweet PAG degradation under aerobic conditions. ( ) Aerobic
treatment, ( ) autoclaved control, ( ) abiotic control.
Figure 6.9. Time course for oxygen consumption in batch aerobic biodegradation assays with the Sweet PAG. ( ) Aerobic treatment, ( ) endogenous control, ( ) autoclaved control, ( ) abiotic
control.
0
50
100
150
200
250
0 20 40 60 80
Swee
t PA
G C
once
ntra
tion
(ppm
)
Time (days)
0
50
100
150
200
250
300
350
0 20 40 60 80
O2
Con
sum
ed (m
g/L l
iq)
Time (days)

240
Figure 6.10. Time course for fluoride released (as percentage of total fluoride) determined in
batch aerobic biodegradation assays with the Sweet PAG. ( ) Aerobic treatment, ( ) autoclaved control, ( ) abiotic control.
Figure 6.11. Ion chromatogram obtained for abiotic control in Lactone PAG aerobic degradation
assay (day 98).
02468
101214161820
0 20 40 60 80
% o
f flu
orid
e re
leas
ed
Time (days)
Lactone PAG
Probable Degradation Peak from biological
contamination

241
Figure 6.12. Ion chromatogram obtained for autoclaved control in Lactone PAG aerobic degradation assay (day 98).
Figure 6.13. Ion chromatogram obtained for aerobic treatment in Lactone PAG degradation assay (day 98).
Lactone PAG Degradation
Lactone PAG Degradation
Products
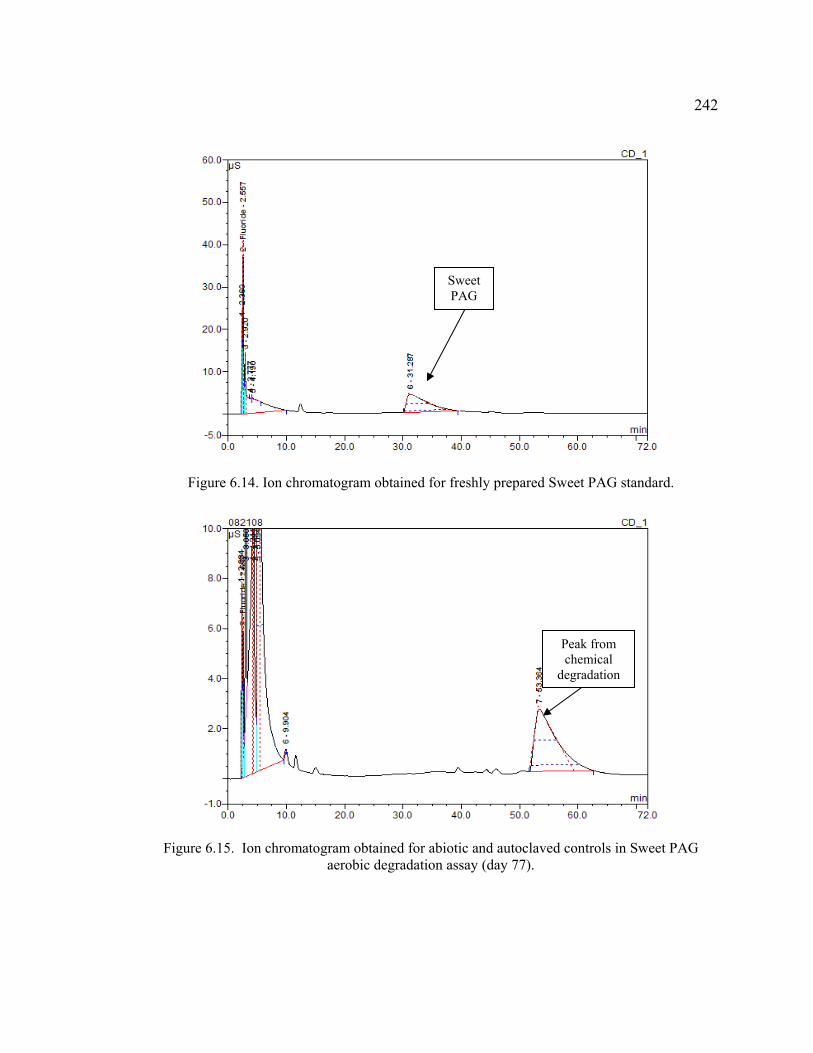
242
Figure 6.14. Ion chromatogram obtained for freshly prepared Sweet PAG standard.
Figure 6.15. Ion chromatogram obtained for abiotic and autoclaved controls in Sweet PAG aerobic degradation assay (day 77).
Sweet PAG
Peak from chemical
degradation

243
Figure 6.16. Ion chromatogram obtained for aerobic treatment in Sweet PAG aerobic degradation assay (day 77).
Table 6.9. MS/MS analysis on different treatments for Lactone PAG and Sweet PAG, negative mode. Numbers represent m/z (mass over charge) ratio of fragments observed.
Treatment Lactone PAG* Sweet PAG**
Days of treatment 20 30 PAG only 395.1 685.1
Abiotic 395.1 685.1, 517.0 Autoclaved 395.2 390.9, 218.9, 177.1
Aerobic 197.9, 192.9 391.0, 218.8, 177.1 Cometabolic 197.8, 193.0 NA Anaerobic 395.1, 192.9 517.2
*Results after 20 days of treatment ** Results after 30 days of treatment NA = Not Applicable (no experiment performed for this condition)
New Biodegradation
Peak
244
removal was observed in anaerobic conditions although no significant fluoride released
was observed (data not shown).
6.4.3. Physical and Chemical Treatment
The removal of the new non-perfluorinated PAGs by three different physico-
chemical treatments, i.e., adsorption to granular activated carbon (GAC), reductive
treatment with zero-valent iron (ZVI), and chemical oxidation by Fenton’s reagents, was
examined. PFOS and PFBS were included in these studies as reference compounds.
6.4.3.1. Adsorption to Granular Activated Carbon
Batch experiments were set up to measure the capacity of GAC to adsorb the new
PAGs. Isotherms for all PAGs were determined (Figures 6.17 to 6.21) and the
experimental results were fitted to the Langmuir and Freundlich models (Table 6.10).
These results were then compared to results obtained for PFBS and PFOS elsewhere
(Ochoa-Herrera and Sierra-Alvarez 2008).
Comparison of the results obtained in this experiment show that from the PAGs
studied, Sweet PAG had the highest capacity for adsorption and also the most bonding
strength to activated carbon. For the PAGs presented in Table 6.10, only PFOS had a
higher adsorption capacity, although Sweet PAG still had a higher bonding strength to
activated carbon. All other PAGs studied in this experiment presented similar
characteristics, with PF1 presenting the most capacity for adsorption, and SF2 the highest
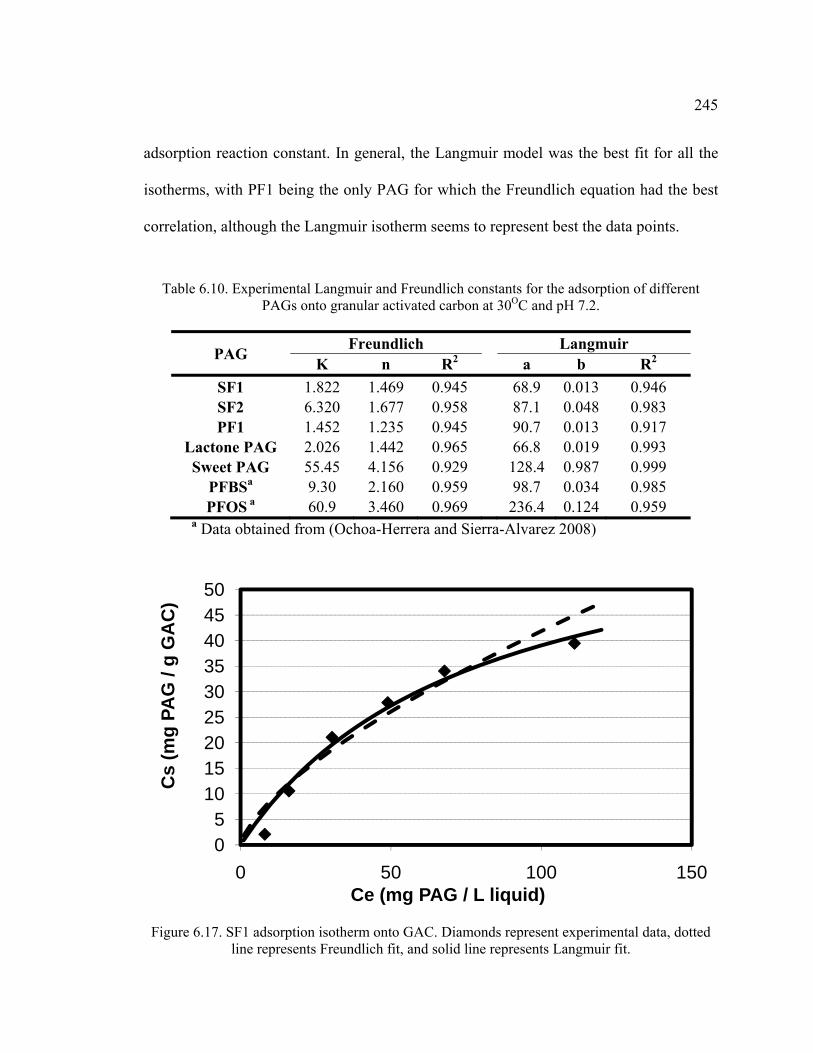
245
adsorption reaction constant. In general, the Langmuir model was the best fit for all the
isotherms, with PF1 being the only PAG for which the Freundlich equation had the best
correlation, although the Langmuir isotherm seems to represent best the data points.
Table 6.10. Experimental Langmuir and Freundlich constants for the adsorption of different
PAGs onto granular activated carbon at 30OC and pH 7.2.
PAG Freundlich Langmuir K n R2 a b R2
SF1 1.822 1.469 0.945 68.9 0.013 0.946 SF2 6.320 1.677 0.958 87.1 0.048 0.983 PF1 1.452 1.235 0.945 90.7 0.013 0.917
Lactone PAG 2.026 1.442 0.965 66.8 0.019 0.993 Sweet PAG 55.45 4.156 0.929 128.4 0.987 0.999
PFBSa 9.30 2.160 0.959 98.7 0.034 0.985 PFOS a 60.9 3.460 0.969 236.4 0.124 0.959
a Data obtained from (Ochoa-Herrera and Sierra-Alvarez 2008)
Figure 6.17. SF1 adsorption isotherm onto GAC. Diamonds represent experimental data, dotted
line represents Freundlich fit, and solid line represents Langmuir fit.
05
101520253035404550
0 50 100 150
Cs
(mg
PAG
/ g
GA
C)
Ce (mg PAG / L liquid)
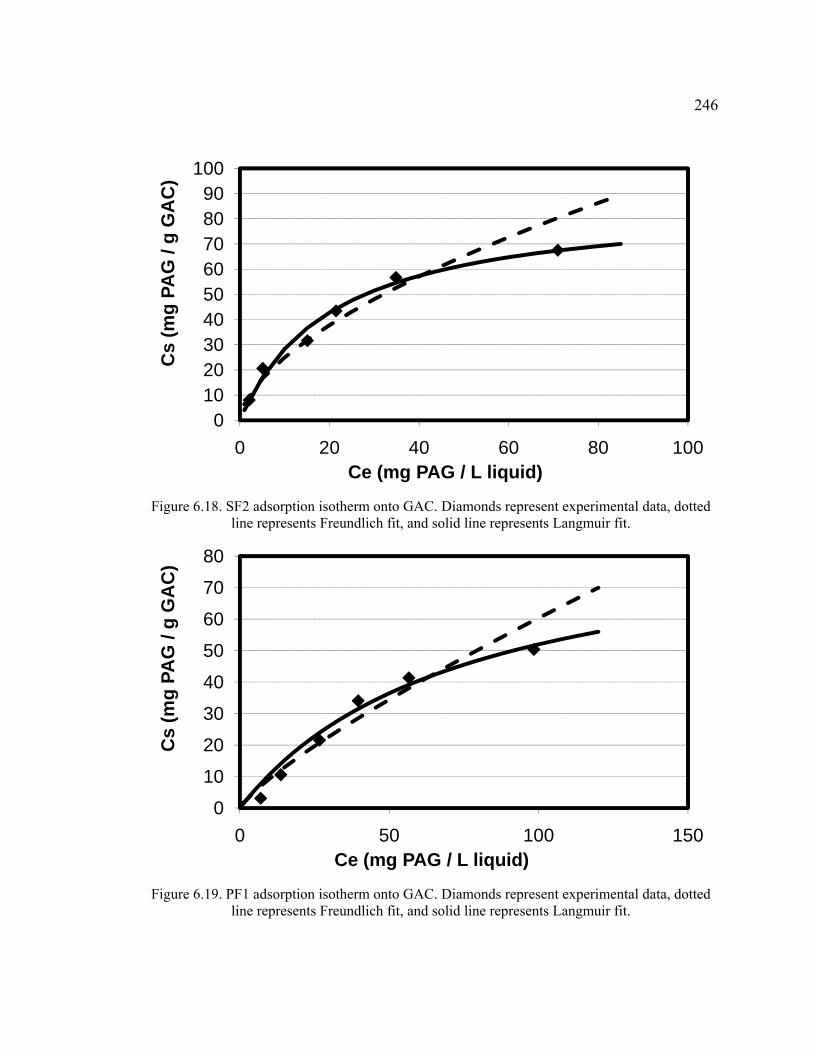
246
Figure 6.18. SF2 adsorption isotherm onto GAC. Diamonds represent experimental data, dotted
line represents Freundlich fit, and solid line represents Langmuir fit.
Figure 6.19. PF1 adsorption isotherm onto GAC. Diamonds represent experimental data, dotted
line represents Freundlich fit, and solid line represents Langmuir fit.
0102030405060708090
100
0 20 40 60 80 100
Cs
(mg
PAG
/ g
GA
C)
Ce (mg PAG / L liquid)
0
10
20
30
40
50
60
70
80
0 50 100 150
Cs
(mg
PAG
/ g
GA
C)
Ce (mg PAG / L liquid)

247
Figure 6.20. Lactone PAG adsorption isotherm onto GAC. Diamonds represent experimental
data, dotted line represents Freundlich fit, and solid line represents Langmuir fit.
Figure 6.21. Sweet PAG adsorption isotherm onto GAC. Diamonds represent experimental data,
dotted line represents Freundlich fit, and solid line represents Langmuir fit.
0
10
20
30
40
50
60
0 50 100 150
Cs
(mg
PAG
/ g
GA
C)
Ce (mg PAG / L liquid)
020406080
100120140160180
0 20 40 60 80 100
Cs
(mg
PAG
/ g
GA
C)
Ce (mg PAG / L liquid)

248
6.4.3.2. Chemical Reduction with ZVI
A batch experiment with ZVI and hydrogen gas was set up for all the PAGs
presented in this study. As part of the corrosion of the ZVI surface, hydrogen and
electron are produced. However, such corrosion and concomitant formation of oxide or
hydroxide layer inhibit further reaction. Hydrogen in the headspace avoids formation of
these oxides on the iron surface, improving the rate of reaction (Keum and Li 2004). A
summary of the results obtained is presented in Table 6.11. For almost all the PAGs, with
the exception of SF2, reduction with ZVI resulted in little or no compound degradation or
fluoride release. SF2 was completely transformed by reduction with ZVI in less than 1
day of treatment. In spite of the complete removal observed for SF2, only 2.8% of the
total fluorine was released as fluoride. Lower but significant removals of SF1 and PF1,
11.1 and 10.5%, respectively, were determined by reductive treatment after 72 hours.
After the same time period, the fluoride released observed for SF1 and PF1 was 2.0 and
7.1%, respectively.
Chemical transformation of SF2 was accompanied by a shift in the retention times
of the peaks detected at 265 nm in HPLC (Figure 6.22). Analysis of the different areas
observed in the HPLC showed a 1:1 relationship between the initial PAG and its product
(Figure 6.23). Further analysis by mass spectroscopy showed that the compound had the
same molecular weight as that of the corresponding compound but with an amino
substitution (Figures 6.24 to 6.26). This same result was observed for the biodegradation
of SF2 under anaerobic conditions.
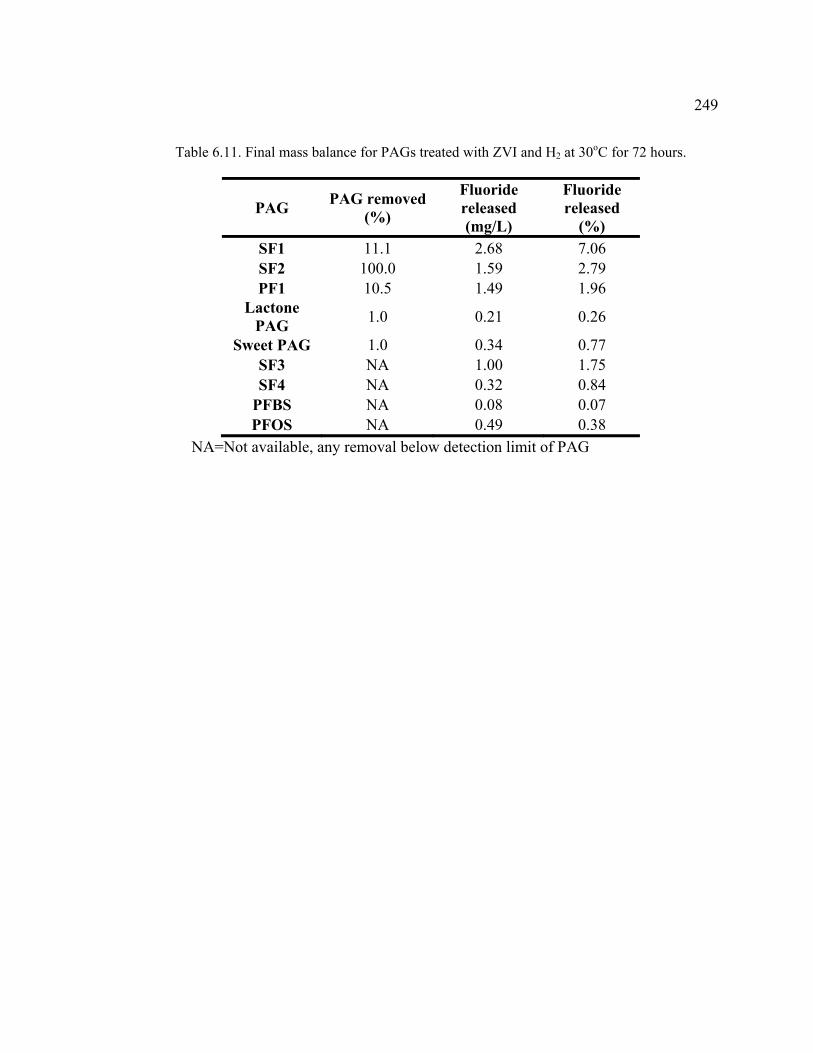
249
Table 6.11. Final mass balance for PAGs treated with ZVI and H2 at 30oC for 72 hours.
PAG PAG removed (%)
Fluoride released (mg/L)
Fluoride released
(%) SF1 11.1 2.68 7.06 SF2 100.0 1.59 2.79 PF1 10.5 1.49 1.96
Lactone PAG 1.0 0.21 0.26
Sweet PAG 1.0 0.34 0.77 SF3 NA 1.00 1.75 SF4 NA 0.32 0.84
PFBS NA 0.08 0.07 PFOS NA 0.49 0.38
NA=Not available, any removal below detection limit of PAG
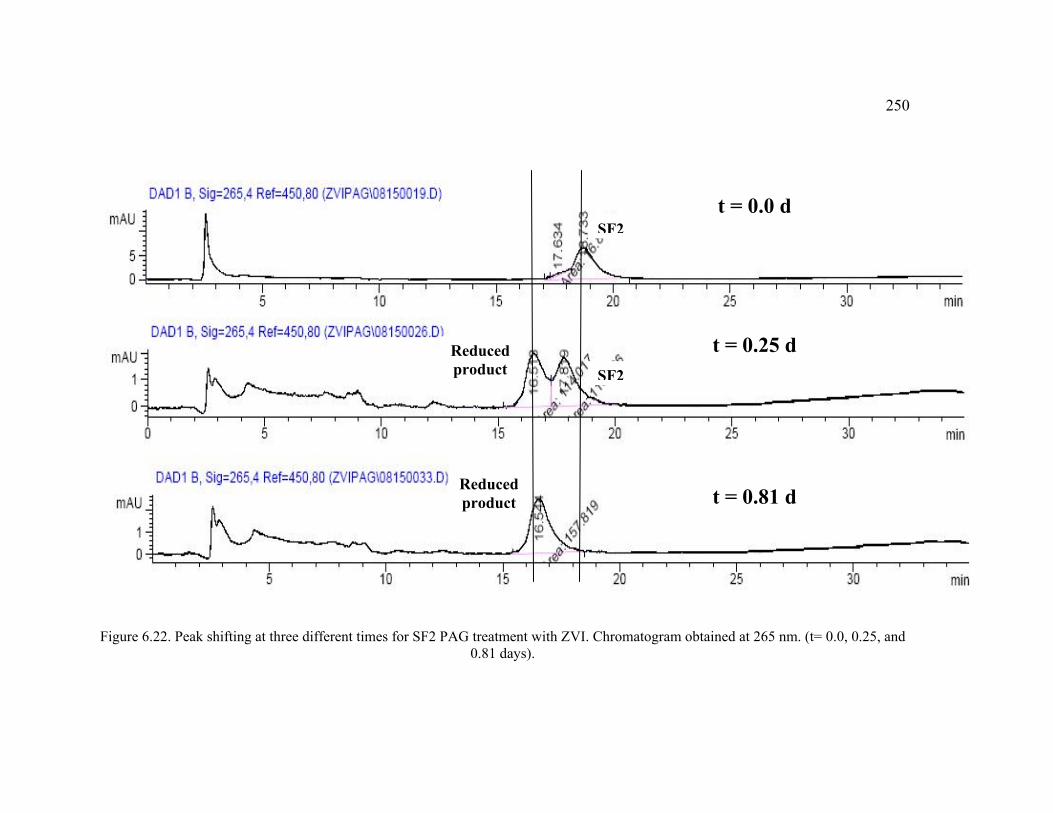
250
Figure 6.22. Peak shifting at three different times for SF2 PAG treatment with ZVI. Chromatogram obtained at 265 nm. (t= 0.0, 0.25, and 0.81 days).
t = 0.0 d
t = 0.25 d
t = 0.81 d
SF2
Reduced product SF2
Reduced product
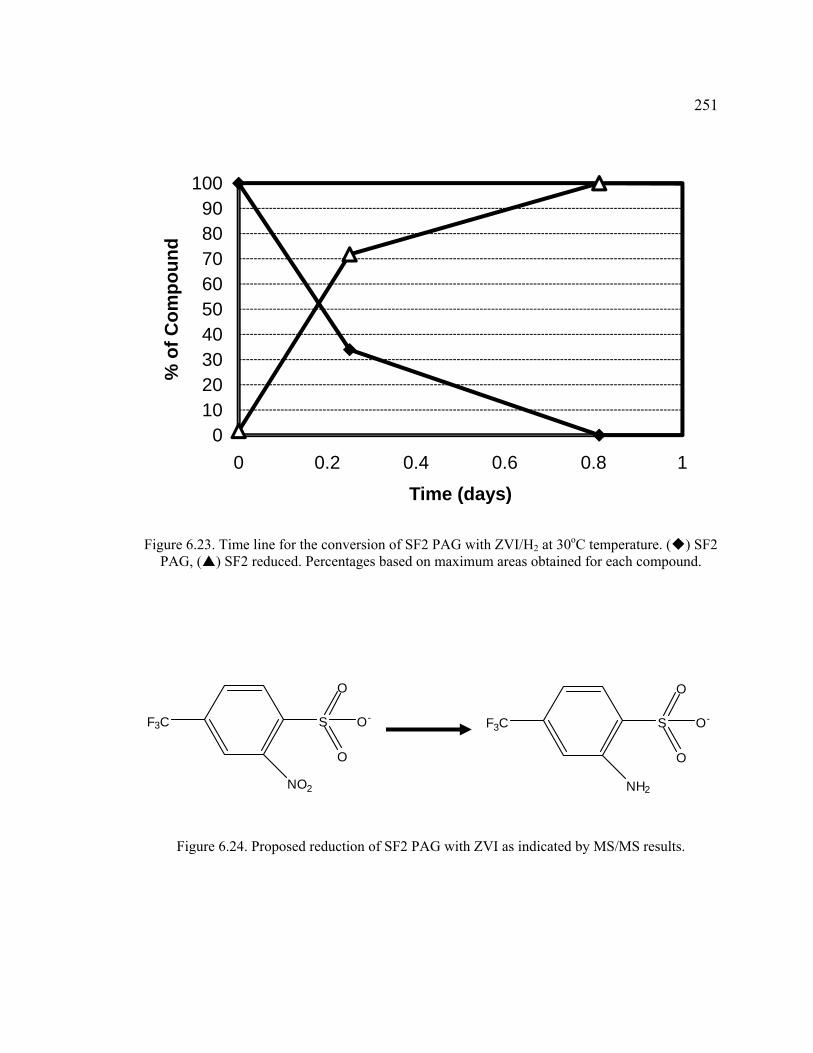
251
Figure 6.23. Time line for the conversion of SF2 PAG with ZVI/H2 at 30oC temperature. ( ) SF2 PAG, ( ) SF2 reduced. Percentages based on maximum areas obtained for each compound.
Figure 6.24. Proposed reduction of SF2 PAG with ZVI as indicated by MS/MS results.
0102030405060708090
100
0 0.2 0.4 0.6 0.8 1
% o
f Com
poun
d
Time (days)
NH2
SF3C
O
O
O-
NO2
SF3C
O
O
O-
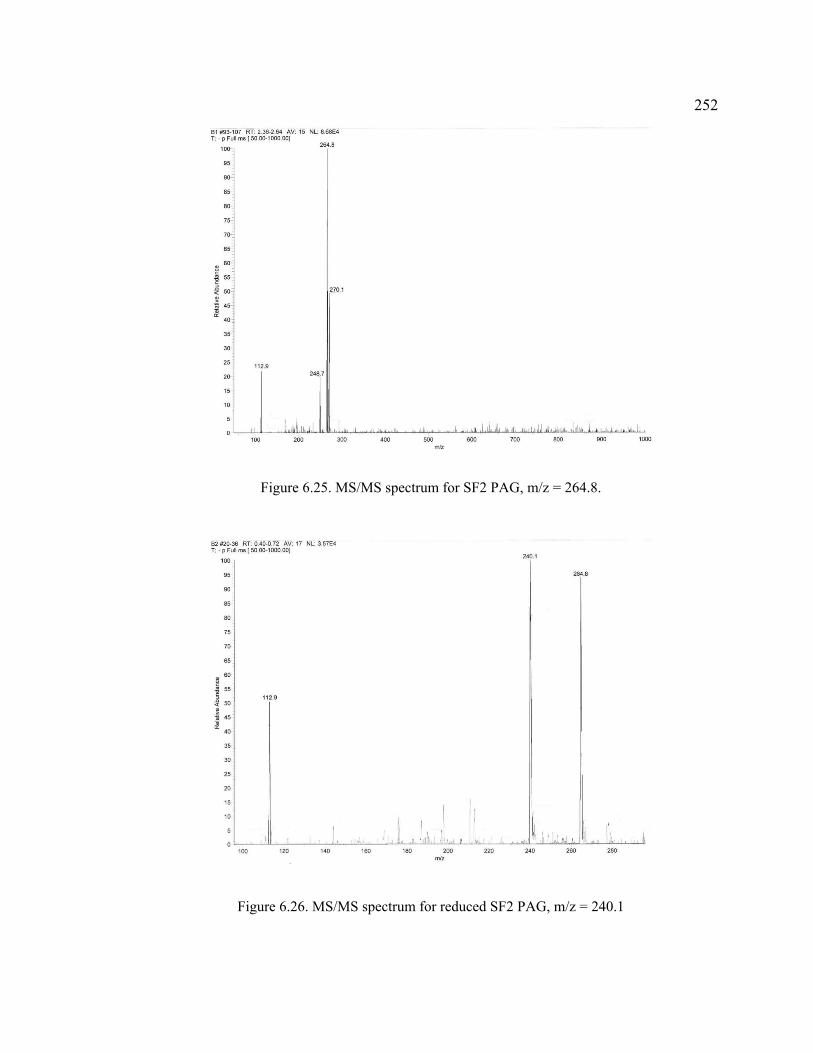
252
Figure 6.25. MS/MS spectrum for SF2 PAG, m/z = 264.8.
Figure 6.26. MS/MS spectrum for reduced SF2 PAG, m/z = 240.1

253
6.4.3.3. Chemical Reaction with Fenton’s Reagents
New non-perfluorinated PAGs, as well as, PFOS and PFBS, were treated with
Fenton’s reagent and the removal of PAG as well as fluoride released was measured
(Table 6.12). From the results it is obvious that Fenton’s reagent was the best treatment
for all PAGs, with the exception of PFOS and PFBS. All new ionic PAGs were
completely transformed after 15 min as shown in Figures 6.27 and 6.28, which present
the fluoride released as a percentage of the initial fluoride in the treatment, and PAG
concentration vs. time, respectively. In the case of SF1 complete fluorine mineralization
was also observed. PF1 was second in fluorine mineralization after SF1; with 41.9% of
the fluoride being released. Complete transformation was indicated by chromatography
and mass spectroscopy as well. No other compounds were detected by chromatography
after treatment with Fenton’s reagent.
Further analysis by mass spectroscopy provided information on the nature of the
degradation products released after treatment of PAGs. For the aromatic PAGs (i.e., SF1,
SF2, PF1), the Fenton’s reagent appeared to degrade the aromatic ring and, in the case of
SF1, complete fluorine mineralization was achieved. Figures 6.33, 6.34 and 6.35 present
the suggested degradation pathway for SF2, PF1, Lactone PAG and Sweet PAG,
according to the results observed by mass spectroscopy (Table 6.13). As shown in Figure
6.35, treatment of the Lactone PAG and Sweet PAG with the Fenton’s reagent appear to
lead to the same byproducts. All peaks observed on the spectrums that presented a higher
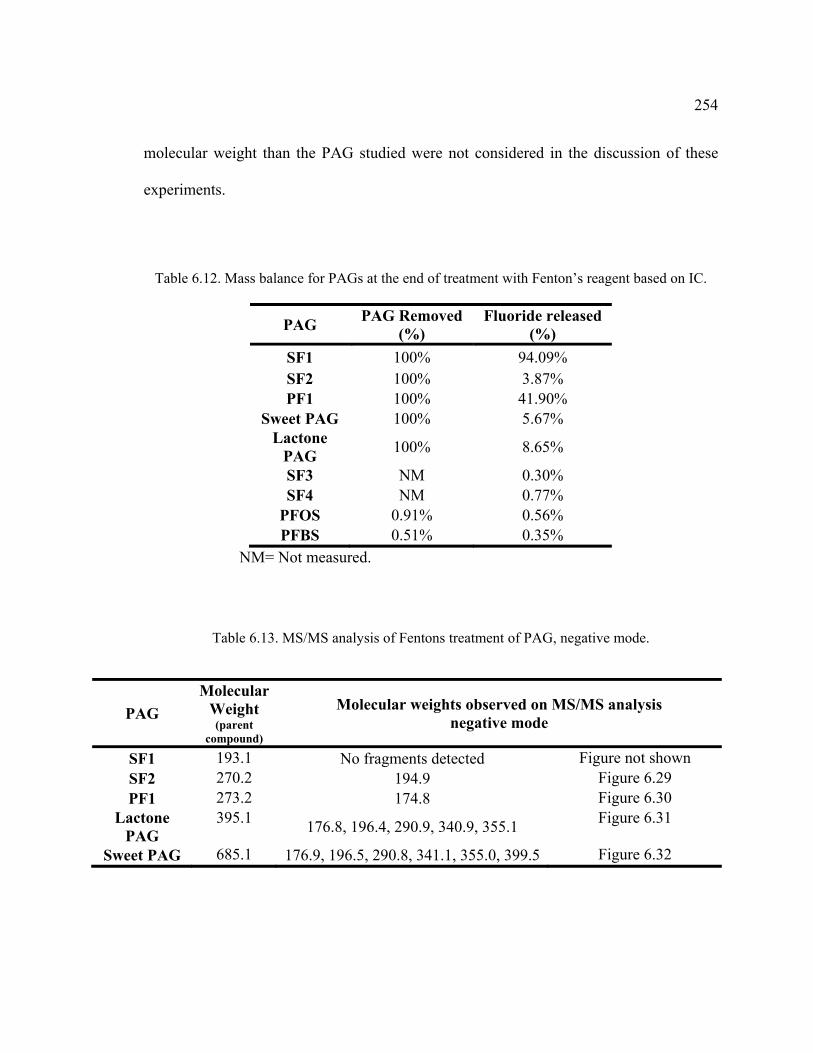
254
molecular weight than the PAG studied were not considered in the discussion of these
experiments.
Table 6.12. Mass balance for PAGs at the end of treatment with Fenton’s reagent based on IC.
PAG PAG Removed (%)
Fluoride released (%)
SF1 100% 94.09% SF2 100% 3.87% PF1 100% 41.90%
Sweet PAG 100% 5.67% Lactone
PAG 100% 8.65%
SF3 NM 0.30% SF4 NM 0.77%
PFOS 0.91% 0.56% PFBS 0.51% 0.35%
NM= Not measured.
Table 6.13. MS/MS analysis of Fentons treatment of PAG, negative mode.
PAG Molecular
Weight (parent
compound)
Molecular weights observed on MS/MS analysis negative mode
SF1 193.1 No fragments detected Figure not shown SF2 270.2 194.9 Figure 6.29 PF1 273.2 174.8 Figure 6.30
Lactone PAG
395.1 176.8, 196.4, 290.9, 340.9, 355.1 Figure 6.31
Sweet PAG 685.1 176.9, 196.5, 290.8, 341.1, 355.0, 399.5 Figure 6.32
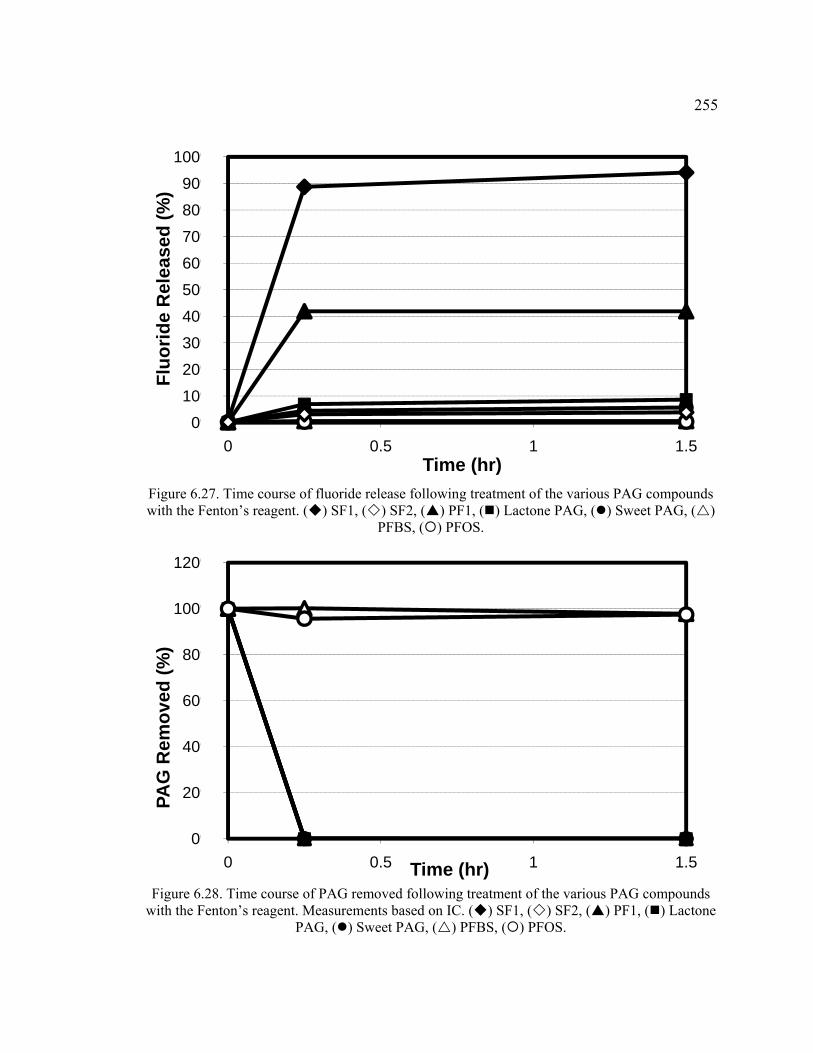
255
0%
10%
20%
30%
40%
50%
60%
70%
80%
90%
100%
0 0.5 1 1.5
Fluo
ride
Rel
ease
d (%
)
Time (hr)
0%
20%
40%
60%
80%
100%
120%
0 0.5 1 1.5
PAG
Rem
oved
(%)
Time (hr)
Figure 6.27. Time course of fluoride release following treatment of the various PAG compounds with the Fenton’s reagent. ( ) SF1, ( ) SF2, ( ) PF1, ( ) Lactone PAG, ( ) Sweet PAG, ( )
PFBS, ( ) PFOS.
Figure 6.28. Time course of PAG removed following treatment of the various PAG compounds with the Fenton’s reagent. Measurements based on IC. ( ) SF1, ( ) SF2, ( ) PF1, ( ) Lactone
PAG, ( ) Sweet PAG, ( ) PFBS, ( ) PFOS.
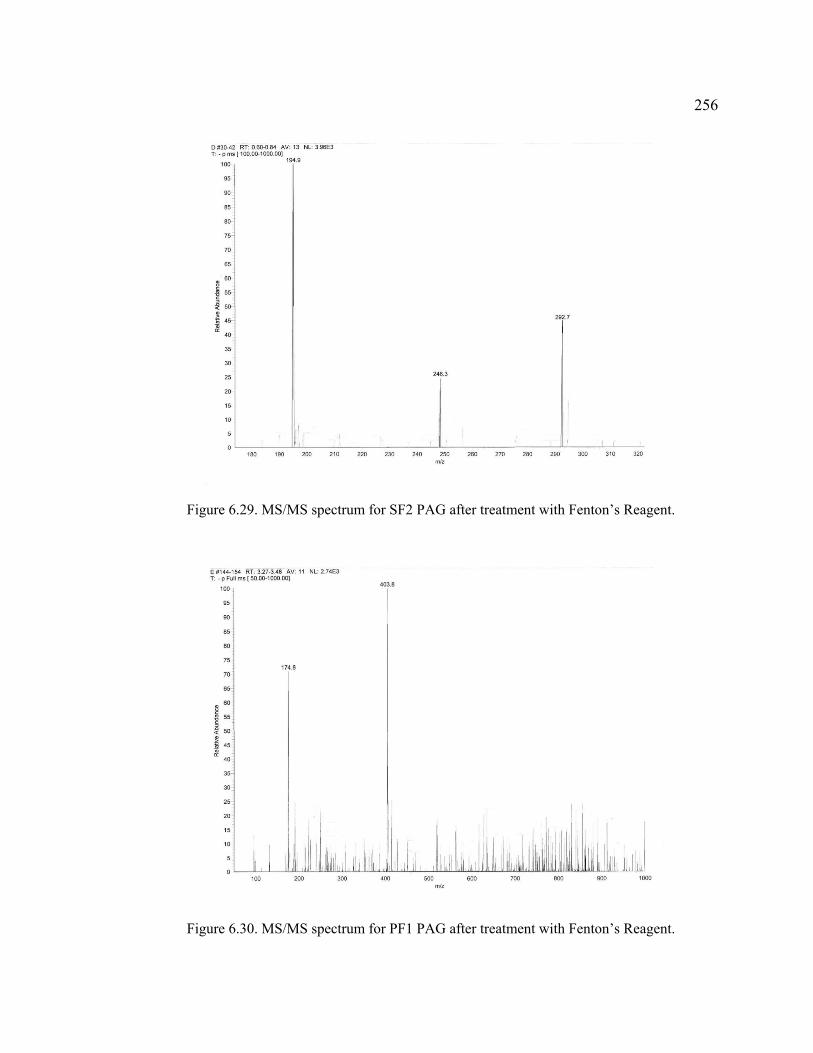
256
Figure 6.29. MS/MS spectrum for SF2 PAG after treatment with Fenton’s Reagent.
Figure 6.30. MS/MS spectrum for PF1 PAG after treatment with Fenton’s Reagent.
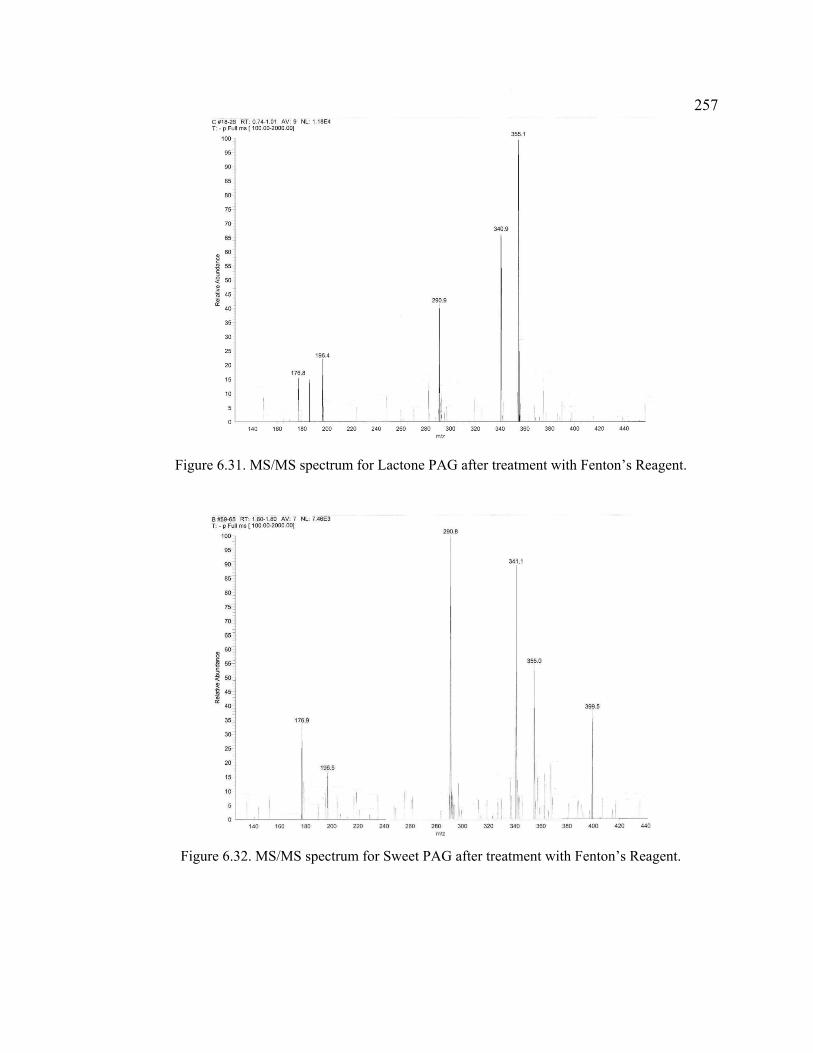
257
Figure 6.31. MS/MS spectrum for Lactone PAG after treatment with Fenton’s Reagent.
Figure 6.32. MS/MS spectrum for Sweet PAG after treatment with Fenton’s Reagent.

258
Figure 6.33. Suggested degradation pathways for PF1 treated with Fenton’s reagent according to results obtained by MS/MS.
Figure 6.34. Suggested degradation pathways for SF2 treated with Fenton’s reagent according to results obtained by MS/MS.
O
F
F
F
F
SO3-
F
F
SO3-
O
HO
PF1
O
NO2
SO3-
-O
NO2
SO3-F3C
SF2
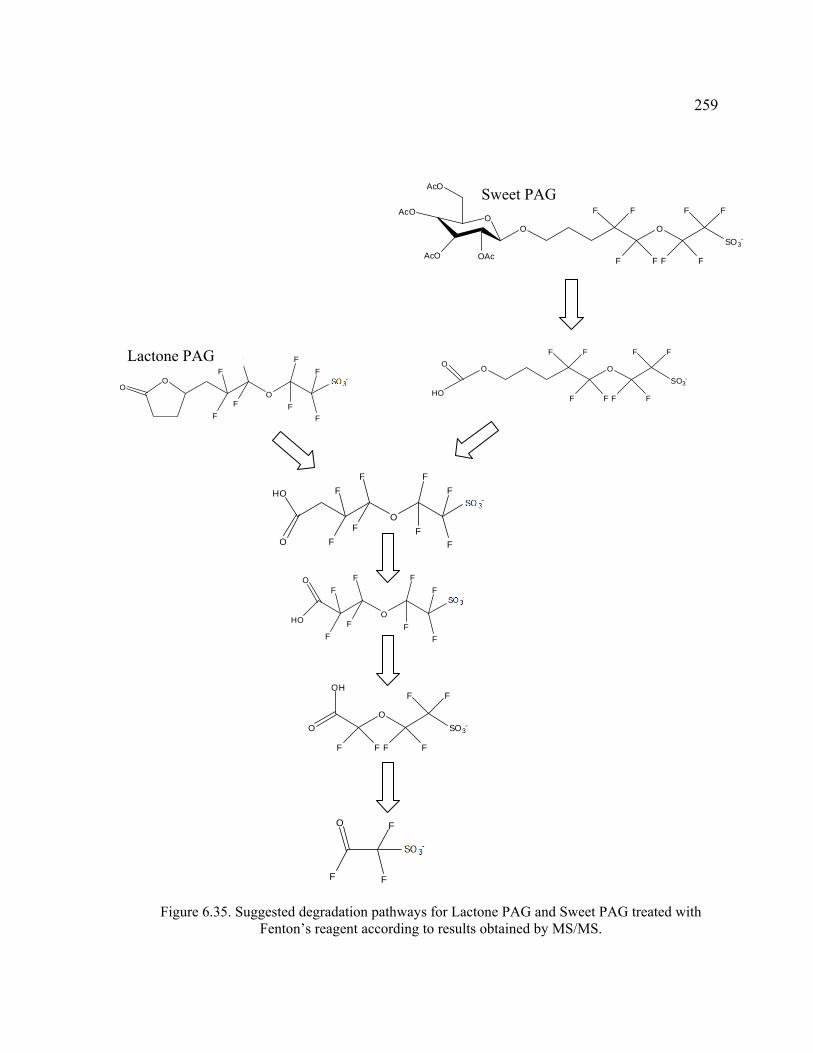
259
Figure 6.35. Suggested degradation pathways for Lactone PAG and Sweet PAG treated with Fenton’s reagent according to results obtained by MS/MS.
OO
F F
F F
O
F F
F F
SO3-
AcO
AcO
AcO OAc
O
F F
F F
O
F F
F F
SO3-
O
HOO
OO
S
O
O
O-
F
FF
F
F
F
F
F
OS
O
O
O-
F
FF
F
F
F
F
F
HO
O
OS
O
O
O-
F
FF
F
F
F
F
F
O
HO
F F
O
F F
F F
SO3-
OH
O
F
F
S
O
O
O-
O
F
Sweet PAG
Lactone PAG

260
6.5. Discussion
6.5.1. Toxicity Tests
Three different tests (MTT, Microtox®, and methanogenic toxicity test) were set
up to determine the toxicity of the new PAGs and how they compare to commercially
available perfluorinated PAGs, such as PFOS and PFBS. Since industrial PAGs are salts,
two counterions (DPI and TPS), typically used with ionic PAGs, were also tested. After
analyzing results a clear pattern is observed in all three tests. PAGs usually tended to
have little or no toxicity in any of the three different assay systems studied, with the
exception of Sweet PAG in methanogenic toxicity tests. The MTT test and Microtox®
assay presented relatively similar results for all the compounds tested. PFOS, PFBS and
new PAGs with a phenyl sulfonate structure such as SF1 and SF2, were non-inhibitory at
the highest concentrations tested in the Microtox® (500 μM to 11,250 μM) and the MTT
assay (100 μM to 2,500 μM). However, it is important to mention that PFOS was tested
at lower concentrations than other PAGs due to its limited solubility in water (500 mg/L
in distilled water).
PAGs with an alkyl ether sulfonate substituent such as PF1, Sweet PAG and
Lactone PAG presented similar inhibitory concentrations (IC50 values always between
332 μM to 2037 μM) for Microtox® and MTT tests. Although the absolute values differ,
the IC50 for all these PAGs present the same order of magnitude (millimole range),
which may be due to their structural similarities. The structural similarities present a
sulfonate polar head, an eight or four carbon fluorinated chain, and an ether functional
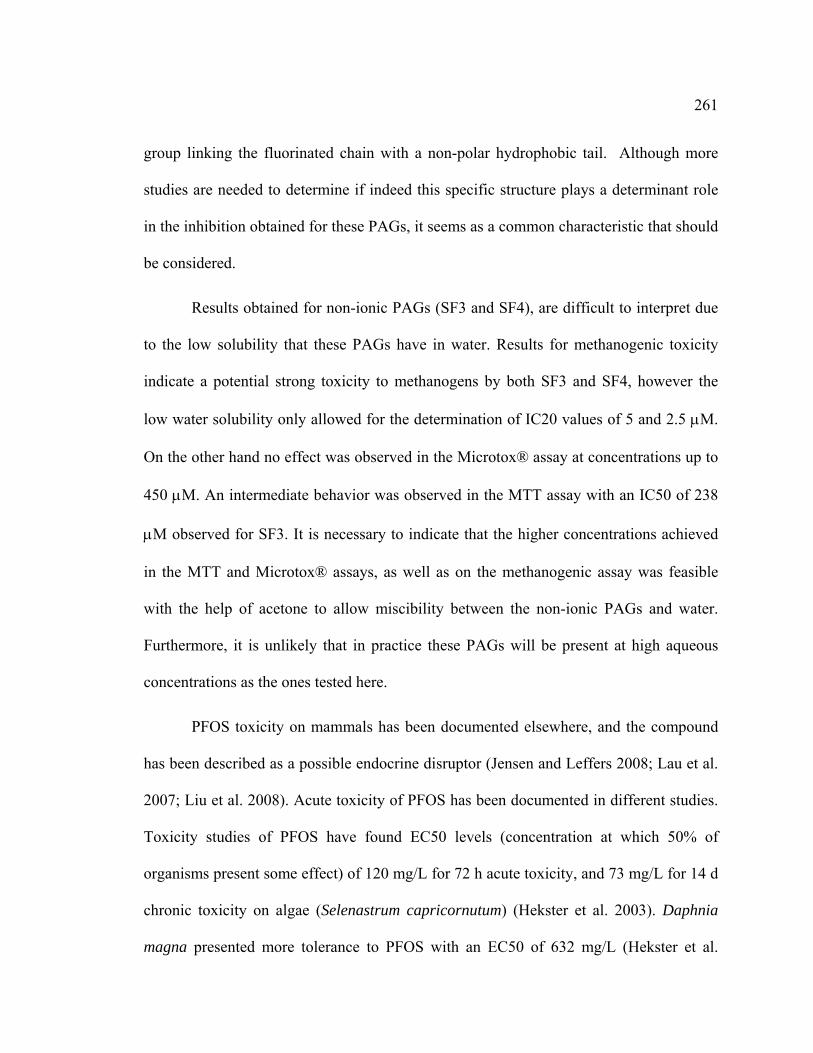
261
group linking the fluorinated chain with a non-polar hydrophobic tail. Although more
studies are needed to determine if indeed this specific structure plays a determinant role
in the inhibition obtained for these PAGs, it seems as a common characteristic that should
be considered.
Results obtained for non-ionic PAGs (SF3 and SF4), are difficult to interpret due
to the low solubility that these PAGs have in water. Results for methanogenic toxicity
indicate a potential strong toxicity to methanogens by both SF3 and SF4, however the
low water solubility only allowed for the determination of IC20 values of 5 and 2.5 μM.
On the other hand no effect was observed in the Microtox® assay at concentrations up to
450 μM. An intermediate behavior was observed in the MTT assay with an IC50 of 238
μM observed for SF3. It is necessary to indicate that the higher concentrations achieved
in the MTT and Microtox® assays, as well as on the methanogenic assay was feasible
with the help of acetone to allow miscibility between the non-ionic PAGs and water.
Furthermore, it is unlikely that in practice these PAGs will be present at high aqueous
concentrations as the ones tested here.
PFOS toxicity on mammals has been documented elsewhere, and the compound
has been described as a possible endocrine disruptor (Jensen and Leffers 2008; Lau et al.
2007; Liu et al. 2008). Acute toxicity of PFOS has been documented in different studies.
Toxicity studies of PFOS have found EC50 levels (concentration at which 50% of
organisms present some effect) of 120 mg/L for 72 h acute toxicity, and 73 mg/L for 14 d
chronic toxicity on algae (Selenastrum capricornutum) (Hekster et al. 2003). Daphnia
magna presented more tolerance to PFOS with an EC50 of 632 mg/L (Hekster et al.
262
2003). Toxicity tests performed in the present study show no effect of PFOS on either
the Microtox® or MTT assays. This can be explained by the low concentrations of PFOS
tested. In the MTT assay, a 24 h test, due to methodology restriction, and low PFOS
solubility in water, the highest concentration tested was 50 mg/L, much lower than the
EC50 levels found in other studies. The Microtox® assay allowed for a higher PFOS
concentration (250 mg/L), however the assay lasts only 30 min, so it is uncertain if longer
exposures would have resulted in higher toxicity, although the latter is improbable.
Nevertheless it is important to notice that PFOS bioaccumulation presents a concern for
long term toxicity (Lau et al. 2007). Liu et al. (2008) found that PFOS and other long
chain perfluoroalkyl chemicals presented inhibition to Scenedesmus obliquus (an algae)
growth rate. They found an IC50 of 156μM for PFOS, and an IC50 of 261μM for
perfluorododecanoic acid, using fluorescence as a response parameter. They also found
that this inhibition was in part caused due to enhanced cell permeability when algae was
exposed to these chemicals, and that toxicity was dependent on the chain length and acid
group. PFOS is also an endocrine disruptor and has been found to affect the
neuroendocrine system in rats (Austin et al. 2003).
In agreement with the results obtained in this study on the acute toxicity of PFBS,
where no toxic effects were found in any test, various studies performed by 3M
Corporation and submitted to the Australian government in a report on the environmental
and health effects of potassium PFBS, show that PFBS had no toxic effects to mammals
or humans. They determined that a PFBS LD50 to rats should be higher than 2000 mg/kg
bw (NICNAS 2005). Furthermore the study also reports a non-observable adverse effect

263
level (NOAEL) for prolonged exposure (90 days) in rats of 200 mg/kg bw/day (NICNAS
2005).
Toxicity to methanogenic consortia was also tested for all PAGs with similar
results obtained for almost all PAGs. However, IC50 values for this test were usually
higher (less toxic) than for the other tests, with the exception of Sweet PAG which turned
out to be especially toxic for methanogens. Higher IC50 values for the other PAGs can be
explained by the fact that in this test granular sludge was utilized; while for MTT and
Microtox® dispersed cells are utilized. It is well known that granular sludge is less
affected by any chemical than suspended cells (Hulshoff Pol et al. 1998). Diffusional
transport is the mean transport process in granular sludge (Lens et al. 2003). While outer
microorganisms have immediate exposure to chemicals and hence suffer from its
toxicity; microorganisms in biofilms have less exposure, as they only come in contact
with chemicals once they have diffused through the granule. These limitations make for a
lower acute toxic effect.
There was one PAG, SF2, which was toxic to acetotrophic methanogens but was
not toxic to any other test. The methanogenic toxicity of nitroaromatics, with similar
structures to SF2, has been studied before by Razo-Flores et al. (1997). This study shows
that nitrogen-substituted aromatics tend to be toxic to acetotrophic methanogens, with
nitroaromatics being the most toxic of all the substitutions studied there. This
phenomenon is explained by the higher reactivity of nitrogen-substituted aromatics when
compared to analog alkyl substituted aromatics. Higher toxicity of nitroaromatics against
amine-aromatic analogs is explained by the higher octanol-water partition coefficient of

264
nitroaromatics versus the analog amines (Razo-Flores et al. 1997). Specific toxicity of
nitroaromatics to methanogens has been suggested to be due to specific interactions
between nitroaromatics, or reduction intermediates, and the cell membrane of
methanogens causing cell lysis (Gorontzy et al. 1993). Based on these precedents there is
no surprise that SF2 resulted in a higher toxicity to methanogens compared to most other
PAGs.
The PAG counterions, diphenyliodonium (DPI) and triphenylsulfonium (TPS),
were considerably more toxic compared to the PAG compounds in all assays except for
Sweet PAG in methanogenic assays. Their IC50 values were generally one or two orders
of magnitude lower. The mechanisms of toxicity by DPI have been studied elsewhere
(Gerami-Nejad and Stretton 1981; Odonnell et al. 1993; Riganti et al. 2004; Scaife 2005;
Shiemke et al. 2004; Tew 1993). DPI has been reported to inhibit flavoprotein activity
(Scaife 2005), cytochrome P450 (Tew 1993), and membrane-bound methane
monooxygenase and ammonia monooxygenases (Shiemke et al. 2004). Odonnell et al.
(1993), found that the characteristic inhibitory concentration for DPI to the neutrophil
NADPH oxidase to be 5.6 μM which is close to the values obtained in these studies.
Their study also found that phenyl radicals play an important role in the mechanism of
toxicity of DPI. On the other hand, Barret et al (1976), found that TPS also inhibits
mitochondrial activity by direct action on oxidative phosporylation as well as to be
inhibitory to the electron transport chain between NADH and cytochrome b. For all their
tests, they found the 50% inhibition to be on concentrations below 100 μM. The results
found in their study had a similar outcome to the results obtained in this study.

265
6.5.2. Biodegradation Tests
The biodegradability of the new PAGs by aerobic and anaerobic sludge from
municipal wastewater treatment plants was evaluated in this study. Conditions for
degradation can be divided in three different types: aerobic, aerobic cometabolic and
anaerobic. PFOS was not tested with these assays since its persistence has been
thoroughly documented in the literature (Key et al. 1998; Tang et al. 2006). Several
studies exist in the biodegradability of fluorinated aromatics both under aerobic
(Emanuelsson et al. 2006; Ferreira et al. 2008; Zhang et al. 2007) and anaerobic
conditions (Vargas et al. 2000). Previous studies will be compared to the results obtained
from all the experiments conducted. From these results, it can be observed a clear pattern
regarding to biodegradability and some special characteristics that may improve it.
Under aerobic conditions, aromatic PAGs: SF1, SF2, and PF1, showed little
degradation after 369 days of incubation (2.7, 1.4 and 2.2% of fluoride released,
respectively). The same trends were observed for cometabolic degradation. An initial
evaluation of the persistence of these aromatic PAGs may point to the natural stability of
the aromatic ring. However, aerobic degradation of aromatic compounds has been
documented under different conditions and both with pure cultures and mixed inoculate
(Acuna-Arguelles et al. 2003; Bielefeldt and Stensel 1999; Cobos-Vasconcelos et al.
2006; Lee et al. 2002; Tharakan and Gordon 1999; Zepeda et al. 2006). Zhang et al.
(2007), have also demonstrated biodegradability of mono-fluorophenols by acclimated
activated sludge. They found that aerobic biodegradability decreases in the following
order: 4-fluorophenol > 3-fluorophenol > 2-fluorophenol. Therefore other structural
266
factors may be of importance on the reason behind the reduced biodegradability of
aromatic PAGs. It is commonly known that the more electron-withdrawing substituents
on an aromatic ring tends to correspond to greater recalcitrance in aerobic environments
(Field et al. 1995). Electron-withdrawing substituents, such as nitro (-NO2), and sulfonate
(-SO3-), protect the aromatic ring from attack by oxygenases (Ye et al. 2004 390). SF1
and SF2 PAGs contain at least three electron withdrawing groups: two fluoride
substitutions and a sulfonic substitution in the case of SF1; and a nitro substitution, a
trifluoromethyl substitution and a sulfonic substitution in the case of SF2. These
characteristics may be preventing the ring from attack by oxigenases and thus increasing
their recalcitrance.
On the other hand, non-aromatic PAGs, such as Lactone PAG and Sweet PAG,
were more readily biodegradable under aerobic conditions (complete PAG degradation
after 15 days). Based on IC measurements, complete biotransformation was observed, but
complete fluorine mineralization was not achieved as indicated by the partial fluoride
released results (9.9% for Lactone PAG and 17.5% for Sweet PAG at 99 and 75 days,
respectively). From the results obtained it is observed that autoclaved sludge also
presents some degradation although these may have occurred due to incomplete
sterilization, during the procedure to heat kill cells, or to contamination. In the case of
Lactone PAG removal was not observed in the abiotic control. However degradation was
observed in the autoclaved control after day 10 with a more accelerated rate after day 35.
One interesting behavior observed in the Lactone PAG assay was the fluoride released by
the autoclaved treatment. It is difficult to establish a definitive cause for the results
267
obtained, however a closer look to the chromatograms obtained for this test (Figures 6.12
and 6.13) show that during the degradation of Lactone PAG there were distinct pathways
for the autoclaved and biotic assays, which may have allowed further degradation and
fluorine mineralization of Lactone PAG.
Sweet PAG was completely removed in all the treatments to which it was
subjected. However the rate of removal differed from the test and the controls. It is clear
from the PAG removal data that the complete aerobic treatment presented the higher
removal rate, followed by the autoclaved control and the abiotic control (Figure 6.8).
Furthermore an analysis to the chromatograms obtained for the Sweet PAG assays
(Figures 6.14 to 6.16), and the MS/MS data (Table 6.9), show that Sweet PAG was
transformed to a deacetylated form (Figure 6.36), which is product of the acetyl groups
being hydrolyzed off the sugar moiety. Esters are known to undergo hydrolysis at pH
outside neutral range. This may explain why removal was observed in the abiotic control,
and anaerobic treatment where a pH of 7.5 was measured. However it is clear from the
chromatograms and the MS/MS data that in both the autoclaved and biotic treatment,
further biological degradation of Sweet PAG occurred. Nevertheless, fluoride release was
only observed in the biotic treatment, which proves that fluorine mineralization was
biologically mediated.
Figure 6.36. Hydrolyzed form of Sweet PAG. MW=517.
268
For both Lactone PAG and Sweet PAG, there was a somewhat higher O2
consumption determined in the complete treatment compared to endogenous control
lacking PAG (Table 6.8), and the comparison between abiotic and biotic controls
indicates that removal of PAG was linked to oxygen respiration. The fact that new non-
aromatic PAGs (Lactone PAG and Sweet PAG) presented readily biodegradability
suggests that these structures are more prone to degradation by mixed consortium such as
those found in municipal wastewater. However, the lack of 100% mineralization still
presents an obstacle that must be overcome. The lack of complete fluoride released,
indicates that the fluorinated chain present on these PAGs was not completely degraded.
Furthermore, oxygen consumption data shows that there was consumption of non-
endogenous COD, which most likely comes from the alkylic hydrophobic tail of the
PAGs, rather than the fluorinated chain. The fluorinated chain in Sweet PAG and Lactone
PAG resembles the structure of PFOS and PFBS, except for an ether functional group
located in the middle of the chain. The strength of the carbon-fluoride bond found in the
fluorinated chain seems to affect mineralization of the new PAGs, in some way similar to
the effect that this has on PFOS and PFBS biodegradation.
Under anaerobic conditions the results showed a similar behavior for most PAGs.
For this treatment aromatic PAGs presented a little improvement over aerobic
degradation, although it was still minimal. Previous studies by Vargas et al. (2000), on
the anaerobic degradation of fluorinated aromatic compounds found that, under
methanogenic conditions, mono-fluorophenols and mono-fluorobenzoates were not
269
degraded even after 100 days of treatment. However, 2- and 4-flurobenzoate were readily
degraded under denitrifying conditions. Further studies should be performed on the new
PAGs under denitrifying conditions to determine if the same results can be obtained.
SF2 was the only compound that showed biotransformation under anaerobic
conditions, with 100.0% biotransformation achieved but only 9.2% of fluoride
mineralization after 501 days. These results suggest that biotransformation and not
mineralization was the main process to which SF2 was subjected. MS/MS data provided
more insight on the transformation observed and showed that biotransformation of the
nitro aromatic compound, SF2, under anaerobic conditions consisted mainly of the
reduction of the nitro group to an amino group (Figure 6.24). The ability of anaerobic
microorganisms to reduce nitro groups in aromatic compounds is well established. Razo-
Flores et al. (1999), reported that selected nitroaromatic compounds were
stoichiometrically transformed to the corresponding aromatic amines during continuous
flow treatment in an upward-flow anaerobic sludge bed (UASB) reactor. However, only
three of the seven compounds tested underwent complete mineralization (2-nitrophenol,
5-nitrosalicylate, and 4-nitrobenzoate), while other four did not (4-nitrophenol, 2,4-
dinitrophenol, 2,4-dinitrotoluene, and nitrobenzene). This suggests that biotransformation
stopped after transformation of the nitro substituent to the amino substituent.
Furthermore, Tan et al. (2005), showed that aromatic sulfonated amines were not
biodegradable under anaerobic conditions after more of 100 days of treatment. These
results agree with the ones obtained in the present study and may explain the lack of
further degradability. On the other hand, Tan et al (2005) also found that orto- and para-
270
amine benzylsulfonates were degraded under aerobic conditions. This opens the
possibility of SF2 complete degradation by consecutive anaerobic-aerobic treatments.
It has to be pointed out that this study does not cover all the possibilities and
conditions that exists in nature and that may present biodegradability of the new PAGs.
Besides aerobic and anaerobic conditions, another interesting approach for the
biodegradation of the non-perfluorinated PAGs would be to take advantage of ammonia
monooxygenases (AMO) of nitrifying microorganisms. These enzymes are known to be
involved in cooxidation leading to the breakdown of aromatic structures (Zepeda et al.
2006). Nitrification processes are a common part of most wastewater treatment plants, so
no modification of existing processes would be necessary.
Analysis of all the results obtained in this study show that the non-perfluorinated
characteristic of the new PAGs allows them to be more biodegradable. It also shows that
addition of structures that are known for their persistence (such as aromatic rings)
decreases their biodegradability potential. However, the results obtained for both Lactone
PAG and Sweet PAG point out a path that may be the solution to more biodegradable
PAGs: the inclusion of known biodegradable functional groups like oxygenated
aliphatics.

271
6.5.3. Physico-Chemical Treatment
6.5.3.1. Adsorption to Granular Activated Carbon
Sweet PAG presented the highest for affinity GAC, while SF1 and PF1 were the
least prone to treatment (Table 6.10). The affinity of the former compound for GAC is in
the same range as that of other common contaminants such as p-xylene, nitrobenzene,
ethylbenzene, and trichloroethene (TCE) which are commonly treated with GAC
columns (Dobbs and Cohen 1980; Ochoa-Herrera and Sierra-Alvarez 2008). Sweet PAG
presents an affinity comparable to that of the widely used PAG, PFOS (Ochoa-Herrera
and Sierra-Alvarez 2008). At saturation GAC can hold up to 128 mg/g of Sweet PAG, a
value that represents half the capacity observed for PFOS (236.4 mg Sweet PAG/g) The
high tendency of Sweet PAG to partition onto GAC may be explained by the large
hydrocarbon tail of this compound. This larger apolar chain increases hydrophobicity
which tends to favor adsorbability on GAC (Eckenfelder 2000). Furthermore, as long as
pore size is not a problem, larger molecules also tend to be more adsorbable due to more
chemical bonds being formed between carbon and the chemical in solution (Eckenfelder
2000). On the other hand, PAGs with shorter hydrophobic tails such as, SF1, SF2 and
PF1, were less effectively adsorbed by GAC compared to the Sweet PAG, due to the
same reasons presented before. The Freundlich constants determined for SF1, SF2, PF1
and Lactone PAG in our study (Table 6.10) were found to be in the same range as those
reported for contaminants such as tetrachloroethane, trichlorofluoromethane,
acrylonitrile, EDTA, and benzene (Dobbs and Cohen 1980), and for PFBS, a compound
proposed to replace PFOS in photolithography (Ochoa-Herrera and Sierra-Alvarez 2008).
272
The loading values determined at saturation for the PAGs, SF1, SF2, PF1 and Lactone
PAG, (65-90 mg/g GAC) are relatively close to that observed for PFBS (98.7 mg/g).
6.5.3.2. Reduction with Zero Valent Iron
Zero-valent iron reduction is a process commonly used to degrade highly
halogenated compounds and other highly oxidized contaminants. The potential of ZVI
treatment to remove the new PAGs from aqueous solutions is obvious based on the
ability of ZVI to reduce oxidized compounds. Results obtained in this study show that
ZVI treatment at low temperatures (30oC) had a very little effect on almost all the PAGs,
with the exception of SF2 and Sweet PAG. However, Sweet PAG degradation occurred
due the hydrolysis of acetyl groups found in Sweet PAG rather than due to ZVI
reduction. On the other hand, just as in the case of the anaerobic treatment, SF2 was
completely reduced to the corresponding amine in 22 hr. In a related study, complete
reduction of various nitroaromatic pesticides to their corresponding amines was also
observed following ZVI treatment at 35oC for 20-50 hr (Keum and Li 2004).
Although SF2 was completely transformed, only a small fraction of the fluoride
was released. SF1 was the PAG with the most fluoride released (7.06% of SF1 vs. 2.79%
of SF2 after 3 days). This may be explained by the fact that the energy of the carbon-
fluorine bond is lower for fluorine attached to aromatic benzyl rings with a value of 393
kJ/mol, compared to 485 kJ/mol of the simple carbon-fluorine bond (Sanderson 1976;
Sanderson 1983).

273
PFOS is not degraded by ZVI treatment at temperatures below 100oC (Hori et al.
2006), although the compound is attacked by ZVI in subcritical water at temperatures of
350oC. Based on these results there exists the possibility that given that at low
temperatures transformation is already observed for the new PAGs, at higher
temperatures a better performance in the degradation of the new PAGs may be achieved.
However, these treatments tend to be energy intensive and not appropriate for full scale
application.
6.5.3.3. Advanced Oxidation with Fenton’s Reagent
Of all the techniques utilized in this study, Fenton’s reagent provided the most
promising results. Complete transformation was observed for all the new PAGs. With
complete mineralization of fluorine achieved for SF1, and almost 50% of fluoride
released for PF1. Only partial defluorination was observed for all the other PAGs. PFOS
and PFBS presented negligible degradation with only 0.56 and 0.35% of the fluoride
released respectively. Hydroxyl radicals generated by the Fenton’s reagent can attack the
aromatic ring and cleave it, promoting further degradation (Chamarro et al. 2001; Neyens
and Baeyens 2003).
It has to be mentioned that SF1 was the only PAG where the fluorine substitution
occurred directly onto the aromatic ring. Other PAGs such as SF2, PF1, Lactone PAG
and Sweet PAG, were also degraded, although complete mineralization of organofluorine
was not achieved. Most of fluoride mineralization occurred in the first 15 minutes of the

274
reaction after which fluoride release stopped. A common feature of the latter PAGs is that
fluorine atoms are bound to alkylic carbon atoms. This characteristic seems to be
determinant in the mineralization of PAG. Fluoride-carbon bonds are stronger when
fluoride is bonded to an alkylic carbon compared to bonding to an aromatic carbon
(Sanderson 1976; Sanderson 1983). This may explain the high mineralization observed in
the case of SF1 where both fluorides are attached to aromatic carbons and the lack of this
effect on the other PAGs where fluoride is attached to alkylic carbons. Fluorines attached
directly to the aromatic rings are more prone to be mineralized, than the ones bonded
with alkylic carbon. In the case of the Lactone PAG and Sweet PAG, MS/MS results
indicate that the initial oxidation resulted in ring opening and ring cleavage, and that
further attack involved successive α-oxidation steps leading to alkylic carboxylates with
increasingly shorter length (Figure 6.35). In the case of PF1 and SF2 oxidation resulted
in ring opening and formation of alkylic carboxylic acids.
In the case of PF1 it is clear that the final structure correlates almost perfectly
with the fluoride released, since two fluorine atoms were released per molecule of PF1,
which will in fact account for 50% of the initial fluoride (Figure 6.27). A quantitative
analysis of this kind for Lactone PAG and Sweet PAG results more difficult, since
various byproducts are observed and the quantitative relationship between them is not
known. However, it is important to notice the similarities of the pathway that followed
the degradation of these PAGs which also present the most similar structures.
Although PF1, Lactone PAG and Sweet PAG, were degraded almost completely,
complete fluorine mineralization was not observed and a final product consisting of a 2C
275
alkyl sulfonate fluorinated chain was left as residual. It has been reported that small
halogenated compounds (usually 2 carbon length or less) tend to be somewhat more
resistant to degradation by Fenton’s reagent (Chamarro et al. 2001), which might be the
cause of the behavior observed in this study.
The results obtained in the advanced oxidation of PAGs with Fenton’s reagent
clearly show an improvement on the degradability of new PAGs when compared to other
commercially available PAGs like PFBS and PFOS. Non-perfluorination seems to be the
determinant factor in this improved behavior.
276
7. ENVIRONMENTAL PROPERTIES OF NON‐PERFLUORINATED
SURFACTANTS: EPA PBT PROFILER AS MODEL FOR ANALYSIS
7.1. Abstract
Semiconductor manufacturing is an ever evolving industry with technologies being developed at a fast rate. Along with the introduction of new technologies, new chemicals are developed and, in some cases, released into the environment without a complete knowledge of their environmental fate and properties. Experimental determination of these properties can be expensive and time-consuming, so faster and cheaper options should be available. Software modeling is an alternative to predict these properties for new chemicals, or chemicals in their developing stage. The Persistence-Bioaccumulation-Toxicity (PBT) Profiler and Estimations Program Interface (EPI) Suite are two set of programs developed by the U.S. Environmental Protection Agency that can estimate physical and environmental properties of new chemicals according to their structure. These models were utilized to predict environmental properties of new photo-acid generators (PAGs) that are being developed to substitute perfluorooctane sulfonate (PFOS) in photolithographic processes in semiconductor manufacturing. PFOS is an emerging contaminant of concern due to its environmental persistence and bioaccumulative properties, and a Significant New Use Rule (SNUR) was emitted for this chemical by the EPA. The results obtained in this study were compared to experimental values to determine the accuracy of these models. The software models were found to provide reasonable predictions for various compound properties including vapor pressure, octanol-water partition coefficients and toxicity. However prediction of other key environmental parameters, such as biodegradability, was poor and other models should be utilized for the estimation of these properties.
277
7.2. Introduction
Semiconductor manufacturing involves a series of highly advanced technological
processes. Existing processes are undergoing frequent modifications and new ones are
being developed at a fast rate to meet the demand for faster and innovative semiconductor
materials. The advancement and introduction of new technologies brings along the use of
new chemicals and materials (Banerjee et al. 2005) which must meet complex
technological requirements. However, the evaluation of the potential environmental
impact of these materials often comes as a second thought or after some environmental
problems become apparent. Chemicals such as trichloroethylene (TCE),
perchloroethylene (PCE), perfluorooctane sulfonate (PFOS), and other solvents and
surfactants were widely used without concern until they were found to produce
environmental problems such as toxicity, bioaccumulation or persistence. After these
problems were identified treatment-processes were developed, but on occasions such
methods become expensive or non viable. Due to these challenges, such materials are
usually banned from production and new materials have to be found that replace the older
ones.
Testing the impact on the environment of a new chemical is a process which
involves a lot of variables and testing, which makes it costly, both in terms of time and
economy. Direct measurement of properties that affect the environment impact of a given
chemical can be challenging and costly, especially when long term exposure to the
compound being studied is needed. With an ever-changing industry, like the
semiconductor industry, time can also become an issue.

278
Models have been developed to estimate the environmental properties of
pollutants based on various characteristics of the compound studied, including chemical
structure, molecular weight, partition coefficients, etc (Dimitrov et al. 2004; USEPA
2007). Based on these inputs, models usually predict the fate of chemicals once released
into the environment, and if they will get degraded by either biological or chemical
means. Utilization of software to model environmental properties of new materials before
they enter the mass market, can save the industry both time and money. It is important to
notice that real data will always be preferable to simulated data. However, simulated data,
if representative of real data, can be used in the earlier stages of the introduction of a new
chemical, as a screening tool to look for factors that may affect the environmental
properties of such chemical. Software suites, such as the EPA EPI (Estimations Program
Interface) Suite and the EPA PBT (Persistence - Bioconcentration - Toxicity) Profiler,
can be used to test and discriminate between friendly and non-friendly new chemicals
(USEPA 2008).
In this study, both the EPA EPI Suite and the EPA PBT Profiler will be used to
estimate the environmental fate and impact of new non-perfluorinated PAGs which have
been proposed as alternatives for PFOS in photolithography. Results obtained in this
study will be compared to data obtained by experimentation (Chapter 6) to determine the
effectiveness of these software programs to model and characterize the environmental
impact and fate of these chemicals.

279
7.3. Materials and Methods
7.3.1. PAG Compounds
The chemical structure of the PAG compounds and counterions evaluated, as well
as their molecular formulas, and molecular weights are shown in Figures 6.1 and 6.2, and
their chemical structure is shown in Table 7.1. The new non-perfluorinated chemicals
were developed and synthesized by Dr. C. L. Ober and his research group from the
Cornell University (Ayothi et al. 2006; Ayothi et al. 2007). PFOS and PFBS were used as
reference compounds. Perfluorobutane sulfonic acid potassium salt, PFBS (CAS 375-73-
5; >97%) was obtained from Sigma-Aldrich Corp. (St. Louis, MO). Perfluorooctane
sulfonic acid potassium salt, PFOS, (CAS 2795-39-3; 98% purity) was purchased from
SynQuest Laboratories (Alachua, FL).
PAG counterions were also tested for toxicity and persistence. Diphenyliodonium
chloride, DPI (CAS 1483-72-3; >98%); 3-(4,5-dimethyl-2-thiazolyl)-2,5-diphenyl-2H-
tetrazolium bromide (CAS 298-93-1; ~98%) was obtained from Sigma-Aldrich Corp. (St.
Louis, MO). Triphenylsulfonium bromide, TPS (CAS 3353-89-7; >98%) was obtained
from TCI America (Portland, OR).
7.3.2. Modeling Software
In this study two modeling software suites were utilized to estimate and predict
the environmental impact of new non-perfluorinated PAGs, the EPA EPI Suite
(www.epa.gov/oppt/exposure/pubs/episuite.htm) and the PBT Profiler
280
(www.pbtprofiler.net). Since results on both programs are dependent on the kind of
compound that is provided, i.e. ionic and non-ionic, acidity constants for all the PAGs
should be taken into account to determine the species expected to be dominant under
environmental conditions. Previous studies with the PAGs examined here showed that the
pKa values for all the ionic compounds are very low (e.g., pKa for PF1 = -4.86, PFBS =
-4.99, PFOS = -3.27) (Ayothi et al. 2007; Brooke et al. 2004). This suggests that under
environmental conditions all the ionic PAGs investigated tend to be completely
dissociated. Therefore, the ionic form of the PAGs was used for calculation in all the
study. Whenever an ionic input was not possible the sodium salt of all ionic PAGs was
used instead.
7.3.3. PBT Profiler
The PBT Profiler is a model recommended by the US-EPA and developed by the
Environmental Research Center of the Syracuse Research Corporation under contract
with EPA to study new compounds when experimental data is not available. The only
input to this model is the structure of the compound being modeled. In order to obtain the
desired values and parameters to determine the PBT characteristics of each compound,
the PBT Profiler uses different models and methodologies. Input on the PBT Profiler is
accomplished by the use of Simplified Molecular Input Line Entry System (SMILES)
notation (Weininger 1988). SMILES is a chemical notation that allows describing a
chemical structure of a compound by a single line of text. Each new PAG was encoded in
281
this notation in order to be modeled by this software (Table 7.1). Following the input of
data, the PBT Profiler then transfers the structures to different models and estimates
values which then are converted to persistence, bioaccumulation and toxicity data that are
compared to the PBT criteria established by EPA.

282
Table 7.1. SMILES notation for the PAGs studied. PAG Structure SMILES Notation
SF1 ONa
F
F
S
O
O
C1=C(F)C(S(=O)(=O)O[Na])=C(F)C=C1
SF2
NO2
F3C ONaS
O
O
C1(C(F)(F)F)=CC(N(=O)=O)=C(S(=O)(=O) O[Na])C=C1
PF1 ONaO
F
F
F
F
S
O
O
C1=CC(OC(F)(F)C(F)(F)S(=O)(=O)O[Na]) =CC=C1
SF3 N O
O
O
S
O
O
O2N
CF3C42=C3C=CC=C4C=CC=C2C(=O)N(OS(=O) (=O)C1=CC=C(C(F)(F)F)C=C1N(=O)=O)C3=O
SF4 N O
O
O
S
O
O
F
F
C42=C3C=CC=C4C=CC=C2C(=O)N(OS(=O) (=O)C1=C(F)C=CC=C1F)C3=O
Lactone PAG ONa
OO
OS
O
O
F
FF
F
F
F
F
F
C1CC(CC(F)(F)C(F)(F)OC(F)(F)C(F)(F)S(=O) (=O)O[Na])OC1=O
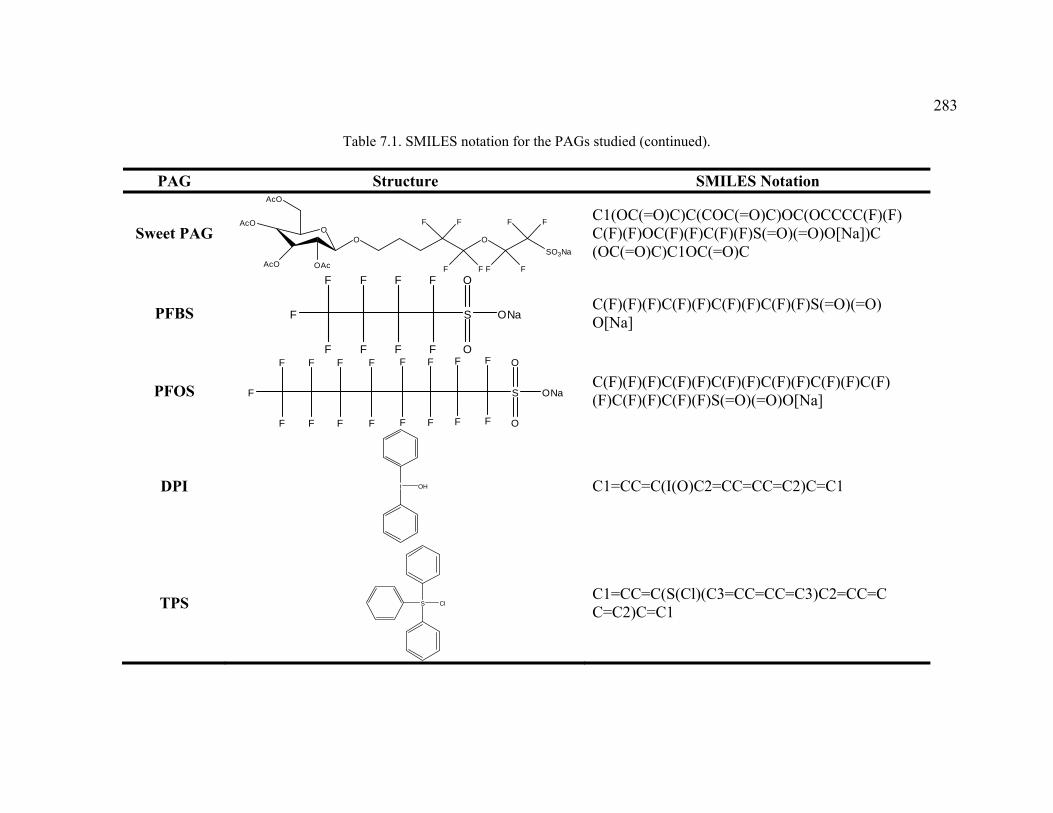
283
Table 7.1. SMILES notation for the PAGs studied (continued).
PAG Structure SMILES Notation
Sweet PAG SO3Na
AcO
AcO
AcO OAc
OO
F F
F F
O
F F
F F C1(OC(=O)C)C(COC(=O)C)OC(OCCCC(F)(F) C(F)(F)OC(F)(F)C(F)(F)S(=O)(=O)O[Na])C (OC(=O)C)C1OC(=O)C
PFBS ONa
F
F
F
F
F
F
F
F
F
S
O
O
C(F)(F)(F)C(F)(F)C(F)(F)C(F)(F)S(=O)(=O) O[Na]
PFOS ONaS
F
F F
F
F
F
F
F F
F
F F
FF
F
F F O
O
C(F)(F)(F)C(F)(F)C(F)(F)C(F)(F)C(F)(F)C(F) (F)C(F)(F)C(F)(F)S(=O)(=O)O[Na]
DPI I OH C1=CC=C(I(O)C2=CC=CC=C2)C=C1
TPS S ClC1=CC=C(S(Cl)(C3=CC=CC=C3)C2=CC=C C=C2)C=C1
284
7.3.3.1. Environmental Persistence
The PBT Profiler establishes the persistence of a certain chemical in the
environment by first estimating the half-life of this chemical in four different media: air,
water, soil and sediments. Then the Profiler, based on the different partition coefficients
(i.e. partition coefficient octanol-water or Kow), estimates the likelihood of a chemical to
stay in each medium in case that a release occurs. Then based on this two main
calculations the PBT Profiler establishes the tendency of this compound to be persistent.
Air persistence is estimated by calculation of an atmospheric half-life. This
atmospheric half-life takes into account the reaction rates of the chemical of study with
two of the most important atmospheric oxidants: hydroxyl radicals and ozone. The rates
are calculated using the method of Atkinson (Meylan and Howard 1993). Real data is
preferred if available. The rates calculated are used in conjunction with the average
concentrations of the oxidants to estimate a half-life value (Atkinson and Carter 1984;
Prinn et al. 1992). The overall half-life is the weighted average of the two half-lives
obtained.
Estimation of the half-life of a chemical in water, soil or sediment, is achieved by
the PBT Profiler by utilizing the ultimate degradation survey module of the BIOWIN
estimation program (Boethling et al. 1994). The output of this program gives the estimate
amount of time needed for complete degradation of a chemical. This result is then
converted to a half-life by assuming that a total of six half-lives are needed for complete
degradation. The BIOWIN program assumes aerobic conditions. In order to account for
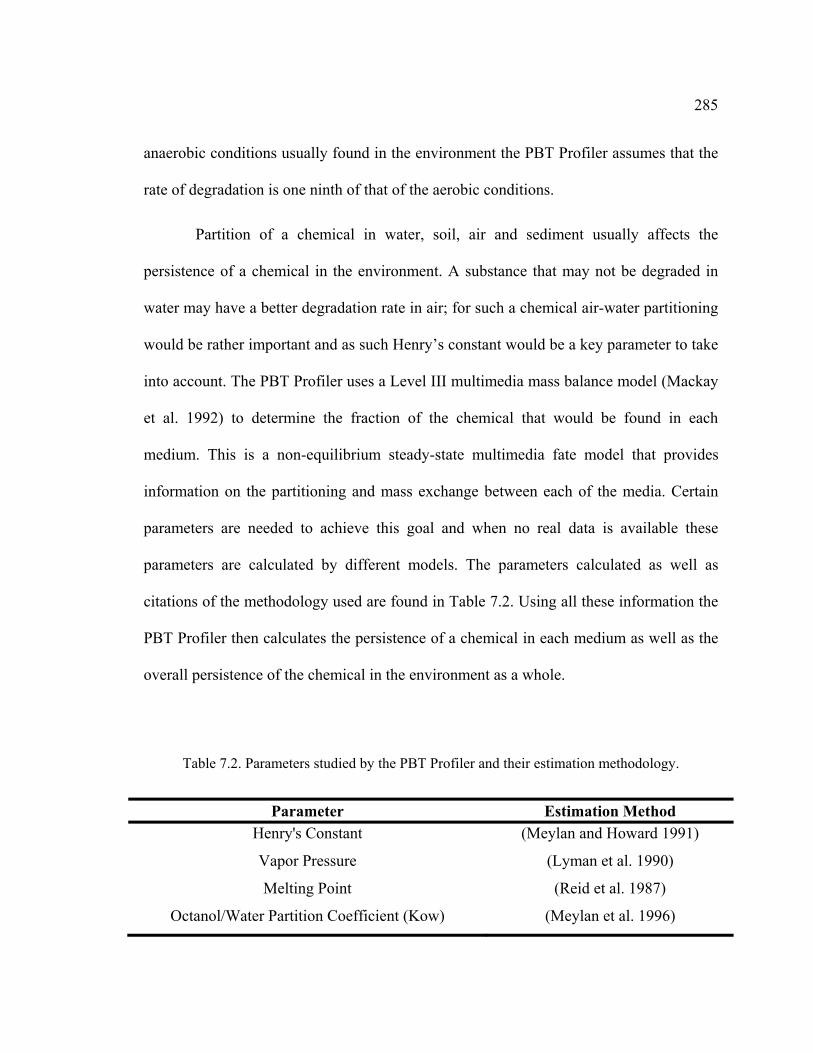
285
anaerobic conditions usually found in the environment the PBT Profiler assumes that the
rate of degradation is one ninth of that of the aerobic conditions.
Partition of a chemical in water, soil, air and sediment usually affects the
persistence of a chemical in the environment. A substance that may not be degraded in
water may have a better degradation rate in air; for such a chemical air-water partitioning
would be rather important and as such Henry’s constant would be a key parameter to take
into account. The PBT Profiler uses a Level III multimedia mass balance model (Mackay
et al. 1992) to determine the fraction of the chemical that would be found in each
medium. This is a non-equilibrium steady-state multimedia fate model that provides
information on the partitioning and mass exchange between each of the media. Certain
parameters are needed to achieve this goal and when no real data is available these
parameters are calculated by different models. The parameters calculated as well as
citations of the methodology used are found in Table 7.2. Using all these information the
PBT Profiler then calculates the persistence of a chemical in each medium as well as the
overall persistence of the chemical in the environment as a whole.
Table 7.2. Parameters studied by the PBT Profiler and their estimation methodology.
Parameter Estimation Method Henry's Constant (Meylan and Howard 1991)
Vapor Pressure (Lyman et al. 1990)
Melting Point (Reid et al. 1987)
Octanol/Water Partition Coefficient (Kow) (Meylan et al. 1996)
286
7.3.3.2. Bioconcentration
Bioconcentration factors are also environmental parameters of concern that can be
estimated using the PBT Profiler. Bioconcentration factors are difficult and expensive to
obtain by experimental means (Meylan et al. 1999). This parameter is estimated by the
EPI suite BCFWIN program (Meylan et al. 1999). In order to calculate a value of
bioconcentration, the program uses the octanol-water partition coefficient. This value is
used in different equations that establish a relationship between the bioconcentration
factor and the partition coefficient. The use of a specific equation was based on other
structural or chemical properties of the chemical studied (Meylan et al. 1999). These
models only consider that chemicals partition between the water and the lipid phase of an
organism (Meylan et al. 1999), and do not take into account other mechanisms of
bioconcentration such as metabolism, and binding to other macromolecules, such as
proteins.
7.3.3.3. Chronic Toxicity
The ECOSAR (Ecological Structure Activity Relationships) program is used by
the PBT Profiler to estimate chronic toxicity of a chemical in fish. This program
estimates the chronic toxicity to fish by comparing the similarities in structure between
the chemical of the study and others for which the toxic concentration has been estimated
experimentally. The values obtained are expressed in mg/L.

287
7.3.4. EPI Suite
The EPA EPI Suite (http://www.epa.gov/oppt/exposure/pubs/episuite.htm) is a
series of programs that can be used to estimate different environmental characteristics of
chemicals of interest (Table 7.3). Some of EPI Suite modules will not be utilized in this
study. PFOS and PFBS are not known to be volatile compounds under environmental
conditions and, therefore, AOPWIN (reaction between hydroxyl radicals and chemical in
air), HENRYWIN (Henry’s law constant), KOAWIN (octanol/air partition constant),
AEROWIN (aerosol sorption), and WVOLWIN (rate of volatilization from rivers and
lakes) modules will not be reported in this study. BIOHCWIN (hydrocarbon
biodegradability estimation) would not be applicable in our study due to the inherent
characteristics of the chemicals of interest (i.e. not hydrocarbons). Partitioning of
chemicals between air, water and soil, as well as the bioconcentration factor, are already
studied using the PBT Profiler. The outputs obtained in BCFWIN (bioconcentration
factor) and LEV3EPI (partition of chemical between air, soil and sediment) are the same
as the results obtained in the PBT Profiler and will not be used in separate fashion due to
this reason. All other modules will be used and compared with experimental data when
available.

288
Table 7.3. EPI Suite programs and their respective parameters estimated (USEPA 2007).
Program Parameters Estimated
KOWWIN
Octanol-water partition coefficient (Kow)
AOPWIN Rates for gas-phase reaction between hydroxyl radicals and a chemical (kOH)
HENRYWIN Henry’s Law constant (HL)
MPBPWIN Melting point, boiling point, and vapor pressure of organic chemicals (Mp,
Bp, Vp)
BIOWIN Aerobic and anaerobic biodegradability of organic chemicals
BIOHCWIN Biodegradation half-life for hydrocarbons (t1/2)
PCKOCWIN Soil adsorption coefficient (Koc)
WSKOWWIN Chemical’s water solubility estimated based on Kow value
WATERNT Water solubility by using a "fragment constant" method
HYDROWIN Acid- and base-catalyzed hydrolysis constants
BFCWIN Bioconcentration Factor (BCF)
KOAWIN Octanol/air partition coefficient (Koa)
AEROWIN Fraction of airborne substance sorbed to aerosols
WVOLWIN Rate of volatilization of a chemical from rivers and lakes
STPWIN Removal of a chemical in a Sewage Treatment Plant
LEV3EPI Partitioning of chemicals between air, soil, sediment, and water under steady
state conditions
7.3.5. Experimental Methods
Most of the experimental data showed in this chapter have been obtained from
Chapter 6, with the exception of the octanol-water partition coefficients (Kow) which are
reported in the current chapter. PAGs, including PFOS and PFBS, are surface active
agents, due to this property they have the tendency to aggregate at the interface of a
289
liquid-liquid system, and direct measurement of Kow data is not possible (Martin et al.
2003; NICNAS 2005; Poulsen et al. 2005). An indirect approach was taken in this study.
7.3.5.1. Determination of Kow.
Previous studies have shown that there exists a linear relationship between log
Kow and the retention time of a specific compound when using a C18 chromatographic
column and a constant gradient (Finizio et al. 1991). Correction factors depending on
structural properties are usual for this type of measurements, however for the purpose of
this study a simplified linear equation was utilized for calculations:
log (7-1)
Where:
Log Kow = Logarithm of the octanol partition coefficient.
T= Retention time of compound analyzed.
T0 = Retention time of reference (retention time of column, 2 min.).
A, B= linear regression parameters.
The use of this method will help to study the effectiveness of the software
modeling to predict Kow. This will be done based on the correlation obtained between
the Kow predicted by software and the Kow estimated by the retention times in this
experiment. Since no other similar compounds (fluorinated surfactants) exist for which an
experimental Kow has been calculated experimentally, the estimated values for PFOS

290
and SF1 will be used as a reference for calculation of the parameters in the equation
above.
Chromatographic results for Kow were obtained using a HPLC system with
suppressed conductivity detector (ICS-3000 ion chromatography system, DIONEX,
Sunnyvale, CA). The chromatograph was equipped with a separation column (Acclaim
Polar Advantage II, C18) operating at 35 ºC. A mixture of 20 mM boric acid (pH 9.0) and
95% acetonitrile was used as the mobile phase at a flow rate of 1mL/min. All other
materials and methods used to obtain experimental data were described in section 6.2.
7.4. Results and Discussion
Data obtained using the PBT Profiler and the EPI Suite are presented in this
section and compared to available experimental data.
7.4.1. Physical Properties
Physical properties for all PAGs, specifically, boiling point, melting point and
vapor pressure were obtained using the program MPBPWIN (Table 7.4). Data are offered
for the acid and sodium salt form of the chemicals. From the results given by the program
it can be observed that under environmental conditions all these compounds, when not in
solution, will be present in their solid form.
Relatively similar boiling points, melting points and vapor pressures were
estimated for all aromatic PAGs (i.e., SF1, SF2, and PF1). The two nonionic PAGs

291
examined (SF3 and SF4) showed similar properties as well, which is according to our
expectations since both compounds present very similar structural characteristics. The
physical properties of Lactone PAG were relatively similar to those of the aromatic
PAGs, unlike Sweet PAG which presented higher boiling and melting points and lower
vapor pressure, somewhat similar to those of the nonionic PAGs. Several factors affect
these properties. Van der Waals forces, dipole attraction, electronegativity, all are
properties that affect vapor pressure, boiling point and melting point, although the latter
with less intensity. Van der Waals forces are strongly affected by molecular size and
structure (Schwarzenbach 2003). Large molecules such as Sweet PAG, SF3 and SF4
(where Van der Waals forces are stronger) will have a lower vapor pressure when
compared to smaller molecules like SF1, which is in agreement with the predictions.
Electronegativity and dipole attraction are both characteristics that affect vapor pressure
as well; higher dipole attraction will represent lower vapor pressures. This explains why
SF2 with an electron withdrawing nitro group has lower predicted vapor pressure than
SF1, and PF1.
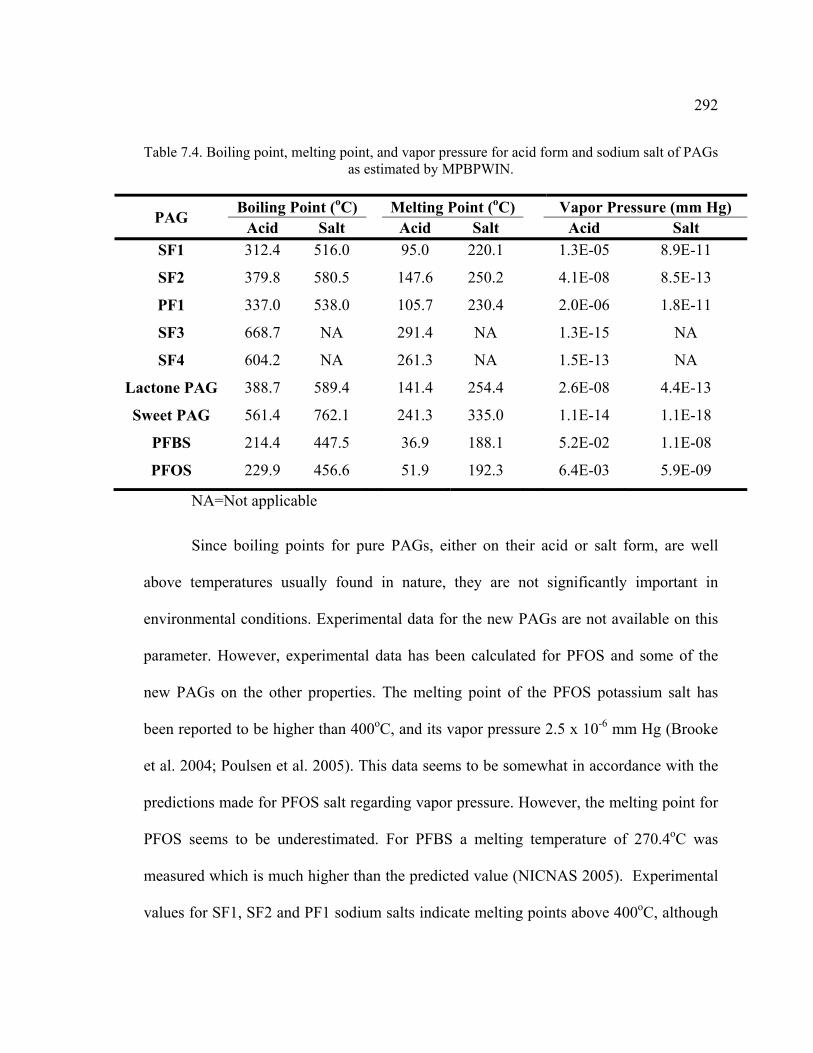
292
Table 7.4. Boiling point, melting point, and vapor pressure for acid form and sodium salt of PAGs as estimated by MPBPWIN.
PAG Boiling Point (oC) Melting Point (oC) Vapor Pressure (mm Hg) Acid Salt Acid Salt Acid Salt
SF1 312.4 516.0 95.0 220.1 1.3E-05 8.9E-11
SF2 379.8 580.5 147.6 250.2 4.1E-08 8.5E-13
PF1 337.0 538.0 105.7 230.4 2.0E-06 1.8E-11
SF3 668.7 NA 291.4 NA 1.3E-15 NA
SF4 604.2 NA 261.3 NA 1.5E-13 NA
Lactone PAG 388.7 589.4 141.4 254.4 2.6E-08 4.4E-13
Sweet PAG 561.4 762.1 241.3 335.0 1.1E-14 1.1E-18
PFBS 214.4 447.5 36.9 188.1 5.2E-02 1.1E-08
PFOS 229.9 456.6 51.9 192.3 6.4E-03 5.9E-09
NA=Not applicable
Since boiling points for pure PAGs, either on their acid or salt form, are well
above temperatures usually found in nature, they are not significantly important in
environmental conditions. Experimental data for the new PAGs are not available on this
parameter. However, experimental data has been calculated for PFOS and some of the
new PAGs on the other properties. The melting point of the PFOS potassium salt has
been reported to be higher than 400oC, and its vapor pressure 2.5 x 10⁻⁶ mm Hg (Brooke
et al. 2004; Poulsen et al. 2005). This data seems to be somewhat in accordance with the
predictions made for PFOS salt regarding vapor pressure. However, the melting point for
PFOS seems to be underestimated. For PFBS a melting temperature of 270.4oC was
measured which is much higher than the predicted value (NICNAS 2005). Experimental
values for SF1, SF2 and PF1 sodium salts indicate melting points above 400oC, although
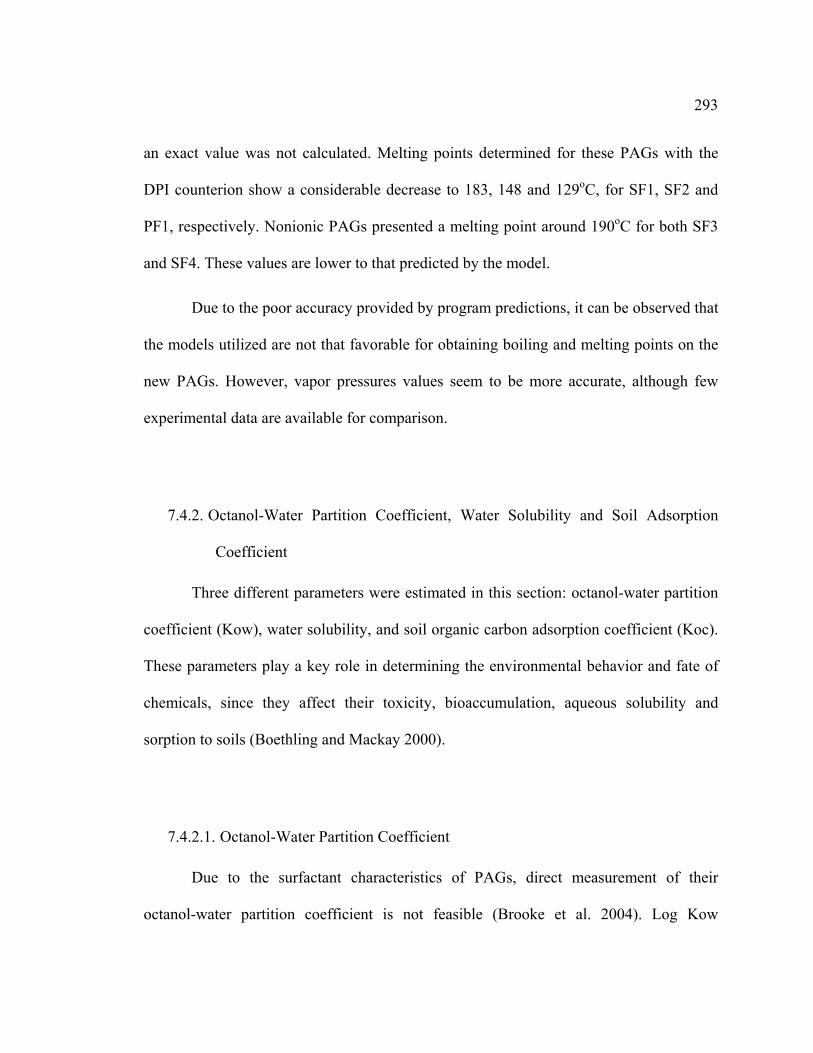
293
an exact value was not calculated. Melting points determined for these PAGs with the
DPI counterion show a considerable decrease to 183, 148 and 129oC, for SF1, SF2 and
PF1, respectively. Nonionic PAGs presented a melting point around 190oC for both SF3
and SF4. These values are lower to that predicted by the model.
Due to the poor accuracy provided by program predictions, it can be observed that
the models utilized are not that favorable for obtaining boiling and melting points on the
new PAGs. However, vapor pressures values seem to be more accurate, although few
experimental data are available for comparison.
7.4.2. Octanol-Water Partition Coefficient, Water Solubility and Soil Adsorption
Coefficient
Three different parameters were estimated in this section: octanol-water partition
coefficient (Kow), water solubility, and soil organic carbon adsorption coefficient (Koc).
These parameters play a key role in determining the environmental behavior and fate of
chemicals, since they affect their toxicity, bioaccumulation, aqueous solubility and
sorption to soils (Boethling and Mackay 2000).
7.4.2.1. Octanol-Water Partition Coefficient
Due to the surfactant characteristics of PAGs, direct measurement of their
octanol-water partition coefficient is not feasible (Brooke et al. 2004). Log Kow
294
coefficients were estimated using the program KOWWIN from the EPI Suite and then the
effectiveness of the program was estimated by linear regression of chromatography
retention times.
Table 7.5 presents the retention times obtained in the chromatographic study, and
Table 7.6 shows the results obtained for both the software calculations and the
chromatographic regression. SF3 and SF4 Kows were not possible to estimate using
chromatography due to the PAG’s low solubility in water, and their low UV absorbance.
Table 7.5. Chromatographic retention times obtained for the different PAGs.
PAG Retention Time (min) * SF1 2.07 SF2 2.21 PF1 2.86
PFBS 2.87 Lactone PAG 2.98 Sweet PAG 3.75
PFOS 4.09 * Column retention time = 2.0 min
Table 7.6. Estimation of log Kow for the ionic PAGs
Estimation Method SF1 SF2 PF1 SF3 SF4 Lactone
PAG Sweet PAG PFBS PFOS
Software
KOWWIN -2.55 -2.17 0.18 3.84 3.46 -0.06 0.26 0.26 4.13
Chromatography -2.59 -2.14 0.01 NE NE 0.40 2.48 0.04 4.07
NE = Not estimated

fr
om
re
K
S
re
sh
th
d
p
Figure
rom the reten
mitted from
esults obtain
Kow, such as
weet PAG i
etarded the r
hows that th
he ionic PAG
ata obtained
Figure 7.1. Cpredicted by K
e 7.1 compa
ntion time o
m the linear
ned for the
s the size of
is the bigge
retention tim
here is a stron
Gs and the K
d by the softw
Comparison bKOWWIN. (
ares the Kow
obtained from
regression
other new-P
f the molecul
est molecule
me obtained
ng positive c
Kow obtaine
ware modelin
between Log K) PFOS, (
w predicted
m the chrom
calculation
PAGs (Tabl
le, may have
e of all the
with this ex
correlation b
ed by chrom
ng.
Kow values c) PFBS, ( )( ) Sweet PA
by the mod
matographic
due to the
le 7.5). Sinc
e played an
new PAGs
xperiment. O
between the K
matography,
calculated by SF1, ( ) SFAG.
dels and the
experiment.
obvious de
ce, other fac
important ro
studied and
On the other
Kow predict
indicating t
chromatograpF2, ( ) PF1, (
e Kow calcu
Sweet PAG
viation from
ctors beside
ole on this r
d this could
hand, Figur
ted for the re
the quality o
phy vs Log K( ) Lactone P
295
ulated
G was
m the
es the
esult.
have
re 7.1
est of
of the
Kow PAG,
296
Generally speaking new PAGs will not tend to partition into organic matrixes.
This is obvious when Log Kow values of the new PAGs are compared against other
known chemical compounds which tend to do this, i.e. Dioxins (log Kow values between
4.30 and 8.20, (Zheng et al. 2003)) PCBs (log Kow values between 4.09 and 8.18,
(Hawker and Connell 1988)), and PBDEs (log Kow values between 5.47 and 8.27,
(Braekevelt et al. 2003)).
7.4.2.2. Water Solubility
Water solubility is an important property that contributes to determine the
environmental fate of contaminants in the environment. Usually chemicals with a high
solubility will tend to stay in aqueous phase and they present a higher mobility when
compared to less soluble chemicals (Boethling and Mackay 2000).
Two models, part of EPI suite, were used to predict values for water solubility for
commercially available PAGs and the new non-perfluorinated PAGs. WSkow is a
program which calculates the value of water solubility based on the available Kow value
(Meylan and Howard 1995; Meylan et al. 1996). WaterNT, on the other hand, calculates
water solubility by fragment addition (Meylan and Howard 1995).
Table 7.7 shows the predictions obtained from both programs. It is important to
notice that an exact value for experimental water solubility was not obtained for new-
PAGs due to the limited quantity available for experimentation. The third column
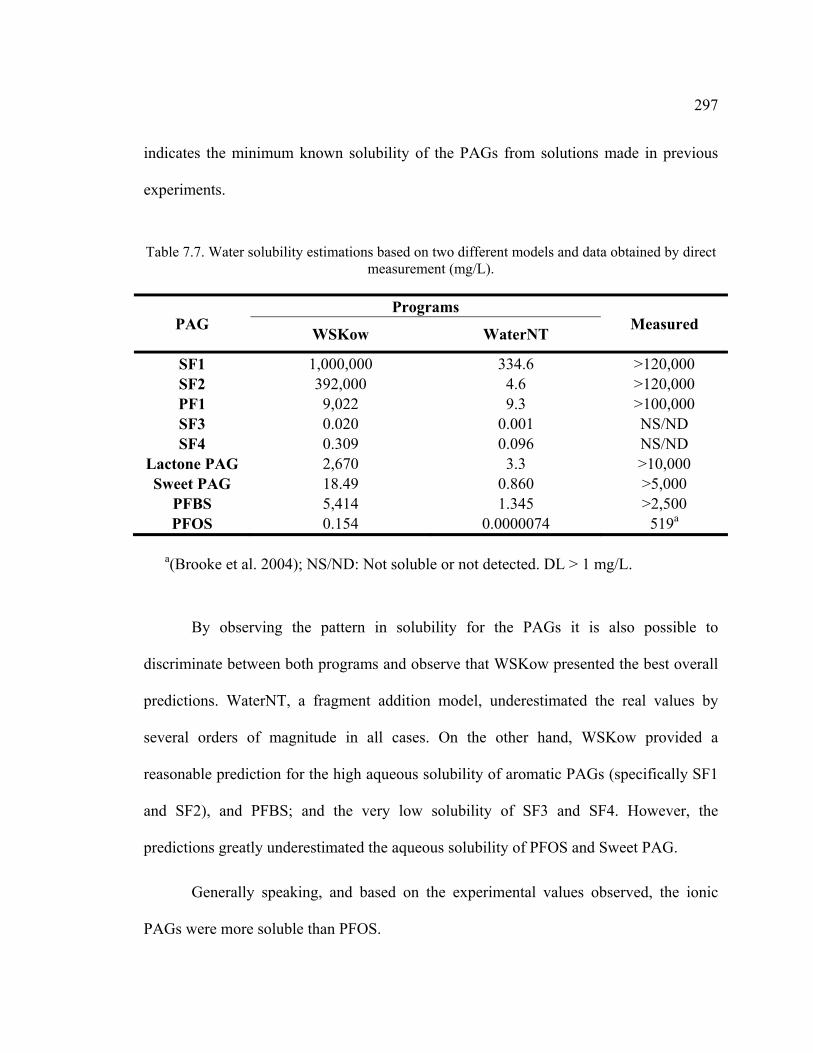
297
indicates the minimum known solubility of the PAGs from solutions made in previous
experiments.
Table 7.7. Water solubility estimations based on two different models and data obtained by direct
measurement (mg/L).
PAG Programs
Measured WSKow WaterNT
SF1 1,000,000 334.6 >120,000 SF2 392,000 4.6 >120,000 PF1 9,022 9.3 >100,000 SF3 0.020 0.001 NS/ND SF4 0.309 0.096 NS/ND
Lactone PAG 2,670 3.3 >10,000 Sweet PAG 18.49 0.860 >5,000
PFBS 5,414 1.345 >2,500 PFOS 0.154 0.0000074 519a
a(Brooke et al. 2004); NS/ND: Not soluble or not detected. DL > 1 mg/L.
By observing the pattern in solubility for the PAGs it is also possible to
discriminate between both programs and observe that WSKow presented the best overall
predictions. WaterNT, a fragment addition model, underestimated the real values by
several orders of magnitude in all cases. On the other hand, WSKow provided a
reasonable prediction for the high aqueous solubility of aromatic PAGs (specifically SF1
and SF2), and PFBS; and the very low solubility of SF3 and SF4. However, the
predictions greatly underestimated the aqueous solubility of PFOS and Sweet PAG.
Generally speaking, and based on the experimental values observed, the ionic
PAGs were more soluble than PFOS.

298
7.4.2.3. Soil Adsorption Coefficient (Koc)
Organic carbon soil adsorption coefficients (Koc) measure the tendency that a
chemical has to partition onto the solid phase when in equilibrium with an aqueous phase.
Usually these coefficients are calculated from isotherm data. However, the values
obtained are dependent on the type of sorbent, or in this case, soil characteristics
(Boethling and Mackay 2000). Electric interactions are important in soils with high
mineral content; minerals present in the soil usually determine the properties of the soil as
sorbent. This is especially true for ionic chemicals which can be attracted or rejected by
positive and negative charges common in soil minerals (Schwarzenbach 2003). However,
it is believed that most of the sorption of hydrophobic organic contaminants (i.e. non-
polar) to soil occurs mainly due to the carbon content present in the soil. This presents a
form to compare the different coefficients that can be calculated experimentally by
normalizing them to the carbon content in the soil (Boethling and Mackay 2000). This
last interaction is the on estimated in this simulation.
The normalized soil sorption coefficients for the PAG compounds were estimated
using the PCKOCWIN program which is part of the EPI Suite (Table 7.8). No
experimental data are available for comparison of the Koc predicted for new-PAGs.
However, experimental data for PFOS and PFBS exists in the literature. PFOS was found
to have Koc values between 37.4 for clay loam and 126 for sandy loam (Ellefson 2001).
The values reported seem to be much lower than predicted by the software simulation
(Table 7.8). This can be explained by the fact that the software simulation calculates
sorption to organic matrixes only and does not take into account sorption to other
299
component of soils like minerals (Meylan et al. 1992) which appear to be implicated on
the sorption of PFOS. The study by Ellefson (2001) showed that PFOS adsorption to soil
seems to increase with mineral content of the soil instead of organic content, this
indicates that electric attraction between mineral charges and PFOS polar head may be of
more importance. PFBS, on the other hand, does not seem to adsorb to soils (NICNAS
2005).
Koc values by definition are normalized to carbon content and, therefore,
adsorption isotherms utilizing for the new PAGs on granular activated carbon (see
Chapter 6), can be used as reference frame for qualitative comparison of these results.
Similarly to the results obtained for the GAC sorption isotherms, Sweet PAG and PFOS
were estimated to have a higher affinity for the soil organic matter than other ionic PAGs
(SF1, SF2, Lactone PAG, and PF1).
As explained previously, sorption of compounds that present both polar and non-
polar characteristics, such as the PAGs considered in this study, onto soil is difficult to
predict based solely on hydrophobic interactions with the organic matter in the soil. Other
specific characteristics of the soils are also to be taken into account.

300
Table 7.8. Koc values estimated for the different PAGs by PCKOCWIN program.
PAG Koc log Koc
SF1
32.28
1.51
SF2 99.20 2.00
PF1 102.30 2.01
SF3 41,880 4.62
SF4 13,630 4.14
Lactone PAG 39.41 1.60
Sweet PAG 519.80 2.72
PFBS 221.60 2.35
PFOS
100,900
5.00
7.4.3. Persistence
Table 7.11 shows the half-life estimated for each PAG in a specific medium, as
well as the amount partitioned into that medium in a default release scenario. A default
release scenario establishes equal amounts of chemical being released in the three media
studied: air, water and soil, then establishing partitions according to the specific partition
coefficient values specific for that chemical. Table 7.12 presents the highest and lowest
overall persistence values obtained for each chemical, as well as the overall persistence
based in the default release scenario. These results indicate that according to the EPA
criteria for persistence all the PAGs will be persistent in the environment (USEPA
1999a). According to these criteria SF1, SF2, PF1 and DPI, would be considered
persistent and an Order/Significant New Use Rule (SNUR) would take effect (Table 7.9).
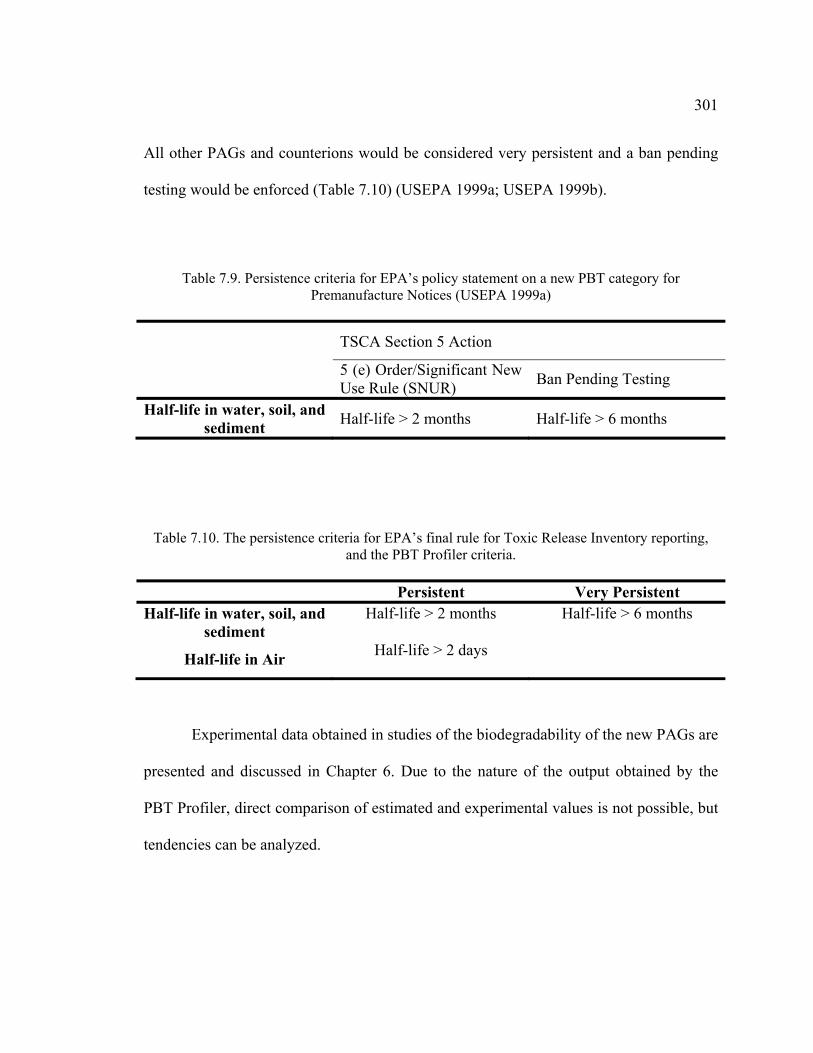
301
All other PAGs and counterions would be considered very persistent and a ban pending
testing would be enforced (Table 7.10) (USEPA 1999a; USEPA 1999b).
Table 7.9. Persistence criteria for EPA’s policy statement on a new PBT category for Premanufacture Notices (USEPA 1999a)
TSCA Section 5 Action
5 (e) Order/Significant New Use Rule (SNUR) Ban Pending Testing
Half-life in water, soil, and sediment Half-life > 2 months Half-life > 6 months
Table 7.10. The persistence criteria for EPA’s final rule for Toxic Release Inventory reporting, and the PBT Profiler criteria.
Persistent Very Persistent
Half-life in water, soil, and sediment
Half-life > 2 months Half-life > 6 months
Half-life in Air Half-life > 2 days
Experimental data obtained in studies of the biodegradability of the new PAGs are
presented and discussed in Chapter 6. Due to the nature of the output obtained by the
PBT Profiler, direct comparison of estimated and experimental values is not possible, but
tendencies can be analyzed.
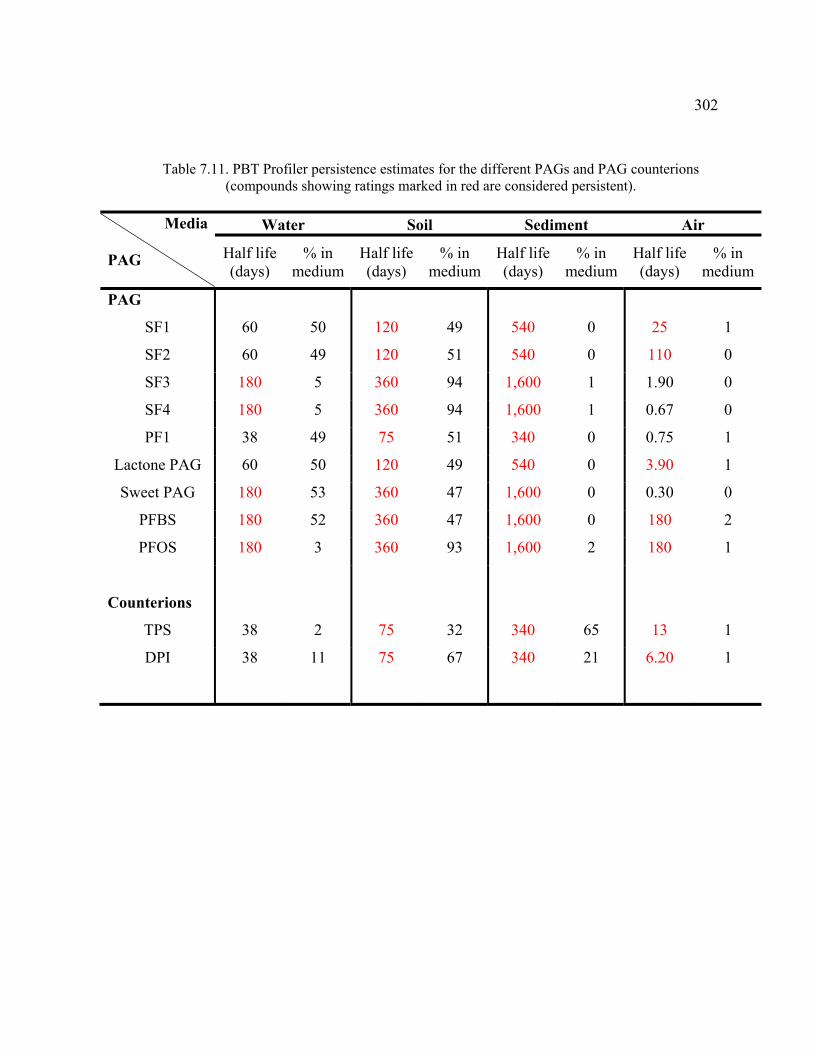
302
Table 7.11. PBT Profiler persistence estimates for the different PAGs and PAG counterions
(compounds showing ratings marked in red are considered persistent).
Media
PAG
Water Soil Sediment Air
Half life (days)
% in medium
Half life (days)
% in medium
Half life (days)
% in medium
Half life (days)
% in medium
PAG
SF1
60
50
120
49
540
0
25
1
SF2 60 49 120 51 540 0 110 0
SF3 180 5 360 94 1,600 1 1.90 0
SF4 180 5 360 94 1,600 1 0.67 0
PF1 38 49 75 51 340 0 0.75 1
Lactone PAG 60 50 120 49 540 0 3.90 1
Sweet PAG 180 53 360 47 1,600 0 0.30 0
PFBS 180 52 360 47 1,600 0 180 2
PFOS 180 3 360 93 1,600 2 180 1
Counterions
TPS
38
2
75
32
340
65
13
1
DPI
38
11
75
67
340
21
6.20
1
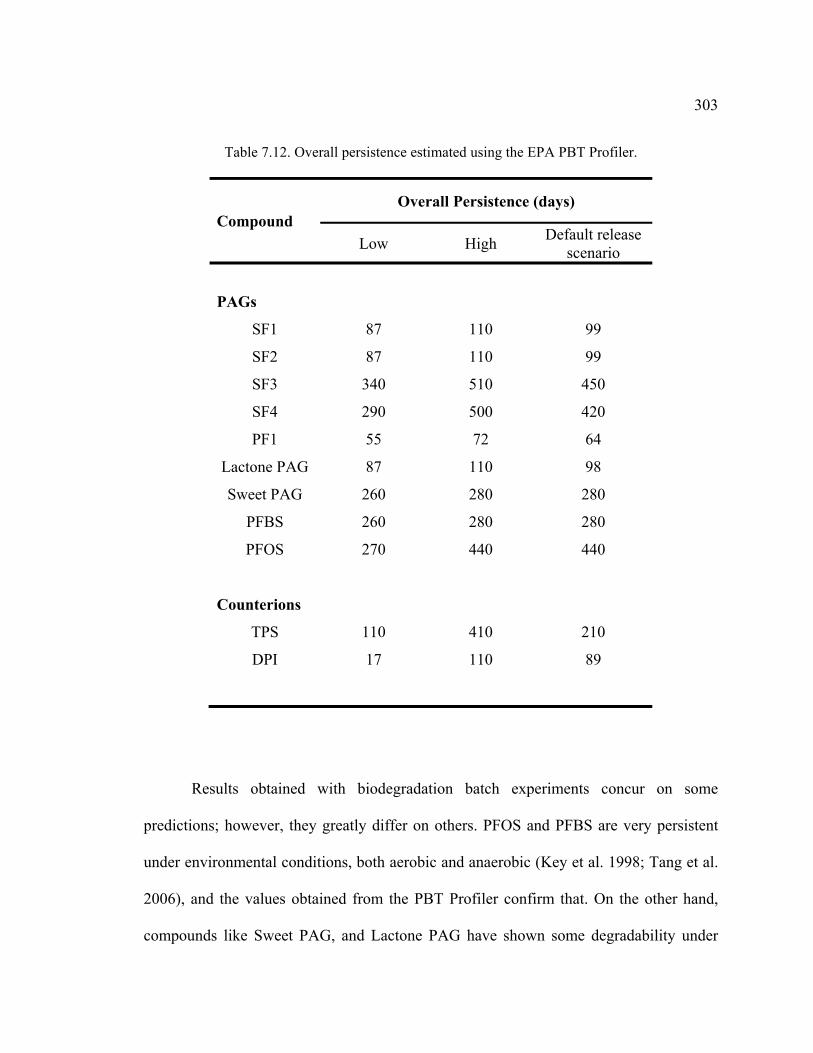
303
Table 7.12. Overall persistence estimated using the EPA PBT Profiler.
Compound Overall Persistence (days)
Low High Default release scenario
PAGs
SF1
87
110
99
SF2 87 110 99
SF3 340 510 450
SF4 290 500 420
PF1 55 72 64
Lactone PAG 87 110 98
Sweet PAG 260 280 280
PFBS 260 280 280
PFOS 270 440 440
Counterions
TPS
110
410
210
DPI
17
110
89
Results obtained with biodegradation batch experiments concur on some
predictions; however, they greatly differ on others. PFOS and PFBS are very persistent
under environmental conditions, both aerobic and anaerobic (Key et al. 1998; Tang et al.
2006), and the values obtained from the PBT Profiler confirm that. On the other hand,
compounds like Sweet PAG, and Lactone PAG have shown some degradability under
304
aerobic conditions (Chapter 6). Lactone PAG and Sweet PAG predictions tend to classify
them as very persistent chemicals; this has been proven inaccurate for both chemicals
according to biodegradation batch experiments presented in the previous chapter.
Another inconsistency comes from the degradation of SF2, for which the PBT Profiler
also attributes the characteristic of persistence. SF2 showed complete biotransformation
under anaerobic conditions (Chapter 6). The PBT Profiler models mostly account for
aerobic degradation, and the anaerobic degradability is calculated by assuming slower
degradation rates. However, it has been proven before, that chemicals that show
recalcitrance under aerobic conditions may be biodegradable under anaerobic conditions.
An example of this behavior are highly halogenated compounds which are non-
biodegradable under aerobic conditions, however present degradation under anaerobic
conditions with a process called reductive dehalogenation (Field and Sierra-Alvarez
2004).
The usefulness of the PBT Profiler to predict persistence for non-perfluorinated
PAGs seems to be poor. It is important to notice that the EPA advices caution when
utilizing the PBT Profiler for screening of perfluorinated chemicals, and surfactants. New
PFOS-Free PAGs, although no perfluorinated, are surfactants. Other models should be
taken into account when modeling and predicting persistence for this kind of compounds.

305
7.4.4. Bioaccumulation
By definition, bioaccumulation is a “progressive increase in the amount of a
substance in an organism or part of an organism which occurs because the rate of intake
exceeds the organism's ability to remove the substance from the body” (IUPAC 1993).
On the other hand, biomagnification refers only to the concentration of a chemical to a
level that exceeds that resulting from its diet (IUPAC 1993). Bioconcentration refers to
the uptake through means, other than diet (Barron 1990), of chemicals that result in a
concentration higher than the surroundings. Bioaccumulation includes both
biomagnification and bioconcentration. In general, chemicals that have the potential to
bioconcentrate also have the potential to bioaccumulate. Since a bioconcentration factor
(BCF) in fish can be readily measured in the laboratory and bioaccumulation is much
more complicated to determine, the BCF is frequently used to predict the importance of
bioaccumulation.
The BCF of each chemical studied were estimated using the PBT Profiler (Table
7.14). Based on EPA’s criteria (Table 7.13), only TPS has the tendency to bioaccumulate.
Table 7.13. Bioaccumulation criteria for EPA’s PBT Profiler.
Bioaccumulative Very Bioaccumulative Bioconcentration factor
(BCF) > = 1,000 > 5,000
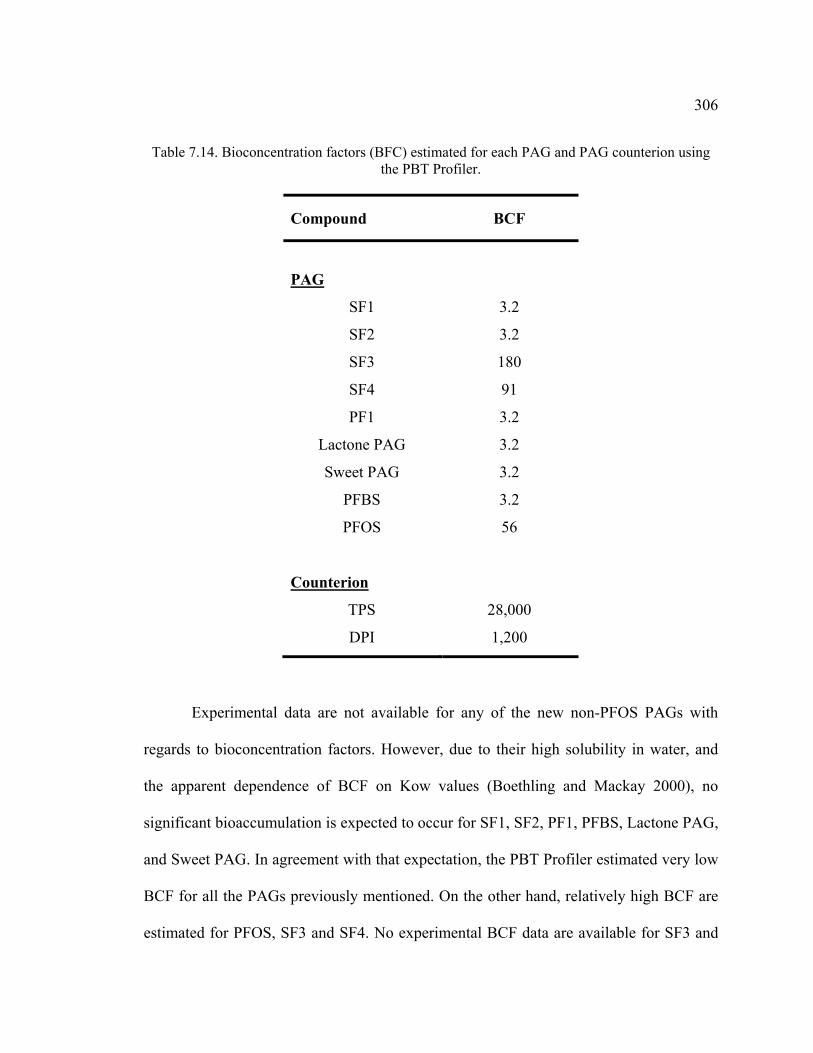
306
Table 7.14. Bioconcentration factors (BFC) estimated for each PAG and PAG counterion using the PBT Profiler.
Compound BCF
PAG
SF1
3.2
SF2 3.2
SF3 180
SF4 91
PF1 3.2
Lactone PAG 3.2
Sweet PAG 3.2
PFBS 3.2
PFOS
Counterion
56
TPS 28,000
DPI 1,200
Experimental data are not available for any of the new non-PFOS PAGs with
regards to bioconcentration factors. However, due to their high solubility in water, and
the apparent dependence of BCF on Kow values (Boethling and Mackay 2000), no
significant bioaccumulation is expected to occur for SF1, SF2, PF1, PFBS, Lactone PAG,
and Sweet PAG. In agreement with that expectation, the PBT Profiler estimated very low
BCF for all the PAGs previously mentioned. On the other hand, relatively high BCF are
estimated for PFOS, SF3 and SF4. No experimental BCF data are available for SF3 and
307
SF4, but due to their physical properties (i.e. non-polar, low water solubility, non-ionic)
they will tend to partition into organic matrixes, and permeate cell membranes, and thus
be bioaccumulative (Boethling and Mackay 2000). On the other hand, although PFOS
does not share some of these characteristics, it has been found to be bioaccumulative
(Giesy and Kannan 2001; Kannan et al. 2001). BCF of up to 2,800 have been measured
experimentally (Brooke et al. 2004). However, the BCF predicted for PFOS is low and
according to the EPA criteria PFOS would not be considered a bioaccumulative chemical
(USEPA 1999a). Underestimation of the BCF of PFOS may be related to the fact that the
PBT Profiler calculates BCF based mostly on physical properties like water solubility and
Kow values, while other mechanisms for bioaccumulation are important as well (protein
binding, metabolism). PFOS has been found to bind to albumin (Poulsen et al. 2005), a
serum blood protein, and this characteristic is not considered in the simulation, which
contributes to the underestimation of the bioaccumulative potential of PFOS. PFBS, on
the other hand, has been found to have lower BCF. In a study, PFBS had a BCF ranging
from 0.113 to 0.272, on Bluegill sunfish (Lepomis machrochirus) (NICNAS 2005).
Martin et al. (2003), in a study with rainbow trout, found that only perfluoroalkyl
sulfonates with chain lengths with more than 4 carbons were detected in the blood serum.
7.4.5. Toxicity
By definition PBT chemicals are those that persist in the environment and have a
tendency to bioaccumulate in animals and humans. This combination of persistence and
308
bioaccumulation presents the probability that any organism may have to be exposed to
considerable levels of the chemical during long periods of time. In other words, they have
chronic exposure which, in turn, leads to chronic toxicity. The PBT Profiler estimates the
fish chronic toxicity value (ChV) of organic chemicals to fish.
Table 7.15 shows the ChV values estimated for each chemical studied. The
criteria used by EPA to establish toxicity is:
• Low concern for values greater than 10 mg/L;
• Moderate concern for values between 10 and 0.1 mg/L; and
• High concern for values lower than 0.1 mg/L.
According to the results obtained by the software (Table 7.15), SF1 and SF2,
would be the less toxic PAGs for fish with values well above the criteria values for EPA.
Although lower concentrations would be needed for PF1, Lactone PAG, Sweet PAG and
PFBs with chronic toxicity values between 1,000 and 1,200 mg/L, the values obtained are
still so much higher than the concern concentrations according to the criteria by EPA.
Only PFOS from the PAGs with a chronic toxicity value for fish of 0.70 mg/L presents a
moderate concern. DPI and TPS counterions presented the lower toxic concentrations
with values below the 0.1 mg/L which is EPA’s criteria for high concern (0.00076 mg/L
for TPS, and 0.077 mg/L for DPI).
Experimental toxicity data determined in our study for the new PAGs were
obtained in acute toxicity assays with microbial and human cells. Mechanisms of acute
toxicity are usually different from those responsible of chronic toxicity. Nevertheless

309
results obtained with the PBT Profiler seem to correlate well with experimental acute
toxicity data.
As discussed in Chapter 6, the counterions DPI and TPS were the most toxic
compounds among those evaluated in most tests, with values of toxicity ranging in the
micromolar range. The IC50 values determined in the MTT assay for DPI and TPS were
12.7 and 59.2 μM, respectively. Similar results were obtained with the Microtox® test.
The PBT Profiler succeeded in predicting the toxicity of these chemicals.
Table 7.15. Chronic toxicity values for fish estimated by EPA’s PBT Profiler.
Compounds Fish ChV (mg/L) PAGs
SF1
190,000
SF2 30,000
SF3 NE
SF4 NE
PF1 1,100
Lactone PAG 1,200
Sweet PAG 1,100
PFBS 1,000
PFOS 0.70
Counterions
TPS
0.00076
DPI
0.077
NE: Not estimated, due to software limitations.
310
Overall prediction of chronic toxicity of the PBT Profiler seems to be accurate
and in very good accordance with observed experimental data. The modeling program
provided a good estimation of chronic toxicity values for fish by PFOS. Reports indicate
not observable effect concentrations (NOEC) values of 0.30 mg/L for fathead minnow
(Brooke et al. 2004), while the PBT Profiler predicts a toxic concentration of 0.70 mg/L.
On the other hand, a study on PFBS showed the low toxicity that this compound presents
with an LD50 to rats higher than 2000 mg/kg bw (body weight) (NICNAS 2005).
Furthermore the study also reports a NOAEL for prolonged exposure (90 days) in rats of
200 mg/kg bw/day (NICNAS 2005). The simulation of this program estimates a chronic
toxicity on fish of 1000 mg/L, and although values of toxicity are not the same among
different species of animals, the software does seem to predict that a concentration much
higher than those usually found in nature would be needed to have a chronic adverse
effect on fish.
SF1 and SF2 were estimated to the least toxic of the new PAGs, which is in
agreement with experimental results obtained in the MTT and Microtox® assays. Other
pattern that was well described with the PBT Profiler occurred with the similar toxicity
values of PF1, Lactone PAG and Sweet PAG. Also, the chronic toxicity estimations for
PF1, Lactone PAG and Sweet PAG were of the same magnitude as was also the case with
the experimental inhibitory concentration determined in the MTT and Microtox® assays
The toxicity estimates provided by the PBT Profiler showed good correlation with
the experimental data obtained for the various PAG compounds studied.
311
7.4.6. Fate of a Chemical in Sewage Treatment Plants
STPWIN is a program part of the EPI Suite that estimates the fate of a chemical in
sewage treatment plants. The fate is evaluated in three different phases, removal by
biodegradation, removal by adsorption to sewage sludge, and removal by volatilization.
Results obtained for both the acid form and the sodium salt form of each PAG are
presented in Table 7.16. Based on results obtained with previous simulations (i.e.
biodegradability), it is no surprising to observe that very low removal rates were
predicted for all the compounds. Biodegradation accounted for very low removal
percentage (0.09-0.72%), and adsorption to sewage sludge accounted for most of the
removal predicted (1.8-89.1%), for both salts and acid forms. As expected, the highest
removal by adsorption were predicted for PAGs with the highest Kow and BCF values,
since they will tend to partition more on organic matrixes like sludge (Schwarzenbach
2003). However, our studies confirmed that Lactone PAG and Sweet PAG undergo
extensive degradation by microorganisms in activated sludge under aerobic conditions
(100% removal) (see Chapter 6). This confirms once again the low precision that the PBT
presents when estimating the biodegradability of these compounds.
Based on its high Kow and BCF values, PFOS should be expected to be largely
adsorbed on sewage sludge. However, experimental results concerning PFOS adsorption
to sludge are contradictory. Up to 95% PFOS was removed by adsorption to sewage
sludge in Ellefson’s study. Ellefson (2001) proposes chemisorptions as the main
mechanism of adsorption of PFOS due to its ionic nature. On the other hand, studies from

312
Ochoa-Herrera and Sierra-Alvarez (2008), showed that PFOS was barely adsorbed to
aerobic activated sludge but found higher removal by adsorption to anaerobic sludge.
Volatilization was not an important mechanism of removal for any of the PAGs
according to the results from the simulation. This is expected since ionic molecules tend
to have very low Henry’s constant, and thus very low volatilization rates should be
observed.
The usefulness of the STPWIN program for estimation of fate of new PAGs on
sewage treatment plants is limited and results should be taken with caution and just as a
screening tool until real data become available from experimentation. This is especially
true when experimental results on biodegradability of some of the new PAGs are taken
into account. Previously it was shown that Lactone PAG and Sweet PAG are effectively
removed with aerobic sewage sludge. The fact that these PAGs are biodegradable, and
more environmentally friendly than PFOS, was not predicted by the software.
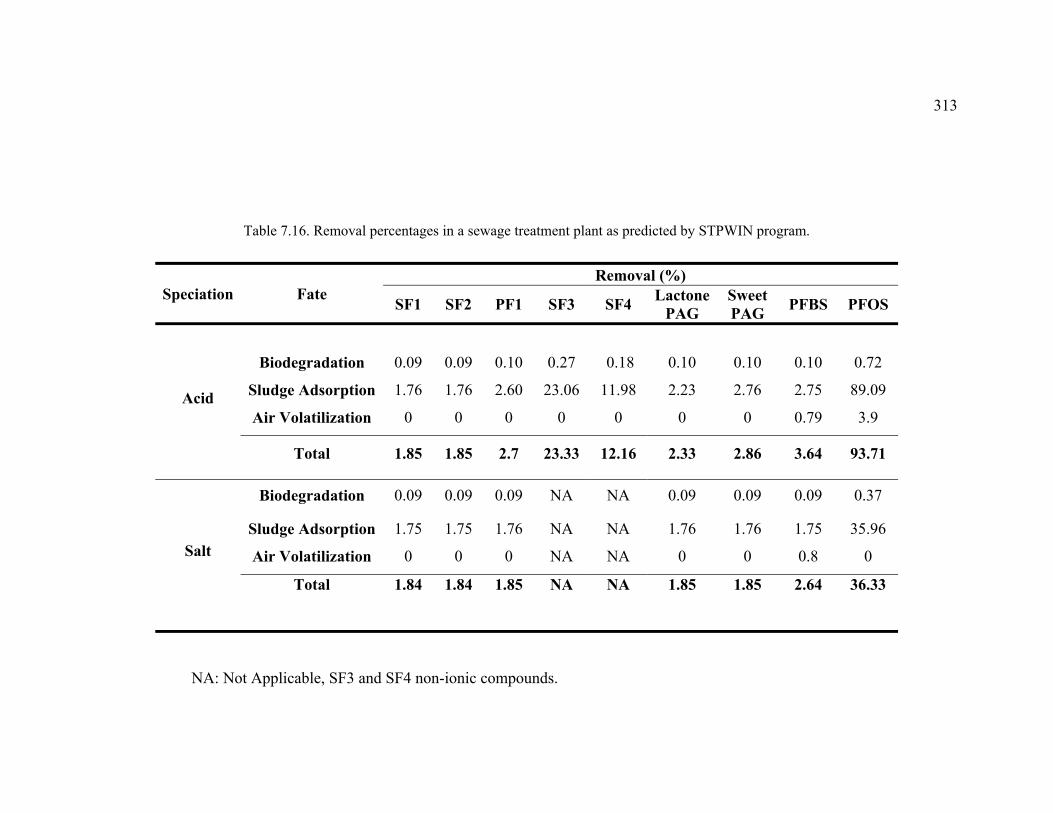
313
Table 7.16. Removal percentages in a sewage treatment plant as predicted by STPWIN program.
Speciation Fate Removal (%)
SF1 SF2 PF1 SF3 SF4 Lactone PAG
Sweet PAG PFBS PFOS
Acid
Biodegradation
0.09
0.09
0.10
0.27
0.18
0.10
0.10
0.10
0.72
Sludge Adsorption 1.76 1.76 2.60 23.06 11.98 2.23 2.76 2.75 89.09
Air Volatilization 0 0 0 0 0 0 0 0.79 3.9
Total 1.85 1.85 2.7 23.33 12.16 2.33 2.86 3.64 93.71
Salt
Biodegradation 0.09 0.09 0.09 NA NA 0.09 0.09 0.09 0.37
Sludge Adsorption 1.75 1.75 1.76 NA NA 1.76 1.76 1.75 35.96
Air Volatilization 0 0 0 NA NA 0 0 0.8 0
Total
1.84
1.84
1.85
NA
NA
1.85
1.85
2.64
36.33
NA: Not Applicable, SF3 and SF4 non-ionic compounds.

314
7.4.7. Overall Performance of the Modeling Software
The performance of the modeling programs utilized in this study, EPI suite and
PBT Profiler, seems to vary depending on the parameter to be evaluated. Improved
models are required to estimate the environmental properties of new PAGs. Although
EPA does not recommend the utilization of these programs for the prediction and
simulation of compounds like PAGs, which are surfactants and highly fluorinated, some
key environmental properties like vapor pressure, water solubility, octanol-water partition
coefficient, and chronic toxicity, were predicted with some accuracy. On the other hand,
biodegradability was not properly estimated and other models are needed.
Some models are developed to satisfy special needs, and a specific model has
been developed to predict biodegradability of fluorinated chemicals. CATABOL is a
metabolic simulator that predicts biodegradability of fluorinated hydrocarbons based on
both expert knowledge and documented metabolic maps (Dimitrov et al. 2004). This
model was designed to model fluorinated compounds and may be better suited for the
study new PAGs.
315
8. CONCLUSIONS
The production of semiconductors presents technological and environmental
challenges. The amount and complexity of the chemical substances utilized in the
manufacturing process has been growing exponentially, and new chemicals are often
introduced to the process and the environment. Two steps of this process play a special
important role in the introduction of new chemical and demand of natural resources:
Chemical Mechanical Planarization (CMP) and photolithography.
Effluents emanating from these processes present a challenge for treatment due to
their complexity. Heavy metals, acids, chelators, surfactants and other chemicals are
found in semiconductor wastewaters. The scope of this study is to evaluate and develop
remediation strategies for the effluents produced in the manufacturing of integrated
circuits.
8.1. Concerning Removal of Copper and Organics from Semiconductor Effluents
CMP is a process were semiconductor wafers are polished for removal of excess
substrate or further addition of circuitry levels. CMP is one of the most water demanding
processes in the industry with 30 to 40% of the total water demanded by the
manufacturing process. The goal of this study is to investigate the feasibility of an
innovative system configuration that combines a seeded crystallization reactor (SCR) and
a sulfate-reducing anaerobic bioreactor (BR) for the simultaneous removal of heavy
metals (copper and nickel) and organic matter (citrate) in a simulated CMP wastewater.
316
Treatment of wastewaters containing citrate as organic contaminant and copper is
feasible by using sulfate reduction in the SCR-BR system. Organic removal efficiencies
above 90%, with a load rate of 6.1 g COD/Lreactor/day and 1.9 g COD/Lreactor/day were
achieved by the system even at copper (II) concentrations in the influent above 75 mg/L.
No significant copper inhibition, when supplied as the only metal to the system,
was observed in the bioreactor. Soluble copper was successfully removed inside the SCR,
avoiding toxicity effects and process failure in the bioreactor.
The system proved to be efficient in removing soluble metals from the water in
the form of metal sulfides precipitates. Specific soluble copper removal efficiencies
around 100% were observed for all the periods in the SCR. When mixed with nickel,
soluble metal removal efficiencies were around 99.8%.
The efficiency of the SCR to remove total metals varied depending on the
conditions. When copper was the sole metal being treated, efficiencies of 100% for
period II, 80% for period IV and 34% for period VI were measured for the crystallization
reactor. The maximum retention capacity of the sand may have been challenged,
affecting the efficiency during period VI. The mechanism for copper removal inside the
crystallization reactor was heterogeneous precipitation. Sand granules successfully served
as nucleation points for copper sulfide. Based on EDS and XRD analyses, covellite was
the main form of copper sulfide found on the sand surface.
However, in the period when simultaneous removal of nickel and copper was
studied, total metal removal efficiencies of 31.3% and 40.6% were observed in the SCR

317
for copper and nickel, respectively. The rest of the metal was retained by the biofilms
inside the BR. Homogeneous nucleation as well as attrition of precipitates on the sand
granules reduced the efficiency of total metal removal in the SCR.
Total metal removal in the sequential system was always above 90% for both
copper only, and mixed copper and nickel conditions. Whenever the SCR retention
capacity efficiency dropped, eroded precipitate fragments were released to the BR where
they were retained, presumably by entrapment in the biofilms inside the BR.
8.2. Concerning the Study of Degradability and Toxicity of Compounds Found in
CMP Wastewaters (Citric Acid and EDTA)
Other important components of semiconductor wastewater are complexing agents
like citrate and ethylenediaminetetraacetic acid (EDTA). The objective of this part of the
study was to evaluate the degradation of citrate with sulfate-reducing and methanogenic
biofilms, as well as, to evaluate the effect that EDTA has in anaerobic microorganisms,
specifically methanogens and sulfate reducing bacteria.
Citric acid was readily degraded under anaerobic conditions by both
methanogenic and sulfate reducing microorganisms, with acetate, and carbon dioxide as
the main products of its degradation. Indirect evidence indicates that hydrogen may have
been a minor intermediate as well. In this experiment the rate of degradation of citrate
ranged from 566 to 720 mg Chemical Oxygen Demand consumed per gram of volatile
suspended solids per day. The rate of citrate degradation was observed to be independent
318
of the sludge utilized, which suggests a common degradation pathway. Acetate, not
citrate, was the main electron donor for sulfate reduction and methanogenesis.
EDTA was found to be toxic to both methanogenic and sulfate-reducing sludge.
Although the range of concentrations that resulted in inhibition for both sludge types
differed by one order of magnitude, with a 50% inhibitory concentration (IC50) of 1.72
mM for sulfate reducers, and an IC50 greater than 40 mM for methanogens.
The inhibitory effect of EDTA on sulfate-reducing bacteria was greatly reduced
by the addition of Ca2+. The results suggest that the calcium-complexed EDTA was less
toxic than non-complexed EDTA, suggesting that the chelating properties of EDTA had
an adverse effect on sulfate reducers.
8.3. Concerning the Evaluation of the Environmental Impact of Newly-Developed
PAGs
Photolithography is an important step in the semiconductor manufacturing. Photo
Acid Generators (PAGs), including PFOS, are an integral part of this process. However,
PFOS has emerged as a priority environmental contaminant due to its recalcitrance and
bioaccumulation. Substitutes for PFOS must be developed for the use in the
semiconductor manufacturing. The objective of this study is to evaluate the
environmental biodegradability and toxicity of a new family of non-perfluorinated PAGs.
New non-perfluorinated PAGs were mostly observed to not have any significant
toxicity in the battery of toxicity tests studied: Mitochondrial Toxicity Test (MTT),

319
Microtox® assay, and methanogenic toxicity test. IC50 values for all PAGs, except
“Sweet” PAG, were greater than 332 μM, a high concentration which is unlikely to be
reached in wastewater or the environment. Sweet PAG, on the other hand, was an
exception and the compound caused 50% methanogenic inhibition at concentrations
ranging 70-162 μM. In stark contrast to most PAGs, the counterions commonly used in
the semiconductor industry, Diphenyliodonium and Triphenylsulfonium, were one or two
orders of magnitude more toxic than most PAGs.
Two of the new non-perfluorinated PAGs, Lactone PAG and Sweet PAG, were
found to be considerably more biodegradable when compared to PFOS and PFBS.
Complete removal of these PAGs was achieved after 15 days, with fluorine
mineralization of 9% for the Lactone PAG, and 17% for the Sweet PAG. The improved
biodegradability is correlated with the structural properties of the new PAGs. The
properties include non-perfluorination and the lack of known recalcitrant functional
groups such as aromatic rings.
Physical treatment of the new PAGs by adsorption to Granular Activated Carbon
(GAC) was shown to have some promise for the removal of these compounds from
wastewater. The length and size of the hydrophobic chain were characteristics that were
found to influence adsorption. Sweet PAG was observed to have the highest affinity for
GAC-adsorption corresponding to the presence of the largest hydrophobic aliphatic
group.
320
Chemical reduction with Zero Valent Iron and Hydrogen at ambient conditions
(30ºC) resulted in low or no removal of most new PAGs. Only SF2, a nitroaromatic PAG,
underwent chemical reduction, leading to the formation of the corresponding amino
compound. Fluorine substituents on aromatic rings seemed to be more prone to limited
reductive cleavage compared to fluorine atoms bound to alkyl chains.
Of all the chemical/physical treatments, Fenton’s reagent presented the most
promising results. Although PFOS and PFBS were not removed by this reaction, Fenton’s
reagent was very efficient in the removal of the new PAGs from aqueous solutions.
Complete fluorine mineralization was observed for SF1 and 50% fluorine mineralization
was achieved for PF1. Oxidative attack led to the formation of low molecular weight
carboxylic compounds. Further research should consider the optimization of the oxidative
treatment to enable the complete mineralization of the new PAGs.
Experimental determination of different environmental properties and study of the
environmental fate of new chemicals can be expensive and time-consuming. Software
modeling presents a fast and cheap option for estimating these properties. The
Persistence-Bioaccumulation-Toxicity (PBT) Profiler and the Estimations Program
Interface (EPI) Suite are two set of programs that can be used to estimate physical and
environmental properties of new chemicals according to their structure. These models
were utilized to predict environmental properties of the new family of PFOS free PAGs.
The results obtained in this study were compared to experimental values to determine the
accuracy of these models.

321
The suitability of the EPI Suite to estimate environmental properties of new PAGs
seems to be limited. Prediction of physical properties by the EPI Suite was accurate for
estimation of vapor pressures, but not for melting or boiling points. Melting and boiling
points were underestimated for all PAGs. The octanol-water partition coefficient (Kow)
is an important parameter to determine the environmental fate of any chemical. This
parameter was estimated using the EPI suite. Although experimental values for Kow
cannot obtained due to surfactant properties of PAGs, predictions seem to be good, as
indicated by the relatively accurate water solubility data estimated using the latter Kow
values.
PBT Profiler was utilized to estimate environmental properties like
biodegradability, bioconcentration, and toxicity, on the new PAGs. While environmental
persistence was not accurately estimated by the PBT Profiler, and bioconcentration
factors appeared to be underestimated, chronic toxicity concentrations seem to be
accurate enough to be utilized as a prediction and screening tool. The performance of the
modeling programs utilized in this study (EPI Suite and PBT Profiler) seems to vary
depending on the parameter to be evaluated. Improved models are required to estimate
the environmental properties of new PAGs.
322
REFERENCES
Abdelouas A, Lutze W, Gong WL, Nuttall EH, Strietelmeier BA, Travis BJ. 2000. Biological reduction of uranium in groundwater and subsurface soil. Science of the Total Environment 250(1-3):21-35.
Acuna-Arguelles ME, Olguin-Lora P, Razo-Flores E. 2003. Toxicity and kinetic
parameters of the aerobic biodegradation of the phenol and alkylphenols by a mixed culture. Biotechnology Letters 25(7):559-564.
Al-Tarazi M, Heesink ABM, Versteeg GF, Azzam MOJ, Azzam K. 2005. Precipitation of
CuS and ZnS in a bubble column reactor. AICHE Journal 51(1):235-246. Alexander M. 1999. Biodegradation and bioremediation. San Diego: Academic Press. Antranikian G, Giffhorn F. 1987. Citrate metabolism in anaerobic-bacteria. Fems
Microbiology Reviews 46(2):175-198. Antranikian G, Gottschalk G. 1989. Phosphorylation of citrate lyase ligase in
Clostridium-sphenoides and regulation of anaerobic citrate metabolism in other bacteria. Biochimie 71(9-10):1029-1037.
APHA. 2005. Standard methods for the examination of water & wastewater. Eaton AD,
Franson MAH, American Public Health A, American Water Works A, Water Environment F, editors. Washington, DC :: American Public Health Association.
Aquino SF, Stuckey DC. 2007. Bioavailability and toxicity of metal nutrients during
anaerobic digestion. Journal of Environmental Engineering-Asce 133(1):28-35. Atkinson R, Carter WPL. 1984. Kinetics and mechanisms of the gas-phase reactions of
ozone with organic-compounds under atmospheric conditions. Chemical Reviews 84(5):437-470.
Austin ME, Kasturi BS, Barber M, Kannan K, MohanKumar PS, MohanKumar SMJ.
2003. Neuroendocrine effects of perfluorooctane sulfonate in rats. Environmental Health Perspectives 111(12):1485-1489.
323
Ayothi R, Chang SW, Felix N, Cao HB, Deng H, Yueh W, Ober CK. 2006. New PFOS free photoresist systems for EUV lithography. Journal of Photopolymer Science and Technology 19(4):515-520.
Ayothi R, Yi Y, Cao HB, Yueh W, Putna S, Ober CK. 2007. Arylonium photoacid
generators containing environmentally compatible aryloxyperfluoroalkanesulfonate groups. Chemistry of Materials 19(6):1434-1444.
Banerjee I, Morse M, Verdiell JM, Docter D. 2005. Materials in semiconductor
processing for high speed circuits: from electrical to optical circuits. IEE Proceedings-Circuits Devices and Systems 152(5):523-526.
Barret RH, Selwyn MJ. 1976. Effects of triphenylsulfonium ions on mitochondria -
inhibition of adenosine-triphosphatase activity. Biochemical Journal 156(2):315.322.
Barron MG. 1990. Bioconcentration. Environmental Science & Technology 24(11):1612-
1618. Battaglia-Brunet F, Foucher S, Denamur A, Ignatiadis I, Michel C, Morin D. 2002.
Reduction of chromate by fixed films of sulfate-reducing bacteria using hydrogen as an electron source. Journal of Industrial Microbiology & Biotechnology 28(3):154-159.
Benjamin MM. 2002. Water chemistry. Tchobanoglous G, editor. Boston: McGraw Hill. Berthiaume J, Wallace KB. 2002. Perfluorooctanoate, perflourooctanesulfonate, and N-
ethyl perfluorooctanesulfonamido ethanol; peroxisome proliferation and mitochondrial biogenesis. Toxicology Letters 129(1-2):23-32.
Bhagat M, Burgess JE, Antunes APM, Whiteley CG, Duncan JR. 2004. Precipitation of
mixed metal residues from wastewater utilising biogenic sulphide. Minerals Engineering 17(7-8):925-932.
Bhattacharya SK, Uberoi V, Dronamraju MM. 1996. Interaction between acetate fed
sulfate reducers and methanogens. Water Research 30(10):2239-2246.
324
Bielefeldt AR, Stensel HD. 1999. Biodegradation of aromatic compounds and TCE by a filamentous bacteria-dominated consortium. Biodegradation 10(1):1-13.
Boethling RS, Howard PH, Meylan W, Stiteler W, Beauman J, Tirado N. 1994. Group-
contribution method for predicting probability and rate of aerobic biodegradation. Environmental Science & Technology 28(3):459-465.
Boethling RS, Mackay D. 2000. Handbook of property estimation methods for
environmental chemicals : environmental and health sciences Boethling RS, Mackay D, editors. Boca Raton: Lewis Publishers.
Bott M. 1997. Anaerobic citrate metabolism and its regulation in enterobacteria. Archives
of Microbiology 167(2-3):78-88. Bott M, Meyer M, Dimroth P. 1995. Regulation of anaerobic citrate metabolism in
Klebsiella-pneumoniae. Molecular Microbiology 18(3):533-546. Braekevelt E, Tittlemier SA, Tomy GT. 2003. Direct measurement of octanol-water
partition coefficients of some environmentally relevant brominated diphenyl ether congeners. Chemosphere 51(7):563-567.
Breznak JA, Kane MD. 1990. Microbial H2/CO2 Acetogenesis in Animal Guts - Nature
and Nutritional Significance. Fems Microbiology Reviews 87(3-4):309-313. Brooke D, Footitt A, Nwaogu TA. 2004. Environmental Risk Evaluation Report:
Perfluorooctanesulphonate (PFOS). Wallingford, OX: Building Research Establishment Ltd, Risk and Policy Analists Ltd, Environment Agency.
Brul S, Coote P. 1999. Preservative agents in foods - Mode of action and microbial
resistance mechanisms. International Journal of Food Microbiology 50(1-2):1-17. Calafat AM, Kuklenyik Z, Caudill SP, Reidy JA, Needham LL. 2006. Perfluorochemicals
in pooled serum samples from United States residents in 2001 and 2002. Environmental Science & Technology 40(7):2128-2134.
Carter KE, Farrell J. 2008. Oxidative destruction of perfluorooctane sulfonate using
boron-doped diamond film electrodes. Environmental Science & Technology 42(16):6111-6115.
325
Chamarro E, Marco A, Esplugas S. 2001. Use of Fenton reagent to improve organic chemical biodegradability. Water Research 35(4):1047-1051.
Charerntanyarak L. 1999. Heavy metals removal by chemical coagulation and
precipitation. Water Science and Technology 39(10-11):135-138. Chen JH, Huang CE. 2007. Selective separation of Cu and Zn in the citric acid leachate
of industrial printed wiring board sludge by D(2)EHPA-modified Amberlite XAD-4 resin. Industrial & Engineering Chemistry Research 46(22):7231-7238.
Choi JY, Kim DS, Lim JY. 2006. Fundamental features of copper ion precipitation using
sulfide as a precipitant in a wastewater system. Journal of Environmental Science and Health Part a-Toxic/Hazardous Substances & Environmental Engineering 41(6):1155-1172.
Cobos-Vasconcelos DDL, Santoyo-Tepole F, Juarez-Ramirez C, Ruiz-Ordaz N,
Galindez-Mayer CJJ. 2006. Cometabolic degradation of chlorophenols by a strain of Burkholderia in fed-batch culture. Enzyme and Microbial Technology 40(1):57-60.
Colleran E, Finnegan S, Lens P. 1995. Anaerobic treatment of sulfate-containing waste streams. Antonie van Leeuwenhoek 67(29-46).
Dahl C, Truper HG. 2001. Sulfite reductase and APS reductase from Archaeoglobus
fulgidus. Hyperthermophilic Enzymes, Pt B. p 427-441. Dezwart D, Slooff W. 1983. The Microtox as an alternative assay in the acute toxicity
assessment of water pollutants. Aquatic Toxicology 4(2):129-138. Dimitrov S, Kamenska V, Walker JD, Windle W, Purdy R, Lewis M, Mekenyan O. 2004.
Predicting the biodegradation products of perfluorinated chemicals using CATABOL. Sar and Qsar in Environmental Research 15(1):69-82.
Dinglasan MJA, Ye Y, Edwards EA, Mabury SA. 2004. Fluorotelomer alcohol
biodegradation yields poly- and perfluorinated acids. Environmental Science & Technology 38(10):2857-2864.
Dobbs RA, Cohen JM. 1980. Carbon adsorption isotherm of toxic organics. EPA-600/8-
80-023, U.S. Environmental Protection Agency. Report nr EPA-600/8-80-023.

326
Dolfing J. 1988. Acetogenesis. In: Zehnder AJB, editor. Biology of Anaerobic
Microorganisms. New York: John Wiley & Sons. p 417-468. Eccles H. 1999. Treatment of metal-contaminated wastes: why select a biological
process? Trends in Biotechnology 17(12):462-465. Eckenfelder WW. 2000. Industrial water pollution control / W. Wesley Eckenfelder, Jr.
Boston: McGraw-Hill. El Bayoumy M, Bewtra JK, Ali HI, Biswas T. 1999. Removal of heavy metals and cod
by SRB in UAFF reactor. Journal of Environmental Engineering-Asce 125(6):532-539.
Ellefson MD. 2001. Soil adsorption/desorption study of potassium
perfluorooctanesulfonate (PFOS). 3M. Report nr E00-1311. Emanuelsson MAE, Henriques IS, Jorge RMF, Castro PML. 2006. Biodegradation of 2-
fluorobenzoate in upflow fixed bed bioreactors operated with different growth support materials. Journal of Chemical Technology and Biotechnology 81(9):1577-1585.
Fang HHP. 1997. Inhibition of bioactivity of UASB biogranules by electroplating metals.
Pure and Applied Chemistry 69(11):2425-2429. Ferreira MIM, Marchesi JR, Janssen DB. 2008. Degradation of 4-fluorophenol by
Arthrobacter sp strain IF1. Applied Microbiology and Biotechnology 78(4):709-717.
Fetzner S. 1998. Bacterial dehalogenation. Applied Microbiology and Biotechnology
50(6):633-657. Field JA, Sierra-Alvarez R. 2004. Biodegradability of chlorinated solvents and related
chlorinated aliphatic compounds. Re/views in Environmental Science and Bio/Technology 3(3):185-254.
Field JA, Stams AJM, Kato M, Schraa G. 1995. Enhanced biodegradation of aromatic
pollutants in cocultures of anaerobic and aerobic bacterial consortia. Antonie Van

327
Leeuwenhoek International Journal of General and Molecular Microbiology 67(1):47-77.
Finizio A, Diguardo A, Arnoldi A, Vighi M, Fanelli R. 1991. Different approaches for
the evaluation of Kow for s-triazine herbicides. Chemosphere 23(6):801-812. Foucher S, Battaglia-Brunet F, Ignatiadis I, Morin D. 2001. Treatment by sulfate-
reducing bacteria of Chessy acid-mine drainage and metals recovery. Chemical Engineering Science 56(4):1639-1645.
Francis AJ, Dodge CJ, Gillow JB. 1992. Biodegradation of metal citrate complexes and
implications for toxic-metal mobility. Nature 356(6365):140-142. Fritz G, Buchert T, Huber H, Stetter KO, Kroneck PMH. 2000. Adenylylsulfate
reductases from archaea and bacteria are 1 : 1 alpha beta-heterodimeric iron-sulfur flavoenzymes - high similarity of molecular properties emphasizes their central role in sulfur metabolism. Febs Letters 473(1):63-66.
Gadd GM. 1990. Biosorption. Chemistry & Industry (13):421-426. Gadd GM. 2000. Bioremedial potential of microbial mechanisms of metal mobilization
and immobilization. Current Opinion in Biotechnology 11(3):271-279. Gamez VM, Sierra-Alvarez R, Waltz RJ, Field JA. 2008. Anaerobic degradation of
citrate under sulfate reducing and methanogenic conditions. Biodegradation. Gavel OY, Bursakov SA, Calvete JJ, George GN, Moura JJG, Moura I. 1998. ATP
sulfurylases from sulfate-reducing bacteria of the genus Desulfovibrio. A novel metalloprotein containing cobalt and zinc. Biochemistry 37(46):16225-16232.
Gerami-Nejad M, Stretton RJ. 1981. Aspects of the antibacterial action of
diphenyliodonium chloride. Microbios 30(120):97-107. Giesy JP, Kannan K. 2001. Global distribution of perfluorooctane sulfonate in wildlife.
Environmental Science & Technology 35(7):1339-1342. Golden JH, Small R, Pagan L, Shang C, Raghavan S. 2000. Evaluating and treating CMP
wastewater. Semiconductor International 23:85-98.
328
Gorontzy T, Kuver J, Blotevogel KH. 1993. Microbial transformation of nitroaromatic
compounds under anaerobic conditions. Journal of General Microbiology 139:1331-1336.
Gorrell TE, Uffen RL. 1977. Fermentative metabolism of pyruvate by Rhodospirillum-
rubrum after anaerobic growth in darkness. Journal of Bacteriology 131(2):533-543.
Hagen DF, Belisle J, Johnson JD, Venkateswarlu P. 1981. Characterization of fluorinated
metabolites by a gas chromatographic-helium microwave plasma detector - the biotransformation of 1h,1h,2h,2h-perfluorodecanol to perfluorooctanoate. Analytical Biochemistry 118(2):336-343.
Hammack RW, Edenborn HM, Dvorak DH. 1994. Treatment of water from an open-pit
copper mine using biogenic sulfide and limestone - a feasibility study. Water Research 28(11):2321-2329.
Hartel U, Buckel W. 1996. Fermentation of trans-aconitate via citrate, oxaloacetate, and
pyruvate by Acidaminococcus fermentans. Archives of Microbiology 166(5):342-349.
Hawker DW, Connell DW. 1988. Octanol water partition-coefficients of polychlorinated
biphenyl congeners. Environmental Science & Technology 22(4):382-387. Hekster FM, Laane R, de Voogt P. 2003. Environmental and toxicity effects of
perfluoroalkylated substances. Reviews of Environmental Contamination and Toxicology, Vol 179. p 99-121.
Helander IM, vonWright A, MattilaSandholm TM. 1997. Potential of lactic acid bacteria
and novel antimicrobials against gram-negative bacteria. Trends in Food Science & Technology 8(5):146-150.
Henneken L, Nortemann B, Hempel DC. 1995. Influence of physiological conditions on
EDTA degradation. Applied Microbiology and Biotechnology 44(1-2):190-197. Hollingsworth J. 2004. MS thesis. University of Arizona. October 2004.
329
Hollingsworth J, Sierra-Alvarez R, Zhou M, Ogden KL, Field JA. 2005. Anaerobic biodegradability and methanogenic toxicity of key constituents in copper chemical mechanical planarization effluents of the semiconductor industry. Chemosphere 59(9):1219-1228.
Hori H, Nagaoka Y, Sano T, Kutsuna S. 2008. Iron-induced decomposition of
perfluorohexanesulfonate in sub- and supercritical water. Chemosphere 70(5):800-806.
Hori H, Nagaoka Y, Yamamoto A, Sano T, Yamashita N, Taniyasu S, Kutsuna S, Osaka
I, Arakawa R. 2006. Efficient decomposition of environmentally persistent perfluorooctanesulfonate and related fluorochemicals using zerovalent iron in subcritical water. Environmental Science & Technology 40(3):1049-1054.
Hu H. 1998. Heavy metal poisoning. In: Fauci A, Braunwald E, Isselbacher K, Wilson J,
Martin J, Kasper D, Hauser S, Longo D, editors. Harrison's Principles of Internal Medicine. 14th ed. New York, NY: McGraw-Hill. p 2564-2569.
Hu WY, Jones PD, Upham BL, Trosko JE, Lau C, Giesy JP. 2002. Inhibition of gap
junctional intercellular communication by perfluorinated compounds in rat liver and dolphin kidney epithelial cell lines in vitro and sprague-dawley rats in vivo. Toxicological Sciences 68(2):429-436.
Hugenholtz J. 1993. Citrate metabolism in lactic-acid bacteria. Fems Microbiology
Reviews 12(1-3):165-178. Hulshoff Pol LW, Lens PNL, Stams AJM, Lettinga G. 1998. Anaerobic treatment of
sulphate-rich wastewaters. Biodegradation 9(3-4):213-224. Hulshoff Pol LWH, Lens PNL, Weijma J, Stams AJM. 2001. New developments in
reactor and process technology for sulfate reduction. Water Science and Technology 44(8):67-76.
IUPAC. 1993. Glossary for chemists of terms used in toxicology. Pure and Applied
Chemistry 65(9):2003-2122.
330
Janssen DB, Dinkla IJT, Poelarends GJ, Terpstra P. 2005. Bacterial degradation of xenobiotic compounds: evolution and distribution of novel enzyme activities. Environmental Microbiology 7(12):1868-1882.
Jenkins BV, Myers CW, Lesiak S, Viscomi R. 2004. The many options for managing
CMP wastewater. Solid State Technology 47(7):61-62, 64, 66, 134. Jensen AA, Leffers H. 2008. Emerging endocrine disrupters: perfluoroalkylated
substances. International Journal of Andrology 31(2):161-169. Jin PK, Bhattacharya SK, Williams CJ, Zhang HN. 1998. Effects of sulfide addition on
copper inhibition in methanogenic systems. Water Research 32(4):977-988. Jong T, Parry DL. 2003. Removal of sulfate and heavy metals by sulfate reducing
bacteria in short-term bench scale upflow anaerobic packed bed reactor runs. Water Research 37(14):3379-3389.
Juang RS, Kao HC, Chen W. 2006. Column removal of Ni(II) from synthetic
electroplating waste water using a strong-acid resin. Separation and Purification Technology 49(1):36-42.
Kaksonen AH. 2004. The performance, kinetics and microbiology of sulfidogenic
fluidized-bed reactors treating acidic metal- and sulfate-containing wastewater. Tampere, Finland: Tampere University of Technology.
Kannan K, Corsolini S, Falandysz J, Fillmann G, Kumar KS, Loganathan BG, Mohd
MA, Olivero J, Van Wouwe N, Yang JH and others. 2004. Perfluorooctanesulfonate and related fluorochemicals in human blood from several countries. Environmental Science & Technology 38(17):4489-4495.
Kannan K, Koistinen J, Beckmen K, Evans T, Gorzelany JF, Hansen KJ, Jones PD, Helle
E, Nyman M, Giesy JP. 2001. Accumulation of perfluorooctane sulfonate in marine mammals. Environmental Science & Technology 35(8):1593-1598.
Kari FG, Giger W. 1996. Speciation and fate of ethylenediaminetetraacetate (EDTA) in
municipal wastewater treatment. Water Research 30(1):122-134.
331
Karri S, Sierra-Alvarez R, Field JA. 2006. Toxicity of copper to acetoclastic and hydrogenotrophic activities of methanogens and sulfate reducers in anaerobic sludge. Chemosphere 62(1):121-127.
Keum YS, Li QX. 2004. Reduction of nitroaromatic pesticides with zero-valent iron.
Chemosphere 54(3):255-263. Key BD, Howell RD, Criddle CS. 1997. Fluorinated organics in the biosphere.
Environmental Science & Technology 31(9):2445-2454. Key BD, Howell RD, Criddle CS. 1998. Defluorination of organofluorine sulfur
compounds by Pseudomonas sp. strain D2. Environmental Science & Technology 32(15):2283-2287.
Lai CL, Lin SH. 2003. Electrocoagulation of chemical mechanical polishing (CMP)
wastewater from semiconductor fabrication. Chemical Engineering Journal 95(1-3):205-211.
Lanigan R, Yamarik T. 2002. Final report on the safety assessment of EDTA, calcium
disodium EDTA, diammonium EDTA, dipotassium EDTA, disodium EDTA, TEA-EDTA, tetrasodium EDTA, tripotassium EDTA, trisodium EDTA, HEDTA, and trisodium HEDTA. International Journal of Toxicology 21(5 supp 2):95 - 142.
Lanouette KH. 1977. Heavy-metals removal. Chemical Engineering 84(22):73-&. Lau C, Anitole K, Hodes C, Lai D, Pfahles-Hutchens A, Seed J. 2007. Perfluoroalkyl
acids: A review of monitoring and toxicological findings. Toxicological Sciences 99(2):366-394.
Lay JJ, Li YY, Noike T, Endo J, Ishimoto S. 1997. Analysis of environmental factors
affecting methane production from high-solids organic waste. Water Science and Technology 36(6-7):493-500.
Lee EY, Jun YS, Cho KS, Ryu HW. 2002. Degradation characteristics of toluene,
benzene, ethylbenzene, and xylene by Stenotrophomonas maltophilia T3-c. Journal of the Air & Waste Management Association 52(4):400-406.
332
Lens P, Vallero M, Esposito G, Zandvoort M. 2003. Perspectives of sulfate reducing bioreactors in environmental biotechnology. Re/views in Environmental Science and Bio/Technology 1(4):311-325.
Lens PNL, Visser A, Janssen AJH, Pol LWH, Lettinga G. 1998. Biotechnological
treatment of sulfate-rich wastewaters. Critical Reviews in Environmental Science and Technology 28(1):41-88.
Lewis A, Swartbooi A. 2006. Factors affecting metal removal in mixed sulfide
precipitation. Chemical Engineering & Technology 29(2):277-280. Lin SH, Yang CR. 2004. Chemical and physical treatments of chemical mechanical
polishing wastewater from semiconductor fabrication. Journal of Hazardous Materials 108(1-2):103-109.
Liu SQ. 2003. Practical implications of lactate and pyruvate metabolism by lactic acid
bacteria in food and beverage fermentations. International Journal of Food Microbiology 83(2):115-131.
Liu W, Chen S, Quan X, Jin YH. 2008. Toxic effect of serial perfluorosulfonic and
perfluorocarboxylic acids on the membrane system of a freshwater alga measured by flow cytometry. Environmental Toxicology and Chemistry 27(7):1597-1604.
Liu YB, Peterson DA, Kimura H, Schubert D. 1997. Mechanism of cellular 3-(4,5-
dimethylthiazol-2-yl)-2,5-diphenyltetrazolium bromide (MTT) reduction. Journal of Neurochemistry 69(2):581-593.
Lloyd JR. 2003. Microbial reduction of metals and radionuclides. Fems Microbiology
Reviews 27(2-3):411-425. Lloyd JR, Lovley DR. 2001. Microbial detoxification of metals and radionuclides.
Current Opinion in Biotechnology 12(3):248-253. Lovley DR. 2000. Environmental microbe-metal interactions. Washington, D.C.: ASM
Press. Lovley DR, Coates JD. 1997. Bioremediation of metal contamination. Current Opinion in
Biotechnology 8(3):285-289.
333
Lyman WJ, Reehl WF, Rosendblatt DH. 1990. Handbook of chemical property
estimation methods. Washington, DC: American Chemical Society. Maag B, Boning D, Voelker B. 2000. Assessing the environmental impact of copper
CMP. Semiconductor International 23(12):101-102,108,110,112,114. Mackay D, Paterson S, Shiu WY. 1992. Generic models for evaluating the regional fate
of chemicals. Chemosphere 24(6):695-717. Madigan MT, Martinko JM, Parker J. 2003a. Prokaryotic diversity: the Archaea. In:
Madigan MT, Martinko JM, Parker J, editors. Brock Biology of Microorganisms. 10th ed: Prentice Hall. p 396-399.
Madigan MT, Martinko JM, Parker J. 2003b. Sulfate- and sulfur-reducing proteobacteria.
In: Madigan MT, Martinko JM, Parker J, editors. Brock Biology of Microorganisms. 10th ed: Prentice Hall. p 396-399.
Madigan MT, Martinko JM, Parker J. 2003c. Sulfate reduction. In: Madigan MT,
Martinko JM, Parker J, editors. Brock Biology of Microorganisms: Prentice Hall. p 579-581.
Maketon W, Zenner CZ, Ogden KL. 2008. Removal efficiency and binding mechanisms
of copper and copper-EDTA complexes using polyethyleneimine. Environmental Science & Technology 42(6):2124-2129.
Martin JW, Mabury SA, Solomon KR, Muir DCG. 2003. Bioconcentration and tissue
distribution of perfluorinated acids in rainbow trout (Oncorhynchus mykiss). Environmental Toxicology and Chemistry 22(1):196-204.
Medvedeva SE. 1999. Transfer of xenobiotics through cell membranes of luminous
bacteria. Luminescence 14(5):267-270. Meesters RJW, Schroder HF. 2004. Perfluorooctane sulfonate - a quite mobile anionic
anthropogenic surfactant, ubiquitously found in the environment. Water Science and Technology 50(5):235-242.

334
Mendicino L, Brown PT. 1998. The environment, health and safety side of copper metalization. Semiconductor International 21(6):105-106,108,110.
Mersmann A. 1999. Crystallization and precipitation. Chemical Engineering and
Processing 38:345-353. Metcalf, Eddy. 2003. Wastewater engineering: treatment and reuse. Tchobanoglous G,
editor. New York, NY: Mc Graw Hill. Meylan W, Howard PH, Boethling RS. 1992. Molecular Topology Fragment
Contribution Method for Predicting Soil Sorption Coefficients. Environmental Science & Technology 26(8):1560-1567.
Meylan WM, Howard PH. 1991. Bond contribution method for estimating Henrys law
constants. Environmental Toxicology and Chemistry 10(10):1283-1293. Meylan WM, Howard PH. 1993. Computer estimation of the atmospheric gas-phase
reaction-rate of organic-compounds with hydroxyl radicals and ozone. Chemosphere 26(12):2293-2299.
Meylan WM, Howard PH. 1995. Atom fragment contribution method for estimating
octanol-water partition-coefficients. Journal of Pharmaceutical Sciences 84(1):83-92.
Meylan WM, Howard PH, Boethling RS. 1996. Improved method for estimating water
solubility from octanol water partition coefficient. Environmental Toxicology and Chemistry 15(2):100-106.
Meylan WM, Howard PH, Boethling RS, Aronson D, Printup H, Gouchie S. 1999.
Improved method for estimating bioconcentration/bioaccumulation factor from octanol/water partition coefficient. Environmental Toxicology and Chemistry 18(4):664-672.
Moriwaki H, Takagi Y, Tanaka M, Tsuruho K, Okitsu K, Maeda Y. 2005. Sonochemical
decomposition of perfluorooctane sulfonate and perfluorooctanoic acid. Environmental Science & Technology 39(9):3388-3392.
335
Mosmann T. 1983. Rapid colorimetric assay for cellular growth and survival - application to proliferation and cyto-toxicity assays. Journal of Immunological Methods 65(1-2):55-63.
Mullin JW, editor. 2001. Crystallization. 4th ed. Boston: Butterworth-Heinemann. 594 p. Nacci D, Jackim E, Walsh R. 1986. Comparative-evaluation of 3 rapid marine toxicity
tests - sea-urchin early embryo growth test, sea-urchin sperm cell toxicity test and Microtox. Environmental Toxicology and Chemistry 5(6):521-525.
Neyens E, Baeyens J. 2003. A review of classic Fenton's peroxidation as an advanced
oxidation technique. Journal of Hazardous Materials 98(1-3):33-50. NICNAS. 2005. Potassium perfluorobutane sulfonate. In: Ageing DoHa, editor:
Australian Government. Nortemann B. 1999. Biodegradation of EDTA. Applied Microbiology and Biotechnology
51(6):751-759. Nowack B, Xue HB, Sigg L. 1997. Influence of natural and anthropogenic ligands on
metal transport during infiltration of river water to groundwater. Environmental Science & Technology 31(3):866-872.
Ochoa-Herrera V, Sierra-Alvarez R. 2008. Removal of perfluorinated surfactants by
sorption onto granular activated carbon, zeolite and sludge. Chemosphere 72(10):1588-1593.
Ochoa-Herrera V, Sierra-Alvarez R, Somogyi A, Jacobsen N, Wysocki V, Field J. 2008.
Reductive defluorination of perfluorooctane sulfonate. Environmental Science & Technology 42(9):3260-3264.
Odonnell VB, Tew DG, Jones OTG, England PJ. 1993. Studies on the inhibitory
mechanism of iodonium compounds with special reference to neutrophil nadph oxidase. Biochemical Journal 290:41-49.
Oleszkiewicz JA, Marstaller T, McCartney DM. 1989. Effects of pH on sulfide toxicity
to anaerobic processes. Environmental Technology Letters 10(9):815-822.
336
Omil F, Lens P, Pol LH, Lettinga G. 1996. Effect of upward velocity and sulphide concentration on volatile fatty acid degradation in a sulphidogenic granular sludge reactor. Process Biochemistry 31(7):699-710.
Oude Elferink S, Visser A, Hulshoff Pol LW, Stams AJM. 1994. Sulfate reduction in
methanogenic bioreactors. Fems Microbiology Reviews 15(2-3):119-136. Parsons JR, Saez M, Dolfing J, de Voogt P. 2008. Biodegradation of Perfluorinated
Compounds. Reviews of Environmental Contamination and Toxicology, Vol 196. p 53-71.
Peters RW, Ku Y, Boardman GD, Walker TJ, Hoffman CP, Chang TK, Parks JT. 1984.
Wastewater-treatment - physical and chemical methods. Journal Water Pollution Control Federation 56(6):553-568.
Poulsen PB, Jensen AA, Wallstrom E. 2005. More environmentally friendly alternatives
to PFOS-compounds and PFOA. In: Agency DEP, editor: Danish Ministry of the Environment.
Prinn R, Cunnold D, Simmonds P, Alyea F, Boldi R, Crawford A, Fraser P, Gutzler D,
Hartley D, Rosen R and others. 1992. Global average concentration and trend for hydroxyl radicals deduced from ale gauge trichloroethane (methyl chloroform) data for 1978-1990. Journal of Geophysical Research-Atmospheres 97(D2):2445-2461.
Quan ZX, La HJ, Cho YG, Hwang MH, Kim IS, Lee ST. 2003. Treatment of metal-
contaminated water and vertical distribution of metal precipitates in an upflow anaerobic bioreactor. Environmental Technology 24(3):369-376.
Ram MS, Singh L, Suryanarayana MVS, Alam SI. 2000. Effect of iron, nickel and cobalt
on bacterial activity and dynamics during anaerobic oxidation of organic matter. Water Air and Soil Pollution 117(1-4):305-312.
Razo-Flores E, Donlon B, Lettinga G, Field JA. 1997. Biotransformation and
biodegradation of N-substituted aromatics in methanogenic granular sludge. Fems Microbiology Reviews 20(3-4):525-538.

337
Razo-Flores E, Lettinga G, Field JA. 1999. Biotransformation and biodegradation of selected nitroaromatics under anaerobic conditions. Biotechnology Progress 15(3):358-365.
Reid RC, Prausnitz JM, Poling BE. 1987. Chapter 2. The properties of gases and liquids.
4th Edition ed. NY: McGraw-Hill, Inc. Riganti C, Gazzano E, Polimeni M, Costamagna C, Bosia A, Ghigo D. 2004.
Diphenyleneiodonium inhibits the cell redox metabolism and induces oxidative stress. Journal of Biological Chemistry 279(46):47726-47731.
Rinzema A, Lettinga G. 1988. The Effect of Sulfide on the Anaerobic Degradation of
Propionate. Environmental Technology Letters 9(2):83-88. Sanderson RT. 1976. Chemical bonds and bond energy / R. T. Sanderson. New York ::
Academic Press. Sanderson RT. 1983. Polar covalence / R.T. Sanderson. New York :: Academic Press. Sani RK, Peyton BM, Brown LT. 2001. Copper-induced inhibition of growth of
Desulfovibrio desulfuricans G20: Assessment of its toxicity and correlation with those of zinc and lead. Applied and Environmental Microbiology 67(10):4765-4772.
Scaife RM. 2005. Selective and irreversible cell cycle inhibition by
diphenyleneiodonium. Molecular Cancer Therapeutics 4(6):876-884. Schaab C, Schobert.S, Gottscha.G, Pfennig N, Giffhorn F. 1972. Phototropic growth of
Rhodopseudomonas-gelatinosa on citrate - accumulation and subsequent utilization of cleavage products. Zeitschrift Fur Naturforschung Part B-Chemie Biochemie Biophysik Biologie Und Verwandten Gebiete B 27(8):962-&.
Schiewer S, Volesky B. 2000. Biosorption processes for heavy metal removal. In: Lovley
DR, editor. Environmental Microbe-Metal Interactions. Washington, D.C.: ASM Press. p 329-362.
Schroder HF. 2003. Determination of fluorinated surfactants and their metabolites in
sewage sludge samples by liquid chromatography with mass spectrometry and

338
tandem mass spectrometry after pressurized liquid extraction and separation on fluorine-modified reversed-phase sorbents. Journal of Chromatography A 1020(1):131-151.
Schwarzenbach RP. 2003. Environmental organic chemistry / René P. Schwarzenbach,
Philip M. Gschwend, Dieter M. Imboden. Gschwend PM, Imboden DM, editors. Hoboken, N.J. : Wiley.
Sear RP. 2006. Heterogeneous and homogeneous nucleation compared: Rapid nucleation
on microscopic impurities. Journal of Physical Chemistry B 110(10):4985-4989. Shiemke AK, Arp DJ, Sayavedra-Soto LA. 2004. Inhibition of membrane-bound methane
monooxygenase and ammonia monooxygenase by diphenyliodonium: Implications for electron transfer. Journal of Bacteriology 186(4):928-937.
Sierra-Alvarez R, Hollingsworth J, Zhou MS. 2007. Removal of copper in an integrated
sulfate reducing bioreactor-crystallization reactor system. Environmental Science & Technology 41(4):1426-1431.
Smidt H, de Vos WM. 2004. Anaerobic microbial dehalogenation. Annual Review of
Microbiology 58:43-73. Smith WL, Gadd GM. 2000. Reduction and precipitation of chromate by mixed culture
sulphate-reducing bacterial biofilms. Journal of Applied Microbiology 88(6):983-991.
Stanley LC, Ogden KL. 2003. Biosorption of copper (II) from chemical mechanical
planarization wastewaters. Journal of Environmental Management 69(3):289-297. Steinberg SM, Poziomek EJ, Engelmann WH, Rogers KR. 1995. A review of
environmental applications of bioluminescence measurements. Chemosphere 30(11):2155-2197.
Tabak HH, Scharp R, Burckle J, Kawahara FK, Govind R. 2003. Advances in
biotreatment of acid mine drainage and biorecovery of metals: 1. Metal precipitation for recovery and recycle. Biodegradation 14(6):423-436.
339
Tada C, Yang Y, Hanaoka T, Sonoda A, Ooi K, Sawayama S. 2005. Effect of natural zeolite on methane production for anaerobic digestion of ammonium rich organic sludge. Bioresource Technology 96(4):459-464.
Taguchi Y, Sugishima M, Fukuyama K. 2004. Crystal structure of a novel zinc-binding
ATP sulfurylase from Thermus thermophilus HB8. Biochemistry 43(14):4111-4118.
Tan NCG, van Leeuwen A, van Voorthuizen EM, Slenders P, Prenafeta-Boldu FX,
Temmink H, Lettinga G, Field JA. 2005. Fate and biodegradability of sulfonated aromatic amines. Biodegradation 16(6):527-537.
Tang CYY, Fu QS, Robertson AP, Criddle CS, Leckie JO. 2006. Use of reverse osmosis
membranes to remove perfluorooctane sulfonate (PFOS) from semiconductor wastewater. Environmental Science & Technology 40(23):7343-7349.
Tew DG. 1993. Inhibition of Cytochrome-P(450) Reductase by the Diphenyliodonium
Cation - Kinetic-Analysis and Covalent Modifications. Biochemistry 32(38):10209-10215.
Tharakan JP, Gordon JA. 1999. Cometabolic biotransformation of trinitrotoluene (TNT)
supported by aromatic and non-aromatic cosubstrates. Chemosphere 38(6):1323-1330.
Thomas RAP, Beswick AJ, Basnakova G, Moller R, Macaskie LE. 2000. Growth of
naturally occurring microbial isolates in metal-citrate medium and bioremediation of metal-citrate wastes. Journal of Chemical Technology and Biotechnology 75(3):187-195.
Thompson LF. 1994. Introduction to microlithography. Thompson LF, Willson CG,
Bowden MJ, editors. Washington, DC :: American Chemical Society. Truper HG, Schlegel HG. 1964. Sulphur metabolism in Thiorhodaceae .1. Quantitative
measurements on growing cells of Chromatium okenii. Antonie Van Leeuwenhoek Journal of Microbiology and Serology 30(3):225-&.
340
Tucker MD, Barton LL, Thomson BM, Wagener BM, Aragon A. 1999. Treatment of waste containing EDTA by chemical oxidation. Waste Management 19(7-8):477-482.
Turick CE, Camp CE, Apel WA. 1997. Reduction of Cr6+ to Cr3+ in a packed-bed
bioreactor. Applied Biochemistry and Biotechnology 63-5:871-877. USEPA. 1999a. Category for persistent, bioaccumulative, and toxic new chemical
substances. Federal Register. p 60194-60204. USEPA. 1999b. Persistent bioaccumulative toxic (PBT) chemicals; lowering of reporting
thresholds for certain PBT chemicals; addition of certain PBT chemicals; community right-to-know toxic chemical reporting. Federal Register. p 58665-58753.
USEPA. 2007. Science advisory board (SAB) review of the estimation programs
interface suite (EPI SuiteTM). EPA Science Advisory Board. USEPA. 2008. Estimation programs interface suite™ for Microsoft® Windows. Version
3.2. Washington, DC. USA: United States Environmental Protection Agency. Utgikar VP, Chen BY, Chaudhary N, Tabak HH, Haines JR, Govind R. 2001. Acute
toxicity of heavy metals to acetate-utilizing mixed cultures of sulfate-reducing bacteria: EC100 and EC50. Environmental Toxicology and Chemistry 20(12):2662-2669.
Utgikar VP, Harmon SM, Chaudhary N, Tabak HH, Govind R, Haines JR. 2002.
Inhibition of sulfate-reducing bacteria by metal sulfide formation in bioremediation of acid mine drainage. Environmental Toxicology 17(1):40-48.
Utgikar VP, Tabak HH, Haines JR, Govind R. 2003. Quantification of toxic and
inhibitory impact of copper and zinc on mixed cultures of sulfate-reducing bacteria. Biotechnology and Bioengineering 82(3):306-312.
Van Hille RP, Peterson KA, Lewis AE. 2005. Copper sulphide precipitation in a fluidised
bed reactor. Chemical Engineering Science 60(10):2571-2578.
341
Van Langerak EPA, Hamelers HVM. 1997. Influent calcium removal by crystallization reusing anaerobic effluent alkalinity. Water Science and Technology 36(6-7):341-348.
Vargas C, Song B, Camps M, Haggblom MM. 2000. Anaerobic degradation of
fluorinated aromatic compounds. Applied Microbiology and Biotechnology 53(3):342-347.
Veeken AHM, Akoto L, Pol LWH, Weijma J. 2003a. Control of the sulfide (S2-)
concentration for optimal zinc removal by sulfide precipitation in a continuously stirred tank reactor. Water Research 37(15):3709-3717.
Veeken AHM, de Vries S, van der Mark A, Rulkens WH. 2003b. Selective precipitation
of heavy metals as controlled by a sulfide-selective electrode. Separation Science and Technology 38(1):1-19.
Veeken AHM, Rulkens WH. 2003. Innovative developments in the selective removal and
reuse of heavy metals from wastewaters. Water Science and Technology 47(10):9-16.
Visser A. 1995. The anaerobic treatment of sulfate containing wastewater [Doctoral].
Wageningen: Wageningen Agricultural University. Visser A, Beeksma I, Vanderzee F, Stams AJM, Lettinga G. 1993. Anaerobic degradation
of volatile fatty-acids at different sulfate concentrations. Applied Microbiology and Biotechnology 40(4):549-556.
Visser A, Pol LWH, Lettinga G. 1996. Competition of methanogenic and sulfidogenic
bacteria. Water Science and Technology 33(3):99-110. Vogel J. 1996. Qualitative inorganic analysis. London, UK: Longman Publishing LTD. Von Canstein H, Li Y, Timmis KN, Deckwer WD, Wagner-Dobler I. 1999. Removal of
mercury from chloralkali electrolysis wastewater by a mercury-resistant Pseudomonas putida strain. Applied and Environmental Microbiology 65(12):5279-5284.
342
Walther R, Hippe H, Gottschalk G. 1977. Citrate, a Specific Substrate for Isolation of Clostridium-Sphenoides. Applied and Environmental Microbiology 33(4):955-962.
Wang N, Szostek B, Buck RC, Folsom PW, Sulecki LM, Capka V, Berti WR, Gannon
JT. 2005a. Fluorotelomer alcohol biodegradation - Direct evidence that perfluorinated carbon chains breakdown. Environmental Science & Technology 39(19):7516-7528.
Wang N, Szostek B, Folsom PW, Sulecki LM, Capka V, Buck RC, Berti WR, Gannon
JT. 2005b. Aerobic biotransformation of C-14-labeled 8-2 telomer B alcohol by activated sludge from a domestic sewage treatment plant. Environmental Science & Technology 39(2):531-538.
Weininger D. 1988. Smiles, a chemical language and information-system .1. Introduction
to methodology and encoding rules. Journal of Chemical Information and Computer Sciences 28(1):31-36.
White C, Gadd GM. 2000. Copper accumulation by sulfate-reducing bacterial biofilms.
FEMS Microbiology Letters 183(2):313-318. White C, Sayer JA, Gadd GM. 1997. Microbial solubilization and immobilization of
toxic metals: key biogeochemical processes for treatment of contamination. FEMS Microbiology Reviews 20(3-4):503-516.
White C, Wilkinson SC, Gadd GM. 1995. The role of microorganisms in biosorption of
toxic metals and radionuclides. International Biodeterioration and Biodegradation 35(1-3):17-40.
Ye J, Singh A, Ward OP. 2004. Biodegradation of nitroaromatics and other nitrogen-
containing xenobiotics. World Journal of Microbiology & Biotechnology 20(2):117-135.
Zepeda A, Texier AC, Razo-Flores E, Gomez J. 2006. Kinetic and metabolic study of
benzene, toluene and m-xylene in nitrifying batch cultures. Water Research 40(8):1643-1649.

343
Zhang CJ, Zhou Q, Chen L, Yuan Y, Yu H. 2007. Degradation of mono-fluorophenols by an acclimated activated sludge. Biodegradation 18(1):51-61.
Zheng G, Huang WH, Lu XH. 2003. Prediction of n-octanol/water partition coefficients
for polychlorinated dibenzo-p-dioxins using a general regression neural network. Analytical and Bioanalytical Chemistry 376(5):680-685.