bioimpedance spectroscopy for the estimation of fat-free
TRANSCRIPT

Bioimpedance Spectroscopy for the Estimation of Fat-Free Mass In End-Stage Renal Disease
A THESIS SUBMITTED TO THE FACULTY OF THE GRADUATE SCHOOL OF THE UNIVERSITY OF MINNESOTA
BY
Sara M. Vine
IN PARTIAL FULFILLMENT OF THE REQUIREMENTS FOR THE DEGREE OF MASTER OF SCIENCE
Carrie P. Earthman
February 2011
May
May,

© Sara M. Vine, 2011

i
Acknowledgements I would first like to thank Dr. Carrie Earthman for her guidance throughout this research project. I am so very appreciative of her willingness to share her knowledge and expertise and for her continued support and confidence in me. I thank Dr. Patricia Painter for graciously allowing me the opportunity to be a part of her research project. Her enthusiasm, advice and direction have helped propel this project forward. I thank Dr. Shalamar Sibley for her support and willingness to serve on my committee. I thank Dr. Michael Kuskowski for his assistance with the statistical analyses and interpretation of the data.
ii
Table of Contents
LIST OF TABLES ...................................................................................................... iii
LIST OF FIGURES...................................................................................................... iv
CHAPTER I: INTRODUCTION ................................................................................. 1
CHAPTER 2: LITERATURE REVIEW ..................................................................... 3
I. Introduction ............................................................................................................... 3
II. BODY COMPOSITION BASICS 3 II.A. Body Composition Assessment Techniques 4 II.B. Criterion (Reference) Assessment Methods of Body Composition 5 II.C. Field Assessment Methods of Body Composition 12 II.D. Summary 21
III. ESRD: TREATMENT MODALITIES AND CONSIDERATIONS FOR BODY COMPOSITION ASSESSMENT 22
III.A. ESRD Treatment Modalities 22 III.B. Rationale for Body Composition Assessment in ESRD 24 III.C. Limitations of Body Composition Assessment in ESRD Patients 25
IV. BIS METHODS COMPARISON STUDIES 26 IV.A. BIS Estimates of Fluid Volume 27 IV.B. BIS Estimates of FFM and FM 44 IV.C. BIA for the Assessment of FFM and FM in ESRD 50
IV. CURRENT STUDY 55
CHAPTER 3: COMPARISON OF BIOIMPEDANCE SPECTROSCOPY AND DUAL-ENERGY X-RAY ABSORPTIOMETRY FOR ASSESSMENT OF BODY COMPOSITION IN END-STAGE RENAL DISEASE ............................................. 68
I. INTRODUCTION 70
II. SUBJECTS AND METHODS 72 II.A. Subjects 72 II.B. Methods 73 II.C. Results 76 II.D. Discussion 79
CHAPTER 4: CONCLUSION .................................................................................... 94
LITERATURE CITED ............................................................................................... 96

iii
List of Tables TABLE 2.1. METHOD COMPARISON STUDIES FOR BIS AND BIA: STUDY SPECIFICS ........... 60 TABLE 2.2. METHOD COMPARISON STUDIES FOR BIS AND BIA: STUDY FINDINGS ........... 64 TABLE 3.1. PHYSICAL AND CLINICAL CHARACTERISTICS BY SUBJECT GROUPS ................ 90 TABLE 3.2. BODY COMPOSITION CHARACTERISTICS BY SUBJECT GROUPS ....................... 91 TABLE 3.3. BIS BIAS FOR ESTIMATES OF FFM BY SUBJECT GROUPS ................................ 91 TABLE 3.4. BIS PERCENT DIFFERENCE FROM DXA ......................................................... 92 TABLE 3.5. CORRELATION OF BIS AND SUBJECT CHARACTERISTICS ................................ 92 TABLE 3.6. GENERAL LINEAR REGRESSION FOR BIS PREDICTION ERRORS ....................... 93

iv
List of Figures FIGURE 2.1. BODY COMPOSITION COMPARTMENTS ......................................................... 58 FIGURE 2.2. IMPEDANCE LOCUS ...................................................................................... 59 FIGURE 3.1. CORRELATION BETWEEN DXA AND BIS FOR FFM BY SUBJECT GROUPS ...... 87 FIGURE 3.2(A-C). BLAND-ALTMAN PLOTS BY SUBJECT GROUPS...................................... 88

1
Chapter I: Introduction
Chronic Kidney Disease (CKD) is a significant and growing problem in the
United States. Approximately 26 million Americans have CKD and the number of
people with kidney failure more than doubled from 180,000 to 380,000 between 1990
and 2000 (1). Even more startling is the number of people at risk for kidney failure.
According to the National Kidney and Urologic Disease Information Clearinghouse,
more than 20 million Americans are at risk for CKD due to hypertension, diabetes and
other risk factors (1). This is a serious problem facing our country and effective
strategies need to be developed to manage it.
The primary purpose of the kidney is to maintain homeostatic function by
regulating fluid and electrolyte balance, excreting nitrogenous wastes and releasing
hormones into the blood (2). When the kidneys are damaged due to injury or disease
chronic kidney disease may develop (CKD). If CKD is allowed to progress, stage 5 CKD
also known as end-stage renal disease (ESRD) can develop. Once CKD has progressed
to this stage, irreversible damage has occurred and the kidney’s ability to perform its
primary functions becomes severely compromised (2).
ESRD and compromised kidney function can lead to a host of symptoms and
complications. Uremia is a clinical syndrome of symptoms that develops as a result of
ESRD and is caused by the buildup of nitrogenous wastes in the blood. Symptoms of
uremia include fatigue, nausea, vomiting, loss of appetite, hypocalcemia,
hyperphosphatemia, metabolic acidosis and polyuria. Other symptoms associated with
ESRD include pericarditis, neuropathy, edema, hyperkalemia, coma and lethargy. Renal

2
replacement therapies such as dialysis or kidney transplantation are frequently required to
manage these symptoms (2).
The symptoms of ESRD and the dialysis therapies prescribed to manage these
symptoms can contribute to malnutrition. It has been shown that malnutrition is a
predictor of morbidity and mortality and up to 37% of ESRD patients on hemodialysis
(HD) therapy are severely malnourished (3). This is attributed to a decrease in protein
and energy intake caused by a loss in appetite, loss of amino acids through dialysate,
protein catabolism due to metabolic acidosis, hyperparathyroidism, inflammation, and/or
insulin resistance (4).
Body composition may be altered in several ways as a result of ESRD
complications. First, malnutrition associated with the disease state and dialysis therapy
may lead to decreased muscle mass (5). Second, elevated serum phosphorus
concentrations may cause bone resorption and lead to renal osteodystrophy, decreasing
bone mineral content. Third, fluid imbalances related to kidney impairment and or
dialysis therapy may result in altered fluid volumes (2). The complex relationships
between renal pathology, nutrition, and body composition present difficult challenges to
the renal community. Because of these challenges, there is a need for accurate,
affordable, and easy to use bedside methods to assess body composition and nutritional
status in ESRD patients.

3
Chapter 2: Literature Review
I. INTRODUCTION
The aim of this thesis is to evaluate bioimpedance spectroscopy (BIS) as a method
to use in the clinic for the assessment of body composition in ESRD patients. Before
presenting the scientific evidence that supports the aim of the current study, background
information will be provided on the fundamentals and various methods of body
composition assessment. In addition, an explanation of the different HD treatment
modalities used, and the rationale for and limitations of body composition assessment in
the ESRD patient population will be provided. Following the presentation of the
background information, a review of studies that have evaluated bioimpedance
spectroscopy against other reference methods will be explored. Finally, the current study
will be described.
II. BODY COMPOSITION BASICS
Body composition can be defined as the relative proportions of protein, fat, water,
and mineral components in the body (6). This definition can be described further by
specific body compartments (Figure 2.1). These compartments include fat mass (FM),
fat free mass (FFM) and fluid compartments. FFM includes lean body mass (LBM) and
bone mineral content (BMC). Bone mineral content is also part of the LBM and contains
bone, collagen, and the mineral matrix. Lean body mass can be further broken down into
two components: the extracellular mass (ECM) and the body cell mass (BCM). Body
cell mass is important as a parameter of nutritional status and, as defined by Moore et al
(1963), is the metabolically active tissue, containing the oxygen-exchanging, potassium-

4
rich, glucose oxidizing, and work-performing tissue (7,8). Body cell mass is an indicator
of the resting metabolic rate, and is a predictor of morbidity and mortality. Because body
protein changes occur primarily within the intracellular space, BCM can be closely
approximated by measuring ICF volume (9). Fluid compartments comprise the final
component of body composition. Total body fluid (TBF) can be broken down into
extracellular fluid (ECF) and intracellular fluid (ICF). Figure 2.1 provides a depiction of
the various body composition compartments.
II.A. Body Composition Assessment Techniques
Body composition can be assessed at five distinct levels, starting with the atomic,
and going on to the molecular, cellular, tissue-organ, and whole-body levels (10). The
atomic level quantifies body mass into 11 major elements: hydrogen, oxygen, nitrogen,
carbon, sodium, potassium, chlorine, phosphorus, magnesium and sulfur. The molecular
level comprises water, lipid, protein, carbohydrates, bone minerals and soft tissue
minerals. These six components can be combined to create various models with as few
as two or as many as six components. The two-component model, which includes FM
and FFM, is the most commonly used model. The cellular level includes extracellular
fluid (ECF), extracellular solids and the body cell mass BCM. As previously stated,
BCM is an important component to measure because it represents the actively
metabolizing component at the cellular level of body composition (7). The tissue level is
made up of adipose tissue, skeletal muscle, visceral organs and bones. The fifth and final
level of body composition is the whole-body level. Here, the trunk, appendages and head
are measured (10).

5
Methods to assess these different levels can be divided into two primary
categories: criterion (reference) methods and field methods (11). Criterion or reference
methods may be used to assess the atomic, molecular, and cellular levels of body
composition through the use of whole body counting, neutron activation, and isotope
dilution. Other criterion or reference methods, such as densitometry, computed X-ray
chromatography (CT), magnetic resonance imaging (MRI), and dual energy X-ray
absorptiometry (DXA) may be used to assess the tissue level of body composition and
provide measures of density, and/or the distribution of skeletal muscle and adipose tissue.
Lastly, field methods are those that provide an estimation based on results from criterion
(reference) measures of body composition, and may be used in both field research and
applied clinical settings. Field methods must be compared against reference methods in
order to evaluate their accuracy and establish validity in any given clinical or healthy
population (10). Methods include anthropometry, bioelectrical impedance analysis
(BIA), and bioimpedance spectroscopy (BIS) (11). The following section of this
literature review will describe several assessment methods of body composition.
Criterion or reference methods will be presented first followed by field methods.
II.B. Criterion (Reference) Assessment Methods of Body Composition
i. Whole Body Counting
Whole body counting is a nuclear-based technique that evaluates human body
composition at the atomic level (12). Total body potassium (TBK) counting is the most
widely performed method of whole body counting and this method is predominantly used
to measure BCM and FFM (12)(13). Moore et al (7) developed an estimation formula

6
expressed as BCM (kg) = 0.00833 X TBK (mmol) or the ratio of TBK to BCM is
120mmol/kg. These formulas make several assumptions: first, the total body
exchangeable potassium occurs only within cells; second, ECF potassium is insignificant;
and third, the potassium content of cells remains constant (14). These assumptions limit
the use of this method in ESRD patients who may experience elevated levels of serum
potassium, producing body composition estimates that may be misleading (15).
Whole body counting can also be used for the estimation of FFM. Forbes and
Lewis (16) proposed that the ratio of total body potassium to BCM is 68.1 mmol/kg of
FFM. This value has been widely used in the field of body composition research;
however, other more recent studies have reported that the potassium content of FFM may
in fact be lower than that, and may vary among individuals to a greater extent than
previously believed (12). In addition, other investigators have found that TBK levels
differ with age, sex and ethnicity (13, 17, 18).
Whole body counting is an attractive method of body composition because it is
relatively non-invasive, requires very little cooperation from the subject and allows for
repeated measures (12). However, it does involve exposure to ionizing radiation and
requires expensive equipment and technical expertise. In addition, the electrolyte
imbalances that ESRD patients experience and the limitations of the formulas developed
by Moore et al (7) and Forbes and Lewis (16), hinders its use in the ESRD patient
population.
ii. Neutron Activation Analysis
Neutron Activation Analysis (NAA) is another criterion assessment method that

7
can be used to evaluate body composition at the atomic level, but can also be used to
determine total body water, protein, fat and bone calcium (12). This method applies a
field of neutrons to the human body, causing atoms in the body to capture these neutrons.
The added energy provided by the captured neutron causes the atom to be momentarily
transformed to a greater nuclear state. In less than a nanosecond the atoms nucleus drops
back down to its lowest energy state. This drop in energy state is followed by an
emission of gamma rays that can be detected and quantified by a body counter and the
element of interest can then be assessed (12).
Like whole body counting, this non-invasive technique requires limited
cooperation from the subject: however, due to the cumulative exposure to the neutron
source, NAA cannot be used for repeat measures over a short period of time (12). With
respect to the ESRD patient population, the inability to conduct repeat measures on
subjects is a major limitation. Repeated measures of body composition are beneficial to
patients on HD therapy because hydration status can change before, during and after a
treatment. Additional limitations to this method include the limited number of
instruments available, the complex design and prohibitive cost of the instrumentation,
and the need for a medical physicist to calibrate and operate the device.
iii. Multiple Isotope Dilution
The dilution principle allows for the evaluation of water at the molecular level
through the assessment of TBF, and at the cellular level through the assessment of ECF
and ICF. Furthermore FFM and FM can be estimated from the dilution measured fluid
volumes (19). Deuterated (2H), tritiated (3H) or oxygen-labeled water (18O) are used to

8
determine TBF, and sodium bromide (NaBr) is most commonly used to determine ECF
(6). Dilution procedures typically include a baseline blood or urine sample, ingestion of
an isotope tracer, an equilibration period and a follow up blood or urine sample. TBF and
ECF volumes can then be calculated using the equation C1V1 = C2V2 (19), where C1V1
reflects the amount of isotope/tracer ingested in a known volume of water, C2 represents
the final concentration of the isotope/tracer and V2 is equal to the volume of TBF or ECF.
ICF volume can be estimated by calculating the difference between TBF and ECF (TBF –
ECF = ICF) (19).
The dilution method is considered to be a criterion or reference method for fluid
volume assessment. However, there are drawbacks and assumptions that limit its
efficacy and use in certain populations (20). The assumptions made include: 1) the
isotope tracer is distributed only in body water; 2) the tracer is equally distributed
throughout all body water compartments; 3) equilibration of the tracer is rapid; and 4) no
tracer or body water is metabolized during the equilibration period (20). Assumption 3
presents the greatest limitation of this method in the ESRD patient population. It has
been shown that disequilibrium in hydration status, as seen in ESRD patients, delays the
equilibration time of the isotope tracer (20). This delay can cause inaccurate measures of
the dilution space, leading to errors in the estimation of fluid volumes when the standard
equilibration periods are applied. Also, dilution may not be suitable for determining
estimates of FFM in ESRD patients because the assumption that the hydration of FFM is
constant at 73% may not be true (20). Cost, amount of time required to perform the
procedure and inability to take repeated measures are additional limitations to this

9
method. Dilution is not recommended for ESRD patients and others with expanded ECF
volumes (20).
iv. Densitometry
Densitometry is a criterion method of body composition used to obtain total body
volume. This method involves the assessment of whole-body density that is defined as
the measurement of total body mass compared to the measurement of total body volume
(19). Underwater weighing (UWW) is the most common method to estimate body
density; however, air displacement plethysmography (ADP) is also a viable method.
Underwater weighing (UWW)
In UWW, body volume is determined by computing the difference between the
mass in air and the mass obtained from UWW (19). From total body volume, body
density can be calculated using the equation:
Body Density (Db) = [Wa / ((Wa –Ww) / (Dw))–(RV + 0.100)]
where Wa equals the weight in air, Ww equals the weight in water, Dw equals the density
of water and RV equals lung residual volume (11). Equations are then applied to the
measurement of body density to assess body composition parameters such as FM and
FFM (21).
Although UWW is considered a criterion or reference method of body
composition, there are technical and biological errors that can occur. These errors may
include subject positioning, head placement, residual volume, alternative lung volumes,
number of trials and selection criteria (11). When and how residual volume is measured
is another cause of error associated with this method. Densitometry and its assumptions

10
have been accurately applied to healthy populations, but may not hold true for patients on
HD therapy, where hydration and bone density may be altered due to fluctuations in fluid
balance and the presence of renal osteodystrophy. Furthermore, this method is limited in
ESRD patients because it is time consuming and challenging for patients with
comorbidities and compromised functional status (22).
Air Displacement Plethysmography (ADP)
An alternative to UWW that is more attractive for ESRD patients is ADP. This
technique is based on air displacement instead of total submersion in water. Subjects sit
or stand in a closed vessel of air and body volume is determined based on pressure
changes (11). This method of body composition is carried out by a device called the
BodPod (Life Measurement Instruments, Inc., Concord, CA). There are two chambers in
this device, a test chamber where the subject sits or stands and a reference chamber.
Small sinusoidal volume and pressure changes that are equal in magnitude and opposite
in sign occur simultaneously in both chambers. Through the application of Poisson’s
law,
P1/P2 = (V2/V1) !
where ! is the ratio of the specific heat of the gas at constant pressure to that at constant
volume (11). Once body volume has been determined, the principals of densitometry can
be applied to find body density (11).
Reliability of the BOD POD in humans has been shown to be quite good, with
test-retest correlation coefficients for body density and percent fat greater than r = 0.90
(11). In addition, BOD POD body composition estimates have been validated against

11
UWW and dual energy x-ray absorptiometry (DXA), showing strong linear relationships
for percent body fat ranging from 0.76 – 0.96 (11). Given the findings of these studies
and the non-invasive nature of the procedure, ADP is an attractive alternative to UWW
for ESRD patients. However, similarly to UWW, errors in estimating residual volume
have been shown to limit its effectiveness. Additionally, because assumptions about
body density are made, this method is subject to errors when used in populations who
may have altered body density (11). Further research is needed before the ADP method
and the BOD POD device can be considered a valid method for estimating body
composition in ESRD patients (11).
v. Dual Energy X-ray Absorptiometry (DXA)
DXA is a criterion method by which BMC, FM, and FFM are measured (23).
DXA uses two X-ray energies that pass through the tissues in the body and allow for the
differentiation of bone mineral, soft tissue, FM, and FFM (24). The initial energy emitted
is known and the final energy is detected after the X-ray has passed through the body
(23). These values are then applied to known body mass attenuation equations and the
proportion of FM to FFM is used to determine whole body composition (25). The
procedure to measure body composition by DXA requires the patient to lie in the supine
position as the X-ray source emits energy from beneath the scanning bed. An overhead
detector passes over the patient and receives the X-ray energy after it has passed through
the subject’s body (24).
Studies conducted within the ESRD patient population have demonstrated that
DXA is a precise and an accurate method of body composition compared to

12
anthropometry, the four-compartment model and total body potassium counting (23).
This method is recognized in the National Kidney Foundation’s Kidney Disease
Outcomes Quality Initiative (KDOQI) clinical practice guidelines as a valid tool for
measuring body composition because it is less influenced by fluctuations in hydration
status (1). Other significant advantages to ESRD patients are that it is non-invasive,
quick and easy to perform (24). It also has the capability of measuring separate body
regions, which is advantageous to ESRD patients who typically have altered body
composition in the upper and lower extremities of the body (1).
Although DXA is routinely used in clinical settings and has been shown to be
useful in ESRD patients, it is not without its limitations. First, DXA machines are costly
and require considerable space allocation to house; therefore many institutions do not
have DXA instruments and thus, patients may be required to travel in order to undergo
body composition assessment by this method (1). Second, there is variation in
measurements among the different manufacturers of DXA machines (26). Third, DXA
does not have the ability to differentiate between ICF and ECF volumes (1). Fourth,
DXA assumes constant hydration, potassium content, and density in the estimation of
body composition (27). Therefore it is possible that alteration in fluid balance and ion
shifts may be a source of error in this method (28, 29). Despite these limitations, DXA is
considered a preferred reference method to measure body composition in ESRD patients
(1).
II.C. Field Assessment Methods of Body Composition
i. Anthropometry

13
Anthropometry is a method to estimate the distribution of bone, muscle, and
adipose tissue (2). Anthropometry includes: height; weight (dry weight for dialysis
patients); skinfolds (e.g. triceps, subscapular); circumferences (e.g. abdominal, calf,
waist, mid-arm muscle); and elbow breadth (30). This method of body composition is
used widely in healthy populations with normal renal function because it is affordable,
portable and suitable for repeat measures (2). Anthropometric measures are operator
dependent but can be used to identify nutrient deficiencies or nutrient excesses that affect
body fat and muscle mass. These measures can also be compared to standardized
percentiles (2).
The use of anthropometrics in the ESRD patient population is limited due to
altered tissue turgor, vascular access, comorbidities, amputations, and overhydration (31).
Furthermore, the use of body weight to evaluate nutritional status can be misleading. A
decrease in ICF (BCM) may be associated with an increase in ECF, masking signs of
malnutrition because weight does not change (32). It is recommended that
anthropometric measures in ESRD patients be used over time to track individual changes
in body composition and should not be used to compare to the standard reference values
of healthy adults (2).
ii. Bioimpedance Techniques
There are two primary approaches to the utilization of bioimpedance technologies
for the assessment of body composition: bioelectrical impedance analysis (single- or
multiple-frequency BIA) and bioimpedance spectroscopy (BIS). Bioimpedance is
attractive as a field technique because it is non-invasive, portable, safe, and easy to use

14
(33).
iia. Bioelectrical Impedance Analysis (BIA)
The aforementioned advantages to the bioimpedance approach in general have
made BIA a method of choice in both field research and clinic settings (34). Generally
speaking, BIA is based on the principle that the flow of an electrical current applied
through a cylindrical conductor is met with a resistance that is proportional to the square
of the conductor’s length and specific resistivity and is inversely proportional to the
conductor’s volume (34). The equation:
R = !L2(1/V)
explains this relationship where R = resistance (ohm), ! is the specific resistivity of the
conductor medium (ohm m) and L is the length of the conductor (m). Rearranged, this
equation can be used to determine the volume of the conductor and gives (34):
V = !L2(1/R)
Simply, BIA measures the body’s resistance, which is proportional to the volume of total
body fluid (TBF) and FFM (35). Typically, electrodes to which the leads are attached in
order to apply the current are placed on an individual being tested in a standard tetrapolar
arrangement, whereby electrodes are placed on the hand, wrist, foot, and ankle. The
limbs of the body offer the greatest resistance to the flow of the current due to their small
cross-sectional area.
There are two types of forces that oppose the electrical current. Resistance (R), is
the opposition of the electrical current through the ICF and ECF; and capacitance (Xc),
represents the opposition of the capacitant effect of the cell membrane; (33). The
15
impedance of the body is a function of its resistance and reactance and is frequency-
dependent (36).
The body composition parameter measured depends on the BIA method used.
Single frequency (SF)-BIA applies the current at a single frequency, usually 50 khz. The
assumption inherent to this method is that 50 kHz is high enough that it will penetrate the
cell membrane, and the conduction of the current will be proportional to the fluid volume
contained in the TBF (33). While this assumption may hold true in healthy individuals, it
may not in individuals in various disease states. Multiple-frequency (MF)-BIA typically
applies the current at two frequencies, one low and one high. Applying the electrical
current at multiple frequencies allows for the differentiation between the ECF and TBF.
At very low frequencies, virtually no penetration of the current through cell membranes
occurs, and thus the resistance measured is proportional to the ECF volume. This
capacity to quantify ECF makes MF-BIA devices particularly advantageous over SF-BIA
devices. At a high enough frequency the current is able to penetrate and pass through the
cell. When this occurs the resistance of the body to the electrical current is proportional
to the sum of ECF and ICF (37). The frequency at which total penetration of the current
occurs is thought to be 50 KHz or less in most healthy people, making SF-BIA a
reasonable choice for TBF determination in those individuals. However, in patient
populations, a frequency of 200 kHz or higher may be required to cross cell membranes
in patients on hemodialysis (36) and children with diarrheal disease (38). MF-BIA thus
has the capacity to quantify not only ECF but also TBF, assuming the high frequency
chosen is high enough in the individual being measured, given disease and other factors.

16
From these two fluid volumes ICF can then be estimated (TBF – ECF = ICF).
Both SF- and MF-BIA methods rely on population-specific prediction equations
that are originally derived from reference data using regression methods. Equations then
should be cross-validated in follow-up studies to establish their validity compared to
reference methods in a population with similar characteristics. SF-BIA only estimates
TBF because it applies the current at only one frequency (most commonly 50 kHz). MF-
BIA devices can estimate both TBF and ECF by applying the impedance data collected at
both a high and low frequency, respectively, to predictive equations. These prediction
equations are best suited for the population from which they were derived and therefore
are limited when applied to other populations (39). Inaccurate measures can be made
when these prediction equations are applied to a single individual, as might take place in
a dialysis clinic. This inaccuracy occurs because errors for an individual are much larger
than those in a group (40). Moreover, developing prediction equations for this patient
population is challenging because fluid volumes before and after HD therapy vary widely
from patient to patient (33).
Fluctuations in fluid status are a major concern when measuring body
composition with impedance methods. As discussed above this method of body
composition measures the resistance to an electrical current whereby estimates of body
composition can be made. Fat, which is a fairly homogenous tissue, is resistant to the
electrical current where as FFM serves to conduct the current through the fluid and
electrolyte rich tissues. When increased fluid volumes cause an expansion of the ECF a
decrease in the resistance to the current can occur and cause an overestimation of FFM.

17
Additionally BIA assumes the hydration and mineral content of FFM is constant (41).
Although the factors surrounding prediction equations, abnormal fluid and
electrolyte balance, and the violation of the assumed constants present limitations to this
method, BIA continues to be used in both field research and clinic settings. With respect
to the ESRD patient population on HD therapy, the estimation of BCM is one of the most
compelling factors of BIA. It has been reported that estimates of BCM may be more
sensitive and effective at identifying malnutrition when compared to physical
examination and biochemical markers (42). This is of value to the ESRD patient
population because early identification of malnutrition may allow for appropriate
intervention before serious adverse outcomes occur (42). Other strengths of the BIA
method of body composition include being non-invasive, portable, inexpensive, and
capable of producing reliable repeat measures (41).
iib. Bioimpedance Spectroscopy (BIS)
BIS relies on many of the same principles as MF-BIA; however, this technique
consists of applying an electrical current across a spectrum of frequencies (1 – 1000 kHz)
(43, 44), rather than at just one low and one high frequency. Furthermore, instead of
applying the impedance measures to prediction equations, BIS devices are equipped with
software that transforms the data based on nonlinear curve-fitting through the cole-cole
model (44). The cole-cole model is the most widely used biophysical model in this
method of body composition (44). A factor called Kb, which approximates the human
body to be the sum of five cylinders, is calculated (45). Results of the cole-cole model
and the Kb factor are then applied to the Hanai mixture theory equations. These equations

18
take into account the non-conducting elements of the body and provide estimates of ECF,
ICF and TBF (44).
The underlying principal of BIS is that living tissues have different properties and
will behave differently when various frequencies of electrical current are applied (43, 44).
As outlined in the previous section on BIA, the cell acts as a capacitor. When direct and
very low frequencies are applied there is no current conduction through the cell. In that
event, the conduction of the current is primarily driven by the conductive properties of
the ECF (36). When there is no conduction of the current through the cells the
impedance value (Z) is purely resistive (36, 44). Currents with higher frequencies cause
the cell to become charged and discharged quickly. As the rate of charge and discharge
increases, the cell membrane capacitance decreases and allows more of the current to be
conducted through the cell (36). The conduction of the current is primarily driven by the
conductive properties of both the ECF and ICF and thus allows for the assessment of
TBF (44).
Both the resistance and reactance of the different body compartments are obtained
as the frequency of the current increases. Values of resistance and reactance are
generated and can be depicted as points on a semicircle or an impedance locus (Figure
2.2) (46).
The resistance value of very low currents is termed R0 and provides an estimate of ECF.
The resistance value of very high currents is termed R" and provides an estimate of TBF
(44). The Hanai mixture equations are most commonly used to calculate measures of
ECF and ICF by BIS (47):

19
ECFBIS = [!ECF * Kb * H2 * (W/D)0.5/R0]2/3
ICFBIS = ECFBIS * [((!ECF * Ro)/( !ECF * Rinf))(2/3)-1]
Where !ECF is the ECF resistivity constant H is height (cm), W is weight (kg), D is body
density (1.05 kg/l) and Kb corrects for differences in body geometry for whole body wrist
to ankle measurement (47). FFM can also be calculated by BIS using the device software
equations:
FFM : ("ECF * ECFBIS) + "ICF * ICFBIS)
Where "ECF is the density of ECF, "ICF is the density of the ICF and ECFBIS and ICFBIS
represent predicted ECF and ICF volume (liters) respectively (48).
BIS is easy to use, produces immediate results, allows for repeated measures, and
has the capacity to differentiate between the ECF and ICF (49). BIS has the added
advantage of utilizing biophysical modeling instead of prediction equations to estimate
TBF and ECF. This allows for more individualized assessment because each person’s
data are generated and modeled without the constraints of a regression-derived
population specific prediction equation. Therefore, these estimates are generally thought
to have the potential for greater accuracy than those estimated by BIA methods (45).
These are all important advantages when assessing body composition and fluid balance in
HD patients; however, uncertainty still remains. Patients on HD have abnormal fluid
distribution that may impair or limit the utility of BIS. Disruption of the capacitance of
the cell membrane due to rapid shifts in fluid and ion distribution during HD treatment
may also decrease the reliability of BIS (50). Another limitation common to all
bioimpedance approaches is that BIS interprets the whole body geometry as a series of

20
five conductive cylinders. The extremities, with their small cross sectional area,
contribute the most resistance and the trunk, with a large cross-sectional area, contributes
the least resistance despite containing a large portion of body fluid (51). Additional
research evaluating the accuracy of BIS for measurements of body composition in renal
disease patients is needed before a final consensus can be made.
iic. Historical Perspective on Bioimpedance Technologies
Biophysicists and engineers like Fricke (52) and Cole (46) have been utilizing the
principles of bioimpedance for decades. Their work has provided the foundation for BIS
research in the field of human body composition (44). Thomasset et al (1963) (53) was
the first to apply impedance technology in a clinical population. Hoffer et al (1969)
(54)and Nyober et al (1983) (54, 55) introduced the tetrapolar electrode placement
technique in the mid 1980s. This tetrapolar technique is also known as whole-body or
wrist-ankle BIS and it is commonly used in field research and clinic settings today.
Hoffer demonstrated a strong correlation between SF-BIA measures of TBF and FFM
against criterion methods (54). In a study conducted by Lukaski et al (1986) (56) SF-BIA
measures of FM were compared against reference methods of densitometry and skinfold
thickness in healthy men and women. It was observed that there were no significant
differences between SF-BIA and densitometrically determined FFM or FM determined
by skinfold measures (56). By this time SF-BIA had become a well-established tool for
body composition and many SF-BIA devices were readily available.
Bioimpedance spectroscopy devices were introduced in 1990 for the estimatation
of TBF, ECF, ICF and FFM (33, 44). Around this same time Matthie and colleagues (44)

21
were successful in applying Hanai’s mixture theory equations to impedance data to obtain
estimates of ECF and ICF. These multiple frequency impedance devices could be used in
two ways: to obtain impedance data over the entire spectrum of frequencies in order to
obtain volume estimates based on cole-cole modeling, or to obtain impedance data at two
defined frequencies in order to derive volume estimates from regression-derived
prediction equations. Currently there are several impedance devices on the market that
can be considered ‘true’ multiple-frequency devices because they only apply the current
at 3 or 4 frequencies, typically 5, 50, 100, and 200 kHz, rather than over the entire
spectrum of frequencies as is the case with a BIS device. The introduction of these MF-
BIA and BIS devices fueled a debate concerning which method, SF- or MF-BIA, or BIS
was most effective for assessing body composition. SF-BIA is easy to use, the data can
be analyzed by any statistical package, and new equations can be generated easily. On
the other hand, MF-BIA and BIS are also easy to use and have the greater potential to
accurately assess ECF and ICF. The debate regarding which method is most effective
continues today and the field of body composition remains divided (44).
II.D. Summary
Measurements of body composition evaluate the atomic, molecular, cellular or
whole tissue components of the human body. The various methods used to obtain these
measures are aimed at assessing the different components of body composition. Each has
its strengths and limitations, but this review has specifically focused on the limitations
each method has in ESRD patients on HD therapy. The aim is to find an accurate method
of body composition for ESRD patients on HD therapy. From the review of body

22
composition methods, taking into consideration strengths and limitations, it seems that
BIS may prove to be the method of choice in this patient population. Before a full review
of the relevant BIS validation literature is presented, it is important to gain a better
understanding of ESRD. A more in-depth presentation of ESRD treatment modalities,
changes in body composition that occur in ESRD, and specific limitations to body
composition assessment in ESRD will be provided in the next section. A review of the
relevant literature supporting our study aim to evaluate BIS in this population will follow.
III. ESRD: TREATMENT MODALITIES AND CONSIDERATIONS FOR BODY COMPOSITION ASSESSMENT
III.A. ESRD Treatment Modalities
CKD can occur as a result of injury to the kidney or disease. Irreversible loss of
kidney function occurs in stage 5 of CKD, also known as ESRD (1). As a result of
compromised renal function, toxic molecules accumulate in the blood and drive
symptoms of uremia. Renal replacement therapies have been developed to remove the
toxic molecules that occur as a result of uremia and include transplant or dialysis therapy
(2). HD therapy is the most common treatment modality used in ESRD patients and
therefore will be the focus of this review
In 2007 there were almost 334,000 ESRD patients receiving HD therapy (57).
This technique requires placement of an arteriovenous fistula to provide access to and
removal of the blood. The arteriovenous fistula also provides access to a dialysis
machine that allows for the passage of blood through a dialysis membrane in which it is
bathed in a dialysate solution before returning it back to the bloodstream (58). Each HD
treatment takes 3-4 hours and is typically performed at a dialysis center or hospital three

23
times per week (58). Although this method is the most common among ESRD patients
more than 20% of HD patients die each year (59). Other complications that impair the
quality of life in these patients includes poor nutrition, heart disease, hypertension,
anemia, bone disease, inflammation, depression, impaired cognitive abilities and physical
dysfunction (60).
These adverse outcomes have prompted the renal community to explore
alternative and more frequent HD techniques. These techniques include nocturnal home
hemodialysis (NHHD) and short daily hemodialysis (SDHD). Studies evaluating the
outcomes of more frequent HD treatment are mixed, but a growing body of literature has
reported that switching from conventional hemodialysis (CHD) to either NHHD or
SDHD offers improved nutrition, quality of life, blood pressure control, fluid and
electrolyte balance, and it shows a decrease in the number of hospitalizations (61).
Both NHHD and SDHD can occur in the home and SDHD can also be performed
in a dialysis center. These more frequent, and in some cases longer, treatment sessions
are intended to more closely simulate kidney function and therefore decrease the adverse
side effects discussed above; however, these new HD techniques are not without their
flaws (62). Increased risk of infection due to the daily vascular access and increased cost
for in-home treatment training and support are limitations in both methods (62). These
original approaches hold promise for the renal community, but further research is
necessary to determine their efficacy and whether they should be offered as a treatment
option along with the conventional thrice weekly in-center treatment approach.

24
III.B. Rationale for Body Composition Assessment in ESRD
Evaluating body composition in ESRD patients plays an in important role in
identifying the severity of disease, managing symptoms and establishing effective
treatments. Body composition assessment at the cellular level can provide useful
information about HD therapy, fluid status and help to determine dry weight. Body
composition at the tissue level can help identify complications of the disease related to
muscle wasting, malnutrition and low bone density (63).
At the cellular level body composition assessment provides measures of fluid
volume that are useful in evaluating the efficacy of HD therapy. One of the primary
goals of HD therapy is to restore fluid balance (64). Consequences such as hypotension
or hypertension may occur if fluid compartments and hydration are not returned to
normal levels. Body composition measures may also be useful in assessing a patient’s
dry weight. Dry weight is the phrase used to describe normal hydration status in dialysis
patients (65). Dry weight is difficult to determine and no accurate methods are available
for clinical use (64). Research suggests that even after dialysis patients reach their dry
weight; they may still have expanded ECF volumes (64). BIS has been shown to
accurately measure ECF compartments in patients on hemodialysis (42, 65) and may be a
more useful method for determining dry weight than the standard clinical observations.
At the tissue level body composition may help identify complications associated
with ESRD. Metabolic acidosis is one such complication that has serious consequences.
This acid base imbalance drives protein catabolism and can result in muscle wasting.
Muscle wasting is a sign of malnutrition and is also a predictor of morbidity and

25
mortality in these patients (2). A second complication of ESRD is renal osteodystrophy.
Driven by a phosphorus and calcium imbalance, osteoclast activity is elevated and can
result in low bone density. These complications may result in other comorbidities,
decrease patient mobility, decrease quality of life and increase morbidity and mortality
(2).
III.C. Limitations of Body Composition Assessment in ESRD Patients
ESRD presents certain challenges that impose limitations to multiple methods of
body composition assessment. These include altered fluid volumes and electrolyte
imbalances, the violation of assumed constants, the presence of comorbidities, decreased
functional status and vascular access. Altered fluid volumes and electrolyte imbalances
impact almost all methods of body composition. This is because most methods rely on
constants derived in healthy populations (66). When these constants are violated the
method may produce misleading results. Renal osteodystrophy is a complication
associated with a phosphorous and calcium imbalance that can ultimately lead to low
bone density (2). In densitometry methods, low bone density may result in the violation
of density constants and thus introduce error into the measurements. Comorbidities,
decreased functional status and vascular access make it challenging for ESRD patients to
go through underwater weighing and to have accurate anthropometric measurements
taken (22). These are several of the ESRD complications that pose challenges to multiple
body composition assessment methods. There is clearly a need to identify an accurate
and reliable method of body composition assessment in patients with ESRD, and BIS has
the potential to meet that need. A full review of the literature evaluating the use of BIS

26
for measures of body composition will be provided in the following section.
IV. BIS METHODS COMPARISON STUDIES
Since BIS was introduced to the field of body composition, it has gained interest
for use in the clinical setting. Many investigators in the fields of dialysis, weight loss,
HIV, lymphedema, and clinical nutrition are enthusiastic about this method due to its
theoretical potential to accurately assess fluid compartments (TBF, ECF and ICF) as well
as body composition (BCM, FM, FFM). Despite the strong interest in the field, the
evidence to date is conflicting, and a consensus regarding its application in clinical
populations has not yet been established.
Dilution is considered a reference method for the assessment of fluid volumes,
and DXA is recognized by the NKF clinical practice guidelines as an effective tool to
assess FFM, FM and BMC in renal patients (1). Thus, this review of the literature will
focus on those studies that have evaluated BIS for estimates of fluid volume using
dilution as a reference method and those that have evaluated BIS for estimates of FFM
and FM using DXA as a reference method. Studies investigating the ability of BIS to
estimate fluid volumes will be presented first, followed by a review of the studies that
have evaluated BIS for estimates of FFM, FM and %BF. To our knowledge no studies
evaluating BIS for measures of FFM have yet been conducted in ESRD patients;
however, several investigators have conducted studies evaluating the use of SF-BIA and
MF-BIA for FFM and/or FM in this patient population. Although SF-BIA and MF-BIA
differ somewhat from BIS in their underlying theory, important insights for future
research can be gained from these studies and their findings will be presented at the end

27
of the review of the literature. The Descriptions of each study can be found in Table 1
and the major findings of each study are listed in Table 2.
Method comparison studies evaluating absolute measurements are best evaluated
using group mean statistics including correlation coefficients, paired t-tests and standard
errors of the estimate (SEE). In addition, mean differences determined by paired t-test
may not indicate a method is not valid, but rather may point to scaling differences
between devices. Furthermore, individual performance and variability is best evaluated
using Bland-Altman Plots. In this method each subject is represented on the plot by
assigning the mean of the two measurements as the x-axis coordinate and the difference
between the two values as the y-axis coordinate. This method also calculates the mean
bias and provides upper- and lower-limits of agreement that are computed as the mean
bias ± 1.96 SD.
IV.A. BIS Estimates of Fluid Volume
i. Healthy Adults
Most method comparisons studies evaluating BIS have been conducted to validate
its ability to measure fluid volumes. BIS has been evaluated for this purpose in healthy
adults (36, 67, 68) and children (69) as well as multiple clinical populations including GI
disease (70), HIV (71), overweight and obese (72-74) and finally ESRD (51, 75, 76).
Two cross-sectional studies (67, 68) have investigated the ability of BIS to
provide estimates of TBF, ECF and ICF in small populations of healthy males. In both
studies the combination of deuterium and bromide were used to measure TBF and ECF
volumes, respectively. ICF volume was calculated as the difference between TBF and

28
ECF (ICF = TBF – ECF). BIS estimates were also obtained using the same device, the
Xitron 4000B. Armstrong et al (1997) utilized the BIS measurements at 48 frequencies
ranging from 50 – 500 kHz while De Lorenzo et al (1997) utilized the BIS measurements
at 21 frequencies ranging from 1 kHz to 1,248 MHz. In addition, De Lorenzo et al
(1997) compared the standard device constants to new resistivity constants generated
from the study population.
Armstrong et al (1997) reported strong correlation coefficients between both
methods for measures of TBF (r = 0.96, P < 0.001), ECF (r = 0.93, P < 0.001) and ICF
(r = 0.93, P < 0.001). Furthermore, the standard errors of the estimates for these linear
regression analyses were 2.23 L for TBF, 1.26 L for ECF and 1.71 L for ICF. The
analysis for the difference between measures of TBF showed BIS did not generate
estimates that were statistically different from dilution. These mean differences ranged
from -5.40 L to 2.87 L. In contrast, BIS did produce estimates of ECF that were
significantly different from dilution with values ranging from -2.33 to 2.53 L (P < 0.01),
and revealing that BIS overestimated ECF in 12 of 13 subjects. Significant differences
between BIS and dilution were also observed for estimates of ICF. These measures
differed by 2.08 ± 3.08 L (P < 0.05). This study also demonstrated that as FFM and BMI
increased, the methods difference between measures of TBF and ICF became more
negative (r = -0.56 to -0.71, P < 0.05). The authors concluded that despite being highly
correlated with dilution and exhibiting strong test re-test reliability, BIS could not be
validated.
Similarly, De Lorenzo et al (1997) reported strong correlation coefficients

29
between BIS and dilution when either standard device constants or the new population
derived constants were used. The correlations decreased only slightly for TBF (r = 0.95
– 0.94) and ICF (r = 0.87 – 0.80) when the new resistivity constants were used. For ECF
the correlations did not change (r = 0.91, SEE = 0.90). Based on these data the authors
were able to conclude that the resistivity constants used for ECF and ICF had little to no
affect on the measures of fluid volumes in healthy males. No significant differences were
observed when BIS measures, using either resistivity constant, were compared with
dilution. Thus indicating BIS is an accurate method to assess body composition in healthy
males when compared with dilution. These findings contradict the results of Armstrong
et al (1997) who found significant differences between BIS measures of ECF and ICF
compared to dilution.
Although the samples were alike, similar dilution techniques were used and
identical BIS devices were used, the application of different BIS constants and the
different range of frequencies used to apply the BIS electrical current may provide
possible explanations for the differing results between these two studies. In addition,
Armstrong et al (1997) measured BIS fluid volumes in subjects after they had been in the
supine position for greater than 3 hours, while the subjects in the study conducted by
DeLorenzo et al (1997) had only been in the supine position for several minutes. The
inconsistent results may be attributed to the variations in study methods and certainly
underscore the need for a standardized protocol for all body composition assessment
methods.
A much larger study conducted by Ellis and Wong (12) compared BIS estimates

30
of TBF, ECF and ICF to dilution measures in a population of children (n = 387) and
young adults (n = 87). The dilution procedures and BIS device used in this study were
identical to those used in the previous studies of Armstrong et al (1997) and De Lorenzo
et al (1997). Whole body BIS measurements were conducted at frequencies ranging from
1 kHz to 1.2 MHz.
In this study strong correlations between methods were observed for TBF (r2 =
0.95, P < 0.0005), ECF (r 2= 0.84, P < 0.0005) and ICF (r2 = 0.85, P < 0.0005) in both
men and women. BIS produced estimates of ECF that were not significantly different
from dilution. However, significant differences (P < 0.0005) were observed for estimates
of TBF and ICF. Despite finding identical correlation coefficients between genders, the
difference between methods for ECF in males (0.25 ± 1.36 (SD) L) was significantly
different (P < 0.001) from the ECF difference in females (-0.63 ± 1.59 L). Similarly, the
difference between methods for ICF in males (-2.79 ± 3.05 L) was significantly different
(P < 0.001) from the ICF difference value in females (-1.8 ± 2.01 L). Furthermore, linear
regression analyses also showed that for males, the difference in TBF became
significantly more negative (r2 = 0.21, P < 0.0001) as the magnitude of the TBF volume
increased. The same relationship was observed for ECF measures in females (r2 = 0.21, P
< 0.0001) and in ICF measures in both males (r2 = 0.35, P < 0.0001) and females (r2 =
0.13, P < 0.001).
The high correlations reported by Ellis and Wong, 1998 are supported by the
findings of smaller previous studies (36, 67). Despite these strong correlations, the
authors’ have demonstrated that as the magnitude of TBF, ECF and ICF volumes

31
increase; the ability of BIS to accurately measure fluid volume becomes impaired. The
authors’ state that the interchangeability between methods was not met and that further
refinement of constants that account for differences in age and gender are required before
BIS can be accepted with confidence.
A more recent study conducted by Moon et al (68) in a population of healthy
college aged students (n = 28) compared TBF measures obtained by two different BIS
devices (Xitron 4000B and ImpediMed SFB7) with dilution. Dilution measures of TBF
were measured deuterium dilution.
Consistent with the previous studies (36, 67, 69) high correlations between the
Xitron 4000B device (r = 0.96) and the ImpediMed SFB7 device (r = 0.98) compared
with dilution were observed. Despite the strong correlations, the authors found that the
Xitron 4000B device produced TBF measures that were significantly different from
dilution in all subjects (2.26 L, P < 0.025) and all female subjects (3.01 L, P < 0.025).
These findings are in line with those of Ellis and Wong (1998) who showed the mean
difference between the Xitron 4000B and dilution differed between genders, calling into
question the accuracy of gender specific constants used in BIS devices. Individual
agreement was assessed using the Bland-Altman method. Based on this analysis the
ImpediMed SFB7 device had narrower limits of agreement (-4.31 and 4.50 L) than those
observed in the Xitron 4000B device (-8.39 and 3.88 L). In this study, ImpediMed SFB7
correlated slightly better with dilution and generated narrower limits of agreement than
the Xitron 4000B device. Despite performing slightly better than the Xitron 4000B the
authors stated the disagreement at the individual level for both BIS devices was

32
unacceptable.
ii. Pregnant Women
The nutritional status of mothers who are pregnant is critical to the growth and
development of the fetus (43). Therefore the assessments of body composition
parameters that are indicators of nutritional status are important to measure during the
course of pregnancy. Two longitudinal studies (77, 78) have compared BIS measures of
TBF and ECF with dilution during pregnancy. Van Loan et al (1995) evaluated the
accuracy of BIS to measure fluid changes in a small group (n=10) of healthy pregnant
women. Measurements were taken at five different time points before, during and after
pregnancy. Deuterium dilution was used to measure TBF and bromide dilution was used
to measure ECF. Bioimpedance estimates of fluid volume were carried out using the
Xitron 4000B device and the electrical current was applied at specified frequencies
ranging from 5 – 548 kHz. In a similar study, Lof and Forsum, (2004) used the newer
Xitron Hydra 4200 to evaluate the accuracy of BIS to measure fluid changes in a small
group (n=21) of healthy pregnant women before, during and after pregnancy. The
authors also investigated the ability of BIS to estimate fluid volume using new resistivity
constants that were generated within the study population. The estimates obtained using
the new constants were compared to those estimates obtained using the constants
provided by the manufacture that have been validated by De Lorenzo (1997). Deuterium
and 0-18 isotope tracers were used to measure TBF and bromide dilution was used to
measure ECF.
Van Loan et al (1995) reported strong correlation coefficients between both

33
methods for measures of TBF at all five time points (r > 0.77; P-values not reported). In
addition, the mean differences between methods for measures of TBF and ECF volumes
at the five different time points ranged from 0.2-1.6 L for TBF and 1.1-1.7 L for ECF.
These differences were not statistically significant. These results showed BIS measures
of TBF and ECF during pregnancy compare well with those of dilution.
Conversely, Lof and Forsum (2004) showed BIS generated significantly lower
measures of ECF and TBF compared to dilution during the late stages of pregnancy. The
mean differences between BIS and dilution measured at four different time points during
pregnancy, ranged from -3.12 L to -0.13 L for ECF measures and -3.75 L to -0.33 L for
TBF measures. Furthermore, when BIS measures were made using population specific
resistivity constants, significantly lower values of ECF and TBF during the late stages of
pregnancy persisted. These group mean results are inconsistent with the findings of Van
Loan et al (1995) who observed no significant differences between methods for estimates
of TBF and ECF. Assessment at the individual level revealed wide limits of agreement at
all time points for measures of TBF (± 4.66 - ± 5.88 kg) ECF (± 2.08 - ± 3.46 kg) and
ICF (± 3.76 - ± 6.52 kg).
The dissimilar results observed between the studies conducted by Van Loan et al
(1995) and Lof and Forsum (2004) may be due to differences in the population,
gestational weight gains and the resistance coefficients used. Furthermore, Van Loan et
al (1995) used the Xitron 4000B BIS device whereas Lof and Forsum (2004) used the
newer Xitron Hydra 4200 device, this may also have contributed to the disparate results
between the two studies. Again, the discrepancy in the literature between two similar

34
studies underscores the need for standardization of methods and procedures (33).
iii. Gastrointestinal Disease
Patients with gastrointestinal (GI) disorders may experience a significant
diminished or absent capacity to absorb water causing rapid shifts in hydration (70).
Anthropometric measures of body composition are not sensitive enough to identify these
fluid shifts and dilution techniques are too cumbersome and often not suitable for this
patient population. A simple non-invasive method that allows for repeat measures is
needed in this patient population. Carlsson et al (70) conducted a study to evaluate the
ability of BIS to assess body composition in stable patients with an ileostomy (n = 21).
BIS estimated fluid volumes were compared to those measured by dilution. Deuterium
and bromide dilution were used for the assessment of TBF and ECF, respectively. BIS
measurements were obtained using the Xitron Hydra 4200 device; measurements were
taken using 50 frequencies ranging from 5 kHz to 1 MHz.
A strong correlation coefficient was reported between methods for TBF (r = 0.92,
P < 0.001). Correlation coefficients for ECF and ICF were not reported. Based on the
group mean comparisons, BIS generated lower estimates of TBF and ICF and higher
estimates of ECF compared to dilution. The mean difference between BIS estimates of
TBF and dilution in women was -2.21 L and in men was -2.01 L. Statistical significance
of these differences was not reported. The mean differences for ECF and ICF were also
not reported, but interestingly the mean difference between dilution and BIS for measures
of ECF were significantly less in women compared to men (P < 0.01). These results are
in agreement with others who showed mean differences between methods differed

35
significantly between genders (68, 69). In addition, the magnitude of the mean
differences between BIS and dilution are in agreement with the findings of a previous
study (69). Finally, Bland-Altman plots revealed wide limits of agreement between BIS
and dilution for all three fluid compartments (ECF, ICF and TBF). This poor agreement
at the individual level is supported by previous findings from Lof and Forsum, (2004).
Based on the mean differences between methods and the poor individual-level of
agreement, the authors concluded that further research is needed before BIS can be
confidently used in patients with ileostomies.
iv. HIV Patients
Individuals with human immunodeficiency virus (HIV) infection experience
involuntary weight loss and the depletion of BCM. These complications are associated
with increased morbidity and mortality and therefore the monitoring of changes in body
composition are extremely important to this patient population (79). Earthman et al (71)
conducted a study investigating the capability of different SF-BIA, MF-BIA and BIS
methods to measure fluid volume changes in HIV patients (n = 21) being treated with
anabolic therapy. Deuterium dilution was used for measures of TBF and bromide
dilution was used for ECF measures. The ICF volume was calculated as the difference
between TBF and ECF. Impedance measurements were performed using the Xitron
4000B device for the baseline measures of three subjects, and the remaining
measurements were carried out by the Xitron Hydra 4200. Changes in measured fluid
volumes were reported pre- to post-treatment.
The authors found SF-BIA, MF-BIA and BIS devices to be well correlated with

36
dilution for absolute volume measures of TBF (r > 0.90), ECF (r > 0.78) and ICF (r >
0.76). Absolute volume measures of TBF, ECF and ICF did not differ between any of
the methods, and BIS produced estimates that were closest to dilution when compared to
the SF- and MF-BIA estimates. However, only the BIS method was able to produce
measures of ICF and TBF change that were not different from dilution measured volume
changes. The dilution-measured ECF did not change from pre- to post-treatment. This
study demonstrated that absolute fluid volumes and the change in ICF and TBF estimated
by BIS were in good agreement with dilution in HIV patients. These results are similar
to those of Van Loan et al (1997) who reported BIS estimates of absolute fluid volume
and estimates of fluid volume change over time agreed well with dilution in healthy
pregnant women. Moreover, these investigators also showed that BIS measured absolute
fluid volumes and changes in fluid volumes better than the SF-BIA or MF-BIA
approaches.
v. Obese Individuals
The assessment of body composition in overweight and obese individuals is an
important clinical tool to effectively manage and implement weight loss strategies in this
rapidly increasing segment of the population (80). However, some methods of body
composition are not well suited for this patient population. For example anthropometric
measures are difficult to perform due to increased adiposity and the accuracy of DXA has
been shown to decrease as BMI increases (80). Thus it is vital that accurate and reliable
methods of body composition assessment be identified for this patient population. Cox-
Reijven and colleagues have conducted two studies (72, 73) evaluating BIS for estimates
37
of TBF and ECF in overweight and obese individuals. In the first study (72) MF-BIA
and BIS estimates of TBF and ECF were compared to dilution measures. In the second
study (73) the authors investigated the ability of BIS to measure changes in fluid
compartments in morbidly obese females (n = 10) undergoing vertical banded
gastroplasty. BIS and dilution measures of TBF and ECF were taken 2 weeks prior to
surgery and then at three follow up time points post-surgery. The change in fluid volume
was calculated by comparing the pre-surgery volume to each of the post-surgery volume
time points and by comparing all post-surgery volumes to one another. In both studies
the same BIS device (Xitron 4000B) and dilution methods (deuterium for TBF and
bromide for ECF) were used.
In the first study, the authors found that both MF-BIA and BIS produced TBF and
ECF estimates that were highly correlated with dilution (r > 0.858). The mean difference
between both approaches and dilution for TBF estimates ranged from 0.3 – 1.1 L and for
ECF estimates ranged from -1.8 – 1.1 L. BIS generated estimates of TBF that was not
different from dilution. Conversely significant differences between MF-BIA for
estimates of TBF (38.9 ± 3.6 L) compared to dilution (40.0 ± 6.8 L) were observed.
Significant differences in measures of ECF between the MF-BIA (18.3 ± 3.5 L) and BIS
(21.2 ± 3.4 L) compared with dilution (19.4 ± 3.1) were also observed. Although BIS
was in good agreement with dilution for estimates of TBF the authors recommended BIS
be used with caution until the degree of overweight and obesity is incorporated into
equations used by bioimpedance devices (72, 81).
In the second study conducted by Cox-Reijven et al (2002) BIS significantly

38
overestimated the change in ECF at two time points. The authors also demonstrated that
the magnitude of fat loss over time was associated with BIS overestimating the change in
fluid volumes. This finding is evidenced by the significant negative correlations between
the overestimations of TBF (r = -0.644, P < 0.0001) and ECF (r = 0.415, P < 0.001) with
the percent of fat loss. Data from both studies conducted by Cox-Reijven et al (2000,
2002) suggest that BIS is not effective at assessing absolute fluid volumes or changes in
fluid volume during severe weight loss. In addition, the authors speculated that the
magnitude in weight loss might be responsible for the observed overestimation in fluid
changes by BIS.
In a similar but more recent study conducted by Mager et al (74) several MF-BIA
approaches and BIS were evaluated against dilution for estimates of fluid volume in
extremely obese women (n = 16) before and after Roux-en-Y gastric bypass surgery. For
the dilution measures of TBF deuterium dilution was used, and for measures of ECF
bromide dilution was used. BIS estimates of TBF and ECF were obtained using the
newer Xitron Hydra 4200. Volume changes were measured pre-to-post surgery. For
absolute volume estimates, BIS was the only bioimpedance method that provided
estimates of TBF, ECF and ICF that were not different from dilution (P > 0.802). The
MF-BIA approaches generated estimates that differed significantly from dilution (P <
0.002). These findings partially support those of Cox-Reijven and Soeters (2000) who
reported no significant differences between BIS and dilution for measures of TBF in
overweight and obese women. For the change in fluid volumes pre-to-post surgery, BIS
and one of the MF-BIA methods provided estimates of TBF and ICF that were not

39
significantly different from dilution. Again these findings contradict those of Cox-
Reijven et al (2002) who reported that BIS produced significantly different estimates of
fluid volume change before and after weight loss surgery when compared to dilution.
Although good agreement was reported between BIS and dilution for both absolute
volume and changes in fluid volume, Mager et al (2008) demonstrated poor agreement at
the individual level for all methods at all time points, by Bland-Altman analysis. Based
on the wide limits of agreement observed, the authors concluded that BIS is impractical
for the clinical assessment of fluid volumes in the extremely obese.
vi. ESRD Patients
There have been few studies that have attempted to validate BIS against dilution
in ESRD patients. Although the literature is limited, it is well-accepted that the
assessment of body composition in ESRD patients is critical to monitoring nutritional
status, detecting and avoiding the consequences of over- and under-hydration and
estimating dry weight (82). The potential for BIS to accurately monitor nutritional status
and detect changes in hydration and weight would certainly benefit the renal community.
Therefore it is crucial that BIS be evaluated in this patient population. This section of the
review will focus on the studies that have evaluated BIS for estimates of fluid volume in
ESRD patients.
Ho et al (75) evaluated the use of SF-BIA and BIS to assess TBF in patients on
HD therapy (n = 8), matched controls (n = 8) and unmatched controls (n = 9). SF-BIA
and BIS measures of TBF were obtained using the Xitron 4000B device. Both SF-BIA
and BIS approaches were compared to deuterium dilution for estimates of TBF. For

40
patients on HD therapy all measurements, including dilution, were determined pre- and
post-dialysis.
The investigators showed that in all patients and control subjects, estimates of
TBF generated by SF-BIA and BIS were not significantly different from TBF measured
by dilution. The absolute mean difference between methods for the entire study
population was 2.4 L for both bioimpedance methods. In patients on HD therapy the
absolute mean difference between SF-BIA and dilution was 2.3 L, while BIS generated
TBF volume measures that were closer to dilution measures with an absolute mean
difference of 1.8 L. The differences between SF-BIA and dilution and BIS and dilution
were not statistically significant. Moreover, volume loss pre- to post-dialysis calculated
by either method was not significantly different from volume loss measured by scale
weight. These data provide evidence that SF- BIA and BIS provide reliable estimates of
TBF in patients on HD therapy. The authors also showed that when compared to SF-
BIA, BIS provided TBF values that were closer to dilution values.
Despite the compelling results from Ho et al (1994), more recent studies have
observed significant differences between BIS and dilution measures of fluid volume in
ESRD patients (51, 76). Cox-Reijven et al (2001) assessed the relationship between TBF
and ECF measured by BIS against dilution in a population (n=17) of patients on HD
therapy(51). For the dilution method deuterium was used to measure TBF and bromide
was used to measure ECF. The BIS estimates of TBF and ECF were generated using the
Xitron 4000B BIS device.
The authors observed moderate correlations between BIS and dilution for

41
measures of TBF (r = 0.71, P < 0.05) and ECF (r = 0.71, P < 0.05), while the average
difference between methods for TBF was 6.9 L and for ECF was 2.3 L. These
differences were deemed clinically unacceptable, but statistical significance was not
reported. The authors speculated that the differences between the two methods might be
partially due to the way BIS interprets whole-body geometry as a series of five
conductive cylinders (arms, legs and trunk). Similar to previous studies in healthy
populations (68, 69) the differences between TBF and ECF measured by dilution and BIS
were significantly associated with the magnitude of the TBF (r = 0.65; P< 0.05) and ECF
(r = 0.77, P < 0.05) compartments. These findings are in contrast to those reported by Ho
et al (1994), which supported the utility of BIS in HD patients.
The findings of Cox-Reijven et al (2001) are supported by a more recent study
conducted by Moissl et al (76). In this study the newer BIS device, the Xitron Hydra
4200, was evaluated against dilution for estimates of TBF and ECF and TBK counting
for estimates of ICF in a multi center population of ESRD patients (n = 32) and healthy
controls (n = 120). Dilution methods included the use of deuterium and bromide for the
measure of TBF and ECF, respectively. This study was unique in that it adjusted the
standard Hanai mixture theory equations for BMI. This new BIS approach is referred to
as body composition spectroscopy, (BCS).
The authors found that compared to the standard equations, the BCS equations
offered a slight but non-significant improvement in the difference between BIS and
dilution for TBF, ECF and TBK counting for ICF. In ESRD patients, the correlations
between BCS and dilution were strong for TBF (r2 = 0.89), ECF (r2 = 0.80) and ICF (r2 =

42
0.82). The P-values for these correlations were not reported. The mean differences
between BCS and dilution were 1.18 ± 2.56 L, 0.84 ± 1.60 L and 0.58 ± 1.93 L for TBF,
ECF and ICF respectively. Like the correlation coefficients the P-values for these
statistics were not reported. The findings indicate a need for further exploration of the
development of these new equations that take BMI into account.
Summary of Bioimpedance Spectroscopy to Estimate Fluid Volumes
In healthy adult males (36) and healthy pregnant women (43) the Xitron 4000 BIS
device produced fluid volume estimates that were not significantly different from dilution
measures. However, these findings were inconsistent with those of Armstrong et al
(1997), Ellis and Wong (1998), Moon et al (2008) and Lof and Forsum (2004) who
showed BIS produced significantly different estimates of fluid volume when compared to
dilution in healthy adults, young adults, children and healthy pregnant women. These
conflicting results may be attributed to the device used, the range of frequencies
employed, or differences between the study populations and protocols used.
Interestingly, the studies that showed significant differences between methods, also
reported strong correlations between the two methods (67-69, 78). The use of paired t-
tests to compare absolute volume measured by a field technique with that measured by a
reference method is not the best way to evaluate accuracy, because there can be scaling
differences on the reference method to which the field technique was calibrated. Thus,
strong correlations suggest good agreement when absolute volumes are the basis for
comparisons.
BIS has also shown to produce reliable absolute fluid volume estimates and
43
change in fluid volume estimates among several clinical populations including HIV
patients (71) and extremely obese individuals (74). Both of these studies demonstrated
that at the group mean-level BIS and dilution were in good agreement. Results regarding
the individual-level agreement differed. Earthman et al (2000) reported good agreement
at the individual level in HIV while Mager et al (2008) reported unacceptably wide limits
of agreement in extremely obese. Although BIS does hold promise as a useful tool to
assess body composition in clinical populations others have reported poor agreement
among populations with altered body composition including GI disease (70) and obese
individuals (72, 73). The reviewed studies have also demonstrated that the magnitude of
fluid volume (72) and the degree of fat loss (73) were significantly associated with the
difference between dilution and BIS. Future studies that account for these variables and
demonstrate good mean-level and individual-level agreement are warranted before BIS
should be used in the clinical.
Similar inconsistencies in the literature were observed among those studies
conducted in ESRD patients. Ho et al (1994) showed BIS produced estimates of fluid
volumes that were not different from dilution, providing evidence the device is capable of
assessing fluid volumes in ESRD. Others (76, 83) have reported significant differences
at both the group and individual level. The negative result of the two more recent studies
do not necessarily indicate BIS is an unreliable method of assessing body composition in
ESRD. Rather, further investigation of the BCS approach and the refinement of the BIS
methodology are warranted before a definitive conclusion can be made regarding the use
of BIS to assess fluid volumes in ESRD.
44
The studies reviewed above used dilution as a reference method, and like all body
composition methods; dilution has limitations and makes assumptions that may introduce
error into the measures. Altered fluid balance observed in pregnant women and clinical
populations such as HIV patients, obese individuals and ESRD patients may delay the
equilibration time of the isotope tracer and thus produce misleading results when standard
equilibration times are used (20).
IV.B. BIS Estimates of FFM and FM
Although BIS has been primarily used to evaluate fluid status, its advantages as a
field tool has generated substantial interest in its capacity to assess FFM and FM in
various populations. Although there have been no studies investigating BIS in ESRD for
FFM assessment, a few studies have been conducted in other populations including
healthy elderly (29, 48, 81, 84).
i. Healthy Elderly
Aging is associated with a decrease in TBF, bone mass, BCM and FFM (85).
Thus, it is important that methods capable of accurately assessing body composition be
available in this patient population. Recently, Tengvall et al (84) investigated the use of
the Xitron Hydra 4200 BIS device to estimate body composition among elderly Swedes
using DXA as a reference method. The authors also compared BIS measures of total
body skeletal muscle mass (TBSMM) with those previously reported by SF-BIA. This
study included a group of non-institutionalized 75-year-old subjects (n = 98). The DXA
measurements were made using a Lunar Prodigy scanner where body fat (BF), lean soft
tissue (LST) and BMC were measured. Fat-free mass was defined as the sum of LST and

45
BMC, appendicular lean soft tissue (ALST) was defined as the sum of LST in arms and
legs and the total body skeletal muscle mass (TBSMM) was calculated as (TBSMM =
(1.19 X ALST) – 1.65).
In this study BIS estimates of FFM were highly correlated with DXA (r = 0.93,
SEE = 4.4 kg). In addition, non-significant mean differences between methods for
measures of FFM and BF in both men (FFM, 0.56 kg; BF, -0.40 kg) and women (FFM,
0.62 kg; BF, -0.97 kg) were observed. However, increased levels of FFM resulted in an
increased bias in BIS measures of FFM (r = 0.27, P = 0.007). A similar relationship, but
in the opposite direction (negative BIS bias), was observed for BIS measures of BF (r =
0.26, P = 0.009). Lastly, BIS generated estimates of TBSMM that were not different
from TBSMM estimates generated by SF-BIA. Based on the results of the group mean
comparisons, the authors have provided evidence that BIS can be used in the elderly to
estimate FFM and BF. However, systematic bias based on the size of FFM and BF
compartments was observed, indicating estimates at the individual level may not be as
reliable.
ii. GI Disease
Patients with GI disease, such as short bowel syndrome (SBS), often experience
rapid changes in fluid status and malnutrition that can lead to shifts in FFM and FM (29).
These shifts are difficult to monitor simply by evaluating weight change. Therefore,
methods that have the ability to accurately monitor body composition are of importance
to effectively implement nutritional and rehydration therapies in this patient population.
Carlsson et al (2004) evaluated the use of the Xitron Hydra 4200 BIS device to measure
46
TBF and FFM in patients with SBS (n = 19) using DXA and anthropometric
measurements as references. A Lunar DPX-IQ DXA scanner was used to measure FM,
lean tissue mass, BMC and density. Fat-free mass was calculated as the sum of lean
tissue mass and BMC. Total body fluid was estimated assuming the DXA measures of
FFM were hydrated at 73.2% and calculated by multiplying the measured DXA value of
FFM by the hydration constant (0.732).
Based on the group mean-level comparisons both DXA and BIS were highly
correlated with one another (r = 0.92, SEE = 4.29), however; BIS produced estimates of
FFM that did not agree and that were greater than DXA measures in both women (-1.7
kg) and men (-2.5 kg). The authors reported similar poor agreement in a previous study
where BIS was evaluated for estimates of fluid volume in a population of patients with
ileostomies (70). The authors also observed disagreement between DXA and BIS for
estimates of TBF in both women (-1.1 L) and men (-1.8 L). However, these results for
TBF should be interpreted with caution because dilution was not used to generate TBF
estimates. Finally, Bland-Altman plots revealed wide limits of agreement indicating
highly variable measures on an individual basis. It has been shown that the hydration of
FFM in SBS patients is elevated (70) and therefore may introduce error into the body
composition measurements. Furthermore, the authors speculated that the large individual
variability among patients could offer an additional explanation for the disagreement
between methods. The authors concluded that future studies investigating the clinical
relevance of BIS are needed before this method should be adopted for use in patients with
GI disease.
47
iii. Cancer Patients
Patients with advanced cancer may often experience weight loss related to
inflammation, insufficient dietary intake and elevated energy expenditure. These factors
can lead to changes in body composition that are associated with decreased survival (86).
Therefore it is critical that accurate and reliable methods of body composition be readily
available to these patients. In a recent study conducted by Ellegård et al (48) the ability
of BIS to estimate body composition in cancer patients (n = 132) was assessed. BIS
estimates of FFM were compared with DXA. The Lunar DPX-L scanner was used in the
first 45 patients and the Lunar Prodigy scanner was used for the latter 87 patients. To
establish that there were no significant differences between DXA devices, both scanners
measured 15 subjects on the same day. Results revealed no significant differences
between devices and the study population was treated as one group. The instrument
provided measures of FM, leans soft tissue (LST) and BMC. FFM was determined by
summing LST and BMC. BIS measures were performed using the Xitron Hydra 4200.
The authors’ also evaluated measures of FFM by using the BCS equation developed by
Moissl et al (2006) that accounts for BMI.
Results based on group mean-level comparisons showed BIS significantly
underestimated FFM compared to DXA when the standard Hanai mixture theory
equation (7.6 ± 4.8 kg, P < 0.001) was used. The use of the new BCS equation improved
the mean difference between devices slightly, but a statistically significant mean
difference was still observed (4.9 ± 4.1 kg, P < 0.001). Interestingly BIS tended to
underestimate FFM to a greater extent in men compared to women and in those with a
48
BMI < 19 and those with weight loss > 5%. Differences in the two measures were
closely correlated with ratio of ECF/ICF (r = 0.65, P < 0.001). A similar finding was
reported by Cox-Reijven et al (2003) in a population of GI patients. Based on the
individual mean-level comparison wide limits of agreement were observed between both
methods. A possible explanation for discrepancies between the two measures may be due
to the use ECF and ICF resistivity constants that rely on the assumption that FFM is
approximately 73% hydrated and 6.8% bone. These assumptions may not be true in
cancer patients who have altered ECF/ICF associated with weight loss, malnutrition and
inflammation. Therefore the use of BIS with standard equations or those modified to
account for BMI should be used with caution to measure FFM in cancer patients.
iv. Obese Individuals
As the prevalence of obesity continues to increase, so too does the need for
weight loss interventions. Because the primary goal of these weight loss interventions is
to reduce body fat there is a need for simple and reliable methods that assess changes in
fat mass. Furthermore, given the rapidity of weight change following bariatric surgery, it
would also be advantageous to be able to assess FFM changes in this population. Ward
et al (81) conducted a study aimed at evaluating the accuracy of two MF-BIA approaches
and one BIS approach against DXA for measures of FFM in subjects with a wide range
of body mass index’s (BMI). Subjects were categorized into three groups: normal weight
(BMI < 24.9 kg/m2) (n = 46); overweight (BMI 25-29.9 kg/m2) (n = 66); or obese (BMI >
30 kg/m2) (n=45). For the estimation of FFM two MF-BIA approaches using the SEAC
SFB3, MF-BIA device with resistance and reactance at four optimal frequencies: 14.2,
49
56.9, 1887.5 and 679.1 kHz for MF-BIA1 and 25, 50, 100 and 200 kHz for MF-BIA2
were used. The data obtained at these frequencies were then applied to population
specific predication equations for estimates of FFM. BIS measurements were collected
using the SEAC SFB3 device at 496 frequencies ranging from 4 to 1024 kHz. In the
normal weight subjects, the DXA measurements were conducted using a Hologic QDR
scanner and in the overweight and obese subjects, the Lunar DPX-L scanner was used.
Results from this study indicated BIS measures were highly correlated (r = 0.95)
with DXA measures of FFM in normal weight individuals but worsened slightly for
overweight (r = 0.88) and obese individuals (r = 0.81). In the normal weight subjects the
two MF-BIA methods produced FFM estimates that were significantly greater than DXA
(P < 0.005). For the overweight and obese subjects both MF-BIA methods and BIS
produced estimates of FFM that was significantly less than DXA (P < 0.0001). The
authors also found that in overweight and obese subjects the mean difference between
methods was greater for the BIS method than either of the MF-BIA approaches. Also,
the authors calculated the limits of agreement based on the % difference between the BIS
predicted FFM and DXA FFM. They observed wide limits of agreement ranging from
6% to 8% of the DXA measured FFM values in the overweight subjects and from 8.6%
to 11.6% in the obese subjects. Results from this study showed that although MF-BIA
and BIS methods were highly correlated with DXA for estimates of FFM, both MF-BIA
and BIS produced estimates of FFM that had significant group mean and individual
errors in overweight and obese subjects. These results indicate that body composition
estimates obtained using either MF-BIA technique or BIS should be interpreted with
50
caution until appropriate adjustments can be made according to BMI.
Summary of BIS for the Estimation of FFM and FM
In healthy elderly (84) BIS has been shown to produce accurate estimates of FFM
when compared to DXA. These findings support the use of BIS for estimates of FFM in
healthy individuals. In other populations, particularly those with altered hydration status
(29), muscle wasting (48) and aberrant adipose tissue (81); BIS estimates of FFM are
more problematic. In these studies (29, 48, 81) BIS estimates of FFM and FM that were
significantly different from DXA and individual agreement between methods was
considered to be wide and unacceptable in patients with GI disease (29), cancer (48) and
overweight or obese individuals (81). Based on these results, BIS cannot yet be
considered a suitable method for measuring FFM or FM in clinical populations; however,
its ability to reliably measure FFM in healthy elderly (84) supports its use and supports
the need for further investigation.
IV.C. BIA for the Assessment of FFM and FM in ESRD
To our knowledge there have been no studies conducted that have evaluated the
use of BIS against DXA for measures of FFM and FM. However, several studies have
compared SF- and or MF-BIA devices with DXA for measures of FFM, FM and percent
body fat (%BF) (15, 87-90). Although these BIA approaches differ from BIS, namely
through the use of population specific prediction equations instead of biophysical
modeling, important information for future research can still be obtained. Thus, the
remainder of the review will focus on the previous studies that have evaluated BIA
methods against DXA for estimates of FFM, FM %BF.
51
The altered fluid status observed in renal patients is a source of concern and
makes it challenging for clinicians to accurately assess body composition. Stall et al (15)
addressed this concern by comparing measures of %BF obtained using four different
methods of body composition (DXA, TBK, SF-BIA and anthropometry) in a population
of peritoneal dialysis (PD) patients (n = 30) and healthy controls (n = 29). For SF-BIA
estimates the Quantum RJL-101 device was used. Correlation coefficients between SF-
BIA and DXA for measures of %BF in both male (r = 0.67; P < 0.01) and female (r =
0.89; P < 0.001) revealed the methods were well correlated. In male subjects the %BF
measured by SF-BIA did not differ from %BF measured by DXA. In female subjects
the SF-BIA measures of %BF were significantly different (P < 0.05) from %BF
measured by DXA. These findings were independent of whether or not the subjects were
patients on PD therapy or healthy controls. This study suggests SF-BIA and DXA
measures of %BF are not influenced by disease state, but that gender may limit the ability
of SF-BIA to evaluate %BF when compared to DXA.
In a similar study, Woodrow et al (87) compared measures of %BF and FFM by
skinfold anthropometry (SFA) and SF-BIA using the Quantum RJL-101 device against
DXA in a population of PD patients, HD patients, undialysed (UD) patients and healthy
controls. Significant differences between all three methods were observed in the control
group (P < 0.005) for measures of %BF; however, differences were not found between
methods in renal patients for either %BF or FFM. In agreement with Stall et al (1996)
neither SF-BIA nor DXA measures of %BF were different between the renal patients and
healthy controls. Conversely, SF-BIA and DXA generated significantly different values

52
(P < 0.05) of FFM in HD patients (FFMBIA, 45.1 ± 10.2 kg; FFMDXA, 43.8 ± 9.0 kg)
compared to controls (FFMBIA, 50.6 ± 8.9 kg; FFMDXA, 49.1 ± 8.6 kg). In addition, it
was observed that in renal patients, the difference between the two methods for measures
of %BF and FFM were greater at the extremes of body fat content. Therefore method
comparisons done at the group mean level, rather than the individual level, may be
misleading as errors at both extreme ends of body fat content may balance each other out.
At the individual level, the authors found wider limits of agreement between methods in
renal patients compared to controls. The authors indicated the difference between groups
may be due to the alterations in fluid status among renal patients compared to controls.
In a study conducted by Kamimura et al (89), again the Quantum RJL-101 SF-
BIA device was compared with DXA for estimates of body fat (BF) in a population of
long-term HD patients (n = 30). All measures were obtained after a routine HD session.
A strong correlation coefficient between methods was observed (r = 0.91), and in all
subjects BIA produced estimates of BF that were not different from DXA. The mean
difference between methods (BIA-DXA) was 0.39 ± 3.3 kg and the lower- and upper-
limits of agreement were -6.1 kg and 6.9 kg, respectively. BIA did however produce
estimates of BF that were different from DXA when gender was taken into account. In
men, the mean difference between methods for measures of BF was -1.93 ± 2.5 kg and in
women was 2.71 ± 2.3 kg. These results are in agreement with Stall et al (1996) who
demonstrated SF-BIA estimates of %BF differed from DXA based on gender. Moreover,
the authors reported that, as BMI increased there was larger error in BIA measures of BF.
A significant correlation (r = 0.48; P < 0.05) was associated with the difference between
53
methods and BMI. Based on the strong correlation between methods and the non-
significant differences among all subjects, the authors demonstrated BIA provided
reliable estimates of BF in HD patients.
In a similar study conducted by Flakoll et al (88), SF-BIA measures of percent
body fat (%BF) were compared to measures obtained by DXA in a population of renal
patients on HD and peritoneal dialysis (PD) therapy (n = 47). In this study the SF-BIA
device used was the Biodynamic Model 310 Body Composition Analyzer. This study
was unique, in that the authors also compared SF-BIA measures of %BF with air
displacement plethysmography (ADP) measures of %BF in a similar population of HD
and PD patients (n = 38). Similar to the previous study of Kamimura et al (2003) a
strong correlation coefficient (r = 0.84; P < 0.0001) between SF-BIA and DXA was
observed. Conversely a significant mean difference between methods was found among
all subjects and when the study population was stratified by gender (significance
indicated by P < 0.05). The same strong correlation (r = 0.74; P < 0.0001) but
significant mean differences were observed between SF-BIA and ADP. In contrast to the
findings of Kamimura et al (2003), there was no significant association for the mean
difference between SF-BIA and DXA and body fat (or BMI). The authors surmised that
the significant differences observed between methods may be attributed to the use of
prediction equations in SF-BIA. These equations are often generated in healthy
individuals with normal fluid status and may not be suitable for renal patients who often
experience large fluctuations in fluid. The authors suggest the use of prediction equations
developed in renal patients as a possible solution to this problem.

54
In a more recent study conducted by Donadio et al(90) two different SF-BIA
devices, the STA-BIA (Akern, Italy) and the Bioscan (Maltron, UK) and one MF-BIA
device, the Quadscan 4000 (Bodystat, UK) were evaluated against DXA for measures of
FM and FFM in a population of HD patients (n = 27). BIA and DXA were well
correlated with one another for measures of FM (r = 0.75) and FFM (r = 0.90) (P –
values for these correlations were not reported). Even with these correlations, significant
mean differences for measures of FM were observed between DXA and MF-BIA (2.8 ±
4.5 kg, P < 0.01) and DXA and SF-BIA (STA-BIA) (1.9 ± 3.3 kg, P < 0.01). Similarly,
significant mean differences for measures of FFM were also observed between DXA and
the MF-BIA device (-2.7 ± 4.7 kg, P < 0.01) and between DXA and the SF-BIA (STA-
BIA) device (-2.0 ± 3.5 kg, P < 0.01). The findings from this study indicate that
estimates of body composition can vary between devices and results should be interpreted
with caution. A difference in the prediction equations used by each device may explain
the contradictory findings. These data suggest that SF-BIA and MF-BIA devices may not
be suitable for assessing FM and FFM in HD patients.
In summary, studies comparing BIA estimates with DXA have generated
inconsistent results. Three studies (15, 89, 90) demonstrated that BIS produced measures
of FFM and FM that were not different than DXA. It is worth mentioning that two of
these studies (89, 90) observed good agreement between BIA measures and DXA in the
overall study population while, in the study conducted by Donadio et al (2008), good
agreement was found for one of the three BIA devices evaluated. The study conducted
by Stall et al (1996) found good agreement between SF-BIA and DXA in male patients
55
only. In contrast, all of the studies (15, 87-90) found that BIA estimates of FFM, FM
and/or %BF that were significantly different from DXA measures in all patients and or a
subset or subgroup of the study population. Based on the findings of the reviewed
studies, BIA cannot be considered an accurate method to assess FFM, FM or %BF
measures in ESRD patients.
Despite the poor agreement between SF- and MF-BIA and DXA for estimates of
FFM and FM in ESRD, a need to continue this line of investigative research exists.
Furthermore, given that BIS has been reported to generate more reliable estimates of
FFM in normal weight healthy adults compared to SF- and MF-BIA (90); studies that
evaluate BIS for estimates of FFM in ESRD are warranted. Further support for this
research comes from previous studies that have reported good agreement between BIS
and dilution for measures of fluid volume in healthy adults (36) and ESRD patients on
HD (75). Thus we feel there is reasonable scientific justification for the initiation of the
current study that aims to evaluate BIS for estimates of FFM in ESRD.
IV. CURRENT STUDY
Although studies evaluating BIS for estimates of fluid and body composition have
been conducted in various healthy adult and clinical populations, few have focused
specifically on the ESRD patient population and none, to our knowledge have evaluated
BIS against a reference method such as DXA to estimate FFM in this population.
Patients with ESRD experience altered fluid volumes and malnutrition that affect body
composition, most importantly a loss of lean tissue (FFM) (2). The changes in fluid
volume can occur rapidly and malnutrition may lead to an increased risk for morbidity
56
and mortality (1). Thus, there is a need to establish an effective, easy to use method of
assessing body composition in these patients. Previous studies evaluating the use of BIS
for the assessment of body composition have been conducted in populations with altered
fluid status and malnutrition; however, results have been inconsistent. Differences in the
methodology such as the use of different BIS devices as well as the use of different
resistivity constants may be a source of the inconsistencies. In addition, the statistical
methods used may account for the differing results. Most studies comparing BIS to
reference methods of body composition report on the agreement between methods based
on group mean comparisons; however, not all studies have reported on the agreement
between methods based on individual comparisons. Group mean level comparisons are
certainly relevant to evaluating BIS against reference methods; however, differences
between methods at either extreme balance each other out, mask individual errors and
produce misleading results. Furthermore, if BIS is to be used as a reliable clinical
measure of body composition, accuracy at the individual level must be established.
The current study aims to investigate the ability of BIS to estimate FFM in a
group of ESRD patients and healthy controls. DXA was chosen as the reference method
because it is considered a valid tool for assessing FFM in ESRD patients (1). In addition,
the current study uses statistical analyses that evaluate the accuracy of BIS at both the
group mean level and the individual level. Two research questions will be addressed in
this study. First, is BIS an acceptable body composition assessment method to estimate
FFM in ESRD patients on HD therapy, ESRD patients not yet on HD therapy and healthy
controls? Second, are their differences among body composition parameters, measured

57
by either BIS or DXA, between ESRD patients on HD therapy, ESRD patients not yet on
HD therapy and healthy controls?

58
FIGURE 2.1. BODY COMPOSITION COMPARTMENTS
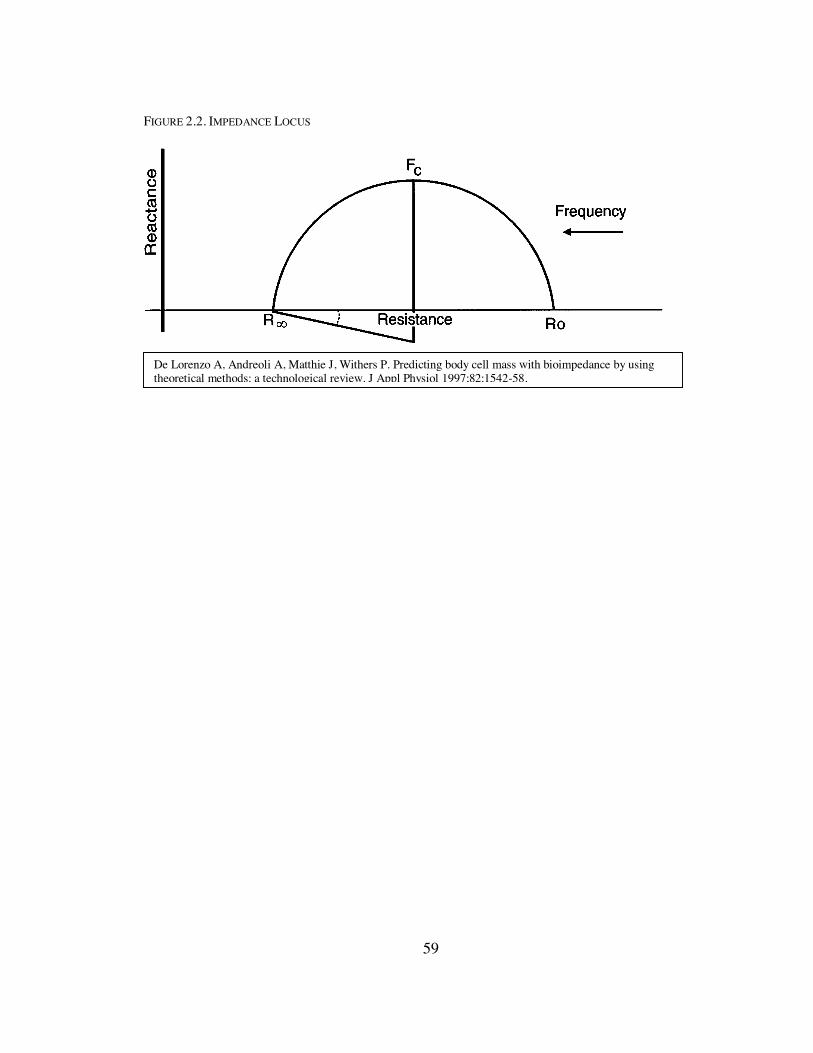
59
FIGURE 2.2. IMPEDANCE LOCUS
De Lorenzo A, Andreoli A, Matthie J, Withers P. Predicting body cell mass with bioimpedance by using theoretical methods: a technological review. J Appl Physiol 1997;82:1542-58.

60
TABLE 2.1. METHOD COMPARISON STUDIES FOR BIS AND BIA: STUDY SPECIFICS
Authors N Age (yrs)
Weight Status (kg) or BMI (kg/m2)
BIS or BIA Method (Device) Study Specifics
Healthy Individuals
Armstrong et al, 1997 13 23 ± 3 25.06 ± 3.55 kg/m2 Xitron 4000B
Cross-sectional analysis conducted on healthy adult males
De Lorenzo et al, 1997
14
28.5 ± 6.64 72.44 ± 10.47 kg Xitron 4000B
Cross-sectional analysis conducted on healthy adult males
Ellis and Wong, 1998
469 (M: 248; F: 221)
M: 11.7 ± 5.8 F: 13.9 ± 6.4
M: 47.0 ± 24.3 kg F: 47.7 ± 20.6 kg Xitron 4000B
Cross-sectional analysis conducted on healthy children and young adults
Moon et al., 2008
28 24 ± 4 72.8 ± 17.58 kg
Xitron 4000B ImpediMed SFB7
Cross-sectional analysis conducted on healthy adults
Tengvall et al, 2009 98 75
M = 26.6 ± 3.0 kg/m2 F = 27.0 ± 5.0 kg/m2 Xitron Hydra 42000
Cross-sectional analysis conducted on healthy elderly
Pregnancy
Van Loan et al, 1995 10
30.1 ± 5.7
Pre-conception: 65.0 ± 7.7 kg Xitron 4000B
Longitudinal analysis conducted on healthy pregnant women at: Baseline (pre-conception), 8-10 weeks gestation, 24-26 weeks gestation, 34-36 weeks gestation and 4-6 weeks post-partum
Lof and Forsum, 2003 21 30 ± 4
Pre-conception: 24.3 ± 5 kg/m2 Xitron Hydra 4200
Longitudinal analysis conducted on healthy pregnant women at: Pre-conception, 14 weeks gestation, 32 weeks gestation,

61
2 weeks postpartum
GI Disease
Carlsson et al, 2002
21 (M: 9; F: 12)
M: 51.8 ± 16.0 F: 50.6 ± 6.7
M: 26.3 ± 7.7 kg/m2 F : 24.6 ± 3.3 kg/m2 Xitron Hydra 4200
Cross-sectional analysis conducted on patients with UC, IDC or CD
Carlsson et al, 2004 19
54 ± 10.2 21.5 ± 3.0 kg/m2 Xitron Hydra 4200
Cross-sectional analysis conducted on patients with short bowel syndrome
HIV Infection
Earthman et al, 2000 21
41.0 ± 7.7
Pre-treatment: 68.1 ± 10.0 kg Post-treatment: 70.4 ± 10.2 kg
Xitron 4000B (3 patients) Xitron Hydra 4200 (remaining patients)
Pre- to post-treatment volume change on patients with HIV infection
Cancer
Ellegard et al, 2009
132 (M: 86; F: 46)
M: 67 ± 12 F: 70 ± 10
M: 22.1 ± 4.0 kg/m2 F: 23.5 ± 3.6 kg/m2 Xitron Hydra 4200
Cross-sectional analysis conducted on patients with cancer
Overweight and Obese Cox-Reijven and Soeters, 2000 90
36.0 ± 9.2 39.7 ± 8.5 kg/m2 Xitron 4000B
Cross-sectional analysis conducted in overweight and obese adults
Cox-Reijven et al, 2002 10
33.9 ± 8.1
Pre-Op: 49.0 ± 7.1 kg/m2
1 yr Post-Op: 29.6 ± 4.5 kg/m2 Xitron 4000B
Pre-to-post vertical banded gastroplasty volume changes in patients with severe weight loss
Ward et al, 2007
157 (Group A: 46; Group B: 66; Group C: 45)
Group A: 33.1 ± 9.7 Group B: 37.8 ± 7.1 Group C: 39.1 ± 5.3
Group A: 22.1 ± 2.0 kg/m2 Group B: 27.7 ± 1.5 kg/m2 Group C: 33.7 ± 3.0 kg/m2 ImpediMed
Cross-sectional analysis conducted on 3 groups (A-C) with a wide range of BMI’s Group A: BMI <24.9 kg/m2 Group B: BMI 25-29.9 kg/m2 Group C: BMI > 30 kg/m2
ESRD
Ho et al, 1994
25 (HD: 8; Matched Controls
HD: 42.5 ± 11.3 MC:
HD (pre-dialysis): 78.5 ± 9.2 kg HD (post-dialysis): 76.5 ± 9.3 kg Xitron 4000
Pre-to-post volume changes in patients on HD. Cross-sectional estimates
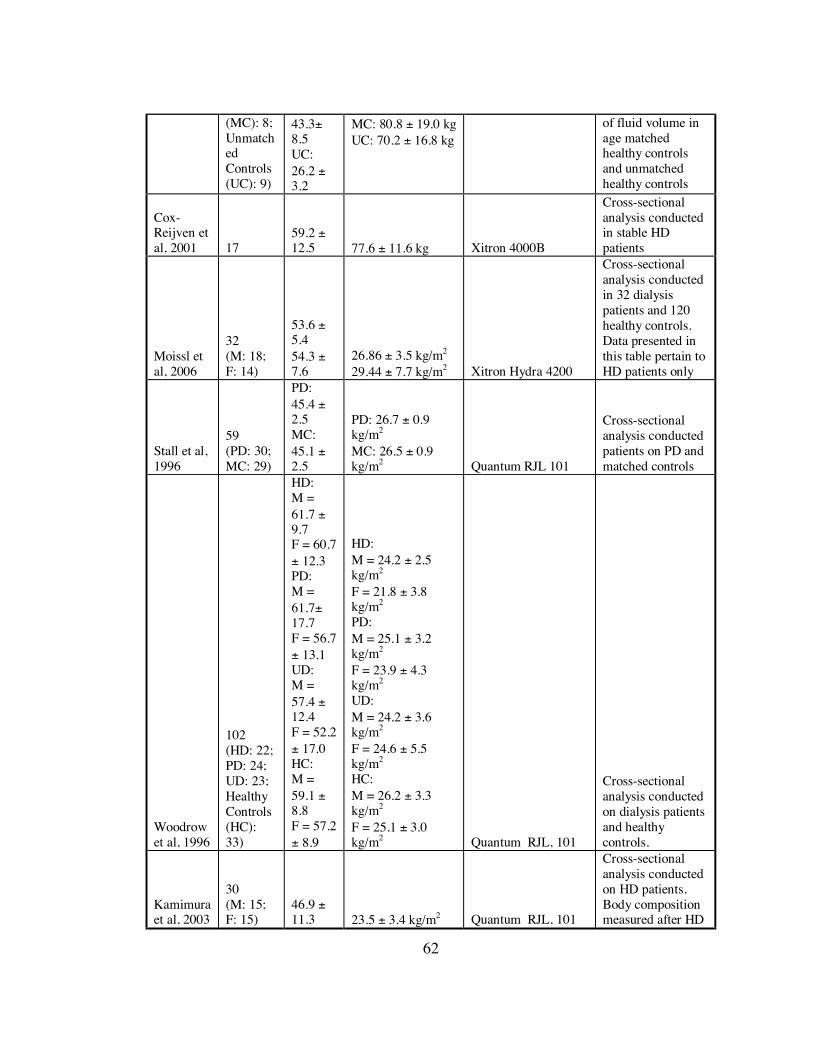
62
(MC): 8; Unmatched Controls (UC): 9)
43.3± 8.5 UC: 26.2 ± 3.2
MC: 80.8 ± 19.0 kg UC: 70.2 ± 16.8 kg
of fluid volume in age matched healthy controls and unmatched healthy controls
Cox-Reijven et al, 2001 17
59.2 ± 12.5 77.6 ± 11.6 kg Xitron 4000B
Cross-sectional analysis conducted in stable HD patients
Moissl et al, 2006
32 (M: 18; F: 14)
53.6 ± 5.4 54.3 ± 7.6
26.86 ± 3.5 kg/m2 29.44 ± 7.7 kg/m2 Xitron Hydra 4200
Cross-sectional analysis conducted in 32 dialysis patients and 120 healthy controls. Data presented in this table pertain to HD patients only
Stall et al, 1996
59 (PD: 30; MC: 29)
PD: 45.4 ± 2.5 MC: 45.1 ± 2.5
PD: 26.7 ± 0.9 kg/m2 MC: 26.5 ± 0.9 kg/m2 Quantum RJL 101
Cross-sectional analysis conducted patients on PD and matched controls
Woodrow et al, 1996
102 (HD: 22; PD: 24; UD: 23; Healthy Controls (HC): 33)
HD: M = 61.7 ± 9.7 F = 60.7 ± 12.3 PD: M = 61.7± 17.7 F = 56.7 ± 13.1 UD: M = 57.4 ± 12.4 F = 52.2 ± 17.0 HC: M = 59.1 ± 8.8 F = 57.2 ± 8.9
HD: M = 24.2 ± 2.5 kg/m2 F = 21.8 ± 3.8 kg/m2 PD: M = 25.1 ± 3.2 kg/m2 F = 23.9 ± 4.3 kg/m2 UD: M = 24.2 ± 3.6 kg/m2 F = 24.6 ± 5.5 kg/m2 HC: M = 26.2 ± 3.3 kg/m2 F = 25.1 ± 3.0 kg/m2 Quantum RJL, 101
Cross-sectional analysis conducted on dialysis patients and healthy controls.
Kamimura et al, 2003
30 (M: 15; F: 15)
46.9 ± 11.3 23.5 ± 3.4 kg/m2 Quantum RJL, 101
Cross-sectional analysis conducted on HD patients. Body composition measured after HD

63
therapy.
Flakoll et al., 2004
47 (HD: 43; PD: 4)
52.7 ± 2.3 25.9 ± 1.0 kg/m2
Biodynamics Model 310 Body Composition Analyzer
Cross-sectional analysis conducted on HD and PD patients. Body composition measured on non-dialysis days.
Donodido et al, 2008 27 32 – 88 17.5-34.4 kg/m2
SF-BIA STA Akern (SF1) Bioscan (SF2) MF – BIA QuadScan 4000 Bodystat
Cross-sectional analysis conducted on HD patients
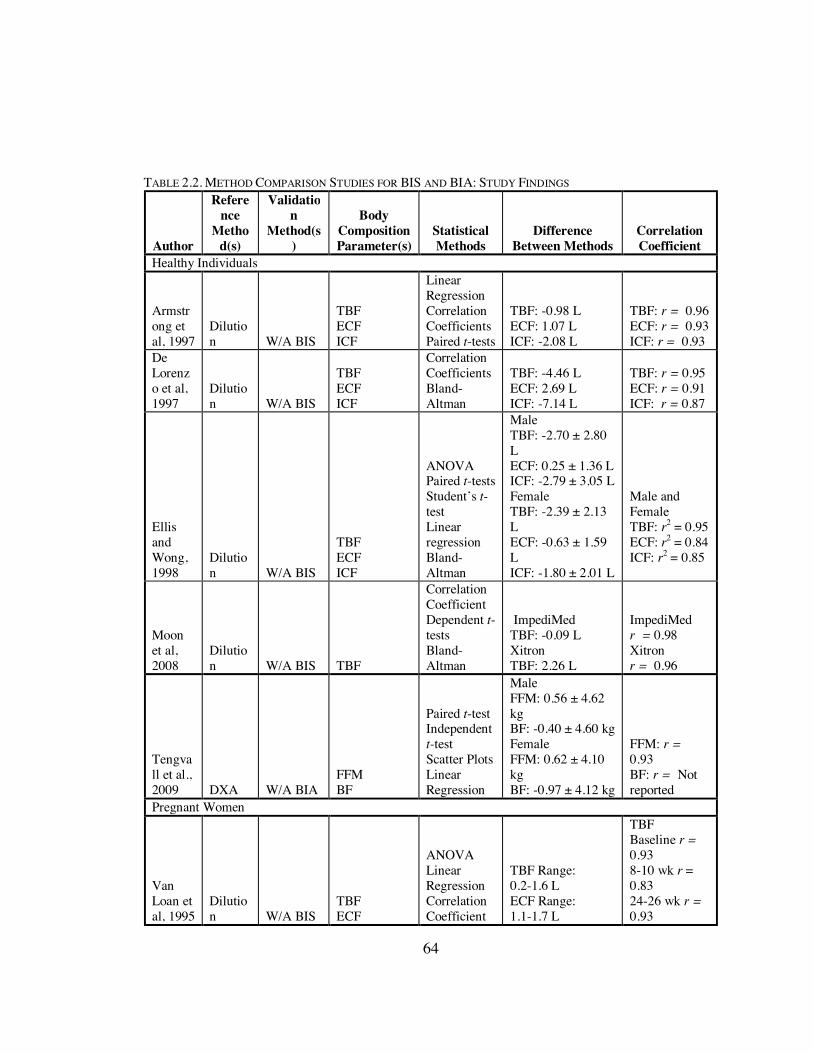
64
TABLE 2.2. METHOD COMPARISON STUDIES FOR BIS AND BIA: STUDY FINDINGS
Author
Reference
Method(s)
Validation
Method(s)
Body Composition Parameter(s)
Statistical Methods
Difference Between Methods
Correlation Coefficient
Healthy Individuals
Armstrong et al, 1997
Dilution W/A BIS
TBF ECF ICF
Linear Regression Correlation Coefficients Paired t-tests
TBF: -0.98 L ECF: 1.07 L ICF: -2.08 L
TBF: r = 0.96 ECF: r = 0.93 ICF: r = 0.93
De Lorenzo et al, 1997
Dilution W/A BIS
TBF ECF ICF
Correlation Coefficients Bland-Altman
TBF: -4.46 L ECF: 2.69 L ICF: -7.14 L
TBF: r = 0.95 ECF: r = 0.91 ICF: r = 0.87
Ellis and Wong, 1998
Dilution W/A BIS
TBF ECF ICF
ANOVA Paired t-tests Student’s t-test Linear regression Bland-Altman
Male TBF: -2.70 ± 2.80 L ECF: 0.25 ± 1.36 L ICF: -2.79 ± 3.05 L Female TBF: -2.39 ± 2.13 L ECF: -0.63 ± 1.59 L ICF: -1.80 ± 2.01 L
Male and Female TBF: r2 = 0.95 ECF: r2 = 0.84 ICF: r2 = 0.85
Moon et al, 2008
Dilution W/A BIS TBF
Correlation Coefficient Dependent t-tests Bland-Altman
ImpediMed TBF: -0.09 L Xitron TBF: 2.26 L
ImpediMed r = 0.98 Xitron r = 0.96
Tengvall et al., 2009 DXA W/A BIA
FFM BF
Paired t-test Independent t-test Scatter Plots Linear Regression
Male FFM: 0.56 ± 4.62 kg BF: -0.40 ± 4.60 kg Female FFM: 0.62 ± 4.10 kg BF: -0.97 ± 4.12 kg
FFM: r = 0.93 BF: r = Not reported
Pregnant Women
Van Loan et al, 1995
Dilution W/A BIS
TBF ECF
ANOVA Linear Regression Correlation Coefficient
TBF Range: 0.2-1.6 L ECF Range: 1.1-1.7 L
TBF Baseline r = 0.93 8-10 wk r = 0.83 24-26 wk r = 0.93

65
34-36 wk r = 0.77 Postpartum r = 0.88 ECF Baseline r = 0.43 8-10 wk r = NA 24-26 wk r = 0.41 34-36 wk r = 0.41 Postpartum r = 0.74
Lof and Forsum, et al, 2003
Dilution W/A BIS
TBF ECF
ANOVA Paired t-test Bland – Altman Linear Regression Correlation Coefficient
TBF Pre-conception: -0.33 ± 4.86 L 14 wks: -1.33 ± 4.70 L 32 wks: -3.75 ± 5.88 L Postpartum: -0.70 ± 4.66 L ECF Pre-conception: -0.13 ± 2.08 L 14 wks: -0.84 ± 3.46 L 32 wks: -3.12 ± 2.92 L Postpartum: -0.84 ± 2.74 L
TBF Pre-conception: r = 0.40 14 wks: r = 0.13 32 wks: r = 0.39 Postpartum: r = 0.31 ECF Pre-conception: r = 0.08 14 wks: r = -0.16 32 wks: r = -0.57 Postpartum: r = 0.12
GI Disease
Carlsson et al, 2002
Dilution DXA W/A BIS
TBF ECF
Unpaired t-test Bland-Altman Linear Regression Correlation Coefficient
TBF(DIL – BIS) M: 2.01 L F: -2.21 L TBF(DXA – BIS) M: 2.61 L F: 1.41 L
TBWDIL: r = 0.92, P < 0.001 TBWDXA: r = -0.94, P < 0.01
Carlsson et al, 2004 DXA W/A BIS
FFM TBF
Paired t-tests Unpaired t-tests Bland-Altman Linear Regression Correlation Coefficient
FFMDXA-BIS: -1.6 kg TBFDXA-BIS: -1.2 L
FFM r = 0.92 TBF r = 0.92

66
HIV Patients
Earthman et al, 2000
Dilution W/A BIS
TBF ECF ICF
ANOVA correlation coefficient RMSE Bland-Altman
Avg Change TBF: 3.5 ± 2.3 L ECF: 0.8 ± 1.2 L ICF: 2.7 ± 1.8 L
Pre-treatment TBF: r = 0.90 ECF: r = 0.78 ICF: r = 0.81 Post-treatment TBF: r = 0.93 ECF: r = 0.78 ICF: r = 0.92 Avg Change # TBF: r = 0.73 # ECF: r = 0.75 # ICF: r = 0.59
Cancer
Ellegard et al, 2009 DXA W/A BIS FFM
Bland-Altman Paired t-test Linear Regression FFM: 7.6 ± 4.8 kg FFM r = 0.89
Overweight and Obese
Cox-Reijven and Soeters, 2000
Dilution
BIS – Linear Regression (LR) BIS – Hanai Mixture (HM)
TBF ECF
Regression Analysis Bland-Altman Paired t-test Linear Correlation
TBF(BIS-LR): 1.1 ± 2.4 L TBF(BIS-HM): 0.3 ± 2.1L ECF(BIS-LR): 1.1 ± 1.8 L ECF(BIS-HM): 0.8 ± 1.7 L
TBF(BIS-LR) r = 0.94 TBF(BIS-HM): r = 0.95 ECF(BIS-LR): r = 0.86 ECF(BIS-HM): r = 0.86
Cox-Reijven et al, 2002
Dilution W/A BIS
TBF ECF
Paired t-test Bland-Altman Linear Regression Correlation Coefficient
TBW: -2.4 L ECF: 0.74 L
TBF: r = 0.69 ECF: r = 0.54
Ward et al., 2007 DXA
W/A BIS MF-BIA FFM
Correlation Coefficient Paired t-test Bland-Altman
BIS Group A: 0.24 kg Group B: -4.59 kg Group C: -7.10 kg
BIS FFMA: r = 0.95 FFMB : r = 0.88 FFMC: r = 0.01
ESRD
Ho et al, 1994
Dilution
BIA-LR BIA-HM TBF
Linear Regression Non-paired t-test ANOVA
TBF: 2.3 L TBF: 1.8 L
Correlation coefficients not reported

67
Cox-Reijven et al, 2001
Dilution W/A BIS
TBF ECF
Regression Analysis Bland-Altman
TBF: 6.9 L ECF: 2.3 L
TBF: r = 0.71 ECF: r = 0.71
Moissl et al, 2006
Dilution TBK
W/A BISxitron W/A BISBCS
TBF ECF ICF
Bland – Altman Linear Regression
All Subjects TBF BCS: -0.2 ± 2.3 L ECFBCS: -0.4 ± 1.4 L ICFBCS: 0.2 ± 2.0 L
HD Patients TBF: r2 = 0.89 ECF: r2 = 0.80 ICF: r2 = 0.82
Stall et al, 1996
DXA TBK Anthropometry SF-BIA %BF
Histogram Plots ANOVA Independent t-tests Correlation Coefficient Bland-Altman
Mean differences not reported
Male FFMDXA: r = 0.67 Female FFMDXA: r = 0.89
Woodrow et al, 1996 DXA SF-BIA
FFM %BF
t test ANOVA
Non-dial (M): FM(DXA): 13.7 ± 8.1 kg FM(BIA) ): 11.9 ± 5.3 kg HD (M): FFM(DXA): 48.1 ± 6.6 kg FFM(BIA) : 52.6 ± 7.4 kg HD (F): FFM(DXA): 35.1 ± 4.2 kg FFM(BIA) : 37.6 ± 6.3 kg PD (F): FFM(DXA): 36.1 ± 3.3 kg FFM(BIA) : 39.9 ± 4.6 kg
Correlation Coefficients not reported
Kamimura et al, 2003 DXA
Skin Fold Anthropometry (SKA) SF-BIA FM
Correlation Coefficient Student’s Independent t test ANOVA Bland-Altman
All Subjects: FM(SKF): 0.49 ± 2.8 kg FM(BIA): -0.39 ± 3.3 kg Male: FM(SKF): 0.40 ± 2.8 kg FM(BIA): -1.93 ± 2.5 kg Female: FM(SKF): -0.53 ± 2.8 kg
All Subjects: SKF vs DXA: r = 0.94 BIA vs DXA: r = 0.91

68
FM(BIA): -2.71 ± 2.3 kg
Flakoll et al., 2004 DXA SF-BIA %BF
ANOVA Linear Regression Bland – Altman
%BF: -2.1% ± 1.0%
Correlation Coefficients not reported
Donadio et al., 2008 DXA
SF-BIA MF-BIA
FM FFM
Regression Analysis Bland-Altman Student’s t-test
FM(SF1): 1.9 ± 3.3 kg FM(SF2): 1.4 ± 3.8 kg FM(MF): 2.8 ± 4.5 kg FFM(SF1): -2.0 ± 3.5 kg FFM(SF2): -1.3 ± 3.8 kg FFM(MF): -2.7 ± 4.7 kg
FM(SF1):0.884 FM(SF2):0.851 FM(MF): 0.753 FFM(SF1): 0.921 FFM(SF2): 0.901 FFM(MF): 0.914

69
Chapter 3: Comparison of Bioimpedance Spectroscopy and Dual-Energy X-Ray Absorptiometry for Assessment of Body Composition in End-Stage Renal Disease ABSTRACT
Background: Malnutrition is a consequence of end-stage renal disease (ESRD) that may
result in altered body composition. Bioimpedance spectroscopy (BIS) is a non-invasive
method of body composition that has the potential to provide reliable estimates of fat-free
mass (FFM) in ESRD patients.
Objective: To evaluate BIS measures of FFM in a population of ESRD patients and
healthy controls.
Design: Sixteen ESRD patients on hemodialysis (HD) therapy (mean body mass index
27.2 ± 5.2 kg/m2; age: 42 ± 15 years), 12 undialysed (UD) ESRD patients (28.8 ± 4.2
kg/m2; 48 ± 8 years) and 23 healthy control subjects (26.6 ± 4.4 kg/m2; mean age: 46 ± 8
years) participated in the present study. Baseline measures of body composition were
determined by dual-energy X-ray absorptiometry (DXA; GE Lunar Prodigy) and
bioimpedance spectroscopy (BIS; Impedimed SFB7) using device software at one time
point prior to a HD treatment modality intervention. Statistical analyses included: a one-
way analysis of variance (ANOVA) to compare mean values of subject characteristics
and body composition measures between the different renal patient groups and healthy
controls, Student’s paired t-tests to compare mean-level accuracy within each group,
Pearson’s product-moment correlation coefficient to evaluate the agreement between
methods, Bland-Altman plots to determine the agreement and individual variability

70
between methods and multiple linear regression to evaluate factors contributing to
measurement bias.
Results: Comparisons of body composition by each method were similar across subject
groups. DXA and BIS produced highly correlated estimates of FFM in HD patients (r =
0.924, P < 0.001), UD patients (r = 0.871, P < 0.001) and control subjects (r = 0.950, P <
0.001). The mean difference between methods (DXA-BIS) for FFM measures did not
differ in HD patients (0.94 ± 5.33 kg), UD patients (-1.89 ± 6.42 kg) or control subjects (-
1.10 ± 4.17 kg). Individual-level agreement between methods was larger among the HD
(11.6 to -9.72 kg) and UD (10.95 to -14.73 kg) ESRD patients compared to controls (7.38
to -9.25 kg). Despite this, 60.7 percent (%) of all ESRD patients had BIS estimates of
FFM that were within 10% of the reference (DXA) value.
Conclusion: BIS estimates of FFM in the ESRD patient groups were not different from
DXA at the group mean-level, but were variable at the individual-level. From these data
it cannot be recommended that BIS be used to evaluate FFM in ESRD patients.
However, the fact that more than half of the ESRD patients had BIS values that fell
within ± 10% of the reference suggests that further evaluation is warranted.
Key Words: Bioimpedance spectroscopy, fat-free mass, body composition, end-stage
renal disease, hemodialysis therapy, dual-energy x-ray absorptiometry
I. INTRODUCTION
End-stage renal disease (ESRD) is characterized by a decreased ability of the
kidneys to excrete and regulate body water, minerals and organic compounds (2).
Hemodialysisis (HD) attempts to manage these symptoms by restoring fluid and
71
electrolyte balance (91). As a result of HD therapy, rapid fluid shifts from the
intracellular fluid (ICF) to the extracellular fluid (ECF) compartment may occur (2).
Loss of lean tissue related to malnutrition and other consequences of renal impairment
may also contribute to altered body composition (2). The prevalence of malnutrition
among patients at the initiation of HD therapy has been reported to be as high as 40%
(59). Nutritional status worsens as the disease state and number of years on HD
progresses. Malnutrition is also known to be a significant predictor of morbidity and
mortality in ESRD (3). Thus it is imperative that accurate and reliable methods to assess
body composition be identified in order to effectively assess the symptoms and severity
of the disease, monitor changes at the fluid and tissue levels and evaluate the efficacy of
therapeutic treatment interventions.
Simple anthropometric measurements of height, weight and BMI are commonly
used to assess nutritional status and estimate body composition (11). These methods are
not sensitive enough to identify fluid shifts and malnutrition, because changes that occur
at the cellular and tissue levels cannot be evaluated (42). DXA is capable of evaluating
body composition with greater sensitivity and is considered to be a reference method for
estimating FFM, FM and bone mineral content (92). It is widely used in a variety of
settings and is recommended by the National Kidney Foundation Kidney Disease
Outcomes Quality Initiative (K/DOQI) clinical practice guidelines as a valid tool for
measuring body composition in renal disease patients (1). Factors limiting its utility
include the cost of instrumentation, exposure to ionizing radiation, inability to quantify
fluid status, non-portability and the requirement for trained technicians (80).

72
Bioimpedance spectroscopy (BIS) is a relatively inexpensive, safe, portable and
easy-to-use method of body composition that has the potential to overcome many of these
limitations. BIS devices measure impedance over a spectrum of frequencies and are
equipped with software that fits the impedance data to the Cole-Cole model through
nonlinear curve fitting (46). The modeled data can then be applied to equations derived
from Hanai mixture theory for the calculation of ECF, total body fluid (TBF) and ICF
(44). Estimates of fat-free mass (FFM) can be calculated based on the manufacturer’s
software (80) and fat mass (FM) may be derived by the subtraction of FFM (kg) from
total body weight (kg) (total body weight (kg) – FFM (kg) = FM (kg)). Application of
the current over a spectrum of frequencies allows for the differentiation of the ECF and
ICF compartments (44). It is the ability to differentiate between these two fluid
compartments and to provide estimates of FFM that make this method especially
appealing to the renal community. A clear consensus regarding the use of BIS to
evaluate body composition in ESRD patients and other clinical populations has not been
reached; in part due to a limited number of studies and limited availability of BIS
devices. The aim of the present study is to evaluate the ability of a relatively new to the
market BIS device to estimate FFM compared to DXA in ESRD patients and healthy
control subjects.
II. SUBJECTS AND METHODS
II.A. Subjects
Subjects in this analysis were part of a larger study designed to evaluate responses
to exercise in patients with ESRD after changing treatments to daily dialysis or
73
transplantation (submitted for publication). The analyses presented here are from the
baseline data collected on 51 of the study subjects (9 females, and 42 males) aged 21 - 64
years (45 ± 11) with mean body mass index (BMI) 27.29 kg/m2. Subjects were recruited
into three groups. Group I consisted of 16 ESRD patients treated with HD (25.8 ± 23.4
mo; range: 3 – 72 mo) who had a mean age of 42.30 ± 14.80 years and a mean BMI of
27.19 ± 5.21 kg/m2. Group II consisted of 12 undialyzed (UD) ESRD patients who had a
mean age of 47.68 ± 10.00 years and a mean BMI of 28.83 ± 4.15 kg/m2. Lastly, group
III consisted of 23 healthy control subjects who had a mean age of 45.85 ± 8.40 years and
mean BMI of 26.55 ± 4.35 kg/m2. ESRD patients were recruited from several dialysis
centers in the San Francisco Bay area and the Minneapolis/St Paul as described by
Painter et al (2010). ESRD patients scheduled for transplant were referred from the
University of California at San Francisco and the University of Minnesota. Patients were
referred to the study by nurse coordinators and/or physicians. Sedentary healthy control
subjects were recruited from kidney donors (> 1 year post donation with normal renal
function as indicated by estimated GFR) at the University of Minnesota. An attempt was
made to match the group of control subjects to the HD and UD patient groups by
percentage of women, and age decades, although there were inadequate donors < 30
years of age.
II.B. Methods
The present study was initiated at the University of California at San Francisco,
and completed at the University of Minnesota. All testing was performed in the General
Clinical Research Center of the respective institutions. Testing was done on a mid-week
74
non-dialysis day, at least 15 hours after completion of the dialysis treatment. Subjects
were instructed to avoid vigorous physical activity 24 hours prior to testing. Due to the
duration of testing and the multiple procedures involved in the overall study, a small
breakfast was provided to subjects 30-45 minutes prior to the body composition analysis.
Body composition was assessed in all subjects by DXA and BIS. DXA measurements of
body composition were taken first, followed by instruction to walk 150 feet and then rest
in the supine position for 10 minutes prior to the BIS measurements. All subjects signed
consent documents approved by the Committee on Human Subjects at the University of
California-San Francisco and the Institutional Review Board at the University of
Minnesota.
Body Composition Assessment
DXA
A DXA whole-body scan was performed using a General Electric Lunar Prodigy
scanner (Lunar Radiation Corp., Madison, WI) and provided estimates of FFM calculated
according to the manufacturer’s software (version 8.8). DXA passes two X-ray energies
through the body. The initial energy emitted is known and the final energy is detected
after passing through the body. These values are then applied to known body mass
attenuation equations and the proportion of FM to FFM is used to determine whole body
composition (25). To help ensure accuracy, subjects were asked to remove all metal
items prior to the DXA scan. None of the female subjects were pregnant at the time of
examination.
BIS

75
BIS measurements of ICF, ECF, and FFM were taken 10 minutes after the
subjects were asked to assume a supine position, using the ImpediMed SFB7 device
(ImpediMed Limited, Eight Mile Plains, Australia). BIS measures the body’s impedance
to an electrical current and based on impedance values, fluid volumes and FFM can be
determined (9). Electrodes were arranged in the traditional tetrapolar configuration, with
injection electrodes placed wrist-to-ankle and sensing electrodes placed hand to foot (56).
For patients on HD therapy, electrodes were placed on the side of the body contralateral
to the arteriovenous fistula. The ImpediMed SFB7 device made ten measurements at 1-
second intervals by applying an electrical current at 256 frequencies ranging from 4 kHz
to 1000 kHz. The cole-cole method of biophysical modeling and the Hanai mixture
theory equations were then used to calculate TBF, ECF, and ICF (36). Estimates of FFM
were calculated per the manufacture’s software.
Statistical Analysis
Data are reported as means ± standard deviation (SD). Comparisons between
methods were made in all subject groups (HD, UD and controls) for measures of FFM.
For group level comparisons: A one-way analysis of variance (ANOVA) was used to
compare the mean values of subject characteristics and body composition measures
between all subject groups, and where ANOVA showed statistically significant
differences, post hoc comparisons for unequal variances were made using the Tamhane’s
test. The Student’s paired t-test was used to compare mean-level accuracy of BIS within
each group and the Pearson’s Product Moment Correlation analysis was used to
determine the relative agreement between DXA and BIS. For individual-level

76
comparisons, the Bland-Altman method was used to determine agreement and individual
differences between the DXA and BIS methods for FFM. The BIS percent differences
from the DXA reference value for estimates of FFM were calculated in each individual
ESRD patient and control subject. BIS bias was calculated by subtracting the BIS value
from the DXA value (DXA-BIS). This bias was evaluated for each subject and also
across subject groups, by ANOVA. By multiple linear regression, individual subject
characteristics have been shown to be predictors of bias among BIS devices (91).
Therefore correlations between subject characteristics of age, gender and BMI were
evaluated for their contribution to the BIS bias in estimates of FFM. To determine if these
variables were significant predictors of BIS bias, a general linear model with backwards
step-wise model selection was fit to the data. Statistical analyses were performed using
SPSS 17.0 for Windows software (SPSS, Inc., Chicago, IL) and statistical significance
was set at an alpha value < 0.05. Bland-Altman plots were created using Sigma Plot 10.0
(Systat Software, Inc. Chicago, IL).
II.C. Results
Subject Characteristics
Mean physical characteristics of all subjects and each of the groups are
summarized in Table 3.1. No significant differences were observed between any of the
groups for age, weight, height or BMI. One ESRD subject had a BMI in the underweight
category (BMI: 16.5 – 18.4 kg/m2) of 17.0 kg/m2. All other ESRD patients and healthy
control subjects had BMIs in the normal (BMI: 18.5 – 24.9 kg/m2) to obese class II (35 –
40 kg/m2) categories that ranged from 20.3 – 35.5 kg/m2. Mean clinical lab values of all

77
subjects and each of the groups are also presented in Table 3.1. For all subjects, the mean
values for calcium, c-reactive protein, glucose, potassium, and sodium fell within the
expected normal ranges (data not shown). Compared to controls, the HD and UD ESRD
patient groups had significantly higher mean values of blood urea nitrogen (BUN) and
creatinine (Cr) and significantly lower mean values of hematocrit (Hct) and hemoglobin
(Hgb). None of the ESRD patients or healthy control subjects presented with
hypoalbuminemia.
Comparison of Body Composition Characteristics Across Groups
Mean body composition measurements of all subjects and groups are summarized
in Table 3.2. No significant differences in body composition by either method were
observed between groups, by ANOVA. The UD patients had a significantly higher ECF
volume than controls and the HD patients had a significantly higher ECF/TBF and
ECF/ICF ratios than controls.
Comparison of BIS vs. DXA for the Measurement of FFM
Group-level Comparisons
DXA and BIS values of FFM for the different study groups are shown in Table
3.2. Estimates of FFM by both methods were not significantly different between any of
the treatment groups by ANOVA. Within all subject groups, BIS produced estimates of
FFM that were not different from DXA by paired t-tests. DXA and BIS measures of
FFM were highly correlated in HD patients (r = 0.924, P < 0.001), UD patients (r =
0.871 P < 0.001) and control subjects (r = 0.950, P < 0.001) (Figure 3.1).
Individual-level Comparisons

78
Agreement between DXA and BIS for estimates of FFM was further evaluated
using the Bland-Altman method. The estimates obtained by DXA and BIS were
averaged and plotted against the difference between the two devices for each group of
subjects. These results are shown in Figure 3.2(a - c). The mean difference between
DXA and BIS was smaller for HD patients (0.94 ± 5.33 kg) and larger for UD patients (-
1.89 ± 6.42 kg) compared to control subjects (-1.10 ± 4.17 kg) (Table 3.3). The upper-
and lower-limits of agreement were wider for all ESRD subjects compared to controls.
Eleven (68.8%) HD patients, 6 (50.0%) UD patients and 20 (87.0%) control subjects had
BIS estimates of FFM that were within ± 10% of the reference value (DXA-measured
FFM) (Table 3.4).
Factors Predicting Bias in BIS Measurements of FFM
Age and BMI were significantly correlated to the bias in BIS (Table 3.5). BMI
and the interactions between gender and BMI and gender and age showed a significant
unique effect in the model predicting BIS bias for estimates of FFM. While holding all
other variables constant, a one-unit increase in BMI resulted in a BIS overestimation of
FFM by 2.588 kg in female subjects and 1.383 kg in male subjects. The effect of BMI
was significant (P = 0.001) and the interaction between gender and age was also
significant (P = 0.017). The interaction between BMI and age approached significance
(P = 0.06) (Table 3.6). The R2 value for this model was 0.429; indicating 42.9% of the
variation in BIS bias for estimates of FFM can be explained by these relationships.

79
II.D. DISCUSSION
We found BIS estimates of FFM were not significantly different from DXA in
any of the treatment groups. Furthermore, the BIS estimates of FFM were highly
correlated with DXA measured FFM values in all treatment groups. Based on these
findings we observed good agreement between BIS and DXA at the group level.
Assessment of individual variability revealed wider limits of agreement among the renal
disease patients compared to the healthy controls. In addition, fewer renal disease
patients had BIS estimates of FFM that fell within ± 10% of the DXA reference value.
Indicating the BIS estimates of FFM were more variable among the renal disease patients
compared to the healthy controls. Our findings also demonstrated that BMI, the
interaction between gender and BMI and the interaction between gender and age had a
significant unique effect in predicting BIS bias.
Although BIS has been primarily evaluated against dilution methods to assess
fluid status among ESRD patients in cross-sectional studies only (51, 75, 76), its potential
for assessing FFM as a nutritional status marker has not yet been evaluated. ESRD is
associated with malnutrition and harmful changes in body composition (2). Early
identification of these changes is critical to effectively assess, manage and treat ESRD.
While DXA is the current method recommended by the K/DOQI clinical practice
guidelines (1), a number of factors make it impractical for use in the clinical setting (80).
BIS is an attractive alternative for estimating body composition in ESRD patients, due to
ease of use, portability and lower cost. In this study we evaluated BIS in ESRD patients,

80
both HD treated and those not yet on HD, for efficacy to estimate FFM, using DXA as a
reference method.
Comparison of Subject Characteristics Across Groups
It is not unexpected that the mean values of BUN and Cr were significantly
higher and mean values of Hct and Hgb were significantly lower in both ESRD patient
groups compared to the healthy control subjects. This is likely attributable to the
decreased ability of the kidney to excrete waste products and synthesize erythropoietin,
resulting in elevated BUN and Cr and depressed Hct and Hgb (2). The observation that
BIS estimates of ECF were significantly greater in UD ESRD patients compared to the
control subjects is also not surprising and reflects the expansion of the ECF compartment,
which frequently occurs in ESRD. Both ratios of ECF/TBF and ECF/ICF were
significantly greater in the group of HD patients compared to the control subjects. This
difference between groups may be explained by the rapid fluid shifts that occur during
HD therapy leading to an expansion of the ECF and a decrease in ICF (2). In the group
of UD patients these ratios were not significantly different than those of the healthy
control subjects. The higher ICF volume in these patients may explain this.
Given the observed differences in clinical lab values and fluid volumes between
subject groups, it is somewhat surprising that ANOVA revealed no significant differences
between subject groups for FFM when measured by either body composition method.
Although it has been previously reported that overhydration in HD patients yielded
significantly different estimates of FFM compared to controls, as measured by DXA (87)
we did not find this to be the case. This lack of significance was observed across all
81
subject groups and may be partially explained by the characteristics of our ESRD patient
population. All ESRD patients were recruited as part of a larger overall study to assess
exercise capacity in ESRD. As part of the inclusion criteria of this larger study, patients
were required to engage in exercise testing without exacerbating their symptoms of
ESRD. Our patient population may therefore be considered healthier than the average
ESRD patient, and thus may explain why no significant differences in body composition
were observed between patients and healthy controls. These data are supported by others
who found no differences in %BF between peritoneal dialysis patients and healthy
control subjects when measured by total-body potassium counting, DXA and single
frequency bioelectrical impedance analysis (SF-BIA) (15).
Comparison of BIS and DXA Measurements
Mean-level Comparisons of DXA and BIS
The previous studies that have evaluated BIS vs. dilution for fluid volume
measures in ESRD have reported mixed results with some finding good mean-level
agreement (75) and others finding significant differences (51). To our knowledge no
other studies have evaluated the use of BIS against DXA for estimates of FFM in ESRD
patients, thus it is difficult to make direct comparisons of our results with other studies.
However, a few studies evaluated the use of SF-BIA (15, 87, 90), and one evaluated
multi frequency bioelectrical impedance analysis (MF-BIA) (90) against DXA for
measures of FFM in ESRD. In these previous studies mean-level comparisons showed
strong correlation coefficients between methods; however, all reported significant mean
differences by paired t-tests between methods for estimates of body composition (15, 87,
82
90). This is in contrast to our findings of no significant mean differences between
methods.
The disparate results between the present study and those conducted previously
may be attributed to differences in bioimpedance methods used. SF- and MF-BIA
require the use of population-specific prediction equations. The equations used in the
previous studies may not have been valid for the study population, to which they were
applied, leading to spurious results. The use of cole-cole biophysical modeling and the
Hanai mixture theory in BIS eliminates the need for prediction equations. Therefore, BIS
may produce better estimates of body composition than BIA in ESRD patients. This
notion is supported by others who have shown BIS to be more effective than BIA
methods in evaluating fluid volumes in ESRD patients on HD therapy (75).
Individual-level Comparisons of DXA and SF-BIA and MF-BIA
No previous studies that evaluated BIS estimates of fluid volume against dilution
in ESRD (51, 75, 76) reported individual level comparisons of dilution and BIS.
However, one study evaluating SF-BIA and MF-BIA estimates of FFM against DXA in
ESRD reported individual-level comparisons, by the Bland-Altman method (90).
Although BIA differs from BIS the authors reported upper and lower limits of agreement
for both SF-BIA and MF-BIA estimates of FFM that were narrower than the limits of
agreement observed across all subject groups in the present study. However, in our study
one subject in the healthy control group and one subject in the HD group had FFM
difference values that were outliers (-11.39 kg and -10.10 kg) of the mean differences for
FFM in their respective group populations. These outliers may explain why wider limits
83
of agreement were observed in the present study when compared to the limits of
agreement observed by Donadio et al (2008). Removal of these outliers would result in a
tighter clustering of data points around the mean difference in both the healthy subjects
and HD patients. Regardless of the outliers, the Bland-Altman plots constructed in the
present study revealed relatively wider limits of agreement among all ESRD patients
compared to healthy control subjects. The difference between healthy controls and
ESRD patients suggests that the variability among individuals may be too large to
produce meaningful measures of FFM in the clinical setting. That said, nearly 61% of
the ESRD patients had BIS-measured FFM values that fell within ± 10% of DXA-
measured values, suggesting that for at least some individuals, BIS may be an accurate
method of evaluation. Factors that may influence accuracy were explored through
multiple regression.
BIS Bias
Our multiple linear regression models show the interactions between gender and
BMI and gender and age had a significant unique effect on predicting BIS bias for
estimates of FFM. Although the BIS studies in ESRD did not evaluate predictors of bias,
our findings are supported by a previous study conducted in healthy individuals by Sun et
al (93) who reported age, gender and BMI were significant explanatory variables of the
variation in MF-BIA estimates of %BF. In addition we were able to show a large portion
(at least 42%) of the variance in BIS bias could be explained by these interactions. While
this explains a fair proportion of the variance in BIS bias, it also indicates that additional
unexplained variance may account for the bias. This remaining bias may be due to

84
measurement error, or to additional covariates that warrant further exploration. It is also
possible that part of the apparent bias observed in BIS estimates may be due to
uncertainties contributed by DXA, the reference method used in the present study.
Limitations
There are several factors that may limit our findings. Cross-sectional data for the
evaluation of body composition assessment methods may yield significantly different
results by paired t-tests even though strong correlations between methods may exist (71).
Furthermore, any field method will be calibrated to a particular reference method. BIS is
typically scaled to multiple dilution because it was originally designed to assess fluid
volumes. FFM estimation was added as a secondary measure and thus scaling
differences may introduce error when cross-sectional measures of FFM are compared
between BIS and DXA. It is recommended that cross-sectional data not be used as the
only means to evaluate body composition assessment methods. Instead, evaluating a
method’s ability to measure changes overtime may provide more compelling information
about its ability to assess body composition particularly for use in the clinical setting
(71).
In addition, it is possible the assumptions made by BIS may have been violated
due to the altered fluid status in the ESRD patient groups. The BIS device used in the
present study utilizes the Hanai mixture theory to calculate measures of body
composition. This mixture theory accounts for the non-conducting elements in the ECF
and ICF, but makes assumptions about their volume and concentrations in the body. In
addition, this theory makes assumptions about the body proportions of the leg, arm, trunk

85
and height (9). Moissl et al (2006), argue that the standard Hanai equations should be
corrected for BMI to improve measures of ICF and TBF in both healthy subjects and
patients with altered fluid status.
Two other factors unrelated to the Hanai mixture theory may be a source of error.
First, FFM is calculated from measures of ECF and ICF volumes. These fluid volumes
are determined based on specific resistivity constants that may not apply to individuals
with altered body composition. Second, BIS relies on the interpretation of the body as a
series of 5 cylinders where ~90% of whole-body impedance comes from the extremities
and ~10% comes from the trunk. Thus, changes in the composition of the limbs and/or
trunk, or fluid shifts occurring during HD therapy may be disproportionately detected
(66). Although this method accounts for individual variation and theoretically provides
estimates of body composition that are more accurate than the SF- and MF-BIA
approaches, the validity of these assumptions and resistivity constants has been
questioned in populations with abnormal fluid status (72, 73, 94). DXA also makes
assumptions about hydration, potassium content and density of the tissues that may be
violated in patients with altered fluid status. While these may be valid assumptions in
healthy populations, fluctuations in hydration status and electrolyte concentrations
occurring as a result of ESRD may lead to erroneous measurements of body composition
(27).
In summary, the present study has demonstrated that at the group mean-level BIS
produces estimates of FFM that are not different from DXA. To the contrary, variability
between methods at the individual-level was large and may be attributed to altered fluid

86
status in the patient population. The variation in BIS bias for estimates of body
composition is partially explained by variables of age, gender and BMI. This study is the
first of its kind and provides novel data to the research field of body composition in
ESRD patients. Future studies that evaluate the ability of BIS to measure changes in
FFM over time, explore other potential confounding variables in BIS bias and involve a
more heterogeneous mix of ESRD patients are warranted before BIS can be
recommended as a valid clinical tool for assessing FFM in ESRD patients.

87
FIGURE 3.1. CORRELATION BETWEEN DXA AND BIS FOR FFM BY SUBJECT GROUPS
DXA - FFM (kg)
30 40 50 60 70 80 90 100
BIS
- FF
M (k
g)
30
40
50
60
70
80
90
100
Figure 3.1. Legend Correlation between fat-free mass (FFM) measured by bioimpedance spectroscopy (BIS)
and dual-energy x-ray absorptiometry (DXA). The dependent variable was FFM
measured by using BIS. In hemodialysis patients ($), the correlation coefficient (r) was r
= 0.924, P < 0.001; in undialyzed patients (%), the coefficient of determination was r =
0.871, P < 0.001and in control subjects (&), the coefficient of determination was r =
0.950, P < 0.001.
BIS
– F
FM (k
g)

88
FIGURE 3.2(A-C). BLAND-ALTMAN PLOTS BY SUBJECT GROUPS (a)
Average FFM by DXA and BIS (kg)30 40 50 60 70 80 90 100
Diff
eren
ce in
FFM
(kg)
(DXA
- B
IS)
-12-10
-8-6-4-202468
10
Mean + 2 SD7.38
Mean-1.13
Mean - 2 SD-9.25
(b)
Average FFM by DXA and BIS (kg)30 40 50 60 70 80
Diff
eren
ce in
FFM
(kg)
(DXA
- B
IS)
-15
-10
-5
0
5
10
15Mean + 2 SD11.61
Mean0.94
Mean - 2 SD-9.64

89
(c)
Average FFM by DXA and BIS (kg)50 55 60 65 70 75 80 85
Diff
eren
ce in
FFM
(kg)
(DXA
- B
IS)
-20
-15
-10
-5
0
5
10
15Mean + 2 SD10.94
Mean-1.89
Mean - 2 SD-14.58
Figure 3.2(a-c). - Legend
Comparison of the measurement of FFM by BIS with DXA in controls (a), HD patients
(b) and UD patients (c) by the Bland & Altman method. Figures show the mean
difference and 95% limits of agreement between methods.

90
TABLE 3.1. PHYSICAL AND CLINICAL CHARACTERISTICS BY SUBJECT GROUPS
*Significantly different from undialysed (Tamhane multiple comparisons of means with
post hoc tests): P < 0.05
†Significantly different from controls (Tamhane multiple comparisons of means with
post hoc tests): P < 0.05
Controls (n = 23)
Hemodialysis (n = 16)
Undialysed (n = 12)
Age (y) 45.85 ± 8.40 42.30 ± 14.80 47.68 ± 10.00 Weight (kg) 82.68 ± 18.65 85.06 ± 21.18 90.66 ± 14.25 Height (m) 1.76 ± 0.10 1.76 ± 0.09 1.77 ± 0.06 BMI (kg/m2) 26.55 ± 4.35 27.19 ± 5.21 28.83 ± 4.15 BUN 17.78 ± 5.38 34.94 ± 10.85*,† 59.18 ± 18.40† Cr 1.15 ± 0.17 8.97 ± 2.27*,† 5.05 ± 2.54† Hgb 14.49 ± 0.94 13.01 ± 0.93† 12.19 ± 1.41† Hct 43.30 ± 2.49 38.69 ± 2.96† 36.23 ± 4.11†

91
TABLE 3.2. BODY COMPOSITION CHARACTERISTICS BY SUBJECT GROUPS
*Significantly different from Controls (Tamhane multiple comparisons of means with
post hoc tests): *P < 0.05
TABLE 3.3. BIS BIAS FOR ESTIMATES OF FFM BY SUBJECT GROUPS
Controls (n = 23)
Hemodialysis
(n = 16)
Undialysed
(n = 12) FFMDXA (kg)
56.57 ± 13.34
61.18 ± 10.26
62.31 ± 8.85
FFMBIS (kg)
57.67 ± 12.84
60.24 ± 13.07
64.20 ± 12.44
TBFBIS (L)
42.18 ± 9.39
44.09 ± 9.57
47.00 ± 9.10
ECFBIS (L)
18.37 ± 3.86
21.74 ± 5.02
22.04 ± 2.93*
ICFBIS (L)
25.40 ± 8.52
22.35 ± 6.90
24.95 ± 7.57
ECFBIS/ TBFBIS
0.44 ± 0.02
0.50 ± 0.08*
0.48 ± 0.08
ECFBIS/ ICFBIS
0.75 ± 0.11
1.06 ± 0.36*
0.96 ± 0.30
Controls (n = 23)
Hemodialysis (n = 16)
Undialysed (n = 12)
Mean ± SD P Mean ± SD P Mean ± SD P DXAFFM – BISFFM -1.102 ± 4.167 0.218 0.944 ± 5.326 0.489 -1.891 ± 6.424 0.330

92
TABLE 3.4. BIS PERCENT DIFFERENCE FROM DXA
BIS – FFM
Difference from reference, DXA
No. of Subjects
Percent of total
' Percent
< 5% 21 41.2 41.2
< 10% 16 31.4 72.6
< 15% 9 17.6 90.2
> 15% 5 9.8 100.0
TABLE 3.5. CORRELATION OF BIS AND SUBJECT CHARACTERISTICS
FFMDXA - FFMBIS Age (y) 0.294† Gender 0.127 BMI (kg/m2) -0.372*
*Correlation is significant at the 0.01 level (2-tailed)
†Correlation is significant at the 0.05 level (2-tailed)
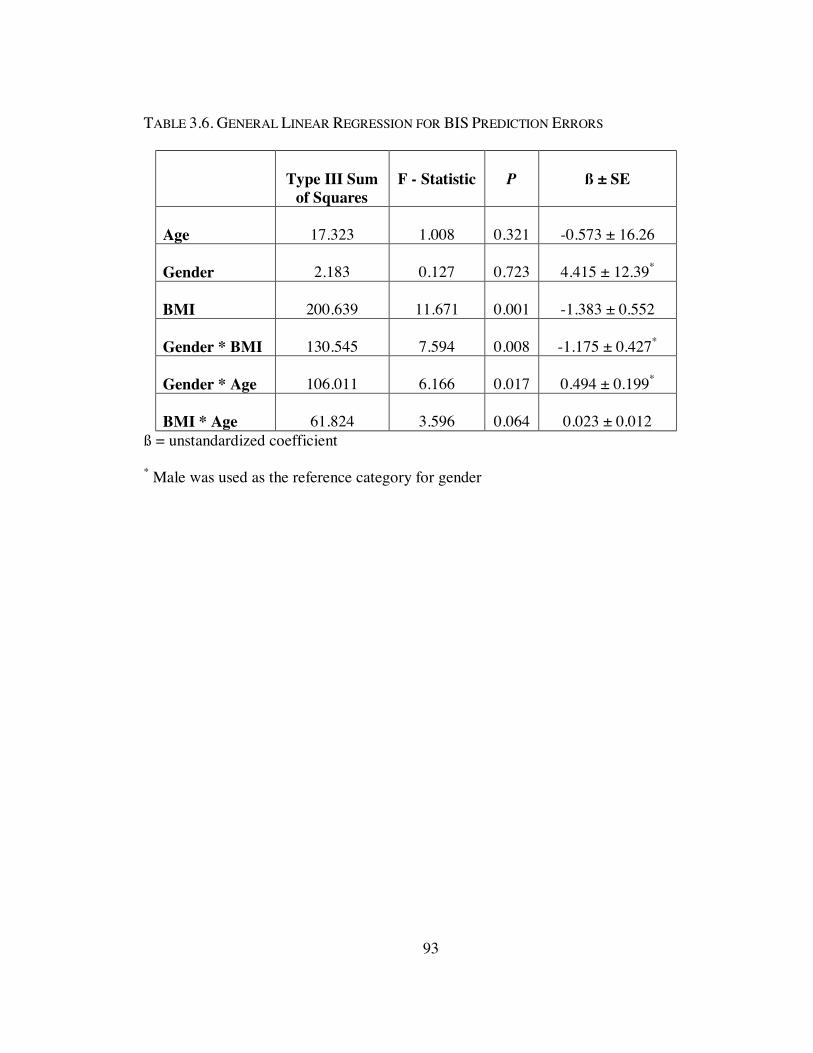
93
TABLE 3.6. GENERAL LINEAR REGRESSION FOR BIS PREDICTION ERRORS
Type III Sum
of Squares
F - Statistic
P
ß ± SE
Age
17.323
1.008
0.321
-0.573 ± 16.26
Gender
2.183
0.127
0.723
4.415 ± 12.39*
BMI
200.639
11.671
0.001
-1.383 ± 0.552
Gender * BMI
130.545
7.594
0.008
-1.175 ± 0.427*
Gender * Age
106.011
6.166
0.017
0.494 ± 0.199*
BMI * Age
61.824
3.596
0.064
0.023 ± 0.012
ß = unstandardized coefficient
* Male was used as the reference category for gender

94
Chapter 4: Conclusion
In the United States the incidence and prevalence of end-stage renal disease
(ESRD) is on the rise (1). As a result, the number of people awaiting transplantation or
requiring dialysis therapy has nearly doubled since 1997 (95). Complications associated
with ESRD and dialysis therapy include malnutrition and tissue catabolism that can lead
to altered body composition (2). These complications highlight the need for reliable,
accurate, and easy to use body composition assessment methods. Bioimpedance
spectroscopy (BIS) is one method that can be safely and easily performed; however, the
reliability and accuracy of this method in ESRD patients has not yet been confirmed.
Sufficient evidence at both the group mean- and individual-level are needed before BIS
can be recommended as a viable clinical tool for the assessment of body composition.
The present study was the first to evaluate BIS for estimates of FFM in ESRD
using DXA as a reference method. Our primary hypothesis was that BIS would provide
measures of FFM that were comparable to those obtained from DXA in ESRD patients
on hemodialysis (HD), ESRD patients not on HD, and healthy control subjects. Our data
support this hypothesis. Based on mean-level comparisons we have demonstrated that in
both ESRD patient groups and the healthy control subjects, BIS provided estimates of
FFM that were highly correlated and not significantly different from DXA. Individual-
level comparisons revealed wider limits of agreement among ESRD patients compared to
healthy controls; however, nearly 61% of the ESRD patients had BIS values that fell
within 10% of the DXA reference measures. These findings suggest that at the group
level and in some individuals, BIS may be an accurate method of FFM assessment in

95
ESRD. Furthermore, we have identified some of the factors that may contribute to
measurement bias. Further research that accounts for these and other factors may lead to
refinement and improved precision in the BIS method.
BIS has gained popularity in the last two decades because it is a safe, easy to use,
and is a portable method to assess body composition. Even though these advantages are
compelling, the device is not flawless and makes assumptions that may not be accurate in
patients with ESRD or fluid imbalances. Accuracy at the individual-level must be further
established before BIS can be confidently used in clinical populations. This method does
however provide promise and further research that explores the accuracy and reliability
of its estimates are crucial to the increasing ESRD patient population.

96
Literature Cited
1. National kidney foundation kidney disease quality outcome initiative (K/DOQI).
clinical practice guidelines for nutrition in chronic renal failure. American Journal of
Kidney Disease, Am J Kidney Dis. 2000;35((suppl 2)):S1-140.
2. Goldstein-Fuchs J, McQuiston B. Renal failure - chapter 33. In: Contemporary
Nutrition Support Practice. 2nd ed. St. Louis Missouri: Saunders; 2006. p. 460-83.
3. Kopple JD. Effect of nutrition on morbidity and mortality in maintenance dialysis
patients. Am J Kidney Dis. 1994 Dec;24(6):1002-9.
4. Bellizzi V, Scalfi L, Terracciano V, De Nicola L, Minutolo R, Marra M, Guida B,
Cianciaruso B, Conte G, Di Iorio BR. Early changes in bioelectrical estimates of body
composition in chronic kidney disease. J Am Soc Nephrol. 2006 May;17(5):1481-7.
5. Donadio C, Consani C, Ardini M, Bernabini G, Caprio F, Grassi G, Lucchesi A,
Nerucci B. Estimate of body water compartments and of body composition in
maintenance hemodialysis patients: Comparison of single and multifrequency
bioimpedance analysis. Journal of Renal Nutrition. 2005 7;15(3):332-44.
6. Lee S, Gallagher D. Assessment methods in human body composition. Current
Opinion in Clinical Nutrition and Metabolic Care. 2008;11:566-72.
7. Moore FD BC. Body cell mass and limits of hydration of the fat-free body: Their
relation to estimated skeletal weight. Ann NY Acad Sci. 1963 1963;110:62-71.

97
8. Moore FD. Clinical implications of research on body composition. Ann N Y Acad Sci.
1963 Sep 26;110:814-20.
9. Buchholz AC, McGillivray CF, Pencharz PB. The use of bioelectric impedance
analysis to measure fluid compartments in subjects with chronic paraplegia. Arch Phys
Med Rehabil. 2003 Jun;84(6):854-61.
10. Shen W, St-Onge M, Wang Z, Heymsfield S. Study of body composition: An
overview. In: Human Body Composition. 2nd ed. ; 2005. p. 11.
11. Going S. Body composition measurement methods. In: Human Body Composition.
2nd ed.; 2005. p. 15.
12. Ellis K. Whole-body counting and neutron activation analysis. In: Human Body
Composition. 2nd ed. ; 2005. p. 51.
13. Cohn SH, Vaswani AN, Yasumura S, Yuen K, Ellis KJ. Assessment of cellular mass
and lean body mass by noninvasive nuclear techniques. J Lab Clin Med. 1985
Mar;105(3):305-11.
14. Wang Z, Zhu S, Wang J, Pierson RN,Jr, Heymsfield SB. Whole-body skeletal muscle
mass: Development and validation of total-body potassium prediction models. Am J Clin
Nutr. 2003 Jan;77(1):76-82.

98
15. Stall SH, Ginsberg NS, DeVita MV, Zabetakis PM, Lynn RI, Gleim GW, Wang J,
Pierson RN,Jr, Michelis MF. Comparison of five body-composition methods in
peritoneal dialysis patients. Am J Clin Nutr. 1996 Aug;64(2):125-30.
16. Forbes G, Lewis A. Total sodium, potassium and chloride in adult man. Journal of
Clinical Investigation. 1956;35:596.
17. Kehayias JJ, Fiatarone MA, Zhuang H, Roubenoff R. Total body potassium and body
fat: Relevance to aging. Am J Clin Nutr. 1997 Oct;66(4):904-10.
18. Kyle UG, Genton L, Hans D, Karsegard L, Slosman DO, Pichard C. Age-related
differences in fat-free mass, skeletal muscle, body cell mass and fat mass between 18 and
94 years. Eur J Clin Nutr. 2001 Aug;55(8):663-72.
19. Lukaski HC. Methods for the assessment of human body composition: Traditional
and new. Am J Clin Nutr. 1987 Oct;46(4):537-56.
20. Schoeller D. Hydrometry. In: Human Body Composition. 2nd ed. ; 2005. p. 35.
21. SIRI WE. The gross composition of the body. Adv Biol Med Phys. 1956;4:239-80.
22. Behnke AR,Jr, Feen BG, Welham WC. The specific gravity of healthy men. body
weight divided by volume as an index of obesity. 1942. Obes Res. 1995 May;3(3):295-
300.

99
23. Lohman T, Chen Z. Dual-enery X-ray absorptiometry. In: Human Body Composition.
2nd ed.; 2005. p. 63.
24. DeVita MV, Stall SH. Dual-energy X-ray absorptiometry: A review. J Ren Nutr.
1999 Oct;9(4):178-81.
25. Blake GM, Fogelman I. The clinical role of dual energy X-ray absorptiometry. Eur J
Radiol. 2009 Sep;71(3):406-14.
26. Plank LD. Dual-energy X-ray absorptiometry and body composition. Current Opinion
in Clinical Nutrition & Metabolic Care. 2005 May;8(3):305-9.
27. King S, Wilson J, Kotsimbos T, Bailey M, Nyulasi I. Body composition assessment
in adults with cystic fibrosis: Comparison of dual-energy X-ray absorptiometry with
skinfolds and bioelectrical impedance analysis. Nutrition. 2005 12;21(11-12):1087-94.
28. Chumlea WC. Anthropometric and body composition assessment in dialysis patients.
Semin Dial. 2004 Nov-Dec;17(6):466-70.
29. Carlsson E, Bosaeus I, Nordgren S. Body composition in patients with short bowel
syndrome: An assessment by bioelectric impedance spectroscopy (BIS) and dual-energy
absorptiometry (DXA). Eur J Clin Nutr. 2004 Jun;58(6):853-9.
30. Kopple JD. National kidney foundation K/DOQI clinical practice guidelines for
nutrition in chronic renal failure. Am J Kidney Dis. 2001 Jan;37(1 Suppl 2):S66-70.

100
31. Chumlea WC, Guo SS, Siervogel RM. Phase angle spectrum analysis and body water.
Appl Radiat Isot. 1998 May-Jun;49(5-6):489-91.
32. Earthman C, Traughber D, Dobratz J, Howell W. Bioimpedance spectroscopy for
clinical assessment of fluid distribution and body cell mass. Nutr Clin Pract. 2007
Aug;22(4):389-405.
33. Kyle UG, Bosaeus I, De Lorenzo AD, Deurenberg P, Elia M, Gómez JM, Heitmann
BL, Kent-Smith L, Melchior J, et al. Bioelectrical impedance analysis—part I: Review of
principles and methods. Clinical Nutrition. 2004 10;23(5):1226-43.
34. Ward L, Cornish BH, Paton NI, Thomas BJ. Multiple frequency bioelectrical
impedance analysis: A cross-validation study of the inductor circuit and cole models.
Physiol Meas. 1999 Nov;20(4):333-47.
35. Chumlea C, Sun S. Bioelectrical impedance analysis. In: Human Body Composition.
2nd ed. ; 2005. p. 79.
36. De Lorenzo A, Andreoli A, Matthie J, Withers P. Predicting body cell mass with
bioimpedance by using theoretical methods: A technological review. J Appl Physiol.
1997 May;82(5):1542-58.
37. Cornish BH, Thomas BJ, Ward LC. Improved prediction of extracellular and total
body water using impedance loci generated by multiple frequency bioelectrical
impedance analysis. Phys Med Biol. 1993 Mar;38(3):337-46.

101
38. Meyer A, Mazariegos M, Solomons NW, Fürst P. The use of bioimpedance
spectroscopy to monitor water changes induced by rehydration in young children with
abnormal water disturbances associated with diarrheal disease. Applied Radiation and
Isotopes. 1998 6;49(5-6):607-10.
39. Sun S, Chumlea C. Statistical methods. In: Human Body Composition. 2nd ed. ;
2005. p. 151.
40. Chumlea WC, Guo SS, Zeller CM, Reo NV, Baumgartner RN, Garry PJ, Wang J,
Pierson RN, Heymsfield SB, Siervogel RM. Total body water reference values and
prediction equations for adults. Kidney Int. 2001 06;59(6):2250-8.
41. Jebb SA, Elia M. Assessment of changes in total body water in patients undergoing
renal dialysis using bioelectrical impedance analysis. Clin Nutr. 1991 Apr;10(2):81-4.
42. Chertow GM, Lowrie EG, Wilmore DW, Gonzalez J, Lew NL, Ling J, Leboff MS,
Gottlieb MN, Huang W, Zebrowski B. Nutritional assessment with bioelectrical
impedance analysis in maintenance hemodialysis patients. J Am Soc Nephrol. 1995
Jul;6(1):75-81.
43. Van Loan MD, Kopp LE, King JC, Wong WW, Mayclin PL. Fluid changes during
pregnancy: Use of bioimpedance spectroscopy. J Appl Physiol. 1995 Mar;78(3):1037-42.
44. Matthie JR. Bioimpedance measurements of human body composition: Critical
analysis and outlook. Expert Rev Med Devices. 2008 Mar;5(2):239-61.

102
45. Jaffrin MY, Morel H. Body fluid volumes measurements by impedance: A review of
bioimpedance spectroscopy (BIS) and bioimpedance analysis (BIA) methods. Med Eng
Phys. 2008 12;30(10):1257-69.
46. Cole K. Membranes, ions and impulses: A chapter of classical biophysics. In:
Berkley, USA: University of California Press,; 1972.
47. Matthie JR. Second generation mixture theory equation for estimating intracellular
water using bioimpedance spectroscopy. J Appl Physiol. 2005 Aug;99(2):780-1.
48. Ellegard LH, Ahlen M, Korner U, Lundholm KG, Plank LD, Bosaeus IG. Bioelectric
impedance spectroscopy underestimates fat-free mass compared to dual energy X-ray
absorptiometry in incurable cancer patients. Eur J Clin Nutr. 2009 Jun;63(6):794-801.
49. Dumler F. Use of bioelectric impedance analysis and dual-energy X-ray
absorptiometry for monitoring the nutritional status of dialysis patients. ASAIO J. 1997
May-Jun;43(3):256-60.
50. Scharfetter H, Wirnsberger GH, Holzer H, Hutten H. Influence of ionic shifts during
dialysis on volume estimations with multifrequency impedance analysis. Med Biol Eng
Comput. 1997 Mar;35(2):96-102.
51. Cox-Reijven PL, Kooman JP, Soeters PB, van der Sande FM, Leunissen KM. Role of
bioimpedance spectroscopy in assessment of body water compartments in hemodialysis
patients. Am J Kidney Dis. 2001 Oct;38(4):832-8.

103
52. Fricke H. A mathmatical treatment of the electrical conductivity and capacity of
disperse systems. II. Phys Rev. 1925;26:678-81.
53. Thomasset A. Bio-electric properties of tissues. estimation by measurement of
impedance of extracellular ionic strength and intracellular ionic strength in the clinic.
Lyon Med. 1963 Jun 2;209:1325-50.
54. Hoffer EC, Meador CK, Simpson DC. Correlation of whole-body impedance with
total body water volume. J Appl Physiol. 1969 Oct;27(4):531-4.
55. Nyboer J, Liedtke R, Reid K, Gessert W. Nontraumatic electrical detection of total
body water and density in man. Med Jadertina. 1983;15(supp.):381-5.
56. Lukaski HC, Bolonchuk WW, Hall CB, Siders WA. Validation of tetrapolar
bioelectrical impedance method to assess human body composition. J Appl Physiol. 1986
Apr;60(4):1327-32.
57. United states renal data system: Annual data report - 2007. Annual Data Report.
2007. Report No.: 4.
58. Depner T, Daugirdas j. Clinical practice guidelines for hemodialysis adequacy,
update 2006. American Journal of kidney Diseases. 2006;48(Suppl 1):S14-76.
59. US renal data system. USRDS 2005 annual data report: Atlas of end-stage renal
disease in the united states. Bethesda, National Institutes of Health, National Institute of
Diabetes and Digestive and Kidney Diseases: 2005.

104
60. Klinger A. High-frequency hemodialysis: Rationale for randomized
clinical trials. Clin J Am Soc Nephrol. 2007;2:390-2.
61. Lacson E,Jr, Diaz-Buxo JA. Daily and nocturnal hemodialysis: How do they stack
up? Am J Kidney Dis. 2001 Aug;38(2):225-39.
62. Walsh M, Culleton B, Tonelli M, Manns B. A systematic review of the effect of
nocturnal hemodialysis on blood pressure, left ventricular hypertrophy, anemia, mineral
metabolism, and health-related quality of life. Kidney Int. 2005 Apr;67(4):1500-8.
63. Dumler F, Kilates C. Use of bioelectrical impedance techniques for monitoring
nutritional status in patients on maintenance dialysis. J Ren Nutr. 2000 Jul;10(3):116-24.
64. Spiegel DM, Bashir K, Fisch B. Bioimpedance resistance ratios for the evaluation of
dry weight in hemodialysis. Clin Nephrol. 2000 Feb;53(2):108-14.
65. Zhu F, Kuhlmann M, Kotanko P, Seibert E, Leonard E, Levin N. A method for the
estimation of hydration state during hemodialysis using a calf bioimpedance technique.
Physiol Meas. 2008;26(6):S503-16.
66. Kyle U, Bosaeus I, De Lorenzo A, Deurenberg P, Elia M, Gomez J, Heitmann B,
Kent-Smith L, Melchior J, et al. Bioelectrical impedance analysis - part II: Utilization in
clinical practice. Clinical Nutrition. 2004;23:1430-53.
105
67. Armstrong LE, Kenefick RW, Castellani JW, Riebe D, Kavouras SA, Kuznicki JT,
Maresh CM. Bioimpedance spectroscopy technique: Intra-, extracellular, and total body
water. Med Sci Sports Exerc. 1997 Dec;29(12):1657-63.
68. Moon JR, Tobkin SE, Roberts MD, Dalbo VJ, Kerksick CM, Bemben MG, Cramer
JT, Stout JR. Total body water estimations in healthy men and women using
bioimpedance spectroscopy: A deuterium oxide comparison. Nutrition & Metabolism.
2008 01;5:1-6.
69. Ellis KJ, Wong WW. Human hydrometry: Comparison of multifrequency
bioelectrical impedance with 2H2O and bromine dilution. J Appl Physiol. 1998
Sep;85(3):1056-62.
70. Carlsson E, Bosaeus I, Nordgren S. Body composition in patients with an ileostomy
and inflammatory bowel disease: Validation of bio-electric impedance spectroscopy
(BIS). Eur J Clin Nutr. 2002 Jul;56(7):680-6.
71. Earthman C, Matthie J, Reid P, Harper I, Ravussin E, Howell W. A comparison of
bioimpedance methods for detection of body cell mass change in HIV infection. Journal
of Applied Physiology. 2000;88(3):944-56.
72. Cox-Reijven PL, Soeters PB. Validation of bio-impedance spectroscopy: Effects of
degree of obesity and ways of calculating volumes from measured resistance values. Int J
Obes Relat Metab Disord. 2000 Mar;24(3):271-80.

106
73. Cox-Reijven P, van Kreel B, Soeters P. Accuracy of bioelectrical impedance
spectroscopy in measuring changes in body composition during severe weight loss. JPEN
J Parenter Enteral Nutr. 2002 March 1;26(2):120-7.
74. Mager JR, Sibley SD, Beckman TR, Kellogg TA, Earthman CP. Multifrequency
bioelectrical impedance analysis and bioimpedance spectroscopy for monitoring fluid and
body cell mass changes after gastric bypass surgery. Clinical Nutrition. 2008
12;27(6):832-41.
75. Ho T, Kushner R, Schoeller D, Gudivaka R, Spiegel D. Bioimpedance analysis of
total body water in hemodialysis patients. Kid. 1994;46:1438-42.
76. Moissl UM, Wabel P, Chamney PW, Bosaeus I, Levin NW, Bosy-Westphal A, Korth
O, Muller MJ, Ellegard L, et al. Body fluid volume determination via body composition
spectroscopy in health and disease. Physiol Meas. 2006 Sep;27(9):921-33.
77. van Loan MD. Estimates of fat-free mass (FFM) by densitometry, dual energy X-ray
absorptiometry (DXA), and bioimpedance spectroscopy (BIS) in caucasian and chinese-
american women. Applied Radiation and Isotopes. 1998 6;49(5-6):751-2.
78. Lof M, Forsum E. Evaluation of bioimpedance spectroscopy for measurements of
body water distribution in healthy women before, during, and after pregnancy. J Appl
Physiol. 2004 Mar;96(3):967-73.

107
79. Bambameto G, Kolter D. Malnutrition in HIV infection. Gastroenterol Clin North
Am. 1997;26(2):393-415.
80. Thomson R, Brinkworth GD, Buckley JD, Noakes M, Clifton PM. Good agreement
between bioelectrical impedance and dual-energy X-ray absorptiometry for estimating
changes in body composition during weight loss in overweight young women. Clinical
Nutrition. 2007 12;26(6):771-7.
81. Ward LC, Dyer JM, Byrne NM, Sharpe KK, Hills AP. Validation of a three-
frequency bioimpedance spectroscopic method for body composition analysis. Nutrition.
2007 9;23(9):657-64.
82. Jaeger JQ, Mehta RL. Assessment of dry weight in hemodialysis: An overview. J Am
Soc Nephrol. 1999 Feb;10(2):392-403.
83. Kooman JP, Cox-Reijven PL, Van der Sande FM, Van den Ham EC, Leunissen KM.
Assessment of body composition in ESRF. Kidney Int. 2001 Jan;59(1):383-4.
84. Tengvall M, Ellegard L, Malmros V, Bosaeus N, Lissner L, Bosaeus I. Body
composition in the elderly: Reference values and bioelectrical impedance spectroscopy to
predict total body skeletal muscle mass. Clin Nutr. 2009 Feb;28(1):52-8.
85. Dey DK, Bosaeus I, Lissner L, Steen B. Body composition estimated by bioelectrical
impedance in the swedish elderly. development of population-based prediction equation

108
and reference values of fat-free mass and body fat for 70- and 75-y olds. Eur J Clin Nutr.
2003 08;57(8):909.
86. Barber MD, Ross JA, Fearon KCH. Cancer cachexia. Surg Oncol. 1999 11;8(3):133-
41.
87. Woodrow G, Oldroyd B, Turney JH, Tompkins L, Brownjohn AM, Smith MA.
Whole body and regional body composition in patients with chronic renal failure.
Nephrology Dialysis Transplant. 1996;11:1613-8.
88. Flakoll P, Kent P, Neyra R, Levenhagen D, Chen K, Ikizler T. Bioelectrical
impedance vs air displacement plethysmography and dual-energy X-ray absorptiometry
to determine body composition in patients with end-stage renal disease. JPEN J Parenter
Enteral Nutr. 2004 January 1;28(1):13-21.
89. Kamimura MA, Avesani CM, Cendoroglo M, Canziani MEF, Draibe SA, Cuppari L.
Comparison of skinfold thicknesses and bioelectrical impedance analysis with dual-
energy X-ray absorptiometry for the assessment of body fat in patients on long-term
haemodialysis therapy. Nephrol Dial Transplant. 2003 January 1;18(1):101-5.
90. C Donadio, A Ben, F Caprio, G Grassi, B Khedr, M Mazzantini. Single- and multi-
frequency bioelectrical impedance analyses to analyse body composition in maintenance
haemodialysis patients: Comparison with dual-energy x-ray absorptiometry. Physiol
Meas. 2008 06;29(6):S517-24..

109
91. Kushner R, de Vries P, Gudivaka R. Use of bioelectrical impedance analysis
measurements in the clinical management of patients undergoing dialysis. Am J Clin
Nutr. 1996 September 1;64(3):503S-509.
92. Prior BM, Cureton KJ, Modlesky CM, Evans EM, Sloniger MA, Saunders M, Lewis
RD. In vivo validation of whole body composition estimates from dual-energy X-ray
absorptiometry. J Appl Physiol. 1997 August 1;83(2):623-30.
93. Sun G, French CR, Martin GR, Younghusband B, Green RC, Xie Y, Mathews M,
Barron JR, Fitzpatrick DG, et al. Comparison of multifrequency bioelectrical impedance
analysis with dual-energy X-ray absorptiometry for assessment of percentage body fat in
a large, healthy population. Am J Clin Nutr. 2005 January 1;81(1):74-8.
94. Gudivaka R, Schoeller DA, Kushner RF, Bolt MJG. Single- and multifrequency
models for bioelectrical impedance analysis of body water compartments. J Appl Physiol.
1999 September 1;87(3):1087-96.
95. Foley R, Collins A. End-stage renal disease in the united states: An update from the
united states renal data system. Journal of the American Society of Nephrology, J Am
Soc Nephrol. 2007;18:2644-8.