bioimpedance-based volume overload at clinical...
TRANSCRIPT
Bioimpedance-based volume overload at clinical target
weight is negative in hemodialysis patients with a high
body mass index
Werner Ribitsch1, Jakob Stockinger2, and Daniel Schneditz2
1Division of Nephrology, Department of Internal Medicine,
and
2Institute of Physiology, Medical University of Graz, Austria
Address correspondence to:
Daniel Schneditz, Ph.D.
Institute of Physiology
Center for Physiologic Medicine
Medical University of Graz
Harrachgasse 21/5
8010 Graz, Austria
phone: +43 (316) 380 4269
fax: +43 (316) 380 9630
e-mail: [email protected]
Short running title: Bioimpedance-based volume in hemodialysis patients
Character count (whole document, including spaces): 29325
Bioimpedance-based volume in hemodialysis patients
Page 2 of 22
Abstract
Objective: To compare volume overload in stable hemodialysis (HD) patients
assessed by standard clinical judgment with data obtained from bioimpedance
analysis.
Methods: Ultrafiltration volume (VU) was delivered as prescribed by standard
clinical practice. Independently, a measure for volume overload was assessed by
a clinical score (SW). The Body Composition Monitor (BCM, Fresenius Medical
Care, Bad Homburg, Germany) was used to derive values for extracellular
volume (VE) and volume overload (VO) before HD. Arterial pressures (P0, P1) and
serum levels of NT-pro-BNP (B0, B1) were evaluated before and after HD.
Results: In 28 patients (11 women, age: 51.3±13.3 y, body mass index, BMI:
18.5 to 40.9 kg/m²; VE 17.91±3.45 L) delivered VU was 2.41±1.03 L and not
different from VO of 2.08±1.49 L derived from bioimpedance analysis. There was
no correlation between VO and VU (r=-0.15, p=0.46) but a negative correlation
between the difference VO-VU (i.e. the volume overload at treatment end) and
BMI (r=-0.49, p<0.01). Positive correlations were observed between B0 and the
relative volume overload (=VO/VE) (r=0.58, p<0.001).
Conclusion: The well recognized relationship between cardiac natriuretic
peptides and volume expansion was confirmed. The volume overload at
treatment end (VO-VU) was negligible for the whole group of patients but more
negative with increasing BMI. It therefore appears that in comparison to
bioimpedance-based evaluation the clinical judgment overestimates volume
overload in obese patients which leads to the delivery of high ultrafiltration
volumes and to volume contraction at the end of a dialysis session in this group
of patients. (250 words)
Keywords: bioimpedance – body mass index – natriuretic peptide – ultrafiltration

Bioimpedance-based volume in hemodialysis patients
Page 3 of 22
Introduction
Volume overload and hypertension are known to importantly contribute to
high cardiovascular morbidity and mortality seen in dialysis patients [1, 2]. The
correct assessment of volume status is especially demanding as only a small
increase in extracellular volume over prolonged periods of time is assumed to
lead to considerable cardiac strain and, as a consequence, to left ventricular
hypertrophy [3, 4]. In clinical practice volume overload is most often judged by
clinical signs such as edema, dyspnea, hypertension, or coughing. It is obvious
that such an assessment is subject to many limitations because these symptoms
are not specific for volume status. To overcome these limitations, alternative and
more objective methods have been suggested. For example, the diameter and
collapsibility of the vena cava measured by ultrasonography is assumed to
provide information on intravascular volume [5, 6, 7]. Pulmonary congestion
seen in the chest X-ray offers another possibility to detect fluid overload [3, 8].
And the N-terminal fragment of B-type natriuretic peptide (NT-pro-BNP) has
been proposed as a serologic biomarker of volume overload. But these methods
have their own limitations, they are time consuming and/or they are not readily
available at the bedside. As of today bioimpedance analysis appears to be the
most promising technique for a simple, user-friendly, standardized, and
objective assessment of patient volume status to be used with every treatment
[9, 10, 11, 12, 13]. With this technique it is not only possible to estimate the
patient’s fluid status with sufficient accuracy but to obtain information on body
composition and nutritional aspects as well [9, 10, 14]. Recent studies have
shown that information derived from bioimpedance analysis is useful to improve
the fluid management in dialysis patients, to save antihypertensive medication,
and to reduce the frequency of intradialytic adverse events [15]. In spite of
these promising results there is an ongoing discussion regarding the reliability
and the clinical value of bioimpedance analysis in clinical practice. Volume
assessment is especially difficult in obese subjects where the distribution of
adipose tissue affects bioelectric measurements and where increased skin turgor
conceals volume depletion assessed by clinical judgment.
The aim of this study therefore was to compare the clinical assessment to the
volume status measured by a new bioimpedance device in everyday practice in a

Bioimpedance-based volume in hemodialysis patients
Page 4 of 22
group of patients with a wide range of body mass indices. Additionally, the
relationships between clinical, bioelectrical, and serological measures of volume
overload were assessed.

Bioimpedance-based volume in hemodialysis patients
Page 5 of 22
Material and Methods
Subjects
Twenty-eight prevalent stable hemodialysis patients from the dialysis unit of
the University Medical Center Graz provided written informed consent to
participate in this study. The study protocol was approved by the local Ethics
Committee of the Medical University Graz. Subjects with pacemakers and
patients with major amputations of extremities were excluded.
Bioimpedance
Fluid status was assessed using the Body Composition Monitor (BCM,
Fresenius Medical Care, Bad Homburg, Germany) measuring so-called whole
body bioimpedance at 50 frequencies within the range of 5 kHz to 1 MHz.
Measurements were done in supine body position after a 5 min of rest as
specified by the manufacturer. Current injection and voltage sensing electrodes
were placed on the wrist and the ankle of the contra-lateral access side of the
body. Measurements were performed immediately before a midweek dialysis
session. Total body water (VT), extracellular (VE) and intracellular water volumes
(VI) were derived from bioimpedance data and the volume overload (VO) was
then calculated by the BCM device, using the proprietary body composition
model as described elsewhere [14, 16, 17].
Parameters
In all patients the body mass index (BMI) was recorded before treatment.
Weight, arterial blood pressures (P0, and P1, respectively), and serum levels of
NT-pro-BNP were determined before and after hemodialysis (B0, and B1,
respectively). NT-pro-BNP was measured by immunoassay (ECLIA Roche
Diagnostics GmbH, Mannheim, Germany).
In all patients the volume status was assessed according to the clinical
volume score (SW) developed by Wizemann and Schilling [18]. In a
questionnaire clinical signs of volume expansion (i.e. different stages of pretibial
edema formation, dyspnea, chronic coughing, rising blood pressure during
ultrafiltration) as well as signs of volume depletion (i.e. presence of thirst,
varying degrees of symptomatic hypotension, muscle cramps, dizziness and
fatigue between dialysis sessions) are recorded and scored. A positive sum of

Bioimpedance-based volume in hemodialysis patients
Page 6 of 22
the scored symptoms indicates volume expansion while a negative sum indicates
volume depletion.
Treatment settings such as blood flows and dialysate compositions as well as
the removal of excess volume by ultrafiltration were delivered as prescribed
without adjustment. Delivered ultrafiltration volumes (VU) were recorded.
Statistical analysis
Pearson´s correlation coefficients were determined for variables B0, B1, VO, VU,
VO/VE and SW. χ2- and two-sided t-tests were used to assess differences among
groups. For all tests, the significance level was set at 5%. Statistical calculations
were done with SPSS, Version 17.0 for Windows (SPSS Inc., Chicago, IL, USA).

Bioimpedance-based volume in hemodialysis patients
Page 7 of 22
Results
Twenty-eight patients (11 women, 51.3±13.3 years) were studied (Tab. 1).
The mean arterial pressure before dialysis (P0) was 102.6±15.5 mmHg and
significantly correlated with the clinical volume score (WS) (r=0.44, p<0.05).
Mean arterial pressure after dialysis (P1) significantly fell to 93.1±17.9 mmHg
(p<0.01).
The ultrafiltration volume effectively removed (VU) determined from the
difference between pre- and post-dialysis body mass was 2.4±1.0 L and
0.45±0.16 L larger than the ultrafiltration volume prescribed according to the
patient’s target body mass. This small difference was most likely due to a
systematic overestimation of fluid ingested during dialysis and/or the amount of
fluid required to rinse the blood from the extracorporeal circulation. However,
both volumes where highly correlated (r=0.99, p<0.001) and the ultrafiltration
volume effectively removed (VU) was used for further analysis. This volume was
not different from the mean volume overload (VO) of 2.08±1.49 L obtained from
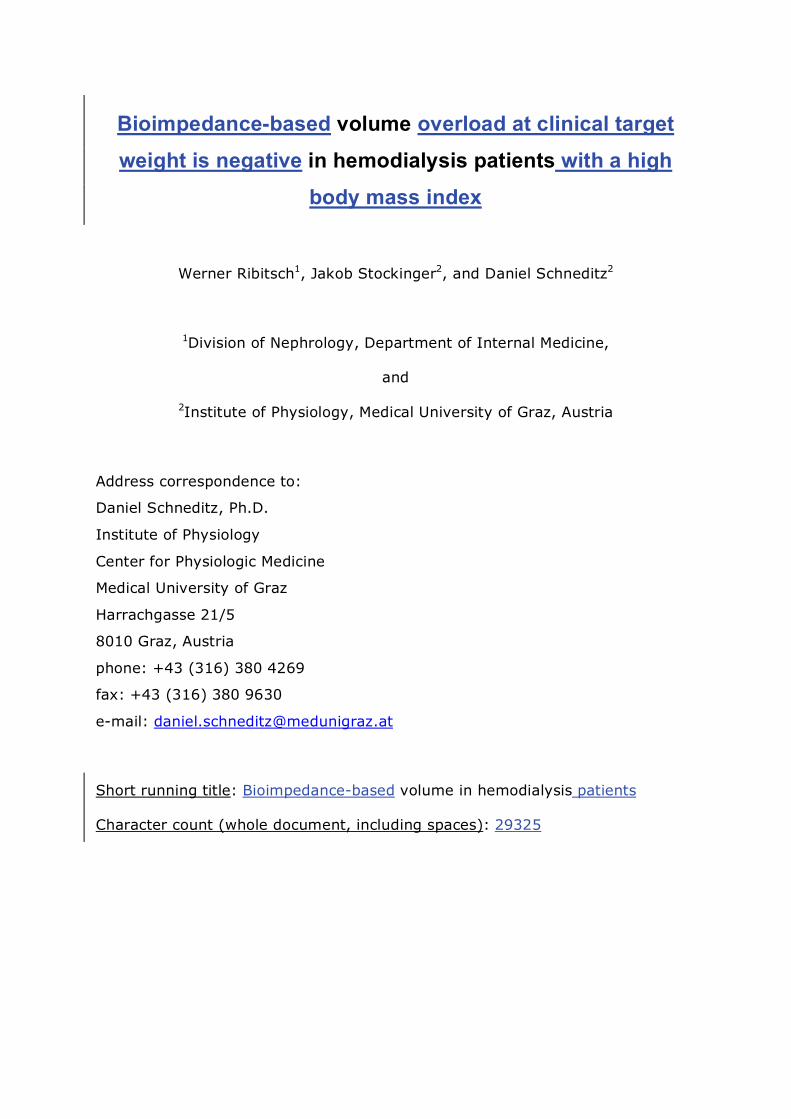
bioimpedance analysis (p=n.s., t-test). Bland-Altman analysis showed a small
bias of -0.33 L for the difference (VO-VU), albeit with considerable limits of
agreement (-4.2 to 3.5 L) (Fig. 1). In spite of this small bias determined for the
whole group there was no correlation between VU and VO in individual studies
(r=-0.13, p=0.51). There was a positive correlation between VU and BMI
(r=0.47, p<0.01) and a negative correlation between VO and BMI (r=-0.31,
p=0.12). Thus, the difference (VO-VU) was also significantly correlated to BMI
(r=0.49, p<0.01) (Fig. 2). BMI was significantly correlated to body mass
(r=0.91, p<0.001) so that high BMI was due to high mass and not to small
stature.
Post-dialysis blood pressures (P1) as well as the drop in arterial pressures (P0-
P1) were negatively correlated to ultrafiltration volume VU (P1: r=-0.43, p<0.05;
P0-P1: r=-0.59, p<0.001) and positively correlated to post-dialysis volume
overload VO-VU (P1: r=0.44, p<0.05; P0-P1: r=0.41, p<0.05). Post-dialysis
pressure P1 was negatively correlated with body mass Mb (P1: r=-0.41, p<0.05)
and BMI (P1: r=-0.52, p<0.01).
Predialytic NT-pro-BNP levels (B0) were negatively correlated with body mass
(r=-0.31, p<0.05) and positively correlated with relative volume overload

Bioimpedance-based volume in hemodialysis patients
Page 8 of 22
(VO/VE) (r=0.58, p=0.001, Fig. 3). Last, but not least, NT-pro-BNP levels
significantly dropped during dialysis (p<0.05).

Bioimpedance-based volume in hemodialysis patients
Page 9 of 22
Discussion
The main observations of this study are: a) There was a close correspondence
between estimated volume overload obtained from bioimpedance analysis VO
and ultrafiltration volume VU for the whole group of patients, albeit with wide
limits of agreement; b) at the same time, there was no correlation between VO
and VU in individual patients; and c) there was a negative correlation between
this discrepancy quantified as VO-VU with body mass index.
The negligible bias between estimated volume overload and ultrafiltration
volume is in support of the null-hypothesis that for the whole group of patients
volume overload was adequately removed as prescribed by routine clinical
practice. This result therefore appears to be in support of bioimpedance
measurements and model calculations provided by the BCM. The limits of
agreement, however, were wide, presumably because of the large range in body
mass and BMI of the study population (Tab. 1). Thus, the comparison of VO and
VU requires a more careful analysis.
In individual studies, there was no relationship between VO and VU, and the
reason for this discrepancy can be attributed to errors in the prescription of VU
according to clinical routine and/or to errors in the estimation of VO by
bioimpedance analysis. Indeed, the BCM has been validated for subjects with a
BMI between 18 and 32 kg/m², and volume estimates in patients with a BMI
outside that range are therefore uncertain. On the other hand, there was only a
slight trend for VO to decrease as BMI increased in this study. It therefore
appears as if BCM predictions could be extended into the higher BMI range.
Others have observed that volumes derived from so-called whole-body
bioimpedance measurements are more variable in obese subjects and the
question therefore arises whether segmental measurements should be preferred
in this setting [19, 20, 21]. Part of the variability in obese subjects is most likely
due to the different contribution of adipose tissue on whole-body bioimpedance
depending on its distribution between the trunk (visceral, central fat) and the
limbs (peripheral fat). This effect is comparable to the different contribution of
extracellular fluid on whole-body bioimpedance whether it is located in the trunk
or in the limbs [22]. It has been shown that the redistribution of fluid between
the trunk and the limbs affects the measurement and the interpretation of so-

Bioimpedance-based volume in hemodialysis patients
Page 10 of 22
called whole bioimpedance data [23, 24, 25] and for this reason an immediate
measurement before dialysis treatment is recommended by the manufacturer of
the BCM. The fluid shifts between body segments probably also explain the
differences in post-dialysis bioimpedance seen after long 8 h treatments where
fluid is allowed to equilibrate across the body compared to regular 4 h
treatments where such equilibration is more likely incomplete [26].
VU was observed to increase with BMI which is plausible, as larger patients
tend to accumulate more volume. Therefore, the difference VO-VU significantly
decreased with increasing BMI. The difference VO-VU refers to the volume
overload at the end of dialysis, a positive value representing a (positive) volume
overload, and a negative value representing a volume deficit, respectively. A
(positive) volume overload at the end of dialysis is not so surprising because of
the well known difficulties to remove excess fluid volume from the patient during
hemodialysis for hemodynamic reasons [27]. More surprising, however, is the
negative correlation of volume overload with increasing BMI. In fact, at very
high BMI the difference VO-VU was always negative in our study. Especially in
obese patients the clinical assessment seems to overestimate patient volume
status thus leading to high ultrafiltration and consequently to volume depletion
at the end of a dialysis session. One can argue that the standard clinical
assessment of volume to be removed by ultrafiltration was inaccurate because of
limitations mentioned above. This assumption is confirmed by the poor
correlation found between bioimpedance measures and the clinical score in this
cross-sectional analysis. The negative correlation between post-dialysis blood
pressure P1 with body mass Mb and BMI also indicates that more volume was
removed in large patients than that required to reach the same blood pressure
in the whole study group.
Part of the overestimation, however, is inherently linked to body size. It is
clear that - everything else being equal - the large patient is less susceptible to a
given volume overload or volume contraction compared to the small patient,
essentially because the capacity to buffer the same volume perturbation
increases with body size. Therefore, if volume removal is for example prescribed
to attain the same blood pressure, more volume is automatically removed in the
large patient. As current clinical practice attempts to remove as much volume as
Bioimpedance-based volume in hemodialysis patients
Page 11 of 22
possible, the large patient is more likely to be volume contracted compared to
the BCM estimate. This approach, however, is in debate [28, 29].
Consistent with the well-known fact that elevated cardiac natriuretic peptides
reflect volume expansion [30, 31, 32, 33] we found a positive relationship
between predialytic NT-pro-BNP levels and the estimated pre-dialysis volume
overload VO. NT-pro-BNP levels significantly decreased during dialysis and
ultrafiltration. This decrease cannot exclusively be tied to the improved volume
situation because NT-pro-BNP is also cleared with high-flux dialysis. As NT-pro-
BNP is affected by other factors beyond volume expansion, it fails to be a
reliable tool for assessing patient dry mass. For example, it was recently shown
that elevated NT-pro-BNP concentration was also related to malnutrition [34]. In
our study, NT-pro-BNP concentration in obese patients was inversely related to
body mass, supporting the existence of such a relationship and the hypothesis of
inverse epidemiology regarding obesity in dialysis patients. This observation is
also consistent with our finding that at the end of dialysis obese patients
appeared to be volume contracted compared to the BCM estimate.
A limitation of the present study is of course the small number of patients and
the lack in statistical power. On the other hand, bioimpedance analysis was
tested in a standard clinical setting thus providing practical information for
everyday routine.
In conclusion, the well recognized relationship between cardiac natriuretic
peptides and volume expansion was confirmed. In addition, there was no
significant difference between clinically-based and bioimpedance-based volume
assessment in the whole group of patients. However, there was a large
discrepancy between clinically- and bioimpedance-based estimates in individual
patients depending on BMI. At the end of dialysis obese patients appeared to be
volume contracted compared to the BCM estimate. The clinical implications of
this observation remain to be elucidated in future and larger studies.

Bioimpedance-based volume in hemodialysis patients
Page 12 of 22
Conflict of interest
None to declare.

Bioimpedance-based volume in hemodialysis patients
Page 13 of 22
Disclosure
This work originated from a diploma thesis [35] and part of it has been
presented and published in abstract form at the Annual Meeting of the Austrian
Society of Nephrology, Oct. 2-3, in Graz, Austria [36], and at the XVII ERA-EDTA
Congress – II DGfN Congress, June 25–28, 2010, in Munich, Germany [37].

Bioimpedance-based volume in hemodialysis patients
Page 14 of 22
Acknowledgement
We thank Dr. C. Weber from Fresenius Medical Care Austria GmbH for
providing the Body Composition Monitor. Dr. W. Ribitsch was supported by a
research grant from Baxter Healthcare Austria. This work was partly supported
by the Austrian Research Promotion Agency (FFG).
Bioimpedance-based volume in hemodialysis patients
Page 15 of 22
Fig. 1
Volume overload and ultrafiltration volume
Bland-Altman analysis for volume overload VO and ultrafiltration volume VU
comparing the difference (VO-VU) to the average of both measures. The mean
difference is indicated by the full line, the limits of agreement (± 2 SD) are given
by the broken lines (n=28).

Bioimpedance-based volume in hemodialysis patients
Page 16 of 22
Fig. 2
Volume overload and body mass index
Difference between volume overload and ultrafiltration volume (VO-VU) (i.e.,
the volume overload at the end of dialysis) plotted vs. body mass index BMI.
The broken line shows the linear regression given as y=3.90-0.16x; r2=0.24,
p<0.01 (n=28).

Bioimpedance-based volume in hemodialysis patients
Page 17 of 22
Fig. 3
NT-pro-BNP and volume overload
Correlation between predialytic levels of NT-pro-BNP and the relative
predialytic volume overload (VO/VE): r2=0.58; p≤0.001; line of linear regression
(dotted line).

Bioimpedance-based volume in hemodialysis patients
Page 18 of 22
Tab. 1
Patient and treatment characteristics in presented in the order of increasing
BMI (n=28)
M0 BMI P0 P1 VE VO VU VO-VU VO/VE B0 B1 SW
kg kg/m² mmHg mmHg L L L L % pg/mL pg/mL
45.2 18.5 130.3 119.0 13.7 4.0 1.9 2.2 29.2 30137 11704 1
49.7 19.6 116.7 98.3 13.3 1.9 2.7 -0.8 14.3 10690 14044 -3
65.5 20.5 112.3 87.3 16.6 1.1 3.9 -2.8 6.6 3795 1747 0
66.7 21.1 89.0 104.7 18.1 1.9 1.5 0.4 10.5 2144 1431 0
55.5 21.3 96.7 106.3 14.3 1.1 0.0 1.1 7.7 2436 2477 0
53.4 21.3 107.3 108.0 11.7 0.0 1.4 -1.4 0.0 5157 5545 0
68.3 21.7 109.7 115.0 18.9 1.7 3.7 -2.0 9.0 4639 3135 0
77.3 22.2 112.7 98.7 20.8 3.0 1.7 1.3 14.4 5413 3055 2
67.7 22.9 83.0 77.7 19.3 4.9 2.0 2.9 25.4 17145 20088 2
68.1 23.7 90.7 71.3 15.5 0.5 2.1 -1.6 3.2 566 372 0
71.0 24.0 122.3 101.0 16.8 2.2 1.5 0.7 13.1 35000 35000 8
68.4 24.2 121.0 105.3 15.0 1.4 3.3 -1.9 9.3 4138 2895 5
76.5 24.5 110.3 106.7 19.8 3.2 2.3 0.9 16.2 3884 1848 -2
69.9 24.9 112.7 91.0 18.7 3.4 2.5 0.9 18.2 14328 5704 0
60.7 25.0 83.3 71.3 14.8 3.3 2.5 0.8 22.3 17407 9268 -4
67.2 25.3 88.0 126.7 14.3 2.7 1.3 1.4 18.9 35000 25798 -1
74.5 26.1 112.0 116.3 20.5 5.0 1.7 3.3 24.4 7060 8342 0
86.1 28.8 84.3 93.3 17.9 0.5 1.6 -1.1 2.8 1288 1663 -4
95.1 29.1 116.7 101.7 22.7 4.9 2.2 2.7 21.6 3064 2357 2
87.0 29.7 117.0 99.3 20.0 1.8 2.4 -0.6 9.0 17605 11311 0
74.0 30.2 101.7 69.3 14.7 1.4 3.0 -1.6 9.5 14606 5911 0
76.0 31.0 60.3 51.3 16.8 2.3 2.9 -0.6 13.7 8333 5443 -3
87.5 31.6 91.7 88.0 15.5 0.0 1.1 -1.1 0.0 571 642 -3
88.0 32.2 101.3 89.0 21.8 2.7 3.3 -0.6 12.4 7230 4909 1
105.8 36.4 117.7 96.3 20.7 1.9 3.4 -1.5 9.2 7601 9379 -4
119.2 36.4 86.7 65.0 23.7 0.8 3.5 -2.7 3.4 258 165 0
122.0 38.2 100.0 74.7 26.0 1.2 4.8 -3.6 4.6 965 619 -3
107.6 40.8 97.3 75.0 19.6 -0.5 3.3 -3.8 -2.6 833 1019 0
x 76.9 26.8 102.6 93.1* 17.9 2.1 2.4 -0.3 11.7 9332 6995* 0
SD 19.3 5.9 15.5 17.9 3.4 1.5 1 1.9 8.1 9887 8093 2.6
Abbreviations: number of subjects, n; predialytic body mass, M0; body mass index, BMI; pre- and post-dialytic mean arterial pressures, P0, P1; extracellular volume, VE; volume overload VO; relative volume overload, VO/VEC; delivered ultrafiltration volume, VU; pre- and post-dialytic NT-pro-BNP, B0, B1; clinical

Bioimpedance-based volume in hemodialysis patients
Page 19 of 22
score according to Wizemann et al., SW; *p<0.05 (post- compared to pre-dialytic values)
Bioimpedance-based volume in hemodialysis patients
Page 20 of 22
References
[1] Wizemann V, Wabel P, Chamney P, Zaluska W, Moissl U, Rode C, Malecka-Masalska T, Marcelli D. The mortality risk of overhydration in haemodialysis patients. Nephrol Dial Transplant. 2009; 24: 1574-1579. http://ndt.oxfordjournals.org/cgi/content/abstract/gfn707v1
[2] Charra B, Chazot C. Volume control, blood pressure and cardiovascular function. Nephron Physiology. 2003; 93: p94-p101. http://www.karger.com/DOI/10.1159/000070242
[3] Charra B. Fluid balance, dry weight, and blood pressure in dialysis. Hemodialysis International. 2007; 11: 21-31. http://www.blackwell-synergy.com/doi/abs/10.1111/j.1542-4758.2007.00148.x
[4] Stegmayr BG. Ultrafiltration and dry weight: What are the cardiovascular effects? Artif Organs. 2003; 27: 227-229. http://www.blackwell-synergy.com/links/doi/10.1046/j.1525-1594.2003.07205.x/abs
[5] Yanagiba S, Ando Y, Kusano E, Asano Y. Utility of the inferior vena cava diameter as a marker of dry weight in nonoliguric hemodialyzed patients. ASAIO J. 2001; 47: 528-532. http://journals.lww.com/asaiojournal/Fulltext/2001/09000/Utility_of_the_Inferior_Vena_Cava_Diameter_as_a.26.aspx
[6] Ando Y, Yanagiba S, Asano Y. The inferior vena cava diameter as a marker of dry weight in chronic hemodialyzed patients. Artif Organs. 1995; 19: 1237-1242. http://dx.doi.org/10.1111/j.1525-1594.1995.tb02292.x
[7] Mandelbaum A, Ritz E. Vena cava diameter measurement for estimation of dry weight in haemodialysis patients. Nephrol Dial Transplant. 1996; 11: 24-27. http://ndt.oxfordjournals.org/content/11/supp2/24.abstract
[8] Kayatas M, Ozdemir N, Muderrisoglu H, Ulucam M, Turan M, Hizel N. Comparison of the non-invasive methods estimating dry weight in hemodialysis patients. Ren Fail. 2006; 28: 217-222.
[9] Krämer M, Rode C, Wizemann V. Detection limit of methods to assess fluid status in dialysis patients. Kidney Int. 2006; 69: 1609-1620. http://dx.doi.org/10.1038/sj.ki.5000286
[10] Wabel P, Chamney P, Moissl U, Jirka T. Importance of whole-body bioimpedance spectroscopy for the management of fluid balance. Blood Purificat. 2009; 27: 75-80. http://www.karger.com/DOI/10.1159/000167013
[11] Kooman JP, Van Der Sande FM, Leunissen KML. Wet or dry in dialysis—can new technologies help? Semin Dial. 2009; 22: 9-12. http://dx.doi.org/10.1111/j.1525-139X.2008.00533.x
[12] Schneditz D. The arrow of bioimpedance. Kidney Int. 2006; 69: 1492-1493. http://dx.doi.org/10.1038/sj.ki.5000125
[13] Raimann J, Liu L, Tyagi S, Levin NW, Kotanko P. A fresh look at dry weight. Hemodialysis International. 2008; 12: 395-405. http://dx.doi.org/10.1111/j.1542-4758.2008.00302.x
[14] Chamney PW, Wabel P, Moissl UM, Muller MJ, Bosy-Westphal A, Korth O, Fuller NJ. A whole-body model to distinguish excess fluid from the hydration of

Bioimpedance-based volume in hemodialysis patients
Page 21 of 22
major body tissues. Am J Clin Nutr. 2007; 85: 80-89. http://www.ajcn.org/cgi/content/abstract/85/1/80
[15] Machek P, Jirka T, Moissl U, Chamney P, Wabel P. Guided optimization of fluid status in haemodialysis patients. Nephrol Dial Transplant. 2010; 25: 538-544. http://ndt.oxfordjournals.org/cgi/content/abstract/25/2/538
[16] Moissl UM, Wabel P, Chamney PW, Bosaeus I, Levin NW, Bosy-Westphal A, Korth O, Müller MJ, Ellegård L, Malmros V, Kaitwatcharachai C, Kuhlmann MK, Zhu F, Fuller NJ. Body fluid volume determination via body composition spectroscopy in health and disease. Physiol Meas. 2006; 27: 921-933. http://www.iop.org/EJ/abstract/0967-3334/27/9/012/
[17] Wizemann V, Rode C, Wabel P. Whole-body spectroscopy (BCM) in the assessment of normovolemia in hemodialysis patients. Contrib Nephrol. 2008; 161: 115-118.
[18] Wizemann V, Schilling M. Dilemma of assessing volume state--the use and the limitations of a clinical score. Nephrol Dial Transplant. 1995; 10: 2114-2117. http://ndt.oxfordjournals.org
[19] Levin NW, Zhu F, Seibert E, Ronco C, Kuhlmann MK. Use of segmental multifrequency bioimpedance spectroscopy in hemodialysis. Contrib Nephrol. 2005; 149: 162-167. http://content.karger.com/ProdukteDB/produkte.asp?Doi=85482
[20] Park J, Yang WS, Kim SB, Park SK, Lee SK, Park JS, Chang JW. Usefulness of segmental bioimpedance ratio to determine dry body weight in new hemodialysis patients: a pilot study. American Journal of Nephrology. 2009; 29: 25-30. http://www.karger.com/DOI/10.1159/000148647
[21] Medrano G, Eitner F, Floege J, Leonhardt S. A novel bioimpedance technique to monitor fluid volume state during hemodialysis treatment. ASAIO J. 2010; 56: 215-220. http://journals.lww.com/asaiojournal/Fulltext/2010/05000/A_Novel_Bioimpedance_Technique_to_Monitor_Fluid.11.aspx
[22] Scharfetter H, Monif M, Laszlo Z, Lambauer T, Hutten H, Hinghofer-Szalkay H. Effect of postural changes on the reliability of volume estimations from bioimpedance spectroscopy data. Kidney Int. 1997; 51: 1078-1087.
[23] Zhu F, Schneditz D, Wang E, Levin NW. Dynamics of segmental extracellular volumes during changes in body position by bioimpedance analysis. J Appl Physiol. 1998; 85: 497-504. http://jap.physiology.org/
[24] Zaluska WT, Schneditz D, Kaufman AM, Morris AT, Levin NW. Relative underestimation of fluid removal during hemodialysis hypotension measured by whole body bioimpedance. ASAIO J. 1998; 44: 823-827.
[25] Zhu F, Schneditz D, Levin NW. Sum of segmental bioimpedance analysis during ultrafiltration and hemodialysis: A new technique with reduced sensitivity to changes in body position. Kidney Int. 1999; 56: 692-699. http://www.nature.com/ki/journal/v56/n2/abs/4490948a.html
[26] Basile C, Libutti P, Di Turo AL, Casucci F, Losurdo N, Teutonico A, Vernaglione L, Lomonte C. Bioimpedance and the duration of the hemodialysis session. ASAIO J. 2011; 57: 310-313.
Bioimpedance-based volume in hemodialysis patients
Page 22 of 22
http://journals.lww.com/asaiojournal/Fulltext/2011/07000/Bioimpedance_and_the_Duration_of_the_Hemodialysis.11.aspx
[27] Palmer BF. Can chronic volume overload be recognized and prevented in hemodialysis patients? Preventing intradialytic hypotension. Semin Dial. 2009; 22: 489-491. http://dx.doi.org/10.1111/j.1525-139X.2009.00643.x
[28] Curatola G, Bolignano D, Rastelli S, Caridi G, Tripepi R, Tripepi G, Politi R, Catalano F, Delfino D, Ciccarelli M, Mallamaci F, Zoccali C. Ultrafiltration intensification in hemodialysis patients improves hypertension but increases AV fistula complications and cardiovascular events. J Nephrol. 2011; 24: 465-473. http://dx.doi.org/10.5301/JN.2011.7735
[29] London GM. Ultrafiltration intensification for achievement of dry weight and hypertension control is not always the therapeutic gold standard. J Nephrol. 2011; 24: 395-397. http://dx.doi.org/10.5301/jn.5000006
[30] Chazot C, Jean G, Vo-Van C, Collonge C, Terrat JC, Vanel T, Lorriaux C, Hurot JM, Charra B. The plasma level of brain natriuretic peptide is increased in malnourished hemodialysis patients. Blood Purificat. 2009; 28: 187-192. http://www.karger.com/DOI/10.1159/000230809
[31] Paniagua R, Ventura M-d-J, Avila-Diaz M, Hinojosa-Heredia H, Mendez-Duran A, Cueto-Manzano A, Cisneros A, Ramos A, Madonia-Juseino C, Belio-Caro F, Garcia-Contreras F, Trinidad-Ramos P, Vazquez R, Ilabaca B, Alcantara G, Amato D. NT-proBNP, fluid volume overload and dialysis modality are independent predictors of mortality in ESRD patients. Nephrol Dial Transplant. 2010; 25: 551-557. http://ndt.oxfordjournals.org/cgi/content/abstract/25/2/551
[32] Sheen V, Bhalla V, Tulua-Tata A, Bhalla MA, Weiss D, Chiu A, Abdeen O, Mullaney S, Maisel A. The use of B-type natriuretic peptide to assess volume status in patients with end-stage renal disease. American Heart Journal. 2007; 153: 244.e241-244.e245. http://www.sciencedirect.com/science/article/B6W9H-4MV73M7-P/2/d79e7317b44e39e31c913948dd57396d
[33] Roueff S, Martin E, Chauffert ML, Poli I, Kihal K, Yazbeck F, Abbassi A, Saint-Georges M. Brain natriuretic peptide variations are linked to volume status in hemodialysis patients. Clin Nephrol. 2008; 70: 508-513.
[34] Jacobs LH, van de Kerkhof JJ, Mingels AM, Passos VL, Kleijnen VW, Mazairac AH, van der Sande FM, Wodzig WK, Konings CJ, Leunissen KM, van Dieijen-Visser MP, Kooman JP. Inflammation, overhydration and cardiac biomarkers in haemodialysis patients: a longitudinal study. Nephrol Dial Transplant. 2010; 25: 243-248. http://ndt.oxfordjournals.org/cgi/content/abstract/25/1/243
[35] Stockinger J. Body composition in haemodialysis patients Institute of Physiology. Graz, Austria: Medical University of Graz; 2010. p. 81.
[36] Stockinger J, Ribitsch W, Holzer H, Schneditz D. Beurteilung der Volumenexpansion bei chronischen Hämodialysepatienten nach klinischen und bioelektrischen Kriterien. Nephro script. 2009; 12: 13.
[37] Ribitsch W, Stockinger J, Holzer H, Schneditz D. Assessment of volume expansion in chronic haemaodialysis patients by clinical and bioelectrical criteria. NDT Plus. 2010; 3: iii485. http://ndtplus.oxfordjournals.org/content/3/suppl_3