biogeomorphic processes and archaeological site formation · biogeomorphic processes and...
TRANSCRIPT

THESIS
BIOGEOMORPHIC PROCESSES AND ARCHAEOLOGICAL SITE FORMATION IN
ABSAROKA MOUNTAINS OF NORTHWESTERN WYOMING
Submitted by
Jillian M. Bechberger
Department of Anthropology
In partial fulfillment of the requirements
For the Degree of Master of Arts
Colorado State University
Fort Collins, Colorado
Spring 2010

ii
COLORADO STATE UNIVERSITY
March 25, 2010
WE HEREBY RECOMMEND THAT THE THESIS PREPARED UNDER OUR
SUPERVISION BY JILLIAN M. BECHBERGER ENTITLED BIOGEOMORPHIC
PROCESSES AND ARCHAEOLOGICAL SITE FORMATION IN THE ABSAROKA
MOUNTAINS OF NORTHWESTERN WYOMING BE ACCEPTED AS FULFILLING
IN PART REQUIREMENTS FOR THE DEGREE OF MASTER OF ARTS.
Committee on Graduate work
________________________________________
Robert Coleman
________________________________________ Jason M. LaBelle
_________________________________________
Advisor: Lawrence C. Todd
________________________________________ Department Chair: Kathleen A. Sherman

iii
ABSTRACT OF THESIS
BIOGEOMORPHIC PROCESSES AND ARCHAEOLOGICAL SITE FORMATION IN
THE ABSAROKA MOUNTAINS OF NORTHWESTERN WYOMING
Archaeologists frequently associate Thomomys taploides, the Northern Pocket
Gopher, with the loss of stratigraphic integrity (Bocek 1986; Morin 2006). Disturbance
from subsurface burrowing and the redistribution of sediment can result in both lateral
and vertical movement of cultural material. However, fossorial activity does not
necessarily negate the research potential of a site. Burrowing mammals may actually
reveal previously unidentified archaeological sites, help land managers develop effective
site testing plans and evaluate site significance, and contribute to a better understanding
of a region’s archaeological record and past environmental conditions.
This research explores the influence of pocket gopher activity on site formation at
a high elevation prehistoric flaked stone scatter in the Absaroka Mountains of
northwestern Wyoming. Pocket gopher activity was documented at the site in a 1-hectare
sample area surrounding a small sag pond. It was suspected the sediment pocket gophers
transport to the surface while digging subsurface tunnels was eroding downslope into the
small pond, burying cultural material. Archaeological data were examined in conjunction
with pocket gopher behavioral patterns and geomorphic processes to better understand
the affect of burrowing and sediment relocation on cultural material.
Geospatial analysis was used to identify topographic controls on burrow
placement. The physical characteristics of flaked stone recovered from pocket gopher
disturbed sediment were compared with artifacts located on the undisturbed site surface

iv
and subsurface artifacts collected during test excavation to identity patterns in
distribution potentially resulting from gopher activity. Erosion from pocket gopher
mounds was evaluated by comparing the sediment characteristics of active and
abandoned burrows and using a GIS-based erosion model.
Results show pocket gopher burrows occur most frequently on north facing
slopes. Neither gradient nor elevation could be shown to significantly influence burrow
placement. There were differences in the locations of winter pocket gopher activity and
summer activity. The physical characteristics of artifacts found within pocket gopher
disturbed sediment were indistinguishable from artifacts on the site surface. Subsurface
flaked stone exhibited significant differences in the artifact characteristics examined at all
depths. However, the vertical distribution of artifacts at the site was not consistent with
patterns noted in other pocket gopher impacted archaeological sites. The erosion model
indicated sediment from pocket gopher disturbed areas at the site would be deposited in
the sag pond, however the amount of predicted accumulation did not correspond with
accumulation calculated using radiocarbon dated samples collected from known depths.
The impact of pocket gopher activity on the lateral and vertical movement of
artifacts at 48PA2874 could not be definitively demonstrated. This project provides a
general background for further research on pocket gopher impacts to archaeological
material in alpine settings. With additional research the effect of pocket gopher activity
on artifact distribution in high elevation environments can be better understood.
Jillian M. Bechberger
Department of Anthropology
Colorado State University
Fort Collins, CO 80523

v
ACKNOWLEDGEMENTS
I would like to thank Dr. Larry Todd for providing the opportunity to participate
in the Greybull River Sustainable Landscape Ecology Project. Dr. Todd’s field school
and teaching methods allow students to experience, not just read about, the past and
present relationship between humans and environments. I will be forever grateful for his
guidance, suggestions, and the slight fear he inspired- it made me want to do a better job,
be a better student, and to think about archaeology as more then just the material record
of past human activity.
This project would not have been possible without the help of the GRSLE field
school students who spent two long weeks documenting the dirt and rocks in pocket
gopher mounds. I thank fellow graduate school students Marcy Reiser, Naomi Ollie,
Courtney Hurst, Robin Roberts, and Allison Bohn for their friendship and support. I
greatly appreciate the edits provided by my father Larry Wiseman, Courtney Hurst, Jason
LaBelle, and Erik Gantt- who all know more about pocket gophers then they wanted. I
thank my mother for her unwavering confidence and support. Finally I thank Erik for his
unbelievable patience and encouragement throughout the last few months of this process.

vi
TABLE OF CONTENTS
SIGNATURE PAGE .............................................................................................................ii
ABSTRACT OF THESIS......................................................................................................iii
AKNOWLEDGEMENTS......................................................................................................v
CHAPTER 1: INTRODUCTION AND BACKGROUND .................................................1
Research Objectives.................................................................................................4
Theoretical Perspective..........................................................................................10
Background to the GRSLE Project ............................................................11
48PA2874: Introduction to the Research Site............................................12
Thesis Organization ...............................................................................................13
CHAPTER 2: ENVIRONMENT AND LANDSCAPE FORMATION............................15
Site Setting and Landscape History: A Brief Summation of Long-term
Processes ................................................................................................................16
Landscape Formation at 48PA2874...........................................................18
Broad Geomorphic Processes: Rotational Slides and Earthflows .............18
Site-Specific Geomorphic Processes: Mass Wasting ............................................21
Frost Action, Solifluction, and Snow.........................................................22
Landforms in High Elevation Environments: Turf-Banked Terraces and Lobes ..23
Sediment Transportation........................................................................................25
Overland Flow ...........................................................................................26
Impact on Archaeological Material .......................................................................28
Pocket Gopher Ecology and Archaeology.............................................................29
Pocket Gophers: Behavior and Habitat..................................................................30
Burrow Systems .........................................................................................30
Food and Foraging Tunnels .......................................................................32
Sediment Disturbance and Erosion........................................................................31
Topographic Influences on Erosion ...........................................................37
Pocket Gophers and Archaeology..........................................................................38
Artifact Transportation: Vertical and Horizontal Displacement................38

vii
Geomorphic Impacts: The Formation of ‘Stone Zones’ ...........................42
Gophers and Stratigraphic Integrity: Bimodal Artifact Distribution .........43
Pocket Gophers and Archaeology: Summary ............................................44
CHAPTER 3: RESEARCH METHODS AND DATA .....................................................46
Research Methods..................................................................................................47
Documentation of 48PA2874 ....................................................................47
Test Excavation Methodology ...................................................................48
Pocket Gopher Data Collection .................................................................50
Geospatial Analysis of Gopher Burrows ...................................................52
Statistical Evaluation of Artifact Characteristics.......................................53
Geographic Information System Erosion Model .......................................54
Results of Data Collection .....................................................................................58
48PA2874: Artifact Assemblage ...............................................................58
Test Excavation Data .................................................................................62
Summary of Pocket Gopher Documentation .........................................................65
Gopher Activity in the Pond Catchment Area ...........................................67
Non-culturally Modified Stone Distribution..............................................68
Chipped Stone............................................................................................68
CHAPTER 4. RESULTS AND INTERPRETATIONS ....................................................70
Test Excavation Analysis.......................................................................................70
Comparing Subsurface and Surface Artifact Characteristics.....................74
Test Excavation and Inferences on Formation Processes ..........................75
Pocket Gopher Burrow Analysis ...........................................................................77
Spatial Distribution of Burrows: Aspect, Elevation, and Slope................78
Pocket Gopher and Site Surface Artifacts .................................................80
Shape Indices: Pocket Gopher Artifacts and the Surface Assemblage......83
Pocket Gopher and Subsurface Artifacts ...................................................84
Sediment Analysis .................................................................................................86
Particle Size in Active vs. Inactive Burrows .............................................86

viii
Topographic Influences on Erosion .......................................................................89
D90 Erosion Model Results ...................................................................................92
Summary................................................................................................................95
CHAPTER 5. IDENTIFYING PATTERNS: POCKET GOPHERS, ARTIFACT
DISTRIBUTION, AND EROSION.......................................................................97
Pocket Gopher Transportation of Surface Artifacts...............................................97
Pocket Gopher Impacts on Subsurface Cultural Material....................................102
Evidence of Pocket Gopher Occupation in the Test Units ......................104
48PA2874 and Previous Archaeological Research on Pocket Gophers ..105
Artifact Size in Gopher Burrows and Test Excavation Units ..................108
Pocket Gopher and Erosion at 48PA2874 ...........................................................110
Future Research Directions..................................................................................113
Understanding Pocket Gophers and Artifact Transportation...................113
Site Specific Research: Surface Documentation......................................114
Site Specific Research: Subsurface Documentation ................................115
Pocket Gophers, Geomorphology, and Archaeology: A Regional Perspective...116
Pocket Gophers as Ecosystem Indicators ................................................118
Pocket Gophers and Site Management ....................................................119
Summary..............................................................................................................119
REFERENCES CITED....................................................................................................121
APPENDIX A ..................................................................................................................127
48PA2874 Site Data.............................................................................................128
Artifact Distribution.............................................................................................131
Concentration 1........................................................................................131
Concentration 2........................................................................................132
Concentration 3........................................................................................133
Concentration 4........................................................................................133

ix
Concentration 5........................................................................................134
Concentration 6........................................................................................134
Source of Tool Stone ...............................................................................134
Obsidian Hydration Analysis...................................................................136
Tools and Source Material ......................................................................137
Temporally Diagnostic Projectile Points .................................................139
Summary..................................................................................................140
APPENDIX B ..................................................................................................................141
Results of Statistical Analysis..............................................................................142
Test Excavation Artifact and Site Surface Assemblage ..........................142
Pocket Gopher and Surface Artifacts.......................................................144
Pocket Gopher and Excavation Artifacts .................................................145
T26: Excavation Artifacts ....................................................................................148
Artifacts in T26-6 Compared with Artifacts in T26-7 by Depth .............162
APPENDIX C ..................................................................................................................169
Radiocarbon dates................................................................................................170

x
LIST OF TABLES
Table 2.1. Thomomys talpoides: Burrow Depth by Ecotone in Saguache Co, Colorado ..34
Table 3.1. Summary of Surface Artifacts at 48PA2874 ....................................................60
Table 3.2. Raw Material Types at 48PA2874....................................................................61
Table 3.3. Summary of Pocket Gopher Data in 1-Hectare Sample Area .........................67
Table 3.4. Pocket Gopher Data: Burrows Located in Pond Catchment Area...................67
Table 3.5. Rock Size Distribution in Mound s and Soil Casts..........................................69
Table 4.1. Mean Values of Artifact Characteristics by Depth: All Levels of T26 ............71
Table 4.2. U27: Mean Values of Shape Indices.................................................................74
Table 4.3. Distribution of Gopher Burrows in Sample Area: Aspect ................................78
Table 4.4. Distribution of Gopher Burrows in Sample Area: Elevation............................79
Table 4.5.Distribution of Gopher Burrows in Sample Area: Slope...................................79
Table 4.6. Elevation, Slope, and Aspect of Burrows in Pond Catchment .........................80
Table 4.7. Artifact Length: Gopher Burrows, Site Surface, and Buffered Analysis
Zones................................................................................................................81
Table 4.8. Gopher Burrows and Surface Artifacts: t-test of Shape Indices.......................84
Table 4.9. Gopher Burrows and Subsurface Artifacts: t-test of Shape Indices .................85
Table 4.10. T-test of Particle Size: Active vs. Inactive Pocket Gopher Burrows ..............87
Table 4.11. Radiocarbon Samples: Predicted and Actual Accumulation ..........................92
Table 5.1. Average Artifact Density: Gopher Burrows and Site Surface..........................98
Table A1. Summary of Surface Artifact Data .................................................................130
Table A.2. Source Material at 48PA2874........................................................................135
Table A.3. Source Material in Concentrations.................................................................136
Table A.4. Obsidian Source Areas...................................................................................137
Table A.5 Source Material of Projectile Points ...............................................................138
Table A.6a Source Material of Formal Tools: Bifaces, Scrapers, and Awls ...................139
Table A.6b. Source Material of Expedient Tools ............................................................139
Table B.1. U27 Artifacts and Site Surface Assemblage ..................................................142
Table B.2. T26 Artifacts by Depth and Site Surface Assemblage...................................142
Table B.3. T-test of Artifact Length in Burrows, Site Surface, and Buffer Areas...........144
xi
Table B.4. T-test of Elongation and Flatness of Artifacts in Burrows, Site Surface,
and Buffer Areas ............................................................................................144
Table B.5. T-test of Blockiness/Sphericity and Weight of Artifacts in Burrows, Site
Surface, and Buffer Areas..............................................................................145
Table B.6. Statistical Analysis of Pocket Gopher and U27 Artifacts ..............................145
Table B.7. Statistical Analysis of Pocket Gopher and T26 Artifacts by Depth...............145
Table B.8. All T26 Artifacts: T26-6 and T26-7 Artifacts Combined and Compared by
Depth..............................................................................................................148
Table B.9. Artifacts in T26-6 Compared with Artifacts in T26-7 by Depth ...................162

xii
LIST OF FIGURES
Figure 1.1. Location of GRSLE Project and Research Site.................................................2
Figure 1.2. Overview of Study Site .....................................................................................3
Figure 1.3. Diagram of Artifact Analysis Zone Radiating out from Burrows.....................6
Figure 1.4. Evidence of Winter Pocket Gopher Activity.....................................................7
Figure 2.1. Annual Variation in Moisture Regimes at 48PA2784.....................................19
Figure 2.2. Characteristics of a Rotational Slide ...............................................................20
Figure 2.3. Turf-banked Lobes and Terraces Present at 48PA2874 ..................................25
Figure 2.4. Evidence of Pocket Gopher Activity at 48PA2874.........................................33
Figure 2.5. Erosion of Gopher Sediment at the Niwot Ridge LTER Site..........................36
Figure 2.6. Seasonal Change of Particle Size in Gopher Mounds .....................................37
Figure 2.7. Percent of Artifacts Encountered During Re-Excavation at Jasper Ridge ......40
Figure 2.8. Formation of Stone Zones Proposed by Johnson (1989).................................42
Figure 3.1. Example of the Excavation Grid Layout .........................................................49
Figure 3.2. Pocket Gopher Documentation at 48PA2874..................................................51
Figure 3.3. Axial Measurements Used to Calculate Shape Indices ...................................54
Figure 3.4 The D90 Erosion Model ...................................................................................55
Figure 3.5 Steps Used to Merge Field-Collected Elevation Data and USGS DEM..........57
Figure 3.6. Distribution of Artifacts at 48PA2874 ............................................................59
Figure 3.7. Location of Excavation Test Units ..................................................................62
Figure 3.8. Block T26: Artifact Frequency by Depth.......................................................64
Figure 3.9. Block U27: Artifact Frequency by Depth ......................................................65
Figure 3.10. Distribution of Pocket Gopher Burrows in 1-Ha Sample Area.....................66
Figure 4.1. T26-6 and T26-7: Exposure of Slump-Earthflow Deposits ............................74
Figure 4.2 Pocket Gopher Burrows and Localized Analysis Zones ..................................82
Figure 4.3 Particle Size Distribution: Active and Inactive Burrows in 1-Ha Sample
Area..................................................................................................................87
Figure 4.4 Proportional Volume of Sediment per Gopher Burrow in Pond Catchment....90
Figure 4.5 Sediment Samples from Pond Toposequence ..................................................91
Figure 4.6 Path of Erosion Predicted by D90 Erosion Model ...........................................93
Figure 4.7 Predicted Sediment Accumulation at Sample Locations in U27-17 ................94

xiii
Figure 5.1 Pocket Gopher Burrows and Site Surface Cultural Material............................99
Figure 5.2 Models of Subsurface Artifact Distribution Attributed to Gopher Activity...106
Figure 5.3 T26 and U27: Artifact Frequency by Depth...................................................111
Figure 5.4 Mean Values of Artifact Characteristics by Depth
Figure A.1. 48PA2874: Site Overview ...........................................................................128
Figure A.2. Map of 48PA2874: Lobate Slopes Bounded by Steep Drainages ................129
Figure A.3 Location of Artifact Concentrations .............................................................131

1
CHAPTER 1
INTRODUCTION AND BACKGROUND
Burrowing mammals exert substantial influence over the physical, chemical, and
biological structure of ecosystems. For archaeologists, sub-surface faunalturbation is
often associated with significant site disturbance, particularly the loss of stratigraphic
integrity (Bocek 1986; Morin 2006). While horizontal and vertical relocation of cultural
material can occur, fossorial activity does not necessarily negate the research potential of
an archaeological site. Heavily bioturbated sites may not be able to address specific
“living floor” type questions; however they can provide input on broader research
questions, such as regional settlement patterns. The scale of the information sought must
match the level of site integrity. The activities of subsurface organisms may facilitate site
discovery, aid in the development of effective site testing plans, and contribute to a better
understanding of a region’s archaeological record and past environmental conditions.
The pocket gopher (Geomyidae: Rodentia) is a familiar and often lamented
bioturbator. Pocket gophers are highly adaptive, occupying environments as diverse as
alpine tundra and the grasslands of the high plains. Despite their ubiquity,
comprehensive research addressing the impact of pocket gopher activity on
archaeological material is limited (Balek 2002; Bocek 1986; Bocek 1992; Erlandson
1984; Fowler, et al. 2004; Johnson 1989; Morin 2006). Fortunately, ecologists and

2
geomorphologists have extensively studied pocket gopher behavior and the long-term
environmental affects of their activity (Gabet 2000; Gabet, et al. 2003; Hansen and
Morris 1968; Huntly and Inouye 1988; Ingles 1949; Ostrow, et al. 2002; Sherrod and
Seastedt 2001; Sherrod, et al. 2005; Thorn 1978a). This project couples biophysical
research with archaeological data to explore the influence of pocket gopher activity on
site formation processes.
Figure 1.1. Location of GRSLE Project and Research Site
0 105 Miles ¹0 105 Miles ¹
The Northern Pocket Gopher (Thomomys talpoides) is considered an integral
component of high elevation environments (Gabet et al. 2003; Huntly and Inouye 1988;
Sherrod et al. 2005; Thorn 1978). The current study examines the impact of Thomomys
talpoides on a prehistoric lithic scatter in the Absaroka Mountains of northwestern
General Site
Location
Greybull
River
Wyoming N
Cody

3
Wyoming (Figure 1.1). The research site (48PA2874) is located in an open alpine
meadow overlooking the western Big Horn Basin.
The terrain consists of overlapping, lobate slopes that terminate in spoon shaped
depressions referred to as sag ponds. The hummocky landscape is blanketed with
montane grasses and forbs, creating an ideal habitat for the Northern Pocket Gopher
(Figure 1.2). The sag ponds, with their deeper, finer grained sediments and thick
vegetation, are surrounded by dense concentrations of pocket gopher activity. Pocket
gophers create an extensive network of sub-surface tunnels, depositing the excavated
sediment in small mounds on the ground surface. The magnitude of pocket gopher
occupation observed during initial examination of the site area made apparent the need to
evaluate the impact of faunalturbation on archaeological material. Pocket gopher
disturbance has the potential to obscure or create patterns in artifact distribution, which
could be attributed to, but are not a result of, cultural events.
Figure 1.2. Overview of Study Site
Photograph by L.C. Todd

4
Research Objectives
Pocket gophers can impact cultural material in two ways: by the direct, physical
repositioning of artifacts and by the indirect geomorphic changes induced by their
activities. Transformations occur at, and are relevant to the archaeological record at
multiple scales. Localized movement of artifacts can alter the distribution of cultural
material at a site. Spatial relationships of artifacts and features are used to infer past
human activities and interpret site function.
The consideration of gopher activity is important when conducting field survey
and subsurface testing or excavation. The sediment pocket gophers eject onto the ground
surface may reveal buried archaeological material or conversely, obscure the visibility of
surface artifacts. The churning of sediment can homogenize chronologically distinct
cultural deposits or create pseudo-stratified deposits. The intensity of pocket gopher
occupation, and therefore site disturbance, is linked to environmental conditions.
Fluctuations in pocket gopher population over time may reflect changes in habitat.
Reconstructing the history of gopher occupation may contribute to a better understanding
of regional climate and landscape change.
This research examines the direct and indirect affect of pocket gopher activity at
48PA2874. This analysis represents an initial, exploratory effort at examining the
relationship between pocket gopher activity and archaeological site formation in an
alpine setting. It is recognized that both cultural and non-cultural processes alter the
record of past human activity and that the findings of this study may not be definitively
attributed to pocket gopher activity. Outlined below are the research questions and how
they were addressed in this project:

5
I. Is pocket gopher activity causing horizontal or vertical displacement of
archaeological material at 48PA2874? If so, are artifacts of particular shapes or
sizes preferentially transported?
To explore the influence of pocket gopher activity on surface and subsurface
artifact distribution, physical characteristics of artifacts recovered from pocket gopher
mounds were compared with those located on the undisturbed ground surface and those
found in test excavation units. Artifacts were evaluated using a variety of shape indices
calculated from axial measurements. These indices provide a quantifiable value to
attributes and form that can then be used to make comparisons of different artifact
groups. Trends in shape characteristics help determine if pocket gophers are more likely
to transport particular forms of artifacts, such as equidimensional material rather than
long, thin objects. Maximum length and the following shape indices were used in this
analysis: elongation (b/a), flatness (c/b), blockiness/roundness (bc/a²)⅓
, and weight
(a+b+c)⅓
, where a equals length, b equals width, and c equals thickness (de Scally and
Owens 2005).
Disturbance to surface archaeological material was examined by comparing
artifact characteristics based on distance from the pocket gopher mound. If pocket
gophers are altering the spatial relationships of surface material, artifacts closest to the
disturbed sediment are more likely to exhibit patterning in density, size, or shape. In this
analysis surface artifacts were examined as a whole assemblage and then grouped by

6
circular, concentric, 2-meter zones that radiate out 10 meters from the center of pocket
gopher activity (Figure 1.3).
Figure 1.3. Diagram of Artifact Analysis Zone Radiating out from Burrows
2m
4m
6m
8m
10m
2m
4m
6m
8m
10m
2m
4m
6m
8m
10m
Photograph by L.C. Todd
Vertical distribution of cultural material was investigated by comparing artifacts
located in pocket gopher mounds with those recovered from test excavation units.
Characteristics were analyzed by depth, in 5 centimeter (cm) intervals. Some research
has shown pocket gopher activity results in subsurface stratification of material by size
(Bocek 1986, 1992; Erlandson 1984; Johnson 1989). Patterns in artifact distribution that
have been linked to pocket gopher activity are compared with data from test excavation
to evaluate evidence of disturbance at 48PA2874.

7
II. What is the relationship of pocket gopher mound location to topographic features?
If pocket gophers seek out the most suitable habitat, can areas of occupation, and
by extension, areas of archaeological disturbance, be predicted?
A considerable amount of pocket gopher activity surrounded sag ponds at
48PA2874. To systematically evaluate this visual observation, pocket gopher activity
was documented in a 1-hectare area surrounding a dry sag pond. Gopher activity was
identified by the presence of small mounds of disturbed sediment and tunnel casts, also
called soil cores, soil casts, eskers, or ropes. Tunnel casts form on the ground surface
when burrowing occurs beneath snow cover. Sediment is compacted upward into the
snow, creating a tube-shaped soil cast that is revealed upon snowmelt (Figure 1.4).
Figure 1.4. Evidence of Winter Pocket Gopher Activity
a. Tunnel emerging from snow bank, b. Tunnel-shaped soil casts after snowmelt
Photographs by L.C. Todd
a. b.

8
The surface evidence of pocket gopher occupation was mapped and burrow
characteristics recorded. Documentation included recording the amount of displaced
sediment, the area covered by ejected material, the type of burrow (mound or soil core),
screening for the presence of archaeological material, and identifying occupation status
(actively used or abandoned). Pocket gopher burrow location data and associated
attributes were input into Geographic Information System (GIS) software ESRI ArcMap
9.2. The program was used to examine burrow density in relation to slope, aspect, and
elevation within the 1-hectare sample area to uncover patterns or preferences in burrow
location.
III. How does the sediment disturbed by burrowing contribute to geomorphic
processes at the site; specifically, erosion? How is this affecting archaeological
material?
The sediment transported to the ground surface by pocket gophers is susceptible
to redistribution by alluvial, colluvial, and aeolian processes. Sag ponds at 48PA2874 act
as mini-catchment basins for eroded sediment. It is suspected that the long-term
accretion of particulate matter in the sag ponds is an environment conducive to burying
archaeological materials. Due to the density of burrows surrounding the sag ponds,
sediment disturbed by pocket gopher activity could significantly contribute to deposition.
This possibility was examined in two ways. One, sediment properties of actively
occupied gopher burrows were compared with the properties of abandoned burrows. If
redistribution of sediment disturbed by gopher activity is occurring, the freshly ejected

9
sediment from occupied burrows should have different characteristics than that of
inactive, deflated burrows. Since the inactive burrows have been exposed to erosion for a
longer period, it is expected abandoned burrows would have less volume on average than
active mounds. As clay and silt are more easily eroded than larger material like sand,
therefore inactive burrows should contain a lower proportion of fine particulates.
The second way this question was evaluated used a GIS-based erosion model.
The model predicts the path and amount of material eroding from a specified point. The
travel route is determined by the slope that was calculated from high resolution elevation
information collected during field work, and the volume of sediment associated with each
pocket gopher burrow. As silt and clay are most easily transported, only the average
proportion of fine particulates comprising burrow sediment was input into the model.
The results show if sediment, 1) was likely to reach the sag pond and 2) the amount of
potential accumulation.
IV. How accurately does the GIS model predict the rate of sedimentation and what
can this tell us about past environmental conditions?
The accuracy of the GIS erosion model was evaluated by comparing predicted
deposition with the actual accumulation within the pond. The rate of sediment
accumulation was determined by radiocarbon dates of charcoal samples taken from
known depths during the test excavation of four 1 by 1 meter (m) units located in the
pond area. The results of the GIS erosion model are interpreted as representing the
amount of sediment accumulation resulting from erosion of pocket gopher disturbed

10
sediment occurring within one year. The of predicted deposition was multiplied by the
number of years indicated by the radiocarbon dates, thus approximating the rate of
accumulation predicted to occur in that time span.
Long-term sedimentation rates are closely linked with climate. Erosion of pocket
gopher mound sediment is driven by the frequency and intensity of precipitation events,
snow accumulation, and wind. The amount of sedimentation will vary with changing
environmental conditions. For example, an extended period of warming can result in a
diminished snowpack, lessening the amount of deposition that results from the
transportation of sediment by melt water. A greater amount of snow will increase the
sediment yield from overland flow during the spring thaw. The vulnerability of sediment
to erosion is impacted by the density and composition of vegetation. Vegetation
communities are determined largely by climate, and in high elevation environments
strongly influenced by sediment brought to the ground surface by gophers. These biotic-
abiotic interactions form one of the many non-linear feedback systems that shape alpine
ecosystems. Knowing the rate of accumulation in different time periods can begin to
suggest paleo-ecological conditions. The scale of this research project cannot reconstruct
the former climate; however it proposes a method that combines biophysical studies with
archaeological data to identify changes over time.
Theoretical Perspective
Historically, the goal of the archaeologist centered on developing a better
understanding of past human behavior through the study of material cultural (Trigger
1989). The realization that the record of human action consists of evolving interactions

11
between social and environmental factors has encouraged many contemporary
archaeologists to take an interdisciplinary approach to archaeological research (Schiffer
1987). An archaeological assemblage is not a direct reflection of past human behavior.
After abandonment, the material record is transformed by both cultural and biophysical
processes. Before archaeology can be used to infer human behavior, it is crucial to
identify the taphonomic processes shaping the distribution and types of materials present
today (Schiffer 1987:7). Reconstructing the taphonomic history is not only imperative to
understanding the human component of a site, but can also provide information on past
ecological conditions and changes.
Background to the GRSLE Project
Research was conducted as part of the Greybull River Sustainable Landscape
Ecology (GRSLE) project. In 2002 GRSLE, in conjunction with the Laboratory for
Human Paleoecology at Colorado State University (CSU), initiated a longitudinal, multi-
disciplinary program to document and monitor the environmental and cultural processes
governing the human use of landscapes. GRSLE’s philosophy- “Science, Stewardship
and Sustainability” (Todd 2004) - emphasizes archaeological research with multi-purpose
applications. Archaeological data are not restricted to the interpretation of past human
behavior; rather archaeological research is in a prime position to monitor modern human
impacts on the environment and to help link research in the natural and social sciences.
Unlike the heavy traffic incurred by nearby National Parks (Yellowstone and
Grand Teton), the upper Greybull watershed currently receives far less recreational use.
This comparatively pristine wilderness is on the cusp of a great shift in land use as the

12
area is becoming increasingly attractive to hikers, hunters, and horseback riders, as well
as to oil and gas companies (Todd et al. 2004). The GRSLE project has the unique
opportunity to document environmental conditions prior to extensive commercial and
recreational use. Through creating interdisciplinary baseline data sets, researchers will
have an unbiased, reproducible way to monitor human-environmental interactions.
Archaeology can provide land managers with the scientific data needed to decide which
elements of the ecosystem are least resilient as well as help determine the success of
outreach and educational programs (Todd et al. 2004).
48PA2874: Introduction to the Research Site
The GRSLE project area focuses on the remote, little accessed tributaries of the
upper Greybull River in the central Absaroka Mountains (Figure 1.1). Prior to the
GRSLE research, only nine prehistoric archaeological sites had been documented in the
project area (Burnett 2005). Since 2002, graduate students, Colorado State University
field school participants, and volunteers have recorded over 73,299 artifacts and
identified over 384 previously undocumented archaeological sites (Todd, personal
communication).
The research site, 48PA2874, is a prehistoric lithic scatter located on a broad
alpine meadow at an elevation of 3100 m. The weathering of relic landslides has created
a rolling topography interspersed with seasonally-filled sag ponds. The site encompasses
approximately 2.8 hectares and contains over 2,400 artifacts. Diagnostic projectile points
indicate the site was used for over the last 9,000 years. Historically the area was summer
range for cattle and is still part of the Greybull C&H grazing allotment. No historic

13
artifacts or significant evidence of modern recreational use (ATV tracks, trash, collector
piles) was encountered. The site has a diverse artifact assemblage with both local and
exotic toolstone source materials. Discrete concentrations of lithic debris with clusters of
fire-affected artifacts are present, suggesting more than ephemeral use of the site. The
site is located in an open grassland, making it unlikely these clusters of fire-affected
artifacts are a result of wildland fires or the burning of individual tree wells, although
additional research to refine our understanding of tree-line movement over the last 9,000
years is needed to fully discount this possibility. The intra-site patterning is currently
interpreted as multiple episodes of human activities surrounding a hearth.
Thesis Organization
Chapter 2 reviews the geomorphic processes common in high elevation
environments and how they have influenced topographic features and archaeological
material at 48PA2874. This is followed by a comprehensive examination of pocket
gopher ecology, behavioral patterns, and the physical impact of burrowing on landscapes.
An overview of previous archaeological research on pocket gopher activity and artifact
distribution is provided. Chapter 3 outlines the research methods, describes the site
surface assemblage, the results of test excavation, and the information collected on
pocket gopher burrows. Chapter 4 analyzes test excavation data, reports the results of the
erosion model, and compares the physical characteristics of lithic debris recovered from
pocket gopher disturbed areas with the surface assemblage and subsurface artifacts. The
results are examined in conjunction with previous archaeological and ecological research.

14
Chapter 5 discusses conclusions drawn from the study, outlines future site-specific
research directions, and delves into broader issues of the influence of pocket gophers on
biogeomorphic processes and their affect on the archaeological record in montane
environments.

15
CHAPTER 2
ENVIRONMENT AND LANDSCAPE FORMATION
Understanding the evolution of natural systems at multiple spatial and temporal
scales is key to developing interpretative frameworks in archaeology. This research
project focuses on biophysical interactions occurring at a site-specific location over a
geologically short timeframe. The nature of this study does not allow for an in-depth
examination of the many geomorphic transformations that have occurred, and are
occurring at 48PA2874. However, there are landscape formation processes common to
high elevation settings that can be applied to the research area (Hall and Lamont 2003;
Hall 2003).
Characteristics of landscapes are a function of past environmental conditions and,
in many areas, human modification. Ecological systems are not static and modern
conditions may not reflect the former climate or topography. Geomorphic events modify
the physical environment and can transport, bury, or reveal artifacts. Understanding post-
depositional changes affecting site context is essential to legitimately infer function from
the material record of human activity (Schiffer 1987).
This chapter provides an overview of some of the significant geomorphic
processes that have shaped and continue to change 48PA2874. Broad, landscape-scale
changes and site specific methods of sediment transportation are addressed. These

16
include multiple forms of mass movement, cryoturbation, and alluvial and aeolian
erosion. This is followed by a brief discussion of key archaeological research conducted
on mass wasting and cryoturbation. The chapter concludes with a detailed examination
of a third geomorphic process the focus of this research, faunalturbation by pocket
gophers.
Site Setting and Landscape History:
A Brief Summation of Long-term Processes
The GRSLE project area is located at the headwaters of the Greybull River in the
Absaroka Mountains of northwest Wyoming. The Absaroka Mountains are part of
geologic feature called the Absaroka volcanic province (AVP) that stretches 250
kilometers (km) from southwestern Montana through northwestern Wyoming, covering a
total of 23,310 km². The AVP formed between 53 and 38 million years ago during the
Eocene Epoch when volcanic activity created a belt of high elevation, andesitic
stratovolcanoes (Malone, et al. 1996). The eruptions caused lava, ash, and mudflows to
fill rivers, forming a broad, high elevation volcanic plain (Hughes 2003). Rapid fluvial
and aeolian erosion transported the newly deposited volcanic material into adjacent
basins, forming a thick layer of redeposited debris (Malone, et al 1996:481). Over time,
geomorphic processes have formed the present-day landscape of steep drainages, broad
alpine meadows, and glacial outwash terraces (Reitze 2004).
Modern climate varies with micro-environmental conditions, topographic
features, and elevation changes. Weather data collected by the Western Regional Climate
Center (WRCC) at the Sunshine 2NE station, located north of the project area, indicate
annual precipitation is approximately 35 cm. Winter temperatures average between -

17
14ºC and -9ºC and summer averages 14.8ºC (WRCC 2010). To a certain degree,
physical characteristics of the modern landscape can be grouped by elevation. Elevation
in the Absarokas ranges from 2200 meters above sea level (masl) to 4009 masl at Francs
Peak. The highest ridges of the Absarokas consist of deflated bedrock with patches of
glacial regolith, colluvial debris, and alluvial deposits. Slope wash and colluvium, with
lesser amounts of surface bedrock, alluvium, and glacial deposits comprise the mid-slope
areas. The landscape below the higher-gradient mid-slopes is dominated by landslide
deposits (Burnett 2005).
Vegetation in drainages and north-facing slopes consists primarily of coniferous
forests. Mountain Big Sagebrush (Artemisia tridentate) is often found on the dryer south
facing slopes (Burnett 2005:7). Montane grasses and forbs, including blue grama
(Boutela chondrosum) and mountain sorrel (Oxyria digna) are present on the large open
meadows in the sub-alpine and alpine environmental zones. Small islands of spruce-fir
and white bark pine are present in some of the upland meadows. Tree lines are not
stationary and have shifted with changes in temperature and moisture regimes. This is
clearly indicated by the presence of “ghost forests” within the project area (Reiser 2005).
A number of artiodactyls occupying the area would haven been attractive to
Native American hunters, including mule deer (Odocoileus hemionus), elk (Cervus
elaphus), pronghorn (Antilocapra americana), and big horn sheep (Ovis candensis).
Although not present today, bison (Bison bison) were present historically and
prehistorically in the Absaroka Mountains (Frison 1991; Ollie 2007). Other mammalian
species include Grizzly bears (Ursus arctos horriblis), black bears (Ursus americanus),
wolves (Canis lupus), and coyotes (Canis latrans). Smaller mammals found in the area

18
consist of rabbits (Lepus sp.), marmots (Marmota flaviventris), badgers (Taxidea taxus),
ground squirrels (Spermophilus sp.), and the impetus for this research, northern pocket
gophers (Thomomys taploides).
Landscape Formation at 48PA2874
48PA2874 is located in an upland meadow dissected by moderate-sized gullies
and small rills. The superimposed, bulbous slopes range in gradient from 2º to 30º with
the majority of the site between 5º and 6º. Elevation at the site ranges from 3075 meters
to 3105 meters. The higher portions of the hill slopes are mostly deflated with areas of
exposed bedrock, thin regolith, and sparse, patchy vegetation. It was informally noted
that bedrock had significant lichen and moss growth, which has the potential to suggest
stable environmental condition (Benedict 2009). Alluvial and colluvial transportation of
upslope material has created relatively deep toe-slope deposits. As shown in Figure 2.1,
vegetation across the site is drought sensitive, and varies greatly between wet and dry
years. In general, vegetation consists of bunch grasses, forbs, and abundant wildflowers
in wet years.
Broad Geomorphic Processes: Rotational Slides and Earthflows
The disconformity between the ancient sedimentary deposits and the overlying
reworked volcanic material formed a landscape prone to mass-wasting (Ollie 2007:3).
Mass-wasting refers to geomorphic processes that are induced by gravity (Ritter et al.
2002). A mass wasting event can range from the downslope movement of a single
particle to a massive debris-flow that alters an entire watershed. The basic physical

19
Figure 2.1. Annual Variation in Moisture Regimes at 48PA2784
structure of the landform on which 48PA2874 is located was created by multiple
landslide events occurring prior to the Pleistocene-Holocene transition (Ollie 2008).
Landslides began as rotational slides or slumps which liquefied into earthflows
downslope (Dikau et al. 1996:43). A rotational slide occurs when a distinct mass of
sediment and/or rock rotates along a curviplanar line parallel to the contour of the slope
(Figure 2.2). At the initial point of failure, the mass of sediment and rock tilts backward
while being displaced downslope, forming a scarp where movement began. This is
followed by a flattening or “slope reversal” (Dikau et al. 1996:49).
Photographs by L.C. Todd
July 2005
July 2006

20
When rotational slides liquefy downslope they are termed slump-earthflows
(Ritter 2002). The transition to a flow can cause the toe area to rise or bulge and form
lobate terrain features, like those found at 48PA2874 (Dikau et al. 1996:49, 51). These
events can create irregular drainage patterns and often develop ponds or boggy areas at
the head of the slump or between the main body and the toe (Figure 2.2) (Dikau et al.
1996:48). Rotational slides can be small occurrences that result in the formation of small
terracettes, or large, expansive movements that cover entire landforms (Dikau et al.
1996:45).
Figure 2.2. Characteristics of a Rotational Slide
Note ponding at the head of the slide and at the base of the lobate toe
(Figure based on Dikau et al 1996:Figure 4.2; Ritter 2002:Figure 4.37A)
Subsequent geomorphic processes have altered topography at the site. These
include other forms of mass wasting, such as heave, soil creep, and solifluction, and their
cryogenic counterparts, frost heave, frost creep, and gelifluction, as well as alluvial and

21
aeolian erosion. At 48PA2874 the dominant landform features, turf-banked lobes and
terraces, were formed from the interaction of solifluction and frost action
Site-Specific Geomorphic Processes: Mass Wasting
Mass wasting events vary in their intensity and spatial extent. Like all
geomorphic transformations mass movements are a function of multiple factors, such as
terrain, weather/climate, sediment characteristics, seasonal vegetation, and land use
among others (Ritter et al. 2002). Heave and soil creep, two slow mass wasting processes
occurring at 48PA2874, work in conjunction with one another. Heave is the vertical
expansion of surface material and soil creep is the gravitationally driven downslope
movement of sediment. Soil creep occurs when boundaries between the mineral
structures are weakened enough to move material downslope, parallel to the ground
surface, without causing mass failure (Roering 2004; Selby 1982). The loss of particle
cohesion makes the slope vulnerable to additional mass wasting and other forms of
erosion (Gatto 2000). Heave decreases with depth and is thought to cease by 20 cm
below the surface. Research on the rate of sediment movement due to creep indicates
particles can travel between 0.1 to 15 mm/yr on vegetated soil and up to 50 cm/year on
unvegetated slopes where creep is enhanced by freeze-thaw cycles (Ritter et al.
2002:105). The impact of soil creep may be barely detectable over short time frames, but
can be a significant agent of change over the long-term (Selby 1982:117).

22
Frost Action, Solifluction, and Snow
When soil creep is caused by freeze-thaw cycles, it is referred to as frost creep.
The degree of frost creep depends on the number of freeze-thaw events and soil
properties such as texture, moisture, and temperature (Gatto 2000; Millar 2006). Frost
heave occurs as the soil matrix freezes and forces larger particles toward the surface. As
the ice melts, fines accumulate in the void left by the particle, resulting in a surface
covered with only larger debris (Waters 1992). Loose soil with low clay content,
characteristics of pocket gopher mound sediment, promote the freeze-thaw process
(Hilton 2003). Frost creep contributes to the formation of distinctive lobate-shaped
landforms and low, step-like terracettes (Benedict 1976) both of which are present at
48PA2874.
Freeze-thaw processes and solifluction generally co-occur on the same landscape
feature, in opposing seasons (Benedict 1970). Solifluction is a form of mass wasting
defined as the slow downslope movement of waterlogged sediment. Solifluction is
favored by sediment that overlays an impermeable surface such as frozen ground or by
deposits that have differing permeability, such as the strata overlaying the slump-
earthflow at the site. As surface layers thaw, the cohesion of the upper deposits are
weakened, allowing sediment to flow over the impermeable stratum (Benedict 1970:170).
When solifluction is caused by the melting of snow or ice, the process is often referred to
as gelifluction.
The influence of snow on geomorphic processes is significant (Caine 1995; Thorn
1978b). Snow surfaces are able to trap fine aeolian particles (see Figure 1.4a). Sediment
accumulation in snow patch sites can be twenty to thirty times greater then adjacent

23
snow-free areas (Thorn 1978b:422). Snow at 48PA2874 is unevenly distributed, resulting
in the differential accretion of fine particulate matter. The transportation of fines in melt
water from snow patches produces localized concentrations of sediment (Thorn
1978b:417). Sheet wash from snow-melt is a major contributor to sediment yield; and as
discussed below pocket gophers are particular active beneath snow cover (Thorn
1978b:423).
Landforms in High Elevation Environments:
Turf-Banked Terraces and Lobes
Solifluction and frost action results in two types of landforms present at the site,
turf-banked lobes and turf-banked terraces. Turf-banked lobes are “lobate accumulations
of moving soil that lack conspicuous sorting” (Benedict 1970:172). The lobe or tongue-
shaped features bulge at the toe, overhanging the riser on which it forms (Benedict
1970:177) (Figure 2.3b, c). At the back of most lobes are “spoon-shaped” depressions or
sag ponds (Benedict 1970:172). Turf-banked lobes form most readily on moist slopes
with gradients between 4º to 23º and where snow is unevenly distributed like at site
48PA2874 (Benedict 1970:172; Ritter et al. 2002:386). In terrain with turf-banked lobes,
snow accumulates in the depressions and drainage ways, leaving the lobe exposed to
erosion by wind. Wind-blown sediment from exposed areas are deposited downslope and
along the edges of the lobe (Benedict 1970:171).
Solifluction and frost action also create turf-banked terraces. Turf-banked
terraces are similar to lobes except that they form unsorted, stair step-like landforms
(Benedict 1970:170). Turf-banked terraces are present where snow accumulation occurs
evenly across the landform on slopes ranging from 2 to 19º. Turf banked terraces more

24
readily form on lower, concave slopes above ponds, but can also be found on convex
slopes. Miniature turf-banked terraces, called Dryas-banked terraces are multiple,
parallel, linear accumulations of sediment that roughly follow the slope contour (Figure
2.3a). The terraces result from the interaction of the prevailing winds and surficial frost
creep (Benedict 1970:171).
Studies conducted by Benedict (1970) on turf-banked lobes and terraces in the
front range of the Colorado Rocky Mountains showed solifluction transports sediment
between 0.4 cm to 4.3 cm per year. Benedict found sediment movement is affected
primarily by gradient and moisture content, while temperature and soil texture had little
impact on displacement rates (Benedict 1970:165). The rate and driving force of
movement varied between locations on the lobe. Solifluction proved to be most effective
on the saturated axial portion of the lobe while frost creep dominated the outer edges
(Benedict 1970:166). The rate of movement averaged 3 mm/year at the edge of the lobe
to 43 mm/year along the axis. Movement was greatest in the surface layers of the soil and
occurred only within the upper 50 cm of sediment (Benedict 1970:179).
The slow downslope movement of turf banked lobes and terraces have the
potential to transport archaeological material. In solifluction lobes, the slow, downward
movement of surface sediment oozes under older deposits, results in older sediment on
the ground surface (Hilton 2003:169). The result is a landform with chronologically
inverse stratigraphy which could significantly impact the interpretation of archaeological
sites. The soil profile resulting from solifluction is distinct and can be easily identified
when aware of the process.

25
Figure 2.3. Turf-banked Lobes and Terraces Present at 48PA2874 (a) Overview of miniature turf-banked terraces, formed by frost creep and wind;
arrow points to detail, (b) Overlapping turf-banked lobes, (c) Hummocky terrain, a
result of relic slump-earthflow events.
Sediment Transportation
Sediment characteristics such as clast size, orientation, and stratification provide
information on the manner of deposition. Sediment movement by overland flow

26
generally exhibits moderate sorting, weak-to-no orientation, and variation in particle size.
Deposits are massive (uniform) with dispersed, laminated lenses when the flow of water
is both rapid and not highly concentrated with sediment (Bertran and Texier 1999).
Areas that have massive deposits with no lenses are a result of either “hyper-concentrated
flow accumulation” or slow deposition resulting from processes such as rain splash,
freeze-thaw, and bioturbation (Bertran and Texier 1999:100).
Energy is needed to transport sediment downslope. The entrainment capacity, or
kinetic energy, generated from rainfall is a function of the duration, intensity, frequency,
and amount precipitation (Selby 1982:84). The power of fluvial processes is also
influenced by external factors, including soil characteristics, vegetation type and density,
gradient, and microtopographic features (Selby 1982:83). Soil matrix properties, such as
cohesion and pore space determine infiltration capacity and retention of water (Bryan
2000). Thick vegetation can inhibit the movement of water over the ground surface.
Small, seemly insignificant topographic differences make erosion spatially discontinuous.
The following section addresses methods of sediment transport that occur at 48PA2874,
including interrill, rill, and pipe erosion (Bryan 2000: 387; Gatto 2000:147).
Overland Flow
Interrill or sheet erosion refers to the detachment and transportation of particulate
matter by rainfall or runoff. Rainsplash energy dislodges sediment upward and away
from the initial impact zone. The force behind splash erosion can be enhanced by wind
or obstructed by vegetation (Bryan 2000:387). The amount and size of pore space in a
soil determines the infiltration capacity. Once pore space is filled the soil becomes

27
saturated and ponding can occur in even the smallest depressions, which facilitates
overland flow. Overland flow transports sediment over the ground surface in broad,
shallow sheets or in threads between vegetation. Threads of moving water can form rills
and the convergence of rills can result in gullies (Selby 1982:99). Gatto (2000:148)
reports erosion in rills “exceeded that on interrill surfaces by a factor of 40 on an 11º
slope” and can account for as much as 80% of sediment erosion on hill slopes.
Rill formation can be facilitated by small topographic characteristics, changes in
vegetation, human land use, and animal activity (Bryan 2000:390). Incomplete
vegetation coverage, which is present at 48PA2874, allows frost action, rain splash, and
surface wash to occur between clumps of vegetation (Selby 1982:100). Selby (1982:87)
notes overland flow is significant in mountain environments where slopes, exposed rocks,
and thin soils “promote” runoff. Entrainment of particulate matter by surface flow
concentrates at the base of slopes and hollows (Selby 1982:94). Sheet wash is extremely
effective in transporting sediment disturbed by animals (Selby 1982:104). The material
loosened by pocket gopher activity is much more vulnerable to erosion than adjacent,
undisturbed sediment.
Overland flow and rill formation often over-shadow the role of sub-surface
erosion (Wilson 2008:1858). The transportation of water beneath the ground surface
enhances the impact of surface processes, particularly the formation of gullies, by
decreasing soil cohesion, increasing seepage, and from pipe erosion (Wilson 2009). Pipe
erosion, the movement of water through a subsurface soil pipe or interconnected
macropores is a significant process as burrowing animals like the pocket gopher create an
extensive network of subsurface tunnels (Bryan 2000:395; Ritter et al. 2002:139).

28
Research conducted for the National Science Foundation’s Long-term Ecological
Research program (LTER) on Niwot Ridge, near Boulder, Colorado documented sheet
wash entering pocket gopher “…tunnels only to emerge a few meters downslope with
sufficient force to form a fountain 10-20 cm high” (Thorn 1978:184). The intense piping
of water through gopher tunnels causes tunnel systems to collapse, leading to the
formation of gullies (Reichman and Seabloom 2002). According to Ritter et al.
(2002:139), piping can result in up to one-fifth of erosion on hill slopes.
Impact on Archaeological Material
Mass wasting, cryoturbation, and alluvial processes can have a significant effect
on the distribution of archaeological material. Heave and soil creep preferentially move
heavy and dense artifacts downslope (Rapp 1998). Studies have shown freeze-thaw
processes have a substantial impact on the translocation of lithic debris, particularly in
conjunction with other geomorphic process (Hilton 2003). As might be expected, there is
an inverse relationship between depth of burial and artifact movement; surface material is
transported a greater distance, in less time than buried material (Hilton 2003:169).
Elongated artifacts are more readily reoriented by cryoturbation and are prone to upward
movement. The greater the length and/or the greater the effective height the more likely
it is an artifact will be impacted by freeze-thaw cycles (Hilton 2003:197). Experimental
research conducted by Hilton (2003) showed artifact movement attributed solely to
freeze-thaw cycles ranged from 0.7 cm to 31.7 cm. Artifacts exposed to both frost action
and other geomorphic processes moved a significantly greater distance, between 6 cm
and 136 cm. Small flakes (5 to 10 mm width) in the exposed unit were particularly prone

29
to lateral transportation; on average moving 45.7 cm further than larger material. The
movement of the exposed artifacts corresponded to the direction of the prevailing winds,
while those impacted only by freeze-thaw cycles trended downslope. It was noted that
many artifacts became partially buried and oriented vertically, which inhibited horizontal
movement (Hilton 2003:183). Flake relocation caused by frost action not only moved
artifacts shorter distance, but also showed no significant or predicable sorting by size or
shape.
Pocket Gopher Ecology and Archaeology
The pocket gopher can be an important component in ecosystem function and
diversity (Huntly and Inouye 1988; Ostrow et al. 2002). Nutrient availability in soil
(Litaor, et al. 1996), the composition of vegetation communities (Sherrod, et al. 2005),
the presence of vertebrate and invertebrate species (Ingles 1952; Ostrow, et al. 2002), and
topographic features on multiple spatial scales (Inouye, et al. 1997), are all, in part,
structured by pocket gopher activity. Subsurface tunneling and the redistribution of
sediment also affect archaeological sites. Pocket gophers homogenize soil horizons and
can change the stratigraphic relationships of buried cultural material (Bocek 1986;
Erlandson 1984; Johnson 1989; Morin 2006). Knowing the habitat parameters,
behavioral patterns, and the physical changes induced by burrowing will help
archaeologists identify locations of pocket gopher occupation and potential impacts to
archaeological material.
This section provides an overview of pocket gopher ecology in high elevation
environments with particular emphasis on the Northern Pocket Gopher, the species

30
present in the project area. This section is followed by a review of previous studies of
pocket gopher impacts to archaeological sites.
Pocket Gophers: Behavior and Habitat
Pocket gophers are solitary herbivores that spend up to ninety-nine percent of
their lives underground (Thorn 1978). There are over 30 species of pocket gophers, each
associated with, and adapted to, particular environments (Bocek 1986). Although they
exploit diverse habitats, from the tall-grass prairie to alpine tundra, all species of pocket
gophers exhibit similar behavioral traits (Thorn 1978). Of the many pocket gopher
species, the Northern Pocket Gopher (Thomomys talpoides) is the most widely
distributed, occupying an area spanning north-south from Manitoba to New Mexico and
east-west from the Midwest to California (Gabet et al. 2003:265).
Burrow Systems
Pocket gophers individually occupy subsurface burrows. The burrow system has
four components: multiple surface openings, a network of feeding tunnels, a den
chamber, and separate compartments for food storage (Bocek 1986; Erlandson 1984).
The extensive system of tunnels represents a single gopher’s territory or “home range”
(Romanach, et al. 2005). Territories are relatively fixed and generally do not overlap
(Ingles 1952; Thorn 1978). The length and areal extent of foraging tunnels varies with
environmental characteristics. The more food available for consumption, the smaller the
area the burrow system spans (Romañach et al. 2005); and the less potential for impacts
to archaeological material.
31
Pocket gophers line their dens with finely shredded grasses. Depending on
sediment characteristics and compactness, dens are on average located 50 cm below the
ground surface (Bocek 1986; Erlandson 1984). They average 20 cm in height and 24 cm
in diameter (Ingles 1952). Food caches are located in separate compartments connected
to the nest through the underground tunnel system (Ingles 1952). In areas abandoned by
pocket gophers where surficial evidence of occupation no longer exists, pocket gopher
activity may be identifiable by subsurface clusters of vegetation or excrement.
Slight differences in soil type and vegetation communities have an impact on
pocket gopher distribution. Soil depth, temperature, moisture content, hardness, and
rockiness influence the presence and density of burrows (Beck 1965). The rate of mound
formation changes significantly with water content of soil. When soil moisture is less
than 9% or greater then 18% burrowing rates drop dramatically (Miller 1948). Soil
frozen between 5 to 10 centimeters deep inhibits tunneling, forcing pocket gophers to
relocate burrows in cold periods (Ingles 1949:344). During spring thaw, pocket gophers
occupying low lying areas desert their winter homes in favor of drier ground (Thorn
1978:182). They will frequently, but not always, return to the home range occupied the
previous season (Ingles 1952:89). Monitoring of pocket gopher dispersal patterns over a
three year period in the Sierra Nevada Mountains in California found the longest distance
an adult male pocket gopher moved to a new territory to be 27 m and for juvenile pocket
gophers 120 m (Ingles 1952).
Population densities as high as 200 pocket gophers per hectare have been reported
in environments with abundant forage (Huntly and Inouye 1988). Alpine and sub-alpine
regions have lower population densities. In Black Mesa, Colorado, pocket gopher

32
density ranged from 10 to 91 individuals per hectare (Beck 1965), 40 to 46 in the Front
Range of Colorado (Thorn 1978), and 10 to 40 in the Wasatch Plateau of Utah (Ellison
1946).
Food and Foraging Tunnels
Pocket gophers feed underground on the roots and stems of grasses and forbs
(Huntly and Inouye 1988). The nutritional demand of burrowing compels pocket gophers
to consume large quantities of vegetation, which greatly affects the distribution,
abundance, and composition of plant communities (Ellison 1946; Huntly and Inouye
1988; Sherrod and Seastedt 2001). While pocket gophers will eat both grasses and forbs,
in montane environments forbs account for over 90% of food consumed (Beck 1965:8).
Forbs in alpine settings may be preferred because they are widely dispersed and have a
large amount of subsurface biomass (Sherrod et al. 2005:585).
The network of foraging tunnels radiating from the den chamber run parallel to
the ground surface at the depth of root growth. Generally, tunnels are between 10 and 30
centimeters below the surface (cmbs), although they can extend up to two meters deep
(Beck 1965; Bocek 1986). The Northern Pocket Gopher has a broad range in tunnel
depth, from 8 to 152 cmbs. Research has shown rocky soil limits the depth of tunneling
to 3.6 to 7.9 cmbs (Thorn 1978:184). In places with snow cover, tunnels created during
the winter can be seen on the ground surface (Figure 2.4). Tunneling compacts the soil
upward into the overlying snow, forming tube-shaped casts of sediment where the pocket
gopher traveled. At snowmelt, these long cylindrical casts of sediment become exposed
(Ellison 1948; Ingles 1949, 1952).

33
Figure 2.4. Evidence of Pocket Gopher Activity at 48PA2874
Beck (1965) compared burrowing depths in alpine, sub-alpine, and sage-
bunchgrass ecotones in Saguache County, Colorado. The deepest burrowing occurred in
the lowest elevation zone, the sage-bunchgrass environment. The shallowest burrows
were located in the alpine areas, the highest elevations (Table 2.1). The elevation of the
current research area (3100 m) is between the sub-alpine and shrub-bunchgrass
environmental zones.
a. b.
Three kinds of pocket gopher activity at
48PA2874:
a) Sediment ejected from burrowing and
degrading soil cores, areas of former
occupation would frequently be reused
seasonally
b) Soil cores form only under snow cover
this was revealed upon sow melt during
spring thaw,
c) Mounds of sediment ejected during
spring/summer activity.
Photographs by L.C. Todd
c.

34
Table 2.1. Thomomys talpoides:
Burrow Depth by Ecotone in Saguache Co, Colorado (Beck 1965)
Thomomys talpoides Alpine (3810m) Sub Alpine (3500m) Shrub-bunchgrass (2834m)
Average Burrowing Depth 34 cm 41 cm 69 – 94 cm
Individual tunnels can be as long as 100 m with diameters between 5 and 25 cm,
depending on the size of the pocket gopher (Gabet et al. 2003). The areal extent of tunnel
systems varies from 20 to 200 m² per gopher (Beck 1965:5; Bocek 1986). In alpine
environments, Thorn (1978:181) reports a pocket gopher territory typically spans 56 m².
Beck’s research in south-central Colorado showed territory size varied greatly, between
7.4 and 187.3 m² (Beck 1965).
Sediment Disturbance and Erosion
Through their excavation of underground tunnels and deposition of sediment on
the ground surface, pocket gophers can have a significant impact on the landscape.
Long-term research conducted in the Colorado Rocky Mountains found Thomomys
talpoides transport 3.9 to 5.8 metric tons of sediment per hectare per year to the surface
(Thorn 1978:186). In the same study area, researchers found particularly prolific pocket
gophers could transport 48,000 cm³ (48 liters) of sediment to the surface in a single day
(Litaor et al. 1996:38). In Minnesota, Thomomys talpoides creates on average 2.86
mounds per gopher per day (Mielke 1977). Areas with substantial occupations can
completely rework surface sediment in three to five years (Bocek 1986:590). In addition
to displacing massive amounts of sediment, pocket gophers transport clasts as large as
their tunnels, typically around 5 cm in diameter (Bocek 1986:591). Pocket gopher
research conducted in Gunnison County, Colorado, showed gophers avoided rocks larger

35
than 2.5 cm in diameter (Morris 1968:6). Pocket gopher activity resulted in size-sorting
of clasts, with mounds containing more rocks between 0.6 and 2.5 cm in diameter than
the adjacent surface sediment (Morris 1968:391).
Wind, water, and gravity redistribute sediment deposited on the surface by pocket
gophers (Sherrod and Seastedt 2001). Over time, these processes can bury archaeological
deposits. Fine particulate matter is more easily eroded than larger particles, which causes
mounds and soil casts to contain a greater percent of sand and less silt and clay relative to
the surrounding sediment (Thorne 1978:185). Where surface openings to burrows are
closely spaced, entire burrow systems may be “scoured out” by water runoff (Thorn
1978:184). Researchers at the Niwot Ridge LTER site measured the volume of sediment
in fresh pocket gopher mounds and again 1-year later. The average volume of fresh
mounds (48,000 cm³) decreased by ¾ (10,200 cm³) in a single year (Litaor et al.
1996:38).
In a separate study conducted at Niwot Ridge, soil loss from gopher mounds was
monitored in a dry alpine meadow, an environment very similar to 48PA2874 (Sherrod
and Seastedt 2001). Sherrod and Seastedt (2001:199) measured soil accumulation at 0 m,
0.5 m, 1 m, and 2 meters downslope of pocket gopher mounds and in non-disturbed
control areas. The study showed the amount of sediment eroding from gopher mounds
was statistically greater than the control areas at distances up to 0.5 m (Sherrod and
Seastedt 2001:201). Beyond 0.5 m, there were, on average, more sediment removed from
pocket gopher mounds than control areas, however the difference was not statistically
significant (Sherrod and Seastedt 2001:202). Figure 2.5 (Sherrod and Seastedt
2001:203), shows the amount of sediment moved at each distance interval. The figure

36
divides the sediment into two size fractions, particles over 2 mm and under 2 mm. As
would be expected, a greater amount of fine material was transported.
Figure 2.5. Erosion of Gopher Mound Sediment at the Niwot Ridge LTER Site
Distance moved and amount of sediment eroding from gopher mounds. Particle size of transported sediment is indicated. Figure adapted from
Sherrod and Seastedt (2001:Figure 1a).
0 m .5 m 1 m 2 m Control
0
40
80
100
120
140
160
> 2 m
< 2 m
Distance from mound
Mas
s (g
) /
met
er
0 m .5 m 1 m 2 m Control
0
40
80
100
120
140
160
> 2 m
< 2 m
Distance from mound
Mas
s (g
) /
met
er
Although the amount of sediment removed from pocket gopher disturbed areas
was only significant in the immediate vicinity of the mounds, particle size analysis
showed a considerable change in sediment texture (Figure 2.6). In the summer, freshly
ejected pocket gopher mound sediment contained approximately 30% silt and clay. By
fall, burrows contained no clay and only a small amount of silt could be detected
(Sherrod and Seastedt 2001:204).

37
Topographic Influences on Erosion
The degree of slope affects the intensity of erosion and where sediment is
deposited. The movement of sediment displaced by gophers does not simply increase
with an increase in slope, as is often assumed (Gabet 2000; Gabet et al. 2003).
Figure 2.6. Seasonal Change of Particle Size in Gopher Mounds at the Niwot Ridge
LTER site (Adapted from Sherrod and Seastedt 2001:Figure 2a)
Gabet et al. (2003:266) developed a slope-dependent equation modeling the
movement of sediment from gopher mounds. On level ground, pocket gopher mounds
form a ring or ‘donut’ shape around the surface opening of the tunnel. As slope increases
the sediment ejected from the tunnel heads downhill, causing an initial increase in
sediment flux (Gabet et al. 2003:267). The primary method of transportation at steeper
gradients is mechanical processes rather than the physical movement of sediment by
pocket gophers (Gabet et al. 2003:267). Sediment flux does not have a steady increase
with steeper gradients. Erosion of gopher sediment on hill slopes can be limited by
vegetation or other obstructions; particularly by the terraces which form as excavated
sediment accumulates around the surface opening of the tunnel (Gabet et al. 2003:267).

38
Pocket Gophers and Archaeology
Current understanding of the affect of pocket gopher activity on cultural material
is based on three key studies; Barbara Boceks’s (1986, 1992) experimental work at the
Jasper Ridge site, Donald Johnson’s (1989) examination of stone zone formation, and Jon
Erlandson’s (1984) identification of bimodal patterning in artifact distribution. The next
section describes and discusses the findings of these three research projects.
Artifact Transportation: Vertical and Horizontal Displacement
Bocek (1986, 1992) investigated the degree of vertical and horizontal artifact
displacement caused by rodent activity in the Santa Cruz Mountains in California. The
Jasper Ridge Site (CA-SMa-204) is located on a grassy alluvial terrace that supports a
substantial gopher population. The site is a short-term camp dating to around 900A.D.
(Bocek 1986: 592). Excavation showed artifacts were size stratified at two distinct
depths. Smaller (0.6 - 5 cm) pieces of debitage, fire-cracked rock, and culturally
unmodified rock were concentrated near the surface while larger (≥ 5 cm) materials were
clustered around 40 cmbs. Artifact frequency decreased dramatically below 50 cm.
Bocek (1986, 1992) proposed the segregation of material by size resulted from
gopher activity. Since pocket gophers are unable to transport objects larger than the
diameter of their tunnels (around 5 cm) they burrow around and beneath larger objects
(Bocek 1986:591). As a result, the larger clasts sink to the maximum depth of gopher
activity and the smaller clasts are moved upward. This produces a size stratification with
lithic materials less than 5 cm in diameter near the surface and larger materials between
30 and 60 cm beneath the surface. Although lithic artifacts displayed this distribution,

39
shell artifacts had a different pattern. Shells, consisting mostly of bivalves, displayed a
unimodal distribution concentrated at 40 - 50 cmbs. Bocek (1986:597) proposed the
extremely low-density, thin, flat shells were transported by different mechanisms from
the larger and heavier objects (1986:597). Of the three types of shells found at the site,
higher density shell acted more similar to lithic artifacts and occurred more frequently
than low density shell in the upper excavation levels. Transport of artifacts in gopher -
disturbed areas is impacted by both the size and density of material (Bocek 1986:597).
Seven years after the initial research at the Jasper Ridge, Bocek (1992) returned to
investigate subsequent gopher disturbance. During the first excavation all material larger
than 0.6 cm was collected and the units were backfilled with sieved sediment. Therefore
it could be assumed upon re-excavation that any objects larger than about 0.6 cm had
been introduced into the unit, possibly by pocket gophers. As mentioned above, the
objects transported by pocket gophers are constrained by tunnel diameter and should be
no greater than five centimeter in maximum length. As the majority of gopher activity
occurs in the first 30 cmbs, a greater number of artifacts should be found in the upper 30
cm than in deeper layers.
Re-excavation revealed that 8% of the cultural material found during the first
excavation had been introduced into the unit; a process they attributed to gopher activity
(Figure 2.7). The vast majority of artifacts were smaller than 1.8 cm. In fact, only a
single flake larger than 3.5 cm was recovered. This artifact was found in the first 10 cm
of excavated sediment (Bocek 1992:264). No new material had been deposited on the
surface of the unit. In Level 1 (0 to 10 cmbs), the highest proportion (41%) of the
original amount of cultural material had been transported into the unit. At greater depths

40
the amount of cultural material introduced into the unit decreases, likely due to the lack
of gopher activity. The only exception occurred from Level 6 (50 - 60 cmbs) to Level 7
(60 - 70 cmbs) where the percent of material increased 2.9%. When comparing artifact
size distributions from the 1981 and 1988 excavations, “frequency distributions suggest
that small-sized materials are gradually dispersed throughout the zone of maximum
rodent activity as soil disturbance increases through repeated burrowing” (Bocek
1992:267).
Figure 2.7. Percent of New Artifacts Introduced into Units Seven Years after Initial
Excavation of the Jasper Ridge Site (Figure adapted from Bocek 1992:Figure 1)
0
5
10
15
20
25
30
35
40
45
50
1 2 3 4 5 6 7 8
10 cm Levels
Per
cen
t of
Art
ifa
cts
Debitage
Shell
Bone
This study is particularly significant because, in the past, archaeologists have
associated gopher disturbance primarily with vertical, not horizontal disturbance of
artifacts (Bocek 1986). Yet Bocek’s (1992) research clearly indicates rodent activity can
expand the area of a site and impact the density of artifacts. Bocek calculated it would
take only 88 years for gopher activity to completely ‘restock’ the cultural material to the
excavated unit. In the almost one-thousand years since the prehistoric occupation of

41
Jasper Ridge, Bocek determined the artifacts in the unit could have been recycled 11
times (Bocek 1992:268).
Geomorphic Impacts: The Formation of ‘Stone Zones’
Donald Johnson (1989) investigated the impact of pocket gopher activity on
stratigraphy at the Signorelli Ranch site near the Vandenberg-Lompoc area of California.
The site is located on a gravelly colluvial apron inundated with both abandoned and
active pocket gopher mounds. A road cut at the site exposed a soil profile consisting of a
homogenous biomantle of dark sediment overlaying a discrete pavement of randomly
oriented natural stones and archaeological artifacts all with lengths ≥ 6 cm. The layer of
stone varied between 30 and 50 cm thick at a depth ranging from 25 to 60 cm below the
surface. Archaeological artifacts of similar size were incorporated in the layer of natural
rock. Particle size and chemical analysis of mounds and soil overlying the stone zone
showed the sediment was indistinguishable (Johnson 1989:370). The accumulation of
larger clasts corresponds to the size of material that gophers are unable to transport and to
the depth of burrowing. Johnson attributed the soil profile seen at the Signorelli Ranch
site to the gradual sinking of the larger materials that gophers avoid while burrowing
(Figure 2.8). Gophers typically go around or beneath larger objects, which forms voids
that large clasts overtime descend into (Johnson 1989:372). He termed these non-cultural
features ‘stone zones.’ The notion that gophers were not transporting clasts of a certain
size was supported by the lack of material larger than 6 cm in gopher mound sediment
(Johnson 1989:376). This study is important as it demonstrates that concentrations of

42
subsurface archaeological material may result biomechanical processes and not human
activity.
Figure 2.8. Formation of Stone Zones Proposed by Johnson (1989)

43
Gophers and Stratigraphic Integrity: Bimodal Artifact Distribution
The impact of pocket gopher activity on the vertical distribution of artifacts was
studied by Erlandson (1984) at a short-term, single component prehistoric site in the
foothills of Santa Barbara, California. Prehistoric artifacts found during excavation
included temporally diagnostic shell beads, bone, and lithic debris. A small number of
historic artifacts and sediment that had been soaked in motor oil were present in some of
the units. The intense mixing of sediment at the site, identified by the presence of
krotivina, made distinguishing in-situ deposits impossible (Erlandson 1984:785).
Artifact frequency by depth had a weakly bimodal distribution (Erlandson
1984:787). The largest peak occurred at either 10 to 20 cmbs or 20 to 30 cmbs,
depending on the location of the excavation unit. A dramatic decline in artifact
frequency occurred from 30 to 50 cmbs depth followed by a second, less dramatic peak
or “distinctive flattening in the declining curve” (Erlandson 1984:787). To determine if
the bimodal distribution in prehistoric artifact frequency resulted from post depositional
disturbance or multiple occupation events, Erlandson examined the distribution of the
modern oil-inundated sediment. The oil-soaked profiles had the same bimodal
distribution as the prehistoric artifacts, strongly supporting the idea taphonomic processes
were affecting the distribution of archaeological material.
Studies on Thomomys bottae, the species present in Erlandson’s research area,
show tunneling occurs at 15 to 20 cm and burrows at 50-55 cmbs. The distribution of
cultural material at the site was attributed to the infilling and collapse of abandoned
tunnels and dens (Erlandson 1984:788). Assuming this was occurring at the site,
Erlandson calculated that in the 500 years separating the prehistoric and historic

44
occupations at the site, the average rate of artifact redistribution was 5% per 100 years
(1984:789).
Pocket Gophers and Archaeology: Summary
The studies discussed above show the significant effect pocket gopher activity can
have on the distribution of archaeological material. Pocket gophers are most often
associated with the homogenization of soil horizons and the mixing of stratigraphic
sequences. Bocek’s research (1992) showed artifacts disturbed by burrowing are not
limited only to vertical relocation. Pocket gopher activity can transport artifacts laterally;
a notion not extensively considered prior to her work at Jasper Ridge. Horizontal
movement can increase the spatial extent of a site; and because pocket gophers typically
only move material less than 5 cm in length, lateral transport results in decreased density
of a particular size-class of artifacts.
The vertical sorting of artifacts by size within the soil profile was addressed by
both Bocek (1986) and Johnson (1989). Both studies found pocket gopher activity
dispersed smaller artifacts within a homogenized matrix throughout the burrowing zone.
Larger artifacts tended to accumulate at the maximum depth of pocket gopher activity,
forming what Johnson (1989) refers to as a ‘stone zone’ (Figure 2.8). Stone zone
formation was linked to one of two processes. One, large surface clasts may become
buried by sediment and by small clasts that pocket gophers transport to the ground
surface (Balek 2002: 43) or by the gradual sinking of larger clasts that pocket gophers
burrow around (Bocek 1984; Johnson 1989). Erlandson (1984) demonstrated how a
bimodal distribution of sub-surface artifacts could result from the infilling of abandoned

45
tunnels. Two stratigraphically distinct concentrations, such as those encountered by
Erlandson (1984), Johnson (1989), and Bocek (1986, 1992) could easily be mistaken as
an indicator of human created features or multiple occupations.
Studies evaluating the impact of pocket gopher activity on archaeological material
show there is a great potential to misinterpret natural phenomenon as human behavior.
This project aims to build upon previous studies of pocket gophers occupying
archaeological sites and to develop ways to identify the tell-tale signs of gopher activity.
The following chapter describes how pocket gopher occupation was documented at
48PA2874, the analysis conducted to explore patterns in the horizontal and vertical
distribution of artifacts, and the methods used to evaluate the impact of gopher disturbed
sediment on site formation processes.

46
CHAPTER 3
RESEARCH METHODS AND DATA
Site 48PA2874 was discovered by Dr. Lawrence Todd in the summer of 2004
during a recreational hike. Colorado State University archaeological field school students
documented the site in 2005 and returned to conduct additional research in 2006.
48PA2874 is distinguished from other local sites by the quantity and density of lithic
debris, diversity of tool types, range of chronologically diagnostic projectile points, and
the presence of spatially discrete concentrations of artifacts. Temporally diagnostic
projectile points found on the surface of the site indicate human presence as early as the
Late Paleoindian period, approximately 9,000 years before present with episodes of use
extending into the Late Prehistoric, within the last 1000 years. Fieldwork had two
objectives: 1) to determine if 48PA2874 contained buried cultural deposits; and 2) to
investigate the impact of pocket gopher activity on artifact distribution.
This chapter outlines the methods used to record surface artifacts, conduct test
excavation, and document pocket gopher activity. This is followed by a discussion of the
artifact assemblage at 48PA2874, the results of the test excavation, and data recorded on
pocket gopher burrows.

47
Research Methods
Documentation of 48PA2874
Artifacts at 48PA2874 were identified using a non-systematic survey strategy
known as noodling. Noodling refers to the focused examination of the area surrounding
an artifact. Standardized artifact attributes were entered into an Excel spreadsheet using a
personal digital assistant (PDA). Location information for each artifact was collected
with a Wide Area Augmentation System (WAAS)-enabled handheld Garmin Rino 110
GPS (± 5 meter accuracy). Attributes documented on each artifact include type, raw
material, dimensions, color, presence of inclusions, heat modification, and percent of
dorsal cortex. In 2005 the primary and secondary color of an artifact and the portion of
the flake present (complete, platform, no platform) were noted. Documentation of these
two characteristics was discarded in 2006 in an effort to increase the rate of artifact
recordation. In both field seasons, artifacts were divided into eight broad artifact types
and then sub-divided into more specific categories. The eight general artifacts types are:
flake, angular debris, nodule/cobble, core, awl, biface, scraper, and projectile point.
Flakes and angular debris were further identified as having no edge modification, edge
modification of undetermined origin (i.e., resulting from either natural processes or
human behavior), or having clear, human worked edges. Bifaces were classified into five
stages representing a continuum in the production sequence; Stage 1 being initial
reduction to Stage 5, a finished tool. Scrapers were subdivided into side, end, or
general/undefined scraper categories. Nodules were identified as tested, worked, or
complete cobbles. Cobbles were defined as an unbroken stone of a type of raw material
suitable for knapping not naturally occurring at the site. The amount of cortex on an

48
artifact was described as 0%, 1 - 10%, 10 - 25%, 25 - 50%, 50 - 75%, or 75 - 100%
coverage on the dorsal surface. When present, the type of heat modification was
recorded (crazing, potliding, thermal fracturing, or multiple types). Projectile points and
most tools were photographed and GPSed with a Trimble GeoXT (sub-meter
differentially corrected accuracy). Additional measurements recorded on projectile
points include blade length, neck width, stem length, side-notch depth, and basal notch
depth. Other then the temporary collection of obsidian for geochemical sourcing (Bohn
2007), no surface artifacts were collected. Epoxy molds were taken of chronological
diagnostic projectile points and other notable artifacts.
Test Excavation Methods
Test excavation was conducted at 48PA2874 to determine if buried cultural
material was present and to gain a better understanding of site formation processes. It
was suspected that loose sediment from pocket gopher mounds was eroding into small
alpine sag ponds located at the site, creating buried archaeological deposits. The area
chosen for test excavation was a centrally located sag pond surrounded by pocket gopher
activity and a moderate to high density of surface artifacts.
Four 1 by 1 m test units were excavated at 48PA2874. Units were laid out in an
alpha-numeric grid system that divided the site area into 5 by 5 m blocks (Figure 3.1).
East-west trending grid lines were assigned letters in alphabetic order and north-south
grid lines were sequentially numbered. Each 5 by 5 m block was identified by the
corresponding letter-number combination. The blocks were than sub-divided into 1 by 1
m units, for a total of 25 units per block. The units were sequentially numbered,

49
beginning in the southwest corner and moving north, then east at the end of each row.
This provided each 1 by 1 m unit with a unique identification, for example A 1 - 1.
Figure 3.1. Example of the Excavation Grid Layout
A 1 -5 A 1 – 6 A 1 - 15 A 1 – 16 A 1 - 25
A 1 -4 A 1 – 7 A 1 – 14 A 1 - 17 A 1 – 24
A 1 – 3 A 1 - 8 A 1 – 13 A 1 - 18 A 1 – 23
A 1 -2 A 1 - 9 A 1 – 12 A 1 - 19 A 1 – 22
A 1 -1 A 1 - 10 A 1 – 11 A 1 - 20 A 1 – 21
A 1 -5 A 1 – 6 A 1 - 15 A 1 – 16 A 1 - 25
A 1 -4 A 1 – 7 A 1 – 14 A 1 - 17 A 1 – 24
A 1 – 3 A 1 - 8 A 1 – 13 A 1 - 18 A 1 – 23
A 1 -2 A 1 - 9 A 1 – 12 A 1 - 19 A 1 – 22
A 1 -1 A 1 - 10 A 1 – 11 A 1 - 20 A 1 – 21
5 m by 5 m
Block A 1
The four 1 by 1 m units were oriented so that two units bordered one another on
the north/south axis, forming two 1 by 2 m test excavation areas. One 1 by 2 m
excavation area (units U27-16, U27-17) was located at the edge of the sag pond. The
other two units (T26-6, T26-7) were placed on a gentle slope leading into the pond. Units
were excavated and cultural material collected in five centimeter vertical intervals or
levels. Artifacts and charcoal larger than one centimeter were mapped in-situ with a
Sokkia Set 4B EDM (electromagnetic distance measurement). Sediment was screened by
level with a 1/8th
inch wire mesh screen. Artifacts were documented with the same
methods used on surface material. Charcoal samples larger than one centimeter

50
encountered during screening were also collected. When abundant, only a representative
sample of charcoal per level was collected.
Eight sediment samples were collected from the test excavation units. Five
samples were collected from U27-16 (pond unit) at depths ranging from 1 cmbs to 115
cmbs. Three samples were collected from T26-17, the excavation unit located up-slope
of the pond. Color was identified for each sample using Munsell soil color charts (Color
1975). Particle size analysis was conducted by Naomi Ollie, a former Colorado State
University (CSU) graduate student, at the CSU Soil, Water and Plant Testing Laboratory
Soils Laboratory using the hydrometer method. This method uses the settling rates of
sediment in an aqueous solution to determine the proportion of sand (particles measuring
2 – 0.05 mm), silt (0.05 – 0.002 mm), and clay (<0.002 mm) in a sample. Three charcoal
samples from test excavation unit U17-17 were sent to Beta Analytical for radiocarbon
analysis (Beta - 221329, Beta - 221330, Beta - 221331).
Pocket Gopher Data Collection
The effect of pocket gophers on archaeological material and site formation at
48PA2874 was explored through the documentation of surficial evidence of pocket
gopher activity in a one-hectare sample area surrounding a small sag pond (Figure 3.2).
The study used these data to identify topographic controls on burrow placement, examine
the influence of pocket gophers on artifact distribution, and evaluate the amount of
erosion occurring from disturbed sediment.

51
Figure 3.2. Pocket Gopher Documentation at 48PA2874
Photograph by L.C. Todd
Pocket gopher activity was identified through pedestrian survey that began at, and
radiated out from, the excavation units located in the dry sag pond. Pocket gopher
occupation was indicated by the presence of small mounds of sediment and soil casts.
Soil casts form during winter months and pocket gopher data were collected in June,
therefore researchers were able to classify gopher activity as active (mounds) or inactive
(soil casts). The presence of cobwebs or extremely dry, deflated soil on some mounds
suggested they were not in use at the time of recording. To determine if mounds were
currently active, the sediment, after being analyzed, was placed back into the burrow
opening. The burrow was subsequently monitored for freshly ejected sediment as an
indication of activity. Burrow locations were mapped using an EDM total station and the
following characteristics were documented: the type of burrow (mound or soil cast),
volume of disturbed sediment, volume of disturbed rock, length and width of the mound

52
or the length of the tunnels, and size of burrow opening. The sediment disturbed by
pocket gophers was sieved through 4.76 mm (0.187 in) wire mesh screen. Artifacts
encountered were collected and analyzed using the same methods employed for surface
and subsurface test excavation artifacts. In addition, sediment and rock samples were
collected from each burrow. Non-culturally modified rocks with lengths greater than 5
cm were documented but not collected.
To determine the size distribution of clasts within gopher-disturbed sediment,
rock samples were sorted by size using an Al-Sci Sieve/Gravelometer. The gravelometer
measures clasts with lengths between 4 mm and 128 mm, at intervals ranging between
1.7 mm and 10mm. Sediment collected from 25 burrows underwent the same particle
size analysis as sediment from test excavation units. Artifacts collected from gopher-
disturbed sediment were analyzed using the method described for excavation and site
surface artifacts.
Geospatial Analysis of Gopher Burrows
Topographic controls on burrow placement were explored utilizing GIS software
ESRI ArcGIS 9.1 and 9.2. The location of burrows and their associated attributes,
including type (mound or soil core), occupation status, sediment volume, particle size
distribution, non-cultural stone, and artifacts, were examined in relation to elevation,
aspect, and slope. Slope and aspect were calculated using high resolution elevation data
collected during fieldwork.
A separate analysis of data from burrows located within the catchment area was
conducted to examine erosion specifically within the pond. The hydrologic boundaries of

53
the pond were determined using Geographic Information Systems (GIS) software ArcGIS
9.1. The Spatial Analyst Flow Direction Hydrology function in ArcGIS 9.1 calculates the
direction surface water travels based on elevation data. Using a 10-m resolution digital
elevation model (DEM) from the US Geological Survey EROS Data Center
(http://seamless.usgs.gov 1999), the program identified an area 1880 m² (0.188 ha) as the
pond catchment.
Statistical Evaluation of Artifact Characteristics
The maximum length of artifacts and multiple shape indices were used to explore
patterns and correlations in gopher mound, surface, and subsurface artifacts. The length
(a), width (b), and thickness (c) (Figure 3.3) of each artifact was obtained using digital
calipers and the measurements applied to equations that quantify the physical features of
cultural material. The shaped indices of elongation, flatness, and blockiness/sphericity
were calculated using the following ratios b/a, c/b, and (bc/a²)⅓
(Scally and Owens 2005).
Axial measurements are correlated with particle weight and therefore can be used as a
size index as well as a shape index (Scally and Owens 2005:50). The calculation used to
categorize weight is (a+b+c)⅓
. Normal distribution of the data was determined using
Levene’s test for equality of variance. Once determined, the appropriate t test
(parametric/nonparametric) was applied. Tabular data for each statistical test are listed in
Appendix B.

54
Figure 3.3. Axial Measurements Used to Calculate Shape Indices
Geographic Information System Erosion Model
A Geographic Information System (GIS)-based erosion model was used to predict
the path and amount of erosion occurring from pocket gopher mounds. The program,
called the D90 Erosion model, was created by Dr. Denis Dean, a former professor in
geospatial science at CSU (Dean 2006). The model determines path of erosion from a
given starting point based on elevation data. It is assumed particulate matter will travel
the path of least resistance, i.e., downslope. As shown in Figure 3.4, elevation data are in
a grid format (raster) where each grid cell represents the elevation of a 0.5 m by 0.5 m
area on the ground surface. The starting point, the gopher mound, is linked to a number
representing the volume of material available for erosion. If the cell adjacent to the
gopher mound is lower in elevation, then a user-defined percentage of sediment is
transferred downslope.
The D90 model is a Visual Basic 6 program that reads two ASCII files; one
representing the ‘source’ points (gopher burrows) and one representing elevation data.
Both ASCII files were exported from ArcGIS 9.2 using the Raster calculator tool. Once
imparted into Visual Basic 6, the D90 program evaluates gopher mound data in
Width (b)
Length (a) Thickness (c)

55
Figure 3.4. The D90 Erosion Model
Pocket gopher burrow location data and the
associated volume of sediment (1.00) is
superimposed on elevation data (Z) and moves a
user-specified percent of sediment (0.85, 0.10,
0.05) into adjacent downslope cells. If only two
cells bordering the source area are lower in
elevation, than the program will move only the
portion initially allocated and the remainder stays
in the source cell. In the example below if only
two cells were lower in elevation than the source
cell, then 0.85 and 0.10 would be transported and
0.05 would remain in the source cell.
conjunction with elevation data, moving a user-defined percentage of sediment in a
specified number of directions (shown in Figure 3.4). Material is moved only when
adjacent elevations are lower than the source area. The percent of sediment moved is
ranked, meaning a higher percentage of material will be moved to the lowest elevation, a
lower percentage will move to the next lowest elevation and so forth. If sediment moves
into an area previously evaluated, the new volume is added to the current volume and the
algorithm is re-run. The process per cell is terminated when either there is no more
sediment is available to move or no neighboring area has a lower elevation. The model
outputs an ASCII database containing the path and volume of material eroding from each
gopher mound. The ASCII file is then brought into ArcGIS and turned into a raster
database using the Raster Calculator tool.
The model is interpreted as predicting one year of sediment accumulation in a 0.5
by 0.5 m area (the user-determined size of the elevation data grid cell). The predicted
path and amount of sedimentation was compared with an estimate of accumulation

56
derived from three radiocarbon dated charcoal samples collected from known depths in
test excavation unit U27-17. If the model predicts sediment will be deposited in the
location where the radiocarbon sample was obtained, then the amount of sediment
predicted to accumulate can be multiplied by the number of years indicated by the
radiocarbon date. The resulting value indicates the volume of sediment deposited in a
particular 0.25 m² area (0.5 m x 0.5 m cell size) in a specified timeframe. If the model is
accurate, predicted deposition should approximate the depth at which the radiocarbon
sample was collected.
Elevation data used in the model were collected during field work with an EDM.
Although 900 points were taken to document topography, as Figure 3.5 shows, the data
were not collected in a grid system. This resulted in some gaps in topographic
information. To compensate for the ‘missing’ data, a 10 m digital elevation model
(DEM) of the Phelps Mountain 7.5’ Quadrangle was downloaded from the USGS
(http://seamless.usgs.gov). The 10 m resolution DEM was merged with the field data
using the Append function in ArcGIS 9.2. The resulting shapefile was interpolated using
the Kriging function. Kriging is commonly used in geospatial science to generate the
value of an unknown field by using data from nearby locations. The kriged elevation
map, however, did not represent the actual landscape (Figure 3.5 c). Upon further
investigation a discrepancy between the DEM and field data vertical datums was
discovered. To reduce the elevation difference between corresponding cells in the
database, the average of the elevation discrepancy was calculated and the difference (7.6
m) was added to each cell in the USGS data. The databases were then recombined (using

57
the Append function) and re-kriged (using the Kriging function). The output then
satisfactorily represented the topography at the site (Figure 3.5).
Figure 3.5. Steps Used to Merge Field-Collected Elevation Data and USGS DEM A. Location map of points taken in field with EDM, B. 10 m USGS Digital Elevation Map, C. Map of
merged data points, D. Final elevation map used in analysis (lightest areas=lowest elevation, sag pond
upper right, ridge trending southwest-northeast)
10m USGS DEM
50m
50m
Elevations from Field Data
Merged Elevation
Data
Final Elevation
Map
5 meter contours
A.
B.
C. D.
10m USGS DEM
50m
50m
Elevations from Field Data
Merged Elevation
Data
Final Elevation
Map
5 meter contours
A.
B.
C. D.
Gopher burrow information input into in the model consisted of location data, the
extent of areal coverage per mound, and the volume of disturbed sediment. Since fines
are more likely to be redistributed than sand, only a portion of the sediment volume was
used to determine accumulation. The average amount of silt and clay in gopher mounds
(determined through particle size analysis) was approximately 50 %, therefore half the
volume recorded per gopher burrow was used in calculations.

58
Results of Data Collection
48PA2874: Artifact Assemblage
Over 2,470 artifacts were recorded at the site in an area covering approximately
2.8-hectares. The site is significantly larger and contains a greater quantity and diversity
of artifacts than other sites in the vicinity. There are six discrete concentrations of lithic
material interspersed with a sparse scatter of debris (Figure 3.6). Three of the
concentrations have distinct clusters of heat-altered lithic material, which may indicate
the presence of a hearth. A brief description of the site is provided below and additional
data are provided in Appendix A. Artifact Concentration 2 is addressed in greater detail
as test excavation and pocket gopher documentation occurred within this concentration.
A full description of the site is provided in Appendix A.
The artifact assemblage is dominated by flakes and angular debris (97%, n=2385)
(Table 3.1). Tools (worked flakes, bifaces, awls, scrapers, and projectile points)
comprise 3% (n=75) of the artifacts at the site, nodules and cores make up 0.5% (n=11).
Cortex was present on only 3% (n=77) of artifacts. When present, artifacts with 50% or
more cortex account for less than one percent of the assemblage (n=16). The lack of
artifacts with cortex, the small number of cores, and the absence of an on-site raw
material source indicates later stages of tool production rather than initial reduction were
occurring at the site.

59
Figure 3.6. Distribution of Artifacts at 48PA2874
!
!
!!
! !!!! ! !!!
! !!!!!!! !!! !!!!
! !! ! !!
!
!
!! !
!!
!
!
!
!
!
!
!!
! !
!!
!! ! !! !! !
!! !! !! !
!! !!
!
! !
!
!
!
! ! !
!
!
! !
!
!
!!!
! !!!!!!
! !!!! !
!!! ! !
! ! ! ! !
!
!
! !
!
[�
[�
[�
[� [�
[�
[�
[� [�
[�[�[�
[�
[�
[�
[�
[�[�[�[�
[�[�
[�
[�
[�
[�
Concentration 1
Concentration 2
Concentration 3
Concentration 4
Concentration 5
Concentration 6
0 30 6015
Meters
Site 48PA2872
Artifact Distribution
[� Projectile Points
! Heat Impacted Artifacts
.
*1 meter buffer around artifacts (n= 2471)
48PA2874
*

60
Table 3.1. Summary of Surface Artifacts at 48PA2874
Artifact Types Projectile Point Types Artifact Type Count Percent Time Period Count %
Flake 1806 73.1 Paleoindian 2 8%
Worked Flake 16 .6 Early Archaic 2 8%
Edge Damage Flake 463 18.7 Middle Archaic 4 15%
Angular Debris 116 4.7 Late Archaic 6 23%
Projectile Point 26 1.1 Archaic 4 15%
Biface 20 .8 Late Prehistoric 2 8%
Scraper 10 .4 Unidentifiable 6 23%
Awl 3 .1 Total 26 100
Core 4 .2
Nodules 7 .3
Total 2471 100
A wide variety of raw material types were found at the site (Table 3.2).
Unfortunately much of it (67%) consisted of chert that could not be visually identified by
field crews as either local or exotic because similar specimens occur in multiple
locations. Artifacts from local raw material make up 21% of the assemblage, non-local
material 11%. The high proportion of unknown sources makes inferring information
such as preferred tool stone or mobility patterns from these data impossible.
Bohn (2007) analyzed the source of obsidian artifacts throughout the GRSLE
project area, including 12 samples from 48PA2874. Obsidian at the site was sourced to
three areas, 75% was from Obsidian Cliff located 140 km (87 miles) northwest of the
project area, 17% from Teton Pass 142 km (88 miles) west/southwest, and 8% from Park
Point, the closest source area, 87 km (54 miles) northwest (Bohn 2007).
As mentioned above, there were six discrete concentrations of lithic debris at the
site; three of which had clusters of heat impacted artifacts (Figure 3.6). Although no fire-
cracked rock was found, it is likely the fire affected clusters of chipped stone represent
the remains of a hearth.

61
Table 3.2. Raw Material Types at 48PA2874
LOCAL NON-LOCAL
Material Type Count Percent Material Type Count Percent
Chalcedony 249 10.1 Quartzite 206 8.3
Mudstone 214 8.7 Obsidian 42 1.7
Petrified Wood 41 1.7 Morrison For. Quartzite 27 1.1
Irish Rock Chert 6 .2 Phosphoria 2 0.1
Volcanic/Basalt 5 .2 Porecelanite 1 0.05
Madison For. Chert 3 0.1 Total Non-Local 287 11.3%
Dollar Mountain Chert 1 0.05 UNKNOWN
Total Local 519 21% Chert 1674 67.7 *Toolstone “local” if located in Upper Greybull watershed. Total Unknown 1674 67.7%
Concentration 2 surrounds the pond where pocket gopher documentation and test
excavation was conducted. Over 800 artifacts were found in approximately 600 m²,
including eight projectile points, seven bifaces, one core, three worked flakes, five
scrapers, and two nodules. The only two projectile points dating to the Paleoindian
period at the site are located in Concentration 2. In addition, two Middle Archaic, two
Late Archaic, one general Archaic, and one temporally unidentifiable project point were
found. The distribution of tools displays an interesting pattern. The four projectile points
dating to the Archaic period are clustered in a 10 m² area with the Middle Archaic points
lying directly beside one another. With the exception of one Paleoindian point and the
unidentifiable projectile point, all projectile points are located within the cluster of heat
affected artifacts. However, none of the projectile points have any indication of heat
exposure. Other tools contained in the cluster of heat impacted artifacts are three bifaces,
four scrapers, three worked flakes, and one nodule. Of these, only one tool, a worked
flake, shows evidence of heat exposure.
The extent of 48PA2874, the density of lithic debris, the diversity of tools and raw
material, and internal spatial patterning of artifacts suggest a range of activities were
occurring at the site. Temporally diagnostic artifacts indicate the site was used as early as

62
9,000 years before present through the Late Prehistoric period. Clusters of heat impacted
artifacts surrounded by debitage and tools suggest areas of focused activity centered
around a hearth; which may be associated with more than brief instances of opportunistic
hunting.
Test Excavation Data
Four 1 m by 1 m test excavation units were placed within Concentration 2 to
determine the presence of buried archaeological deposits and to explore biophysical
interactions affecting site formation (Figure 3.7). Taphonomic processes at a site-specific
scale were analyzed through the comparison of sediment properties and the physical
characteristics of subsurface and surface artifacts. Landscape change occurring at a
broad spatial scale is addressed through the examination of soil in the test excavation
units. The following section summarizes the results of test excavation and explores
general trends in the data. Additional information, including a level-by level narrative for
each test unit is provided in Appendix B.
T26-6 and T26-7 are located approximately 13 meters upslope of the pond bottom
(Figure 3.7). The units were placed on a slope that trends downward north-northeast at
approximately 6º to 7º. T26-6 and T26-7 border each other on their south/north edge
respectively. Together, T26-6 and T26-7 yielded a total of 395 pieces of culturally
modified lithic material within a depth of 30 cmbs (Figure 3.8). Sixty-one percent
(n=241) of the chipped stone in the T26 units was recovered from T26-6, the downslope
test excavation unit. T26-7 yielded total of 39% (n=150) of the artifacts collected in the
T26 units.

63
3.7. Location of Excavation Test Units
The trend in artifact frequency in both units is an increase in lithic
materials beginning at 5 cmbs, peaking around 15 cmbs, steadily decreasing to 30 cmbs.
The maximum depth of buried cultural material is unknown as excavation ceased prior to
reaching sterile sediment due to time limitations.
POND

64
Figure 3.7. Block T26: Artifact Frequency by Depth
0
20
40
60
80
100
120
140
Surface 0-5 5-10 10 -15 15-20 20-25 25-30
Depth (cmbs)
Co
un
t
All T26 Artifacts
T26-6
T26-7
Block U27 is located north and east of T26 along the southern edge of the sag
pond. Together the two units U27-16 and U27-17 yielded a total of 64 lithic artifacts.
Twice the amount of sediment was removed from U27 (60 cmbs) as compared to T26,
however the units contained only 13% of the total number of artifacts recovered during
test excavation. U27-16 and U27-17 were initially excavated by quadrant, then, due to
the lack of cultural material, at 30 cmbs units were excavated as 1 by 1 m areas.
Almost 70% of artifacts found in U27 were recovered from U27-17, the upslope
unit (n=44). Artifact frequency in U27-17 displays a bimodal distribution with peaks at
20 cmbs and 50 cmbs (Figure 3.8). Three artifacts were found on the surface of U27-16
and only one artifact was recovered in the first 15 cm of sediment excavated. U27-16
had an increase in artifact frequency at 20 cmbs. Although there is an increase in lithic
material with depth, no more than 15 flakes were found in any given level in U27-16 and

65
U27-17 combined. The final level excavated in both units contained artifacts. As stated
above, the depth of buried cultural deposits was not determined due to time limitations.
Figure 3.8. U27 Artifact Frequency by Depth
0
2
4
6
8
10
12
14
16
18
20
Surface 0-5 5-10 10-15 15-20 20-25 25-30 30-35 35-40 40-45 45-50 50-55 55-60
Depth (cmbs)
Co
un
t
All U27 Artifacts
U27-17
U27-16
Summary of Pocket Gopher Documentation
Fifty-three areas of pocket gopher activity were documented in the one-hectare
sample area (26 mounds, 27 soil casts) (Figure 3.9, Table 3.3). The total volume of
displaced material was 309.6 liters. Of the 309.6 liters, 249.1 liters consisted of sediment
and 60.5 liters of rock, approximately a 4:1 ratio. The volume of material associated with
individual burrows ranged from 0.3 to 28.4 liters, with an average of 5.8 liters per
location. Seventeen burrows were active and 34 had no evidence of current occupation.
Activity was not determined for the two mounds recorded on the final day of fieldwork,
as researchers did not return to the site to monitor for newly ejected sediment. A total of
114 pieces of flaked stone were recovered from gopher disturbed sediment, a density of

66
approximately 4 artifacts/ m2. Other than lithic debris, no other types of culturally
modified or non-cultural material, such as bone, were recovered from burrows.
Figure 3.9. Distribution of Pocket Gopher Burrows in 1-Ha Sample Area
The surface area disturbed by pocket gopher activity was calculated using the
length and width of each mound. Since only the length of soil casts was recorded in the
field, the average width of gopher tunnels, 15 cm (Gabet at el. 2003) was used to
determine the ground surface covered by soil casts. The length and width of eight
mounds was not recorded and to adjust for the missing data, the average size of mounds
in the study area was substituted (0.5 m²). Calculations show pocket gophers disturbed
28.2 m², or 0.28%, of the hectare (10,000 m²) study area.
POND
BURROWS

67
Table 3.3. Summary of Pocket Gopher Data in 1-Hectare Sample Area
Burrow Current Occupation
Mound Soil
Core
Sediment
(liters)
Rock
(liters) Flakes Active Inactive Unknown
Surface
Area
26 27 249.1 60.5 114 17 34 2 28.2 m²
Gopher Activity in the Pond Catchment Area
Thirty-six of the 53 burrows are located within the catchment area (19 mounds, 17
soil casts) (Table 3.4). The volume of material disturbed by pocket gopher activity in the
1-hectare area totaled 147.9 liters, of which 113.2 liters were sediment and 34.7 liters
rock. The volume of sediment in individual gopher burrows varies from 0.2 to 14.4
liters. Approximately one-third of the burrows were occupied at the time of
documentation. Although the pond catchment area represents only 19% of the sample
area, it contains well over half the burrows (68%) and almost half (48%) the sediment
and rock disturbed by pocket gophers in the entire study area. Pocket gopher activity
covers 15.8 m² (0.8%) of the catchment surface area. Compared to the entire sample
area, the pond catchment has a higher density of burrows and greater extent of surface
disturbance. This distinction may indicate that the vegetation, sediment, and topographic
characteristics of the pond area are more suitable for pocket gopher habitation than the
area outside the pond.
Table 3.4. Pocket Gopher Data: Burrows Located in Pond Catchment Area
Burrow Current Occupation Pond Area (m²)
Mound Soil
Cast
Sediment (liters)
Rock Flake Active Inactive Unknown Total Disturbed
19 17 113.2 34.7 49 12 24 0 1880m² 15.8m²

68
Non-culturally Modified Stone Distribution
The size of rocks pocket gophers are capable of transporting is limited by tunnel
diameter. Johnson (1989:372) found gophers will not transport clasts greater than 6 – 7
cm diameter; other research found material greater than 5 cm in diameter was not
transported (Bocek 1886:591). In montane environments, rocks measuring 0.6 cm to 2.5
cm in diameter were more abundant in gopher disturbed sediment than the surrounding
ground surface (Hansen and Morris 1968:391). At 48PA2874 gopher disturbed sediment
contained clasts measuring over 5 cm, including one stone with a length of 25 cm (Table
3.5). Analysis of rock samples from mound sediment at the site reveals 87% of rocks
were less than 1.13 cm in length. Rocks with lengths between 4.5 and 25 cm comprised
only 2% of the sample. The size distribution of clasts found in soil casts was similar to
that of mounds, although no rocks larger than 6.4 cm were found in soil casts (Table 3.4).
It is possible larger clasts are not being transported, but rather dislodged by pocket
gopher activity.
Chipped Stone
Mound and soil cast sediment was screened with a 4.76 mm (0.187 in) wire mesh
screen to determine the presence of archaeological material. All artifacts found during
screening were collected for further analysis. A total of 114 pieces of culturally modified
lithic material were recovered from 29 burrows. Burrows contained a wide range of
artifact types, including flakes (84%), worked flakes (4%), angular debris (6%), bifaces
(2%), a core (1%), an awl (1%), an end scraper (1%), and a side scraper (1%). The
number of flakes found within pocket gopher sediment was not correlated with the

69
volume of disturbed material per burrow. The greatest number of artifacts (n=16)
recovered from a single burrow was found in only 1.7 liters of disturbed sediment.
Artifacts tended to be located on the gentle slope south of the pond and the level saddle to
the west. No artifacts were recovered from pocket gopher sediment on the steeper
eastern slope.
Table 3.5 Rock Size Distribution in Mounds and Soil Casts
Clasts in Mounds Clasts in Soil Casts
Length Count % of Total Count % of Total
4 mm 298 5.6% 95 2.4%
5.7 mm 1832 35% 1035 25.8%
8 mm 1659 31.6% 1255 31.3%
11.3 mm 772 14.7% 797 19.8%
16 mm 339 6.4% 417 10.4%
22.6 mm 162 3.1% 221 5.5%
32 mm 40 0.8% 103 2.5%
45 mm 64 1.2% 89 2.2%
64 mm 39 0.74% 3 0.1%
>64 mm 25 0.5% - -
9 cm 13 0.24% - -
12.8 cm 5 0.1% - -
25 cm 1 0.02% - -
Total 5249 100% 4019 100%
The following chapter analyzes data outlined above to gain a better understanding
of the geomorphic impacts of pocket gopher activity and influence on artifact distribution
at 48PA2874. As mentioned previously, additional information the site surface
assemblage can be found in Appendix A. Test excavation data and statistical analysis are
located in Appendix B.

70
CHAPTER 4
RESULTS AND INTERPRETATIONS
Test Excavation Analysis
To identify trends in the subsurface distribution of cultural material, the physical
attributes of artifacts were compared by level, unit, and block. Analysis also included
comparing subsurface material with site surface artifacts and those recovered from pocket
gopher mounds. Shape indices, including elongation, flatness, blockiness/sphericity, and
weight, and the maximum length of lithic material were compared between artifact
groups using Levene’s test for variance and t-tests for means.
Artifact data from T26-6 and T26-7 were combined and artifact characteristics
analyzed by depth (Table 4.1). Lithic material found on the surface of the units had the
greatest average length (15.5 mm) and the greatest variance from the mean (σ = 10.04),
while artifacts 0 – 5 cmbs had the lowest mean length (8.6 mm) and the lowest standard
deviation (σ = 4.02). With depth the average length of artifacts steadily increases until 25
– 30 cmbs where there is a slight decrease. The variation in artifact length has a
pronounced increase between 10 – 15 cmbs (σ = 7.73), then a decrease until 25 – 30
cmbs where standard deviation again increases (σ = 6.71).

71
Table 4.1. Mean Values of Artifact Characteristics by Depth:
All Levels of T26
Count Length (mm) Elongation Flatness Blockiness Weight Ratio
Surface 12 15.5 0.70 0.26 0.04 9.37
0-5 55 8.65 0.744 0.185 0.0347 5.39
5-10 85 8.74 0.692 0.196 0.0319 5.23
10-15 128 10.17 0.737 0.234 0.0411 6.61
15-20 49 10.83 0.714 0.231 0.0361 6.63
20-25 34 11.1 0.70 0.21 0.0361 6.70
25-30 31 10.24 0.734 0.220 0.0403 6.61
Average n = 394 10 0.72 0.22 0.04 6.24
T-tests were used to compare the physical characteristics of artifacts in T26 by
level; meaning artifacts found 0 -5 cmbs were compared with those from 5 -10 cmbs, 10
– 15 cmbs and so on. Results showed a statistically significant difference in the vertical
distribution of artifacts at the alpha 0.05 level between many of the attributes examined.
A brief summary of the results is provided below; tabular data of the statistical analysis
are located in Appendix B.
Artifacts located between 0 – 5 cmbs and 5 – 10 cmbs had uniform physical
properties; there was no statistically significant differences in any of the attributes
examined. Artifacts with depth become significantly longer, less flat, and heavier at the
alpha 0.05 level. In addition, artifacts from 5 – 10 cmbs were more elongated and more
angular than those from 10 – 15 cmbs. There were no significant differences between
artifacts from any level and those from 25 – 30 cmbs.
A comparison of T26-6 and T26-7 artifacts by level shows little variation in the
characteristics examined. T26-6 contained more artifacts per level than T26-7, with the
exception of 10 – 15 cmbs and 20 – 25 cmbs. Only two artifact characteristics had
statistically significant differences at the alpha 0.05 level. Artifacts recovered from 0 – 5

72
cmbs from T26-7 were significantly more angular than those from T26-6. At 15 – 20
cmbs T26-7 artifacts were more elongated.
In T26-7 there is a change in artifact frequency that corresponds to a change in
sediment characteristics. The A horizon in the western portion of T26-7 consists of
colluvial and alluvial deposits of light brownish grey (10YR6/2) sandy loam that overlays
a horizon of unsorted, angular, decomposing cobbles in a clay-rich, tan-mottled matrix.
The cobble layer, formed by slump-earthflow events, emerges around 15 cmbs in the
most upslope quadrant of T26-7 (SW corner of the SW quadrant) and extends with depth
to the northeast, following the curve of the landform (Figure 4.1). As the cobble layer
was revealed, artifact frequency decreased substantially. A similar relationship between
artifact frequency and sediment change can not be evaluated in T26-6 because the large
cobbles and tan sediment were only beginning to be uncovered in the southwestern
quadrant when excavation ceased.
The low number of artifacts recovered from U27 makes conducting statistical
analysis on artifact characteristics between levels difficult. The small sample size has the
potential to introduce substantial bias and skew any statistical analysis of artifact
attributes. The average values of maximum length and the shape indices are provided in
Table 4.2. No correlations between depth and artifact length or shape indices could be
identified in U27. Both units had a wide size range per level, with artifact lengths
measuring between 4 mm to 39 mm. Statistical analysis of artifact characteristics by
depth is not provided due to the small number of artifacts per level.

73
Figure 4.1. T26-6 and T26-7:
Exposure of Slump-Earthflow Deposits
N
T26-7
T26-6
Photography by L.C. Todd

74
Table 4.2. U27: Mean Values of Shape Indices
CMBS Count Length (mm) Elongation Flatness Blockiness Weight
Surface 1 5.3 0.566 0.233 0.4213 3
0-5 3 8.7 0.829 0.215 0.035 5.8
5-10 - - - - - -
10-15 4 11.25 0.744 0.266 0.521 7.83
15-20 5 16.8 0.773 0.307 0.061 10.94
20-25 7 5.08 0.492 0.274 0.329 2.77
25-30 4 14.7 0.813 0.186 0.042 9.14
30-35 1* - - - - -
35-40 1 56.8 0.871 0.337 0.635 41
40-45 3 9.8 0.694 0.246 0.470 6.10
45-50 4 11.6 0.580 0.133 0.352 6.37
50-55 8 19.51 0.621 0.289 0.452 11.18
55-60 4 18.4 0.746 0.189 0.467 12.12 *Missing Data
U27 had no identifiable shift in artifact frequency that correlated with a change in
sediment characteristics. Other than a slight increase in fine particulate matter with
depth, sediment color (10YR 4/2, dark grayish brown) and structure (massive) was
uniform throughout both units. The tan mottled sediment with cobbles found in T26 was
not reached in U27. As discussed below, this suggests greater sediment accumulation has
occurred in the pond units since the slump-earthflow event.
Comparing Subsurface and Surface Artifact Characteristics
There was a statistically significant difference in physical characteristics of
subsurface and surface artifacts. All artifact data from the two U27 units were grouped
prior to analysis due to the small number of specimens recovered during testing.
Artifacts from T26 were compared with surface artifacts by depth. T-tests of surface and

75
U27 artifacts show subsurface artifacts are statistically shorter, more elongated, more
angular, and lighter than surface artifacts.
Every level of T26 showed statistically significant differences in maximum length
and weight, with subsurface artifacts being smaller and lighter than surface material
(Appendix B). Subsurface artifacts were statistically more flat at all depths except 15 –
20 cmbs and more angular with the exception of 10 – 15 cmbs. Elongation of surface and
subsurface material was only significantly different between 5 – 10 cmbs, with
subsurface material being more elongated.
Test Excavation: Inferences on Formation Processes
Test excavation showed buried cultural material is present at the site at least as
deep as 60 cmbs. Soil profiles from the test excavation units provided a glimpse of
formation processes occurring at a broad spatial scale. Specifically, profiles were
examined for evidence of the slump-earthflow event on which the site sits. Sediment
characteristics are consistent with what would be expected: Upslope deposits consist of a
thin A-horizon with uniform texture and color then an abrupt transition to an unsorted
mass of brown-grey mottle sediment, gravels, and cobbles. The A-horizon gets thicker as
the slope becomes more level toward the pond. The greatest sediment accumulation
occurs within the pond due to the deposition of particulate matter eroding from upslope.
As mentioned previously, the slump-earthflow event, indicated by the unsorted cobble
horizon, was not encountered in the pond during test excavation. An auger probe was
placed in U27-17 to determine the depth of the slump-earthflow deposit within the pond.
The auger probe revealed a transition to clay-rich, tan, grey, and brown mottled sediment
at approximately one meter below the ground surface, however no cobbles were

76
encountered. The auger probe continued only 15 cm below the initial change in sediment
characteristics and may not have gone deep enough to reach the cobble layer.
The discrepancy in size and shape between buried and surface material may
indicate subsurface artifacts are not in their primary context. In general, buried artifacts
were smaller, flatter, more angular, and lighter than surface artifacts. Chipped stone from
T26 has less variation from the mean than surface artifacts in almost all artifact
characteristics at all depths. The comparison of artifacts from U27 and surface artifacts
showed statistically significant differences in all categories with the exception of flatness.
If smaller artifacts are being transported across the ground surface by processes
such as overland flow, then it might be reasoned that the frequency of artifacts would
increase as the landform begins to level out further downslope. Both T26-6 and T26-7
have the greatest number of artifacts in the most downslope quadrants. U27-16, the most
downslope of all four test units, and the unit located on the most level ground, contains
the smallest number of artifacts. This may be due to landform characteristics.
Deposition will occur where either the slope flattens enough to impede transport or
obstructions occur (Hilton 2003). The slope above U27-16 may be gentle enough for
artifacts to have been deposited prior to reaching the unit.
Determining if artifact distribution in the test excavation units is a result of human
behavior or natural processes with this level of analysis is not possible. The tendency of
subsurface lithic materials to be smaller and lighter than those on the site surface suggests
the possibility that artifacts are being relocated by post depositional processes. As
discussed in Chapter 2, there are multiple geomorphic processes in high elevation
environments capable of transporting artifacts. Bioturbation from pocket gophers is one

77
of these processes. The following section addresses the impact of their activity on
vertical and horizontal artifact distribution at 48PA2874.
Pocket Gopher Borrow Analysis
The objectives of pocket gopher documentation are to identify topographic
controls on burrow placement, examine erosion of pocket gopher disturbed sediment, and
begin initial evaluation of pocket gopher influence on horizontal and vertical artifact
distribution. To identify spatial patterns in habitat selection, the locations of pocket
gopher activity were examined in conjunction with high resolution topographic data.
Spatial analysis was conducted at two geographic scales, one covering the entire 1
hectare sample area for a generalized view of burrow location, and the other focusing on
the pond catchment area to examine localized preferences.
Redistribution of sediment disturbed by pocket gophers is examined by
comparing the physical properties of actively occupied burrows with deflated, abandoned
burrows. Abandoned burrows have been exposed to erosion for a longer period of time
than the active burrows and should exhibit different sediment properties. For instance,
older mounds and soil casts are expected to contain a lower proportion of silt and clay
than freshly churned sediment due to the vulnerability of small particles to erosion. To
identify patterns, similarities, or differences in the distribution of archaeological material,
the physical characteristics of artifacts recovered from pocket gopher mounds are
compared with those from test excavation units and the site surface. The following
section reports pocket gopher data and analyzes the results.

78
Spatial Distribution of Burrows: Aspect, Elevation, and Slope
Almost 90% of pocket gopher mounds and tunnels in the study area are on north
facing slopes. No evidence of pocket gopher activity was located on south, southeast, or
southwest facing slopes. Only 2% of burrows were found on west facing slopes. Slopes
with western and southern aspects have the greatest exposure to sunlight, resulting in
higher soil temperatures, lower soil moisture, and sparse vegetation, all of which deter
gopher occupation. Northern slopes retain snow pack longer, providing insulation from
cold winter temperatures and protection from predators. Approximately half (48%) of
winter pocket gopher activity, indicated by soil casts, occurred on north facing slopes.
Less than one-third (27%) of mounds, which are created in snow-free conditions, are
located on north-facing slopes (Table 4.3).
Table 4.3. Distribution of Gopher Burrows in Sample Area: Aspect
Aspect All Burrows Soil Casts Mounds
N 38% 48% 27%
NE 34% 30% 38%
NW 17% 7% 27%
E 9% 11% 8%
W 2% 4% 0%
SE - - -
SW - - -
S - - -
Total 100% 100% 100%
Pocket gophers occupied elevations between 3090 m to 3104 m (Table 4.4).
Although not a large span, even small differences in elevation can impact micro-
environmental conditions. Gopher activity was least frequent at the extreme ends of the
elevation spectrum. Of all burrows, almost half (49%) were located between elevations of
3098 m and 3100 m. A slightly higher percentage of tunnels than mounds were located

79
within the lowest elevation range. This may be due to the seasonal influx of melt water
into depressed areas, making conditions habitable only in the winter (Zaitlin, et al. 2007).
Evidence of gopher activity within the sag pond was minimal, consisting of only one
small surface opening with little associated loose sediment. Gophers may periodically
explore the pond, although the high soil moisture inhibits long-term occupation.
Table 4.4. Distribution of Gopher Burrows in Sample Area: Elevation
All Burrows Mounds Tunnels
Elevation (m) Count Percent Count Percent Count Percent
3098 – 3100 26 49% 11 42% 15 56%
3100 – 3102 11 21% 8 31% 3 11%
3102 – 3104 16 30% 7 27% 9 33%
Total 53 100% 26 100% 27 100%
Slope in the sample area ranged from 2º to 15º. Despite this wide range, pocket
gopher activity was evenly distributed across gradients and similar for mounds and
tunnels (Table 4.5). Slope did not appear to be a significant factor in burrow placement
at 48PA2874, a finding consistent with (Reichman and Seabloom 2002; Seabloom, et al.
2000) who found no correlation between tunnel characteristics and hill slope angle.
Table 4.5. Distribution of Gopher Burrows in Sample Area: Slope
All Burrows Mounds Tunnels
Range Count % Count % Count %
2º to 4º 13 24% 4 15% 6 22%
5º to 7º 12 23% 6 24% 9 33%
8º to 10º 11 21% 4 15% 6 22%
11º to 13º 11 21% 8 31% 4 15%
13º-15º 6 11% 4 15% 2 8%
Total 53 100% 26 100% 27 100%
The analysis of aspect, elevation, and slope and pocket gopher activity in the
catchment basin was consistent with the results from the larger sample area.

80
Approximately 75% of the burrows in the pond drainage area are located on north facing
slopes (Table 4.6c). No burrows are present on south, southeast, or southwest facing
slopes. Over twice as many soil casts are located on slopes facing north than are mounds
(47% of soil casts, 21% of mounds). No mounds are present on slopes with a western
aspect. Elevation in the pond catchment area ranges from 3094 to 3110 m (Table 4.6a).
Like the 1-hectare sample area, half the burrows are located in the mid-range, between
elevations of 3098 to 3100 m. Gradient did not appear to impact burrow placement as
pocket gopher activity was evenly distributed across the range of slope (Table 4.6b).
Table 4.6. Elevation, Slope, and Aspect of Burrows in Pond Catchment Area
Table 4.6a. Elevation Table 4.6b. Slope Elevation (m) Count % of Total Slope Count % of Total
3098 – 3100 18 50% 2º to 4º 8 22%
3100 – 3102 10 28% 5º to 7º 8 22%
3102 – 3104 8 22% 8º to 10º 7 20%
Total 36 100% 11º to 13º 8 22%
13º to 15º 5 14%
Total 36 100%
Table 4.6c. Aspect Aspect All Burrows Soil Casts Mounds
N 33% 47% 21%
NE 39% 29% 47%
E 8% 18% 0%
NW 17% 0% 32%
W 3% 6% 0%
SE - - -
S - - -
SW - - -
Total 100% 100% 100%
Pocket Gopher and Site Surface Artifacts
The largest artifact found in gopher disturbed sediment measures 48.4 mm,
conforming to the size of objects expected to be transported (Bocek 1986:591). As
shown in Table 4.7, the maximum length of a surface artifact (96.9 mm) is twice as long

81
as the largest artifact recovered from a pocket gopher burrow. The minimum length of a
gopher burrow artifact (4.8 mm) is three-times larger than the smallest surface artifact
(1.4 mm). Despite these apparent differences, analysis showed neither the variance nor
mean length of artifacts in gopher mounds and the site surface differed significantly at the
alpha .05 level (p=0.288).
A difference in artifact length was not evident at site-scale, however localized size
sorting of artifacts may be occurring. The influence of gopher activity on artifact
distribution in a spatially limited area was examined using GIS software ArcGIS 9.1.
The program was used to delineate 2 m, 4 m, 6 m, 8 m, and 10 m ‘buffer’ zones that
extended from the center of each gopher burrow (Figure 4.2).
Table 4.7. Artifact Length: Gopher Burrows, Site Surface, and Buffered Analysis Zones
Location # Artifacts Mean (mm) Maximum (mm) Minimum (mm) Standard Deviation
Gopher 114 14.9 48.8 4.8 8.5
Site 2465 15.6 96.9 2.4 9.63
0 – 2 m 74 17.16 72 6 11.99
2 – 4 m 131 16.41 56 5 8.54
4 – 6 m 225 15.25 47 5 7.49
6 – 8 m 210 16.98 74 5 9.85
8 - 10m 207 15.41 97 6 10.14
0 – 4 m 205 16.68 72 5 9.91
6 - 10 m 435 16.09 74 5 8.74
The physical characteristics of artifacts located within each buffer zone were
compared with artifacts found in burrows to determine if cultural material located closer
to gopher-disturbed areas were being sorted by shape. Artifacts located in preceding
buffer areas were not included in the analysis of subsequent buffer; meaning artifacts
within the two-meter buffer were not included in the analysis of the four-meter buffer
area. To account for potential error introduced by variation in GPS accuracy, two

82
additional buffer-area sizes, 0 m - 4 m (4 m span) and 6 - 10 m (4 m span) were
examined. Results were consistent with 2 meter interval buffer zones.
Figure 4.2. Pocket Gopher Burrows and Localized Analysis Zones

83
Analysis does not reveal striking differences between artifact characteristics based
on distance from pocket gopher burrows. The greatest variation in length occurs between
gopher burrow artifacts and the two-meter buffer zone (Table 4.7). Artifacts in gopher
disturbed sediment have the smallest average length (14.8 mm) of all the buffer zones.
The two-meter buffer zone contains artifacts with the greatest average length (17.16 mm).
There is a difference in the minimum length of artifacts within 10 m of gopher disturbed
sediment and the site assemblage as a whole. No artifacts within 10 m of gopher activity
are less than 5 mm in size; while the minimum length of surface assemblage is 2.4 mm.
T-tests showed no significant difference in the mean length of gopher burrow artifacts
and surface artifacts at all spatial intervals at the alpha 0.05 level. There may be a weak
trend where artifacts in gopher burrows are smaller and have less variation than those
within two meters; however the differences are not statistically significant.
Shape Indices: Pocket Gopher Artifacts and the Surface Assemblage
The mean elongation value for artifacts in gopher burrows is 0.74, indicating a
tendency for equality in length and width. The mean elongation values of site surface
artifacts at all distance intervals were similar to those in gopher burrows (from 0.72 to
0.74). The flatness value for artifacts in pocket gopher sediment and site artifacts at all
distances was also consistent (from 0.25 to 0.28). Neither the variance nor mean
elongation and flatness values were statistically different at the alpha .05 level (Table 4.8
and Appendix B).

84
Table 4.8. Gopher Burrows and Surface Artifacts: t-test of Shape Indices
Elongation Flatness Blockiness Weight
Location Sig. (2-tailed) Sig. (2-tailed) Sig. (2-tailed) Sig. (2-tailed)
Site Surface 0.229 0.632 0.959 .094
0 – 2 m 0.135 0.194 0.222 0.191
2 – 4 m 0.669 0.334 0.227 0.089
4 – 6 m 0.178 0.576 0.576 0.659
6 – 8 m 0.139 0.588 0.920 0.053
8 – 10 m 0.111 0.591 0.791 0.787
0 – 4 m 0.506 0.231 0.283 0.238
6 - 10 m 0.118 0.551 0.904 0.241
The blockiness/sphericity values for gopher burrows, site surface artifacts, and
each buffer zone were all centrally located along the sphericity scale with values at
approximately 0.5. Analysis indicated neither variance nor mean sphericity of gopher
burrow artifacts and site surface artifacts was statistically significant at the alpha 0.05
level (Table 4.8 and Appendix B).Weight values of gopher disturbed artifacts and those
on the site surface at all distance intervals showed little deviation, ranging from 9.7 to
10.5. Neither variance nor mean weight was statistically significant at the alpha 0.05
level (Table 4.8 and Appendix B).
Pocket Gopher and Subsurface Artifacts
The same characteristics used to compare artifacts on the site surface and those in
gopher sediment (length, elongation, flatness, blockiness, and weight) were applied to
artifacts recovered from test excavation units. The larger quantity of lithic debris
recovered from T27-16 and T26-17 provided a more appropriate sample size to use in
level-by-level analysis. The U27 units contained too few specimens per level to provide
a reasonable comparison by depth. Therefore, artifact data from all levels of both U26
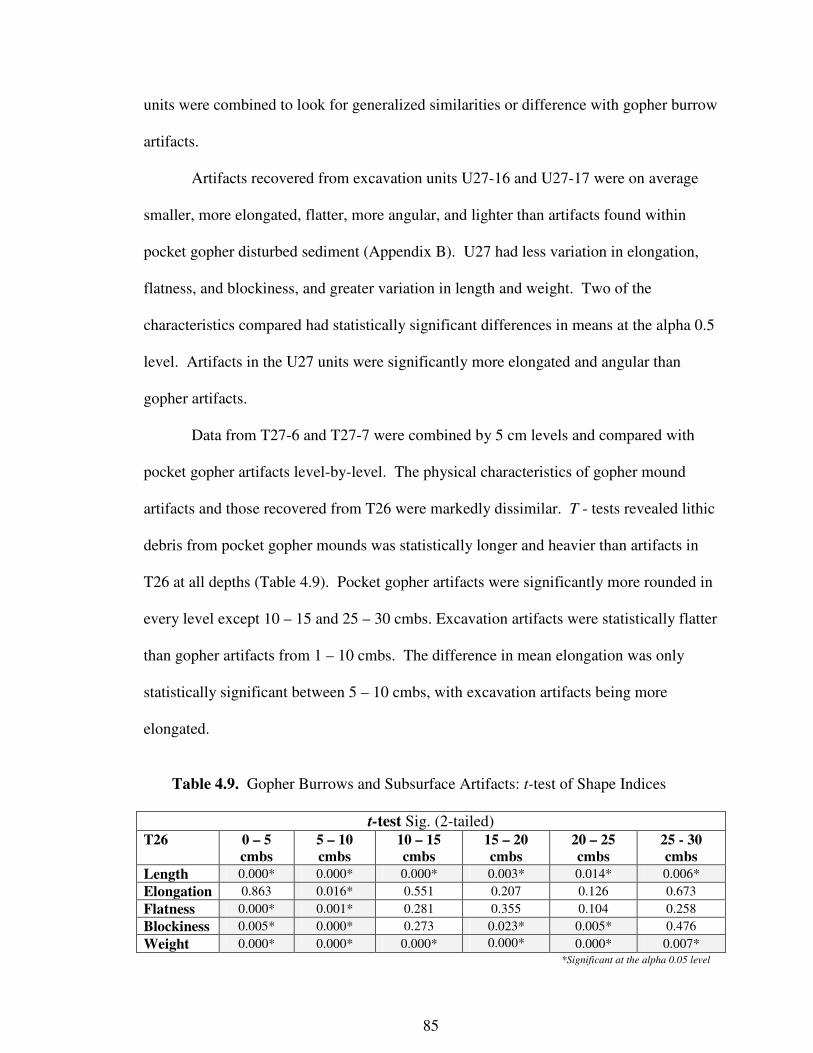
85
units were combined to look for generalized similarities or difference with gopher burrow
artifacts.
Artifacts recovered from excavation units U27-16 and U27-17 were on average
smaller, more elongated, flatter, more angular, and lighter than artifacts found within
pocket gopher disturbed sediment (Appendix B). U27 had less variation in elongation,
flatness, and blockiness, and greater variation in length and weight. Two of the
characteristics compared had statistically significant differences in means at the alpha 0.5
level. Artifacts in the U27 units were significantly more elongated and angular than
gopher artifacts.
Data from T27-6 and T27-7 were combined by 5 cm levels and compared with
pocket gopher artifacts level-by-level. The physical characteristics of gopher mound
artifacts and those recovered from T26 were markedly dissimilar. T - tests revealed lithic
debris from pocket gopher mounds was statistically longer and heavier than artifacts in
T26 at all depths (Table 4.9). Pocket gopher artifacts were significantly more rounded in
every level except 10 – 15 and 25 – 30 cmbs. Excavation artifacts were statistically flatter
than gopher artifacts from 1 – 10 cmbs. The difference in mean elongation was only
statistically significant between 5 – 10 cmbs, with excavation artifacts being more
elongated.
Table 4.9. Gopher Burrows and Subsurface Artifacts: t-test of Shape Indices
t-test Sig. (2-tailed)
T26 0 – 5
cmbs
5 – 10
cmbs
10 – 15
cmbs
15 – 20
cmbs
20 – 25
cmbs
25 - 30
cmbs
Length 0.000* 0.000* 0.000* 0.003* 0.014* 0.006*
Elongation 0.863 0.016* 0.551 0.207 0.126 0.673
Flatness 0.000* 0.001* 0.281 0.355 0.104 0.258
Blockiness 0.005* 0.000* 0.273 0.023* 0.005* 0.476
Weight 0.000* 0.000* 0.000* 0.000* 0.000* 0.007*
*Significant at the alpha 0.05 level

86
Sediment Analysis
As noted previously, if erosion is redistributing material disturbed by pocket
gophers, fresh mound sediment will have different characteristics than winter soil casts
that have been exposed to erosive processes for a longer period of time. It is proposed
that sediment from active mounds will have a greater proportion of fine particulate matter
than winter soil casts or abandoned mounds. Because sediment samples were collected in
mid-summer, it was presumed that soil casts had been exposed between 30 and 60 days,
depending on topographic position and snow depth.
Within the 1-ha study area, particle size analysis was conducted on 25 samples of
mound and soil core sediment. Fourteen of the samples were from burrows located in the
pond catchment area. The result of particle size analysis from all 25 pocket gopher
burrows is discussed below, followed by a separate examination of samples from the
pond catchment area.
Particle Size in Active vs. Inactive Burrows
As shown in Figure 4.3, the average amount of sand and clay is greater in active
burrows. Silt is roughly equivalent regardless of occupation status. Levene’s test for
variance at the alpha 0.05 level indicates no statistical difference in the percent of sand,
silt, and clay. T-tests showed only the proportion of clay in occupied and abandoned
burrows was significantly different at the alpha 0.05 level (p = 0.02). It can be noted that
sand only misses significance at the alpha 0.05 level (p = 0.058) (Table 4.10).
The results of particle size analysis from burrows located in the pond catchment
area were similar to the rest of the study area (Figure 4.3). Sand and silt did not have

87
statistically significant differences in variance or mean. A t-test for clay in active and
inactive burrows was statistically significant (p = 0.03) (Table 4.10).
Table 4.10. T-test of Particle Size:
Active vs. Inactive Pocket Gopher Burrows
1-ha Study Area
Particle Size F Sig. T df Sig. (2-tailed)
Sand 3.379 .079 -1.993 23 .0581
Silt .052 .822 0.8047 23 .4292
Clay 2.62 .117 2.445 23 .0225*
Pond Catchment Area
Sand .919 .357 -1.611 12 .133
Silt .012 .913 .440 12 .668
Clay 1.251 .285 2.458 12 0.03* *Significant at the alpha .05 level
Figure 4.3. Particle Size Distribution:
Active and Inactive Burrows in 1-Ha Sample Area
Inactive
Burrows
Active
Burrows
Inactive
Burrows
Inactive
Burrows
Active
Burrows
Active
Burrows
1-ha SAMPLE AREA
Sand Silt Clay
Active 42% 34% 24%
Not Active 50% 32% 18%
POND AREA
Sand Silt Clay
Active 42% 32% 25%
Not Active 51% 32% 17%

88
There are problems with drawing conclusions on erosion from the particle size
data. A total of 25 pocket gopher burrows had texture analysis completed; only 14
samples were located in the pond catchment area. This represents just under half the
locations of pocket gopher activity documented. When choosing samples for particle size
analysis, effort was made to select a representative type of burrows (mounds, soil casts;
active, inactive), sizes, and locations, but is possible the samples did not accurately
represent gopher activity at the site.
Another potentially significant issue involves the amount of time soil casts and
unoccupied mounds have been abandoned. The actual length of exposure is not known.
Based on the approximated interval between the date of snow melt and the start of field
work, it is estimated that the ground surface had been exposed around 30 days. However
snow cover varies considerably across the landscape, resulting in highly localized
geomorphic regimes. Some areas have likely remained snow-free all winter, exposing
pocket gopher disturbed sediment to the elements year round. In addition to not knowing
how long pocket gopher mounds and soil casts have been exposed, the amount of time
needed to yield measurable differences in sediment characteristics has yet to be
determined. It is possible that more than 30 days is required to significantly erode
sediment. Before the extent of erosion resulting from pocket gopher activity is inferred,
it is recommended year-long monitoring, mapping, and sampling of disturbed sediment is
conducted to truly understand the amount of erosion caused by pocket gophers.

89
Topographic Influences on Erosion
Topographic characteristics influence the intensity and type of erosion that occur.
The steeper the gradient, the lower the energy input needed to initiate particle movement
(Ritter et al. 2002: 80). Sediment in gopher burrows was examined by location to
determine if erosion was independent of landscape position. Burrows located on steeper,
exposed slopes are expected to have a higher proportion of sand than burrows located on
more level, protected slopes (Figure 4.4). In addition to burrow sediment, nine samples
of undisturbed sediment were collected along a toposequence that began at the highest
point on the east ridge and extended to the pond bottom. The samples from the
toposequence were analyzed using the hydrometer method, the same technique used with
pocket gopher sediment.
As expected, the proportion of sand in burrows located along the ridge is greater
than the proportion of sand in burrows located on the gentle southern and western slopes.
Conversely, the percentage of silt and clay in burrows located south and west of the pond
is greater than those on the ridge. There is also a notable difference in sediment volume
by location. The average volume of sediment in burrows located on the steeper eastern
slope is 1.16 liters, while the average for all gopher burrows is 5.8 liters. Burrows
located on the south and west sides of the pond have more sediment per burrow than
those located on the east, illustrating the inverse relationship between slope and sediment
volume. The result of particle size analysis from the toposequence also conforms to
expectations. The portion of sand is highest along the steepest slopes and the easier-to-
erode silt and clay are the greatest in the areas with gentle gradients (Figure 4.5).

90
Figure 4.4. Proportional Volume of Sediment per Gopher Burrow in Pond Catchment:
Size of Circle Indicates the Amount of Sediment in Relation to Other Burrows
The degree of slope and exposure to wind and water are the primary factors
influencing erosion at the site. Gradient on the east side of the pond is more than two-
times that on the southern and western slopes, facilitating the removal of smaller particles
like silt and clay. The higher ridge to the east may also help protect the areas to the south
and west from wind deflation. The variation in sediment volume and particle size in
burrows based on landform position indicates topography plays an important role in
erosion of pocket gopher disturbed sediment.
POND
Catchment
Boundary

91
Figure 4.5. Sediment Samples from Pond Toposequence
Sample Sand Silt Clay Texture
2A 51 36 13 LOAM
2B 59 32 9 SANDY LOAM
2C 39 38 23 LOAM
2D 73 25 2 LOAMY SAND
2E 55 36 9 SANDY LOAM
2F 61 30 9 SANDY LOAM
2G 43 40 17 LOAM
2H 37 36 27 LOAM
2I 27 44 29 CLAY LOAM
DOWN
SLOPE
POND

92
D90 Erosion Model Results
The D90 erosion model predicted that sediment eroding from the pocket gopher
mounds and soil casts documented at the site would in fact reach the sag pond (Figure
4.6). Sediment accumulation was predicted to occur in U27-17 where three radiocarbon
dated charcoal samples were collected. Table 4.11 shows the depth at which each sample
was collected, the time range provided by radiocarbon dates, and the predicted amount of
sediment accumulation associated with each date. The model over estimated the amount
of sediment accumulation for sample U27-17-6, under estimated sample U27-27-11, and
was relatively close to the real accumulation for sample U27-17-10.
Table 4.11. Radiocarbon Samples: Predicted and Actual Accumulation
D90 Model D90 Model Sample
#
Actual
Depth
Radiocarbon
Cal BP (max) Predicted Difference
Radiocarbon
Cal BP (min) Predicted Difference
U27-
17-6
44
cmbs
2720 102 cmbs + 58 cm 2350 104 cmbs + 60 cm
U27-
17-10
62
cmbs
2760 60 cmbs - 2 cm 2760 56 cmbs - 6 cm
U27-
17-11
106
cmbs
3850 79 cmbs - 27 cm 3640 74 cmbs - 32 cm
There are many factors that could influence why the model did not predict the
amount of sediment accumulation actually found in the pond. One significant problem
with the model is based on the data used in analysis. The high resolution elevation
information collected in the field had to be merged with a smaller scale USGS DEM
(1:24,000). As mentioned previously, a difference in the vertical datums used by the two
maps was uncovered by comparing the difference in elevation between overlying grid
cells.

93
Figure 4.6. Path of Erosion Predicted by D90 Erosion Model
$$
$
$
$
$$
$
$
$
$
$$
$
$
$
$
$
$
$
$
$
$$
$$$
$$$$$$$$
$$$
$
$
$
$
$
$
$$
$
$$
$
$
0 6 123Meters ¯
Legend
$ Gopher Burrows
Contour Interval 0.25 m
U27
T26
Path of
Eroded
Sediment

94
The average difference between elevations in corresponding cells was calculated and the
data adjusted. Small variation in elevation between adjacent grid cells will impact the
results of the model as the algorithm terminates if a neighboring cell with a lower
elevation is not encountered. This may cause predicted sediment movement to cease
prematurely. The inconsistency in the amount of accumulation predicted per cell is
shown in Figure 4.7. These differences seem small, however extrapolated out over
thousands of years, as was done for this analysis, the discrepancies become very
significant.
Figure 4.7. Predicted Sediment Accumulation at Sample Locations in U27-17
Another potential data-related issue involves the determining the depth from
which radiocarbon samples U27-17-10 and U27-17-11 were collected. Sample U27-17-
10 was obtained from screened sediment and U27-17-11 was collected from an auger
0.103
liters
0.223
liters
Sample: U27-17-6
(2720 to 2350 Cal BP)
0.223 liters/year
Sample: U27-17-10
(2920 to 2760 Cal BP)
and
Sample: U27-17-10
(2920 to 2760 Cal BP)
0.103 liters/year
1 meter (test unit U27)
1.33 liters .099 liters
.083 liters

95
probe that was placed in the center of the unit. For U27-17-10, the elevation of the
ground surface prior to excavation and the ending elevation of the level from which it
was collected (Level 12, 62 cmbs) were used to determine the amount of accumulation.
Levels were excavated in 5-cm intervals and it is unknown where within those 5-cm the
charcoal originated. U27-17-11, the sample obtained from the auger probe, has a slightly
higher margin of error and could actually be 10 cm shallower what is used in the
calculations. Sample U27-17-6 was collected in situ and there should be no significant
issues with real verses estimated depth. Unfortunately, the model was least accurate for
the in-situ sample.
The model is considering only one method of sedimentation; that which results
from pocket gopher activity. There are likely many sources contributing and removing
particulate pattern from the pond catchment. If the model had consistently predicted too
low accumulation, it would not have been as problematic since gopher sediment should
only account for a portion of the deposition. The over-sedimentation predicted for
sample U27-17-6 can not be as easily accounted for.
The model assumes steady state conditions; that the gopher population recorded
in 2006 represents gopher activity in perpetuity. The model does not account for
fluctuation in the density of pocket gopher occupation, climate, shifts biotic comminutes,
or terrain changes, all of which influence the intensity of erosion.
Summary
This chapter compared artifacts recovered from test excavation units, the site
surface, and gopher disturbed sediment. Site formation processes were examined using

96
the soil profiles of test excavation units, spatial analysis of burrow placement and their
associated sediment characteristics, and a GIS-based erosion model. The following
chapter analyzes the results, provides suggestions for additional work at 48PA2874, and
discusses the broader application of pocket gopher research.

97
CHAPTER 5
IDENTIFYING PATTERNS:
POCKET GOPHERS, ARTIFACT DISTRIBUTION, AND EROSION
This research couples biophysical processes with archeological data to explore the
influence of pocket gopher activity on site formation. Pocket gopher behavior in high
elevation environments and geospatial analysis of burrow location were used to identify
topographic controls on burrow placement. If gophers tend to occupy certain terrain,
then cultural material located in these areas are more likely to be affected by gopher
activity. To explore the influence of pocket gophers on artifact distribution the physical
characteristics of chipped stone recovered from gopher-churned sediment, the
undisturbed site surface, and subsurface artifacts were compared. Erosion from gopher
mounds and soil casts was evaluated by comparing sediment characteristics in active and
abandoned burrows and with a GIS-based erosion model.
Pocket Gopher Transportation of Surface Artifacts
The size and shape of chipped stone within gopher mounds and soil casts were
indistinguishable from those located on the undisturbed site surface. Pocket gopher
activity does not appear to be sorting surface artifacts by length, elongation, flatness,
blockiness/angularity, or weight. However, a difference in artifact density was identified.

98
The average artifact density in gopher mounds and soil casts, obtained by dividing the
number of artifacts within gopher sediment by the areal extent of disturbance (114
artifacts/28.8 m²), is 4 artifacts/m². In contrast, average density of the site surface
assemblage is less than 0.1/ m² (2,470 artifacts/28,000 m²). This ratio may be misleading
as the site is comprised of multiple artifact concentrations spread over a large area. It is
more appropriate to compare the density of chipped stone in artifact concentrations with
those in gopher burrows. The average density in Concentration 2, the concentration
where pocket gopher activity was documented, is approximately 1/m² (769 artifacts/800
m²). Although this is greater than the overall site assemblage, it is still notably lower
than artifact density in gopher sediment. The localized impact of gopher activity was
evaluated by examining density in 2, 4, 6, 8, and 10 m zones extending out from the
gopher burrows. The raw artifact count increases from the 2 to 6 m analysis areas (Table
5.1). However, when surface area is taken into consideration, the inverse is true.
Average artifact density decreases steadily from the 2 m zone outward.
Table 5.1. Average Artifact Density: Gopher Burrows and Site Surface
Location # Artifacts Area (m²) Artifacts/m²
Gopher 114 28.2 m² 4
0 – 2 m 74 166 m² 0.45
2 – 4 m 131 499 m² 0.26
4 – 6 m 225 832 m² 0.27
6 – 8 m 210 1,165 m² 0.19
8 - 10m 207 1,522 m² 0.14
Site 2470 28,000 m² 0.09
Although no spatial patterning by size or shape was observed on the surface of the
site, the effect of pocket gopher activity on artifact density is not entirely clear. The
average artifact density in pocket gopher burrows appears high when compared to

99
undisturbed areas; and a trend where artifact density decreases with increasing distance
from the burrow was identified. As shown in Figure 5.1, pocket gopher activity is patchy
across the landscape and artifacts are irregularly distributed within mounds and soil casts.
Figure 5.1. Pocket Gopher Burrows and Cultural Material:
Size of Black Dot Indicates the Proportion of Total Artifacts Recovered per Burrow
POND
Artifact
Concentration 2

100
Out of 53 mound and soil casts, just over half contained cultural material (n=29, 55%).
Burrow sediment containing artifacts are more frequently located on the gentle slopes
north, south, and west of the pond (Figure 5.1). No artifacts were recovered from
mounds located on the steeper eastern slope.
Gopher disturbed artifacts tended to be located on the periphery of Concentration
2. This presents the following questions: Are gophers transporting surface artifacts
horizontally, independent of shape or size, creating or diluting artifact distribution in
Concentration 2? Does the displacement of surface artifacts facilitate lateral movement
by other geomorphic processes, such as mass wasting, cryoturbation, or alluvial
transportation? Is gopher activity impacting material already present on the site surface
without significantly changing the spatial relationship? Can these interactions be
recognized?
Lateral movement of artifacts has the potential to expand the boundaries of a site
and lower the density of artifacts in one area while increasing density in a new location
(Bocek 1992). As discussed in Chapter 2, Bocek (1992) documented the horizontal
transportation of subsurface material by gophers, finding that artifacts 0.6 to 1.8 cm in
diameter and non-cultural rock 1.8 to 3.5 cm were the most prone to lateral movement.
The size variation in transported cultural and non-cultural material may be due to
differences in density (mass), although this has not been conclusively demonstrated
(Bocek 1986). While subsurface horizontal movement was found, no new cultural
material was brought to the site surface during the seven-year study (Bocek 1992:267). It
seems reasonable to assume that if pocket gophers are transporting artifacts horizontally
beneath the ground, then continued activity would eventually eject the relocated

101
subsurface cultural material onto the surface. The length of time needed for this process
to become evident is not known.
Recognizing this process in the archaeological record is difficult. It is possible
artifacts transported laterally underground before being relocated to the site surface
would contain a higher frequency of artifacts 0.6 to 1.8 cm and natural rock 1.8 to 3.5 cm
in length. Little variation in the length of chipped stone in gopher sediment was
observed; 73% were located in the size range Bocek (1992) associated with subsurface
lateral transport. In addition, the average length of surface artifacts at 48PA2874 was not
statistically different than those in gopher sediment. Of the non-modified stone, only
14% were within the size range found at Jasper Ridge (Bocek 1992). The reason for this
discrepancy is unknown; it may be a result of environmental differences.
To understand pocket gopher impacts to surface archaeological material at
48PA2874 it is recommended gopher occupation be documented across the entire site,
with particular emphasis on gopher activity near the four other artifact concentrations. If
a concentration with no evidence of gopher activity is found, then comparing the
distribution of artifacts in the undisturbed concentration with those in Concentration 2
could provide information on formation processes. If gophers are expanding
Concentration 2, then there may be observable differences in the density or the size and
shape of chipped stone located on the periphery of the two concentrations. If gopher
activity is causing, or contributing to the concentration of artifacts, there may be a similar
discrepancy within the interior of the concentrations.
At this time, the distribution of surface artifacts at 48PA2874 is interpreted as
resulting from human use rather than gopher activity. This is supported by clusters of

102
heat-impacted artifacts within the larger concentrations. Although no fire-crack rock was
found, clusters of heat-impacted chipped stone can indicate the presence of an intact
hearth feature. Intact features suggest gophers have not been transporting surface
artifacts. However, further analysis is needed to avoid inferring human behavior from an
artifact distribution resulting from bioturbation.
Pocket Gopher Impacts on Subsurface Cultural Material
Surface and subsurface artifacts have statistically significant differences in at least
one physical characteristic in every level of all four test units. Is disturbance by gophers
causing the marked distinction seen in the size and shape of surface and subsurface
chipped stone? To address this question, the vertical distribution of buried archaeological
material at 48PA2874 was compared with three artifact distribution patterns attributed to
gopher activity by Bocek (1986), Erlandson (1984), and Johnson (1989).
Before data from 48PA2874 can be compared to the results of other studies, the
landscape characteristics of the current project area should be considered. The extent of
pocket gopher activity will be influenced by soil depth, moisture, hardness, and rockiness
(Beck 1965:4). The composition of vegetation communities and density is also a factor
in gopher occupation (Romañach et al. 2005). Forbs and grasses, pocket gopher’s
primary food source in montane ecotones, are more abundant in the pond area due to the
accumulation of water from snowmelt and protection from the drying winds. Test units
were placed on a north-northeast facing slope; the aspect pocket gopher burrows were
most commonly found. The test units were also within the most common elevation range
(3097 m and 3099 m). Slope was not shown to be a factor in burrow placement; however

103
the units were located between a gradient of 1º to 4º. The habitat suitability of test
excavation areas had both positive and negative qualities. Based on environmental
conditions, occupation of this area can not be ruled out.
Bocek (1986), Erlandson (1984), and Johnson (1989) all conducted research in
California in areas with dense grasses, deep deposits, and notable soil development.
Pocket gopher activity in these three studies areas can be expected to occur at a greater
depth than at 48PA2874. At the current research site, deposits are more shallow and
have undergone little pedogenesis. Like most high elevation environments, the amount
of deposition across the site is highly localized.
Test excavation in the U27 units show sediment accumulation in the pond is much
greater than the deposits upslope (T26). Pond sediment has a greater water content, more
organic material, fewer gravels, and is less compacted than slope material. While
unconsolidated material is favorable for pocket gophers, the seasonal influx of water
from snowmelt makes continuous pocket gopher occupation in the pond area unlikely
(Ingles 1948, 1952). However, if occurring, it would be expected that evidence of gopher
activity could be as deep as 50 cmbs in the U27 units.
Pocket gopher activity upslope of the pond is expected to be much shallower than
activity in the pond. Compared to deposition in the pond, the slope has relatively thin
deposits. The upper strata overlays a more compacted mass of large clasts and gravels
within a silt and clay rich matrix. This cobble layer, deposited by a slump-earthflow
event, is not material conducive to burrowing (Johnson 1989). Clasts are dense and
measure up to 25 cm in length. As discussed previously, pocket gophers typically avoid
material larger than 5 cm (Bocek 1986). The density of large rocks, the compactness of

104
the deposit, and the presumed depth of the slump-earthflow material would make
burrowing around or under the layer impossible. Therefore, gopher activity on the slope
above the pond is not expected to occur beneath the upper horizon of sediment, between
15 cmbs at the shallowest point in the T26 units and at least 30 cmbs where the landslide
deposit was not reached during excavation. Compared to other species of pocket
gophers, Thomomys has been shown to inhabit comparatively thin, rocky soils (Beck
1965:5); therefore, it is not unreasonable to suspect gophers would burrow in the
shallower sediment along the slope. Activity is more likely to occur where the deposits
overlaying the slump-earthflow material is thickest. This would be in unit T26-6, located
downslope of T26-7, where there is greater sediment accumulation.
Evidence of Pocket Gopher Occupation in the Test Units
Evidence of pocket gopher occupation on the ground surface near the test
excavation units was minimal. One mound was documented three meters southeast of the
T26 units. No gopher mounds or soil casts were adjacent to U27, however there was a
surface opening with little associated loose sediment in U27-17. Subsurface indications
of past gopher activity can be recognized by the presence of krotivina, changes in
sediment color and texture that result from the infilling of tunnels (Erlandson 1984), or
from the accumulation of fecal pellets or organic material at the depth of dens and food
caches (Ingles 1949, 1952). No subsurface evidence of gopher activity was noted during
test excavation in any unit. Below the layer of sod in U27 no indications of gopher
activity were reported.

105
48PA2874 and Previous Archaeological Research on Pocket Gophers
As discussed in Chapter 2, Bocek (1986) and Johnson (1989) found pocket
gopher activity resulted in the stratification of artifacts and non-cultural material by size.
Bocek’s initial excavation at Jasper Ridge, found that lithic debris between 0.6 and 2.5
cm in size were disproportionally present in the upper 30 cmbs (Bocek 1992:262).
Artifact frequency had a distinct trend with the largest number of artifacts in the first 10
cmbs and decreasing steadily thereafter (Figure 5.2). Artifacts larger than 5 cm were
concentrated around 50 cmbs, the typical extent of gopher activity at Jasper Ridge, below
which very few artifacts were encountered (Bocek: 1986:595,596). Johnson (1989:370)
refers to the layer of randomly oriented clasts accumulating below pocket gopher tunnels
and burrows as ‘stone zones’.
While Johnson (1989) and Bocek (1986) both encountered an increase in the size
of artifacts at the maximum depth of gopher activity, there was a difference in the overall
distribution of archaeological material. Johnson (1989) found smaller artifacts were
evenly dispersed throughout a thick homogenized biomantle lying above the stone zone
(Figure 5.2). In addition, the material comprising stone zones measured a minimum of 6
to 7 cm, slightly larger than that discovered by Bocek (1986).
Erlandson (1984) discovered a very different pattern in artifact distribution with
pocket gopher disturbance. He speculated that the infilling of collapsed tunnels and
burrows were creating a weakly bimodal pattern in artifact frequency by depth (Figure
5.2). Bocek (1986) analyzed Erlandson’s data and found that the largest artifacts were
located from 0 – 20 cmbs and that the difference between artifact size in the upper and

106
lower strata (0 – 40 and 40 – 70 cmbs) was not statistically significant at the alpha 0.05
level (Bocek 1986:600).
Figure 5.2. Three Different Patterns of Subsurface Artifact Distribution Attributed to
Gopher Activity
Depth
Artifact Frequency
Depth
Artifact Frequency
Depth
Artifact Frequency
None of the four test units excavated at 48PA2874 reached sterile horizons due to
time limitations. The following discussion is based on an incomplete record of the extent
of buried cultural material. Artifact frequency by depth in T26-7 was unimodal, not
consistent with any of the previously identified patterns (Figure 5.2, 5.3a). As shown in
Figure 5.3a and 5.3b, units T26-6, U27-16, and U27-17 appear to have a bimodal
distribution of artifacts. However the second ‘peak’ in U27-16 consists of only one
additional artifact. Artifact frequency is more strongly bimodal in U27-17, but like U27-
16 the increase in artifacts is small (n=4). Within the 60 cm of sediment excavated in the
1 by 1 m unit, only 44 artifacts were recovered. It is possible the low number of total
artifacts recovered from U27-17 makes this seemly minor increase more significant.
While the high moisture content of pond sediment does not favor pocket gopher
Bimodal
Distribution Erlandson (1984)
Decreasing
Distribution Bocek (1992)
Uniform
Distribution
Johnson (1989)

107
occupation (Ingles 1948), U27-17 was the only unit to have surface evidence of pocket
gopher activity.
Figure 5.3. T26 and U27: Artifact Frequency by Depth
a. Units T26-6 and T26-7; b. Units U27-16 and U27-17
7
70
61
30
16
23
0
22
15
67
19
18
8
33
0 5 10 15 20 25 30 35 40 45 50 55 60 65 70 75
Surface
0-5
5-10
10 -15
15-20
20-25
25-30
cmbs
Artifact Count
T26-6
T26-7
3
0
0
1
0
11
1
4
0
3
0
4
5
7
3
1
1
3
4
8
4
0 1 2 3 4 5 6 7 8 9 10 11 12
Surface
0-5
5-10
10-15
15-20
20-25
25-30
30-35
35-40
40-45
45-50
50-55
55-60
cmbs
Artifact Count
U27-16
U27-17
a.
b.

108
The second peak in T26-6 (n=6) occurred in the final level excavated, therefore it
is not known if frequency would continue to increase, decrease, or remain steady. The
distribution pattern is also unknown in U27-16 and U27-17; however both units were
excavated one level below the second peak in frequency, which better supports the
potential for a bimodal distribution of cultural material.
The vertical distribution of artifacts in T26-6, U27-16, and U27-17 follow more
closely with the distribution pattern identified by Erlandson (1984) than either Bocek
(1992) or Johnson (1989). However the relationship is not strong. Artifacts in T26-7
were not consistent with any previously identified distribution patterns. In the units with
a bimodal trend the depth of the second peak in artifact frequency does correspond to the
maximum depth of pocket gopher activity expected in each unit. It is difficult to identify
patterns in distribution when the extent of subsurface cultural deposits is undetermined.
Before any conclusions can be drawn, units need to be further excavated to determine if
additional cultural material is present.
Artifact Size in Gopher Burrows and Test Excavation Units
The size of artifacts in T26 increases near the depth of maximum gopher activity
(25 cmbs in the T26 units). Statistical analysis indicates the mean length of artifacts
recovered from 0 – 10 cmbs is significantly smaller than those from 15 – 25 cmbs at the
alpha 0.05 level (Appendix B). However, the average length of material found from 15 –
25 cmbs (11 mm), is within the size range transported by pocket gophers (Bocek 1986).
A clear relationship between artifact length and depth in the T26 units can not be
attributed gopher activity.

109
If pocket gopher activity was dispersing material of a particular size-grade
throughout the upper layer of the soil profile, as found by Johnson (1989), it can be
assumed that the same size material would be found on the ground surface. However,
this is not the case. Artifacts located on the surface of T26 are significantly larger than
subsurface material at all depths. The mean length of artifacts from 0 – 5 cmbs and 5 - 10
cmbs (the burrowing zone) is uniform, supporting Johnson’s (1989) findings, assuming
the burrowing zone at T26 is between 0 – 10 cmbs as expected.
A connection between artifact size and depth was not identified in the U27 units.
Neither size stratification nor frequency distributions found by Bocek (1986) or Johnson
(1989) were strongly represented in the T26 units. There is a general trend with smaller
artifacts located 0 – 10 cmbs and larger material at the maximum depth of burrowing (25
cmbs). However, as stated above, the larger material is within the size that gophers are
capable of transporting.
The shape indices elongation, flatness, blockiness/roundness, and weight were
also evaluated for patterns in vertical distribution. If pocket gopher activity is causing the
stratification of artifacts based on physical characteristics, artifacts within the zone of
burrowing (from 0 - 10 cmbs in T26) are expected to have uniform properties, shifting at
the maximum depth of burrowing. T-tests comparing artifacts recovered from 0 – 5 cmbs
with those from 5 – 10 cmbs indicate there is no statistical difference in the any of the
attributes examined, conforming to Johnson’s (1989) findings.
With the exception of elongation, the mean values of artifact characteristics
plotted by depth generally display a wave-like distribution (Figure 5.4). Surface artifacts
are notability different than those from 0 – 5 cmbs. Surface cultural material is longer,

110
less flat, more rounded, and heavier. From 0 – 20 cmbs length gently increases and
artifacts become less flat. Length decreases from 25 – 30 cmbs and artifacts become
more flat from 20 – 25 cmbs, then less flat 25 – 30 cmbs. Artifacts become more angular
0 – 10 cmbs, more rounded 10 -15 cmbs, more angular 15 – 25 cmbs, and more round at
25 cmbs. Weight increases from 0 – 10 cmbs and then remains steady. There does not
appear to be a pattern in the elongation values by depth. Not all of the characteristics
between levels are statistically significant at the alpha 0.05 level (Figure 5.4). Detailed
results of statistical analysis comparing each level are located in Appendix B.
Pocket Gophers and Erosion at 48PA2874
One goal of this analysis was to examine the extent of erosion occurring from
pocket gopher disturbed sediment. Particle size analysis indicates the proportion of clay
in inactive and active burrows is statistically different. This supports the proposal
inactive burrows, assumed to have been exposed on the ground surface longer than active
burrows, have a lower proportion of small, easily eroded particles. There were not
statistically significant differences at the alpha 0.05 level in silt or sand in active and
inactive burrows. It should be noted that sand misses the zone of significance by only
0.008 (p = 0.058).

111
Figure 5.4. Mean Values of Artifact Characteristics by Depth
Mean Length
0
2
4
6
8
10
12
14
16
18
Surfa
ce 0-5
5-1
0
10-
15
15-2
0
20-2
5
25-3
0
Mean Elongation
0.66
0.67
0.68
0.69
0.7
0.71
0.72
0.73
0.74
0.75
Surfa
ce 0-5
5-1
0
10-
15
15-2
0
20-2
5
25-3
0
Mean Flatness
0
0.05
0.1
0.15
0.2
0.25
0.3
Surfa
ce 0-5
5-1
0
10-
15
15-2
0
20-2
5
25-3
0
Mean Blockiness
0
0.005
0.01
0.015
0.02
0.025
0.03
0.035
0.04
0.045
Surfa
ce 0-5
5-1
0
10-
15
15-2
0
20-2
5
25-3
0
Mean Weight
0
1
2
3
4
5
6
7
8
9
10
Surfa
ce 0-5
5-1
0
10-
15
15-2
0
20-2
5
25-3
0
* *
* *
*
Average value of artifact
characteristics by depth in unit
T26.
Asterisks between depths (cmbs)
indicate statistical significance
between the two levels at the
(alpha 0.05 level).
*

112
The topographic location of burrows appears to influence the percent of sand, silt,
and clay in gopher-disturbed sediment. There is a higher percent of sand in burrows on
hill tops and on the steeper slopes than in lower gradient areas. Mounds and soil casts
located on higher elevation, exposed portions of the landform are susceptible to deflation
by wind and steep slopes facilitate mass wasting.
If gopher disturbed sediment is being transported, where is it being deposited?
The D90 erosion model sought to address this question by predicting the path and amount
of sediment eroding from the pocket gopher mounds. While the model did indicate
sediment would be deposited in the pond catchment, the predicted accumulation only
corresponded with one of the three radiocarbon dated samples collected from known
depths during test excavation. As discussed in Chapter 4, there are potential problems
with the elevation data and with the fundamental assumptions underlying the model. The
accretion and removal of sediment is part of a dynamic system with positive and negative
feedbacks that operate continuously on multiple scales. Models attempt to whittle down
these complex interactions to manageable components. As a result, they are not
representative of the real world. The D90 model focused on the transportation of
sediment by overland flow, not considering other methods, such as wind, freeze-thaw,
soil creep or other types of mass movements, and infiltration. Bioturbation interacts with
each of the drivers of sediment transportation; meaning, even if overland flow dominated
erosion, this process can facilitate aeolian processes, cryoturbation, gravitational
movement, and infiltration. Micro-environmental features, such as rocks downslope of
sediment movement, small topographic differences, and variation in vegetation coverage
were not included in the model. One of the most significant problems is that gopher

113
occupation, climate, and terrain features in the model remain steady throughout time, an
obviously false assumption.
Future Research Directions
This research aimed to address four questions: 1) Is pocket gopher activity
affecting the horizontal or vertical distribution of cultural material in an observable and
predictable manner? 2) Do pocket gophers inhabit particular topographic features,
allowing archaeologists to anticipate areas with a high probability of disturbance? 3)
How does disturbed sediment affect geomorphic processes, specifically erosion at the
site? 4) Does a GIS based model predicting erosion from pocket gopher mounds and soil
casts indicate sediment will be deposited in the sag pond? If so, does the amount of
sediment accumulation in the sag pond correspond to accumulation calculated from
radiocarbon dated samples? The following section will describe additional site-specific
research that could be done to further address these research questions.
Understanding Pocket Gophers and Artifact Transportation
Pocket gopher impacts on the distribution of surface and subsurface
archaeological material at 48PA2874 could be better understood with further
documentation of pocket gopher activity. Analyses indicate potential trends in
distribution. These patterns need to be further examined prior to concluding that gopher
activity is, or is not, transporting cultural material. It is recommended the following
research on surface material be conducted at the site:

114
Site-Specific Research: Surface Documentation
1. Record mound and soil cast attributes and map gopher activity across the entire
site to further evaluate the influence of gopher disturbance on artifact density and
sorting of artifacts by physical characteristics.
2. Map the shape of areal disturbance of mound sediment and the orientation of soil
casts. With these data, disturbed areas can be looked at in relation to topographic
features, in particular slope.
3. Create a high resolution topographic map for the entire site surface using a
systemic mapping method and run the D90 erosion model with the new data.
4. Document vegetation type and changes in composition or density across the site
during Spring, the height of gopher activity. This can be linked with burrow
location to identify preferences in pocket gopher habitat based on vegetation
communities.
5. Visit the site at regular intervals over multiple seasons and collect the following
information:
a. Map the areal extent and depth of snow cover during each site visit.
b. Document and map evidence of gopher activity as it becomes exposed by
snowmelt and as new mounds form. This will determine how long gopher
disturbed areas have been exposed to erosion and if there are seasonal
changes in the location of gopher occupation.
c. Collect mound and soil cast sediment samples throughout the season to
identify changes in particle size.

115
d. Place sediment collection troughs downslope of gopher mounds/soil casts
at multiple distance intervals to examine transportation of sediment over
the ground surface (similar to the study conducted by Sherrod and Seasted
2001 discussed in Chapter 2).
Site Specific Research: Subsurface documentation
Subsurface archaeological material did not have a strong correlation to the
vertical distribution found by other researchers (Bocek 1986; Erlandson 1984; Johnson
1989). However, the limited amount of test excavation conducted could not provide a
complete picture of the vertical distribution of cultural material. It is recommended the
following research on subsurface material be conducted at the site:
1. Excavate the backfilled sediment in U26-16, 17 and T26-6,7 to search for
evidence of new gopher activity and newly introduced chipped stoned (similar to
Bocek’s 1992 research at Jasper Ridge).
2. Continue test excavation of the units to determine the extent of subsurface cultural
material and the depth of slump-earthflow deposits.
3. Excavate beneath gopher mounds and soil casts to examine artifact distribution in
areas with known gopher disturbance.
4. Excavate areas exhibiting no evidence of gopher activity on multiple landform
features.
5. Collect additional samples for radiocarbon dating and evaluate the estimated
sediment accumulation with the deposition predicted by the D90 erosion model.

116
Like most research, this project raises more questions then it answers.
Documentation of gopher activity across the entire site will help evaluate the relationship
between disturbance areas and chipped stone. Knowing the location of pocket gopher
burrows across a wider geographic area would help identify environmental factors
influencing burrow placement. A high resolution topographic map and the locations of
gopher activity across the site would allow for additional testing of the erosion model.
Subsurface testing should be expanded at the site. Test units were focused on the
pond catchment area, only one of many topographic features at the site. To understand
the relationship between the vertical distribution of artifacts and gopher activity across
the landform test units should be placed in other areas of the site. Test excavation in
locations with known gopher activity may help identify the influence of gopher activity
on the vertical distribution of artifacts.
While the impact of pocket gopher activity on the lateral and vertical movement
of artifacts at 48PA2874 could not be determined information was gained from the study.
Primarily, this project has provided a general background that may spur additional
research. With further study the effect of pocket gopher activity on artifact distribution in
high elevation environments can be better understood.
Pocket Gophers, Geomorphology, and Archaeology: A Regional Perspective
The interaction of pocket gophers, geomorphic processes, and cultural material
can not be understood through the study of a single site. There is a lack of published
archaeological research on pocket gopher impacts to artifacts. At present, three pocket

117
gopher-specific studies dominate the archaeological literature, Bocek (1986, 1992),
Erlandson (1984), and Johnson (1989). These three studies were conducted in the coastal
foothills of south-central California, a vastly different environment than the high
elevation, alpine grassland of this study. Although research at 48PA2874 is just
beginning, initial results show little similarities with the studies from California. Can
these differences be attributed to environmental factors, such as soil characteristics,
climate, or topography? Are the anatomical and behavioral patterns of the two pocket
gopher species, Thomomys bottae (California) and Thomomys talpoides (current project)
causing different affects on archaeological material? If so, then identifying pocket
gopher disturbance or modeling the impact of gopher activities could vary considerably
between environments.
To further investigate this phenomenon, it is proposed that pocket gopher activity
in archaeological sites be recorded in multiple settings, beginning with the variety of
ecotones located in the GRSLE project area. Using the research methods suggested for
further work at 48PA2874, sites containing pocket gopher activity should be documented
in the low-elevation Greybull River basin, the mid-elevation forested areas, the subalpine
– alpine transition zone, and the alpine mountain tops. Importantly, the lack of pocket
gopher activity at sites should be noted as well.
Pocket gopher activity has the potential to impact not only individual sites, but
also the regional history of an area. If pocket gophers in mountain settings occupy a
particular habitat and their behavior alters the distribution of cultural material enough to
change the interpretation of a site, then the understanding of sites within those
environmental zones may be skewed. Since individual sites are the foundation of a

118
regional understanding of prehistoric land use, it is crucial to determine the processes that
may obscure or alter the interpretation of even a single, seemingly inconsequential site.
Pocket gopher documentation in a variety of settings would help form a better
understanding of impacts to artifacts in differing environmental conditions. Eventually,
information from the GRSLE project area could be expanded over a broader geographic
coverage, examining not only the influence of environmental conditions but different
pocket gopher species as well.
Pocket Gophers as Ecosystem Indicators
Pocket gopher occupation is important not only to the interpretation of
archaeological sites but it can be used as a proxy for past environmental conditions. Had
the erosion model accurately predicted the amount of accumulation occurring at
48PA2874, the information could have been used to examine long-term environmental
change (Hall and Lamont 2003:220). Sediments are transported and deposited in
particular environments and climatic conditions, and therefore, can yield valuable paleo-
environmental information (Hassan 1978; Millar 2006). As pocket gophers can occupy a
specific area for significant periods of time, they have the potential to provide
archaeologists with a long record of environmental data. Deposits at Lamar Cave, a
paleontological site in Yellowstone National Park contain a continuous record of
Thomomys talpoides occupation spanning over 3,200 years. The study showed the
density of pocket gopher population changed with fluctuations in climate, increasing
during mesic periods and decreasing during xeric conditions (Hadly 1997). A similar

119
trend may be seen in sedimentation rates or in the intensity of gopher occupation at an
archaeological site.
Pocket Gophers and Site Management
How can pocket gopher studies be applied in a practical manner to archaeological
site management and evaluation? The presence of artifacts in the mounds of
subterranean animals has long been used by archaeologists to identify the presence of
buried cultural deposits without further damaging a site with test excavation. While this
is generally a legitimate practice, there is the potential that buried cultural deposits are
created by the relocation of surface artifacts into gopher burrows. Therefore a
radiocarbon date associated with a particular stratum may not be contemporaneous with
the associated artifacts. If the affect of pocket gopher activity results in a predictable,
observable distribution of artifacts, then this information could be used to identify sites
impacted by subsurface faunalturbation and avoid misinterpreting site function.
Summary
The material record of past human activity is an interactive composite of cultural,
biological, and physical processes. This project integrated biophysical research and
archaeological data to examine site formation at 48PA2874. The study represents a
preliminary step toward developing a better understanding of pocket gophers effects on
sediment and cultural material in montane environments. Pocket gopher activity is
important not only to the interpretation of individual sites, but can contribute to the
regional archaeological record and a better understanding of human use of alpine

120
environments. However, before behavioral inferences can be drawn from any
archaeological site, post depositional changes to cultural material must be considered.
Further research will help researchers judge the intensity of impacts to artifacts and begin
to predict areas likely to be disturbed by subsurface faunalturbation. While pocket
gophers may change the distribution of archaeological material, they should not be
viewed as a destructive agent but rather as another factor in the taphonomic history of a
site and the source of additional data. Clearly, the relationship of pocket gophers,
geomorphic processes, and cultural material in alpine environments is complex.
However, these interactions are fundamental to recognizing the full research potential of
an archaeological site and developing a comprehensive, unbiased understanding of
regional prehistory.

121
REFERENCES CITED
Balek, C. L.
2002 Buried artifacts in stable upland sites and the role of bioturbation: A
review. Geoarchaeology-an International Journal 17(1):41-51.
Beck, Reldon F.
1965 Pocket gopher habitat relations in mountain rangelands in Colorado.
M.S., Department of Range Management, Colorado State University, Fort
Collins.
Benedict, James B.
1970 Downslope Soil Movement in a Colorado Alpine Region: Rates,
Processes, and Climatic Significance. Arctic and Alpine Research 2(3):165-226.
1976 Frost Creep and Gelifluction Features - Review. Quaternary Research
6(1):55-76.
2009 A Review of Lichenometric Dating and Its Applications to Archaeology.
American Antiquity 74(1):143-172.
Bertran, P., and J. P. Texier
1999 Facies and microfacies of slope deposits. Catena 35(2-4):99-121.
Bocek, B.
1986 Rodent Ecology and Burrowing Behavior - Predicted Effects on
Archaeological Site Formation. American Antiquity 51(3):589-603.
1992 The Jasper Ridge Reexcavation Experiment - Rates of Artifact Mixing by
Rodents. American Antiquity 57(2):261-269.
Bohn, Allison
2007 Scattered Glass: Obsidian Artifact Provenance Patterns in Northwestern
Wyoming, Department of Anthropology, Colorado State University.
Bryan, R. B.
2000 Soil erodibility and processes of water erosion on hillslope.
Geomorphology 32(3-4):385-415.
Burnett, Paul
2005 Surface Lithic Scatters in the Central Absarokas of Wyoming, Department
of Anthropology, Colorado State University.

122
Caine, Nel
1995 Snowpack Influence on Geomorphic Processes in Green Lakes Valley,
Colorado Front Range. The Geographical Journal 161(1):55-68.
de Scally, F. A., and I. F. Owens
2005 Depositional processes and particle characteristics on fans in the Southern
Alps, New Zealand. Geomorphology 69(1-4):46-56.
Dean, Denis
2006 D90 Erosion Model. Fort Collins, Colorado.
Ellison, L.
1946 The Pocket Gopher in Relation to Soil Erosion on Mountain Range.
Ecology 27(2):101-114.
Erlandson, Jon
1984 A Case Study in Faunalturbation: Delineating the Effects of the Burrowing
Pocket Gopher on the Distribution of Archaeological Materials. American
Antiquity 49(4):785-790.
Fowler, K. D., H. J. Greenfield, and L. O. van Schalkwyk
2004 The effects of burrowing activity on archaeological sites: Ndondondwane,
South Africa. Geoarchaeology-an International Journal 19(5):441-470.
Gabet, E. J.
2000 Gopher bioturbation: Field evidence for non-linear hillslope diffusion.
Earth Surface Processes and Landforms 25(13):1419-1428.
Gabet, E. J., O. J. Reichman, and E. W. Seabloom
2003 The effects of bioturbation on soil processes and sediment transport.
Annual Review of Earth and Planetary Sciences 31:249-273.
Gatto, L. W.
2000 Soil freeze-thaw-induced changes to a simulated rill: potential impacts on
soil erosion. Geomorphology 32(1-2):147-160.
Hadly, E. A.
1997 Evolutionary and ecological response of pocket gophers (Thomomys
talpoides) to late-Holocene climatic change. Biological Journal of the Linnean
Society 60(2):277-296.
Hall, K., and N. Lamont
2003 Zoogeomorphology in the Alpine: some observations on abiotic-biotic
interactions. Geomorphology 55(1-4):219-234.

123
Hall, Kevin, Neil Lamont
2003 Zoogeomorphology in the Alpine: Some observations on Abiotic-Biotic
Interactions. Geomorphology 55:219-234.
Hansen, R. M., and M. J. Morris
1968 Movement of Rocks by Northern Pocket Gophers. Journal of Mammalogy
49(3).
Hassan, Fekri A.
1978 Sediments in Archaeology: Methods and Implications for
Palaeoenvironmental and Cultural Analysis. Journal of Field Archaeology
5(2):197-213.
Hilton, M. R.
2003 Quantifying postdepositional redistribution of the archaeological record
produced by freeze-thaw and other mechanisms: An experimental approach.
Journal of Archaeological Method and Theory 10(3):165-202.
Hughes, Susan
2003 Beyond the Altithermal: The Role of Climate Change in the Prehistoric
Adaptations of Northwestern Wyoming, Department of Anthropology, University
of Washington..
Huntly, N., and R. Inouye
1988 Pocket Gophers in Ecosystems - Patterns and Mechanisms. Bioscience
38(11):786-793.
Ingles, L. G.
1949 Ground Water and Snow as Factors Affecting the Seasonal Distribution of
Pocket Gophers Thomomys-monticola. Journal of Mammalogy 30(4):343-350.
1952 The Ecology and the Mountain Pocket Gopher, Thomomys-monticola.
Ecology 33(1):87-95.
Inouye, R. S., N. Huntly, and G. A. Wasley
1997 Effects of Pocket Gophers (Geomys bursarius) on Microtopographic
Variation. Journal of Mammalogy 78(4):1144-1148.
Johnson, D. L.
1989 Subsurface Stone Lines, Stone Zones, Artifact-Manuport Layers, and
Biomantles Produced by Bioturbation Via Pocket Gophers (Thomomys-bottae).
American Antiquity 54(2):370-389.

124
Litaor, M. I., R. Mancinelli, and J. C. Halfpenny
1996 The influence of pocket gophers on the status of nutrients in Alpine soils.
Geoderma 70(1):37-48.
Malone, David Henry, Thomas Armitage Hauge, and Kent A. Sundell
1996 Field guide for the detachment structures of the eastern Absaroka Range,
Wyoming. Denver, Colorado, Colorado Geological Survey, Dept. of Natural
Resources.
Mielke, Howard
1977 Mound Building by Pocket Gophers (Geomyidae): Their Impact on Soils
and Vegetation in North America. Journal of Biogeography 4(2):171-180.
Millar, S. W. S.
2006 Processes dominating macro-fabric generation in periglacial colluvium.
Catena 67(1):79-87.
Miller, M. A.
1948 Seasonal Trends in Burrowing of Pocket Gophers (Thomomys). Journal of
Mammalogy 29(1):38-44.
Morin, E.
2006 Beyond stratigraphic noise: Unraveling the evolution of stratified
assemblages in faunalturbated sites. Geoarchaeology-an International Journal
21(6):541-565.
Ollie, Naomi
2008 Landscape change and stability in the Absaroka Range, Greater
Yellowstone ecosystem, Wyoming. Department of Anthropology, Colorado State
Univeristy.
Ostrow, D. G., N. Huntly, and R. S. Inouye
2002 Plant-mediated interactions between the northern pocket gopher,
Thomomys talpoides, and aboveground herbivorous insects. Journal of
Mammalogy 83(4):991-998.
Rapp, George (Rip) Jr., and Christopher L. Hill
1998 Geoarchaeology: the Earth Science Approach to Archaeological
Interperpretation. Yale University Press, New Haven.
Reichman, O. J., and E. W. Seabloom
2002 The role of pocket gophers as subterranean ecosystem engineers. Trends
in Ecology & Evolution 17(1):44-49.

125
Reiser, Marcy
2005 In the Shadow of Ghost Trees: Applying Forest Ecology to Archaeolgical
Interpretations. Presented at 63rd Plains Anthropological Conference. Edmonton,
Canada.
Reitze, William
2004 High Altitude Occupation and Raw Material Procurment: Dollar
Mountain, a Northwest Wyoming Example, Department of Anthropology,
Colorado Staste University.
Ritter, Dale, R. Craig Kochel, Jerry R. Miller
2002 Process Geomorphology. McGraw-Hill, New York..
Roering, J. J.
2004 Soil creep and convex-upward velocity profiles: Theoretical and
experimental investigation of disturbance-driven sediment transport on hillslopes.
Earth Surface Processes and Landforms 29(13):1597-1612.
Romanach, S. S., O. J. Reichman, and E. W. Seabloom
2005 Seasonal influences on burrowing activity of a subterranean rodent,
Thomomys bottae. Journal of Zoology 266:319-325.
Schiffer, Michael
1987 Formation Processes of the Archaeological Record. University of Utah
Press, Salt Lake City.
Seabloom, E. W., O. J. Reichman, and E. J. Gabet
2000 The effect of hillslope angle on pocket gopher (Thomomys bottae) burrow
geometry. Oecologia 125(1):26-34.
Selby, Michael John
1982 Hillslope materials and processes. Oxford University Press, Oxford.
Sherrod, S. K., and T. R. Seastedt
2001 Effects of the northern pocket gopher (Thomomys talpoides) on alpine soil
characteristics, Niwot Ridge, Colorado. Biogeochemistry 55(2):195-218.
Sherrod, S. K., T. R. Seastedt, and M. D. Walker
2005 Northern pocket gopher (Thomomys talpoides) control of alpine plant
community structure. Arctic Antarctic and Alpine Research 37(4):585-590.

126
Thorn, C. E.
1978a Preliminary Assessment of the Geomorphic Role of Pocket Gophers in the
Apline Zone of the Colorado Front Range. Geografiska Annaler Series -Physical
Geography 60(3-4):181-187.
Thorn, Colin E.
1978b The Geomorphic Role of Snow. Annals of the Association of American
Geographers 68(3):414-425.
Todd, L.C., Allison Bohn, Oscar Burger, Paul Burnett
2004 Recreation Ecology, Heritage Resource Management, and Environmental
Monitoring:The GRSLE Project, Northwestern Wyoming. Presented at 62th Plains
Anthropological Conference. Billings, Montana.
Waters, Michael
1992 Principles of Geoarchaeology: a North American Perspective. University
of Arizona Press,Tuscon.
Western Regional Climate Center
2010 Sunshine 2NE station; http://www.wrcc.dri.edu/CLIMATEDATA.html
Wilson, G.V.
2009 Mechanisms of Ephemeral Gully Erosion Caused by Constant Flow
through a Continuous Soil-pipe. Earth Surface Processes and Landforms
34:1858-1866.
Zaitlin, B., M. Hayashi, and J. Clapperton
2007 Distribution of northern pocket gopher burrows, and effects on
earthworms and infiltration in a prairie landscape in Alberta, Canada. Applied Soil
Ecology 37(1-2):88-94.

127
APPENDIX A

128
APPENDIX A:
28PA2874 Site Data
Site 48PA2874 is located at the sub-alpine-alpine transition zone in an open
upland meadow. The hummocky grassland overlooks the floodplain of the Greybull
River to the east and is bounded on the north and east/southeast by steep drainages
(Figure A.1). The undulating topography present today was formed over thousands of
years by landslides and slump events caused by changes in moisture and temperature
regimes. Overtime erosion has softened these features into multiple lobate-shaped
slopes, many of which terminate in seasonally filled sag ponds. The entire area is
dissected by shallow drainages and gullies.
Figure A.1. 48PA2874: Site Overview
Photograph by L.C. Todd
Photograph by L.C. Todd
Photograph by Marcy Reiser

129
Site 48PA2874 contains over 2,470 lithic artifacts covering 2.8-hectares. The site
is located on the southern portion of the landform on a north and northeast facing toe
slope. The site is significantly larger and contains a greater number and diversity of
artifacts than other sites in the area.
Figure A.2. Map of 48PA2874:Lobate Slopes Bounded by Steep Drainages
.0 500 1,000250
Meters
The assemblage is dominated by flakes and angular debris, 96.5% (n=2385). Tools
(worked flakes, bifaces, awls, scrapers, and projectile points) comprise 3% (n=75) of the
artifacts at the site, nodules and cores make up 0.5% (n=11). Cortex was present on only
3.1% (n=77) of artifacts. When present, artifacts with 50% or more cortex account for a
mere 0.7% (n=16) of the assemblage. There are 117 artifacts with evidence of heat
exposure (4.8% of 2463 artifacts, heat impact data was missing for eight artifacts). Heat

130
altered artifacts are clustered within concentrations of lithic debris, as described below.
There are six artifact concentrations at 48PA2874.
Of the 75 tools found at the site, there were 16 worked flakes, 20 bifaces, 3 awls,
10 scrapers, and 26 projectile points. Over 80% of tools were located within artifact
concentrations. Projectile points make-up 36% of the tool assemblage and temporally
diagnostic points from all cultural periods have been found on the site surface. These
include two Paleoindian (8%), two Early Archaic (8%), four Middle Archaic (15%), six
Late Archaic (23%), four general Archaic (15%), two Late Prehistoric (8%), and six
unidentifiable projectile points (23%).
Table A.1. Summary of Surface Artifact Data
a. Artifact Types b. All Tools Artifact Type Count Percent Tool Type Count Percent
Flake 1806 73.1 Worked Flake 16 18.2
Worked Flake 16 0.6 Biface (stage undetermined) 1 3.6
Edge Damage Flake 463 18.7 Biface Stage 1 1 0.9
Angular Debris 116 4.7 Biface Stage 2 5 6.4
Projectile Point 26 1.1 Biface Stage 3 7 7.3
Biface 20 0.8 Biface Stage 4 4 5.5
Scraper 10 0.4 Biface Stage 5 2 7.3
Awl 3 0.1 Projectile Point 26 36.4
Core 4 0.2 Scraper 10 11.8
Nodules 7 0.3 Awl 3 2.7
Total 2471 100 Total Tools 75 100
c. Heat Impacted
Artifacts
d. Percent Cortex
Present
e. Projectile Point Types
Type Count % Cortex Count % Time Period Count %
Crazing 51 2.1 0% 2394 96.9 Paleoindian 2 8
Pot Lids 20 0.8 1-10% 23 0.9 Early Archaic 2 8
Multiple Types 12 0.5 10-25% 21 0.8 Middle
Archaic
4 15
Thermal
Fracture
34 1.4 25-50% 17 0.7 Late Archaic 6 23
Absent 2346 94.9 50-75% 9 0.4 Archaic 4 15
Unspecified 8 0.3 75-100% 7 0.3 Late
Prehistoric
2 8
Total 2471 100 Total 2471 100 Unidentifiable 6 23
Total 26 100

131
Artifact Distribution
There are six discrete concentrations of artifacts separated by a sparse scatter of
lithic material. The concentrations are located on two lobate slopes separated by a
shallow drainage. Artifacts are located within a 25 m elevation range (3081 m to 3106
m) on a gradient ranging from 3 to 23%.
Figure A.3. Location of Artifact Concentrations
.0 50 10025 Meters
Concentration 5
Concentration 3
Concentration 6
Concentration 4
Concentration 2
Concentration 1
Concentration 1
Concentration 1 is located in the northern portion of the site and measures 65 m
N/S by 43 m E/W. The concentration contains over 550 pieces of chipped stone
including four projectile points, three bifaces, two awls, one worked flake and two tested
chert nodules. The two chronologically diagnostic projectile points indicate Late

132
Prehistoric and Late Archaic occupation. Two projectile points date to general Archaic
period and one was too fragmented to be identified. The western portion of
Concentration 1 has a discrete cluster of heat impacted artifacts. With the exception of
the single worked flake and one early stage biface, all tools in Concentration 1 are located
outside the cluster of heat impacted artifacts. Notably, only expedient tools were found
within the heat cluster. The limited time and effort invested in constructing these tools
may have influenced the method of discard. Although concentrations of heat impacted
artifacts often indicate the presence of a hearth, further investigation, such as excavation,
is needed to determine if a feature is indeed present.
Concentration 2
Concentration 2 is located in the central portion of the site and measures 57 m
N/S by 37 m E/W. The concentration surrounds the pond where pocket gopher
documentation and test excavation was conducted. Approximately 800 artifacts are
located in Concentration 2, including eight projectile points, seven bifaces, one core,
three worked flakes, five scrapers, and two nodules. The only two projectile points found
at 48PA2874 which date to the Paleoindian period are located in Concentration 2. One
of the Paleoindian points could be specified as Agate Basin. Other diagnostic projectile
points in Concentration 2 include two Middle Archaic, two Late Archaic, one general
Archaic, and one temporally unidentifiable project point. The distribution of tools
displays an interesting pattern. The four projectile points dating to the Archaic period are
clustered in a 10 m² area with the Middle Archaic points lying directly beside one
another. The Paleoindian points are located 15 meters apart. With the exception of the

133
Agate Basin and the unidentifiable projectile point, all projectile points are located within
a cluster of heat affected artifacts. However, none of the projectile points have any
indication of heat exposure. Other tools contained in the cluster of heat impacted
artifacts are three bifaces, four scrapers, three worked flakes, and one nodule. Of these,
only one tool, a worked flake, shows evidence of heat exposure. As in Concentration 1, a
cluster of heat impacted artifacts may indicate a hearth feature but further work is needed.
Concentration 3
Concentration 3 is located in the western portion of the site and contains over 175
artifacts in a 30 m by 30 m area. Tools include six projectile points, one end scraper, one
worked flake, and two bifaces. With the exception of one unidentifiable projectile point,
all date to the Archaic period, one Early Archaic, two Middle Archaic, and two Late
Archaic. Heat altered artifacts are scattered throughout the concentration.
Concentration 4
Concentration 4 is located in the southeastern portion of the site and measures 25
m². The concentration contains approximately 450 artifacts, including two projectile
points, one biface, two scrapers, two worked flakes, and three nodules. The projectile
points date to the Late Archaic and the general Archaic periods. A cluster of heat
impacted artifacts are located within the concentration. The biface, scrapers, and worked
flakes are located within this cluster of heat impacted.
134
Concentration 5
Concentration 5 is located in the southern portion of the site. The concentration is
the smallest at the site measuring approximately 20 m². The concentration contains
slightly over 100 artifacts. Only one tool, a worked flake, and two heat altered flakes
were documented.
Concentration 6
Concentration 6 is located in the northwestern portion of the site and measures
approximately 30 m E/W by 20 m N/S. The concentration contains approximately 50
artifacts including one Late Prehistoric projectile point, three bifaces, an awl, a worked
flake, and a core. Only two heat affected artifacts were located in the concentration.
Interspersed around the concentrations are a scattering of flakes and a small number of
tools. Only nine artifacts with evidence of heat exposure are present outside of the
clusters, supporting the possibility these features are the remains of hearths.
Source of Tool Stone
Artifacts manufactured from both locally available and raw materials from distant
sources are present at 48PA2874. In the following discussion ‘local’ is defined as being
available in the Upper Greybull watershed. Toolstone locally available consists of Irish
Rock chert, Madison Formation chert, Dollar Mountain Chert, chalcedony, petrified
wood, mudstone, and volcanic material/basalt. Non-local source materials include a
variety of cherts, quartzite, Morrison Formation quartzite, obsidian, porecelanite, and
phosphoria. Quartzite and phosphoria can be obtained in the Big Horn Basin, east of the
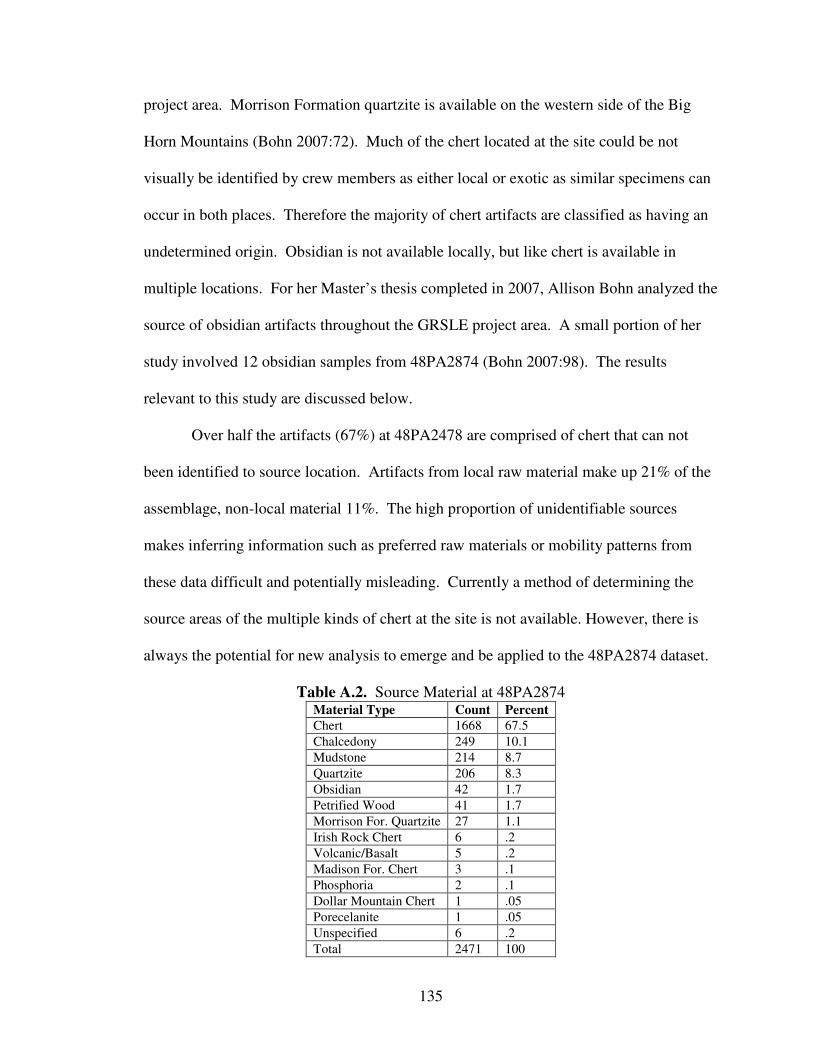
135
project area. Morrison Formation quartzite is available on the western side of the Big
Horn Mountains (Bohn 2007:72). Much of the chert located at the site could be not
visually be identified by crew members as either local or exotic as similar specimens can
occur in both places. Therefore the majority of chert artifacts are classified as having an
undetermined origin. Obsidian is not available locally, but like chert is available in
multiple locations. For her Master’s thesis completed in 2007, Allison Bohn analyzed the
source of obsidian artifacts throughout the GRSLE project area. A small portion of her
study involved 12 obsidian samples from 48PA2874 (Bohn 2007:98). The results
relevant to this study are discussed below.
Over half the artifacts (67%) at 48PA2478 are comprised of chert that can not
been identified to source location. Artifacts from local raw material make up 21% of the
assemblage, non-local material 11%. The high proportion of unidentifiable sources
makes inferring information such as preferred raw materials or mobility patterns from
these data difficult and potentially misleading. Currently a method of determining the
source areas of the multiple kinds of chert at the site is not available. However, there is
always the potential for new analysis to emerge and be applied to the 48PA2874 dataset.
Table A.2. Source Material at 48PA2874 Material Type Count Percent
Chert 1668 67.5
Chalcedony 249 10.1
Mudstone 214 8.7
Quartzite 206 8.3
Obsidian 42 1.7
Petrified Wood 41 1.7
Morrison For. Quartzite 27 1.1
Irish Rock Chert 6 .2
Volcanic/Basalt 5 .2
Madison For. Chert 3 .1
Phosphoria 2 .1
Dollar Mountain Chert 1 .05
Porecelanite 1 .05
Unspecified 6 .2
Total 2471 100

136
Table A.3. Source Material in Concentrations
Material Con 1 Con 2 Con 3 Con 4 Con 5 Con 6
Chert 66 71 74 63.9 57 48
Chalcedony 12 11 10.7 7.8 10.3 18.2
Mudstone 5.6 5 3.5 17 24.3 10.4
Quartzite 11.5 9 5 6 5.6 15
Obsidian 1.7 0.2 3 3 0 4.2
Pet. Wood* 0.54 3 2 0 2.8 0
Mor. Qt.* 2.3 0.2 0 1.9 0 2.1
IR Chert* 0.36 0.2 0.6 0 0 0
Volcanic 0 0.1 0 0.2 0 0
Mad Chert* 0 0 0.6 0 0 2.1
Phosphoria 0 0.1 0 0 0 0
DM Chert* 0 0 0 0 0 0
Porecelanite 0 0.1 0 0 0 0
Unspecified 0 0.1 0.6 0.2 0 0
100 100 100 100 100 100
Obsidian Hydration Analysis
Obsidian comprises slightly less than 2% of the total assemblage at 48PA2874.
Bohn’s conducted obsidian source analysis on a total of 12 artifacts from the site, four
from Concentration 1, four from Concentration 3, two from Concentration 4 and two
artifacts outside the concentrations (Bohn 2007:98). Analysis showed obsidian
originated from three areas; Obsidian Cliff located 140 km (87 miles) northwest, Teton
Pass 142 km (88 miles) west/southwest, and Park Point, the closest source area found at
87 km (54 miles) northwest (Bohn 2007:47). Obsidian in Concentration 1 sourced to
Obsidian Cliff (n=3) and Teton Pass (n=1). Concentration 3 contained three artifacts
from Obsidian Cliff and one from Teton Pass. Concentration 4 had one artifact from
Obsidian Cliff and one from Park Point (Bohn 2007:98, 47). The two artifacts analyzed
outside the concentrations were sourced to Obsidian Cliff. The vast majority of the

137
obsidian artifacts (75%) sourced to Obsidian Cliff, Wyoming. Although Obsidian Cliff is
not the closest location to the project area, prehistorically it was a highly utilized obsidian
source area. Projectile points found in concentrations with sourced obsidian indicate all
were occupied all various times in the past. Therefore linking specific time periods with
a particular obsidian source area is not possible. However the study shows occupants of
48PA2874 obtained obsidian from multiple source areas from great distances. Although
it appears Obsidian Cliff may have been a preferred source, artifacts undergoing this
analysis represent a small portion of the obsidian located at the site. Additional testing
would aid in interpreting these data.
Table A.4. Obsidian Source Areas Source Area Artifact Count Percent
Obsidian Cliff 9 75%
Teton Pass 2 17%
Park Point 1 8%
Total 12 100%
Tools and Source Material
Of the 26 projectile points found at the site, 54% were manufactured from chert
that could not be identified as local or non-local material (Table A.5). Five projectile
points, 19% were manufactured from locally available raw material and six projectile
points, 27% from non-local stone. Paleoindian points (n=2) were manufactured from
porecelanite, an exotic toolstone available in the Big Horn Basin and from a high quality
chert, which has a high likelihood of being non-local. One of the two early Early Archaic
points found at the site is Dollar Mountain chert- the only point composed of this type of
locally available material. The other Early Archaic projectile point is manufactured from
chert from an unknown source. The Middle Archaic points are composed of

138
unidentifiable chert (n=3) and Morrison Formation quartzite (n=1). Of the temporally
diagnostic projectile points, the Late Archaic has the most diverse sources including chert
(n=1), quartzite (n=2), mudstone (n=1), and chalcedony (n=2). However, Late Archaic
projectile points are also the most numerous of the temporally identifiable points (n=6).
The source material of projectile points that can only be identified to the general Archaic
period include Morrison Quartzite (n=1), obsidian (n=1), and chert (n=2). Projectile
points too fragmented to be associated with any time period were composed of mudstone
(n=1), obsidian (n=1), and chert (n=4).
Table A.5. Source Material of Projectile Points Material
Type
Paleo-
Indian
Early
Archaic
Middle
Archaic
Late
Archaic
General
Archaic
Late
Prehistoric
Not
Known Total LOCAL SOURCE MATERIAL
Chalcedony - - - 2 - - - 2
Dollar Mt* - 1 - - - - - 1
Mudstone - - - 1 - - 1 2
Total - 1 - 3 - - 1 5 NON-LOCAL SOURCE MATERIAL
Morr. Qt.** - - 1 - 1 - - 2
Quartzite - - - 2 - - - 2
Obsidian - - - - 1 - 1 2
Porecelanite 1 - - - - - - 1
Total 1 - 1 2 2 - 1 7 UNKNOWN SOURCE LOCATION
Chert 1 1 3 1 2 2 4 14
Total 1 1 3 1 2 2 4 14
Total All 2 2 4 6 4 2 6 26
Percent All 8% 8% 15% 23% 15% 8% 23% 100% *Dollar Mountain Chert
** Morrison Formation Quartzite
Of the other formal tools (defined as Stage 3 and higher bifaces, scrapers, and
awls) 73% were composed of unidentifiable source material, 21% were local material,
and 6% were non-local. Worked flakes were more frequently composed of local material
(31% local) then the entire site assemblage (21% local), the projectile points assemblage
(19% local), and all other formal tools (21% local) (Table A.6a,b). Although formal tools

139
have the lowest percentage of non-local material, it also has the highest percent of
unidentifiable sources that could skew the data in either direction.
Table A.6a.Source Material of Formal Tools: Bifaces, Scrapers, and Awls Material Type Count Percent
Chert 23 69.7
Chalcedony 1 3
Mudstone 4 12.1
Petrified Wood 1 3
Morrison For. Quartzite 1 3
Madison For. Chert 1 3
Unspecified 1 3
Total 33 100
Table A.6b. Source Material of Expedient Tools: Worked Flakes Material Type Count Percent
Chert 7 43.8
Chalcedony 1 6.3
Mudstone 3 18.8
Obsidian 1 6.3
Quartzite 3 18.8
Volcanic 1 6.3
Total 16 100
Temporally Diagnostic Projectile Points
The number of chronologically diagnostic point types can not be directly
correlated with the intensity of occupation during the associated time frame, however it
can be noted Middle Archaic and Late Prehistoric projectile points are the most heavily
represented cultural periods at 48PA2874. It is likely the points identified to-date do not
represent all the projectile points present at the site currently or prehistorically. Survey
certainly did not encounter every artifact and it is likely some projectile points have been
collected looters. Tools can be reused by later peoples, thereby seemly reducing the
number of projectile points from earlier time periods. Regardless of the problems linking
the chronologically diagnostic points with the degree of site use overtime, it can safely be
stated the site was occupied intermittently for the last 9, 000 years.

140
Summary
The ultimate goal of examining the artifact assemblage at 48PA2874 is to
contribute to the growing understanding of past human use of the Upper Greybull region.
What information can be inferred from the cultural material found in the study area?
Chronologically diagnostic projectile points indicate humans hunted in the area from
9,000 BP through the Late Prehistoric. The absence of ground stone may indicate game,
rather than vegetal material was the primary resource used at the site.
The overall artifact assemblage within the project area had very few artifacts with
cortex. If early stage reduction of source material was taking place a large number of
cores or nodules would be expected. However, only .2% of the entire lithic assemblage
consisted of cores or nodules. Nor is the area a source of tool stone as no outcrops or
deposits of workable material is present. Clearly, initial production of stone tools was not
the primary activity occurring at the site.
Source material of tool stone shows prehistoric people had a wide geographic
range, from the Big Horn Mountains to the east, to modern day Yellowstone National
Park to the north, and Teton Pass to the west. While these locations and human mobility
can not be associated with particular time periods, the presence of these material types
show not all resources were locally obtained.
Artifacts and features indicate more than brief instances of opportunistic hunting
occurred at 48PA2874. The presence of clusters of heat impacted artifacts surrounded by
lithic debris and tools suggest hearths and activity areas are associated with a longer-term
presence such as a campsite.

141
APPENDIX B

142
APPENDIX B
Results of Statistical Analysis
Test Excavation Artifact and Site Surface Assemblage
Table B1. U27 Artifacts and Site Surface Assemblage All Artifacts from U27-16 and U27-17 Combined for Analysis
Location Count Mean Std. Deviation t- test Sig. (2-tailed)
U27 63 13.721 11.171 Length Surface 2705 16.580 10.342
.030*
U27 63 .67997 .15963 Elongation Surface 2705 .7302 .1538
.010*
U27 63 .2455 .1244 Flatness Surface 2705 .2610 .1441
.397
U27 63 .0369 .0212 Blockiness Surface 2705 .0453 .0261
.011*
U27 63 8.556 7.4559 Weight Surface 2705 10.539 6.6639
.020*
*Significant at the alpha 0.05 level
Table B2. T26 Artifacts by Depth and Site Surface Assemblage Artifacts from T26-6 and T26-7 Artifacts Combined by Depth for Analysis
T26: 0-5 cmbs and Site Surface Assemblage
CMBS Count Mean Std. Deviation t-test Sig. (2-tailed)
0-5 55 8.655 4.0157 Length Surface 2705 16.580 10.3421
.000*
0-5 55 .7441 .1543 Elongation Surface 2705 .7302 .1537
.511
0-5 55 .1854 .0829 Flatness Surface 2705 .2610 .1441
.008*
0-5 55 .0347 .0179 Blockiness Surface 2705 .0453 .02610
.003*
0-5 55 5.3903 2.6432 Weight Surface 2705 10.5396 6.6639
.000*
T26: 5-10 cmbs and Site Surface Assemblage
CMBS N Mean Std. Deviation t-test Sig. (2-tailed)
5-10 85 8.746 4.5183 Length Surface 2705 16.580 10.3421
.000*
5-10 85 .6929 .1606 Elongation Surface 2705 .7302 .1537
.028*
5-10 85 .1964 .0892 Flatness Surface 2705 .2610 .1441
.000*
5-10 85 .0318 .0203 Blockiness Surface 2705 .0453 .0260
.000*
5-10 85 5.2306 2.6216 Weight Surface 2705 10.5396 6.6639
.000*

143
T26: 10-15 cmbs and Site Surface Assemblage
CMBS N Mean Std. Deviation t-test Sig. (2-tailed)
Length 10-15 128 10.170 7.7336
Surface 2705 16.580 10.3421
.000*
Elongation 10-15 128 .7371 .1402
Surface 2705 .7302 .1538
.621
Flatness 10-15 128 .2343 .1322
Surface 2705 .2610 .1441
.040*
Blockiness 10-15 128 .0411 .0265
Surface 2705 .0453 .0261
.076
Weight 10-15 128 6.6059 6.3926
Surface 10.5396 6.6639
.000*
T26: 15-20 cmbs and Site Surface Assemblage
CMBS N Mean Std. Deviation t-test Sig. (2-tailed)
15-20 49 10.833 6.3622 Length
Surface 2705 16.580 10.3734 .000*
15-20 49 .7142 .1556 Elongation
Surface 2705 .7302 .1538 .470
15-20 49 .2312 .1259 Flatness
Surface 2705 .2610 .1441 .108
15-20 49 .0361 .0194 Blockiness
Surface 2705 .0453 .0261 .002*
15-20 49 6.6312 3.5190 Weight
Surface 2705 10.5396 6.6639
.000*
T26: 20-25 cmbs and Site Surface Assemblage
CMBS N Mean Std. Deviation t-test Sig. (2-tailed)
20-25 34 11.085 4.6827 Length
Surface 2705 16.580 10.3421 .002*
20-25 34 .6978 .1932 Elongation
Surface 2705 .7301 .1537 .225
20-25 34 .2100 .0817 Flatness
Surface 2705 .2609 .1441 .040*
20-25 34 .0330 .0143 Blockiness
Surface 2705 .0453 .0261 .000*
20-25 34 6.6990 2.844 Weight
Surface 2705 10.5396 6.6639 .000*

144
T26: 25-30 cmbs and Site Surface Assemblage
CMBS Count Mean Std. Deviation t-test Sig. (2-tailed)
25-30 31 10.248 6.7105 Length
Surface 2705 16.580 10.3421 .001*
25-30 30 .7345 .1664 Elongation
Surface 2705 .7301 .1537 .877
25-30 31 .2202 .1333 Flatness
Site 2705 .2609 .1441 .117
25-30 31 .0403 .0312 Blockiness
Surface 2705 .0453 .0260 .289
25-30 31 6.6139 4.6366 Weight
Surface 2705 10.5396 6.6639 .001*
*Significant at the alpha 0.05 level
Pocket Gopher and Site Surface Artifacts
Table B3. t-test of Artifact Length in Burrows,
Site Surface, and Buffer Areas Area T df Sig. (2-tailed)
Site -1.063 2583 .288
0 – 2 m -1.502 186 .135
2 – 4 m -1.364 243 .642
4 – 6 m -.373 337 .710
6 – 8 m -1.890 322 .060
8 - 10m -.445 319 .657
0 – 4 m -1.601 317 .110
6 - 10 m -1.281 547 .201
Table B4. t-test of Elongation and Flatness of
Artifacts in Burrows, Site Surface, and Buffer Areas Elongation Flatness
Location T Df Sig. (2-tailed)
T Df Sig. (2-tailed)
Site Surface 1.204 2818 .229 -.479 2818 .632
0 – 2 m -1.502 186 .135 -1.305 186 .194
2 – 4 m .428 243 .669 -.968 243 .334
4 – 6 m 1.35 337 .178 -.559 337 .576
6 – 8 m 1.485 322 .139 -.542 322 .588
8 – 10 m 1.598 319 .111 -.538 319 .591
0 – 4 m .666 317 .506 -1.201 317 .231
6 - 10 m 1.564 547 .118 -.597 547 .551

145
Table B5. t-test of Blockiness/Sphericity and Weight
of Artifacts in Burrows, Site Surface, and Buffer Areas Blockiness/Sphericity Weight Location T Df Sig.
(2-tailed)
T Df Sig. (2-tailed)
Site Surface .051 2817 .959 -1.687 126.334 .094
0 – 2 m -1.226 186 .222 -1.312 186 .191
2 – 4 m -1.089 243 .227 -1.707 243 .089
4 – 6 m .308 337 .576 -.442 337 .659
6 – 8 m -.100 322 .920 -1.943 322 .053
8 - 10m .265 319 .791 -.270 319 .787
0 – 4 m -1.183 317 .283 -1.650 317 .238
6 - 10 m .120 547 .904 -1.174 547 .241
Pocket Gopher and Excavation Artifacts
Table B6. Statistical Analysis of Pocket Gopher and U27 Artifacts
Count Mean Std. Deviation t-test Sig. (2-tailed)
Gopher 114 14.9 8.53 Length
U27 63 13.7 11.17 .428
Gopher 114 .7486 .1606 Elongation
U27 63 .6799 .1596 .007*
Gopher 114 .2538 .1490 Flatness
U27 63 .2454 .1243 .707
Gopher 114 .0446 .0225 Blockiness
U27 63 .0368 .0212 .027*
Gopher 114 9.49 5.3745 Weight
U27 63 8.55 7.4559 .333
*Significant at the alpha 0.05 level
Table B7. Statistical Analysis of Pocket Gopher and T26 Artifacts
Pocket Gopher Artifacts and T26: 0 - 5 cmbs
Count Mean Std. Deviation t-test Sig. (2-tailed)
Gopher 114 14.92 8.536 Length
0 -5 55 8.65 4.015 .000*
Gopher 114 .7486 .1607 Elongation
0 -5 55 .7441 .1544 .863
Gopher 114 .2538 .1491 Flatness
0 -5 55 .1854 .0829 .000*
Gopher 114 .0446 .0225 Blockiness
0 -5 55 .0347 .0179 .005*
Gopher 114 9.4997 5.3726 Weight
0 -5 55 5.3903 2.6433 .000*

146
Pocket Gopher Artifacts and T26: 5 – 10 cmbs
Count Mean Std. Deviation t-test Sig. (2-tailed)
Gopher 114 14.92 8.536 Length
5 – 10 85 8.746 4.5183 .000*
Gopher 114 .7486 .1607 Elongation
5 – 10 85 .6929 .1605 .016*
Gopher 114 .2538 .1491 Flatness
5 – 10 85 .1963 .0829 .001*
Gopher 114 .0446 .0225 Blockiness
5 – 10 85 .0319 .0203 .000*
Gopher 114 9.4997 5.3726 Weight
5 – 10 85 5.2305 2.6215 .000*
Pocket Gopher Artifacts and T26: 10 – 15 cmbs
Count Mean Std. Deviation t-test Sig. (2-tailed)
Gopher 114 14.92 8.536 Length
10 -15 128 10.17 7.734 .000*
Gopher 114 .7486 .1607 Elongation
10 -15 128 .7370 .1401 .551
Gopher 114 .2538 .1490 Flatness
10 -15 128 .2342 .1322 .281
Gopher 114 .0446 .0225 Blockiness
10 -15 128 .0411 .0265 .273
Gopher 114 9.4997 5.3726 Weight
10 -15 128 6.606 6.3925 .000*
Pocket Gopher Artifacts and T26: 15 - 20 cmbs
Count Mean Std. Deviation t-test Sig. (2-tailed)
Gopher 114 14.92 8.536 Length
15 – 20 49 10.833 6.3622 .003*
Gopher 114 .7486 .1607 Elongation
15 – 20 49 .7141 .1555 .207
Gopher 114 .2538 .1490 Flatness
15 – 20 49 .2312 .1259 .355
Gopher 114 .0446 .0225 Blockiness
15 – 20 49 .0361 .0194 .023*
Gopher 114 9.4997 5.3726 Weight
15 – 20 49 6.6313 3.5190 .000*

147
Pocket Gopher Artifacts and T26: 20 - 25 cmbs
Count Mean Std. Deviation t-test Sig. (2-tailed)
Gopher 114 14.92 8.536 Length
20 – 25 34 11.085 4.683 .014*
Gopher 114 .7486 .1607 Elongation
20 – 25 34 .6978 .1932 .126
Gopher 114 .2538 .1490 Flatness
20 – 25 34 .2100 .0817 .104
Gopher 114 .0446 .0225 Blockiness
20 – 25 34 .0330 .0142 .005*
Gopher 114 9.4997 5.3726 Weight
20 – 25 34 6.6990 2.8437 .000*
Pocket Gopher Artifacts and T26: 25 - 30 cmbs
Count Mean Std. Deviation t-test Sig. (2-tailed)
Gopher 114 14.92 8.536 Length
25 -30 31 10.248 6.7105 .006*
Gopher 114 .7486 .1607 Elongation
25 – 30 31 .7346 .1665 .673
Gopher 114 .2538 .1490 Flatness
25 – 30 31 .2203 .1333 .258
Gopher 114 .0446 .0225 Blockiness
25 – 30 31 .0403 .03125 .476
Gopher 114 9.4997 5.3726 Weight
25 – 30 31 6.6140 4.6367 .007*
*Significant at the alpha 0.05 level

148
T26: Excavation Artifact
Table B8. All T26 Artifacts: T26-6, T26-7 Artifacts Combined and Compared by Depth
T26 0-5 and 5-10 cmbs
Group Statistics
CMBS N Mean Std. Deviation Std. Error Mean
0-5 55 8.655 4.0157 .5415 Length
5-10 85 8.746 4.5183 .4901
0-5 55 .74410848 .154365927 .020814697 Elongation
5-10 85 .69285027 .160577062 .017417028
0-5 55 .18539854 .082866193 .011173675 Flatness
5-10 85 .19636985 .089160709 .009670837
0-5 55 .03472991 .017980753 .002424524 Blockiness
5-10 85 .03183675 .020267262 .002198293
0-5 55 5.39030303 2.643227799 .356412764 Weight
5-10 85 5.23058824 2.621594348 .284351831
T26 0-5 and 5-10 cmbs Independent Samples Test
Levene's Test for Equality of Variances t-test for Equality of Means
95% Confidence Interval
F Sig. T df Sig. (2-tailed)
Mean Difference
Std. Error Difference Lower Upper
Equal variances assumed
.098 .755 -.122 138 .903 -.0913 .7491 -1.5725 1.3898 Length
Equal variances not assumed
-.125 124.84 .901 -.0913 .7303 -1.5368 1.3541
Equal variances assumed
.100 .752 1.873 138 .063 .0512582 .0273724 -.00286533 .1053875 Elongation
Equal variances not assumed
1.889 118.68 .061 .0512582 .0271404 -.00248402 .10500045
Equal variances assumed
.129 .720 -.731 138 .466 -.0109730 .0150124 -.04065553 .0187195 Flatness
Equal variances not assumed
-.742 121.40 .459 -.0109713 .0147775 -.04022633 .0182376
Equal variances assumed
.001 .973 .862 138 .390 .0028931 .0033579 -.00374665 .0093291 Blockiness
Equal variances not assumed
.884 124.98 .378 .0028931 .0032727 -.00358407 .0037030
Equal variances assumed
.058 .811 .351 138 .726 .1597147 .4551371 -.74022957 1.059659 Weight
Equal variances not assumed
.350 114.73 .727 .1597147 .4559451 -.74344685 1.062876

149
T26 0-5 and 10-15 cmbs Group Statistics
CMBS N Mean Std. Deviation Std. Error Mean
0-5 55 8.655 4.0157 .5415 Length
10-15 128 10.170 7.7336 .6836
0-5 55 .74410848 .154365927 .020814697 Elongation
10-15 128 .73705377 .140165963 .012389038
0-5 55 .18539854 .082866193 .011173675 Flatness
10-15 128 .23425873 .132208236 .011685667
0-5 55 .03472991 .017980753 .002424524 Blockiness
10-15 128 .04112461 .026521370 .002344180
0-5 55 5.39030303 2.643227799 .356412764 Weight
10-15 128 6.60598958 6.392562435 .565028031
T26 0-5 and 10-15 cmbs Independent Samples Test
Levene's Test for Equality of Variances t-test for Equality of Means
95% Confidence Interval
F Sig. T df Sig. (2-tailed)
Mean Difference
Std. Error Difference Lower Upper
Equal variances assumed
1.626 .204 -1.37 181 .171 -1.5158 1.1027 -3.6915 .6600 Length
Equal variances not assumed
-1.73 174.653 .084 -1.5158 .8720 -3.2369 .2053
Equal variances assumed
1.815 .180 .303 181 .762 .007054711 .023305198 -.038904 .053039526 Elongation
Equal variances not assumed
.291 94.021 .772 .007054711 .024222714 -.041035 .055149337
Equal variances assumed
6.738 .010 -2.53 181 .012 -.04880194 .019288733 -.086913 -.01080496 Flatness
Equal variances not assumed
-3.02 156.910 .003 -.04880194 .016168050 -.080753 -.01692505
Equal variances assumed
.440 .508 -1.63 181 .104 -.00639702 .003916171 -.014122 .001332519 Blockiness
Equal variances not assumed
-1.89 147.386 .060 -.00639402 .003372462 -.013598 .000269925
Equal variances assumed
2.026 .156 -1.36 181 .176 -1.2156553 .894159624 -2.98001 .548630805 Weight
Equal variances not assumed
-1.82 180.838 .070 -1.2156553 .668046955 -2.53386 .102482960
T26 0-5 and 15-20 cmbs Group Statistics
CMBS N Mean Std. Deviation Std. Error Mean
0-5 55 8.655 4.0157 .5415 Length
15-20 49 10.833 6.3622 .9089
0-5 55 .74410848 .154365927 .020814697 Elongation
15-20 49 .71416473 .155585368 .022226481
0-5 55 .18539854 .082866193 .011173675 Flatness
15-20 49 .23122887 .125921529 .017988790
0-5 55 .03472991 .017980753 .002424524 Blockiness
15-20 49 .03613547 .019361331 .002765904
0-5 55 5.39030303 2.643227799 .356412764 Weight
15-20 49 6.63129252 3.519031644 .502718806

150
T26 0-5 and 15-20 cmbs Independent Samples Test
Levene's Test for Equality of Variances t-test for Equality of Means
95% Confidence
F Sig. T df Sig. (2-tailed)
Mean Difference
Std. Error Difference Lower Upper
Equal variances assumed
3.030 .085 -2.11 102 .037 -2.1781 1.0318 -4.2246 -.1316 Length
Equal variances not assumed
-2.09 79.246 .043 -2.1781 1.0580 -4.2838 -.0724
Equal variances assumed
.000 .985 .984 102 .328 .029943753 .030437121 -.030132 .090315639 Elongation
Equal variances not assumed
.983 100.441 .328 .029943753 .030451077 -.030665 .090354572
Equal variances assumed
11.027 .001 -2.25 102 .029 -.04583037 .020693907 -.086804 -.00474070 Flatness
Equal variances not assumed
-2.14 81.412 .033 -.04583037 .021176581 -.087989 -.00368815
Equal variances assumed
.270 .605 -.384 102 .702 -.00140567 .003662328 -.008676 .005858643 Blockiness
Equal variances not assumed
-.382 98.441 .703 -.00140567 .003678117 -.008761 .005893128
Equal variances assumed
2.600 .110 -2.07 102 .043 -1.2409887 .60631246 -2.44337 -.03835837 Weight
Equal variances not assumed
-2.04 88.505 .047 -1.2409887 .6162436 -2.46586 -.01643187
T26 0-5 and 20-25 cmbs Group Statistics
CMBS N Mean Std. Deviation Std. Error Mean
0-5 55 8.655 4.0157 .5415 Length
20-25 34 11.085 4.6827 .8031
0-5 55 .74410848 .154365927 .020814697 Elongation
20-25 34 .69785464 .193225705 .033137935
0-5 55 .18539854 .082866193 .011173675 Flatness
20-25 34 .21006984 .081773891 .014024107
0-5 55 .03472991 .017980753 .002424524 Blockiness
20-25 34 .03303606 .014267561 .002446866
0-5 55 5.39030303 2.643227799 .356412764 Weight
20-25 34 6.69901961 2.843712247 .487692627

151
T26 0-5 and 20-25 Independent Samples Test
Levene's Test for Equality of Variances t-test for Equality of Means
95% Confidence
F Sig. T df Sig. (2-tailed)
Mean Difference
Std. Error Difference Lower Upper
Equal variances assumed
1.413 .238 -2.603
87 .011 -2.4307 .9339 -4.2871 -.5744 Length
Equal variances not assumed
-
2.510 61.995 .015 -2.4307 .9686 -4.3669 -.4946
Equal variances assumed
2.442 .122 1.246 87 .216 .046253845 .037120671 -.02727508
.120035198 Elongation
Equal variances not assumed
1.182 58.602 .242 .046253845 .039132779 -
.03206199 .124569489
Equal variances assumed
.126 .723 -1.372
87 .174 -.02467306 .017988034 -.06042470
.011081859 Flatness
Equal variances not assumed
-
1.376 70.768 .173 -.02467106 .017931162 -
.06042760 .011084449
Equal variances assumed
1.929 .168 .466 87 .643 .001693847 .003636709 -.00553505
.008922199 Blockiness
Equal variances not assumed
.492 81.563 .624 .001693847 .003444630 -
.00515968 .008546862
Equal variances assumed
.834 .364 -2.205
87 .030 -1.3087178 .593614945 -2.4859559
-.12884296 Weight
Equal variances not assumed
-
2.167 66.135 .034 -1.3087678 .604048141 -
2.5146189 -.10274166
T26 0-5 and 25-30 cmbs
Group Statistics
CMBS N Mean Std. Deviation Std. Error Mean
0-5 55 8.655 4.0157 .5415 Length
25-30 31 10.248 6.7105 1.2052
0-5 55 .74410848 .154365927 .020814697 Elongation
25-30 30 .73457752 .166460937 .030391470
0-5 55 .18539854 .082866193 .011173675 Flatness
25-30 31 .22025151 .133337628 .023948145
0-5 55 .03472991 .017980753 .002424524 Blockiness
25-30 31 .04031145 .031251576 .005612949
0-5 55 5.39030303 2.643227799 .356412764 Weight
25-30 31 6.61397849 4.636671653 .832770813

152
T26 0-5 - 25-30 cmbs
Independent Samples Test
Levene's Test for Equality of Variances t-test for Equality of Means
95% Confidence Interval
F Sig. T df Sig. (2-tailed)
Mean Difference
Std. Error Difference Lower Upper
Equal variances assumed
9.979 .002 -1.380
84 .171 -1.5938 1.1550 -3.8907 .7031 Length
Equal variances not assumed
-
1.206 42.374 .234 -1.5938 1.3213 -4.2596 1.0719
Equal variances assumed
.421 .518 .265 83 .792 .009530965 .036019310 -.06210994
.081171925 Elongation
Equal variances not assumed
.259 55.973 .797 .009530965 .036836030 -
.06426158 .083323189
Equal variances assumed
3.949 .050 -1.496
84 .138 -.03482970 .023300953 -.08118971
.011483531 Flatness
Equal variances not assumed
-
1.319 43.342 .194 -.03482970 .026426590 -
.08813599 .018429159
Equal variances assumed
1.880 .174 -1.053
84 .295 -.00558537 .005298798 -.01611878
.004955704 Blockiness
Equal variances not assumed
-.913 41.438 .367 -.00558137 .006114206 -
.01792464 .006762390
Equal variances assumed
13.387 .000 -1.562
84 .122 -1.2275464 .783473005 -2.7897456
.334346528 Weight
Equal variances not assumed
-
1.351 41.228 .184 -1.2236464 .905835131 -
3.0523044 .605388116
T26 5-10 and 10-15 cmbs
Group Statistics
CMBS N Mean Std. Deviation Std. Error Mean
5-10 85 8.746 4.5183 .4901 Length
10-15 128 10.170 7.7336 .6836
5-10 85 .69285027 .160577062 .017417028 Elongation
10-15 128 .73705377 .140165963 .012389038
5-10 85 .19636985 .089160709 .009670837 Flatness
10-15 128 .23425873 .132208236 .011685667
5-10 85 .03183675 .020267262 .002198293 Blockiness
10-15 128 .04112461 .026521370 .002344180
5-10 85 5.23058824 2.621594348 .284351831 Weight
10-15 128 6.60598958 6.392562435 .565028031

153
T26 5-10 and 10-15 cmbs Independent Samples Test
Levene's Test for Equality of Variances t-test for Equality of Means
95% Confidence Interval
F Sig. t df Sig. (2-tailed)
Mean Difference
Std. Error Difference Lower Upper
Equal variances assumed
1.713 .192 -1.533 211 .127 -1.4244 .9294 -3.2566 .4077 Length
Equal variances not assumed
-1.694 208.019 .092 -1.4244 .8411 -3.0826 .2337
Equal variances assumed
3.653 .057 -2.126 211 .035 -.04420300 .020795806 -.08519762 -.00209339 Elongation
Equal variances not assumed
-2.068 162.921 .040 -.04420500 .021373842 -.08640898 -.00199833
Equal variances assumed
7.454 .007 -2.315 211 .022 -.03788885 .016368277 -.07015189 -.00562280 Flatness
Equal variances not assumed
-2.498 210.938 .013 -.03788885 .015168385 -.06779928 -.00798742
Equal variances assumed
.622 .431 -2.740 211 .007 -.00927858 .003389639 -.01596974 -.00260962 Blockiness
Equal variances not assumed
-2.890 206.794 .004 -.00928788 .003213670 -.01562614 -.00295102
Equal variances assumed
3.502 .063 -1.880 211 .061 -1.3751348 .731500586 -2.8136981 .066584285 Weight
Equal variances not assumed
-2.174 181.841 .031 -1.3750148 .632544575 -2.6234701 -.12733095
T26 5-10 and 15 -20 cmbs
Group Statistics
CMBS N Mean Std. Deviation Std. Error Mean
5-10 85 8.746 4.5183 .4901 Length
15-20 49 10.833 6.3622 .9089
5-10 85 .69285027 .160577062 .017417028 Elongation
15-20 49 .71416473 .155585368 .022226481
5-10 85 .19636985 .089160709 .009670837 Flatness
15-20 49 .23122887 .125921529 .017988790
5-10 85 .03183675 .020267262 .002198293 Blockiness
15-20 49 .03613547 .019361331 .002765904
5-10 85 5.23058824 2.621594348 .284351831 Weight
15-20 49 6.63129252 3.519031644 .502718806
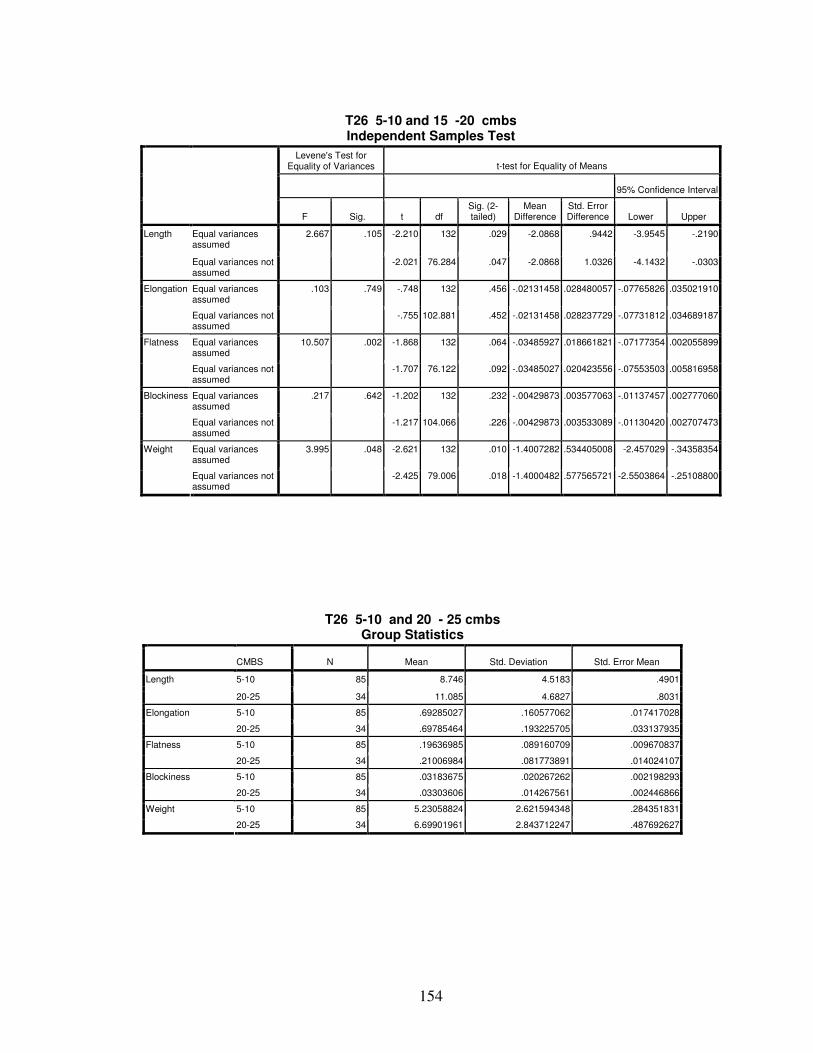
154
T26 5-10 and 15 -20 cmbs Independent Samples Test
Levene's Test for Equality of Variances t-test for Equality of Means
95% Confidence Interval
F Sig. t df
Sig. (2-tailed)
Mean Difference
Std. Error Difference Lower Upper
Equal variances assumed
2.667 .105 -2.210 132 .029 -2.0868 .9442 -3.9545 -.2190 Length
Equal variances not assumed -2.021 76.284 .047 -2.0868 1.0326 -4.1432 -.0303
Equal variances assumed
.103 .749 -.748 132 .456 -.02131458 .028480057 -.07765826 .035021910 Elongation
Equal variances not assumed -.755 102.881 .452 -.02131458 .028237729 -.07731812 .034689187
Equal variances assumed
10.507 .002 -1.868 132 .064 -.03485927 .018661821 -.07177354 .002055899 Flatness
Equal variances not assumed -1.707 76.122 .092 -.03485027 .020423556 -.07553503 .005816958
Equal variances assumed
.217 .642 -1.202 132 .232 -.00429873 .003577063 -.01137457 .002777060 Blockiness
Equal variances not assumed -1.217 104.066 .226 -.00429873 .003533089 -.01130420 .002707473
Equal variances assumed
3.995 .048 -2.621 132 .010 -1.4007282 .534405008 -2.457029 -.34358354 Weight
Equal variances not assumed -2.425 79.006 .018 -1.4000482 .577565721 -2.5503864 -.25108800
T26 5-10 and 20 - 25 cmbs Group Statistics
CMBS N Mean Std. Deviation Std. Error Mean
5-10 85 8.746 4.5183 .4901 Length
20-25 34 11.085 4.6827 .8031
5-10 85 .69285027 .160577062 .017417028 Elongation
20-25 34 .69785464 .193225705 .033137935
5-10 85 .19636985 .089160709 .009670837 Flatness
20-25 34 .21006984 .081773891 .014024107
5-10 85 .03183675 .020267262 .002198293 Blockiness
20-25 34 .03303606 .014267561 .002446866
5-10 85 5.23058824 2.621594348 .284351831 Weight
20-25 34 6.69901961 2.843712247 .487692627

155
T26 5-10 and 20 -25 cmbs Independent Samples Test
Levene's Test for Equality of Variances t-test for Equality of Means
95% Confidence Interval
F Sig. t df
Sig. (2-tailed)
Mean Difference
Std. Error Difference Lower Upper
Equal variances assumed
.736 .393 -2.525 117 .013 -2.3394 .9264 -4.1741 -.5048 Length
Equal variances not assumed -2.487 58.944 .016 -2.3394 .9408 -4.2220 -.4568
Equal variances assumed
1.991 .161 -.145 117 .885 -.00500436 .034581628 -.07349168 .063482736 Elongation
Equal variances not assumed -.134 52.186 .894 -.00500436 .037436287 -.08011997 .070110665
Equal variances assumed
.001 .972 -.775 117 .440 -.01369996 .017682573 -.04871405 .021319413 Flatness
Equal variances not assumed -.804 65.985 .424 -.01369996 .017035277 -.04771164 .020312172
Equal variances assumed
1.226 .271 -.315 117 .753 -.00119930 .003808851 -.00874540 .006343920 Blockiness
Equal variances not assumed -.365 85.809 .716 -.00119930 .003289323 -.00773876 .005339857
Equal variances assumed
1.356 .247 -2.694 117 .008 -1.4684373 .545063712 -2.5479013 -.38896122 Weight
Equal variances not assumed -2.601 56.677 .012 -1.4684133 .564535262 -2.5990387 -.33782959
T26 5-10 and 25-30 cmbs Group Statistics
CMBS N Mean Std. Deviation Std. Error Mean
5-10 85 8.746 4.5183 .4901 Length
25-30 31 10.248 6.7105 1.2052
5-10 85 .69285027 .160577062 .017417028 Elongation
25-30 30 .73457752 .166460937 .030391470
5-10 85 .19636985 .089160709 .009670837 Flatness
25-30 31 .22025151 .133337628 .023948145
5-10 85 .03183675 .020267262 .002198293 Blockiness
25-30 31 .04031145 .031251576 .005612949
5-10 85 5.23058824 2.621594348 .284351831 Weight
25-30 31 6.61397849 4.636671653 .832770813

156
T26 5-10 and 25-30 Independent Samples Test
Levene's Test for Equality of Variances t-test for Equality of Means
95% Confidence Interval
F Sig. t Df
Sig. (2-tailed)
Mean Difference
Std. Error Difference Lower Upper
Equal variances assumed
8.557 .004 -1.381 114 .170 -1.5025 1.0881 -3.6580 .6530 Length
Equal variances not assumed -1.155 40.347 .255 -1.5025 1.3011 -4.1314 1.1263
Equal variances assumed
.168 .682 -1.212 113 .228 -.04172246 .034425624 -.10990616 .026476124 Elongation
Equal variances not assumed -1.191 49.340 .239 -.04177246 .035028478 -.11210750 .028652858
Equal variances assumed
3.602 .060 -1.109 114 .270 -.02388660 .021536865 -.06654025 .018782704 Flatness
Equal variances not assumed -.925 40.200 .361 -.02388660 .025827093 -.07607257 .028308736
Equal variances assumed
2.050 .155 -1.707 114 .090 -.00847494 .004963747 -.01830739 .001358451 Blockiness
Equal variances not assumed -1.406 39.577 .168 -.00847464 .006028075 -.02066190 .003712562
Equal variances assumed
17.496 .000 -2.014 114 .046 -1.3833259 .687021648 -2.7437853 -.02245666 Weight
Equal variances not assumed -1.572 37.222 .124 -1.3833259 .879979085 -3.1667578 .399257059
T26 10-15 and 15-20 cmbs Group Statistics
CMBS N Mean Std. Deviation Std. Error Mean
10-15 128 10.170 7.7336 .6836 Length
15-20 49 10.833 6.3622 .9089
10-15 128 .73705377 .140165963 .012389038 Elongation
15-20 49 .71416473 .155585368 .022226481
10-15 128 .23425873 .132208236 .011685667 Flatness
15-20 49 .23122887 .125921529 .017988790
10-15 128 .04112461 .026521370 .002344180 Blockiness
15-20 49 .03613547 .019361331 .002765904
10-15 128 6.60598958 6.392562435 .565028031 Weight
15-20 49 6.63129252 3.519031644 .502718806

157
T26 10-15 and 15-20 cmbs Independent Samples Test
Levene's Test for Equality of Variances t-test for Equality of Means
95% Confidence Interval
F Sig. t df
Sig. (2-tailed)
Mean Difference
Std. Error Difference Lower Upper
Equal variances assumed
.014 .905 -.534 175 .594 -.6623 1.2402 -3.1101 1.7854 Length
Equal variances not assumed -.582 104.964 .562 -.6623 1.1372 -2.9173 1.5926
Equal variances assumed
1.589 .209 .943 175 .347 .022889043 .024284488 -.025039126 .070817211 Elongation
Equal variances not assumed .900 79.558 .371 .022889043 .025446114 -.027754662 .073532747
Equal variances assumed
.230 .632 .138 175 .890 .003029857 .021925060 -.040241714 .046301429 Flatness
Equal variances not assumed .141 90.938 .888 .003029857 .021451140 -.039580586 .045640301
Equal variances assumed
.999 .319 1.199 175 .232 .004989135 .004160169 -.003221426 .013199696 Blockiness
Equal variances not assumed 1.376 118.596 .171 .004989135 .003625660 -.002190285 .012168554
Equal variances assumed
.256 .613 -.026 175 .979 -.025302934 .965801903 -1.931421605
1.880815738 Weight
Equal variances not assumed -.033 153.368 .973 -.025302934 .756295494 -
1.519404381 1.468798514
T26 10-15 and 20 -25 Group Statistics
CMBS N Mean Std. Deviation Std. Error Mean
10-15 128 10.170 7.7336 .6836 Length
20-25 34 11.085 4.6827 .8031
10-15 128 .73705377 .140165963 .012389038 Elongation
20-25 34 .69785464 .193225705 .033137935
10-15 128 .23425873 .132208236 .011685667 Flatness
20-25 34 .21006984 .081773891 .014024107
10-15 128 .04112461 .026521370 .002344180 Blockiness
20-25 34 .03303606 .014267561 .002446866
10-15 128 6.60598958 6.392562435 .565028031 Weight
20-25 34 6.69901961 2.843712247 .487692627

158
T26 10-15 and 20 -25 cmbs Independent Samples Test
Levene's Test for Equality of Variances t-test for Equality of Means
95% Confidence Interval
F Sig. t df
Sig. (2-tailed)
Mean Difference
Std. Error Difference Lower Upper
Equal variances assumed
.157 .692 -.658 160 .512 -.9150 1.3912 -3.6625 1.8325 Length
Equal variances not assumed -.868 86.359 .388 -.9150 1.0546 -3.0113 1.1814
Equal variances assumed
8.230 .005 1.331 160 .185 .039199134 .029447224 -.01896234 .097354502 Elongation
Equal variances not assumed 1.108 42.653 .274 .039199134 .035378115 -.03214412 .110562681
Equal variances assumed
3.491 .064 1.015 160 .312 .024188888 .023828294 -.02286646 .071247423 Flatness
Equal variances not assumed 1.325 84.188 .189 .024188888 .018254599 -.01211102 .060488979
Equal variances assumed
1.820 .179 1.711 160 .089 .008088549 .004727108 -.00124724 .017424121 Blockiness
Equal variances not assumed 2.387 99.579 .019 .008088549 .003388560 .001365395 .014811702
Equal variances assumed
.568 .452 -.083 160 .934 -.09303025 1.126725221 -2.3181421 2.132141372 Weight
Equal variances not assumed -.125 123.316 .901 -.09303025 .746391837 -1.5704280 1.384369231
T26 10-15 and 25-30 cmbs Group Statistics
CMBS N Mean Std. Deviation Std. Error Mean
10-15 128 10.170 7.7336 .6836 Length
25-30 31 10.248 6.7105 1.2052
10-15 128 .73705377 .140165963 .012389038 Elongation
25-30 30 .73457752 .166460937 .030391470
10-15 128 .23425873 .132208236 .011685667 Flatness
25-30 31 .22025151 .133337628 .023948145
10-15 128 .04112461 .026521370 .002344180 Blockiness
25-30 31 .04031145 .031251576 .005612949
10-15 128 6.60598958 6.392562435 .565028031 Weight
25-30 31 6.61397849 4.636671653 .832770813

159
T26 10-15 and 25-30 cmbs Independent Samples Test
Levene's Test for Equality of Variances t-test for Equality of Means
95% Con Interval
F Sig. t df
Sig. (2-tailed)
Mean Difference
Std. Error Difference Lower Upper
Equal variances assumed
.845 .359 -.052 157 .959 -.0781 1.5111 -3.0628 2.9066 Length
Equal variances not assumed -.056 51.154 .955 -.0781 1.3856 -2.8596 2.7034
Equal variances assumed
3.149 .078 .084 156 .933 .002476255 .029496486 -.055787786 .060740295 Elongation
Equal variances not assumed .075 39.192 .940 .002476255 .032819654 -.063897367 .068849876
Equal variances assumed
.018 .893 .528 157 .598 .014007224 .026508308 -.038351699 .066366148 Flatness
Equal variances not assumed .526 45.379 .602 .014007224 .026647110 -.039650435 .067664884
Equal variances assumed
.549 .460 .148 157 .883 .000813164 .005502489 -.010055293 .011681622 Blockiness
Equal variances not assumed .134 41.083 .894 .000813164 .006082793 -.011470535 .013096863
Equal variances assumed
.492 .484 -.007 157 .995 -.00798811 1.220325892 2.418363388 2.402385566 Weight
Equal variances not assumed -.008 60.929 .994 -.00798811 1.006361715 -2.02081211 2.004403388
T26 15 – 20 and 20-25 cmbs Group Statistics
CMBS N Mean Std. Deviation Std. Error Mean
15-20 49 10.833 6.3622 .9089 Length
20-25 34 11.085 4.6827 .8031
15-20 49 .71416473 .155585368 .022226481 Elongation
20-25 34 .69785464 .193225705 .033137935
15-20 49 .23122887 .125921529 .017988790 Flatness
20-25 34 .21006984 .081773891 .014024107
15-20 49 .03613547 .019361331 .002765904 Blockiness
20-25 34 .03303606 .014267561 .002446866
15-20 49 6.63129252 3.519031644 .502718806 Weight
20-25 34 6.69901961 2.843712247 .487692627

160
T26 15-20 and 25 -30 cmbs Group Statistics
CMBS N Mean Std. Deviation Std. Error Mean
15-20 49 10.833 6.3622 .9089 Length
25-30 31 10.248 6.7105 1.2052
15-20 49 .71416473 .155585368 .022226481 Elongation
25-30 30 .73457752 .166460937 .030391470
15-20 49 .23122887 .125921529 .017988790 Flatness
25-30 31 .22025151 .133337628 .023948145
15-20 49 .03613547 .019361331 .002765904 Blockiness
25-30 31 .04031145 .031251576 .005612949
15-20 49 6.63129252 3.519031644 .502718806 Weight
25-30 31 6.61397849 4.636671653 .832770813
T26 15-20 and 20 -25 cmbs Independent Samples Test
Levene's Test for Equality of Variances t-test for Equality of Means
95% Confidence Interval
F Sig. t df
Sig. (2-tailed)
Mean Difference
Std. Error Difference Lower Upper
Equal variances assumed
.411 .523 -.197 81 .844 -.2526 1.2807 -2.8008 .844 Length
Equal variances not assumed
-.208 80.67 .836 -.2526 1.2129 -2.6660 .836
Equal variances assumed
2.280 .135 .425 81 .672 .0163100 .038372754 -.06003965 .672 Elongation
Equal variances not assumed
.409 60.89 .684 .0163100 .039901619 -.06348085 .684
Equal variances assumed
7.044 .010 .861 81 .392 .0211590 .024573313 -.02773414 .392 Flatness
Equal variances not assumed
.928 80.71 .356 .0211591 .022809475 -.02422712 .356
Equal variances assumed
.399 .529 .795 81 .429 .0030994 .003898554 -.00465745 .429 Blockiness
Equal variances not assumed
.839 80.66 .404 .00309 .003692883 -.00424872 .404
Equal variances assumed
.421 .518 -.093 81 .926 -.06772 .727829206 -1.5158789 .926 Weight
Equal variances not assumed
-.097 79.03 .923 -.067727 .700407236 -1.461842530 .923

161
T26 15-20 and 25-30 Independent Samples Test
Levene's Test for Equality of Variances t-test for Equality of Means
95% Confidence
F Sig. t Df
Sig. (2-tailed)
Mean Difference
Std. Error Difference Lower Upper
Equal variances assumed
.970 .328 .392 78 .696 .5843 1.4913 -2.3847 .696 Length
Equal variances not assumed
.387 61.411 .700 .5843 1.5095 -2.4338 .700
Equal variances assumed
.408 .525 -.551 77 .583 -.02041278 .037037824 -.094164 .583 Elongation
Equal variances not assumed
-.542 58.250 .590 -.02041278 .037651798 -.095741 .590
Equal variances assumed
.256 .614 .371 78 .711 .010977367 .029564073 -.047801 .711 Flatness
Equal variances not assumed
.367 61.223 .715 .010977367 .029951798 -.048905 .715
Equal variances assumed
2.257 .137 -.739 78 .462 -.00417591 .005650905 -.015260 .462 Blockiness
Equal variances not assumed
-.667 44.691 .508 -.00417591 .006257429 -.016781 .508
Equal variances assumed
3.859 .053 .019 78 .985 .017314022 .914786928 -1.80386 .985 Weight
Equal variances not assumed
.018 51.569 .986 .017314022 .972745303 -1.93507 .986
T26 20-25 and 25-30 cmbs Group Statistics
CMBS N Mean Std. Deviation Std. Error Mean
20-25 34 11.085 4.6827 .8031 Length
25-30 31 10.248 6.7105 1.2052
20-25 34 .69785464 .193225705 .033137935 Elongation
25-30 30 .73457752 .166460937 .030391470
20-25 34 .21006984 .081773891 .014024107 Flatness
25-30 31 .22025151 .133337628 .023948145
20-25 34 .03303606 .014267561 .002446866 Blockiness
25-30 31 .04031145 .031251576 .005612949
20-25 34 6.69901961 2.843712247 .487692627 Weight
25-30 31 6.61397849 4.636671653 .832770813

162
T26 20-25 and 25-30 cmbs Independent Samples Test
Levene's Test for Equality of
Variances t-test for Equality of Means
95% Confidence Interval
F Sig. t df Sig. (2-tailed)
Mean Differenc
e
Std. Error Difference Lower Upper
Equal variances assumed
3.396 .070 .587 63 .559 .8369 1.4250 -2.0108 3.6846 Length
Equal variances not assumed
.578 53.047 .566 .8369 1.4483 -2.0679 3.7417
Equal variances assumed
.631 .430 -.809 62 .422 -.036722 .045388608 -.12745341 .054007656 Elongation
Equal variances not assumed
-.817 61.970 .417 -.036722 .044964032 -.12665551 .053159792
Equal variances assumed
2.327 .132 -.375 63 .709 -.010181 .027168310 -.06447319 .044109871 Flatness
Equal variances not assumed
-.367 48.878 .715 -.010181 .027752283 -.06595478 .045592149
Equal variances assumed
3.410 .070 -1.225 63 .225 -.007275 .005937757 -.01914144 .004590275 Blockiness
Equal variances not assumed
-1.188 41.135 .242 -.007275 .006123100 -.01964001 .005089232
Equal variances assumed
6.690 .012 .090 63 .929 .0850411 .944759617 -1.8029333 1.97299260 Weight
Equal variances not assumed
.088 48.880 .930 .0850411 .965065451 -1.8544421 2.0245347
Table B9. Artifacts in T26-6 Compared with Artifacts in T26-7 by Depth
0-5 cmbs T26-6 and T26-7
Group Statistics
UNIT N Mean Std. Deviation Std. Error Mean
T26-6 33 8.400 4.2088 .7327 Length
T26-7 22 9.036 3.7710 .8040
T26-6 33 .74833593 .147826302 .025733256 Elongation
T26-7 22 .73776730 .167047076 .035614556
T26-6 33 .20133811 .082736317 .014402544 Flatness
T26-7 22 .16148918 .078920454 .016825897
T26-6 33 .03885951 .019672444 .003424533 Blockiness
T26-7 22 .02853551 .013215286 .002817508
T26-6 33 5.30505051 2.922246106 .508697752 Weight
T26-7 22 5.51818182 2.219126271 .473119311

163
0-5 cmbs T26-6 and T26-7 Independent Samples Test
Levene's Test for Equality of Variances t-test for Equality of Means
95% Conf Interval
F Sig. t df
Sig. (2-tailed)
Mean Difference
Std. Error Difference Lower Upper
Equal variances assumed
.072 .789 -.572 53 .570 -.6364 1.1122 -2.8672 1.5945 Length
Equal variances not assumed -.585 48.439 .561 -.6364 1.0877 -2.8229 1.5502
Equal variances assumed
.906 .346 .247 53 .806 .010568630 .042862201 -.07542058 .096539319 Elongation
Equal variances not assumed .241 41.269 .811 .010568630 .043938560 -.07814515 .099286776
Equal variances assumed
.004 .947 1.782 53 .080 .039848937 .022362174 -.00500393 .084701777 Flatness
Equal variances not assumed 1.799 46.622 .078 .039848937 .022148230 -.00471797 .084414971
Equal variances assumed
3.829 .056 2.155 53 .036 .010324003 .004789998 .000716483 .019931523 Blockiness
Equal variances not assumed 2.328 52.988 .024 .010324003 .004434611 .001429251 .019218755
Equal variances assumed
.110 .741 -.290 53 .773 -.21313113 .733772086 -1.6848976 1.258629110 Weight
Equal variances not assumed -.307 52.007 .760 -.21313133 .694705179 -1.6071574 1.180892119
5-10 cmbs T26-6 and T26-7
Group Statistics
UNIT N Mean Std. Deviation Std. Error Mean
T26-6 70 8.627 4.2997 .5139 Length
T26-7 15 9.300 5.5653 1.4370
T26-6 70 .70138766 .166285729 .019874946 Elongation
T26-7 15 .65300913 .127926446 .033030466
T26-6 70 .20291257 .087035330 .010402712 Flatness
T26-7 15 .16583715 .095656996 .024698530
T26-6 70 .03363284 .020889522 .002496775 Blockiness
T26-7 15 .02345501 .014915732 .003851225
T26-6 70 5.19095238 2.496405928 .298377579 Weight
T26-7 15 5.41555556 3.236813705 .835741705

164
5-10 cmbs T26-6 and T26-7 Independent Samples Test
Levene's Test for Equality of Variances t-test for Equality of Means
95% Conf Interval
F Sig. t df
Sig. (2-tailed)
Mean Difference
Std. Error Difference Lower Upper
Equal variances assumed
.965 .329 -.521 83 .604 -.6729 1.2912 -3.2409 1.8952 Length
Equal variances not assumed -.441 17.752 .665 -.6729 1.5261 -3.8823 2.5366
Equal variances assumed
2.815 .097 1.060 83 .292 .048378528 .045654210 -.04225859 .139182915 Elongation
Equal variances not assumed 1.255 25.300 .221 .048378528 .038548997 -.03066903 .127723959
Equal variances assumed
.338 .563 1.472 83 .145 .037075414 .025193925 -.01334290 .087185118 Flatness
Equal variances not assumed 1.383 19.285 .182 .037075414 .026799884 -.01861409 .093112238
Equal variances assumed
.397 .530 1.788 83 .077 .010177828 .00562516 -.00144356 .021500013 Blockiness
Equal variances not assumed 2.218 27.264 .035 .010177828 .004589752 .000764706 .019590951
Equal variances assumed
1.406 .239 -.299 83 .765 -.22460375 .749974301 -1.7162715 1.267065546 Weight
Equal variances not assumed -.253 17.738 .803 -.22460317 .887408236 -2.0995681 1.641748332
10-15 cmbs T26-6 and T26-7 Group Statistics
UNIT N Mean Std. Deviation Std. Error Mean
T26-6 61 10.316 6.9677 .8921 Length
T26-7 67 10.037 8.4209 1.0288
T26-6 61 .75430583 .140973459 .018049802 Elongation
T26-7 67 .72134668 .138608277 .016933696
T26-6 61 .22760438 .143257448 .018342237 Flatness
T26-7 67 .24031718 .122060164 .014912022
T26-6 61 .04132903 .025463180 .003260226 Blockiness
T26-7 67 .04093849 .027640103 .003376776
T26-6 61 6.69180328 5.200678929 .665878704 Weight
T26-7 67 6.52786070 7.350690196 .898029737

165
10-15 cmbs T26-6 and T26-7 Independent Samples Test
Levene's Test for Equality of Variances t-test for Equality of Means
95% Confidence
F Sig. t df
Sig. (2-tailed)
Mean Difference
Std. Error Difference Lower Upper
Equal variances assumed
.543 .463 .203 126 .839 .2791 1.3738 -2.4397 2.9978 Length
Equal variances not assumed .205 124.895 .838 .2791 1.3617 -2.4159 2.9741
Equal variances assumed
.007 .935 1.333 126 .185 .032959147 .024729879 -.0180557 .081898851 Elongation
Equal variances not assumed 1.332 124.453 .185 .032959147 .024749655 -.0160595 .081943890
Equal variances assumed
.395 .531 -.542 126 .589 -.01271200 .023462397 -.0591195 .033718595 Flatness
Equal variances not assumed -.538 118.474 .592 -.01271800 .023639079 -.0595671 .034097071
Equal variances assumed
.000 .998 .083 126 .934 .000390539 .004711979 -.0089330 .009715407 Blockiness
Equal variances not assumed .083 125.980 .934 .000390539 .004693793 -.0088983 .009679431
Equal variances assumed
.207 .650 .144 126 .885 .163942582 1.135686131 -2.083565 2.411432049 Weight
Equal variances not assumed .147 118.967 .884 .163942582 1.117967735 -2.049711 2.377636676
15-20 cmbs T26-6 and T26-7 Group Statistics
UNIT N Mean Std. Deviation Std. Error Mean
T26-6 30 10.567 6.5662 1.1988 Length
T26-7 19 11.253 6.1786 1.4175
T26-6 30 .75519268 .150014231 .027388726 Elongation
T26-7 19 .64938376 .145118574 .033292484
T26-6 30 .22579348 .128649531 .023488083 Flatness
T26-7 19 .23981108 .124463967 .028553992
T26-6 30 .03989961 .022289600 .004069506 Blockiness
T26-7 19 .03019211 .011759544 .002697824
T26-6 30 6.62888889 3.641299222 .664807241 Weight
T26-7 19 6.63508772 3.414827394 .783415133
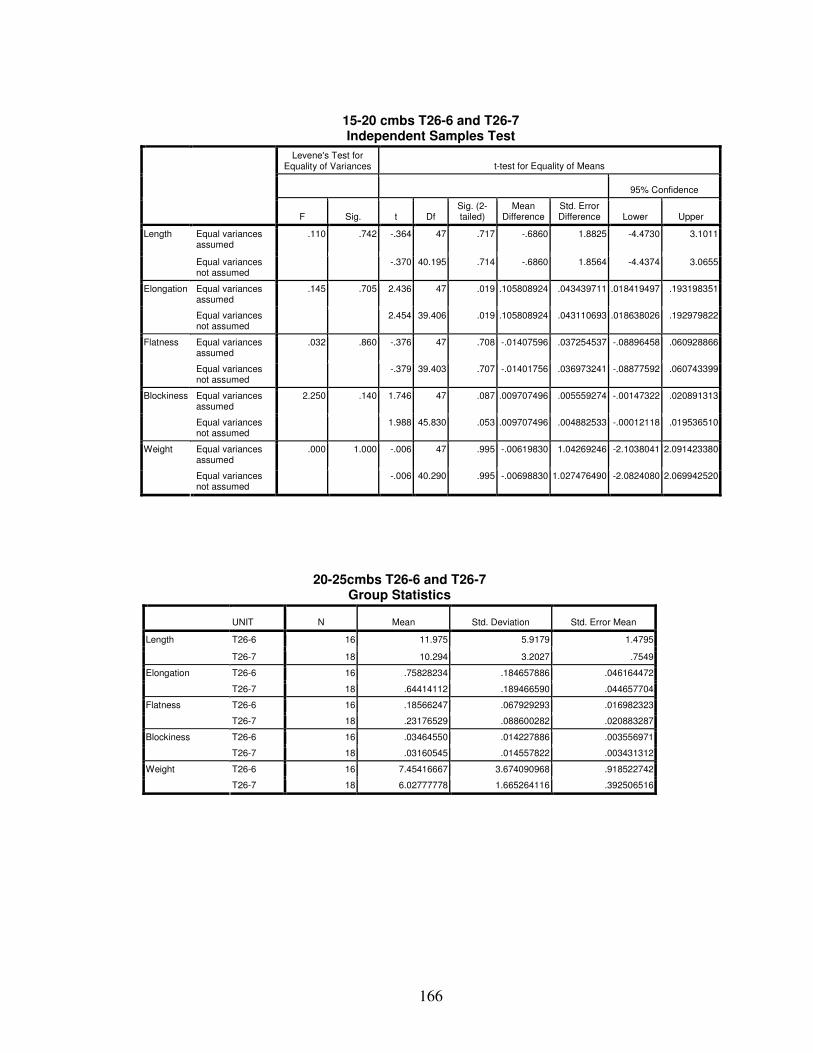
166
15-20 cmbs T26-6 and T26-7 Independent Samples Test
Levene's Test for Equality of Variances t-test for Equality of Means
95% Confidence
F Sig. t Df
Sig. (2-tailed)
Mean Difference
Std. Error Difference Lower Upper
Equal variances assumed
.110 .742 -.364 47 .717 -.6860 1.8825 -4.4730 3.1011 Length
Equal variances not assumed -.370 40.195 .714 -.6860 1.8564 -4.4374 3.0655
Equal variances assumed
.145 .705 2.436 47 .019 .105808924 .043439711 .018419497 .193198351 Elongation
Equal variances not assumed 2.454 39.406 .019 .105808924 .043110693 .018638026 .192979822
Equal variances assumed
.032 .860 -.376 47 .708 -.01407596 .037254537 -.08896458 .060928866 Flatness
Equal variances not assumed -.379 39.403 .707 -.01401756 .036973241 -.08877592 .060743399
Equal variances assumed
2.250 .140 1.746 47 .087 .009707496 .005559274 -.00147322 .020891313 Blockiness
Equal variances not assumed 1.988 45.830 .053 .009707496 .004882533 -.00012118 .019536510
Equal variances assumed
.000 1.000 -.006 47 .995 -.00619830 1.04269246 -2.1038041 2.091423380 Weight
Equal variances not assumed -.006 40.290 .995 -.00698830 1.027476490 -2.0824080 2.069942520
20-25cmbs T26-6 and T26-7 Group Statistics
UNIT N Mean Std. Deviation Std. Error Mean
T26-6 16 11.975 5.9179 1.4795 Length
T26-7 18 10.294 3.2027 .7549
T26-6 16 .75828234 .184657886 .046164472 Elongation
T26-7 18 .64414112 .189466590 .044657704
T26-6 16 .18566247 .067929293 .016982323 Flatness
T26-7 18 .23176529 .088600282 .020883287
T26-6 16 .03464550 .014227886 .003556971 Blockiness
T26-7 18 .03160545 .014557822 .003431312
T26-6 16 7.45416667 3.674090968 .918522742 Weight
T26-7 18 6.02777778 1.665264116 .392506516

167
20-25 cmbs T26-6 and T26-7 Independent Samples Test
Levene's Test for Equality of Variances t-test for Equality of Means
95% Confidence
F Sig. t df
Sig. (2-tailed)
Mean Difference
Std. Error Difference Lower Upper
Equal variances assumed
8.670 .006 1.046 32 .303 1.6806 1.6067 -1.5921 4.9532 Length
Equal variances not assumed 1.012 22.482 .322 1.6806 1.6609 -1.7597 5.1208
Equal variances assumed
.314 .579 1.774 32 .086 .114141224 .064330030 -.01689459 .245177207 Elongation
Equal variances not assumed 1.777 31.709 .085 .114141224 .064229813 -.01677790 .245020238
Equal variances assumed
1.736 .197 -1.686 32 .102 -.046102823 .027343788 -.10180296 .009594650 Flatness
Equal variances not assumed -1.713 31.371 .097 -.046102823 .026916741 -.10097612 .008767966
Equal variances assumed
.124 .727 .614 32 .543 .003040047 .004949137 -.00701015 .013121110 Blockiness
Equal variances not assumed .615 31.692 .543 .003040047 .004942261 -.00703852 .013110947
Equal variances assumed
14.472 .001 1.486 32 .147 1.426388889 .959652405 -.52839092 3.381136870 Weight
not assumed 1.428 20.379 .168 1.426388889 .998872060 -.65471905 3.507519683
25-30 cmbs T26-6 and T26-7 Group Statistics
UNIT N Mean Std. Deviation Std. Error Mean
T26-6 23 9.639 6.0420 1.2599 Length
T26-7 8 12.000 8.5749 3.0317
T26-6 22 .76405451 .173235401 .036933912 Elongation
T26-7 8 .65351580 .120513076 .042607807
T26-6 23 .22699072 .145755902 .030392207 Flatness
T26-7 8 .20087628 .094062808 .033256225
T26-6 23 .04404624 .034635800 .007222063 Blockiness
T26-7 8 .02957391 .015420779 .005452069
T26-6 23 6.46666667 4.679344252 .975710725 Weight
T26-7 8 7.03750000 4.800444341 1.697213373

168
25-30 cmbs T26-6 and T26-7 Independent Samples Test
Levene's Test for Equality of Variances t-test for Equality of Means
95% Confidence
F Sig. t Df
Sig. (2-tailed)
Mean Difference
Std. Error Difference Lower Upper
Equal variances assumed
2.502 .125 -.853 29 .401 -2.3609 2.7670 -8.0199 3.2982 Length
Equal variances not assumed -.719 9.536 .489 -2.3609 3.2830 -9.7245 5.0027
Equal variances assumed
1.685 .205 1.656 28 .109 .110538710 .066749270 -.02619971 .247268392 Elongation
Equal variances not assumed 1.960 18.071 .066 .110538710 .056387401 -.00789521 .228970942
Equal variances assumed
1.379 .250 .471 29 .641 .026114433 .055453894 -.08730516 .139530382 Flatness
Equal variances not assumed .580 19.293 .569 .026114433 .045051778 -.06808121 .120311987
Equal variances assumed
1.080 .307 1.134 29 .266 .014472329 .012767059 -.01163239 .040583896 Blockiness
Equal variances not assumed 1.599 26.832 .121 .014472329 .009048937 -.00409998 .033044655
Equal variances assumed
.248 .622 -.295 29 .770 -.57083333 1.932803737 -4.5238829 3.382194162 Weight
not assumed -.292 11.975 .776 -.57083333 1.957688600 -4.8373182 3.695576515

169
APPENDIX C

170
RADIOCARBON DATES

171

172

173