biogas industrial - user manual · biogas industrial user manual bioenergy and food security rapid...
TRANSCRIPT

BIOGAS INDUSTRIAL
User manual
Bioenergy and food security
Rapid appraisal (BEFS RA)

BIOGAS INDUSTRIAL
User manual
Bioenergy and food security
Rapid appraisal (BEFS RA)
By
Luis Eduardo Rincón
Contributors: Luis Gil, Valentina Hernández, Vicki Romo, Erika Felix,
Irini Maltsoglou
FOOD AND AGRICULTURE ORGANIZATION OF THE UNITED NATIONS
Rome, 2017

The designations employed and the presentation of material in this information product do not imply the
expression of any opinion whatsoever on the part of the Food and Agriculture Organization of the United
Nations (FAO) concerning the legal or development status of any country, territory, city or area or of its
authorities, or concerning the delimitation of its frontiers or boundaries. The mention of specific companies
or products of manufacturers, whether or not these have been patented, does not imply that these have
been endorsed or recommended by FAO in preference to others of a similar nature that are not
mentioned.
The views expressed in this information product are those of the author(s) and do not necessarily reflect the
views or policies of FAO.
ISBN 978-92-5-109750-2
© FAO, 2017
FAO encourages the use, reproduction and dissemination of material in this information product. Except
where otherwise indicated, material may be copied, downloaded and printed for private study, research and
teaching purposes, or for use in non-commercial products or services, provided that appropriate
acknowledgement of FAO as the source and copyright holder is given and that FAO’s endorsement of users’
views, products or services is not implied in any way.
All requests for translation and adaptation rights, and for resale and other commercial use rights should be
made via www.fao.org/contact-us/licence-request or addressed to [email protected].
FAO information products are available on the FAO website (www.fao.org/publications) and can be
purchased through [email protected].
This publication has been printed using selected products and processes so as to ensure minimal environmental impact and to
promote sustainable forest management.

BEFS Rapid Appraisal – Biogas industrial component User manual
iii
Contents
Acknowledgements .................................................................................................................................... vi
1 Overview of the energy end use option (end use) module ..................................................................... 1
2 The Biogas industrial component ......................................................................................................... 3
3 Terms and definitions used in the biogas industrial component ............................................................ 5
4 Scope and objective of the biogas industrial component ....................................................................... 7
5 Running the biogas industrial component ............................................................................................. 8
5.1 Step 1: Biogas use selection .................................................................................................................. 10
5.2 Step 2: Number of processes and operation mode selection ............................................................... 13
5.3 Step 3: Defining the feedstock .............................................................................................................. 14
5.4 Step 4: Production cost and financial parameters ................................................................................ 20
5.5 Step 5: Calculation of the production cost ............................................................................................ 22
6 Assumptions and limitations of the biogas industrial component ........................................................ 24
7 The results of the biogas industrial component................................................................................... 25
7.1 Overview of the production cost calculation (optional)........................................................................ 25
7.2 The summary results comparative ........................................................................................................ 26
7.3 The summary of results by process ....................................................................................................... 28
8 Annex ................................................................................................................................................ 31
8.1 Methodology and outputs ..................................................................................................................... 31
8.1.1 Cost calculation of required inputs ............................................................................................... 31
8.1.2 Cost calculation of required labour ............................................................................................... 32
8.1.3 Cost calculation of required transportation .................................................................................. 32
8.1.4 Cost calculation of storage ............................................................................................................ 32
8.1.5 Fixed cost calculation .................................................................................................................... 33
8.1.6 Calculation of other costs .............................................................................................................. 35
8.1.7 Total production cost and unit cost of electricity calculation ....................................................... 36
8.2 Data requirements for running the tool ................................................................................................ 37
8.3 New feedstock creator wizard ............................................................................................................... 40
8.4 Recalculate plant size ............................................................................................................................ 43
8.5 List of feedstock included in biogas industrial tool ............................................................................... 44
8.6 Codigestion rates ................................................................................................................................... 47
9 References ........................................................................................................................................ 47

BEFS Rapid Appraisal – Biogas industrial component User manual
iv
Figures
Figure 1: The Structure of the energy end use option module ................................................................................................ 1
Figure 2: Biogas production system at the industrial level ....................................................................................................... 3
Figure 3: Layout of the biogas – Industrial results sheets ........................................................................................................ 4
Figure 4: Rapid appraisal tool for heat and power ................................................................................................................... 8
Figure 5: The Biogas industrial component: flow of analysis and inter-linkages with BEFS RA modules and
components ............................................................................................................................................................... 9
Figure 6: Final use of biogas – option 1 .................................................................................................................................. 12
Figure 7: Final use of biogas – options 2 through 4 ................................................................................................................ 13
Figure 8: Number of processes and operation mode selection .............................................................................................. 14
Figure 9: Feedstock selection ................................................................................................................................................. 14
Figure 10: Biomass distribution throughout the year............................................................................................................. 15
Figure 11: Feedstock price and feedstock storage cost .......................................................................................................... 16
Figure 12: Collection cost when no collection method is required ........................................................................................ 17
Figure 13: Feedstock price calculation using the traditional calculator (method 1) .............................................................. 18
Figure 14: Selection of collection method for manure ........................................................................................................... 18
Figure 15: Cost of collection method of manure for method 2 .............................................................................................. 19
Figure 16: Cost of collection method of manure for method 3 .............................................................................................. 19
Figure 17: General inputs ....................................................................................................................................................... 22
Figure 18: Production cost calculation ................................................................................................................................... 23
Figure 19: Processing costs for power generation.................................................................................................................. 23
Figure 20: Detail of production costs of biogas production by capacity ................................................................................ 26
Figure 21: Techno-economic results ....................................................................................................................................... 27
Figure 22: Socio-economic and financial results for households ........................................................................................... 28
Figure 23: Socio-economic and financial results for industries .............................................................................................. 28
Figure 24: Layout of comparative results ............................................................................................................................... 30
Figure 25: Input new feedstock .............................................................................................................................................. 40
Figure 26: New feedstock creator........................................................................................................................................... 40
Figure 27: Wastewater definition ........................................................................................................................................... 41
Figure 28: Other type of feedstock definition. Biogas potential defined by the user ............................................................ 42
Figure 29: Other feedstock definition. Biogas potential calculated by the tool ..................................................................... 42
Figure 30: Recalculate plant sizes ........................................................................................................................................... 43
Figure 31: Plant size definition ............................................................................................................................................... 43

BEFS Rapid Appraisal – Biogas industrial component User manual
v
Tables
Table 1: Type of reactor depending on the TS content ............................................................................................................ 7
Table 2: Estimated cost of storage ......................................................................................................................................... 20
Table 3: Inputs cost equations ................................................................................................................................................ 31
Table 4: Labour and miscellaneous cost equations ................................................................................................................ 32
Table 5: Transportation of feedstock cost equations ............................................................................................................. 32
Table 6: Storage cost equations .............................................................................................................................................. 33
Table 7: Equipment costs proxies ........................................................................................................................................... 33
Table 8: Other costs equations ............................................................................................................................................... 36
Table 9: Total production cost equations ............................................................................................................................... 36
Table 10: Data requirements for running the tool ................................................................................................................. 37
Table 11 Optimal codigestion rates from selected literature sources.................................................................................... 47

BEFS Rapid Appraisal – Biogas industrial component User manual
vi
Acknowledgements
The BEFS Rapid Appraisal was the result of a team effort to which the following authors, listed in alphabetical
order, contributed1: Giacomo Branca (Tuscia University, Viterbo), Luca Cacchiarelli (Tuscia University, Viterbo),
Carlos A. Cardona (National University of Colombia at Manizales), Erika Felix, Arturo Gianvenuti, Ana Kojakovic,
Irini Maltsoglou, Jutamanee Martchamadol, Jonathan Moncada, Luis Rincon, Andrea Rossi, Adriano Seghetti,
Florian Steierer, Heiner Thofern, Andreas Thulstrup, Monica Valencia (National University of Colombia at
Manizales) and Stefano Valle (Tuscia University, Viterbo).
Inputs and contributions were also received from Renato Cumani, Amir Kassam, Harinder Makkar, Walter
Kollert, Seth Meyer, Francesco Tubiello and his team, Alessio d’Amato (University of Rome, Tor Vergata) and
Luca Tasciotti.
We would like to thank the Bioenergy and Food Security Working Group in Malawi2 as well as the National
Biofuels Board3 and its Technical Working Group in the Philippines for their involvement in the pilot testing of
the BEFS Rapid Appraisal and the useful feedback provided. We also wish to extend our appreciation to Rex B.
Demafelis and his team from University of the Philippines Los Baños for their valuable support in the pilot testing
exercise.
The BEFS Rapid Appraisal benefited from feedback and comments provided at a peer review meeting held in
February 2014 in FAO Headquarters by Jonathan Agwe (International Fund for Agricultural Development), Adam
Brown (International Energy Agency), Michael Brüntrup (German Institute for Development Policy), Tomislav
Ivancic (European Commission), Gerry Ostheimer (UN Sustainable Energy for All), Klas Sander (The World Bank),
James Thurlow (International Food Policy Research Institute), Arnaldo Vieira de Carvalho (Inter-American
Development Bank), Jeremy Woods (Imperial College, University of London) and Felice Zaccheo (European
Commission). Useful feedback was also provided by Duška Šaša (Energy Institute Hrvoje Požar, Zagreb).
Furthermore, we would like to express our sincere gratitude to Ivonne Cerón Salazar, Federica Chiozza, Pia Maria
Dahdah, Luis Miguel Gil Rojo, Monique Motty, Andrea Rampa, Sergio Rivero, Vicky Romo, Simona Sorrenti and
Chengyi Wu for their assistance in finalizing the tools and documents.
1 Unless otherwise specified, all authors were affiliated to FAO at the time of their contribution.
2 The BEFS working group in Malawi comprises the following members: Ministry of Energy, Ministry of Lands, Housing, and Urban Development, Ministry of Finance, Ministry of Agriculture and Food Security, Ministry of Environment and Climate Change and Department of Forestry, Ministry of Industry and Trade, Ministry of Economic Planning and Development, Ministry of Labour and Vocational Training, Ministry of Transport and Public Infrastructure, Ministry of Information and Civic Education, Ministry of Local Government and Rural Development.
3 The National Biofuels Board is chaired by the Secretary of Department of Energy and includes the following members: Department of Trade and Industry, Department of Science and Technology, Department of Agriculture, Department of Finance, Department of Labour and Employment, Philippine Coconut Authority, Sugar Regulatory Administration.

BEFS Rapid Appraisal – Biogas industrial component User manual
vii
The work was carried out in the context of the Bioenergy and Food Security Rapid Appraisal project
(GCP/GLO/357/GER) funded by the German Federal Ministry of Food and Agriculture (BMEL).

BEFS Rapid Appraisal – Biogas industrial component User manual
viii
BEFS RA user manual volumes
I. Introduction to the approach and the manuals
II. Country status module
III. Natural resources module
1. Crops
Section 1: Crop production tool
Section 2: Crop budget tool
2. Agricultural residues
Crop residues and livestock residues
3. Woodfuel and wood residues
Section 1: Forest harvesting and wood processing residues
Section 2: Woodfuel plantation budget
IV. Energy end use options module
1. Intermediate or final products
Section 1: Briquettes
Section 2: Pellets
Section 3: Charcoal
2. Heating and cooking
Biogas community
3. Rural electrification
Section 1: Gasification
Section 2: SVO
Section 3: Combustion
4. Heat and power
Section 1: CHP (cogeneration)
Section 2: Biogas industrial
Transport
Ethanol and biodiesel

BEFS Rapid Appraisal – Biogas industrial component User manual
1
1 Overview of the energy end use option (end use) module
As explained in the general introduction of the BEFS RA training manual, the energy end use option module is
used to assess the techno-economic and socio-economic viability of different bioenergy production pathways.
The module is divided into five sections, these are: intermediate or final products, heating and cooking, rural
electrification, heat and power and transport. Each of the sub-modules includes a choice of components of
analysis to assess the production of specific biofuels based on particular processing technologies, as depicted in
Figure 1. This module builds up from the information generated in the Natural resources modules in relation to
feedstock. For a more detailed description of the module, refer to the general introduction of the training
manual.
Figure 1: The Structure of the energy end use option module
A general description of each of the sub-modules and their respective components of analysis are presented
below. A more detailed discussion on each of the components of analysis will be provided in the respective user
manual.
The intermediate or final products sub-module is used to assess the viability of producing briquettes, pellets
and charcoal. The Briquettes/Pellets components are used to evaluate the potential to develop the production
of biomass briquettes/pellets to supply energy for heating and cooking in rural and urban households. The
objective of the analysis is to generate information on production cost, biomass requirements and financial
viability and social parameters to help users in their decision to promote briquette/pellet production in the
country. The Charcoal component is used to compare existing charcoal production technologies with improved
and more efficient technologies. The aim of the analysis is to assess the required upfront capital cost of the
improved technologies, the financial viability from the standpoint of charcoal producers and the social and
environmental benefits that improved technologies can trigger when compared to existing charcoal production
technologies. The results generated by the analysis inform on potential barriers for the uptake of the improved
charcoal technologies by producers and help define how to effectively disseminate their introduction.
The Heating and cooking sub-module is used to assess the viability of producing biogas at the community level.
The Biogas community component is used to evaluate the potential to develop biogas production from livestock
manures at the household and community levels and compares three different types of technologies. The
BEFS Rapid Appraisal – Biogas industrial component User manual
2
component generates information on: 1) the amount of biogas that can be produced based on manure
availability, 2) the size of biodigester needed to harness the energy, 3) the installation cost of three types of
biodigester technologies. The component biogas industrial also provides financial social and economic
parameters to help the user understand the potential opportunities and the requirements needed for deploying
biogas technology in their countries.
The Rural electrification sub-module is used to assess the viability of supplying electricity from local biomass
resources in remote areas without access to the electric grid. The sub-module is comprised of three
decentralized-based technology pathways for electrification, these are: gasification, use of straight vegetable oil
(SVO) and combustion. The results from this sub-module generate estimates of the cost of electricity generation
and distribution, calculates the financial viability of electrification and informs on the associated social and
economic outcomes for each alternative technology pathway. The Gasification component analyses the partial
burning of biomass to generate a gas mixture that is subsequently combusted in gas engines to produce
electricity. The Straight vegetable oil (SVO) component builds on from the Crops component in the Natural
Resources module. It assesses the potential to substitute diesel with SVO in generators to produce electricity.
The Combustion component assesses the burning of biomass to produce steam which drives a turbine to
produce electricity.
The Heat and power sub-module is used to assess the viability of the production of electricity and heat from
local biomass resources. The sub-module is comprised of two decentralized-based technology pathways for
electrification and heat, these are: CHP (cogeneration) and biogas industrial. The results from this sub-module
generate estimates of the cost of electricity/heat generation and distribution, calculates the financial viability of
electrification/heat and informs on the associated social and economic outcomes for each alternative
technology pathway. The CHP (cogeneration) component examines the potential for the simultaneous
production of electricity and heat from a biomass source, allowing the user to analyse a factory integrated
production or a standalone operation for pure grid electricity generation. The Biogas industrial component
evaluates the potential to develop a biogas-based industry for electricity, heat, CHP or upgraded biogas. This is
done by using waste water, high moisture solids, low moisture solids or a combination of these. All technology
pathways are based on simple and readily available technologies that can be easily adaptable to remote rural
areas.
The Transport sub-module is used to assess the viability of producing liquid biofuels for transport, namely
ethanol and biodiesel. The analysis builds on the results generated from the Natural Resources’ components in
terms of feedstock availability and the crop budget. The tool covers ethanol and biodiesel. In the ethanol
sections the users can assess the potential for developing the ethanol industry in the country. Likewise in the
biodiesel section, the potential for developing the biodiesel industry is assessed. The analyses generates results
on the cost estimates for the production of the selected biofuel based on feedstock origin, i.e. smallholder,
combination smallholder/commercial or commercial, and according to four predefined plant capacities, namely
5, 25, 50 and 100 million litres/year4. The results also consist of information on economic feasibility and socio-
economic parameters. In this component, the user has the option to include into the assessment a GHG
emissions analysis that covers the whole supply chain of the selected biofuels.
4 The selection of the predefined plant capacities is based on a review of relevant literature; please see the Transport manual for further details.
BEFS Rapid Appraisal – Biogas industrial component User manual
3
Another option for the user is to utilise the pretreatment calculator prior to using the energy end use tools5.
This allows the user to calculate the additional costs of pre-processing the biomass selected in order to obtain
the specific conditions required for the final biomass conversion for energy end use.
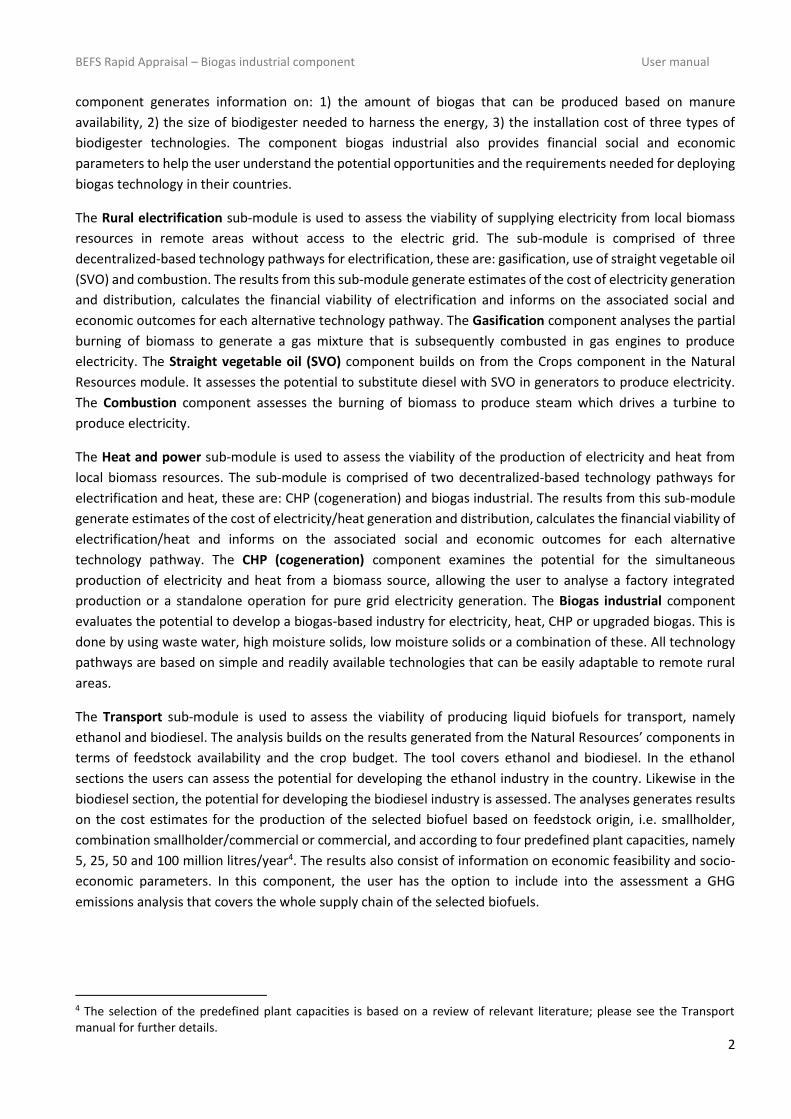
2 The Biogas industrial component
The Biogas industrial component is designed to assist the user in evaluating the potential to develop industrial-
scale biogas production from different organic materials with one of the following objectives: electricity
production, heat and electricity production, heating and/or cooking, and selling the biogas to the natural gas
line. The boundary of the biogas industrial analysis is shown in Figure 2. The tool is based on extensive literature
review. The detailed assumptions and calculations used to develop the tool are provided in the Annex.
Figure 2: Biogas production system at the industrial level
After completing the analysis, the user will have an indication on: 1) the production cost of the main product
for various scales of biogas production as well as the share of production cost and the total investment cost; 2)
the feedstock consumption and demand for each production scale; 3) the annual feedstock distribution; 4) the
number of plants and consumers potentially supplied; and 5) the employment generation potential and
financial viability associated to each level of production as shown in Figure 3. The user will also be able to
compare across different process and plant capacities to identify the most appropriate biomass sources based
on a number of factors including physical availability, economic and social results.
5 The pretreatment calculator can be used prior to utilising the energy end use tools. The exceptions are the Biogas community and transport tools, as these tools already include pretreatment.

BEFS Rapid Appraisal – Biogas industrial component User manual
4
Figure 3: Layout of the biogas – Industrial results sheets

BEFS Rapid Appraisal – Biogas industrial component User manual
5
3 Terms and definitions used in the biogas industrial component
This section includes the definitions of specific terms used in the biogas industrial component. It is important to
anticipate these definitions and consider them throughout the analysis, as to be able to interpret the results
correctly.
Biogas is a clean, efficient and renewable source of energy produced during anaerobic digestion (AD)
of wastewater, organic wastes and biomass. During the biological conversion of the organic material in
an oxygen-free environment, biogas and bio-fertilizers are obtained as useful end products. Biogas can
be effectively used in simple gas stoves for cooking and in lamps used for lighting in rural areas. It can
substitute the use of fuelwood, charcoal or kerosene. Besides, it is a renewable energy source and CO2
neutral, mainly composed of methane and carbon dioxide. The biogas can be used to generate heat
and/or electricity by burning it, as feedstock to produce methanol and chemical feedstock to replace
carbon and coal, among others applications.
The Upflow Anaerobic Sludge Blanket (UASB) is the most used technology for wastewater treatment
worldwide (Strezov and Evans, 2015, Chan et al., 2009, Abbasi et al., 2012). In an UASB, a gas collection
device replaces the packing material. These biodigesters operate in upflow mode, feeding the influent
by the bottom, going through dense sludge bed with high microbial activity and a gas-liquid-solid
separation device (Strezov and Evans, 2015, Chan et al., 2009). This separator device allows separating
the liquid effluent, that flows out from the reactor from the solid sludge, that remains in the digester,
while biogas is collected (Strezov and Evans, 2015). The process is based on the natural immobilization
of anaerobic bacteria, forming 1-4 nm of diameter dense granules (Chan et al., 2009, Wang et al., 2005).
The Continuously Stirred Tank Reactor (CSTR) is the most common and easy to operate biodigester for
treating wastewater with high solid concentration and chemical oxygen demand (COD) values higher
than 30.000 mg/L (Chan et al., 2009, Wang et al., 2005). Usually the CSTR volumes ranges between 500
to 700 m3 with an organic loading rate (OLR) ranging from 1-4 kg organic dry matter per m3 per day
(Wang et al., 2005). The CSTR digester is mostly used to stabilize the sludge by converting the
biodegradable fractions into biogas (Massoud et al., 2007). It is usually operated at high temperatures,
to increase the process rates. CSTR digestion units are designed in big volumes that make perfect mixing
difficult. Mixing is done mechanically or by recycling either flow or the produced biogas. Therefore, the
mixing efficiency is an important factor in modelling the solids transport in the reactor and evaluation
of the Solids Retention Time (SRT). Materials with very high COD loading rates (30 kg per m3 per day)
can be digested using this technology, reaching an adequate treatment at lower Hydraulic Retention
Times (HRT) (even 4 hours) (Wang et al., 2005). Generally, a removal efficiency of 85-95% of the COD
of the inlet material and a methane content in the produced biogas of 80-95% have been reported for
this type of digestion (Chan et al., 2009, Wang et al., 2005).
The Plug Flow Reactors (PFR) have a constant volume, but produce biogas at a variable pressure. The
size of such digesters varies from 2.4 to 7.5 m3. PFR digesters consist of a narrow and long tank with an
average length to width ratio of 5:1. The inlet and outlet of the digester are located at opposite ends,
kept above ground, while the remaining parts of the digester is buried in the ground in an inclined
position. As the fresh substrate is added from the inlet, the digestate flows towards the outlet at the
other end of the tank. The inclined position makes it possible to separate acidogenesis and
methanogenesis longitudinally, thus producing a two-phase system (Rajendran et al., 2012). Although
the optimal digestion in PFRs is reached at thermophilic conditions, they can be also operated at
mesophilic temperatures (Strezov and Evans, 2015). Under thermophilic conditions the HRT is usually
of 15 to 20 days. In order to avoid temperature fluctuations during the night and to maintain the process
BEFS Rapid Appraisal – Biogas industrial component User manual
6
temperature, a gable or shed roof is placed on top of the digester to cover it, which acts as an insulation
both during day and night (Rajendran et al., 2012). The optimal solids concentration of the feed is in
the range of 11% to 14% (Abbasi et al., 2012).
In a batch reactor the biomass is loaded once and discharged until the end of the process. Because of
its simplicity and portability, batch reactors are a good option for treating biowaste in countries
where landfilling is the most common waste management method utilized (Abu-Reesh, 2014). Batch
reactors function similar to a landfill, but at higher temperatures and with continuous leachate
recirculation the biogas yield is between 50 and 100 percent higher than in landfills (Mogal, 2013).
Another advantage of batch fermentation is the possibility to recover recyclables and other materials
after the anaerobic fermentation is completed (Mogal, 2013). As the batch digestion is simple and
requires less equipment and lower levels of design work, it is typically a cheaper form of digestion
(Baskar et al., 2012).
In batch biodigestion, the reactor is loaded once and discharged until the end of the anaerobic process
takes place. Because of its simplicity and portability, batch reactors are a good option for treating
biowaste in countries where landfilling is the most common waste management method utilised. Batch
reactors function similar to a landfill, but at higher temperatures and with continuous leachate
recirculation. The biogas yield is between 50 and 100 percent higher than in landfills (Vandevivere et
al., 1999). Another advantage of batch fermentation is the possibility to recover recyclables and other
materials after the anaerobic fermentation is completed. On the other hand, extra safety must be taken
to avoid explosions when unloading the reactor after the digestion is complete.
The Hydraulic Retention Time (HRT) is defined as the time that the influent remains into the digester
(Kangle et al., 2012). The HRT depends on the technology, temperature and feedstock composition. For
instance, for mesophilic digestion the HRT ranges between 10 to 40 days, while for thermophilic
operation, lower HRT are required (approximately 14 days for high solids reactors). The HRT influences
the economics of the digestion. For shorter retention times, smaller biodigesters are required, and
therefore, have more favourable economics (Parawira, 2004). The numeric definition of this parameter
is given by the following equation.
Where θ is the HRT (d), V is the volume of the reactor (m3) and Q is the influent flow rate (m3/d).
The operational temperature for biogas production determines the species of methanogens in the
digesters. For instance, mesophilic digestion is performed at 30 to 40°C, where mesophiles are the
primary microorganism present. For temperatures between 50 to 60°C, thermophilic degradation
occurs, where thermophiles are the primary microorganisms present (Wang et al., 2014). The reaction
rate of biological processes strongly depends on the growth rates of the involved microorganisms that
are temperature-dependent. Usually high temperatures lead to faster chemical and biological reaction
rates. Besides, temperature should be kept constant as much as possible during all the process, since
fluctuations of even ±2% can reduce the biogas production in 30% for thermophilic operation (Zupančič
and Grilc, 2012).
The Total Solids (TS) content in anaerobic digestion can be divided into two different ranges: low solid
content (LS) also called liquid anaerobic digestion, containing between 15 to 20% of TS and high solid
(HS) or solid state anaerobic digestion, with a range between 22 to 40% of TS (Kangle et al., 2012,
Monnet, 2003, Arsova, 2010). Municipal solid wastes and sludge from aerobic wastewater treatment
are digested under low-solids conditions. Since these systems contain a large volume of water, liquid
AD requires higher retention time and size for too low nutrient levels (Massoud et al., 2007).
Q
V

BEFS Rapid Appraisal – Biogas industrial component User manual
7
For substrates having higher solids content, solid state anaerobic digestion (SS-AD) technology should
be applied (Abbasi et al., 2012). SS-AD can be used to degrade food industry wastes, the biodegradable
organic fraction of municipal solid waste, agricultural and forestry residues, and other high-solids
wastes (Rajendran et al., 2012, Li et al., 2015, Brown et al., 2012). Typically, high-solids wastes must be
mixed with water or a low-solids waste, e.g. wastewater treatment sludge, to dilute the solids content
to the operating range (Yang et al., 2015). TS contents up to 30% have minimal effects on conversion
rates and efficiency. However, TS contents range between 30 to 50% causes inhibition of AD because
of the building-up of volatile fatty acids (Liew, 2011). The most used TS content for SS-AD ranges
between 20% and 40% (Liew, 2011) (Table 1).
Table 1: Type of reactor depending on the TS content
Substrate Reactor options
Low total solids content (<15%)
Examples: soluble industrial wastewater,
municipal sewage, sewage sludge,
aquatic/marine plants, particulate industrial
wastes, animal manures
Anaerobic filter
Upflow Anaerobic Sludge Blanket Reactor (UASB)
Fluidized Bed Reactor
Continuous stirred tank reactor (CSTR)
Solids concentrating reactor (SOL-CON)
High total solids content (>15%)
Examples: municipal solid waste, agricultural
residues, energy crops
Continuous stirred tank reactor (CSTR)
Leach bed reactor (e.g. SEBAC-sequential batch anaerobic
composting)
Source: Adapted from (Lai et al., 2009)
4 Scope and objective of the biogas industrial component
The aim of the biogas industrial component is to assess the potential of developing biogas production at the
industrial level from different types of organic raw materials, such as crop residues, manure, wastewater, etc.,
to be used for different purposes, i.e. heat and electricity, heating and/or cooking, only electricity and biogas for
the natural gas line. It provides the user with a technical foundation to identify the viability of producing biogas.
The results present the financial analysis for the selected biodigester and raw materials and the socio-economic
benefits that biogas production involves.
The following section describes the flow of analysis and options within this component. The background
methodology for the biogas industrial financial analysis, feedstock collection and feedstock storage is described
in detail in the Annex.

BEFS Rapid Appraisal – Biogas industrial component User manual
8
Figure 4: Rapid appraisal tool for heat and power
5 Running the biogas industrial component
The flow of analysis within the biogas industrial component and the inter-linkages it has with other components
is depicted in Figure 5. The user has the choice to select the components of analysis in a different order or even
omit some components. It is, however, strongly recommended that the user follows the order and flow of
analysis as described below, given that the Biogas industrial component relies on the information generated in
the Natural resources module and information can be cross-referenced with other modules to contextualize the
results of the analysis. The results of this component are essential for the comprehensiveness of the analysis.
When interpreting the results, the user should take into account all relevant factors, particularly aspects related
to food security, agricultural trade and the sustainable use of natural resources.

BEFS Rapid Appraisal – Biogas industrial component User manual
9
Figure 5: The Biogas industrial component: flow of analysis and inter-linkages with BEFS RA modules and components
The user navigates step by step through the options and is asked to input necessary data to obtain final results.
When the required data are limited or unavailable, then the default values provided by the tool can be utilised.

BEFS Rapid Appraisal – Biogas industrial component User manual
10
The navigation buttons are placed on the top and bottom of each sheet, indicating the next step with the button
“NEXT>>” and allowing the user to return to a previous section with the “<<BACK” button.
The following sub-chapters describe each step of the analysis required to operate the biogas industrial tool. All
input parameters are based on a generic situation.
5.1 Step 1: Biogas use selection
The user will:
1. Select the final use for the obtained biogas (
2. Figure 6, label 1). In this tool four possible final uses are considered:
a. Option 1: Heat and electricity,
b. Option 2: Heating and/or cooking,
c. Option 3: Electricity only; and
d. Option 4: Connection to natural gas line.
For this example, heat and electricity production was selected as the final use for the obtained biogas.

BEFS Rapid Appraisal – Biogas industrial component User manual
11
3. Define market prices and consumption of each energy type at the household level (
4. Figure 6, label 2).
5. Define the electricity market price and consumption at the household level (
6. Figure 6, label 3).

BEFS Rapid Appraisal – Biogas industrial component User manual
12
7. Define the electricity and heat market price and consumption at the industrial level (
8. Figure 6, label 4).
Figure 6: Final use of biogas – option 1
Depending on which of the options for the final use is selected, the data required varies. The market prices and
consumption for different energy types are needed at both the household and industrial level. Additionally, for
option 2 and 4, the user must also decide whether or not to include biogas transport and distribution to final
consumers. Lastly, for option 4, the user must input the distance between the plant and the connection point.

BEFS Rapid Appraisal – Biogas industrial component User manual
13
Figure 7: Final use of biogas – options 2 through 4
5.2 Step 2: Number of processes and operation mode selection
Before proceeding with the analysis, the user can choose to load the default values for running this component by
clicking on the “Load Default Values” button as shown in Figure 8, label A.
Biogas industrial tool allows user to compare up to 4 processes, under 3 operation modes. In order to start the
analysis the user will:
1. Define the number of processes to analyse in order to perform comparisons (Figure 8, label 1).
2. Select the operation mode among the following options:
a. Single feedstock: When only one single feedstock is used throughout the year (Figure 8, label 2).
b. Multi-feedstock: Up to 5 feedstock options can be used throughout the year. But only one option
can be allocated to each month (Figure 8, label 3).
c. Optimized co-digestion: Up to 5 feedstock
options can be used throughout the year, plus 1
main co-digestion feedstock. All
combinations are accepted. Use of manure
or wastewater as co-digestion6 feedstock is
required (Figure 8, label 4).
6 “Co-digestion is the simultaneous anaerobic digestion of multiple organic wastes in one digester. Co-digestion is used to increase methane production from low-yielding or difficult to digest materials. For the co-digestion process, care must be taken to select compatible feedstock’s that enhance methane production (and to avoid materials that may inhibit methane generation).” Extracted from: Prabhu, A., Raja, S. & Lee, C. 2014. Biogas production from biomass waste: a review. IJIRT, 1, 73-83.
For this example, 4 processes were
compared under optimized co-
digestion with manure as the co-
digestion feedstock.

BEFS Rapid Appraisal – Biogas industrial component User manual
14
Figure 8: Number of processes and operation mode selection
5.3 Step 3: Defining the feedstock
Step 3. A Selection of the feedstock
The user will:
1. Select the main feedstock category from the dropdown menu (Figure 9, label 1). This list includes 12
options: biodiesel/oilseed industry, crop residues, crops, dairy-milk industry, energy crops, ethanol-
sugar-starch industry, food processing residues, grass, other options, slaughterhouse wastes, yeast-
alcoholic beverages and manure. Once, the main feedstock category is selected, the user can select the
specific feedstock associated to this category (Figure 9, label 2). A list of all categories and feedstock
included can be found in Annex 8.5.
Figure 9: Feedstock selection
Based on literature review, optimal co-digestion should involve manure or wastewater as a co-
digestion feedstock in at least 50% contain (see Annex 8.6).

BEFS Rapid Appraisal – Biogas industrial component User manual
15
2. Enter data on the feedstock available (t/year) of the selected raw material (Figure 9, label 3). Most of
this information is generated in the Natural Resources module. Specific information for food processing
and biofuel industries must be collected directly by the user.
3. The volatile solids (VS) and total solids (TS) contents as well as the biogas potential (BMP) and its
methane composition (%) of the feedstock can be automatically generated from the technical database
in the tool if default values are selected (Figure 9, label 4). Although these values can be also defined by
the user when user defined is selected.
4. For optimized co-digestion, it is required to define the co-digestion feedstock to the main feedstock
ratio (Figure 9, label 5). For optimal co-digestion processes, the co-digestion feedstock (manure or waste
water) to main feedstock ratio should be higher than 50%. Besides, both feedstocks should be
compatible in order to preserve the microorganisms.
5. Define the co-digestion feedstock among two possibilities: manure or waste water (Figure 9, label 6).
The required co-digestion feedstock is automatically calculated by the tool based on the co-digestion
feedstock to main feedstock ratio. VS, TS, BMP and methane content can again be either defined by the
tool or by the user.
Step 3.B Feedstock available per month The Feedstock planner is a new feature presented in this tool. It allows the user to define the distribution of the
feedstock throughout the year (Figure 9, label B). The user will:
1. Define the monthly average environmental temperature in °C (Figure 10, label 1).
2. Distribute the feedstock available during the year, according to monthly availability. The user may also
use the spread button to automatically distribute the feedstock (Figure 10, label 2).
Figure 10: Biomass distribution throughout the year
Step 3.C Feedstock price (USD/t) The user has two options for determining the feedstock price:
For this example, the following feedstock for Process 1 were selected: Feedstock 1 “Barley straw”, Feedstock
2 “Maize Silage”, Feedstock 3 “Rye”, Feedstock 4 “Maize” and Feedstock 5 “Maize Grain Silage” (Figure 9).
Meanwhile, for Processes 2, 3 and 4 “Cheese waste”, “Mango wastes” and “Grass silage” were selected as
feedstocks, respectively.

BEFS Rapid Appraisal – Biogas industrial component User manual
16
A. If there is a current price in the country for this feedstock, the user clicks on the “Market Price”
(Figure 11, label 1) and directly inputs the price of the selected feedstock (USD/t) in the
corresponding cell.
B. If there is no current price for this feedstock, the user can estimate the feedstock price by clicking
on the “Use Calculator” (Figure 11, label 2) and selecting the “Price Calculator” (Figure 11, label 3).
Figure 11: Feedstock price and feedstock storage cost
The user will get a “warning” before continuing with
the use of the calculator, and the user will need to
enter:
1. The wage for both unskilled and skilled labour in
the “labour” section in unit of USD per person-
hour.
2. The working hours and price of diesel in the corresponding lines under “Feedstock collection”.
The “Price Calculator” assists the user in estimating the potential feedstock price, according to the following
options:
1. Raw materials such as food, market and industrial wastes: No collection method is required, since the raw material is already collected. In this case, the tool assumes that the feedstock does not have a price, so the user should define the feedstock price based on the transportation and/or market price (Figure 12).

BEFS Rapid Appraisal – Biogas industrial component User manual
17
Figure 12: Collection cost when no collection method is required
2. Raw materials such as crop residues and grass lands: The Traditional calculator is used and the user will
need to:
Select the biomass collection method from the
following options (Figure 13, label 1):
- manual
- semi-mechanized
- mechanized
Define the biomass yield in t/ha (Figure 13, label 2):
Enter the labour requirements (person-hour per
hectare) and the fuel needs (litres per hour)
associated with the selected biomass collection
method (Figure 13, label 3). To return to the
previous section, the user must click on the
“<<BACK Data Entry” button.
The calculator will automatically generate a feedstock price (Figure 11), and this value is transferred to the
“Data Entry Needs” worksheet for further calculation, when the user clicks on “<< BACK Data Entry” button
(Figure 13, label A).
Note: The type of labour and diesel required will depend on the collection method: manual, semi-mechanized and mechanized.
Guidance: The collection method can
be identified based on similar practices
currently applied in the country.
For this example, is considered that no collection method is required for Feedstock 2 “Maize Silage”, Feedstock 4
“Maize” and Feedstock 5 “Maize Grain Silage” (Figure 11).

BEFS Rapid Appraisal – Biogas industrial component User manual
18
Figure 13: Feedstock price calculation using the traditional calculator (method 1)
3. For raw materials such as manure and wastewater: An special Price calculator is used and the user will
need to:
Select the collection method for the feedstock (Figure 14, label 1) among the following options:
Figure 14: Selection of collection method for manure
A. Method 2: For collecting manure directly from stables or processing facilities. The user needs
to:
- Define the collection method (Figure 15, label 1).
- Select the data source either to use the default values or to define them manually (Figure
15, label 2).
- Define the operation cost of electricity, diesel, water make-up and unskilled workers (Figure
15, label 3), if the option of “user defined values” is selected.
- Define the capital investment cost (Figure 15, label 4), if the option of “user defined values”
is selected.
For this example, the selected Feedstock 1 “Barley straw” is assumed to be collected with “semi-mechanized”
method. The number of person-hours for skilled workers (machine operators) is 15 per hectare and for unskilled
workers is 10 per hectare, and the diesel consumption of the machine is 1.5 litres per hour. Using the information
that manual labour works 8 hours per day and machinery works 18 hours and diesel price of 1.48 USD per litre, a
proxy price of the feedstock is calculated at 39.51 USD/t (Figure 13).

BEFS Rapid Appraisal – Biogas industrial component User manual
19
Figure 15: Cost of collection method of manure for method 2
B. Method 3: For collecting and transporting manure from different farms to a central collection
point. The user needs to:
- Define the collection method (Figure 16, label 1).
- Define the transportation method (Figure 16, label 2).
- Select the data source to use the default values or to define them manually (Figure 16, label
3).
- Define the transport method requirements (Figure 16, label 4), if the option of “user defined
values” is selected.
- Define the number of farms supplying manure and the average distance from the farms to
the collection point (Figure 16, label 5).
- Define the labour cost (Figure 16, label 6), if the option of “user defined values” is selected.
- Define the collection machinery requirements (Figure 16, label 7), if the option of “user
defined values” is selected.
- Define the equipment requirements and its corresponding cost (Figure 16, label 8), if the
option of “user defined values” is selected.
Figure 16: Cost of collection method of manure for method 3

BEFS Rapid Appraisal – Biogas industrial component User manual
20
This special calculator will automatically generate a feedstock price (Figure 11), and this value is transferred
to the “Data Entry Needs” worksheet for further calculation only when the user clicks on << BACK Data Entry
button (Figure 14, label A). Otherwise the result will not be transferred.
4. For raw materials such as crops: Since these raw materials already have a market price, the user needs
to specify the feedstock price (Figure 11, label 4), and the cell is white even when “Use Calculator” is
selected.
5. The user will need to carry out similar steps for each feedstock chosen.
Step 3.D: Feedstock storage cost (USD/t) Step 2.C.1 The user can enter the existing prices of storage of agricultural products in the country as a
proxy. The price should be entered in the respective cell for each feedstock (USD/tonne). If this
information is not available, then the user should go to the next step.
Step 2.C.2 The user can determine a proxy for this value. The user will need to do the following:
1. Identify a type of feedstock storage likely associated with conditions of his/her country from
the options presented in Table 2.
2. For the selected storage option, look up the global building cost provided in Table 2.
3. Enter the proxy value (USD/tonne) in the respective cell for each feedstock (Figure 11, label 4).
Table 2: Estimated cost of storage
Estimated Cost of Storage Unit Min Average Max
Enclosed structure with crushed rock floor USD/tonne 10 12.5 15
Open structure with crushed rock floor USD/tonne 6 7 8
Reusable tarp on crushed rock USD/tonne n/a 3 n/a
Outside unprotected on crushed rock USD/tonne n/a 1 n/a
Outside unprotected on ground USD/tonne n/a 0 n/a
Source: (EPA, 2007)
5.4 Step 4: Production cost and financial parameters
General inputs required to run the operations are shown in Figure 17. The user will need to provide data on:
1. Utilities cost: the cost of water (USD/m3), caustic soda (USD/t), electricity (USD/kWh) and heat (USD/GI).
2. Labour cost (USD/person-hour): the labour rate for unskilled and skilled workers (USD per person per
hour). These parameters are required to calculate the feedstock price (as explained in Step 3.B) and the
labour cost of the combustion process.
For this example, all feedstock are stored on crushed rock and covered by a reusable tarp. Therefore, the cost of
storage is 0.55 USD/tonne. (User inputs the cost in the corresponding cells as shown in Figure 11, label 5).
For this example, it is considered that manure is collected using Method 2 with a flush system, obtaining a proxy
price of the feedstock of 16.81 USD/t (Figure 16).
For this example, Feedstock 3 “Rye” has a market price of 150 USD/t (Figure 11).

BEFS Rapid Appraisal – Biogas industrial component User manual
21
3. Feedstock collection: these parameters are required to calculate the feedstock price as explained in Step
3.B. The user enters the hours of labour required for manual labour, hours of labour required for running
the machinery and the price of diesel.
4. Market prices: the market prices of electricity (USD/kWh), heat (USD/GI), biogas (USD/m3), natural gas
(USD/m3) and digestate (USD/t).
5. Operating parameters: The user enters:
- Operating days per year
- Digestate recovery system (Sedimentator, floater, centrifuge, belt press, screen sieves or screw
press)
- Heat loss in production (%),
- Electricity loss in production (%),
- Storage safety rate of biogas (%),
- Solids recovery (%),
- Heat loss in distribution (%) and
- Electricity loss in distribution (%)
6. Other costs (%): The user enters the percentage of:
- Plant overhead,
- Maintenance,
- Miscellaneous and
- General and administrative cost,
These parameters are used to estimate the production cost of electricity.
7. Financial parameters: The user identifies the values for the following financial parameters:
- Loan ratio (For the 4 sizes) (%),
- Discount rate (%),
- Loan interest rate (%),
- Loan term (years) and
- Plant cost index.
The plant cost index data for equipment cost is obtained from technical literature and based on past technical
and economic conditions. Therefore, the Intratec chemical plant construction index (IC), a dimensionless index
used as a proxy to update the capital cost of a chemical plant, which accounts for price changes due to
inflation/deflation and economic conditions, is applied to the BEFS RA tool. This index is freely updated and
available on (http://base.intratec.us/home/ic-index).
For this example, the values shown in Figure 17 were used to carry out the analysis.

BEFS Rapid Appraisal – Biogas industrial component User manual
22
Figure 17: General inputs
5.5 Step 5: Calculation of the production cost
After entering the data in Steps 1 to 5, the
user can click on the “Production Cost” button
(Figure 18- label A).
Note: This section also shows the budgets for calculating
the processing cost. These calculations are done
automatically using the information entered by the user
in the previous steps and can be reviewed if needed (see
section 7.1 for more details).

BEFS Rapid Appraisal – Biogas industrial component User manual
23
Figure 18: Production cost calculation
This will take the user to the budget processing section for the selected feedstock (Figure 19).
Figure 19: Processing costs for power generation
In this worksheet, the user will need to enter additional data in the white cells, specifically on:

BEFS Rapid Appraisal – Biogas industrial component User manual
24
1. The transportation distance of feedstock to the biogas plant: The user
identifies an estimated distance, in kilometres, that will be
required to transport the feedstock. The transportation
distance depends on the availability of biomass in a
particular area and the amount of biomass required for
each production capacity (Figure 19-Label 1).
2. Technical parameters: The user will define:
- The type of digester choosing one of the following options
(Figure 19-Label 2): CSTR, plug flow, UASB or batch7.
- Depending on the operation temperature the user can define
mesophillic or thermophillic regime (Figure 19-Label 3).
- Specify the water make-up and the HRT (days) (Figure 19-Label 4).
3. Transport cost from the collection point to the biogas plant
Once all data is entered, the user must click on “<<BACK Data Entry” to return to the Data Entry Needs sheet. The
user can repeat the same steps for all the processes.
6 Assumptions and limitations of the biogas industrial component
Before starting the analysis, the user should become familiar with the assumptions and limitations of the tool
and take them into consideration during the analysis and most especially when interpreting the results.
The limitations of the biogas industrial component are:
1. Up to four processes can be assessed to carry out comparisons
2. For each process, a maximum of 5 main feedstocks. 1 additional feedstock can be analysed if co-
digestion feedstock is selected.
3. The business lifetime is considered to be 20 years for the financial analysis.
The details of key assumptions and calculation equations are presented in the Annex.
7 This option won’t be available fro co-digestion option
For this example the values that were used to carry out the analysis are: Type of fermentor: CSTR Temperature regime (°C): Thermophilic Water make-up: 15% HRT (days): 13.8 The transportation distance of feedstock to biogas plant: Distance for 250 kWe: 10 km Distance for 1000 kWe: 15 km Distance for 10000 kWe: 15 km Distance for 50000 kWe: 20 km The transport cost is 0.05 USD/t/km for all the feedstocks
These parameters are used for further analysis.
Guidance: The small-scale plants use less biomass compared to the medium and large-scale ones. Therefore, the distance of transportation could be shorter. If the availability of biomass in that area is high and sufficient enough to supply for all production scales of the plants, then the users can input the same transportation distance of feedstock for all production scales.

BEFS Rapid Appraisal – Biogas industrial component User manual
25
7 The results of the biogas industrial component
7.1 Overview of the production cost calculation (optional)
After user inputs all required data (Steps 1 to 5), then the user has the option to review the detailed production
cost as shown in Figure 20. There are five main sections in this worksheet as explained below.
- PART 1 (Figure 20-label 1) shows the distribution of production cost along the following categories:
inputs, labour and miscellaneous, transportation of feedstock, storage, investment, maintenance, plant
overhead, general and administrative cost and loan interest. The total production costs (USD/year) of
the three four capacities (250kWe, 1000kWe, 10000kWe and 50000kWe) are presented for comparative
analysis.
- PART 2 (Figure 20-label 2) shows the energy balance,
in terms of electricity production and consumption
in unit of kWh per year and heat production and
consumption in unit of GI per year. Finally the electricity
and heat for selling are also summarized. The results are
presented for all the capacities.
- PART 3 (Figure 20-label 3) shows the unit cost of biogas (USD per
unit product) for all the capacities.
- PART 4 (Figure 20, label 4) summarizes the loan details, e.g. loan amount, loan interest, annual loan
payment, etc., for financial analysis.
- PART 5 (Figure 20-label 5) the “Financial Analysis” buttons will open the worksheet with the details on
the financial analysis for each biogas production system.
- PART 6 (Figure 20-label 6) the “Detailed investment cost 1” button will open the worksheet with the
details on the investment cost for each biogas production system.
Note: Depending on the final use selected by the user, the plant will produce heat and electricity, heat and or electricity, only electricity or biogas to connect to the natural gas grid. The tool automatically takes part of the electricity and heat

BEFS Rapid Appraisal – Biogas industrial component User manual
26
Figure 20: Detail of production costs of biogas production by capacity
7.2 The summary results comparative
The information presented in this section aims at helping the user in the decision making process to support the
development of industrial-biogas production for power and heat generation in his/her country. The results aim
to answer the following questions:
What are the investment and production costs per unit of product for the various production capacities
and feedstock selections?
BEFS Rapid Appraisal – Biogas industrial component User manual
27
How much biomass and area are required to secure the supply of biomass for the development of biogas
systems?
How many potential biogas plants can be developed based on the availability of biomass?
How many households or industries can gain access to electricity through biogas productions?
How many jobs can be created through biogas production?
Which type of feedstock(s) might be more suitable and could be promoted for the biogas production?
What is the financial viability of the biogas system?
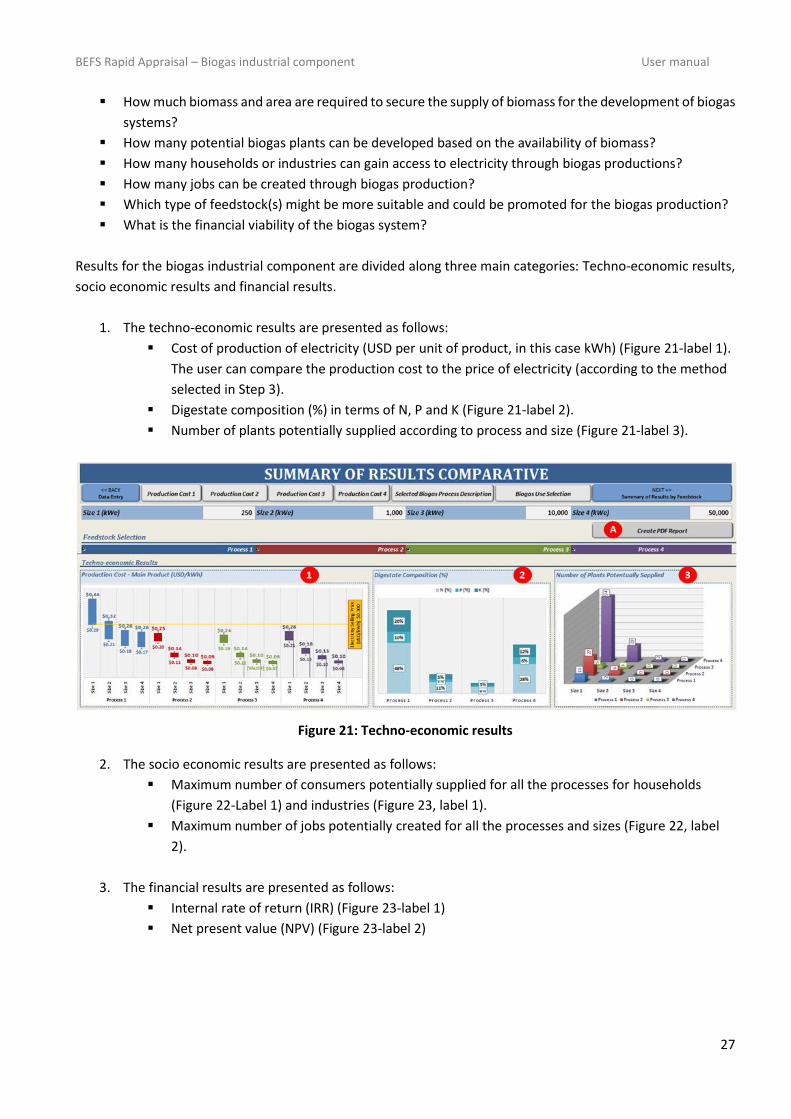
Results for the biogas industrial component are divided along three main categories: Techno-economic results,
socio economic results and financial results.
1. The techno-economic results are presented as follows:
Cost of production of electricity (USD per unit of product, in this case kWh) (Figure 21-label 1).
The user can compare the production cost to the price of electricity (according to the method
selected in Step 3).
Digestate composition (%) in terms of N, P and K (Figure 21-label 2).
Number of plants potentially supplied according to process and size (Figure 21-label 3).
Figure 21: Techno-economic results
2. The socio economic results are presented as follows:
Maximum number of consumers potentially supplied for all the processes for households
(Figure 22-Label 1) and industries (Figure 23, label 1).
Maximum number of jobs potentially created for all the processes and sizes (Figure 22, label
2).
3. The financial results are presented as follows:
Internal rate of return (IRR) (Figure 23-label 1)
Net present value (NPV) (Figure 23-label 2)

BEFS Rapid Appraisal – Biogas industrial component User manual
28
Figure 22: Socio-economic and financial results for households
Figure 23: Socio-economic and financial results for industries
The user can save and print the results in PDF format by using “Create a PDF report” and following the
instructions (Figure 21, label A).
7.3 The summary of results by process
The information presented in this section helps the user in the decision making process to develop biomass
combustion for power generation in rural areas. The user can compare the results across the different feedstock
selected in the analysis.
1. The user first selects the process to see the summary results from the dropdown menu (Figure 24-Label
1). The results for that specific process will be generated.

BEFS Rapid Appraisal – Biogas industrial component User manual
29
2. Comparison results are presented on:
Production costs of the main product for all the considered
sizes (USD/kWh) (Figure 24-label 2)
Share of production cost (%)(Figure 24-label 3)
Investment cost (USD) (Figure 24-label 4)
Feedstock consumption and demand (Figure 24-label 5)
Annual feedstock distribution (Figure 24-label 6)
Number of plants supported (Figure 24-label 7)
Consumers potentially supplied (Figure 24-label 8)
Number of jobs potentially created (Figure 24-label 9)
NPV (1000 USD/year) (Figure 24-label 10)
IRR (%)(Figure 24-label 11)
Digestate composition in N, P, K values (Figure 24-label 12)
Digestate production and income (Figure 24-label 13)
The user can save and print the results in PDF format by using “Create a PDF report” and following the
instructions (Figure 24, label A).
For sake of simplicity this section is presented for results obtained in single mode option
Guidance: These results can
help identify the type of
feedstock and electricity
production scale that is most
viable and should be
promoted for combustion
system.

BEFS Rapid Appraisal – Biogas industrial component User manual
30
Figure 24: Layout of comparative results

BEFS Rapid Appraisal – Biogas industrial component User manual
31
8 Annex
8.1 Methodology and outputs
This section describes the methodologies integrated in the biogas industrial component. It also includes a
description of the equations which support the analysis. The equations are not visible to the user, but their
structure and content might be important for those who will update them and/or work on the improvement
of the tool.
8.1.1 Cost calculation of required inputs
The required inputs consist of the cost of feedstock (biomass), cost of water, and cost of diesel consumption.
The equations used to calculate the cost of these items are presented in Table 3.
Table 3: Inputs cost equations
Item Equation and Assumption Remark Biogas Production 𝛾’=𝐵0 x S0 x [1−𝐾 / (𝐻𝑅𝑇 x 𝜇M−1+𝐾)]
Where: 𝛾’ is Volumetric methane production rate (m3/h) 𝐵0 is Biomethane potential S0 is influent VS concentration 𝜇M is Maximum specific growth rate (1/day) 𝐻𝑅𝑇 is Hydraulic retention time (day) 𝐾 is kinetic parameter
Modified Hashimotos’s kinetic model (Hashimoto et al., 1981, Hashimoto, 1983, Hashimoto, 1984, Hashimoto, 1986) 20°C < T < 60°C
Quantity of feedstock QF = BR (m3/year) / (𝛾’ x DE) Where: QF is Quantity of feedstock (tonne per year) BR is biogas rate (m3/year) DE is Digestor efficiency (%)
Default value of DE is assumed as 63%.
Water Make-up WM = QF x TS / (100 – TS) Where: WM is Water Make-Up (m3 per year) QF is Quantity of feedstock (tonne per year) TS is Total solids content (%)
Default value of MR is assumed as 35%.
Energy potential (EP) (MJ per year)
EP = BR (m3/year) x Cp (kWh/m3) x Operating hours per year x 3.6 Where, EP is Energy potential (MJ/year) BR is biogas rate (m3/year) Cp is the calorific capacity of biogas (kWh/m3) Operating hours per year= Operating hours per day x 365 days per year
Cp is assumed to be 6 kWh/m3 Operating hours per year entered by the user.
Power Generation (PG) (kWh per year)
PG = EP (MJ/year) x TE – (HG x 1000) / 3.6 Where, PG is Power generation (kWh/year) EP is Energy potential (MJ/year) TE is thermal efficiency (%) HG is Heat generation (MJ/year)
Thermal efficiency is assumed to be 60%
Heat Generation (HG) (kWh per year)
HG = EP (MJ/year) x TE – (EE x 1000) / (1 – EE / α) Where, HG is Heat generation (kWh/year)
Thermal efficiency is assumed to be 60%

BEFS Rapid Appraisal – Biogas industrial component User manual
32
EP is Energy potential (MJ/year) TE is thermal efficiency (%) EE is Electricity efficiency (%) α is Energy use factor
Electricity efficnecy is assumed to be 40% α is assumed to be 75%
8.1.2 Cost calculation of required labour
This step presents the equations and assumptions for calculating the labour and miscellaneous cost based
on the power generation capacity as shown in Table 4.
Table 4: Labour and miscellaneous cost equations
Item Equation and Assumption Remark Number of unskilled labour Unskilled labour = 0.42 x kWe x OP
Number of skilled labour skilled labour = (0.42 x kWe x OP) / 5
Total unskilled labour cost (USD per year)
Unit cost of unskilled labour x number of unskilled labour x operating hours per year
Unit cost of unskilled labour (USD/person/hour) Input entered by user in “Data Entry Needs” Operating hours per year same as Table 2.
Total skilled labour cost (USD per year)
Unit cost of skilled labour x number of skilled labour x operating hours per year
Unit cost of skilled labour (USD/person/hour) Input entered by user in “Data Entry Needs” Operating hours per year same as Table 2.
Miscellaneous cost (USD per year)
Percentage of miscellaneous cost (%) x (Total unskilled labour cost + Total skilled labour cost)
Percentage of miscellaneous cost input by user. Default value is 10%
Total labour cost (USD per year)
Total Unskilled labour cost + Total skilled labour cost + Miscellaneous cost
Note that miscellaneous costs consist of labour benefits, health & life insurance, operating supplies and/or laboratory charges (if any).
8.1.3 Cost calculation of required transportation
This step presents the calculation equations of transportation cost as shown in Table 5.
Table 5: Transportation of feedstock cost equations
Item Equation and Assumption Remark Transportation of feedstock (field to plant) (USD per year)
Unit transportation cost x Transportation distance x QF Where: QF is Quantity of feedstock (tonne per year)
Unit transportation cost (USD/tonne/km) and Transportation distance (km) entered by the user QF is calculated in Table 2.
8.1.4 Cost calculation of storage
Table 6 presents the calculating equations for estimating the storage cost.

BEFS Rapid Appraisal – Biogas industrial component User manual
33
Table 6: Storage cost equations
Item Equation and Assumption Remark Storage capacity (tonne/year) The estimate storage capacity in “Feedstock Planner”
worksheet by pressing on the “Feedstock planner”
According to the feedstock distribution designed by the user
Storage cost (USD per year) Unit storage cost x Storage Capacity Unit storage cost (USD/tonne) entered by user based on guidance provided in the manual.
8.1.5 Fixed cost calculation
Fixed cost consists of the cost associated with equipment, building, installation and distribution network.
Table 7 presents the equations and assumptions applied to calculate the fixed cost and the depreciation cost.
Table 7: Equipment costs proxies
Item Unit Cost
Pretreatment
Other (Hygenization, crushing, homogenization) USD/m3 BIOGAS $ 10.80
Pre-processing equipment USD/t feedstock $ 4.50
Equipments
Digester CSTR USD/m3 BIOGAS $ 174.6
Digester UASB USD/m3 BIOGAS $ 608.4
Digester plug flow USD/m3 BIOGAS $ 485.4
Digester batch USD/m3 BIOGAS $ 58.2
Effluence storage pool USD/m3 BIOGAS $ 87.1
Buffer tank USD/m3 BIOGAS $ 15.9
Odor control system USD/t feedstock $ 4.3
Metering pumps USD/t feedstock $ 2.0
Pumps USD/t feedstock $ 4.5
Trommel screen USD/t feedstock $ 5.5
Mixers USD/t feedstock $ 2.0
Post digestion tank (for gravity separation) USD/m3 BIOGAS $ 15.9
Gas collection equipment USD/t feedstock $ 7.5
Desulfurizing tower USD/m3 BIOGAS $ 0.9
Microturbines (30-500 kW) USD/kW $ 650.0
Combustion turbine (500 kW - 50 MW) USD/kW $ 650.0
Reciprocating engine (5 kW - 7 MW) USD/kW $ 600.0
Building
Building w/slab USD/t feedstock $ 6.4
50' Truck weighing scales USD/t feedstock $ 3.3

BEFS Rapid Appraisal – Biogas industrial component User manual
34
Foundation for scales inclu. const. USD/t feedstock $ 2.0
Front-End loader USD/t feedstock $ 5.9
Solids drying area concrete slab USD/t feedstock $ 9.6
Installation
Connection and earthing USD/kW $ 27.1
Land Preparation USD/t feedstock $ 8.7
Installation CSTR USD/m3 ch4/year $ 0.007
Installation UASB USD/m3 ch4/year $ 0.006
Installation plug flow USD/m3 ch4/year $ 0.003
Installation batch USD/m3 ch4/year $ 0.004
Infrastructure (fencing) USD/t feedstock $ 4.6
Infrastructure (roads) ($/ft2) USD/t feedstock $ 6.0
Electricity distribution network
Primary electricity cable USD/m $ 7.5
Secondary cable, installation and meter USD/household $ 164.0
Heat distribution System
Dwelling system USD/MJ $ 0.0014222
Biogas distribution System
Pipe system (Biogas distribution) USD/household $ 52.6
Pipe system (BIOMETHANE distribution) USD/m $ 108.7
Upgrade and connection to natural gas
Biogas upgrading, testing, and injection systems USD/m3/year $ 1.2
Connection to utility natural gas pipeline USD/m3/year $ 0.3
Item Equation and assumption Remark Equipment cost (EC) (USD)
The database of cost details is provided and adjusted by considering the replacement equipment that has the lifetime less than the project lifetime. EC at current period = EC (base year) x [Plant Cost Index (current period) / Plant Cost Index (base year)]
Plant cost index (current period) input by the user
Building cost (BC) (USD)
The database of cost is provided including: building of combustion system, gas engine, water pool, and civil work. BC at current period = BC (base year) x [Plant Cost Index (current period) / Plant Cost Index (base year)]
Plant cost index (current period) input by the user
Item Equation and assumption Remark Installation cost (IC) (USD)
The database of cost is provided including: feasibility study, development and engineering, installation,
Plant cost index (current period) input by the user

BEFS Rapid Appraisal – Biogas industrial component User manual
35
Erection, commissioning, training, shipping, duty, insurance, clearance, etc. IC at current period = IC (base year) x [Plant Cost Index (current period) / Plant Cost Index (base year)]
Distribution network cost (USD) (27.1 x Power capacity (kW)) + (7.5 x10 x Number of households access electricity) Where: Connection and earthing: 27.1 USD/kW. Primary electricity cable: 7.5 USD/m Average electricity cable length : 10 m/household
Total investment (USD) Equipment cost + Building cost + Installation cost + Distribution network cost
Equipment depreciation (USD per year)
Equipment cost divided by project life time Straight line method of depreciation calculation
Building depreciation (USD per year)
Building cost divided by project life time Straight line method of depreciation calculation
Installation depreciation (USD per year)
Installation cost divided by project life time Straight line method of depreciation calculation
Distribution network depreciation (USD per year)
Distribution network cost divided by project life time Straight line method of depreciation calculation
Total depreciation (USD per year)
Equipment Depreciation + Building Depreciation + Installation Depreciation + Distribution network Depreciation
Straight line method of depreciation calculation
Maintenance cost (USD per year)
Percentage of maintenance cost (%) x Total depreciation Percentage of maintenance cost input by the user. Default value is 10%.
Total of fixed cost (USD per year)
Total depreciation + Maintenance cost
Note: The plant cost index is used to update equipment, building and installation cost to the current period. Please visit this website for further information: http://en.wikipedia.org/wiki/Chemical_plant_cost_indexes. The assumption in this tool is that plant cost index can be applied to any type and size of plant. It provides an acceptable proxy to update the investment costs.
8.1.6 Calculation of other costs
The plant overhead is defined as a charge to the production for services, facilities and payroll overhead. The
general and administrative cost comprises rents, insurances, managerial, administrative and executive
salaries. Table 8 shows the equations for calculating the cost associated with plant overhead, general and
administrative cost, average loan interest payment and corporate tax.

BEFS Rapid Appraisal – Biogas industrial component User manual
36
Table 8: Other costs equations
Item Equation and assumption Remark
Plant overhead (USD per year) Percentage of plant overhead (%) x (total labour cost +
maintenance cost)
Percentage of plant overhead
input by the user. Default value is
30%.
General and administrative cost
(USD per year)
Percentage of general & administrative cost (%) x (total
inputs cost + total labour cost + maintenance cost + plant
overhead)
Percentage of general &
administrative cost input by the
user. Default value is 5%.
Average loan interest payment
(USD per year)
Loan amount = loan ratio (%) x total investment cost
Loan payment (USD/month) = PMT([loan interest
rate/12],[12x loan term], loan amount)
Annual loan payment = loan payment (USD/month) x 12
months
Total loan payment =Annual loan payment x loan terms
Loan interest payment =
total loan payment - loan amount
Average loan interest payment =
loan interest payment divided by project lifetime
PMT is a financial function in
Microsoft Excel for calculating the
payment for a loan based on
constant payments and a
constant interest rate.
8.1.7 Total production cost and unit cost of electricity calculation
Table 9 presents the calculation equations of the total operating costs, total fixed costs, and total other costs.
The final results of these costs are used to compute the total production cost of electricity and unit
production cost per kWh.
Table 9: Total production cost equations
Item Equation and assumption Remark Total operating costs (USD per year)
annual inputs cost + annual labour cost + annual transportation cost + annual storage cost
Total fixed costs (USD per year)
depreciation fixed cost +annual maintenance cost
Total other costs (USD per year)
annual plant overhead + annual general &administration cost + annual loan payment + annual income tax
Total production cost (USD per year)
total operating costs + total fixed costs + total other costs
Production cost per kWh total production cost divided by Power generation The equation of power generation (kWh per year) is presented in Table 3.

BEFS Rapid Appraisal – Biogas industrial component User manual
37
8.2 Data requirements for running the tool
Table 10 includes data requirements for running the Combustion component.
Table 10: Data requirements for running the tool
Data Definition and sources
Biomass and its residue
The user selects the biomass/crops and its residue for detailed analysis.
Price of feedstock
If the price of feedstock is not available, the user will need information on hourly wages for skilled and unskilled workers (USD per employee per hour) and fuel consumption of machinery typically used in agricultural or forestry operations to calculate a proxy for this value.
Price of water The user enters the current price of water (USD/m3).
Price of caustic soda The user enters the current price of caustic soda (USD/kg).
Price of electricity The user enters the current price of electricity (USD/kWh).
Price of heat The user enters the current price of heat (USD/GJ).
Feedstock storage cost (USD per tonne)
The user identifies the cost for storing the feedstock. The user can enter the current prices on storage for agricultural products in the country.
If this information is not available in the country, the user can estimate this based on the selection on the type of storage available in the country and use the estimated global cost for building this type of storage that is provided in the tool. Moreover, the size of the storage site or container is estimated using the biomass storage calculator.

BEFS Rapid Appraisal – Biogas industrial component User manual
38
Data Definition and sources
Labour cost Unskilled and skilled workers in the unit of USD per employee per hour.
Working hours of feedstock collection
Working hours of feedstock collection for manual and mechanized method.
The cost of transportation of feedstock (field/collecting point to plant) in unit of USD per tonne per km
Cost of transportation of feedstock from the collection point (or field) to the biogas plant, the user enters the cost of transportation in unit of USD per tonne per km.
If transportation is done on foot or by bike, the user can include this cost in the collection cost of feedstock. Alternatively, the user estimate the cost by using the cost of labour per hour, working time, the amount of material that can be transported and the approximate kilometres that can be travelled under the selected method.
Operating hours per day for combustion system
The user will provide an estimated number of hours per day that the system is expected to operate. Most literature indicates that combustion systems are operated only for a few hours during the day. For example, in cases where the combustion system supplies only household electricity, these operate 4 hours, usually during the night time. The user may want to determine this value based on potential energy demands.

BEFS Rapid Appraisal – Biogas industrial component User manual
39
Data Definition and sources
Costing parameters Percentage of plant overhead cost, general and administrative cost, maintenance cost and miscellaneous cost.
Financial parameters Inflation rate (%) Discount rate (%) Loan ratio (%) Loan interest rate (%) Loan term (years), Plant cost index http://base.intratec.us/home/ic-index
Electricity demand per household
The user inputs data from the Country Status module. The electricity consumption will be estimated based on the type of appliances typically used in a rural household, the quantity of these appliances per rural household and the average hours of operation of the appliances. Note that this value will be used as a proxy to identify the number of potential households that can be supplied with electricity. A more detailed and localized analysis according to energy demand profiles and time framework will need to be carried out for adequate planning and implementation of a combustion system.

BEFS Rapid Appraisal – Biogas industrial component User manual
40
8.3 New feedstock creator wizard
The user may also define a new feedstock by using the new feature “Input new feedstock button” (Figure 25-
label A).
Figure 25: Input new feedstock
The user will:
1. Define the type of feedstook among the following options:
- Wastewater (Figure 26-Label A)
- Other type of feedstock (Figure 26-Label B)
Figure 26: New feedstock creator

BEFS Rapid Appraisal – Biogas industrial component User manual
41
2. When wastewater is selected:
- Define the residue ID (Figure 27-Level 1)
- Define the following properties (Figure 27-Level 2): COD (g/l), COD degradability (%), methane
content (%) and biogas potential (m3/t COD removed)
Figure 27: Wastewater definition
3. When other type of residues is selected:
- Define the residue ID (Figure 28-Level 1)
- Define TS (%) and VS (%) (Figure 28-Level 2)
- Select the method to assign the biogas potential (Figure 28-Level 3)
- If user defined is selected, define the biogas potential (m3/t VS) and the methane content (%)
- If calculator is selected, click on “Use biogas potential calculator” (Figure 29-Label A)
- Select the method to calculate the biogas potential (Figure 29-Label 1)
- If method 1 is selected, define the properties to run the ultimate analysis (Figure 29-Label 2) and
click on “Calculate using method 1” (Figure 29-Label 3)
- If method 2 is selected, define the properties to run the proximate analysis (Figure 29-Label 4)
and click on “Calculate using method 1” (Figure 29-Label 5)

BEFS Rapid Appraisal – Biogas industrial component User manual
42
Figure 28: Other type of feedstock definition. Biogas potential defined by the user
Figure 29: Other feedstock definition. Biogas potential calculated by the tool

BEFS Rapid Appraisal – Biogas industrial component User manual
43
8.4 Recalculate plant size
Recalculate Plant Size is a new feature included in
this tool (Figure 30-Label A) that allows defining
the plant sizes according to the biogas final use
and the minimum and maximum sizes required.
Figure 30: Recalculate plant sizes
The user will:
1. Define a base unit from the dropdown menu (Figure 31-Label 1)
2. Define the minimum and maximum plant sizes required (Figure 31-Label 2)
3. Click on the Calculate button (Figure 31-Label 3)
4. Recalculate the plant sizes, if necessary (Figure 31-Label 4)
5. Apply the calculated plant sizes to continue with the process (Figure 31-Label 5)
Figure 31: Plant size definition

BEFS Rapid Appraisal – Biogas industrial component User manual
44
8.5 List of feedstock included in biogas industrial tool
Food Process. Res. Crops Crop Residues Biodiesel/Oilseed Ind. Enegy Crops Eth-Sugar-Starch
Ind.
Apple pulp Alfalfa Apple cake Coconut cake/expeller Barley Maize Grain Silage
(Crimped seed)
Apple slurry Apple Apple waste Coconut extraction
meal Barley grain Maize Silage
Asparagus peels Banana Apricot fibre Cotton seed
extraction meal Forage
sorghum Miscanthus silage
Baking wastes Beans Asparagus waste Fish Oil Grain
sorghum Miscanthus sillage
Banana peels Buckwheat Banana Residues Flax cake/expeller Grass Clipings Sugar beet leaves,
silage
Barley fresh mass Cabbage Barley straw Flax extraction meal Grass fresh Sugar beet silage
Barley silage Carrot Cauliflower Residues Glycerin Green maize Wheat strip waste
Field fodder silage Cauliflower Cut flower wastes Hemp press cake,
fresh Maize Apple Marc
Hemp press cake Clover Eggplant Residues Linseed oil Maize grain
dry Maize gluten
Hemp silage Comfrey Feeding beet leaves,
fresh Maize germ
cake/expeller Oat grain Maize gluten feed
Loose skinned mandarin
Coriander plant
Feeding beet leaves, silage
Maize germ extraction meal
Rapeseed Mash from distillations
Maize strip waste Eggplant Field fodder hay Oilseed Residuals
(pressed) Reed, cattail,
fresh Molasses
Mango Peels Field beans Grape Residues Olive pulp Rice Potate chips
Rapeseed strip waste Field fodder
fresh Lemmon Residues Palm Kernell
Seaweed, fresh
Potate flakes
Reed, cattail, silage Fodder beet Maize cobs Palm-kernel
cake/expeller Sorghum Potato press water
Bakery residues Garden beet Maize stover Palm-kernel extraction
meal Sorghum
grains Potato pulp, dried
Barley bran Garden beet
tops Maize Straw Peanut cake/expeller Sugar beet Potato starch
Barley feeding meal Garden pea Mango Resdiues Peanut extraction
meal Sunflower
Residue from production of
sweets
Bran and cereal strip waste (70:30), fresh
Giant knotweed
Oat straw Rape cake (pressed
cold)
Sunflowers green start of
flowering Sugar beet chips
Cereal Mash Grape vine Orange Residues Rapeseed
cake/expeller Sweet
Sorghum Sugar beet dried &
shredded
Cereal strip waste, fresh
Ipomoea fistulosa
Pea straw Rapeseed extraction
meal Triticale Sugar beet fresh
Chip fat Jerusalem Artichoke
Pineapple Residues Rapeseed oil Triticale grains
Sugar beet melasse
Coffee pulp Lady´s finger
(Okra) Pineapple waste Raw Glycerol Wheat
Sugar beet pulp, dired
Dairy industry wastes Lupine Potatoe Residues Safflower extraction
meal Wheat grain
Sugar beet tops clean
Discarded wheat flour Mirabilis Rapeseed straw Sesame extraction
meal White fir Sugar filter cake
Field bean grain Mustard Rice Straw Soy beans seeds
steam-heated Willow Sugar for feeding
Grain Peas Nettle Rye straw Soya Oil Winter Barley
Maize , broken Orange Ryegrass straw Soybean extraction
meal
Maize grain powder Parsnips Spinach waste Sunflower cake cold
pressed
Malt coffee marc Pea Other Straw Sunflower extraction
meal

BEFS Rapid Appraisal – Biogas industrial component User manual
45
Food Process. Res. Crops Crop Residues Biodiesel/Oilseed
Ind.
Medical tea (Production waste)
Pineapple Sugar Beet leaf Sunflower Oil
Mixed grain Pomegranate Sugar beet tops Sunflower peelings
Oat bran Potatoes Sugar beet waste
Oats fodder flour Quinoa Sugar beet, leaves and
tops, silage
Old bread Red clover Sugas beet leaf (fresh)
Old chip fat Rhubarb Tangarine Residues
Onion Residues Rosebay willow-
herb Tea Waste
Other cereals straw Rye Tomatoe Residues
Potato flakes Sweet clover Turnip Residues
Potato peeling wastes roughly
Tomato Turnips tops, fresh
Potato Pulp/Peelings Turnip Wheat straw
Potatoes amniotic fluid (Stach production)
Vetch Cocoa Shell
Potatoes mash White cabbage
Potatoes pulp
Potatoes shredder
Potatoes waste water
Processing waste (filtration cake, pulp)
Pulp
Rice Bran
Rice feeding meal
Rolled oats
Rye bran
Rye feeding meal
Silage seep water
Succory chaff
Succory mush
Vegetable wastes
Wheat bran
Wheat chaff
Wheat flakes
Wheat germs
Wheat semolina bran
Fruit slurry
Lemon pulp
Mango pulp
Orange peel and seeds

BEFS Rapid Appraisal – Biogas industrial component User manual
46
Grass Yeast-Alcoholic Bev. Slaughterhouses wastes Other Options Wastewater Dairy-milk ind. Manure
Alemangrass Apple pomace Fat seperator residues Algae Coffee Industry wastewater Butter milk fresh Buffalo
Bermuda grass Beer Barm Floating Sludge bio-waste container Dairy Industry wastewaters Cheese waste Cattle
Glover grass hay Brewer`s grains Flotate sludge, fresh Clover 1st cut in flower Slaugtherhouse wastewater Dairy cow slurry Dairy Cattle
Glover grass silage Brewer`s grains and yeast Animal fats Fodder carrot Distillery wastewater Dairy slurry inc. fodder
remains Poultry
Grass Brewers yeast, fresh Fish liver meal Food leftovers Opt 1. Oilseed proceesing wastewater Milk Whey Swine
Grass cut (golf course) Distiller`s dried grain, solubles
only Fish meal Food Leftovers Opt 2. Fruit industry wastewater Skimmed milk dry
Grass cut (loppings) Distiller`s dried grains Flotate fat Green Mustard before flower Pulp and paper industry
wastewater Skimmed milk fresh
Grass cuttings from lawns Draff Hydrolyzed Meat and Bones Green oats in flower Textile industry wastewater Sour whey fresh
Grass hay Grain mash Leftovers Average fat Makrophyt Brewery industry wastewaters Whole cows milk fresh
Grass silage Grain strip waste Leftovers fat-rich Market waste Opt. 1 Vinasses
Lawn Grape marc Leftovers low fat & wet Market Wastes Opt. 2
Meadow grass green Grape marc, fresh Meat waste Meadow Hay
Miscanthus fresh Malt coffe draff, fresh Pig muck Microalgae
Napier grass Pomace Poultry meat offals News paper
Ray Grass Potato pulp, fresh Purines Salad
Ray Grass Silage Fermentation Residues Rumen content Sisal Pulp
Reed canary grass Yeast Slaughterhouse wastes mixtures Waste Sludge
Rye grass Waste Sludge (concentrated)
Spartina-Cordgrass
Sudan grass fresh
Sudan grass silage
Tall fescue
Timothy grass
Turf grass
Wood grass

BEFS Rapid Appraisal – Biogas industrial component User manual
47
8.6 Codigestion rates
Feedstock 1 Feedstock 2 Optimal Codigestion Rate
Manure Oilseeds 2:1
Manure Fruit Residues 85:15
Manure Sugar Beet 62:38
Manure Energy Crops 1:4
Manure Maize 44:56
Manure Glycerol 25.8:71.5
Manure Straw 50:50
Manure Silage 83:17
Manure Vegetable Wastes 60:40
Manure Potatoe Residues 80:20
Pig Manure Corn stover 75:25
Pig Manure Potato waste 85:15
Pig Manure Wheat Straw 75:25
Cow Manure Wheat Straw 50:50
Cow Manure Beet silage 83:17
Cow Manure Fruit and vegetabe waste 80:20
Cow Manure Barley straw 80:20
Cow Manure Sugar beet tops 70:30
Cow Manure grass silage 70:30
Cow Manure Straw 70:30
Cow Manure Whey 75:25
Buffalo manure Maize silage 75:25
Dairy Manure whey 75:25
Dairy Manure Potatoes 75:25
Dairy Manure Plain pasta 75:25
Dairy Manure Switchgrass 75:25
Dairy Manure Waste Oil 75:25
(DUONG, 2014, ESPOSITO ET AL., 2012, WU, 2007, PRABHU ET AL., 2014)
Table 11 Optimal codigestion rates from selected literature sources
9 References
Abbasi, T., Tauseef, S. M. & Abbasi, S. A. 2012. Low-Rate and High-Rate Anaerobic Reactors/Digesters/Fermenters. Biogas Energy. Springer New York.
Abu-Reesh, I. M. 2014. Kinetics of anaerobic digestion of labaneh whey in a batch reactor. African Journal of Biotechnology, 13, 1745-1755.
Arsova, L. 2010. Anaerobic digestion of food waste: Current status, problems and an alternative product. Master of Science in Earth Resources Engineering, Columbia University.
Baskar, C., Baskar, S. & Dhillon, R. S. 2012. Biomass Conversion: The Interface of Biotechnology, Chemistry and Materials Science, Springer Berlin Heidelberg.

BEFS Rapid Appraisal – Biogas industrial component User manual
48
Brown, D., Shi, J. & Li, Y. 2012. Comparison of solid-state to liquid anaerobic digestion of lignocellulosic feedstocks for biogas production. Bioresource Technology, 124, 379-386.
Chan, Y. J., Chong, M. F., Law, C. L. & Hassell, D. G. 2009. A review on anaerobic–aerobic treatment of industrial and municipal wastewater. Chemical Engineering Journal, 155, 1-18.
Duong, S. 2014. Systematic assessment of straw as potential biogas substrate in co-digestion with manure.
Esposito, G., Frunzo, L., Giordano, A., Liotta, F., Panico, A. & Pirozzi, F. 2012. Anaerobic co-digestion of organic wastes. Reviews in Environmental Science and Bio/Technology, 11, 325-341.
Hashimoto, A. G. 1983. Thermophilic and mesophilic anaerobic fermentation of swine manure. Agricultural Wastes, 6, 175-191.
Hashimoto, A. G. 1984. Methane from swine manure: Effect of temperature and influent substrate concentration on kinetic parameter (K). Agricultural Wastes, 9, 299-308.
Hashimoto, A. G. 1986. Ammonia inhibition of methanogenesis from cattle wastes. Agricultural Wastes, 17, 241-261.
Hashimoto, A. G., Varel, V. H. & Chen, Y. R. 1981. Ultimate methane yield from beef cattle manure: Effect of temperature, ration constituents, antibiotics and manure age. Agricultural Wastes, 3, 241-256.
Kangle, K. M., Kore, S. V., Kore, V. S. & Kulkarni, G. S. 2012. Recent Trends in Anaerobic Codigestion: A Review. Universal Journal of Environmental Research and Technology, 2, 210-219.
Lai, T., Koppar, A., Pullammanappallil, P. & Clarke, W. 2009. Mathematical Modeling of Batch, Single Stage, Leach Bed Anaerobic Digestion of Organic Fraction of Municipal Solid Waste. In: KALLRATH, J., PARDALOS, P., REBENNACK, S. & SCHEIDT, M. (eds.) Optimization in the Energy Industry. Springer Berlin Heidelberg.
Li, Y., Merrettig-Bruns, U., Strauch, S., Kabasci, S. & Chen, H. 2015. Optimization of ammonia pretreatment of wheat straw for biogas production. Journal of Chemical Technology & Biotechnology, 90, 130-138.
Liew, L. N. 2011. Solid-State Anaerobic Digestion of Lignocellulosic Biomass for Biogas Production. Master of Science in the Graduate School, The Ohio State University.
Massoud, K., George, T. & Robert, C. B. 2007. Biomass Conversion Processes For Energy Recovery. Energy Conversion. CRC Press.
Mogal, P. R. 2013. Energy Generation From Food Wastage. International Journal of Emerging Technology and Advanced Engineering, 3, 37-42.
Monnet, F. 2003. An introduction to anaerobic digestion of Organic wastes. Remade Scotland. Parawira, W. 2004. Anaerobic Treatment of Agricultural Residues and Wastewater Doctor of
Philosophy in Engineering, Lund University. Prabhu, A., Raja, S. & Lee, C. 2014. Biogas production from biomass waste: a review. IJIRT, 1, 73-83. Rajendran, K., Aslanzadeh, S. & Taherzadeh, M. 2012. Household Biogas Digesters—A Review.
Energies, 5, 2911-2942. Strezov, V. & Evans, T. J. 2015. Biomass Processing Technologies, CRC Press. Wang, L. K., Hung, Y. T., Lo, H. H. & Yapijakis, C. 2005. Waste Treatment in the Food Processing
Industry, CRC Press. Wang, X., Lu, X., Li, F. & Yang, G. 2014. Effects of Temperature and Carbon-Nitrogen (C/N) Ratio on
the Performance of Anaerobic Co-Digestion of Dairy Manure, Chicken Manure and Rice Straw: Focusing on Ammonia Inhibition. PLoS ONE, 9, e97265.
Wu, W. 2007. Anaerobic co-digestion of biomass for methane production: recent research achievements. Optimization, 1, 1VS.
Yang, L., Xu, F., Ge, X. & Li, Y. 2015. Challenges and strategies for solid-state anaerobic digestion of lignocellulosic biomass. Renewable and Sustainable Energy Reviews, 44, 824-834.

BEFS Rapid Appraisal – Biogas industrial component User manual
49
Zupančič, G. D. & Grilc, V. 2012. Anaerobic Treatment and Biogas Production from Organic Waste. In: KUMAR, S. (ed.) Management of Organic Waste.

BEFS Rapid Appraisal – Biogas industrial component User manual
50
This user manual assists in the utilization of BEFSRA biogas industrial tool. Moreover, this manual provides useful definitions related to biogas digestor options, its operation and key parameters affecting production performance. After completing this manual and operate the tool, users will be able to perform the techno-economic analysis of biogas production and different potential uses for electricity generation, cogeneration of heat and power (CHP), direct use for heating and cooking or upgrade to natural gas. In this manual, users will be guided through a practical example on how to use the more than 450 feedstock options included in the database and that range from agriculture residues to common agro-industrial residues, for codigestion or seasonal operations. A correct use of manual and tool will provide an indication of production costs and investment; financial viability feedstock demand, and potential socio-economic benefits of biogas industrial plants. Biogas industrial manual is part of the Heat and Power submodule of Energy End Use Option in BEFS RA tools. This module builds up from the information generated in the Natural Resources modules in relation to feedstock. For a more detailed description of the module, refer to the general introduction of the training manual.