biogas for road vehicles...methane (ch4) emissions from landfilling or manure storage, resulting in...
TRANSCRIPT

BIOGAS FOR ROAD VEHICLESTECHNOLOGY BRIEF

Copyright (c) IRENA 2018Unless otherwise stated, material in this brief may be freely used, shared, copied or reproduced, provided that all such material is clearly attributed to IRENA. Material attributed to third parties may be subject to third-party copyright and separate terms of use and restrictions.
Some sections of this brief were updated in March 2018, following its original, March 2017 release.
ISBN: 978-92-9260-060-0
Citation: IRENA (2018), Biogas for road vehicles: Technology brief, International Renewable Energy Agency, Abu Dhabi.
ABOUT IRENA
The International Renewable Energy Agency (IRENA) is an intergovernmental organisation that supports countries in their transition to a sustainable energy future, and serves as the principal platform for international co-operation, a centre of excellence, and a repository of policy, technology, resource and financial knowledge on renewable energy. IRENA promotes the widespread adoption and sustainable use of all forms of renewable energy, including bioenergy, geothermal, hydropower, ocean, solar and wind energy, in the pursuit of sustainable development, energy access, energy security and low-carbon economic growth and prosperity.
ACKNOWLEDGEMENTS
This brief benefited greatly from review and comments by Jens Giersdorf (GIZ), Nylund Nils-Olof (VTT), Marcio Schittini (Ecometano) and Arthur Wellinger (EBA), along with IRENA colleagues Dolf Gielen, Rodrigo Leme, Jeffrey Skeer, Nicholas Wagner, Nesrine Ferroukhi and Shunichi Nakada.
Contributing authors: Frank Scholwin, Johan Grope and Angela Clinkscales (Institute of Biogas, Waste Management and Energy), Francisco Boshell, Deger Saygin, Alessandra Salgado and Amr Seleem (IRENA)
For further information or to provide feedback: [email protected]
Disclaimer
This brief and the material featured herein are provided “as is”. Neither IRENA nor any of its officials, agents, data or other third-party content providers provides any warranty, including as to the accuracy, completeness, or fitness for a particular purpose or use of such material, or regarding the non-infringe-ment of third-party rights, and they accept no responsibility or liability with regard to the use of this brief and the material featured therein.
The information contained herein does not necessarily represent the views of the Members of IRENA. The mention of specific companies or certain projects or products does not imply that they are endorsed or recommended by IRENA in preference to others of a similar nature that are not mentioned. The des-ignations employed and the presentation of material herein do not imply the expression of any opinion whatsoever on the part of IRENA concerning the legal status of any region, country, territory, city or area or of its authorities, or concerning the delimitation of its frontiers or boundaries.
Photographs from Shutterstock unless otherwise indicated.

Contents
Insights for policy makers ..........................................................................................................2
Highlights ...........................................................................................................................................5
Process and technology status ...............................................................................................12
Feedstock ............................................................................................................................... 14
Transport and storage ........................................................................................................15
Pre-treatment and in-feed ............................................................................................... 16
Anaerobic digestion ............................................................................................................17
Upgrading and purification ............................................................................................. 18
Distribution as vehicle fuel...............................................................................................23
Biogas vehicles configuration ....................................................................................... 24
Costs .................................................................................................................................................. 26
Biogas production from anaerobic digestion ........................................................ 26
Upgrading..............................................................................................................................30
Biomethane distribution ...................................................................................................32
Total production cost for biomethane as vehicle fuel ..........................................35
Performance and sustainability .............................................................................................37
Potential and barriers ................................................................................................................ 43
Best practice examples ............................................................................................................. 47
Bibliography .................................................................................................................................. 54

Biogas for Road Vehicles | Technology Br ief2
» Biogas can be produced based on a microbiological process from different kinds of biomass. Possible feedstocks can be wastewater, wastewater treatment sludge, manure from animal production, industrial and municipal organic waste or energy crops as well as mixtures. Landfill gas can also be used.
» When biogas is purified or upgraded to natural gas quality (then mostly referred to as “biomethane”), it can be used in the same manner as fossil gas for natural gas vehicles (NGV) or so-called dual fuel vehicles.1
» NGV use is steadily increasing internationally based on the very strong advantages of NGV operation: relatively low emissions compared to diesel and gasoline, typically lower fuel costs, and similar ease of driving.
» Argentina, Brazil, China, Colombia, Germany, India, Iran, Italy, Pakistan, Sweden and Switzerland have relatively well-developed NGV
infrastructures (with decreasing numbers of NGVs in the countries as indicated by the order of the countries), for which biogas could easily be implemented as a renewable alternative to fossil natural gas.
» The largest producers of biogas as vehicle fuel in 2016 were Germany, Sweden, Switzerland, the UK and the US. Internationally, an estimated 500 plants produce biogas and upgrade the gas to natural gas quality equalling about 50 Petajoule (PJ)/a.
» The technology for biogas production as well as for biogas purification and upgrading is reliable and mature. For every single application of the technology chain an adaption of the biogas technology to the available biomass (the so-called feedstock) is necessary. For biogas purification and upgrading, a variation of technologies is available, generally in standardised, prefabricated modules.
Insights for Policy Makers
1 When biogas is upgraded to natural gas quality (and then called biomethane), it is injected to the natural gas grid in most cases. If so, it is blended with natural gas and can be used for producing electricity and/or heat/cold, besides its use as vehicle fuel. Physically, it follows the natural gas flow in the grid and its final use cannot really be influenced. But in most countries, regulations have been established, which allow defined end-use of biomethane on a virtual (by contracts) basis.

Biogas for Road Vehicles | Technology Br ief 3
» The main environmental advantage of biogas as a vehicle fuel is that it can substantially reduce greenhouse gas (GHG) emissions in the transport sector (typically between 60% and 80% compared to gasoline). When liquid residues from biogas production are used as organic fertiliser (substituting mineral fertiliser), it can avoid methane (CH4) emissions from landfilling or manure storage, resulting in additional GHG savings.
» The full closure of local nutrient cycles is possible with biogas solutions. In addition, awareness can be raised about local job creation and low nitrogen-oxide (NOx) emissions from NGVs in comparison to diesel-driven vehicles. (Air Quality, 2016).
» There is a great potential for biogas production from organic wastes as well as from energy crops. However, the use of energy crops as feedstock for biogas production may compete with food production for arable land and water, depending on the regional availability and need for arable land and water for food production. Thus, for member states of the European Union, sustainability standards are applied to biogas as vehicle fuel applications.
» Micro-organisms, which realise the conversion of organic matter to biogas, are capable of
converting different feedstock mixtures. Conversion of biomass to energy by anaerobic digestion, is a real “multi-feedstock” process. Moreover, upgrading offers extreme flexibility: the resulting biogas can be used either as vehicle fuel or to produce heat or electricity. Multiple uses offer diversification of the product portfolio from a biogas plant, helping to ensure a sustainable business.
» The main challenge for biogas as a fuel solution is the cost of the product. The product cost mainly depends on the cost of the feedstock used. Production costs for biogas are typically USD 0.22/ cubic meter (m3) to USD 0.39/m3 methane for manure-based biogas production and USD 0.11/m3 to USD 0.50/m3 methane for industrial waste-based biogas production. Purification and upgrading costs depend partially on trace gases resulting from the feedstock being used and mainly on the size of the biogas upgrading unit.
Definition of terms:
Biogas (also raw biogas):The product of anaerobic digestion (AD) of biomass, without upgrading (CO2-removal);
50% to 70% CH4.
Biomethane:Upgraded biogas to natural gas quality, with a high CH4 content (at least 90%, commonly 96% to 99%) and low share of impurities.

Biogas for Road Vehicles | Technology Br ief4
» The total supply cost for biogas as vehicle fuel (including distribution cost) ranges between USD 0.22/ m3 and USD 0.88/m3 methane for plants with a size above 500 m³/hour (h) raw biogas using residues and wastes as feedstock. For small-scale plants of about 100 m³/h raw biogas the costs are USD 1.00/m3 to USD 1.55/ m3 of methane. Competing with extremely low natural gas prices (USD 0.13/m3 in 2016)2 is extremely challenging.
» Moreover, many countries worldwide support biogas use as vehicle fuel with tax exemptions, investment subsidies or incentives for biogas injection into the natural gas grid. Investments are being made based on such considerations in China, France, the UK and Scandinavia.
» Extensive research is being done on the optimisation or upgrading of biogas production, as well as on exploiting less easily available feedstock. This is expected to increase process efficiency and decrease the production costs of biogas for vehicle fuel in the near future.
» No breakthrough reductions seem to be possible but a cost reduction in the range of 30% to 40% appears to be realistic. Synergies are seen in combination with upcoming innovative technologies like power-to-gas, where renewable electricity is used for hydrogen (H2) production using electrolysis in order to split H2O in a first step and transform the H2 into methane in a second step, or thermochemical gasification of solid biomass to bio-SNG (synthetic natural gas).
2 Natural gas price at the New York Mercantile Exchange (NYMEX), converted by 0.035315 MMBTU/m3: See: www.finanzen.net/rohstoffe/Erdgas-Preis-Natural-Gas.

Biogas for Road Vehicles | Technology Br ief 5
Renewable gases can be produced by anaerobic digestion of wet biomass, gasification of woody solid biomass, or the so-called power-to-gas process, where renewable electricity is used for hydrogen (H2) production using electrolysis in order to split H2O in a first step and transform the H2 into methane in a second step. The most mature process of those three is the biogas production by anaerobic digestion, where wet biomass is degraded by microorganisms under anaerobic conditions. For biogas production various raw materials, such as animal by-products, vegetable by-products, organic household and industrial waste as well as energy crops can be used.
Mainly depending on the feedstock characteristics, different technologies for anaerobic digestion are available and can be divided into wet and solid as well as continuous and discontinuous (also known as batch) systems. Biogas yields vary between different feedstocks, primarily determined by the organic dry matter content and its specific degradability. Low dry-matter content limits the transport distances of the feedstock, due to economic limitations (transportation of water that does
not contain energy). Pre-treatment of the biomass may be necessary in order to make the organic fraction available for the microorganisms or to secure hygienic standards in the case of feedstock, which may be critical from the epidemiological and phytohygienic standpoint.
Biogas consists mainly of methane (CH4, about 60%) and carbon dioxide (CO2, about 40%) and some minor impurities (mostly H2S and H2O), with different shares depending on the feedstock being used. In order to use biogas as vehicle fuel, purification and upgrading (CO2 removal) are necessary to reduce contamination with hazardous components and increase the calorific value of the gas, i.e. to make it interchangeable with conventional fuels (especially natural gas).
Today biogas plant operators can choose among a wide variety of biogas purification and upgrading technologies. The most common technologies for CO2 removal are based on the principles of adsorption, physical and chemical absorption or separation by membranes. Their performance differs mainly with regard to process energy demand and methane losses during the process. The different technologies
Highlights
Process and technology status

Biogas for Road Vehicles | Technology Br ief6
may have different advantages and dis-advantages depending on the individual circumstances of each project.
Upgraded and purified biogas can be transported from the location of production to a filling station by means of the public gas grid, a local gas pipeline or by trucks (in case there is no gas grid available). Depending on the gas grid operating pressure the gas needs to be pressurised. When transported by trucks, it is usually
carried or stored in high-pressure cylinders in a range from 200 bars to 250 bars.3 Another possibility is to liquefy the biogas in order to increase the energy density (three times in comparison to compressed biogas at 200 bars). This more energy- and cost-intensive option is only used for long-distance transport, such as by heavy-duty vehicles or maritime transport. The upgraded biogas can be used in conventional NGVs, which include light-duty commercial vehicles, city buses and gas-powered trucks.
3 One bar = 100 000 N/m2.

Biogas for Road Vehicles | Technology Br ief 7
Energy efficiency, GHG emissions and costs are factors to be taken into account that characterise biomethane vehicle fuel end-use. Depending on the digestible biomass of the used feedstock, typical overall efficiency4 of the biogas supply as fuel is between 70% and 85%. The efficiency is mainly determined by:
» losses during biomass transport and storage,
» efficiency (e.g. digestion rate), methane losses and auxiliary energy needs of the anaerobic process,
» methane losses and energy needs of biogas purification and upgrading and
» energy requirements for biogas transportation (via gas grid or trucks).
When biogas is being produced from energy crops, the potential driving distance based on the amount of
fuel produced from one hectare of agricultural land is around 67 600 km,5 which is the longest in comparison to other alternative biofuel options (biomass-to-liquid, rapeseed oil, biodiesel and bioethanol). For that driving distance, municipal organic waste from roughly 250 inhabitants6 and manure from roughly 50 pigs over one year is necessary to produce the same amount of biogas.
Application of biomethane for transportation allows a reduction of GHG emissions in the range of 60% to 80% in comparison to gasoline. The GHG reduction potential mainly depends on the feedstock being used. There is a higher reduction potential when waste and residues instead of energy crops are used.
The total cost for biomethane production, including all steps from feedstock supply to gas grid
Performance, sustainability and costs
4 Efficiency is defined here as the available energy within the final fuel ready for use in a NGV in comparison to the theoretical available energy in terms of degradable biomass in the feedstock being used for biogas production.
5 Taken from: Fachagentur Nachwachsende Rohstoffe e.V. (FNR) 2007.
6 Based on the following assumptions: i) for municipal waste: 350 kg organic waste per capita and year with 40% dry matter, from which only 80% is practically digestible with 300 m3 biogas per tonne of dry matter and 55% methane; for pig manure: 6 tonnes of manure per pig and year; 26 m3 biogas per tonne and year; 60% methane; in both cases: 15% of produced biogas for heating of digesters, 8% of theoretical electricity production for biogas plant and upgrading plant operation, 1% methane losses.

Biogas for Road Vehicles | Technology Br ief8
injection, ranges from USD 0.28/m3 to USD 1.94/m3 methane7 (see Figure 14) under Central European conditions. Cost depends on plant capacity and the biomass category. (In the case shown, plant capacities ranged from 100 m3/h to 2 000 m3/h for raw biogas production; capital costs, in particular, decrease with plant capacity.) Producing biomethane from energy crops is more costly than from waste (in the USD 0.75-1.94 range, versus USD 0.28-0.63, for each cubic metre of methane produced), mainly because of the significantly higher prices of biomass. Operating costs account for the largest part of the total cost. Costs related to anaerobic digestion come mostly from feedstock. Costs of upgrading technologies are quite similar for the different types of processing. The largest share of costs is related to the auxiliary energy supply. Finally, distribution costs depend mainly on the distance between transport hubs and customers as well as the associated need for gas compression for transportation (pressure of the gas grid or transport in high-pressure gas bottles). Estimating costs of distribution systems (e.g. biomethane
sales to filling stations, operation of fueling stations) is challenging because these are particularly dependent on the country and area.
Biogas production for transportation is mainly concentrated in Europe, especially in Sweden, Switzerland, the Netherlands and Germany. But many countries have a significant potential both in terms of biomass availability and NGV infrastructure.
To determine the availability of feedstock suitable for biogas for vehicle fuel is challenging because of a lack of data. Nevertheless, studies on the technical biomass potential on a global level show significant potentials for biogas production on the basis of energy crops, municipal waste and animal by-products worldwide, with significantly higher numbers in Europe, Latin America, North America and Asia (each between 1 500 PJ/a and 2 000 PJ/a) in comparison to Africa and Australia.
Potential and Barriers
7 All cost values indicated in USD per m3 methane are based on the amount of methane, which in the case of biomethane is commonly around 98% of the total volume and has a calorific value of 11.06 kWh per m3.

Biogas for Road Vehicles | Technology Br ief 9
8 Large numbers of NGV and the infrastructure (gas grid and filling stations) only exist regionally, mainly in the urban regions in south and southeast Brazil.
Taking existing gas infrastructure into account, promising countries for establishing a biogas-as-fuel market in the near future include China, Germany and India, with good NGV infrastructure and large potential for biogas production from organic waste. Brazil has a high biogas production potential and large existing NGV fleet,8 as well as Argentina, Colombia, Italy, Iran and Pakistan with a good NGV infrastructure, but a comparatively small potential of biogas production from organic waste.
Nowadays, several barriers limit project development and biogas implementation. Emerging obstacles can be identified throughout the production line, from feedstock collection to distribution, including costs and lack of policy support. The most important barriers that can hinder the supply of biogas as fuel are:
• lack of centralised biomass availability,
• relatively high costs in comparison with fossil fuels under today’s circumstances,
• lack of awareness about advantages of biogas as an energy carrier,
• changing and short-lasting regulatory frameworks,
• monopolistic structures in the energy sector,
• absence of clear rules for gas-grid access,
• protective structures and stakeholders in the waste business,
• absence of NGV infrastructure,
• lack of highly efficient heavy-duty gas vehicles, and
• insufficient knowledge among end-users about economic advantages of using NGV instead of diesel- or gasoline-driven vehicles.

Biogas for Road Vehicles | Technology Br ief10
Biogas has been used in domestic and agricultural applications for many years. It was mainly used to stabilise residual sludge from waste water beginning in the 1930s. Over the years, the benefits of biogas utilisation have been recognised, and biogas production was set up on a more industrial scale, especially in Europe and North America.
Figure 1 shows biogas production and use in key markets in 2013. The global biogas production reached slightly less than 600 terawatt-hours (TWh) in 2013. The countries with the largest
biogas production by far have been China, the US and Germany. In China almost 100% of biogas is produced in small-scale biodigesters and used for domestic cooking. In the US, in contrast, almost half is used for electricity and half for heat production. In Europe (including Germany, Italy and the UK, besides others) more than 90% is used for electricity generation. The worldwide share of biogas use as vehicle fuel, although still very low (<1%), is growing steadily. Countries that showed a growth in biogas production after 2013
Current applications of biogas production
Figure 1: Use of biogas in countries with most biogas production in 2013
Sources: EurObserv’ER (2014); International Gas Union (2015)
Electricity from Biogas Heat from Biogas
*Including Germany, the UK and Italy
China USA EU* Germany UK Italy
350
300
250
200
150
100
50
0
Bio
gas
in T
Wh
per
yea
r

Biogas for Road Vehicles | Technology Br ief 11
have been, for example, France and the UK. Several countries have started developing a national biogas sector in the last few years, such as Brazil and the Republic of Korea.
The country with the most biogas upgraded to biomethane is Germany, with about 7.2 TWh in 2013. But only 1.4% of Germany’s biomethane, amounting to 103 gigawatt-hours (GWh), has been used as vehicle fuel.9 Other countries with much lower biomethane production in total have a greater focus on biomethane use as fuel. Sweden for example used 97% of its produced biomethane as vehicle fuel. Due to the fact that the gas grid is limited only to the west coast of Sweden, 75% to 80% of the biomethane is transported by trucks from the locations of production to
the filling stations. Although its total biomethane production is relatively low, Italy also uses its biomethane almost completely as vehicle fuel. Due to the country’s extensive gas grid, large NGV fleet and considerable number of NG filling stations, biomethane-as-fuel producers and sellers benefit from a very good NGV infrastructure.
Biomethane is increasingly used for public transport or waste collecting vehicles, such as in the city of Berlin, where more than 150 waste collecting vehicles run on biogas, which is produced from the separately collected organic waste of citizens. In 1990, the city of Lille (France) had already set up an urban bus service using biogas produced by anaerobic digestion (AD) from municipal sewage sludge.
9 Almost all biomethane in Germany has been injected into the natural gas grid and blended with natural gas (as in many other countries too, except Sweden). Only two biomethane plants in Germany exist, where the biomethane is directly supplied to a filling station, without gas grid injection. How much biomethane is being used as fuel physically, therefore, is unknown. Based on contracts of the country, 1.4% is used as a fuel.

Biogas for Road Vehicles | Technology Br ief12
Biogas, produced from different feedstocks containing mainly methane and carbon dioxide, has many applications. It can be used directly for heating and cooking (mainly from small-scale digester with less than 50 m3/h biogas production), for co-generation of heat and power (CHP), for green chemistry (e.g. for renewables-based material production) or as transport fuel.
An important by-product of biogas production is the digestate, which can be used as organic fertiliser. Aside from biogas from anaerobic digestion, other renewable gases (commonly not referred to as biogas) can be supplied via the power-to-gas10 or the bio-SNG11 process (see Figure 3).
Since biogas is currently the most mature of these three options, only the biogas process and related
10 Power-to-gas refers to all processes, which form electrical power into a gaseous energy carrier, such as hydrogen or methane. The main step is the transformation of water into hydrogen by making use of the electricity in a so-called electrolyser. In a potential second step, the hydrogen is transformed together with CO2 into methane in the so-called methanisation process.
11 Bio SNG (Synthetic Natural Gas from Biomass) is produced from woody biomass by gasification.
Figure 2: Biomethane production and biomethane use as vehicle fuel in countries with most biomethane production worldwide in 2013
Source: Štambaský et al. (2015)
biomethane in GWh
% of biomethane used as vehicle fuel
100%
80%
60%
40%
20%
0%
7 200
200
150
100
50
0Germany
Bio
met
hane
pro
duc
ed in
GW
h
Netherlands Sweden Switzerland Austria France Italy
900
Process and Technology Status
Biogas for Road Vehicles | Technology Br ief 13
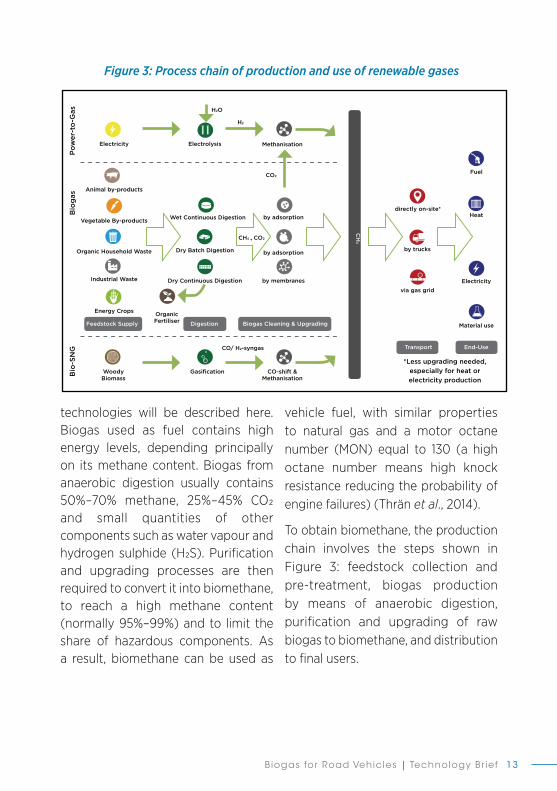
technologies will be described here. Biogas used as fuel contains high energy levels, depending principally on its methane content. Biogas from anaerobic digestion usually contains 50%–70% methane, 25%–45% CO2 and small quantities of other components such as water vapour and hydrogen sulphide (H2S). Purification and upgrading processes are then required to convert it into biomethane, to reach a high methane content (normally 95%–99%) and to limit the share of hazardous components. As a result, biomethane can be used as
vehicle fuel, with similar properties to natural gas and a motor octane number (MON) equal to 130 (a high octane number means high knock resistance reducing the probability of engine failures) (Thrän et al., 2014).
To obtain biomethane, the production chain involves the steps shown in Figure 3: feedstock collection and pre-treatment, biogas production by means of anaerobic digestion, purification and upgrading of raw biogas to biomethane, and distribution to final users.
Figure 3: Process chain of production and use of renewable gasesB
io-S
NG
Pow
er-t
o-G
as
Electricity
Wet Continuous Digestion
Dry Batch Digestion
Dry Continuous Digestion by membranes
*Less upgrading needed, especially for heat or electricity production
by adsorption
by adsorption
Fuel
Heat
Electricityvia gas grid
by trucks
directly on-site*
Material use
OrganicFertiliser
Vegetable By-products
Animal by-products
Organic Household Waste
Industrial Waste
Energy Crops
WoodyBiomass
Gasification
DigestionFeedstock Supply Biogas Cleaning & Upgrading
Transport
CH
4
End-Use
CO-shift &Methanisation
CO/ H2-syngas
Electrolysis
Bio
gas
Methanisation
H2
CO2
CH4 + CO2
H2O

Biogas for Road Vehicles | Technology Br ief14
For biogas production, biomass feedstock can be liquid (concentrated and diluted), solid or slurries. It includes animal by-products (e.g. manure) agricultural by-products (e.g. straw), biowaste from households (collected as mixed waste or separated as organic waste) industrial and commercial waste (waste from markets and restaurants, residues from bio-ethanol and biodiesel production, sewage sludge from waste water treatment plants, etc.) and energy crops (maize silage, grass, sorghum, cereals and
sugar beet). Wood biomass has a high content of lignin and is not suitable for anaerobic digestion.
As shown in Figure 4, different feedstocks have different biogas yields and cause different methane contents. In most countries biogas is produced mainly from organic waste and residues (e.g. cattle and pig slurry, solid cattle manure and poultry manure as well as municipal and industrial waste), especially with respect to its use as transport fuel.
Feedstock
12 This figure is only intended to provide indicative values; they are approximate and can vary extremely. Gas yields depend highly on dry matter content, storage feedstock and feedstock handling. An exact calculation requires feedstock testing.
Figure 4: Biomethane yield of different feedstocks12
Based on FNR (2013); Eder and Schulz (2007)
0 50 100 150 200 250 300 350
Biomethane yield in cubic metres (m3) per tonne of fresh feedstock
DM = dry matter MSW = municipal solid waste t/yr = tonnes per year
dairy waste water (2% DM)
sewage sludge (4% DM)
cattle slurry (10% DM)
pig slurry (6% DM)
distillery stillage/grain vinasse
solid cattle manure
sorghum
brewery spent grain
sugar beet
source separated organic MSW
poultry manure (40% DM)
grass silage
maize silage
separation fat
grain
100 000 t/yr
pig slurry
25 000t/yr MSW* 18 000
t/yrmaize
Feedstock needed for250m3/hour production
capacity
Biogas for Road Vehicles | Technology Br ief 15
Usually, feedstock is transported by truck with a platform/container for solids or by tank for liquids. Other solutions for short distances (<5 km) include a tractor with wagons, but this means of transportation is more expensive. Transport distances depend to a great degree on the feedstock used; higher energy density (Figure 4) may justify longer distances or higher transport costs.
Waste water is typically used directly on site, without any transport or merely small distances by pipes. Slurry is commonly only transported in the range of 5 km or a maximum 10 km, while solid manure (especially poultry manure) and industrial waste with a high energy density (e.g. fats) may be transported more than 100 km. Energy crops (except wheat corn) are seldom transported for distances greater than 30 km, but with logistical optimisation (large trucks and duoliners13) energy crops may be transported more than 50 km.
A biogas plant needs a continuous feed, typically all year long. Most types of waste are available throughout the year. Small fluctuations (e.g. over the weekend) must be compensated with short-term local storage. Strong odor emissions, indicating degradation of material, can occur even during a few days of storage, resulting in a loss in biogas production. Thus, storage must be kept as short as possible, with measures to limit degradation.
Some feedstocks, e.g. energy crops, are available from harvest only once or twice per year. For such feedstocks long-term storage, e.g. ensilaging, is typical. Unavoidable losses of about 5%-10% of the organic material will occur during long-term storage. Yet year-round availability of high-quality feedstocks from local long-term storage can be a great advantage, enabling constant or controlled biogas production in the digesters.
Transport and Storage
13 Duoliners are able to transport fresh feedstock in one direction and digestate on the way back.

Biogas for Road Vehicles | Technology Br ief16
The biogas production process is based on microbiological activity. The feedstock must be “edible” for the organisms. Thus, most feedstocks require pre-treatment (either physical, through crushing or heating; or biological, by adding enzymes) to ensure homogeneity, with a particle size typically less than 10 mm. A suitable pre-treatment can have a positive effect on digestion-process efficiency, which in turn affects utilisation of the feedstock’s energy potential.
The pre-treatment method depends mainly on the feedstock being used and the implemented technology for the digestion process. Most pre-treatment processes aim to maximise the surface of the feedstock (by breaking the feedstock particles) and to crack the material in order to make the degradable part of the feedstock available for microorganisms. Hygienisation may be necessary for some substance groups that are critical from an epidemiological and phytohygienic standpoint. In this case, pre-treatment consists of heating the
substances to a temperature of 70°C for at least one hour (FNR, 2010).
The in-feed of the feedstock normally takes place in a quasi-continuous way by feeding the digester in several batches in a course of the day. This process-step is very important, since a continuous flow of feedstock through the biogas plant is ideal for a stable digestion process. Discontinuous feeding is typically only used in the case of dry batch fermentation, which is not used very often and usually for biogas production from household waste.
The type of feeding technology utilised depends mainly on the consistency of the feedstock. Pumps may be used in the case of pumpable feedstock. Stackable feedstock may either be fed indirectly, by mixing the feedstock with liquid feedstock or recirculated digestate before feeding it into the digester, or directly, such as by means of screw conveyors. In the case of dry batch fermentation, feeding is done by placing the dry matter into a container using a wheel loader. In small-scale plants manual feeding by hand is typical.
Pre-treatment and In-feed

Biogas for Road Vehicles | Technology Br ief 17
Anaerobic Digestion (AD) is a process of organic material degradation by microorganisms under anaerobic conditions (without light and oxygen-depleted conditions) through four steps: hydrolysis, acidification, acetic acid production and methane production (see Figure 5). The process typically takes place simultaneously in one or more digesters, which can be placed in a line or parallel and at different temperatures. Composition and characteristics of biogas differ according to the feedstock, the digester setting and the operational conditions. AD technologies show a very broad range of different set ups. They can be actively heated to mesophilic or thermophilic conditions or operate less efficiently at ambient air temperature. Active mixing improves the process performance.
Based on feedstock characteristics digestion technologies are divided in three categories:
1) Wet continuous system: with low-solids (less than 20% dry matter content in the fermentation process – dry matter), based on continuously stirred tanks, vessels or lagoons
2) Dry continuous system: with dry matter between 15% and 45%, based on horizontal or vertical plug flow reactors
3) Dry batch system: high-solids with dry matter between 28% and 50%, based on garage and percolation systems
The digesters can operate in single or multi-stage combinations. The digestate as an end product is stored in a tank and can be used as fertiliser.
Anaerobic Digestion
Figure 5: Stages of organic material degradation by microorganisms under anaerobic conditions
Source: Strippel et al. (2016)
1. PhaseHydrolysis
hydrolytic acidogenic
micro-organism micro-organism
acetogenetic methanogenic
2. PhaseAcidogenesis
3. PhaseAcetogenesis
4. PhaseMethanogenesis
BiomassCarbohydrates
ProteinsFat
SugarAmino AcidFatty Acid
Fatty Acid(Propanoic Acid)
Acetic Acid
BiogasCH4/CO2
H2/CO2

Biogas for Road Vehicles | Technology Br ief18
Biogas upgrading processes are required for vehicle fuel production in order to reach the gas quality standards implemented by several countries. In addition, biogas used as vehicle fuel requires high energy content, which requires purification as part of the production process.
Purification of biogas consists of removal of contaminants and impurities such as hydrogen sulfide and water vapour. Depending on the biogas origin, hazardous trace compounds such as siloxanes or volatile organic compounds (VOC) may also need to be removed. This is especially the case when biogas originates from waste water treatment plants or landfills.
Hydrogen sulfide needs to be removed because it is significantly corrosive. Hydrogen sulfide can be removed directly in the digester either during the AD process (most common), in a step before the CO2 removal or even within the upgrading process.
In the digester, hydrogen sulfide separation is carried out by adding oxygen in the digester to induce biological desulphurisation (microorganisms consuming oxygen convert H2S in smaller molecules) or by additives catching hydrogen sulfide in the fermentation liquid. The H2S content decreases, from a range of 3 000 parts per million (ppm) to
5 000 ppm, to a smaller one of 50-100 ppm. In order to get even lower H2S contents (<5 ppm), which are necessary when using biogas as vehicle fuel, it can be removed by additional adsorption (impregnated activated carbon) or sodium hydroxide scrubbing.
Water vapour is also removed either by refrigeration (compressed biogas cooled in an exchanger to separate water as liquid stream) or adsorption with a drying agent (silica gel or aluminium).
Siloxanes and VOC do not occur in every type of biogas, but most likely in biogas from waste water treatment and landfills. Also, defoaming agents and lubricants are identified as sources especially for siloxanes in biogas (Köppel et al., 2014). Some types of siloxanes and VOC are water soluble, and some are not. That is why some siloxanes and VOC are already removed in upgrading technologies based on liquids, such as water scrubbers. In order to get rid of all siloxanes and VOC, additional cleaning needs to take place using activated carbon filters. In order to avoid any breakthrough of these components in case of a fully loaded filter, usually a second filter is installed and a periodic sampling of the downstream gas is taken in order to identify a potential breakthrough.
Upgrading and Purification

Biogas for Road Vehicles | Technology Br ief 19
Upgrading of biogas takes place by CO2 removal. The energy content is directly proportional to its methane concentration and removing CO2 increases the biogas’ calorific value.
CO2 removal technologies commonly used are based on absorption (transfer of CO₂ into certain fluids), adsorption (transfer of CO₂ through solid material) or separation by membranes (see Figure 6). All technologies have similar performance and related capital costs, but differ in details concerning energy demand and process parameters. Since costs for biogas upgrading decrease significantly with the size of the plant (see also the section on costs that follows), most biogas plants, which upgrade the biogas to biomethane have a relatively large capacity (commonly above 200 m3/h raw biogas). Therefore, most technology
providers focus on capacities above 200 m3/h raw biogas. Nevertheless, some providers offer small-scale upgrading technologies, in the range of 20 m3/h to 200 m3/h raw biogas, either often based on adaptations to standard technologies.
In the pressurised scrubbers, compressed biogas (usually 5-10 bars) is injected at the bottom of an absorption column, while pure water or solvent is injected at the top. Through packing (increasing the contact surface), CO₂ and H₂S are transferred into the water/solvent, whereas methane is not being absorbed and therefore leaves the column at its top. This is based on the fact that CO₂ and hydrogen sulfide are more soluble in water or in an organic solvent than methane.
Figure 6: Common methods for CO2-separation for biogas upgrading
Pressure-SwingAdsorption
Physical OrganicScrubbing
Physical
Adsorption
AbsorptionBiogas Biomethane
Chemical
Separation byMembranes
Water Scrubbing
Amine Scrubbing

Biogas for Road Vehicles | Technology Br ief20
Source: Beil (2016)
At the head of the column, the biogas as enriched methane is dried and a biomethane output stream can be recovered. At the bottom, the output stream contains mainly water/solvent and CO2 with a small amount of H2S and methane (methane has very low solubility). Then, its injection into a flash tank, allowing a significant drop in pressure, leads to the dissolved gas release, containing mainly CO2 and traces of methane. This gas is then reinjected into the raw biogas input stream.
Water output from the flash tank has to be regenerated. CO2 and H2S must therefore be removed using a desorption process, with air
in a stripping vessel. In a physical scrubbing process, the solvent may be heated to allow desorption. The reclaimed water/solvent is then conducted back to the absorption column for reuse.
The chemical scrubber operates based on a chemical reaction between CO2 and the liquid media – generally a solution of amines. Separation efficiency is higher in organic solvent than in water, reflecting the greater selectivity between CO2 and H2S, on one hand, and CH4, on the other. This leads to lower methane losses and higher methane concentration in the product gas. In comparison with a physical scrubber, the process
Figure 7: Block diagram of the water scrubbing process
Biogas
Compressor CompressorGas cooler
Flash tank
Gascooler
Scrubber
Gas Drying system
Gas cooler
Pump
Biofilter
Stripper
Air Supply
Effluent
Water supply(1m3 per day)CondensateCondensate
DehydratorDehydrator
Waste gas
Biomethane

Biogas for Road Vehicles | Technology Br ief 21
normally works under ambient or only slightly above ambient pressure. Consequently, while the process requires less electricity (for compression), thermal energy (up to about 160°C) is needed to regenerate the solvent.
In the pressure swing adsorption (PSA) process, biogas is pretreated to remove hydrogen sulfide by adsorption. Adsorption of CO2 then occurs by adsorbent materials in a vessel at elevated pressure (usually 4-7 bars). At the top, the biomethane is recovered. When the adsorbent material is almost saturated with CO2 and not able to adsorb as much methane as necessary anymore, it is
emptied in order to release the CO2 to the atmosphere. Afterwards the process step of adsorbing methane under pressure takes place again. In order to have a continuous process, several vessels (generally six) are operated at the same time, each at a slightly different stage of the overall process.
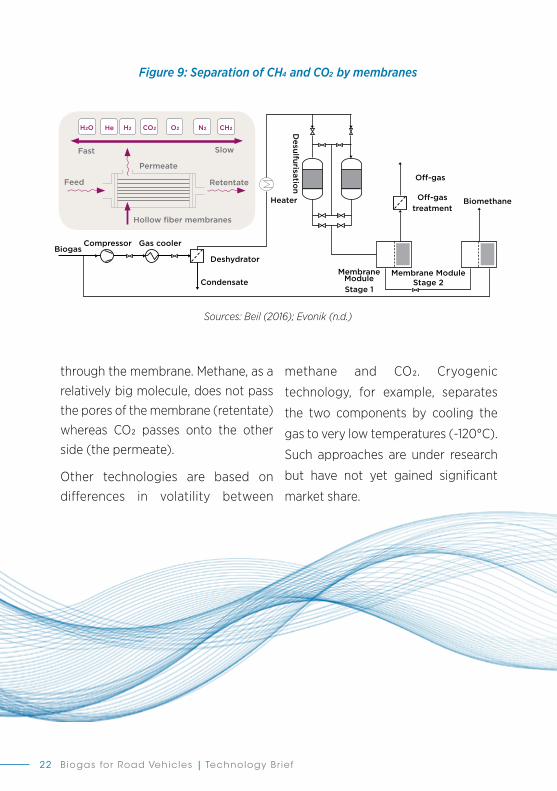
The process of separation by membranes is a relatively new technology for biogas upgrading but has rapidly gained a significant market share (Hoyer, 2016). After the biogas is purified (especially from particles, H2S and other trace compounds), dried and compressed (between 4 bars and 16 bars, depending on design), it passes
Figure 8: Diagram of pressure swing adsorption (PSA)
Source: Beil (2016)
Desulfurisation
Compressor
Biogas
Biomethane
Flushing gas
Compressor Gas coolerCondensate
PSA1
PSA2
PSA3
PSA4
Dehydrator Vacuumpump
Waste gas
Biogas for Road Vehicles | Technology Br ief22
through the membrane. Methane, as a
relatively big molecule, does not pass
the pores of the membrane (retentate)
whereas CO2 passes onto the other
side (the permeate).
Other technologies are based on
differences in volatility between
methane and CO2. Cryogenic
technology, for example, separates
the two components by cooling the
gas to very low temperatures (-120°C).
Such approaches are under research
but have not yet gained significant
market share.
Figure 9: Separation of CH4 and CO2 by membranes
Sources: Beil (2016); Evonik (n.d.)
CompressorBiogas
Gas cooler
Deshydrator
Condensate Membrane
ModuleStage 1
Membrane ModuleStage 2
Off-gas
Heater
Desulfurisatio
n
Off-gastreatment
Biomethane
Fast
Feed
Permeate
Slow
Retentate
Hollow fiber membranes
H2O H2He CO2 O2 N2 CH2

Biogas for Road Vehicles | Technology Br ief 23
Usually the upgraded biogas (biomethane) is transported to the filling stations via public gas pipelines. Therefore, it needs to be compressed to the pressure at which the pipeline is operated. Alternatively, the biomethane can be transported by trucks in high-pressure (200-250 bars) gas bottles or directly used at a filling station at the location of biomethane production.
Biomethane must reach certain quality requirements for methane and water vapour content to be transported by trucks. For example, US Department of Transportation requirements include a minimum methane content of 98% and water content of less than 10 ppm. Carrying biomethane by road involves additional transportation and capital-equipment costs and most likely extra costs for compression at the filling station. Indeed, this method is not commonly used, except in specific situations.
For biomethane injection and transport in the public gas distribution system many countries have established regulations, which, for example, define gas quality requirements as well as
responsibilities for the planning, building, financing and operating of the grid injection unit. Concerning gas quality, biomethane must usually reach natural gas specifications and fulfil threshold values regarding biogas specific trace compounds. To be injected into a vehicle, biomethane must be compressed to at least 200 bars at the refilling station, in order to exceed the pressure in NGV fuel tanks.
Aside from compressed biomethane (CBG) uses, biomethane can also be supplied and used as fuel in the form of liquefied biogas (LBG or bio-LNG). This is an especially interesting solution for heavy-duty transport either on roads or by ships, because the energy density is much higher and therefore longer distances can be reached with the same fuel storage capacity. As for heavy-duty transport, not many other alternatives for renewable fuel are available. This seems to be a promising option for the future. Nevertheless, liquefying biomethane (or natural gas) is an expensive and energy-intensive process.
Distribution as vehicle fuel

Biogas for Road Vehicles | Technology Br ief24
Biogas vehicle configurationSince biomethane has a similar quality to natural gas, it is in fact a “drop-in” substitute for fossil natural gas. It can be used in a NGV without specific requirements. Both light and heavy-duty natural gas vehicles can be filled with biomethane.
A gasoline car can quite easily be converted into bi-fuel gas operation by adding a second fuel supply system and storage cylinders for methane. A bi-fuel vehicle can be operated on either gasoline or methane. For a new factory-built passenger car
the bi-fuel option means an additional cost of about EUR 2 000, the major part of the additional costs coming from the gas cylinders. Vehicles can also be retrofitted for bi-fuel operation. As for performance, methane delivers almost the same performance and efficiency as gasoline. Typical range for a bi-fuel vehicle in gas mode is 400 km to 500 km.
A dedicated gas engine means a spark-ignited engine that is converted to run on gas only. Methane has, compared to gasoline, higher
Figure 10: Numbers of natural gas vehicles and filling stations in leading markets
Source: Papacz (2011)
Argen
tinia
India
Armen
ia
Iran
Banglad
esh
Italy
Bolivia
Pakist
an
China
Thail
and
Colom
bia
Ukrain
e
Egypt
USAUzb
erkis
tan
Brasil
Peru
4 500 000
4 000 000
3 500 000
3 000 000
2 500 000
2 000 000
1 500 000
1 000 000
500 000
0
7 000
6 000
5 000
4 000
3 000
2 000
1 000
0
Num
ber
of
Nat
ural
Gas
Fue
ling
Sta
tio
ns
Num
ber
of
NG
V
Number of Natural Gas Fueling Stations Number of NGV

Biogas for Road Vehicles | Technology Br ief 25
knock resistance. A dedicated gas engine can therefore attain a higher compression ratio than a standard gasoline engine, a feature that offers slightly better energy efficiency than gasoline operation.
Dedicated gas engines are typically used in light-duty commercial vehicles (vans) and in city buses. Several bus manufacturers offer gas buses, from conventional two-axle buses up to articulated buses.
There is also a limited offering of trucks with spark-ignition engines. The maximum power output of gas engines for trucks is around 400 horsepower(hp). Gas powered trucks are typically used for urban services, e.g. delivery and refuse collection. Storing the gas in liquid form (LNG, LBG) instead of compressed gas (CNG, CBG) enables longer driving distances.
Dual-fuel engines, which use diesel fuel and gas simultaneously, hold a promise of diesel-like efficiency and power output. The advantages of such a system are rather limited engine modifications and the possibility to run 100% on diesel fuel as a back-up. The drawbacks of the concept are high emissions of unburned methane, rather low diesel substitution (typically 50% to 60%) and no real benefits for regulated emissions.
The number of NGV worldwide has grown over the last few years and more and more countries have established the use of biomethane as an alternative or additional fuel for these cars. Figure 10 shows the countries with the largest NGV fleets worldwide. Globally, there were about 22.7 million NGV operating in 2015. In 2011, 210 000 heavy-duty vehicles (70 000 buses and 14 000 trucks) were using gaseous fuels according to Papacz (2011).

Biogas for Road Vehicles | Technology Br ief26
The total cost of biogas production from AD depends principally on the prices of feedstocks and the plant capacity. In general, both capital and operation-and-maintenance (O&M) costs decrease significantly with the plant scale (characterised by plant capacity), while consumption related costs (especially for feedstock supply) only decrease slightly with larger plant capacities.
Commonly, capital-related costs for biogas production are lower from industrial organic waste and residues than from energy crops. The difference is between 25% and 30% in analysed biogas production capacities (see Figure 11). This is because in the case of industrial organic waste or residues, handling and storage are usually already installed or should be built regardless (i.e. not especially for biogas production, so it does not lead
to additional costs). When producing biogas from municipal waste, the overall cost depends very much on the definition of economic boundaries, e.g. which investments are included in the bill of biogas production. For example, waste collection (which needs to be done anyway, even without biogas production from the waste) and composting of the digestate (which is often done without anaerobic digestion of the waste as a first step before composting) may be considered as costs for biogas production or as separate costs. In almost any case, the cost of the digester represents the largest share of the total investment for AD (40-45% for energy crops and 55-60% for agricultural or industrial waste with the analysed biogas production capacities; see Figure 11). In addition to investing into the digester, investment is mainly
The costs of biomethane production and supply for vehicle use include three distinct elements: capital related costs (investment into machine technology, buildings and structure, etc. as well as interest for the invested money) operation-related costs (maintenance, services, labour cost, etc.) and consumption-related costs (feedstock, auxiliary energy). In
this section the total costs will first be shown separately for the main process steps:
i) anaerobic digestion, ii) upgrading to biomethane and iii) distribution.
Finally, these costs will be summarised for the overall costs for the biomethane supply as vehicle fuel.
Costs
Biogas production from anaerobic digestion

Biogas for Road Vehicles | Technology Br ief 27
necessary for feedstock storage (especially in the case of energy crops), equipment for pre-treatment and feeding, buildings, as well as electrical and control systems.
Operation-related costs include, above all, costs for maintenance and repair as well as labour costs. When energy crops are used for biogas production, operational costs are typically a little higher compared to biogas production from agricultural and industrial waste, due to the handling of the feedstock at the plant (see Figure 11).
Consumption-related costs can be divided into costs for feedstock supply and auxiliary energy that is needed for operating the biogas plant. The costs for feedstock can be very different. Costs for energy crops as feedstock are usually more expensive compared to waste products and depend mainly on global agricultural commodity prices as well as local circumstances like soil fertility and regional climate conditions. Some waste products may be available free of charge or biogas plant operators may even receive money for waste treatment. The following costs (or revenues, reflected by negative costs) are common values
for biogas production from these feedstock types in Central Europe:14
• Energy crops (e.g. corn silage, sugar beet, wheat grain): USD 9/GJ to USD 14/GJ
• Agricultural waste products (mainly slurry and manure): USD 0/GJ to USD 6/GJ
• Industrial waste products (e.g. distillery stillage, grain vinasse): USD 3/GJ to USD 6/GJ
• Municipal waste (municipal solid waste or sewage sludge): USD -20/GJ to USD -9/GJ
Heat is required to reach the optimal temperature for the digestion. With relatively dry feedstock (e.g. energy crops), heat requirements are comparatively low and consequently the heat costs, since less water needs to be heated in comparison to using manure or industrial wastewater. Additionally, heat demand depends on the climate conditions at the location of the biogas plant. Typically, 5-10% of the total energy from the produced biogas is needed for heating the digesters.
14 Based on typical methane yields for the feedstock mostly used within these categories. Cost estimations result from the author’s consulting experience.

Biogas for Road Vehicles | Technology Br ief28
In addition, electricity is used to operate pumps, monitor the process and carry out other essential tasks. Electricity demand depends mainly on the choice of technology for biogas production and typically varies between 20 kilowatt-hours-electrical (kWhe) and 30 kWhe per Megawatt-hour (MWh) of biogas produced.
In the analysed range of production capacities (500 m3/h to 2,000 m3/h raw biogas production), the costs vary between USD 0.55/m3 and USD 0.81/m3 methane for energy crop based biogas production, USD 0.23/m3 to
USD 0.41/m3 methane for manure based biogas production and USD 0.12/m3 to USD 0.52/m3 methane for biogas production based on industrial waste products.
Notably, transporting the amount of required feedstock in the case of using waste or residues (especially manure) for large production capacities (500 m3/h raw biogas and more) is a challenge in practice, as corresponding feedstock amounts are rarely available in the local radius of a biogas plant. Therefore, biogas production at capacities above
Figure 11: Capital, operational and consumption
Based on Urban et al. (2009)
Min
Max
Min
Max
Min
Max
Min
Max
Min
Max
100 100 100200 200 200500 500 5001000
Energy Crops Manure
Capacity in m3/h raw biogas production
Consumption related costs
Substrates Auxillary PowerCapital realated costs
Co
sts
for
bio
gas
pro
duc
tio
n in
USD
/m3 C
H4
Operation ralated costs
Industrial Waste
1000 10002000
1.0
0.9
0.8
0.7
0.6
0.5
0.4
0.3
0.2
0.1
0.0
-0.1
-0.2
2000 2000
Min
Max
Min
Max
Min
Max
Min
Max
Min
Max
Min
Max
Min
Max
Min
Max
Min
Max
Min
Max

Biogas for Road Vehicles | Technology Br ief 29
500 m3/h raw biogas will practically be realised with feedstock mixtures, i.e. using different feedstock, which leads to corresponding production costs. On the other hand, biomethane production at lower capacities
is relatively costly, because of
high specific costs for small-scale
biogas production, upgrading and
distribution, as shown in the next
paragraphs.

Biogas for Road Vehicles | Technology Br ief30
Upgrading systems are necessary to reach the quality requirements for biomethane combustion in vehicles. The total cost for biogas upgrading is influenced by plant capacity, technology used and project-specific
circumstances (e.g. necessary biomethane quality, quality of raw biogas, available auxiliary power and environmental regulations). Capital and operating costs decrease significantly with larger installed capacities.
Upgrading
Figure 12: Specific costs for biogas upgrading based on a company survey from 2012
Source: Adler et al. (2014); Bauer et al. (2013); Blom (2012).
1 At an early stage of develoopment (in 2012); Today membrane technology is much further developed
2 Based on a solvent named Genosorb
3 Today known as Hitachi Zosen Inova
Spec
ific
upg
rad
ing
co
sts
in U
SD/m
3 CH
4
USD
/m3 C
H4
m3/ raw biogas
Upgrading capacity in m3/h raw bigas
Small Scale upgrading
250 500 750 1000 1250 1500 1750 2000
0.4
0.35
0.3
0.25
0.2
0.15
0.1
0.05
0
1.5
1.0
0.5
0.020 50 100 200
Membranes (Axiom)1
PSA (Carbotech)
Water Scrubbing (Greenlane)
Physical Scrubbing (Haase)2
Water Surubbing (Malmberg)
Chemical Scrubbing(MT Biomethan)3

Biogas for Road Vehicles | Technology Br ief 31
The costs shown in Figure 12 focus on the commonly used technologies, water or amine scrubbers, pressure swing adsorption and separation by membranes. The results of a company survey from 2012 show upgrading costs between USD 0.17/m3 and USD 2.50/m3 of methane in the case of 500 m3/h raw biogas upgrading capacity, USD 0.14/m3 to USD 0.18/m3 of methane in the case of 1,000 m3/h, and USD 0.09/m3 to USD 0.16/m3 of methane at 2 000 m3/h raw biogas upgrading capacity.
A rough calculation based on Adler et al. (2014), Bauer et al. (2013) and Blom (2012) shows upgrading costs for small-scale upgrading (in the range of 20-200 m3/h raw biogas) between USD 0.25/m3 and USD 1.07/ m3 for methane, with the smallest capacity entailing the highest cost.
This shows a significant cost increase with reduced upgrading capacity. With respect to technology there are specific differences in upgrading costs, whereby these are very much influenced by the project-specific circumstances. For example, upgrading with chemical scrubbing might have an economic advantage if cheap heat is available on-site as auxiliary power.
For upgrading technologies, which work at relatively high pressure (e.g. separation by membranes), grid injection costs can be saved, if the biomethane is injected into gas grids that are operated at high pressure. With regard to membrane technology in general, this was at an early stage of development in 2012 and has been developed significantly since then.

Biogas for Road Vehicles | Technology Br ief32
Typically, biomethane production and biomethane consumption take place at different locations. But in the best-case scenario the biomethane fuel station is located close to the production plant. In such cases no additional cost for distribution apply except for the cost of methane storage to equalise biomethane production and biomethane use. In all other cases distribution is connected with cost.
Biomethane distribution from the production plant to the end users location can be either done using a natural gas grid, transported as compressed biomethane gas (CBM) or as liquefied (LBM) and distributed by truck to the filling station. Gas grid injection is the most common and often the most cost efficient solution, if a gas grid is available close to the production plant (<5 km).15 Transport by the gas grid entails two main costs:
1. grid injection (capital and operation related costs);
2. gas transport (investment into the public gas grid and its operation).
The second matter of expense can differ very much between regions
and countries and therefore will not be taken into account here. Also the prices for fuels at the filling station differ very much between countries. That is why a comparison between costs for biomethane production and supply and conventional fuels is done at the point after grid injection. Individual costs vary greatly between countries, both for grid transport (usually involving a fee paid by the one taking the gas from the grid) and in relation to costs for comparable fuels (including taxes).
Calculations for typical cases in Germany show that grid injection costs mainly depend on the injection capacity and the operating pressure of the gas grid. If the biomethane plant is far away from the grid connection point (>10 km), the costs for grid connection, especially capital related costs, may have a major share of the overall grid injection costs. Particularly, capital costs decrease with higher injection capacities since operational costs decrease only slightly with the injection capacity (see Figure 13). The difference between minimal and maximal costs mainly reflects different costs for
Biomethane distribution
15 Many countries have defined regulations, which allow and guarantee a virtual use of biomethane different to the physical flow of the biomethane that is injected into the gas grid. That is why the blending with natural gas in case of biomethane grid injection has to be distinguished from the virtual use of the biomethane, e.g. at a filling station.

Biogas for Road Vehicles | Technology Br ief 33
compression of the biomethane. The minimum cost represents the case of biomethane injection into distribution gas grids working at low pressure (here: 300-800 millibars), while the maximum cost represents biomethane injection into transport grids (here: maximal operating pressure: 55 bars, with an outlet pressure from the biogas upgrading plant of 5-8 bars).
The results show that the largest share of the operational costs are the costs for conditioning the biomethane by adding liquefied petrol gas (LPG). This is necessary in most cases, in order to adapt the heating value of the biomethane to that of the gas inside the gas grid. Nevertheless, there are situations, where this can be avoided (e.g. gas with a low heating value
inside the gas grid, small volume of biomethane injected in comparison to the flow rate in the gas grid, alternative solutions for the adaption of the heating value).
As for upgrading costs, the costs for biomethane injection into the gas grid increase significantly when the injection capacity is reduced. As Figure 13 shows, grid injection costs (based on the circumstances in Germany) can vary between USD 0.06 and USD 0.47 or more per m3 methane.
Additional costs for biomethane distribution via the gas grid occur as a fee for the transport in the public gas grid. These costs differ very much between countries, regions and the amount of gas transported (overall
Figure 13: Costs for biomethane grid injection based on cost analysis in Germany
Min Max
100
Min Max
200
Min Max
500
Min Max
1 000
Min Max
2 000
Co
sts
for
bio
met
hane
gri
d in
ject
ion
in U
SD/m
3 CH
4
Capacity in m3/ raw biogas
0.8
0.7
0.6
0.5
0.4
0.3
0.2
0.1
0.0
Operational costs
Capital costs
Grid connect.
Conditioning LPG
Measurement/ Odourisation
Compression
Source: Urban (2010)

Biogas for Road Vehicles | Technology Br ief34
amount per year and maximum output capacity). In Germany, for example, the fees for gas grid utilisation for typical amounts and capacities of gas filling stations vary between USD 0.05/ m3 of methane and USD 0.26/m3 of methane. These fees are the same for natural gas and biomethane that is transported via the gas grid.
Based on calculations and a literature review, the SGC Report 296 (Vestman, Liljemark and Svensson, 2014) shows costs for biomethane distribution between USD 0.09/m3 and USD 0.22/ m3 of methane. Costs for biomethane distribution on the road (by high-pressure steel cylinder on trucks) represent the upper end of the range (USD 0.17 to USD 0.22/ m3 of methane). In regions without an extensive natural gas grid, road transportation may be a viable option.
Finally, there are costs for the construction and operation of the filling station. Costs mainly depend on the size of the filling station and whether it is a fast or a slow filling station. For public purposes, fast filling stations are normally required and slow filling stations only, for example, for filling a company’s fleet overnight. According to (Harklerod, n.d), the
overall costs for financing and operating a fast-filling fuelling station with a capacity of 3 500 m3/day are about USD 0.5/m3 of gas.
Another option for transport is the liquefaction of biomethane in order to produce liquefied biogas (LBG; qualitatively corresponding to fossil LNG), which has a much higher energy density in comparison to compressed biomethane at 200 bars (roughly three times higher) and therefore can be transported more easily. Since there is not much practical experience with this option, only few numbers on production costs for LBG exist.16
In general, LBG production is more expensive compared to the production of compressed biomethane. Therefore, LBG production can only be justified in the case of very large transport distances (>100 km) or long driving distances of trucks or ships without stops for re-fuelling. A study about perspectives and the potential of low emission LNG in the northwest of Germany show costs for the liquefaction of biomethane in the range of USD 0.07/m3 to USD 0.35/m3 of methane for production capacities of 3 m3/h to 300 m3/h of raw biogas.
16 Liquefaction of natural gas is common practice, but in the case of biogas liquefaction, capacities are much smaller and therefore lead to higher specific costs.

Biogas for Road Vehicles | Technology Br ief 35
The total cost for the supply of biomethane as vehicle fuel varies, with cost ranges of USD 0.75–1.94/m3 from energy crops, USD 0.40–1.63/m3 from manure, and USD 0.28–1.63/m3 from industrial waste for biogas production (see figure 14).
When comparing these numbers, the following aspects need to be taken into account:
• These costs do not include costs for the operation of the public gas distribution system and the filling station, as these costs differ very much from case to case. So the costs can be compared to exchange prices for natural gas but not final consumer prices.
• Besides their dependency on the feedstock and the capacity scale, the costs mainly depend on the operating pressure of the gas grid, where the biomethane is injected, the upgrading technology
and regulations on biomethane production and use, such as environmental, safety and gas quality standards.
• There are very few practical cases, in which biomethane can be produced from only waste and residues at the very low costs as shown here, since the required amount of feedstock for corresponding large biomethane production capacities are rarely available in the local radius of a biogas plant.
• Last but not least, conservative figures are presented here, which are valid for central European cases with demanding environmental and safety regulation, high labour costs and high-end technology use. Thus, for local evaluation different economic figures will result in the best-case scenario for lower total production costs.
Total production cost for biomethane as vehicle fuel

Biogas for Road Vehicles | Technology Br ief36
Figure 14: Total production costs for biomethane used as vehicle fuel by feedstock and size
Sources: Urban et al. (2009); Urban (2010); Adler et al. (2014)
Biogas production Biogas cleaning & upgrading Biogas distribution (via gas grid)
Energy Crops
Capacity in m3/h raw biogas
Min Max
100
Min Max
100
Min Max
100
Min Max
200
Min Max
200
Min Max
200
Min Max
500
Min Max
500
Min Max
500
Min Max
1 000
Min Max
1 000
Min Max
1 000
Min Max
2 000
Min Max
2 000
Min Max
2 000
2.5
2.0
1.5
1.0
0.5
0.0
Co
sts
for
bio
met
hane
sup
ply
in U
SD/m
3 CH
4 Overall supply costs after grid injection, without gas gridoperation free and capital and O&M cost of filling station
Historical natural gas price at the New York Mercantile Exchange(last 3 years: 0.11 USD/m3 NG equ) *
Historical Oil price at the New York Mercantile Exchange(last 3 years: 0.42 USD/m3 NG equ) *
Industrial WasteManure

Biogas for Road Vehicles | Technology Br ief 37
Performance and sustainability
The overall energy performance of biogas or biomethane17 production from different feedstocks depends on multiple parameters along the process chain.
It is largely determined by which feedstock is used. Energy contents of feedstock for biogas production
differ due to different compositions. In addition only a certain share of this energy can be made available by (AD) depending on the anaerobic degradability of the feedstock. This results in a feedstock specific biogas yield in m3 per tonne of fresh matter (see Figure 4).
Figure 15: Ranges of passenger calls with different biofuels
Sources: FNR (2016); Hoornweg (2012)
Energy performance
Bioethanol (1 ha) 22 400 km +14 400 km* 60 000 km equals a consumption of:
3 660 liters of diesel (6.1 L/ 100 km)
4 440 liters of gasoline (7.4 L/ 100 km)Biodiesel (1 ha) 23 300 km +17 600 km*
Rapeseed oil (1 ha) 23 300 km +17 600 km*
Pig manure from 50 pigs during one year 60 000 km
Municipal waste from 250 persons during one year 60 000 km
* Light grey bar represents the additional range if biomethane from ethanol by-products (rapeseed cake,
stillage, straw) is used as transport fuel
BtL (Biomass-to-Liquid) (1 ha) 64 000 km
Biomethane from 1 ha of corn 67 600 km
17 Energy performance here means the amount of energy as output in comparison to the sum of energy input (inside the biomass and all auxiliary energy).

Biogas for Road Vehicles | Technology Br ief38
On one hand, this biogas yield depends on the chemical composition of the feedstock. Overall, fats provide higher biogas/methane yields than carbohydrates and proteins. In terms of feedstock categories, most energy crops provide higher specific biogas yields than animal manure, industrial organic waste, waste waters and sewage sludge. This is because most waste feedstocks include high water content. In addition, in the case of animal manure, degradable biomass would already be consumed in the animal’s rumen during digestion.
On the other hand, the theoretical biogas yield is never reached in practice, as the feedstock is never kept long enough in the digester in order to make use of the whole theoretical biogas potential. This is due to economic optimisation and an ideal digester volume along with corresponding hydraulic retention times that have to be chosen in practice, finding a good balance between investment cost for the digester (which increases with volume) and utilisation of the potential biogas yield. Generally, feedstocks with high costs (e.g. energy crops) and relatively slow digestion characteristics should
be kept in the digester for a long time (>50 days), whereas relatively cheap and fast, easily degradable feedstocks (e.g. manure) can stay in the digester for a relatively short time (20 days to 30 days). In some countries rules exist, which define a minimum retention time in order to avoid methane emissions from undigested feedstock.
Figure 15 shows average ranges of passenger cars driven on different biofuels. Biofuels produced from energy crops are based on an average yield per hectare of agricultural area in Central Europe. Comparable ranges can be reached when producing biomethane from the yearly amount of municipal organic waste from 250 habitants or the yearly amount of manure from 50 pigs (see Figure 15).18 As the amount and composition of waste produced by each inhabitant differs especially between regions worldwide, different potentials per inhabitant need to be considered. Separated collection of the organic fraction of municipal waste is ideal for this, because it facilitates the biogas production process and the production of a clean digestate, which can be used as organic fertiliser in agriculture.
18 Based on the following assumptions: i) for municipal waste: 350 kg organic waste per capita and year with 40% dry matter, where from only 80% is practically digestible with 300 m3 biogas per tonne of dry matter and 55% methane; for pig manure: 6 tonnes of manure per pig per year; 26 m3 of biogas per tonne per year; 60% methane; in both cases: 15% of produced biogas for heating of digesters, 8% of theoretical electricity production for biogas plant and upgrading plant operation, 1% methane losses.

Biogas for Road Vehicles | Technology Br ief 39
Experience shows, however, that changing people’s waste-disposal behaviour is one of the biggest challenges and would require strong political support in order to succeed.
It also has to be taken into account that making use of waste with low energy density (e.g. manure) can become economically challenging when producing biomethane. This is due to the rule of economy of scale, which means that biomethane production is only feasible above a certain production capacity. Therefore, a combination of waste with low energy density (e.g. manure, industrial waste water sludge) with high energy-density feedstock (like energy crops) should be allowed in the political framework in order to make use of the available waste for biogas production. Aside from the feedstock-specific biogas yield, energy performance generally depends on feedstock losses during transport and storage; digestion parameters (especially retention time); the energy used in the overall process (including feedstock supply and pre-treatment, digestion,
purification, upgrading and biogas transport); methane losses (mainly via the off-gas stream of the upgrading process); and losses during energy conversion and use (e.g. production of heat or electricity from biogas/biomethane).
Upgrading to biomethane is necessary when using biogas as vehicle fuel. During this step, energy (electricity and heat) is consumed, and a little methane is lost with the off-gas.19 Different upgrading technologies show different numbers with regard to these issues (see Table 1), but the overall efficiency can only be evaluated from case to case, as process energy might be available in a different way on-site and methane losses might be used, for example for generating process heat.
19 With any upgrading process some methane is transferred to the off-gas stream (separated CO2), as the selectivity of all separation principles (absorption, adsorption or permeation of membranes) can never reach 100%.

Biogas for Road Vehicles | Technology Br ief40
Technology (Company)
Pressure Swing Adsorption < 0.19 0 < 1.5% (Carbotech)
Water Scrubber (Malmberg) 0.2 - 0.23 0 ≤ 1%
Water Scrubber (Greenlane) 0.17 - 0.23 0 < 1.0%
Physical Scrubbera (Haase) 0.23 - 0.27 0 c ≤ 1.0%
Chemical Scrubberb (MT Biomethane) 0.09 0.6 ≤ 0.1%
Separation by Membranes (Axiom) 0.24 0 ≤ 5.0%
Separation by Membranes < 0.2 0 < 1.0% (Evonik, > 1 stages)d
Table 1: Process parameters of biogas upgrading technologies
Sources: Adler (2014); Evonik (n.d.); information from companies
a. using an organic solvent
b. using a solvent based on amines
c. requiring heat for regeneration of organic solvent, for which heat recovery from compression and off-gas treatment can help cover heat demand
d. numbers from company product flyers (2016)
Electricity demand (kWhe/m3 raw
biogas)
Heat demand (kWhth/m3 raw
biogas)
Methane losses

Biogas for Road Vehicles | Technology Br ief 41
According to Eurostat (2016), the transport sector, responsible for 51% of the total oil consumption, contributes significantly to GHG emissions. For example, the transport sector in Europe accounts for 23% of the total European GHG emissions in 2014. Biogas as vehicle fuel is typically assumed to have >50% GHG reduction compared to fossil fuels. Its use reduces the fossil fuel consumption.
But its use can reduce GHG emissions not only by substituting fossil fuels, but also by avoiding methane emissions, for example from manure storage and waste disposal.
Estimates of fuel emissions reduction refer to a life cycle assessment. The assessment takes into account the fuel production (from feedstock supply to upgrading, including intermediate transportation for biomethane) and distribution through the gas grid. To identify the biomethane potential with regard to GHG emissions reduction, GHG emissions are compared between biomethane and conventional fossil fuels. Overall, the main greenhouse gases are methane (CH4), carbon dioxide (CO2), and nitrous oxide (N2O). Global GHG emissions results are given in grams of carbon dioxide equivalent
Sustainability
Figure 16: Comparative GHG emissions from passenger cars running on different fuels
Sources: Dahl (2015); Hoornweg (2012); FNR (2016); Official Journal of the European Union (2009)
200
180
160
140
120
100
80
60
40
20
0
164156
141
124
66
3348
11195
174
75
58
GH
G in
g C
O2-
eq/k
m
Fossil Fuels Bio Fuels Electronic Motors
-24% -60% 80% -70%
Based on:–2.2 kg CO2 per litre of gasoline–2.6 kg CO2 per litre diesel
Gas
olin
e
Die
sel
LPG
Nat
ural
gas
(E
U-m
ix)
Bio
met
hane
(f
rom
mai
ze)
Bio
met
hane
(f
rom
liq
uid
man
ure)
Bio
met
hane
(f
rom
org
anic
was
te)
Etha
nol
(whe
at, r
esid
ual m
ater
ials
: an
imal
feed
)
Bio
dies
el
(rap
e se
ed, r
esi d
ual m
ater
ials
: an
imal
feed
)
Hyd
roge
n (
EU
ele
ctric
ity m
ix,
elec
trol
ysis
on-
site
)
Hyd
roge
n (1
00
% w
ind
ele
ctric
ity,
elec
trol
ysis
on-
site
)
E-M
obili
ty
(E
U e
lect
ricity
mix
)
E-M
obili
ty
(10
0%
win
d e
lect
ricity
)

Biogas for Road Vehicles | Technology Br ief42
(gCO2-eq.) for the purpose of clarity and comparison.
Results show that biomethane offers significant reduction of GHG emissions. Current GHG emissions with gasoline and diesel are estimated at 164-156 gCO2-eq./km, respectively. Natural gas used as an alternative fuel emits 124 gCO2-eq./km, equivalent to a 24% reduction compared to gasoline.
Biomethane can improve the results significantly. GHG emissions of biomethane use depend on the feedstock type. With biomethane produced from crops such as maize, GHG emissions are equal to 66 gCO2-eq./km, over half of which is represented by cultivation and harvesting (use of fertiliser) of raw materials and 28% due to upgrading. GHG emissions can be reduced by roughly 60% compared to gasoline.
Manure reduces GHG emissions by about 80% compared to gasoline. Biomethane production from municipal waste and its use as vehicle fuel give GHG savings of 73% compared to a standard comparator for fossil fuels of 83.8 gCO2-eq./MJ, following the Renewable Energy Directive (RED).
This is equal to a reduction of GHG emissions per driven km of roughly 70% in comparison to a gasoline driven passenger car.
To reduce even more GHG emissions from biomethane production, several solutions can be adopted:
• Reuse digestate as fertiliser
• Use a nitrogen inhibitor to slow down the nitrification producing N2O as GHG, which is typically released during digestate storage and spreading as fertiliser
• Reduce the transportation distance of feedstock as much as possible
• Install measuring equipment for methane losses in the anaerobic digestion system
Aside from GHG emission savings, additional factors must be considered when evaluating the sustainability of biomethane production and its use as vehicle fuel. Environmental, social and economic factors are all relevant, as can be seen in the Global Bioenergy Partnership Sustainability Indicators for Bioenergy, first published in 2011. (Global Bioenergy Partnership, 2011).
20 With a fuel consumption of 7.4 l/100km for an Otto-engine and 6.1 l/100km for a diesel engine.

Biogas for Road Vehicles | Technology Br ief 43
Countries leading the way with biogas for transportation are principally Sweden, Switzerland and Germany. Nevertheless, many other countries have a strong potential that can be tapped. The potential is mainly determined by the feedstock resources for biogas production. Since a lack of gas infrastructure (gas grid, gas filling stations and a NGV fleet) hinders the development of the potential for biogas use as vehicle fuel, this will be also analysed in this section.
Biogas can be produced from a large variety of feedstocks, which can generally be categorised as animal by-products, vegetable by-products, industrial waste, organic household waste and energy crops. Various studies have been conducted on biomass and biogas potentials specifically for individual countries, small regions or on a global level. Different results can be explained by different calculation methodologies, boundary conditions and availability of data - especially due to difficulties in getting complete and reliable data.
The most likely resources to be utilised for biogas production are municipal waste and manure, as these can generate high concentrations of methane. Production is also possible from other resources, such as energy crops, crop residues, and residual wood from lumber production, but these other resources have many competing uses such as liquid transport fuel, heat and power. Thus, the potential availability of these resources might be quite significant, but is hard to quantify (IRENA, 2016), for biogas for road transport applications.
Table 2 shows the 10 countries with the highest potential biogas production from municipal waste and animal byproducts worldwide. This potential is mainly determined by population size and waste production, as well as the size of the animal breeding industry. Countries with a large population and high waste production (e.g. China and India21) or large animal-breeding industries (e.g. the US, China, Australia, France, Germany and Canada21) have the largest biogas production potential from these feedstocks.
Potential and barriers
Potential

Biogas for Road Vehicles | Technology Br ief44
With existing NGV infrastructure also taken into account, the countries with the greatest potential to establish a biogas-for-transport market in the near future are China, the US, India, Germany and Brazil, with Brazil’s relatively large NGV fleet and numerous NG filling stations offsetting its a relatively poorly developed gas distribution system. Still these ‘most promising’ countries would need to add significant infrastructure (NG filling stations and vehicles) in order
to make use of biogas as a transport fuel, since the share of NGV among all light duty vehicles is still low and gas-filling stations are typically not available across the country.
Aside from those countries, other countries with smaller populations possess the established infrastructure for gas as vehicle fuel despite less residual biomass available in absolute terms. These include Italy,22 Argentina, Colombia, Pakistan and Iran.
Table 2: Countries with the largest potential for biogas production from municipal waste and animal by-products as well as their existing NGV infrastructure
Source: Thrän et al. (2010); NVG Journal (2016)
*Rating based on gas-grid distribution in comparison to the distribution of population
1 United States 189.6 598.8 788.4 150 000 1 615 very good
2 China 151.2 397.1 548.3 4 000 000 6.500 average
3 India 125.5 19.6 145.1 1 800 000 936 average
4 Australia 8.2 122.7 130.9 3 000 52 good
5 France 12.7 108.1 120.8 14 000 311 average
6 Germany 19.7 94.5 114.2 98 000 921 very good
7 Canada 8.7 92.6 101.3 14 000 89 average
8 Russia 23.7 63.5 87.2 90 000 253 good
9 Brazil 24.3 57.8 82.1 1 781 000 1 805 poor
10 Spain 15.4 65.9 81.3 4 000 86 good
Biogas potential in petajoules (PJ) per year
Number of NGVs
Country Municipal Animal by- Sum Waste products
Number of NG filling
stations
Existing gas distribution
system*
22 With the 15th highest potential for biogas production from municipal waste and animal by-products worldwide.

Biogas for Road Vehicles | Technology Br ief 45
• Municipal or private company operating the fleet has to make a major decision with some economic risk.
• Drivers may have prejudices against the new vehicle technology.
• Higher standards on fleet depots and maintenance garages (e.g. gas warning system)
• A high density of filling infrastructure in a region or country is crucial (particularly to overcome the initial chicken-egg dilemma of adopting new fuels or power sources).23
• A lot of “clean” alternatives (e.g. liquid biofuels, electric cars) are available.
• The high initial investment is more visible for costumers than economic advantage (costs for fuel) over the car’s lifetime.
• Technical limitations: driving distance, less space in the car because of gas cylinder with large volume in comparison to liquid fuel storages.
Bus and truck fleets Individual transport
Challenges
Advantages • Lower emissions in comparison to diesel and gasoline driven vehicles, not only GHG, but also NOx, fine dust and noise
• No driving restrictions as already implemented in some cities for diesel driven vehicles, e.g. by night.
• In some cases biogas can be produced from own resources (e.g. municipal waste, industrial waste).
• Very visible example for other companies, municipalities and people in general.
• Contribution to municipal or company’s targets on GHG emissions reduction.
• Lower emissions in comparison to diesel and gasoline driven vehicles, not only GHG, but also NOx, fine dust and noise.
• Future limitations on these emissions may not be relevant as for diesel-driven vehicles.
• In most countries, lower fuel prices.
23 A lack of filling stations means customers cannot switch to NGVs, while the lack of customers means filling stations are not feasible and will not be built.
Table 3: Developing the potential of biogas use in the transport sector
BarriersBiomethane production is facing several barriers that limit biogas development as vehicle fuel. Table 3 gives an overview of potential barriers with regard to biogas production and use as vehicle fuel.

Biogas for Road Vehicles | Technology Br ief46
Table 4: Barriers to establishment of biogas-to-fuel market and way to overcome them
Decentral biomass availability, in many cases, can lead either to relatively small production capacities or high transport efforts. Both lead to relatively high biomethane production costs. This is especially the case when using animal by-products for biogas production.
Relatively high costs for the biomethane supply as fuel in comparison to fossil fuels under today’s conditions.
The missing awareness about the advantages of biogas as an energy carrier is a hindrance for gaining adequate support from politicians and the people.
Changing and short-lasting regulatory frameworks often do not give stakeholders a reliable basis for investing in biogas projects
Lack of rules with regard to the access to gas grid
Existing structures and stakeholders in the waste business often do not allow for new solutions of waste treatment.
A missing NGV infrastructure (gas grid, filling stations, NGV) makes biogas use as fuel impossible for individual transport.
The economic advantages of NGV are often not known by the costumers.
Regulations on biogas/biomethane production and use need to allow co-fermentation, especially of energy crops in order to reach a minimum production capacity. This, in turn, allows a biomethane supply at competitive production costs.
In order to stimulate a biogas as vehicle fuel market, some economic incentives are needed in most cases today.
Advantages that should be taken into account and promoted as a minimum are:• the potential reduction of GHG emissions and other emissions,
such as NOx, fine dust, noise for use as vehicle fuel;• the utilisation and treatment of waste and residues and therefore
the reduction of ecological damage and closing of material cycles;• the production of organic fertiliser and substitution of mineral
fertiliser;• the substitution of import fuels and reduction of import
dependency;• the creation of national, regional and local added value
(e.g. employment opportunities and local tax income).
Reliable regulation (including incentives) should be guaranteed for at least 15 years, as biogas plant operators need a 10-20-year planning horizon to pay back the investment.
Clear rules for gas grid access are necessary and biogas should have priority before natural gas in terms of transport capacities in the gas grid.
Public authorities should be open for any new solutions of waste treatment and should strongly support establishing separate collection of the organic waste fraction.
Political support is necessary to overcome the chicken-egg situation,24 e.g. through tax reduction or investment subsidies for gas filling stations and/or NGV.
Transparent pricing (with comparable units) should be established at filling stations.
Barrier Solution
24 No filling stations = costumers not willing to buy NGV, no costumers = filling stations are not feasible and are not being built.

Biogas for Road Vehicles | Technology Br ief 47
Sweden has shown the strongest efforts to overcome these barriers in order to establish a biogas-as-fuel market. This is especially impressive since Sweden does not have a widely spread gas infrastructure and therefore most of the biogas used as fuel is transported in high-pressure gas cylinders on trucks instead of being injected and transported via the gas grid.
Sweden was also one of the first countries in which biogas production for vehicle fuel purposes was
implemented. During the early 1990s, the development of biogas production was started in Linköping. In 1996 the city’s biogas plant was finished and since then all of the city buses — around 70 — run on biogas. In addition, many other commercial vehicles run on the fuel, as well as a large number of cars and the world’s first biogas-powered train (Swedish Biogas International, 2013). Since then biogas production and use as fuel has been steadily increasing (see Figure 17).
Best practice examples
Biogas as vehicle fuel in Sweden
Figure 17: Development of biogas and natural gas used as vehicle fuel and a map of the gas infrastructure in Sweden
Source: Dahl (2015); Green Gas Grids (n.d.)
2000
2008
2001
2009
2002
2010
2003
2011
2005
2013
2006
2014
2007
2004
2012
2 000
1 500
1 000
500
0
GWhNatural Biogas Total CNG sales
2% of the totalvehicle fuel
gas
47 000 (1%)
2 300 (16%)
800 (1%)
Buses provide a stable, long-term market – essential to develop
vehicle gas

Biogas for Road Vehicles | Technology Br ief48
Swedish authorities have been supporting this development mainly by giving financial incentives based on tax exemptions or reductions and investment grants (Svennson, 2015):
• No CO2 or energy tax on biogas until the end of 2015 (extension to 2020 pending EU approval)
• 40% reduction of income tax for use of company NGVs until end 2019
• Investment grants for marketing of new technologies and new solutions for biogas during 2010-2016.
• Climate-investment grant for municipalities until the end of 2018
• A fixed bonus for manure-based biogas production to reduce methane emissions from manure.
As long as the requested gas quality is upheld, there is no formal way to refuse grid access for biomethane plants in Sweden. The government and the gas industry have formulated ambitious visions for biogas production and use in Sweden. These include the governmental vision of a fossil-free transportation sector by 2050, and industry goals of 100% biomethane in NGV and 100% biomethane on the national gas grid by 2050. Nevertheless, the biogas industry complains about the lack of a long-term framework from the government since tax reductions are set for a maximum of 5 years.

Biogas for Road Vehicles | Technology Br ief 49
In the city of Berlin in Germany, the organic waste of its inhabitants is separately collected in order to produce biogas from it. The biogas is used as vehicle fuel for the waste collecting trucks. Today more than
150 trucks are running on biogas, collecting 60% of the total waste (not only organic waste) of Berlin. The digestate from the biogas production is sold to farmers, who use it as organic fertiliser.
The public waste collecting company (BSR) can make use of the following key regulations for production and use of biogas fuel in Germany:
• Priority and financial discharge for biomethane injection to the gas grid;
• Clear rules on gas quality, financing and responsibilities for gas-grid injection;
• Obligatory biofuel quotas (currently based on minimum GHG reductions) for all companies selling fossil fuels.25
Biogas based waste collection in Berlin
Figure 18: Organic waste utilisation in Berlin, with biogas produced to fuel waste-collection fleet
Source: BSR (2016); Trennt Magazin (2013)
25 In order to fulfill this quota, companies who sell fossil fuels (gasoline, diesel or natural gas) are willing to pay a price for biofuels (biodiesel, bioethanol or biomethane) above comparable prices for fossil fuels, depending on supply and demand of biofuels.
2. Collection of organic
3. Biogas production3. Biogas
upgrading4. digestive treatment
5. Supply w digestate
6. Food production
1. Separation of organic waste
5. Fuelling of trucks

Biogas for Road Vehicles | Technology Br ief50
The Baltic Biogas Bus projectThis was an EU-funded project that was aiming to encourage cities and regions around the Baltic Sea (Tõnissoo, 2012), to use biogas as a fuel for public transport. The project ended in 2014.
To secure the supply of biogas in the region, further studies were performed in the production technology and it was estimated its potential. Solutions for distribution technologies of biogas and adaptation of bus depots had been analysed and an overview of regional infrastructure planning was presented.
To establish a foundation for biogas bus requirements to present to bus producers, it was analysed operational experiences from use of biogas buses and verified emissions from biogas driven buses. (European Biofuels Technology Platform, 2016) Strategies, policies, financing and regulatory framework to
facilitate biogas bus use were studied. A Manual on “How to introduce biogas buses” has been created in order to guide the production of implementation plans for several cities. Some specific results of the project are listed as follows:
• Stockholm Public Transport has produced a draft report on a strategy on how to introduce biogas-driven buses in public transport.
• Tartu City has started a feasibility study for a new long-term and sustainable transportation plan.
• A study to investigate the possibilities of using landfill gas from the Tveta waste-handling facility plant south of Stockholm to upgrade and use as fuel in buses has been made.
• A study concerning supply and demand of biogas in the eastern region of Sweden has been made.
Figure 19: Natural gas-driven bus in Tartu City
Source: Tõnissoo (2012)
Feasibility study on the introduction and use of biogas buses in the Tartu City
This publication has been produced with the assistance of the European Union (http://europa.eu). The content of this publication is the sole responsibility of Baltic Biogas Bus and can in no way be taken to reflect the views of the European Union."

Biogas for Road Vehicles | Technology Br ief 51
Biogas as vehicle fuel in BrazilThe Itaipu Technological Park (PTI), the centre of education, research, science and technology that has been developed alongside the Itaipu dam on the border between Brazil and Paraguay, has set up a pilot project for biogas production and its use as vehicle fuel (Energias Renovables, 2014).
The campaign is part of a project jointly managed by Itaipu Binacional, Itaipu Technological Park Foundation, the Brazilian subsidiary of the Scania automotive company, Granja Haacke and the International Renewable Energy Centre – Biogas (CIBiogás-
ER). The objective is to demonstrate, control and regulate the production of biogas, transformed into biomethane as an alternative for urban and rural mobility.
For a demonstration phase, there was also a bus from Scania driving on biomethane in order to demonstrate its technical and environmental potential for urban transport with biomethane. The model used in the pilot project is Scania Euro 6, was manufactured in Sweden and originally designed to
operate as a natural gas vehicle (NGV).

Biogas for Road Vehicles | Technology Br ief52
There are some more pilot projects in Brazil, where biogas is produced and upgraded to biomethane. In the case of GNVerde, a pilot project of the regional gas supplier Súlgas in the state of Rio Grande do Sul, the biomethane is also offered for use as vehicle fuel at a local filling station (Sulgas, 2016).
The Dois Arcos Project in Rio de Janeiro, Brazil, where biomethane is produced from landfill gas, has been fuelling two light vehicle cars and one garbage collection truck since December 2016. The project has also had the opportunity to fuel Scania’s Otto cycle bus for a week.
Since the National Agency for Petroleum, Natural gas and Biofuels published a regulation for the grid injection and commercialisation of biomethane as fuel in Brazil, one very important regulatory requirement for
establishing a biogas-as-fuel market has been defined. Nevertheless, further steps are necessary in order to stimulate this market. Biomethane from urban waste, as well as from waste water treatment, has been excluded so far from gas-grid injection and public commercialisation due to uncertainties about limits and verification methodologies regarding hazardous components, such as siloxanes, VOC and aromatics.
There is also no support mechanism for biomethane thus far and rules for its commercialisation on the gas market, which is dominated by regional monopolies of the state owned gas suppliers. In the case of the state of São Paulo, the state regulatory agency ARSESP is currently developing a draft regulation for grid access and distribution of the costs of the grid connection (Brasil Energia, 2016).
Biogas for Road Vehicles | Technology Br ief 53
Generally there is a changing environment in Brazil with regards to the presence of biogas and biomethane in the energy matrix. An important institutional movement is being rolled out by the energy ministry to increase the presence of this fuel in the matrix, mostly because of the country’s big potential. Taking
into account the large NGV fleet in
Brazil, the high production potential
of biogas from agricultural, industrial
and municipal waste, as well as its
dependency on natural gas imports
from Bolivia, biogas may play an
important role especially for transport
purposes in Brazil.
The city of Vaasa, in Finland, has announced that a fleet of biogas-powered buses will start operation in February 2017. A local waste management company will produce the biogas. An important benefit highlighted in relation to this initiative is the creation of local jobs across the complete biogas value chain (YLE, 2016). In India, the city
of Kolkata has started a pilot programme of a bus fuelled by biogas from animal and human waste. The bus will cover a 17km route. Based on the results of the pilot programme the government plans to introduce this type of buses at large scale. The low cost of the biogas fuel is indicated as one of the main drivers behind this initiative (Hindustan Times, 2017).
Other recent developments

Biogas for Road Vehicles | Technology Br ief54
BibliographyAdler, P., E. Billig, A. Brosowski, J. Daniel-Gromke, I. Falke, E. Fischer, J. Grope, U. Holzhammer, J. Postel, J. Schnutenhaus, K. Stecher, G. Szomszed, M. Trommler, W. Urban, (2014), Leitfaden Biogasaufbereitung und–einspeisung (Guideline Biogas treatment and feeding), Fachagentur Nachwachsende Rohstoffe e.V. (FNR), Gülzow-Prüzen
Air Quality (2016), Motor Vehicle Emission Controls: Fuel Types, www.air-quality.org.uk/26.php, (viewed on 14 December 2016).
Baltic Biogas Bus (n.d.), “Project summary so far”, www.balticbiogasbus.eu/web/about-the-project/project-summary-so-far.aspx, (viewed on 29 November 2016).
Bauer, F., C. Hulteberg, T. Persson, D. Tamm (2013), Biogas Upgrading – Review of Commercial Technologies, SGC Rapport 2013, Svenskt Gastekniskt Centre AB, Malmö.
Beil, M. (n.d.), “Technology overview biogas upgrading to biomethane”, Presentation for Fraunhofer Institute for Wind Energy and Energy System Technology, Bremen.
Blom, H., M. McCann and J. Westman, (2012), “Småskalig uppgradering och förädling av biogas (Small-scale upgrading and refinement of biogas: A report to the Agroväst and Energy Farm)”, www.biogasvast.se/upload/Biogas%20V%C3%A4st/Slutrapport%20Sm%C3%A5skalig%20Biogasuppgradering_2012-02-20.pdf, (viewed on 25 November 2016).
Brasil Energia (2016), “Arsesp prepara regulamentacão de biometano em São Paulo (Arsesp prepares regulation of biomethane in São Paulo)”, www.arsesp.sp.gov.br/Documentosgerais/Brasil%20Energia%20Arsesp.pdf, (viewed on 13 December 2016).
BSR (Berliner Stadtreinigungsbetreibe) (2016), Biogasanlage: Klimaschutz mit Bioabfall (Biogas plant: climate protection with bio waste), www.bsr.de/biogasanlage-22250.php, (viewed on 29 November 2016).
Dahl, J. (2015), “Benefits and challenges of bio-methane production in Sweden”, Presentation for DENA European Biomethane Conference, German Energy Agency, Berlin, 12 October 2015.
Eder, B. and H. Schulz (2007), Biogas-Praxis: Grundlagen, Planung, Anlagenbau, Wirtschaftlichkeit, Beispiele, (Biogas Practice: Basics, Planning, Plant Construction, Efficiency, Examples), pp. 237, Ökobuch,ISBN-13: 978-3936896138.

Biogas for Road Vehicles | Technology Br ief 55
Energias Renovables (2014), “En Itaipú (Brasil) ya tienen un autobús impulsado a biogas (In Itaipu (Brazil) they already have a bus driven on biogas)”, www.energias-renovables.com/biogas/en-itaipu-ya-tienen-un-autobus-impulsado-20141117, (viewed on 29 November 2016).
European Biofuels Technology Platform (2016), “R&D&D Funding and Projects”, www.biofuelstp.eu/funding.html?, (viewed on 08 January 2017).
EurObserv’ER (2014), Biogas Barometer, November 2014, www.energies-renouvelables.org/observ-er/stat_baro/observ/baro224_Biogas_en.pdf, (viewed on 25 November 2016).
Eurostat (2016), “Greenhouse gas emission statistics”, Statistics Explained, http://ec.europa.eu/eurostat/statistics-explained/index.php/Greenhouse_gas_emission_statistics, (viewed on 25 November 2016).
Evonik (n.d.), “SEPURAN® Green Membrane technology for upgrading biogas efficiently” Prospect, www.sepuran.com/sites/lists/RE/DocumentsHP/SEPURAN-green-for-upgrading-biogas-EN.pdf, (viewed on 25 November 2016).
FNR (Fachagentur Nahwachsender Rohstoffe e.V.) (2016), Faustzahlen Biogas, http://biogas.fnr.de/daten-und-fakten/faustzahlen/, (viewed on 29 November 2016).
FNR (2013), Leitfaden Biogas – Von der Gewinnung zur Nutzung (Biogas Guide - From Extraction to Use), Gülzow 2013, ISBN 3-00-014333-5.
FNR (2010), Guide to Biogas: From Production to its Use, https://mediathek.fnr.de/media/downloadable/files/samples/g/u/guide_biogas_engl_2012.pdf.
FNR (2007), “Biokraftstoffe im Vergleich (Biofuels in comparison)”, https://mediathek.fnr.de/grafiken/pressegrafiken/biokraftstoffe-im-vergleich.html, (viewed on 13 December 2016).
Global Bioenergy Partnership (2011), Sustainability Indicators for Bioenergy, GBEP, Rome.
Green Gas Grids (n.d.), “Sweden: Natural gas market and infrastructure”, www.greengasgrids.eu/market-platform/sweden/gas-market-and-infrastructure.html, (viewed on 29 November 2016).
Harklerod, G. (n.d.), Select CNG Fuelling Station Issues, www.marcellus.psu.edu/s_files/pdf/3-Harkelrod.pdf, (viewed on 29 November 2016).
Hindustan Times (2017), “First bus to run on biogas to hit Kolkata roads soon”, www.hindustantimes.com/kolkata/first-bus-to-run-on-biogas-to-hit-kolkata-roads-soon/story-ourifRgKxlPfUHbDxcnqSN.html, (viewed on 08 January 2017).

Biogas for Road Vehicles | Technology Br ief56
Hoornweg, D., and P. Bhada-Tata (2012), “What a waste: A global review of solid waste management”, Urban Development Series, Knowledge Papers no. 15. World Bank, https://openknowledge.worldbank.org/handle/10986/17388, (viewed on 29 November 2016).
Hoyer, K. (2016), Biogas Upgrading: Technical Review, Kuala Lumpur May 2016, www.sgc.se/ckfinder/userfiles/files/BAPF2016Hoyer+Energiforsk.pdf, (viewed on 12 December 2016).
International Gas Union (2015), Biogas: From Refuse to Energy, www.igu.org/sites/default/files/node-page-field_file/IGU%20Biogas%20Report%202015.pdf, (viewed on 25 November 2016).
IRENA (2016), Boosting Biofuels: Sustainable Paths to Greater Energy Security, IRENA, Abu Dhabi.
Köppel, W., H. Schreck, U. Lubenau, R. Erler (2014), Monitoring Biogas II: Abschlussbericht (Final report), www.dvgw-innovation.de/fileadmin/innovation/pdf/g1_03_10.pdf, (viewed on 12 December 2016)
NGV Expo China 2017 (2016), Performance and world ranking of gas-fuelled vehicles, www.ngvexpo.com/msg.php?id=1631, (viewed on 25 November 2016).
Official Journal of the European Union (2009), “Directive 2009/28/EC Of The European Parliament And Of The Council of 23 April 2009 on the promotion of the use of energy from renewable sources and amending and subsequently repealing Directives 2001/77/EC and 2003/30/EC”, Official Journal of the European Union, L 140, pp. 16-62, http://eur-lex.europa.eu/legal-content/EN/TXT/PDF/?uri=CELEX:32009L0028&from=EN, (last viewed 29 November 2016).
Papacz, W. (2011), “Biogas as Vehicle Fuel”, Journal of KONES Powertrain and Transport, Vol. 18, No. 1, pp. 403-310, www.kones.eu/ep/2011/vol18/no1/48.pdf, (viewed on 15 November 2016).
Regis, R. (2015), “Veículos movidos a biometano tornam frota de Itaipu ainda mais verde - Mais um case do CIBIOGÁS (Vehicles powered by biomethane make Itaipu fleet even greener - Another case of CIBIOGÁS)”, Blog entry 15 September 2015, http://rodrigoregis.blogspot.de/, (viewed on 29 November 2016).
Štambaský, J., A. Prządka, E. Kovács, S. Pflüger, N. de la Vega, B. Peón (2015), Biomethane and Biogas Report 2015, European Biogas Association, Brussels.
Strippel, F., C.Findeisen, F. Hofmann, L. Wagner and D. Wilken (2016), Biowaste to Biogas, Fachvernad Biogas, http://biowaste-to-biogas.com/Download/biowaste-to-biogas.pdf.
Biogas for Road Vehicles | Technology Br ief 57
Sulgas (2016), “Transformando resíduos em combustível através da producão do GnVerde (Turning waste into fuel through Green GN Production)”, www.sulgas.rs.gov.br/sulgas/biogas, (viewed on 13 December 2016).
Svensson, M. (2015), Country Report Sweden, Presentation for IEA Bioenergy Task 37, www.iea-biogas.net/country-reports.html, (last viewed 29 November 2016).
Swedish Biogas International (2013), “About Us”, www.swedishbiogas.com/index.php/en/about-us/history, (viewed on 29 November 2016).
Thrän, D. (2013), “Methodenhandbuch: Stoffstrombasierte Bilanzierung der Klimagaseffekte (Methods manual: Material flow-based balancing of the climate effects), Schriftenreihe des BMU-Förderprogramms Energetische Biomassenutzung, www.energetische-biomassenutzung.de/fileadmin/user_upload/Methodenhandbuch/04_Methodenhandbuch_2013_final.pdf.
Thrän, D. et al. (2014), “Biomethane Status and Factor affecting market development and trade”, IEA Bioenergy, ISBN 978-1-910154-10-6.
Thrän, D. et al. (2010), “Regionale und globale räumliche Verteilung von Biomassepotenzialen (Regional and global spatial distribution of biomass potentials), http://literatur.ti.bund.de/digbib_extern/dn047244.pdf.
Tõnissoo, T. (2012), Feasibility Study on the Introduction and Use of Biogas Buses in the Tartu City, Baltic Biogas Bus Project, www.balticbiogasbus.eu/web/Upload/Use_of_biogas/Act_6_8/68_Feasibility%20study%20on%20the%20introduction%20and%20use%20of%20biogas%20buses%20in%20the%20Tartu%20City%20(final%20report).pdf, (viewed on 29 November 2016)
Trennt Magazin (2013), “Was vom Abend übrig bleibt (What’s left of the evening)”, http://trenntmagazin.de/biogut-was-vom-abend-uebrig-bleibt/, (viewed on 29 November 2016).
Urban, W. (Publisher), (2010), “Gasnetze der Zukunft, Studie zu den Auswirkungen der Biogaseinspeisung in das Erdgasnetz auf den Netzbetrieb und Endverbraucher (Gas networks of the future, study on the effects of biogas feed into the natural gas network on grid operation and end users)”, Fraunhofer-Institut für Umwelt-, Sicherheits- und Energietechnik, Oberhausen.
Urban, W. et al. (2009), “Technologien und Kosten der Biogasaufbereitung und Einspeisung in das Erdgasnetz (Technologies and costs of biogas processing and feeding into the natural gas network)”, Ergebnisse der Markterhebung 2007-2008, Abschlussbericht für das BMBF-Verbundprojekt “Biogaseinspeisung” - Band 4 (Final report for the BMBF collaborative project “Biogas feed-in” - Volume 4, Fraunhofer-Institut für Umwelt-, Sicherheits- und Energietechnik, Oberhausen.

Biogas for Road Vehicles | Technology Br ief58
Vestman, J., S. Liljemark, M. Svensson (2014), Cost benchmarking of the production and distribution of biomethane/CNG in Sweden, SGC Rapport 2014, Svenskt Gastekniskt Centre AB, Malmö
YLE (2016), Vaasa set to roll out biogas-fueled buses, http://yle.fi/uutiset/osasto/news/vaasa_set_to_roll_out_biogas-fueled_buses/9378701 (viewed on 08 January 2017).

Biogas for Road Vehicles | Technology Br ief 59

www.irena.org
Copyright © IRENA 2017