bioenergy and food security in asean
TRANSCRIPT

Bioenergy and food security in ASEAN:A FAO tiAn FAO perspective
Beau Damen
OffFAO Regional Office for Asia and the Pacific
Bioenergy Officer

OverviewOverview
11.2
Bioenergy in ASEAN
Bioenergy and food security in ASEAN2.
3.Bioenergy and food security in ASEAN
FAO Bioenergy and food security 3.
4.
FAO Bioenergy and food security
FAO BEFS in ASEAN Project
5. More information
Presentation contentsPresentation contents

Bioenergygyin ASEAN
FAO Regional Office for Asia and the Pacific

Energy in ASEAN + 3Energy in ASEAN 3TPES in ASEAN + 3 by source (ktoe), 2009
Source: IEA, 2011
Total TPES = 3,506,771ktoe

Energy in ASEANEnergy in ASEANTPES in ASEAN by source (ktoe), 2009y
Source: IEA, 2011
Total TPES = 536,335ktoe

Energy in the +3 CountriesEnergy in the 3 CountriesTPES in the +3 Countries by sector (ktoe), 2009y ( ),
Source: IEA,2011,
Total TPES = 2,970,436 ktoe
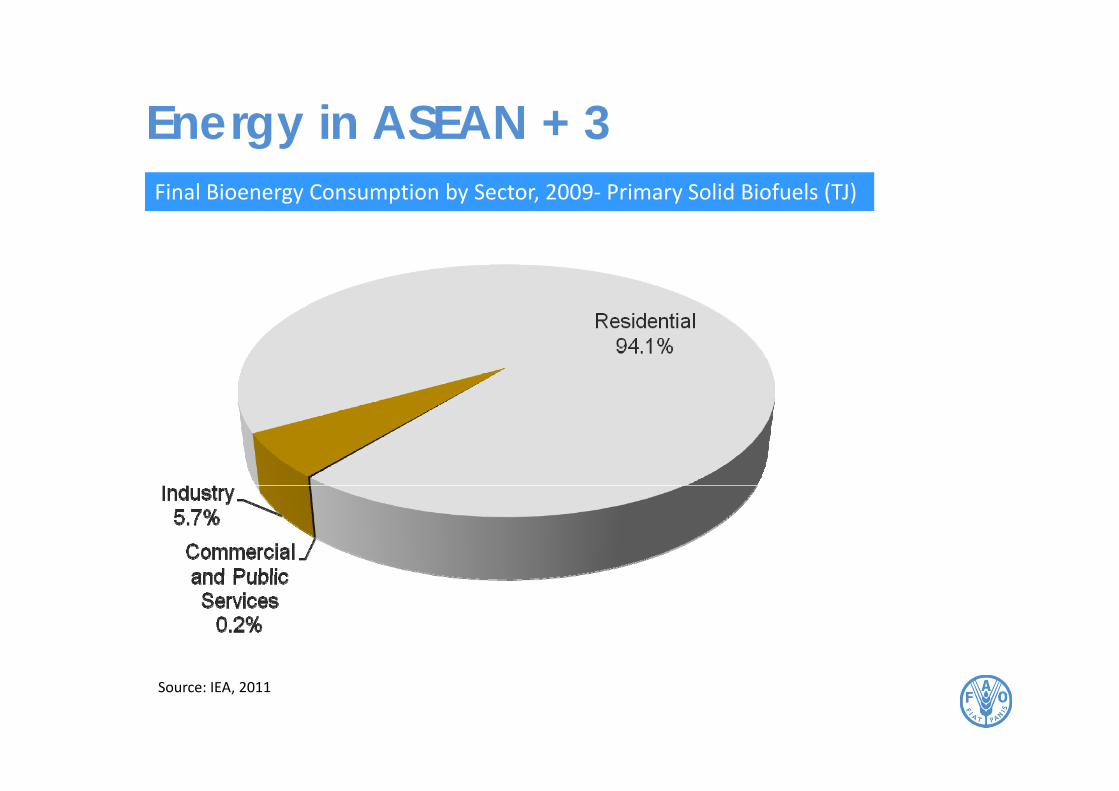
Energy in ASEAN + 3Energy in ASEAN + 3Final Bioenergy Consumption by Sector, 2009‐ Primary Solid Biofuels (TJ)
Source: IEA, 2011

Energy in ASEAN + 3Energy in ASEAN 3TPES and Bioenergy Share in ASEAN + 3, 2009
Country TPES (Ktoe)Bioenergy percentage of
TPES
Brunei 3123 0%
Cambodia 5182 70.7%
Indonesia 201999 26%
Lao PDR n/a n/a
Malaysia 66826 4.5%
Myanmar 15062 69.9%
Philippines 38842 17 9%Philippines 38842 17.9%
Singapore 18476 0.16%
Thailand 103316 19.9%
Vietnam 64048 39 3%
Source: IE
Vietnam 64048 39.3%
China 2257101 9%
EA, 2012
Japan 471992 1.4%
Republic of Korea 229178 1.3%

Energy in ASEAN + 3Energy in ASEAN 3TPES, Bioenergy Share and Poverty Rate in ASEAN + 3, 2010
Source: IEA,
Country TPES (Ktoe)Bioenergy percentage
of TPES
Ratio of population living on less than $2
per dayYear of poverty
count
Brunei 3123 0% n/a n/a 2012, World B
Brunei 3123 0% n/a n/a
Cambodia 5182 70.7% 53.3% 2008
Indonesia 201999 26% 46.1% 2010
Lao PDR n/a n/a 66.0% 2008 BankMalaysia 66826 4.5% 2.3% 2009
Myanmar 15062 69.9% n/a n/a
Philippines 38842 17.9% 41.5% 2009
Singapore 18476 0.16% n/a n/a
Thailand 103316 19.9% 4.6% 2009
Vietnam 64048 39.3% 43.4% 2008
China 2257101 9% 29.8% 2008
Japan 471992 1.4% n/a n/a
Republic of Korea 229178 1.3% n/a n/a

195 1
72.5
195.1
2008
Southeast Asia
2030
P l i h l i i i ASEANPeople without access to electricity in ASEAN

Modern bioenergyModern bioenergySchematic view of commercial (modern) bioenrgy routesSchematic view of commercial (modern) bioenrgy routes
The focus of my presentationSource: IPCC, 2011, based on IEA Bioenergy, 2009
The focus of my presentation

Modern Bioenergy Outlook - AsiaModern Bioenergy Outlook AsiaActual and Projected Bioenergy Demand in Non‐OECD Asia, 1990 ‐ 2035
Source: IEA

China•362 GW RE (incl. biomass) by 2020•15 billion litres of biofuel by 202015 billion litres of biofuel by 2020
Vietnam•5% RE (incl. biomass) by 2020
Thailand
5% RE (incl. biomass) by 2020•560 million litres of biofuel by 2020
•20% RE (incl. biomass) by 2022•5 billion litres of biofuel by 2022
Philippines
Indonesia5% RE b 2025
Philippines•267 MW biomass by 2030•10% ethanol by 2011
•5% RE by 2025•5% biofuels by 2025
Bi d l d i bBioenergy development driven by government

Why Bioenergy?Why Bioenergy?Net Energy Imports of Selected Countries in ASEAN + 3, 2009
Country Net energy importsNet energy imports as a
share of TPES
Brunei ‐15577 ‐498.8%
Cambodia 1545 29.8%
Indonesia ‐153635 ‐76.1%
Lao PDR n/a n/aLao PDR n/a n/a
Malaysia ‐21712 ‐32.5%
Myanmar ‐7172 ‐47.6%
Philippines 16336 42 1%Philippines 16336 42.1%
Singapore 58916 318.9%
Thailand 47369 45.8%
Source: IEA, 2
Vietnam ‐13830 ‐21.6%
China 274916 12.2%
2012Japan 384459 81.5%
Republic of Korea 198096 86.4%

Why Bioenergy?Why Bioenergy?Projected CO² Emissions in Non‐OECD Asia (MT) 1990‐2035
20
ds
15Thou
sand
10CO²
5
MT
0
1990 2009 2015 2020 2025 2030 2035
Source: IEA

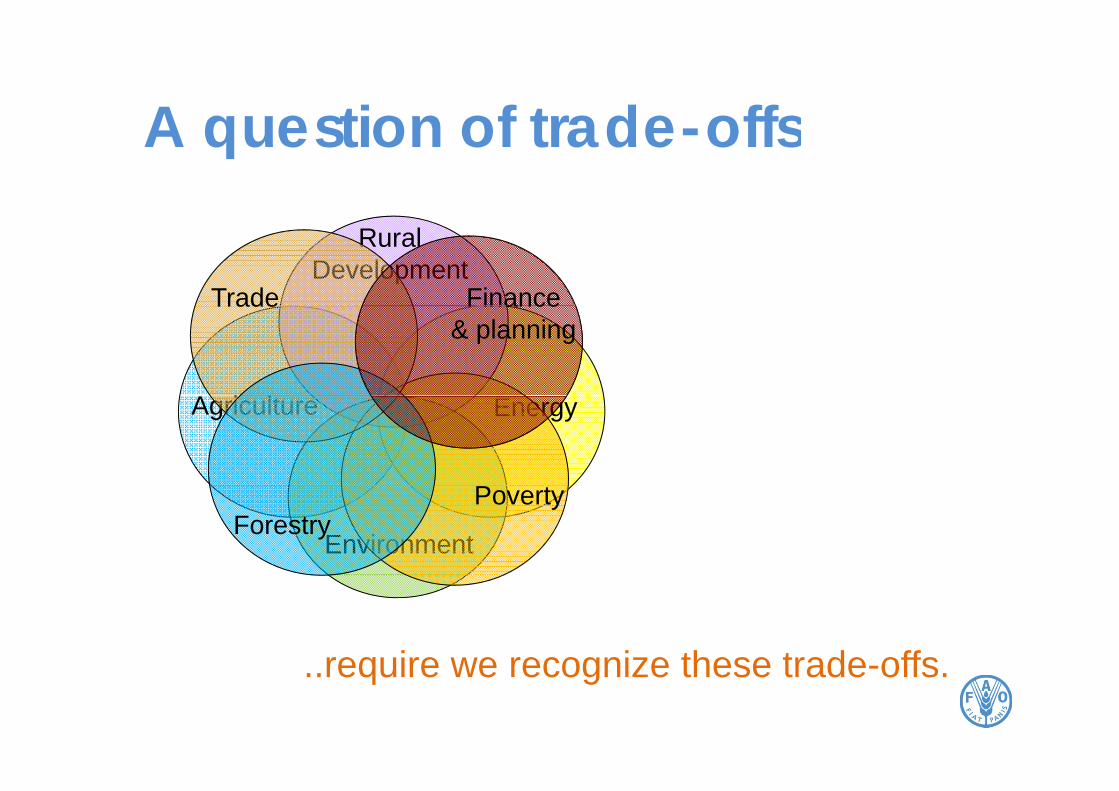
A question of trade offsA question of trade-offs
Energy
Action by one arm of governmentAction by one arm of government..

A question of trade offsA question of trade-offs
A i l EnergyAgriculture
to realize one policy goal..to realize one policy goal

A question of trade offsA question of trade-offsRural
Development
A i l EnergyAgriculture
could have..could have

A question of trade offsA question of trade-offsRural
Development
A i l EnergyAgriculture
Environment
unintended..unintended

A question of trade offsA question of trade-offsRural
Development
A i l EnergyAgriculture
P
Environment
Poverty
consequences..consequences

A question of trade offsA question of trade-offsRural
DevelopmentTrade
A i l
Trade
EnergyAgriculture
P
Environment
Poverty
for others..for others.

A question of trade offsA question of trade-offsRural
DevelopmentTrade
A i l
Trade
EnergyAgriculture
P
Environment
PovertyForestry
Effective bioenergy policiesEffective bioenergy policies..
A question of trade offsA question of trade-offsRural
DevelopmentTrade Finance
A i l
Trade Finance& planning
EnergyAgriculture
P
Environment
PovertyForestry
require we recognize these trade offs..require we recognize these trade-offs.

Risks & bioenergy develomentRisks & bioenergy develoment
Deforestation Biodiversity loss
Competition for resources
Marginalized small holders
Uncertain emissions loss for resources small‐holdersbenefits
Th t d ff b i ifi tThe trade-offs can be significant

Bioenergygyand food security in ASEAN
FAO Regional Office for Asia and the Pacific

Labor
Water
Land
Bioenergy trade implies trade of ag resourcesWh t th t ti l f t fl ?
Water
What are the potential future flows?

Technology
Scientific advances
Bioenergy trade implies trade of ag resourcesWh t th t ti l f t fl ?What are the potential future flows?

Greater Mekongg
Greater Mekong Sub-RegionC t dCase study

Regional bioenergy developmentsRegional bioenergy developments
China 15 billion litres of biofuel consumption by 2020
Biofuels362 GW renewable energy by 2020 including biomass
Biomass
Thailand
p y
5 billion litres of biofuel production by 2022
y g
20% (232GW) renewable energy by 2020 including biomass
Vietnam 550 million litres of biofuel production by 2020
biomass
5% (30GW) renewable energy by 2020 including p y gy y gbiomass
Source: FAO 2010, REN21 2010, IEA 2010
more to come…more to come

Spill over effectsSpill-over effects...China Policy ActionChina - Policy Action• Ethanol tariff reduction & feedstock restrictions• 650 million litres of cassava Cassavaethanol in 2010
Vietnam• Record harvests• Land degradation• New ethanol facilities
Thailand
Lao PDR• Cassava expansion
Thailand• Exports growing along with domestic demand• Pest infestation affecting
• 390 million litre facility proposed
crop Cambodia• Surge in cassava plantings

Thailand cassava outlookThailand cassava outlookThailand
Thousand tons
Competition for export markets likelySource: OAE
Competition for export markets likely
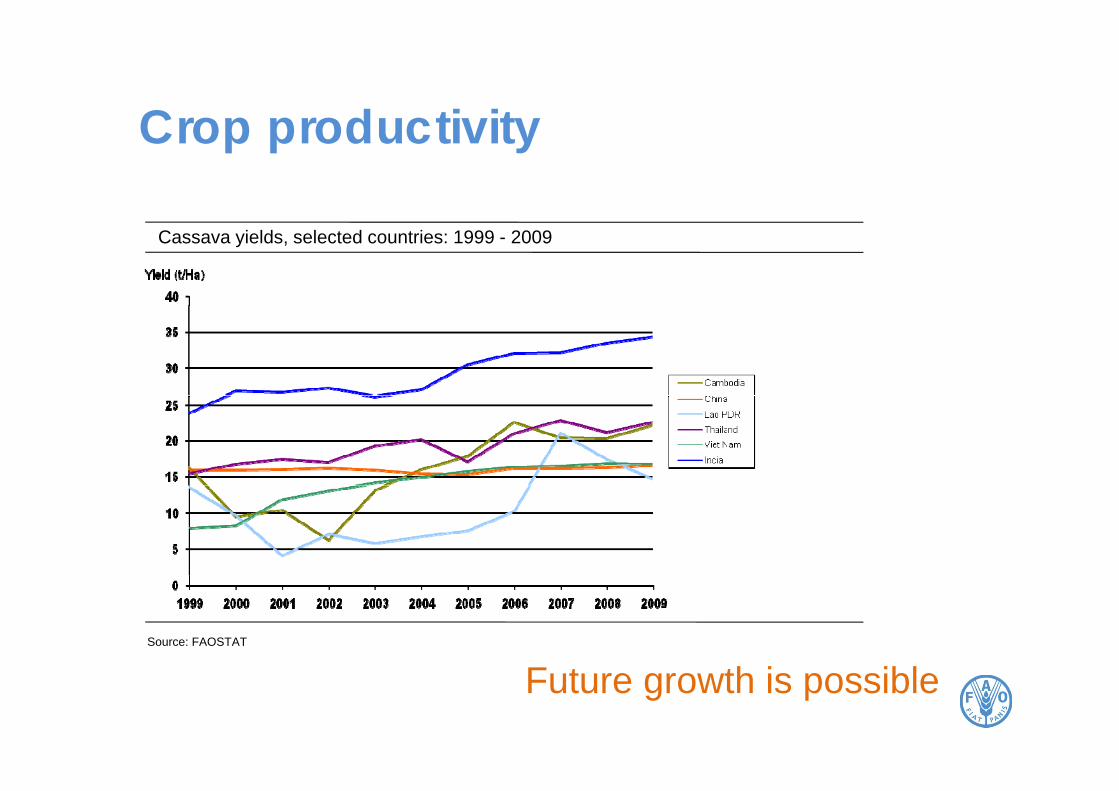
Crop productivityCrop productivity
Cassava yields, selected countries: 1999 - 2009
Source: FAOSTAT
Future growth is possible

Productivity growth and waterProductivity growth and waterThailand
Implications for water resourcesImplications for water resources
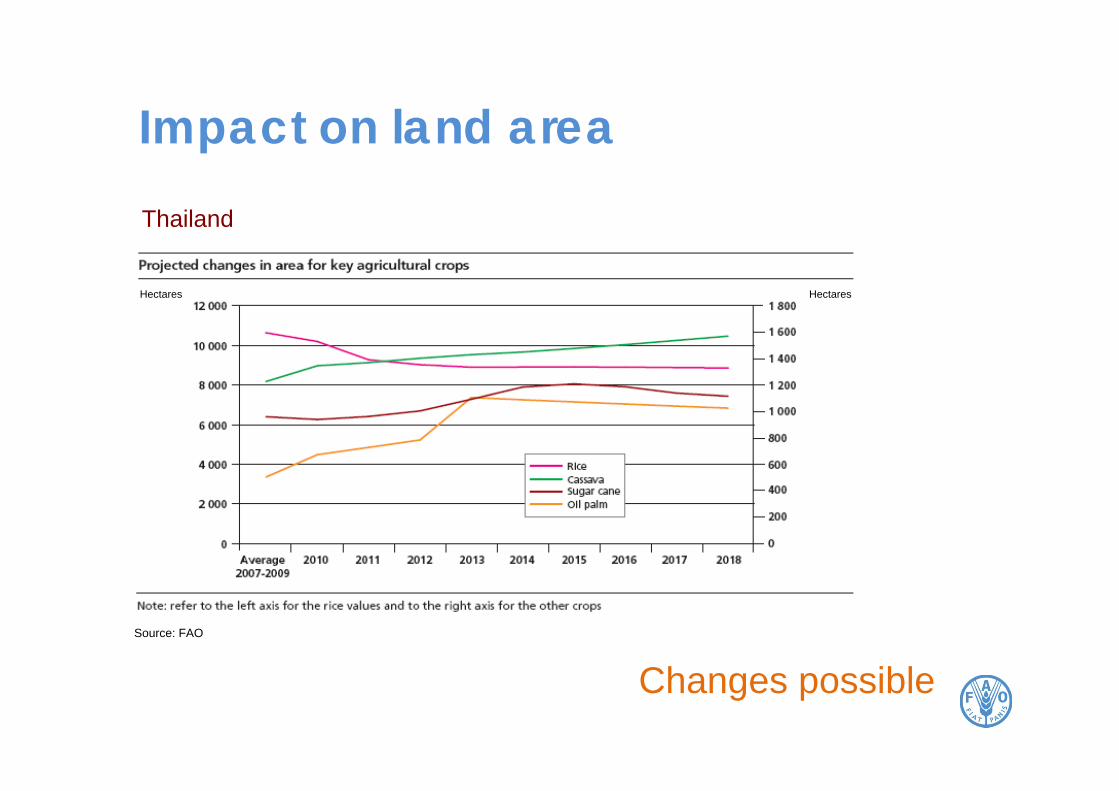
Impact on land areaImpact on land areaT
Thailand hailand
Thailand
Hectares Hectares
Source: FAO
Changes possible

Flow on effectsFlow-on effectsThailandThailand
Thousand tons
Source: OAE
Impact on the rice sector

Land degradationLand degradation
Source: UNEP & TERI from IWMI 2010
L d h l d d t i t dLand resources have already deteriorated
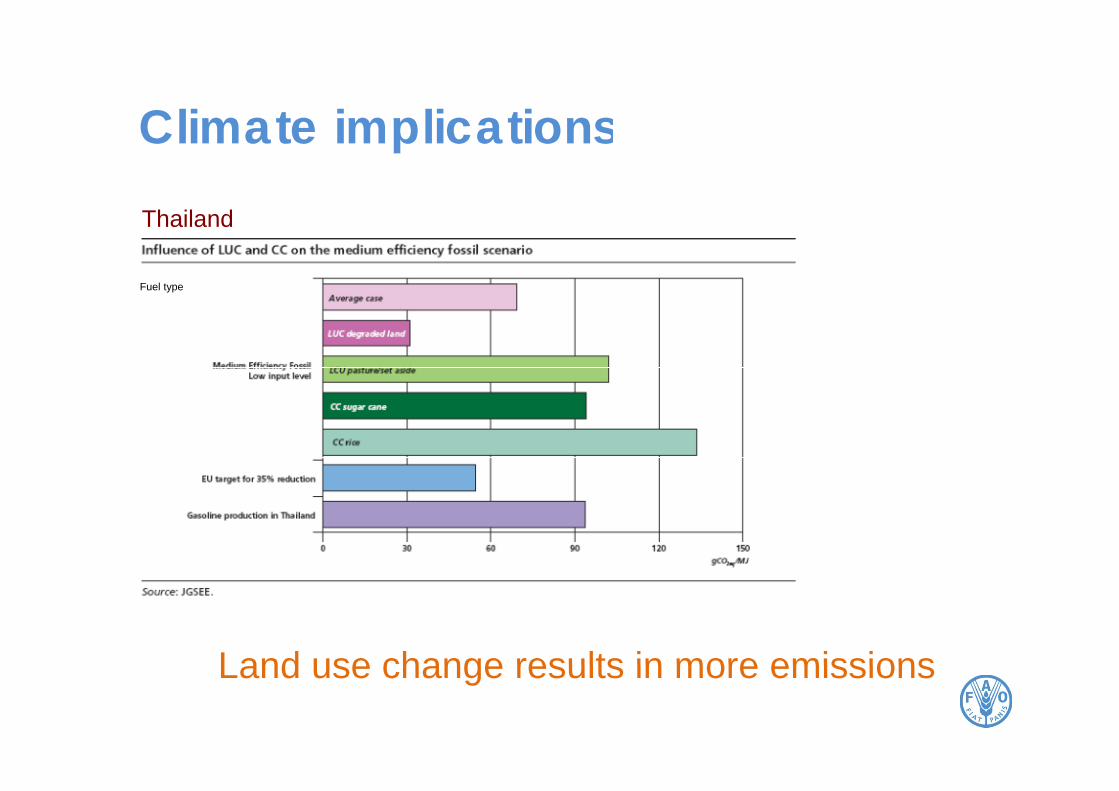
Climate implicationsClimate implicationsT
Thailand hailand
Thailand
Fuel type
Land use change results in more emissionsLand use change results in more emissions
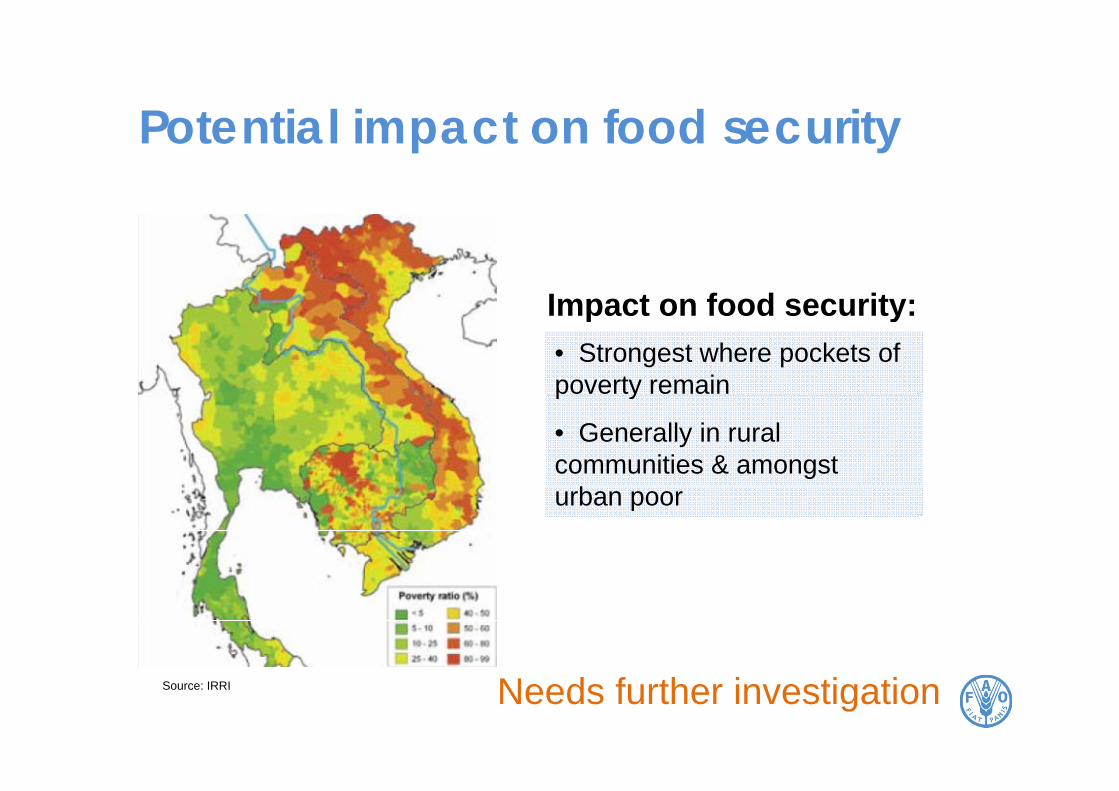
Potential impact on food securityPotential impact on food security
Impact on food security:• Strongest where pockets of poverty remain
Impact on food security:
p y
• Generally in rural communities & amongst urban poor
Source: IRRI Needs further investigation
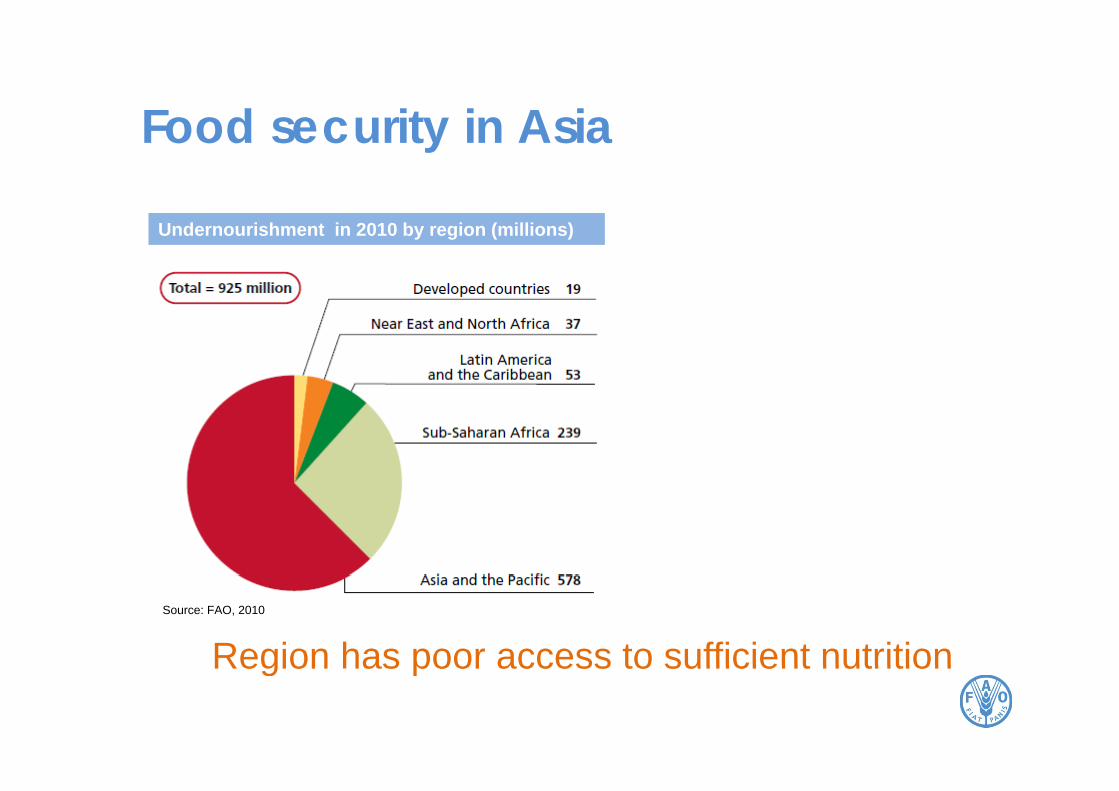
Food security in AsiaFood security in Asia
Undernourishment in 2010 by region (millions)
Region has poor access to sufficient nutritionSource: FAO, 2010
Region has poor access to sufficient nutrition

Undernourishment comparisonUndernourishment comparison
Regional trends in the number of undernourished,1990 to 2010
Source: FAO, 2010
Asia still has a lot of work to do

Food pricesFood pricesThailand380
FAO food price index in real terms: 2005 - 2011
280
330
180
230
Inde
x
80
130
2005
2006
2007
2008
2009
2010
2011
Ri i d i i l l il
2 2 2 2 2 2
Food Price Index Cereals Price Index Sugar Price Index
Source: FAO
Rising and increasingly volatile

FAO Bioenergygyand food security
FAO Regional Office for Asia and the Pacific

FAO Bioenergy & Food securityFAO, Bioenergy & Food security
• Provide an information platform
FAO BEFS framework aims to:p
• Inform judgements, aid decision‐making & guide actionguide action
• Strengthen relationships and & capacity
Assess trade offs associated with bioenergyAssess trade-offs associated with bioenergy

Natural Resources EndowmentsNatural Resources Endowments
Bioenergy Investment Intervention
Agriculture Agro‐industry Sectors
Agricultural Productivity Impacts
Food Security: Access and Availability‐ Poverty Reduction‐Wages and EmploymentPrices
Outcomes:Areas of concern
‐ Prices‐ Rural Development (livelihoods)
FAO’s BEFS framework

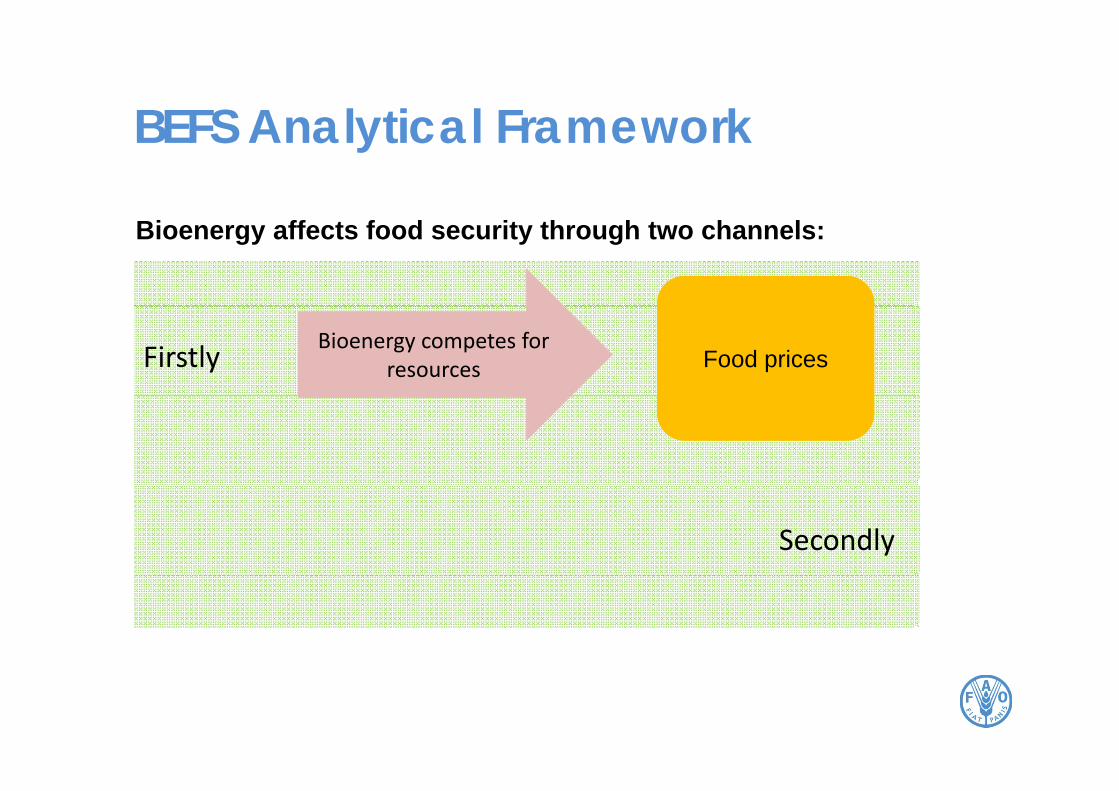
BEFS Analytical FrameworkBEFS Analytical Framework
Bioenergy affects food security through two channels:
Firstly

BEFS Analytical FrameworkBEFS Analytical Framework
Bioenergy affects food security through two channels:
FirstlyBioenergy competes for
resourcesBioenergy competes for
resources

BEFS Analytical FrameworkBEFS Analytical Framework
Bioenergy affects food security through two channels:
Food pricesFirstlyBioenergy competes for
resourcesBioenergy competes for
resources
BEFS Analytical FrameworkBEFS Analytical Framework
Bioenergy affects food security through two channels:
Food pricesFirstlyBioenergy competes for
resourcesBioenergy competes for
resources
Secondly

BEFS Analytical FrameworkBEFS Analytical Framework
Bioenergy affects food security through two channels:
Food pricesFirstlyBioenergy competes for
resourcesBioenergy competes for
resources
Bioenergy interventionsBioenergy interventions Secondly

BEFS Analytical FrameworkBEFS Analytical Framework
Bioenergy affects food security through two channels:
Food pricesFirstlyBioenergy competes for
resourcesBioenergy competes for
resources
Productivity of
Bioenergy interventionsBioenergy interventions
Productivity of agricultural and
biomass production
Secondlypsystems

Different systemsDifferent systemsSome bioenergy systems imply different levels ofSome bioenergy systems imply different levels of resource competition:
HighCompetition
First generation biofuels from coops
& residues
Secondgeneration biofuels
CHP from dedicated plantations
generation biofuelsfrom woody biomass
Power generationBiogas
have different impacts
LowCompetition
Power generation from municipal
waste
Biogas
…have different impacts

What are the current needs and challenges facing the energy and
agriculture sectors?
Natural ResourcesWhat are the natural resources
Natural Resources
Bioenergy Investment Which bioenergy feedstock and
available for bioenergy production?
AgricultureAgro‐
industry
Bioenergy Investment Which bioenergy feedstock and technologies are feasible/cost effective?
What is the environmental impact of
Agricultural Productivity
What is the environmental impact of different bioenergy production chains?
Food Security: Access and Availability‐ Poverty Reduction‐Wages and Employment
How will changes in food prices affect households?
g p y‐ Prices‐ Rural Development
What is the impact of bioenergydevelopment on the national economy?
BEFS Analytical Framework Key questions

Diagnostic Analysis Monitoring and mitigating food security risks at the national
level
Natural Resources Natural Resource Analysis‐Land Assessment‐Water Resource Management
Monitoring environmental impacts
Bioenergy Investment
Water Resource Management‐Woody Biomass & Residues
impacts
AgricultureAgro‐
industry
Techno‐economic and EnvironmentalAnalysis
‐Production Costs‐Greenhouse Gas (GHG)
Mitigating environmental risks through good practice
Agricultural Productivity
Food Security: Access and Availability‐ Poverty Reduction‐Wages and Employment‐ Prices‐ Rural Development
Socio‐economic Analysis‐Household Food Security‐ Economy‐wide Impacts
Mitigating risks to household food security and negative socio-economic impacts through good practiceRural Development
AnalyticalConceptual Practical

Bioenergy Policy Nexus Mainstreaming BEFS
R l
Finding the entry points Policy Making
RuralDevelopment
Trade Finance
Mainstreaming
BEFS into
& making the case
Agenda Setting
Agric lt re
& planning
NationalDevelopment
NationalD l
policy and planning processe
s
Agenda Setting
EnergyAgriculture Development Planning
Development Planning
s
Environment
PovertyForestry
Meeting the gimplementation challenge Implementation
& Monitoring

Agenda Setting Policy MakingImplementation
& Monitoring
Finding the entry points & making the
case
Mainstreaming BEFS into policy and
planning processes
Meeting the implementation
challenge
Preliminary assessmentUnderstanding policy
Collecting country‐specific information
BEFS Scoping
assessment Budgeting and financingMainstreaming BEFS in
BEFSCItrade‐offsUnderstanding linkages
and influencing policy processes
Mainstreaming BEFS in national & sector li i i
the budgetary process
Mainstreaming BEFS in it i t
BEFSCI Monitoring & project appraisal
Raising awareness & building partnershipsNational consensus and
commitment to
policies, strategies, programmesBEFS Full
assessment BEFSCI Good
monitoring systemsFood security monitoring
Project appraisalcommitment to
sustainable food‐secure bioenergy
Costing, assessing and selecting bioenergypolicy measures
BEFS Capacity
practicesSupporting policy
measuresNational, sector and sub‐
national levels
Strengthening institutions & capacities
Needs assessments
Strengthening institutions & capacities
Capacity Developme
nt Strengthening institutions & capacities
Needs assessmentsWorking mechanisms
Learning by doing Mainstreaming as standard practice
FAO BEFS in ASEANProject
FAO Regional Office for Asia and the Pacific

BEFS ASEANBEFS ASEANFAO action:• National capacity building
• Regional cooperationg p
• Regional technical capacity for ASEAN Secretariat
• Formation of national bioenergy policy bodies directed by SOM AMAF & AME
• National and regional BEFS mainstreaming strategies
T t d t h i l t t l• Targeted technical assessments – natural resources, technologies and trade & economic
$0Two year, $0.5 million program

BEFS ASEANBEFS ASEANCha-am Hua Hin Statement on ASEAN Plus ThreeCha-am Hua Hin Statement on ASEAN Plus Three Cooperation on Food Security and Bio-Energy Development - 2009
Develop a comprehensive strategy on sustainable and integrated food and biofuelsproduction and consumption
5.
production and consumption
Promote bio-energy trade and technology innovation to ensure longterm viability of
9.g y
bioenergy
Enhance the partnership with regional and i t ti l i ti
10.international organizations
Foundations

BEFS ASEAN Next stepsBEFS ASEAN – Next steps• Regional inception meetingRegional inception meeting
• Establishing national focal points
•Regional bioenergydevelopment modeling
• BEFS capacity building with ASEC
Id if i l h &• Identify regional research & capacity building partners

BEFS ASEAN PartnersBEFS ASEAN - PartnersCurrent partners:
• ASEC
• ADB
Current partners:
• ADB
• UNIDO
Potential partners:
• JGSEE Thailand
• GBEP
• ???
fLooking for additional regional partners

More informationFAO BEFS
FAO Regional Office for Asia and the Pacific

BEFS HQ
BEFS THAILAND
BEFS PERU
BEFS TANZANIA
Bioenergy & Food Security ProjectInitial target countriesInitial target countries

ASEAN
ASEAN +3SouthAsia
ASEAN
Peru
SADCBolivia
Bioenergy & Food Security ProjectGlobal ActivitiesGlobal Activities

FAO Bioenergy WebsiteFAO Bioenergy Website
• FAO view and role on bioenergy
Find....
• Details of FAO global bioenergy initiatives
• Links to Global Bioenergy Partnership• Links to Global Bioenergy Partnership Secretariat (GBEP)
• Electronic FAO Bioenergy publication warehouse
www fao org/bioenergy/en/www.fao.org/bioenergy/en/
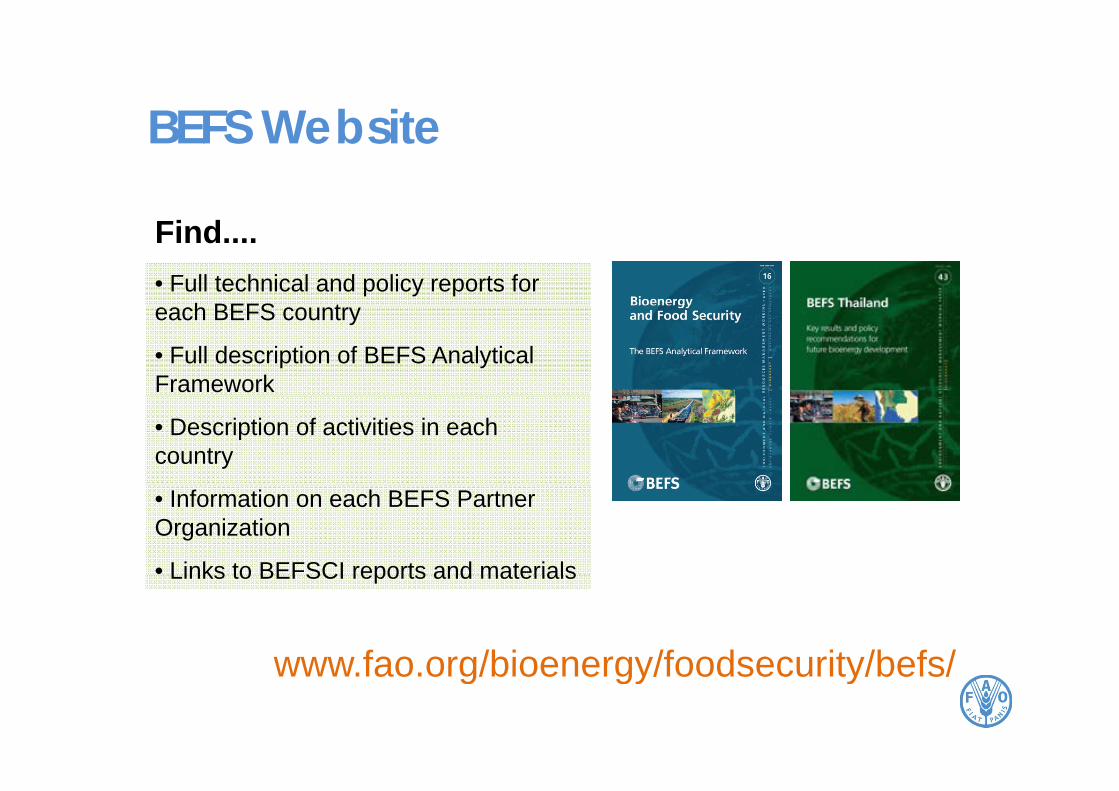
BEFS WebsiteBEFS Website
• Full technical and policy reports for h BEFS t
Find....
each BEFS country
• Full description of BEFS Analytical Framework
• Description of activities in each country
• Information on each BEFS Partner Organization
• Links to BEFSCI reports and materialsLinks to BEFSCI reports and materials
www fao org/bioenergy/foodsecurity/befs/www.fao.org/bioenergy/foodsecurity/befs/

Contacts: FAO & BEFSContacts: FAO & BEFS
Asia and the Pacific
Beau Damen – [email protected]
Climate, Energy and Tenure Division (FAO HQ)
Heiner Thofern – [email protected]
Irini Maltsoglou – [email protected]
Andrea Rossi – [email protected]
www fao orgwww.fao.org

Thank youy
FAO Regional Office for Asia and the Pacific