biodiversity indices for the assessment of air, water and soil …1)_69-86.pdf · ·...
TRANSCRIPT
Biodiversity Journal, 2014, 5 (1): 69–86
Biodiversity indices for the assessment of air, water and soilquality of the “Biodiversity Friend” certification in temperateareas
Gianfranco Caoduro1*, Roberto Battiston2, Pier Mauro Giachino3, Laura Guidolin4 & Giuliano Lazzarin1
1World Biodiversity Association, c/o Museo Civico Storia Naturale, Lung. Porta Vittoria, 9 - 37129 Verona, Italy; e-mails: [email protected]; [email protected] 2Musei del Canal di Brenta, Palazzo Perli, Via Garibaldi, 27 - 36020 Valstagna, Vicenza, Italy: e-mail: [email protected] Fitosanitario Regione Piemonte, Environment Park; Via Livorno 60, 10144 Torino, Italy; e-mail: [email protected] 4University of Padua, Department of Biology, Via U. Bassi, 58/B - 35121 Padua, Italy; e-mail: [email protected] *Corresponding author
ABSTRACT “Biodiversity Friend” is a standard certification developed in 2010 by World BiodiversityAssociation to evaluate the biodiversity and promote its conservation in agriculture. Theprocedure to obtain the certification considers the environmental impacts of the agriculturalactivities on the agrosystem and the biodiversity and suggests operational strategies toimprove the environmental quality of the agriculture areas. The evaluation is referred to 12actions related to low-impact methods of pest and weed control, reconstitution of soil fertility,rational management of water resources, diffusion of hedges, woodlands and nectariferousplants, conservation of agricultural biodiversity, soil, air and freshwater quality through Bio-diversity Indices, use of renewable sources for energy supply, lower CO2 production andCO2 storage and other actions that may have beneficial effects on biodiversity. The environmental conditions of the agrosystem are evaluated by biomonitoring of air, waterand soil. The biodiversity of soil and aquatic macroinvertebrates and the biodiversity of epi-phytic lichen communities decrease very quickly when the soil, water and air conditions arealtered by different causes such as pollution, synthetic and organic pesticides, bad land usepractices, etc. The protocol of the three indices of the standard certification “BiodiversityFriend”: Lichen Biodiversity Index (LBI-bf), Freshwater Biodiversity Index (FBI-bf), andSoil Biodiversity Index (SBI-bf) are here presented in detail.
KEY WORDS biodiversity; bioindicators; pollution; certification; agrosystem.
Received 28.02.2014; accepted 14.03.2014; printed 30.03.2014
INTRODUCTION
Up to date, on the Earth about two million specieshave been recorded (Fontaine et al., 2012), but thenaturalists estimate that the total number of speciesis at least 8.7 million (Mora et al., 2011), three-quarters of them concentrated in the tropical rain-
forests. So, we know only about one fourth of plantand animal species on our planet. Zoologists andbotanists describe about 17,000 new species everyyear (Fontaine et al., 2012), but the destruction oftropical rainforests at a rate of several ten thousandssq km a year (Skole & Tucker, 1993; Katzman &Cale, 1990) determines the extinction of thousands

of species annually; therefore, the loss of biodiver-sity is one of the most important environmentalemergencies today.
The recognition of such an emergency has led150 countries to sign, at the Rio de Janeiro EarthSummit in 1992, the "Convention on Biological Di-versity". With the aim of promoting sustainable de-velopment, the Convention recognizes that theprotection of biodiversity is not concerned only toliving organisms and their ecosystems, but it in-volves and affects the whole human community andits basic needs (the right to food, health, air, waterand soil quality). Despite the Convention's membercountries have met regularly to establish actionsand strategies, the rate of biodiversity loss increasedcontinuously. The minimum target set in the 6thConference in Johannesburg on 2002, has beenfixed in a meaningful reduction of the current rateof biodiversity loss at global, regional and nationallevels, within 2010 (Decision 6/26). Unfortunately,unsustainable patterns of production and consump-tion, lack of education and awareness about thisproblem at any level did not allow to get significantresults: the rate of biodiversity loss has not been re-duced; on the contrary, the destruction of rainforestsis proceeding very quickly every day.
From a long time, the European Community rec-ognized the conservation of biodiversity as a keyobjective of the strategy for sustainable develop-ment (Convention on Biological Diversity, 1992).The preservation of biodiversity is closely connectedwith other environmental emergencies, such asclimate change and resources’ availability, aboutwhich in the coming decades the fate of the entirehuman community will be played.
Biodiversity as a resource. Most peoplehave a romantic vision of biological diversity,mainly linked to emotional and aesthetic criteria.Even though few people recognize its value, biodi-versity is the most important resource of natural sys-tems in the Earth. Therefore, its conservation isfunctional to real preservation of ecosystems, fromwhich depend, directly or indirectly, all human ac-tivities. In essence, we can say that every living speciesis a potential resource, an option for the future, on thecontrary every extinct species is a missed opportunity.
Today, at global level, the destruction and frag-mentation of habitats, pollution, climate change,irrational exploitation of resources, human popula-
tion growth and spread of alien species are the mainthreats to biodiversity (Convention on BiologicalDiversity, 1992).
Biodiversity is a fundamental resource forhuman beings, such as energy and water resources.The maintenance of high biodiversity in the envi-ronment must be an overriding objective for pro-duction activities, especially in the primary sector.The agrosystem can be considered as a man-con-trolled environment in which the coexistence of veg-etal and animal species is not characterized bystable relationships between them; therefore it cannot be considered a true ecosystem. However, it rep-resents the best possible solution to assure environ-mental quality and food production. A modernfarmer has to face the problem of how to encouragebiodiversity in its farm and to manage the effects ofa possible reduction since it was established theclose relationship between the biological quality ofthe environment and the quality of products. Theuse of "good agricultural practices" to ensure con-servation of soil fertility, correct water management,weed and pest control through environmentallyfriendly methods contribute to the maintenance ofbiodiversity in the agrosystems. Other actions suchas the increase of hedgerows, wolds, wooded areasand nectar species, the leaving of necromasses andthe use of multi-year rotations, increase biodiversityin the agrosystems, at the same time improving thequality of air, water and soil (Lowrance et al.,1986).
Supporting biodiversity in agrosystems. Inthis changing world, we are facing a strategicchallenge for the future of the planet: to ensure, interms of sustainability, the productivity of economicsystems and the preservation of natural resources.
World Biodiversity Association, a non-profit or-ganization since its foundation October 4, 2004 atthe Museo Civico di Storia Naturale di Verona, hasbeen engaged in studying and conserving biodiver-sity hot spots, in Italy and worldwide.
In the matter of environmental responsibility,World Biodiversity Association is moving for along time to promote among the companies agreater consciousness of their role into the field ofconservation and the sensitization of their clients tosustainability.
With the support of a team of naturalists, agron-omists, foresters, and its International Scientific
GIANFRANCO CAODURO ET ALII70
Committee, WBA developed in 2010, a certificationthat, starting from the assumption of reducing thebiodiversity losses in the cultivated areas, encour-ages farmers to increase biological complexity of theagrosystem, towards a real sustainability and qualityof the crops. The new certification, named “Biodi-versity Friend” (BF) is not merely confined to cer-tify the engagement of the farm to a significantreduction of the biodiversity loss, but represents anincentive for the farm towards a progressive increaseof biological diversity, that ultimately coincides withan improvement of the health and quality of the prod-ucts. BF certifies that the production processes donot involve loss of biodiversity, and the certifiedcompany is constantly committed to improve thequality of the environment in which it operates.
The Biodiversity Friend standard. The Bio-diversity Friend (BF) protocol considers the envi-ronmental impacts of the agricultural activities onthe ecosystem quality and biodiversity. BF has theobjective of defining a complete picture of the in-teractions of a product or service with the biologicaldiversity of the territory. Moreover, the new proto-col suggests operational strategies to improve theenvironmental quality, with the aim to reduce theimpacts of the agricultural activities on agrosystemsand their biodiversity.
Operative strategies are defined in 12 actionswhich are related to:
1) low-impact methods of pest and weed control(organic or integrated production)
2) low-impact methods for the reconstitution of soilfertility
3) rational management of water resources 4) presence of hedges, woodlands and dry stone
walls/terraces 5) abundance of nectariferous plants 6) conservation of agricultural biodiversity7) soil quality through the Soil Biodiversity Index8) freshwater quality through the Freshwater Bio-
diversity Index9) air quality through the Lichen Biodiversity Index10) use of renewable sources for energy supply 11) moderate CO2 production, CO2 storage and
low-impact manufacturing techniques 12) other actions that may have beneficial effects
on biodiversity.
Each action corresponds with a score. The com-missioner must obtain a minimum score of 60 outof 100 to be certified. To maintain the certificationthe commissioner must increase the biodiversityevery year through effective actions that can be sug-gested by the evaluators and verified in the annualcontrols. When the farm get a score of 80 out of100, no other improvement is requested (Caoduro& Giachino, 2012).
Since 2010 to the present day about 50 organicand integrated production farms have been certified“Biodiversity Friend”. Many of them alreadyplaced on the market their products with the brand“Biodiversity Friend”, to show the consumers theirengagement in biodiversity conservation. In 2010“Biodiversity Friend” obtained the patronage of theMinistry of Agricultural, Food and Forestry Policiesof Italy. The brand “Biodiversity Friend” is exclu-sive property of the WBA and has been registeredas an international trademark in Italy, EuropeanUnion, China and U.S.A.
The Biodiversity Friend environmentalquality assessment
The actions related to the environmental condi-tions of the agrosystem have a very high importancefor the BF certification. They concern the assess-ment of the quality of the air, water and soil byusing synthetic biomonitoring procedures based onmethods recognized by scientific community. In theyears 2009 and 2010 a group of WBA naturalistscoordinated by Dr. Gianfranco Caoduro, under thesupervision of the WBA Scientific Committee, de-veloped different procedures for evaluating thecomplexity, in terms of biodiversity, of the soil andfreshwater communities of temperate agriculturalareas. In the same way, the Lichen BiodiversityIndex (LBI), the most frequently used procedure toassess atmospheric pollution using bioindicators,has been modified to allow an easier application ofthe method. The operation allowed to identify threedifferent procedures of the “Biodiversity Friend”protocol for the assessment of the quality of air,water and soil based on biodiversity indices. Thebiodiversity of soil and aquatic macroinvertebratesand the biodiversity of epiphytic lichen communi-ties decrease very quickly when the soil, water andair conditions are altered by natural or anthropiccauses such as pollution, synthetic and organic pes-ticides, bad land use practices, etc.
71Biodiversity indices for the assessment of air, water and soil quality of the “Biodiversity Friend” certification in temperates areas
MATERIAL AND METHODS
The three indices of the standard certification“Biodiversity Friend” for temperate areas of NorthHemisphere are represented by: Lichen BiodiversityIndex (LBI-bf), Freshwater Biodiversity Index (FBI-bf), and Soil Biodiversity Index (SBI-bf).
THE LICHEN BIODIVERSITY INDEX OFBIODIVERSITY FRIEND (LBI-BF)
Lichens and air pollution in agriculture.Frequently air pollution is considered a problem re-lated to industrialized and urban areas. However, inthe last decades the impacts of agriculture on airquality has been recognized. Air pollutants like pes-ticides and ammonia substances can have negativeeffects also on freshwater, groundwater and soil(National Research Council, 2009). Many authorsshowed that air pollutants produced by agriculturalactivities have a reliable impact on epiphytic lichens(Alstrup, 1991; Brown, 1992; Loppi, 2003; Carrera& Carreras, 2011). Lichens are generally consideredto be good indicators of air quality: altered compo-sition of atmospheric gases is reflected in changesin epiphytic lichen communities. The sensitivity oflichens is particularly relevant to fungicides, butherbicides and insecticides also have an importantimpact on them. In particular, lichen speciesrichness was demonstrated to be negatively in-fluenced by the frequency of pesticide treatments(Bartok, 1999).
Lichen as bioindicators. Lichens are organismsformed by a symbiosis between a fungus and analga. To date, more than 14,000 species of lichenshave been described by lichenologists. Lichens cangive excellent indications on the level of environ-mental alteration because their metabolism dependsstrictly by the air quality. The characteristics thatmake lichens excellent bioindicators of the airquality, both in urban and in rural areas, are: a) highcapacity of absorption and accumulation of sub-stances absorbed from the atmosphere; b) resistanceto environmental stress; c) impossibility to get ridof the polluted parts; d) longevity and slow growth;e) high sensitivity to the pollutants.
In the evaluation of the air quality lichens canbe used as bioindicators and bioaccumulators.
Frequently, a decrease in the number of lichenspecies is recorded together with a reduction of thenumber of specimens of each species. While mor-phological and physiological alterations are difficultto evaluate, the ecological variations allow to con-vert the lichen reactions into numeric values, relatedto different levels of air pollution. Generally, near-ing the pollution sources, there is a progressive de-terioration in lichen's health condition.
The first studies on lichen sensitivity to air pol-lution date back to the XIX century, but only sincesome decades they are used in large-scale biomon-itoring. Recently many methods based on appro-priate interpretation levels have been proposed. Themost used procedure calculates the Lichen Biodi-versity Index (LBI) based on the state of the lichendiversity in standard conditions, after a long expo-sition to atmospheric pollution and/or other kindsof environmental stress; the lichens considered forthe index calculation are, essentially, the epiphyticones. Specific indications on the sampling systemand survey procedures of the lichen biodiversity areavailable on the Manual for the application of theindex, published by ANPA (ANPA, 2001).
A synthetic method to evaluate the air quality ofthe rural areas is the use of the lichens as biosensorsof phytotoxic gases (Nimis, 1999). The epiphyticlichen biodiversity is an excellent indicator of thepollution produced by air pollutants. By means ofthis approach it is possible to correlate different lev-els of environmental alteration to variations of theexternal aspect of the covering and floristic richnessof the lichen communities. A phytotoxic agent, atdetermined concentrations, can cause the death ofthe lichens sensitive to it. As the sensitivity to thepollutants is related to the morphology of the lichentallus, to its ecological, physiological and structuralcharacteristics, the disappearance of the lichensfrom a polluted area is not simultaneous, but de-ferred in time: first the more sensitive species dieand then the more resistant ones. Therefore, the floris-tic composition becomes an indirect measure of theconcentration of pollutants in a certain place.
Lichens answer with a relative velocity to alter-ations of the air quality, but they can recolonize infew years industrial and urban environments if airquality conditions improve, as many Europeancountries revealed. The studies of air quality throughlichens found a large diffusion in Italy starting fromthe eighty years, at the same time with the resump-tion of the interests for the lichenological studies.
72 GIANFRANCO CAODURO ET ALII
73
Many investigations were realized both in urban andin rural areas, in natural protected areas and in areaswhere the human activities are particularly intense.
The methodology adopted in Italy starting fromthe beginning of the 2000 years is indicated as“ANPA Method” (ANPA, 2001). This approachminimizes the subjective elements of the guide linespreviously proposed in Italy and Germany, givingspecific attention to the selection of the samplingsites, of the trees to be monitored and the positionof the sampling grid.
This method estimates the state of the lichenbiodiversity in standard conditions after a long ex-position to air pollutants and/or other kinds of en-vironmental stresses. It is important to specify thatlichens considered in evaluation of biodiversity areessentially the epiphytic ones; this allows to limitthe variability of the ecological parameters unre-lated with pollution, such as base content or watercapacity, very changeable in the lithic substrates.
The Lichen Biodiversity Index of “Biodi-versity Friend”
According to the complexity of the ANPAmethod, which can be performed only by an expertlichenologist, Biodiversity Friend uses a simplifiedapplication of it, allowing to use the procedure alsoby non specialists. In the application of the “Biodi-versity Friend” method the taxonomic identificationof the lichen species is not necessary; the operator isrequired only to distinguish the major morphologicaldifferences among the species of the lichen commu-nity. The operator, therefore, identifies the “SpeciesA”, from the “Species B”, from the “Species C” andso on. All other operations correspond exactly to theones used by the ANPA Method. The use of the tra-ditional sampling grid allows the calculation of a nu-merical index based on lichen diversity and on thefrequency of the various species, through which it ispossible to define the alteration level of the lichencommunity. The density of the sampling sites is cal-culated in relation to the extension of the total farmsurface, as described in Table 1.
Each sample is formed by three trees (phoro-phyta) with the characteristics required by the pro-tocol. The site must be located inside the farmlands, preferably in the central area. The operatormust choose the three trees nearest to the farm cen-ter. If in the farm there are not trees suitable to be
sampled the operator must search other trees in theperipheral zones. The geographic coordinates of thesite must be reported on the sample form, togetherwith a synthetic map with the location of the treesto make their finding easier in the following sur-veys. If the total farm surface is larger than 20hectares and it is necessary to locate more than onesite, these must be located at least at 150 m of dis-tance among them. About the selection of the treespecies, two groups can be distinguished accordingto the pH of the bark, as in Table 2.
Total Farm Surface
Number of samples
≤ 20 ha One sample
20-200 ha 1 + (total surface – 50)/50
The result must be rounded to the inferior integer number
≥ 200 ha 3 + (total surface – 200)/100
The result must be rounded to theinferior integer number
Table 1. Number of air quality sampling sites in relation tofarm surface.
Species with subneutral bark
Species with acid bark (to be preferred)
Acer pseudoplatanus Prunus domestica
Acer platanoides Olea europaea
Ceratonia siliqua Quercus petraea
Ficus sp. Alnus glutinosa
Fraxinus excelsior Castanea sativa
Fraxinus ornus Quercus pubescens
Juglans sp. Quercus cerris
Populus x canadensis Betula pendula
Sambucus nigra Prunus avium
Ulmus sp. Tilia sp.
Table 2. Tree species that can be used in biomonitoring ofair quality by the LBI-bf.
Biodiversity indices for the assessment of air, water and soil quality of the “Biodiversity Friend” certification in temperates areas

For the biomonitoring the trees with a bark eas-ily exfoliable (e.g. Aesculus, Platanus) must be ex-cluded; the use of Sambucus and Robinia is notrecommended for the high water tolerance of theirbark. Celtis australis and Populus alba are not rec-ommended because they maintain for a long time asmooth bark, poorly colonizable by lichens; Fagusis suggested only in mountain areas. Samples basedon trees of different groups are not directly compa-rable. Only one tree species is to be used. When thisis not possible, it is best to use another species ofthe same group. It is preferable to use species withacid bark, in particular, trees of the genus Tilia(Table 2). The sample trees must have the followingcharacteristics: 1) the inclination of the trunk mustnot exceed 10° to avoid effects due to the excessiveeutrophication of inclined surfaces; 2) circumfer-ence larger than 60 cm to avoid situations with pio-neer lichens; 3) absence on the bark of evidentfactors of disturbance or pathologies.
The presence and frequency of the lichen specieson the bark are detected by means of a sampling gridformed by a vertical ladder of 10x50 cm, divided infive subunities of 10x10 cm; the ladder must be ap-plied to each of the four cardinal points, with thebase at about 100 cm from the ground level. To ex-clude from the sample any unfit part of the trunk, arotation up to 20° clockwise can be allowed.
Even if the lichen cover is high, the position-ing of the grid in each cardinal point must avoid:decorticated or damaged portions of the trunk, por-tions with evident knots, portions corresponding torainwater tracks, portions covered with more than25% by bryophytes (however, also muscicolouslichens must be considered in the calculation, ifthey are present).
To allow the repetition of the survey, for everytree in the survey form must be noted: a) the exactlocation of the tree, using a geo-referenced systemor a detailed map; b) the exact exposure (in degree)of each grid position; c) the height, from the groundlevel, of the grid base; d) circumference of the trunkin the middle of the grid.
All the lichen species present in each subunitmust be recorded together with their frequency, cal-culated as number of squares in which each speciesis present (the frequency values of each species,therefore, vary from 0 to 5); if the same specimenof a certain species is present in more than onesquare, its frequency is equivalent to the number of
squares in which it is present. The removal and dam-age of the lichens inside the grid area must beavoided to permit the repetition of the sample. Con-sidering that the identification at specific level ofeach species can be difficult for a non-lichenologistoperator, on the survey form is sufficient to deter-mine the diversity of epiphytic lichens present onthe tree specimen, by noting on the form: “SpeciesA”, “Species B”, “Species C”, etc., making sure thatthey are not damaged or underdeveloped specimensof species already present in the grid. In case ofdoubts in identifying a species, the operator can usethe magnifying glass to confront at microscopiclevel the different morphologies and the camera formacro photography for a following identification.The value of lichen biodiversity of each sampled treeis obtained summarizing the frequencies recorded ineach unit.
Calculation of the Biodiversity Lichen Index
The Biodiversity Lichen Index of the site is sta-tistically determined on the basis of the values col-lected during the survey. The first step is tosummarize the frequencies of the species recordedon each tree. As it is predictable a substantial growthdifference among the sides of the trunk, the frequen-cies must be noted separately for each cardinal point.In this way, for each tree will be obtained four sumsof frequencies (BLjN, BLjE, BLjS, BLjW). In eachsite the following operations must be realized:
1) for each tree the frequencies of all the lichenspecies detected are summed (in this way we havethe biodiversity related to the single phorophyta);
2) all the frequencies gathered on each tree aresummed and the total is divided by three (thenumber of phorophyta). In this way we obtain theLichen Biodiversity Index of the site (LBI);
The Lichen Biodiversity Index of the site mustbe superior or equal to 45. In case of surveys tomake in more sites (farms with total surface largerthan 40 hectares), the total Lichen BiodiversityIndex emerges by the sum of the indices of all sites,divided by the total number of sites. The ratio mustbe 45 or more, for an acceptable air quality.
Classes of lichen biodiversity
Generally, seven classes of Lichen Biodiversityare used, corresponding to the same number of air
74 GIANFRANCO CAODURO ET ALII
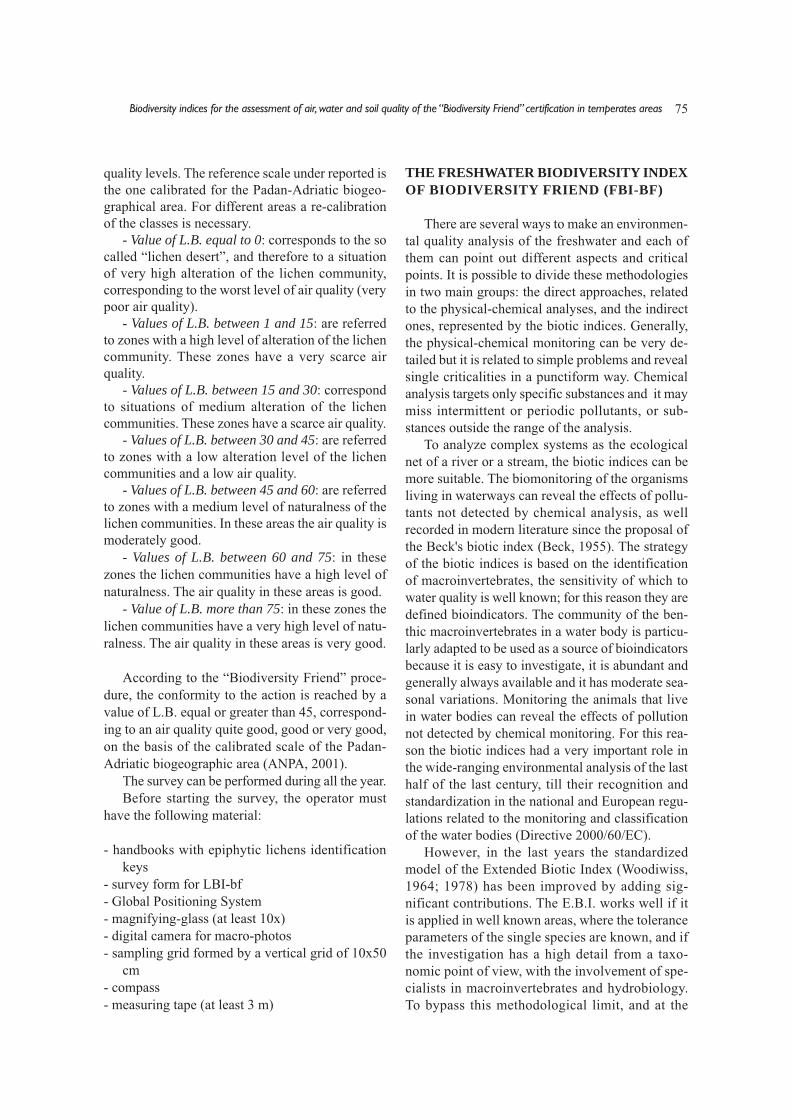
quality levels. The reference scale under reported isthe one calibrated for the Padan-Adriatic biogeo-graphical area. For different areas a re-calibrationof the classes is necessary.
- Value of L.B. equal to 0: corresponds to the socalled “lichen desert”, and therefore to a situationof very high alteration of the lichen community,corresponding to the worst level of air quality (verypoor air quality).
- Values of L.B. between 1 and 15: are referredto zones with a high level of alteration of the lichencommunity. These zones have a very scarce airquality.
- Values of L.B. between 15 and 30: correspondto situations of medium alteration of the lichencommunities. These zones have a scarce air quality.
- Values of L.B. between 30 and 45: are referredto zones with a low alteration level of the lichencommunities and a low air quality.
- Values of L.B. between 45 and 60: are referredto zones with a medium level of naturalness of thelichen communities. In these areas the air quality ismoderately good.
- Values of L.B. between 60 and 75: in thesezones the lichen communities have a high level ofnaturalness. The air quality in these areas is good.
- Value of L.B. more than 75: in these zones thelichen communities have a very high level of natu-ralness. The air quality in these areas is very good.
According to the “Biodiversity Friend” proce-dure, the conformity to the action is reached by avalue of L.B. equal or greater than 45, correspond-ing to an air quality quite good, good or very good,on the basis of the calibrated scale of the Padan-Adriatic biogeographic area (ANPA, 2001).
The survey can be performed during all the year. Before starting the survey, the operator must
have the following material:
- handbooks with epiphytic lichens identificationkeys
- survey form for LBI-bf - Global Positioning System - magnifying-glass (at least 10x) - digital camera for macro-photos - sampling grid formed by a vertical grid of 10x50
cm - compass- measuring tape (at least 3 m)
THE FRESHWATER BIODIVERSITY INDEXOF BIODIVERSITY FRIEND (FBI-BF)
There are several ways to make an environmen-tal quality analysis of the freshwater and each ofthem can point out different aspects and criticalpoints. It is possible to divide these methodologiesin two main groups: the direct approaches, relatedto the physical-chemical analyses, and the indirectones, represented by the biotic indices. Generally,the physical-chemical monitoring can be very de-tailed but it is related to simple problems and revealsingle criticalities in a punctiform way. Chemicalanalysis targets only specific substances and it maymiss intermittent or periodic pollutants, or sub-stances outside the range of the analysis.
To analyze complex systems as the ecologicalnet of a river or a stream, the biotic indices can bemore suitable. The biomonitoring of the organismsliving in waterways can reveal the effects of pollu-tants not detected by chemical analysis, as wellrecorded in modern literature since the proposal ofthe Beck's biotic index (Beck, 1955). The strategyof the biotic indices is based on the identificationof macroinvertebrates, the sensitivity of which towater quality is well known; for this reason they aredefined bioindicators. The community of the ben-thic macroinvertebrates in a water body is particu-larly adapted to be used as a source of bioindicatorsbecause it is easy to investigate, it is abundant andgenerally always available and it has moderate sea-sonal variations. Monitoring the animals that livein water bodies can reveal the effects of pollutionnot detected by chemical monitoring. For this rea-son the biotic indices had a very important role inthe wide-ranging environmental analysis of the lasthalf of the last century, till their recognition andstandardization in the national and European regu-lations related to the monitoring and classificationof the water bodies (Directive 2000/60/EC).
However, in the last years the standardizedmodel of the Extended Biotic Index (Woodiwiss,1964; 1978) has been improved by adding sig-nificant contributions. The E.B.I. works well if itis applied in well known areas, where the toleranceparameters of the single species are known, and ifthe investigation has a high detail from a taxo-nomic point of view, with the involvement of spe-cialists in macroinvertebrates and hydrobiology.To bypass this methodological limit, and at the
75Biodiversity indices for the assessment of air, water and soil quality of the “Biodiversity Friend” certification in temperates areas

same time to increase the systemic complexity ofthe analysis to the study of bioindicators, some au-thors suggested to reduce the taxonomic resolu-tion, rewarding it with a more accurate descriptionof the ecosystem and its functionality, using the“River Continuum Concept” (Vannote et al., 1980;Siligardi et al., 2007; or the Italian SEL in theD.M.391/2003).
As a further evolution of the biotic index method-ologies, the Freshwater Biodiversity Index of “Bio-diversity Friend” is proposed to evaluate thesuitability of a water environment to host a rich bio-diversity. This protocol adapts common used assess-ing methods to evaluate biodiversity in freshwaterenvironments, detecting the diversification and sta-bility of the biotic communities (Klemm et al.,1990; Rosenberg et al., 1997), relating them to theriver continuum and to the functional parts of thehydromorphology.
Determination of the FBI-bf. An environmentsuitable to host many kinds of organisms should beprimarily heterogeneous, with different survivalstrategies. Therefore, a general classification of theentire ecosystem functional to the water course, con-ditioning its dynamics, is necessary. The operatorhas to fill out a survey form in which different mor-phological and ecological parameters are listed. Ifthe water body presents significantly diversifiedecological conditions, the operator must fill out adifferent form for each riparian zone; the final scorewill be obtained as the mean of the final values ob-tained for each zone considered.
Hydro-morphological Assessment
Width. The width of a water body is very impor-tant considering that the most food sources of therefuge and reproduction sites of the aquatic faunaare located near the banks. The width of the bedmust be evaluated in normal water conditions; thebed of the stream includes the part occupied by thewater and a riparian strip lacking of vegetation,trees and shrubs that can not survive in conditionsof frequent submersion and erosion of the substratecaused by high floods.
During periods of low floods, a part of the bedcan be colonized by pioneer herbaceous vegetation.Therefore, the operator must observe carefully thebanks to locate the real width of the water body. The
width will be evaluated transversally, from the ex-treme margins of the bed, in normal water conditions.
If the banks and the bed are completely over-built or if the flows are regulated, involving thedrainage of the water body for more than threemonths in a year, or the bed is dredged more thantwice a year, the water body must be considered“artificial”.
Fluvial morphology. Dikes and canalization andflood-relief works artificially modify the waterbodies to have as less impact as possible on thehuman activities, to prevent overflows and bankerosion. In many agricultural areas is very difficultto keep rivers in their natural conditions, especiallyin Europe where anthropization and urbanizationare widely spread (U.N., 2012). On the contrary, astrong artificial management leads to an homoge-nization of the fluvial structure, reducing the capac-ity of the water bodies to support complex bioticcommunities. A compromise is, however, possible.
A straight channel, completely artificial, withoverbuilt banks offers very few food sources andrefuge sites; it will be colonized, in the best case,only by few and very resistant organisms. A moresinuous and irregular course with natural banks, atleast in some reaches, on the contrary, can transformradically a little agricultural channel in a wetland ofgreat interest for the freshwater flora and fauna.
Hydrological regime. Water flow variations arenatural and related to seasonality; they can supportthe alternation of different host species and increaseaquatic biodiversity. A constant natural flow, deter-mined by a well-structured hydrological network,on the other hand, even guaranteeing more stabilityand continuity to some species, can reduce the pos-sible strategies.
Alterations to the natural hydrological regimesuch as water withdrawals for agricultural, hydro-electric or civilian uses can influence significantlythe functionality of the water body, causing tem-porary shallows incompatible with the life cyclesof many organisms; also the artificial irrigationditches can be considered in this category (Bunn &Arthington, 2002; Ferrington & Sealock, 2005).
The flow variations must not be evaluated by thesize of the wetting bed at the moment of the survey,but they must be deduced from the extension andcomplexity of the perifluvial vegetation and, even-
76 GIANFRANCO CAODURO ET ALII

tually, by information given by other sources of mon-itoring (e.g. Literature, recording stations, etc.).
Riparian vegetation. The perifluvial vegetation,besides conditioning the position and extension ofthe shaded areas, influences the riparian morphologyby creating niches and sites adapted to host theaquatic fauna and produces the most of its foodsources. If, in absence of riparian vegetation, onlyfew particularly resistant species can survive, everyincrease in terms of diversity and complexity of theriparian communities will be followed by an in-crease of the aquatic animal species. Compiling thesurvey form, different categories can be added to-gether, if they are present (e.g. trees, shrubs andherbs). Only hygrophilic and riparian species can beconsidered in the survey; exotic species and not ri-parian herbaceous vegetation must not be considered.
Taxonomic diversity and pollution tole-rance
After the hydro-morphological assessment ofthe water body has been surveyed, the operator eval-uates the diversity of the aquatic biocenosis by a di-rect sampling. The “Biodiversity Friend” proceduredoes not consider the species as in the classic taxon-omy but as morphotypes, as a compromise betweena simple evaluation suitable for non-taxononomistsand an accurate quantitative evaluation of speciesdiversity.
The morphotypes are here considered as groupsof organisms which at macroscopic level are char-acterized by similar shapes. It is not important todefine the taxonomic level: e.g. a sample of twospecies of Plecoptera, one species of Amphipodaand three different genera of Mollusca correspondsto six morphotypes.
However, the identification of a morphotypeneeds a good knowledge of the aquatic fauna, con-sidering that many individuals of different speciescan look identical to an untrained eye. An adequatetraining, even if not at specialistic level, will be nec-essary to recognize differences in the number ofappendixes, the different form or position of bristlesor hooks and so on.
The number of the morphotypes gives a directevaluation of the biodiversity richness and complex-ity of the communities. The dominance of fewmorphs indicates a scarce species richness, the
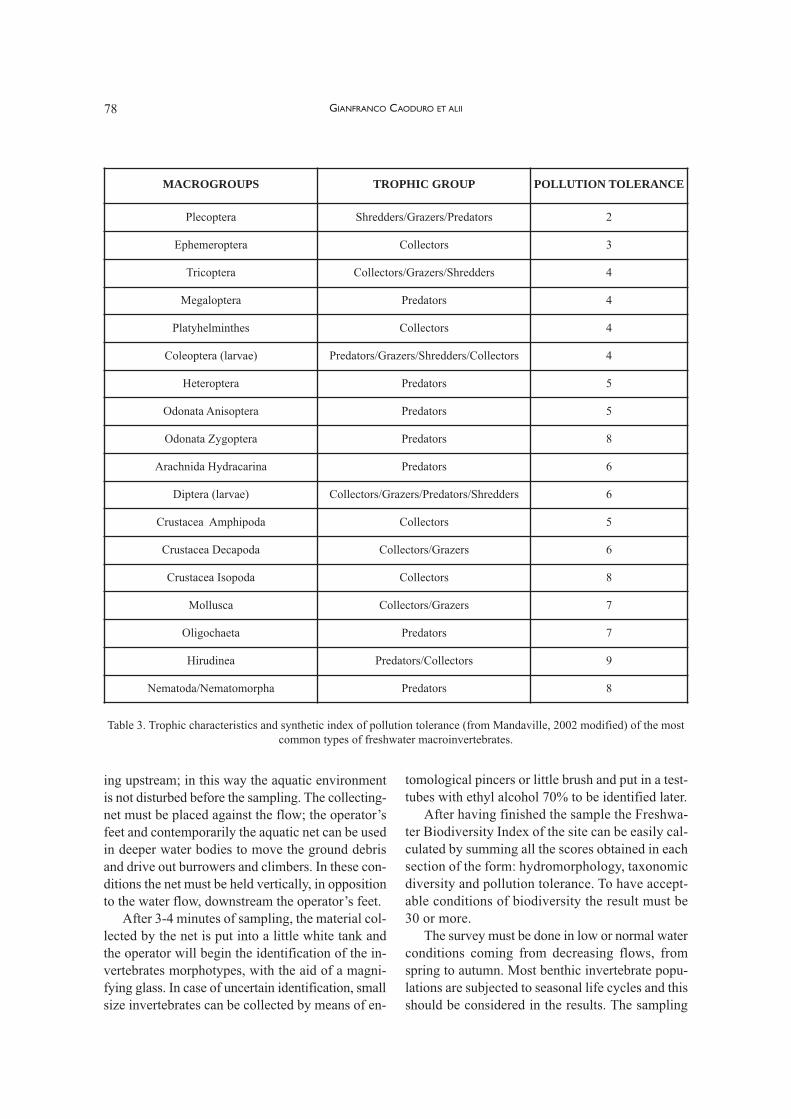
heterogeneity of the morphs, indicates good speciesrichness. If an healthy aquatic environment can hosta rich variety of organisms, the presence of a pol-lutant can limit this condition. Each species, accord-ing to scientific literature (e.g. Mandaville, 2002;see Table 3), has a certain tolerance to pollution, butit is possible to identify a predisposition to tolerancealso at a higher taxonomic level, obviously arrivingat some detail compromises which are consideredacceptable by many authors (Olsgard et al., 1997).If it is not infrequent to find tolerant invertebratesin low polluted sites, the opposite is not true.
Therefore, the presence of at least two bioindi-cators belonging to groups particularly sensitive topollution is here considered as a significant indica-tion to evaluate the minimum quality of the aquaticenvironment. In the survey form the two lower val-ues are identified to define the pollution tolerance,corresponding to the rounded down mean of thesetwo values.
Survey: materials and methods
Before the biological survey, the monitoringprocedure of the FBI-bf provides also the analysisof the main physico-chemical parameters of thefreshwater measured by portable instruments. Inparticular must be surveyed and reported on theFBI-bf form the following parameters: temperature,pH, electric conductivity and dissolved oxygen.These additional information can be useful to un-derstand the reason for eventual discrepanciesbetween an apparently good environment and a richvariety of organisms and suggest the commissionereffective action to reduce the pollution.
Sampling of water macroinvertebrates is per-formed with a collecting-net for aquatic inverte-brates (grid 500 μm), according to the procedureproposed by the British Standards Institute (ISO10870: 2012). In some circumstances the identifi-cation of aquatic invertebrates is possible also fromthe bank, investigating the lower surface of rocksand rubbles. Before sampling with the collecting-net, the operator must verify the activity of surfaceinsects, collect by hands the stones and submergedwood of the bottom for at least two minutes. All thegroups of macroinvertebrates observed during thesesurveys will be reported on the FBI-bf form. Thesample with the collecting-net must begin from themost downstream point of the water body, proceed-
77Biodiversity indices for the assessment of air, water and soil quality of the “Biodiversity Friend” certification in temperates areas
ing upstream; in this way the aquatic environmentis not disturbed before the sampling. The collecting-net must be placed against the flow; the operator’sfeet and contemporarily the aquatic net can be usedin deeper water bodies to move the ground debrisand drive out burrowers and climbers. In these con-ditions the net must be held vertically, in oppositionto the water flow, downstream the operator’s feet.
After 3-4 minutes of sampling, the material col-lected by the net is put into a little white tank andthe operator will begin the identification of the in-vertebrates morphotypes, with the aid of a magni-fying glass. In case of uncertain identification, smallsize invertebrates can be collected by means of en-
tomological pincers or little brush and put in a test-tubes with ethyl alcohol 70% to be identified later.
After having finished the sample the Freshwa-ter Biodiversity Index of the site can be easily cal-culated by summing all the scores obtained in eachsection of the form: hydromorphology, taxonomicdiversity and pollution tolerance. To have accept-able conditions of biodiversity the result must be30 or more.
The survey must be done in low or normal waterconditions coming from decreasing flows, fromspring to autumn. Most benthic invertebrate popu-lations are subjected to seasonal life cycles and thisshould be considered in the results. The sampling
78
MACROGROUPS TROPHIC GROUP POLLUTION TOLERANCE
Plecoptera Shredders/Grazers/Predators 2
Ephemeroptera Collectors 3
Tricoptera Collectors/Grazers/Shredders 4
Megaloptera Predators 4
Platyhelminthes Collectors 4
Coleoptera (larvae) Predators/Grazers/Shredders/Collectors 4
Heteroptera Predators 5
Odonata Anisoptera Predators 5
Odonata Zygoptera Predators 8
Arachnida Hydracarina Predators 6
Diptera (larvae) Collectors/Grazers/Predators/Shredders 6
Crustacea Amphipoda Collectors 5
Crustacea Decapoda Collectors/Grazers 6
Crustacea Isopoda Collectors 8
Mollusca Collectors/Grazers 7
Oligochaeta Predators 7
Hirudinea Predators/Collectors 9
Nematoda/Nematomorpha Predators 8
Table 3. Trophic characteristics and synthetic index of pollution tolerance (from Mandaville, 2002 modified) of the mostcommon types of freshwater macroinvertebrates.
GIANFRANCO CAODURO ET ALII
can give results not reliable in the following situa-tions:
- during or immediately after flood events (it isrecommended to wait at least two weeks to allowthe recolonization of the substrates);
- during or immediately after periods of drought(it is recommended to wait at least four weeks);
- impediments caused by environmental factorssuch as the high turbidity of water.
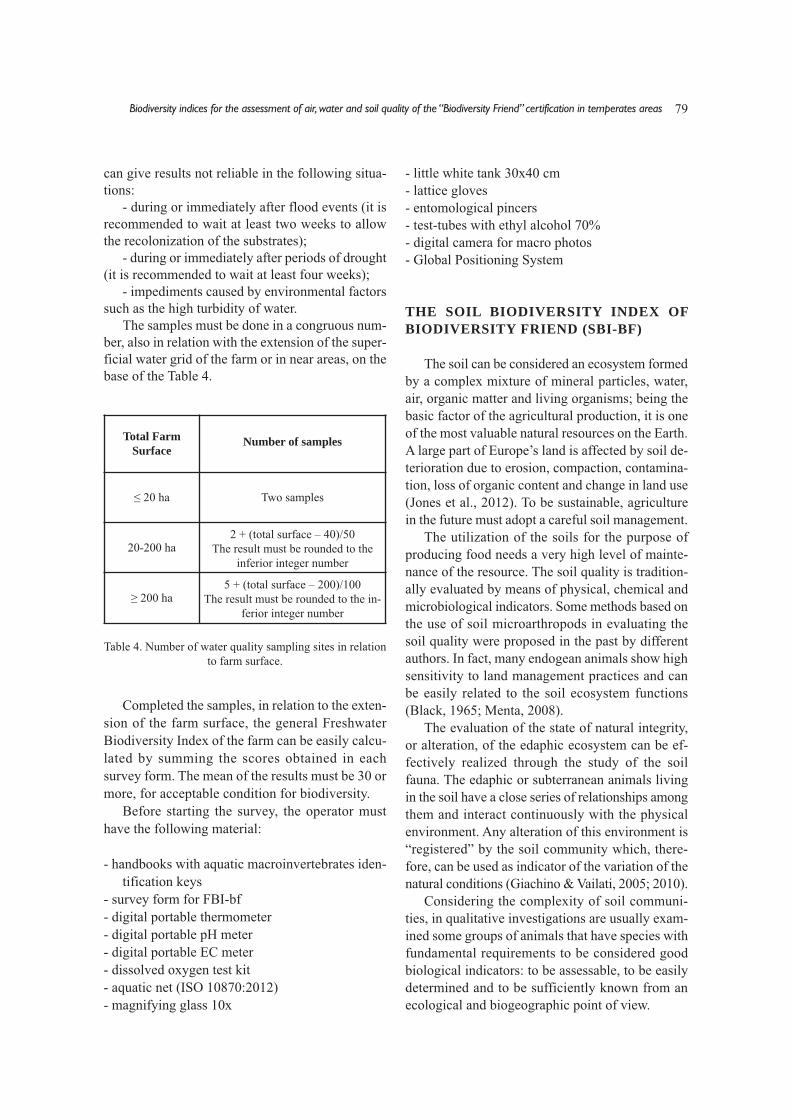
The samples must be done in a congruous num-ber, also in relation with the extension of the super-ficial water grid of the farm or in near areas, on thebase of the Table 4.
- little white tank 30x40 cm - lattice gloves - entomological pincers - test-tubes with ethyl alcohol 70% - digital camera for macro photos - Global Positioning System
THE SOIL BIODIVERSITY INDEX OFBIODIVERSITY FRIEND (SBI-BF)
The soil can be considered an ecosystem formedby a complex mixture of mineral particles, water,air, organic matter and living organisms; being thebasic factor of the agricultural production, it is oneof the most valuable natural resources on the Earth.A large part of Europe’s land is affected by soil de-terioration due to erosion, compaction, contamina-tion, loss of organic content and change in land use(Jones et al., 2012). To be sustainable, agriculturein the future must adopt a careful soil management.
The utilization of the soils for the purpose ofproducing food needs a very high level of mainte-nance of the resource. The soil quality is tradition-ally evaluated by means of physical, chemical andmicrobiological indicators. Some methods based onthe use of soil microarthropods in evaluating thesoil quality were proposed in the past by differentauthors. In fact, many endogean animals show highsensitivity to land management practices and canbe easily related to the soil ecosystem functions(Black, 1965; Menta, 2008).
The evaluation of the state of natural integrity,or alteration, of the edaphic ecosystem can be ef-fectively realized through the study of the soilfauna. The edaphic or subterranean animals livingin the soil have a close series of relationships amongthem and interact continuously with the physicalenvironment. Any alteration of this environment is“registered” by the soil community which, there-fore, can be used as indicator of the variation of thenatural conditions (Giachino & Vailati, 2005; 2010).
Considering the complexity of soil communi-ties, in qualitative investigations are usually exam-ined some groups of animals that have species withfundamental requirements to be considered goodbiological indicators: to be assessable, to be easilydetermined and to be sufficiently known from anecological and biogeographic point of view.
79
Total Farm Surface
Number of samples
≤ 20 ha Two samples
20-200 ha 2 + (total surface – 40)/50
The result must be rounded to the inferior integer number
≥ 200 ha 5 + (total surface – 200)/100
The result must be rounded to the in-ferior integer number
Table 4. Number of water quality sampling sites in relationto farm surface.
Completed the samples, in relation to the exten-sion of the farm surface, the general FreshwaterBiodiversity Index of the farm can be easily calcu-lated by summing the scores obtained in eachsurvey form. The mean of the results must be 30 ormore, for acceptable condition for biodiversity.
Before starting the survey, the operator musthave the following material:
- handbooks with aquatic macroinvertebrates iden-tification keys
- survey form for FBI-bf - digital portable thermometer - digital portable pH meter- digital portable EC meter- dissolved oxygen test kit- aquatic net (ISO 10870:2012)- magnifying glass 10x
Biodiversity indices for the assessment of air, water and soil quality of the “Biodiversity Friend” certification in temperates areas
Coleoptera Carabidae and Staphylinidae, Opil-ionida, Lumbricidae and Enchytreidae were thegroups more frequently used in the past for investi-gations of this kind (Brandmayr et al., 2005). Butthe application of these procedures were often lim-ited by the difficulty of classification at species level,that requires the work of specialists in zoology.
The method of evaluation of the biological soilquality in relation to the presence of edaphic mi-croarthropods, was proposed by Parisi in 2001(QBS-ar, Qualità Biologica del Suolo-Arthropoda),initially with the aim to develop a procedure ableto characterize the maturity of woodland soils.Using the ecological concept of Biological Form(or ecotype), similar to Sistematic Unit in the Ex-tended Biotic Index, and analyzing the morpholog-
ical and functional convergence among the soil mi-croarthropods, Parisi (2001) assigned a differentimportance to each group characterizing the struc-ture of the soil community, defining the so calledecomorphological indices (EMI).
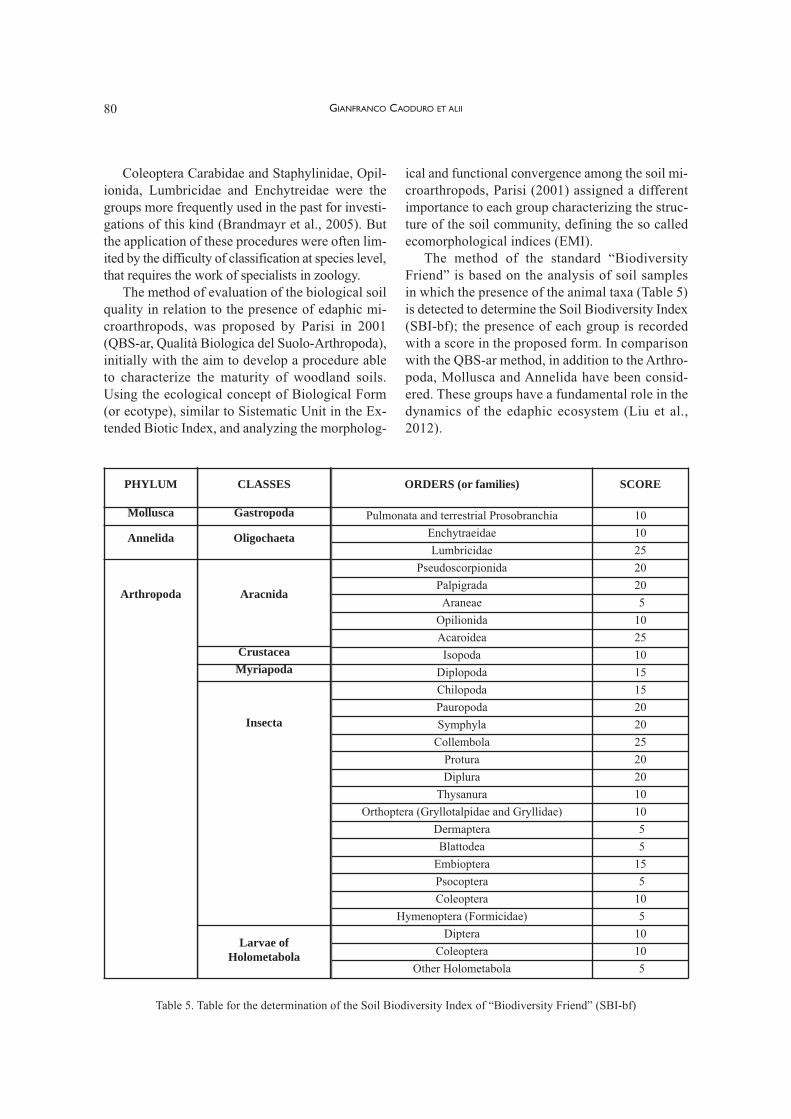
The method of the standard “BiodiversityFriend” is based on the analysis of soil samplesin which the presence of the animal taxa (Table 5)is detected to determine the Soil Biodiversity Index(SBI-bf); the presence of each group is recordedwith a score in the proposed form. In comparisonwith the QBS-ar method, in addition to the Arthro-poda, Mollusca and Annelida have been consid-ered. These groups have a fundamental role in thedynamics of the edaphic ecosystem (Liu et al.,2012).
80
Table 5. Table for the determination of the Soil Biodiversity Index of “Biodiversity Friend” (SBI-bf)
ORDERS (or families) SCORE
Pulmonata and terrestrial Prosobranchia 10Enchytraeidae 10Lumbricidae 25
Pseudoscorpionida 20Palpigrada 20Araneae 5
Opilionida 10Acaroidea 25Isopoda 10
Diplopoda 15Chilopoda 15Pauropoda 20Symphyla 20
Collembola 25Protura 20Diplura 20
Thysanura 10Orthoptera (Gryllotalpidae and Gryllidae) 10
Dermaptera 5Blattodea 5
Embioptera 15Psocoptera 5Coleoptera 10
Hymenoptera (Formicidae) 5Diptera 10
Coleoptera 10Other Holometabola 5
CLASSES
Gastropoda
Oligochaeta
Aracnida
CrustaceaMyriapoda
Insecta
Larvae of Holometabola
PHYLUM
Mollusca
Annelida
Arthropoda
GIANFRANCO CAODURO ET ALII

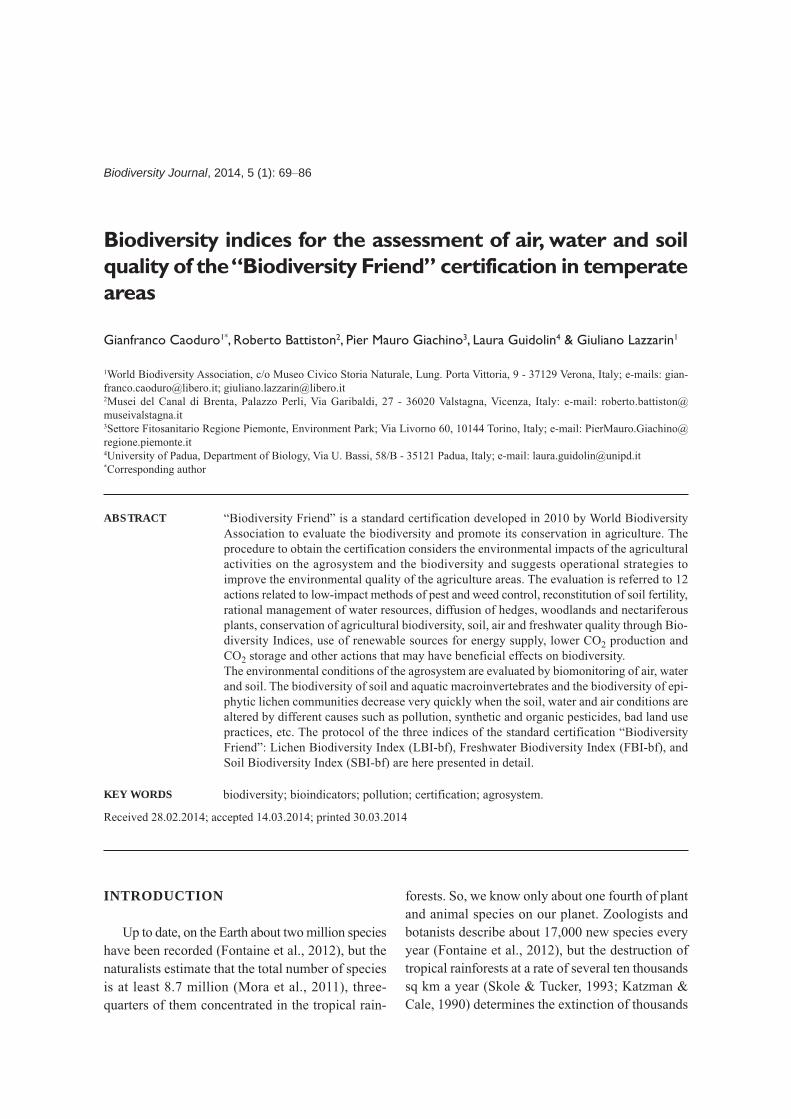
Figure 1. Survey form of the Lichen Biodiversity Index (Form LBI-bf).
Biodiversity indices for the assessment of air, water and soil quality of the “Biodiversity Friend” certification in temperates areas 81

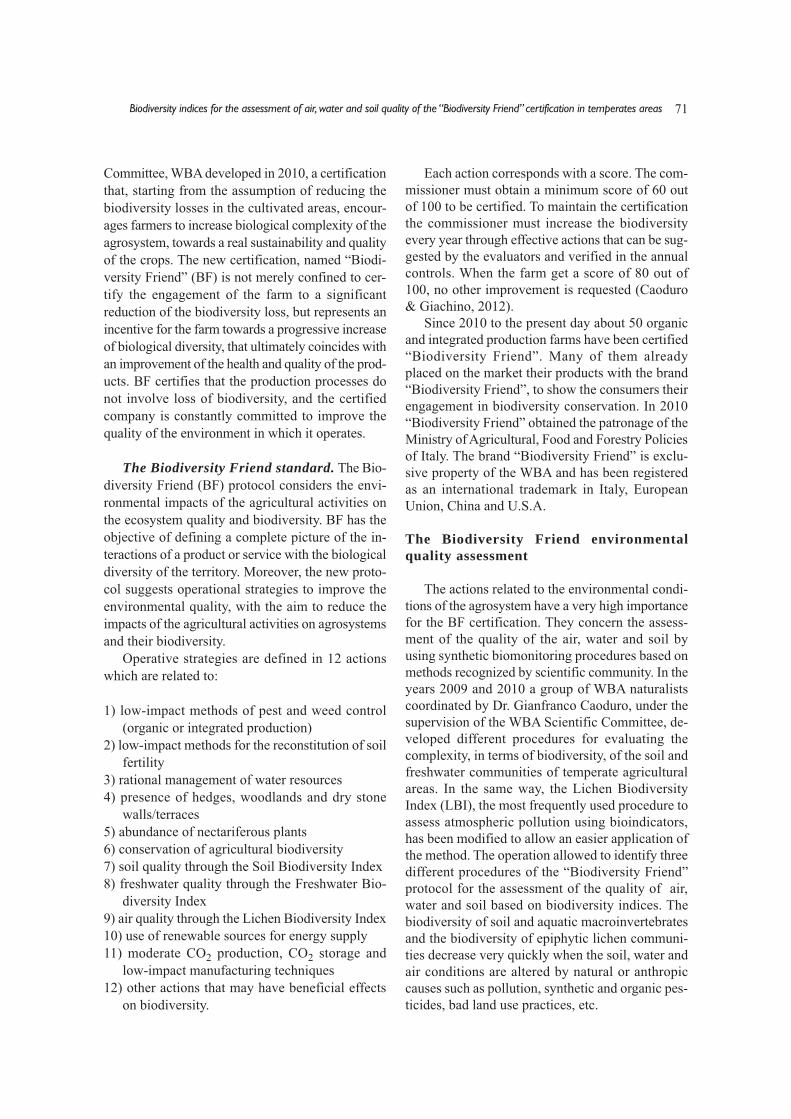
Figure 2. Survey form of the Freshwater Biodiversity Index (Form FBI-bf).
GIANFRANCO CAODURO ET ALII82
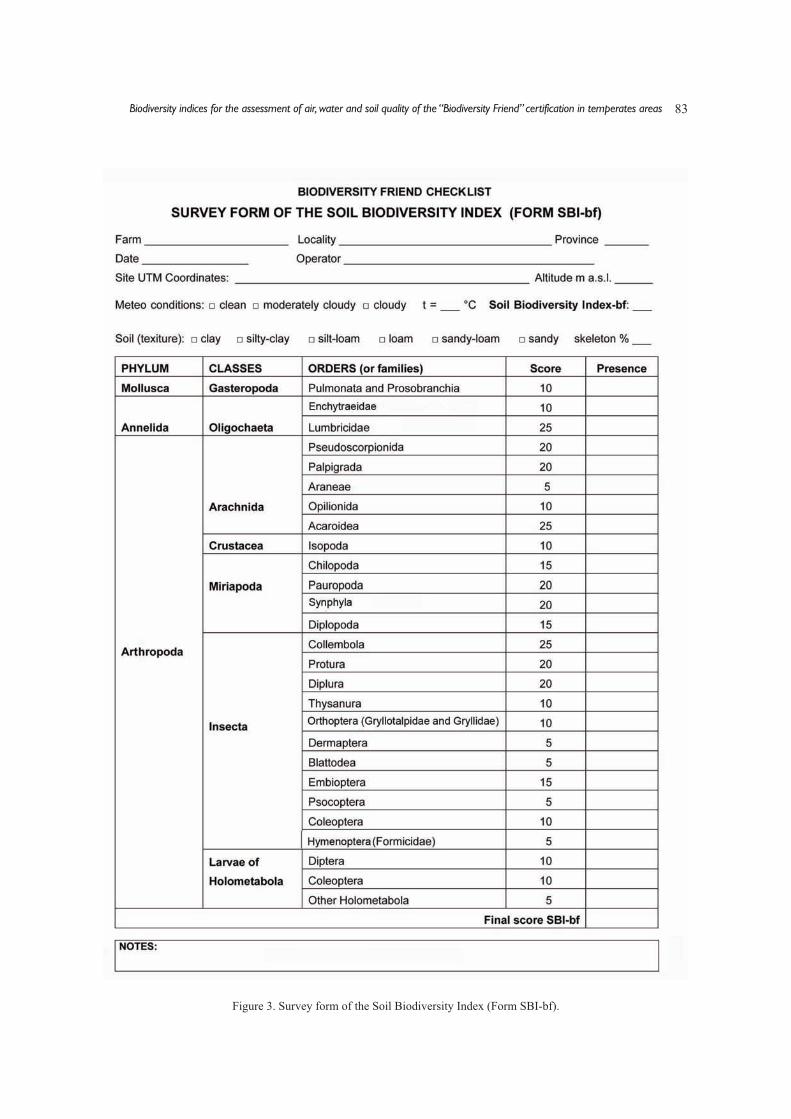
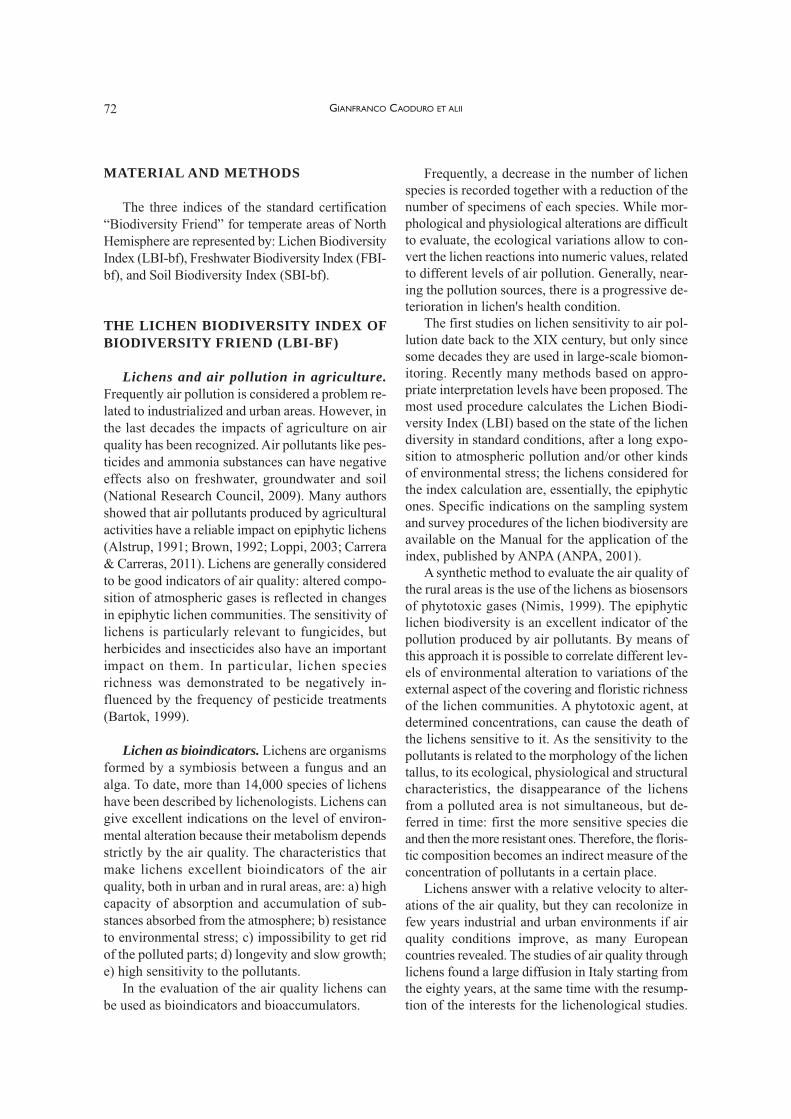
Figure 3. Survey form of the Soil Biodiversity Index (Form SBI-bf).
Biodiversity indices for the assessment of air, water and soil quality of the “Biodiversity Friend” certification in temperates areas 83

Survey methodology of the SBI-bf
One of the most common methods of collectingsoil macroinvertebrates is through the “free hunting”(with or without aspirator). During this operation theexploration of the muscicolous, saproxylic and la-pidicolous enviroments must be done. In the “Bio-diversity Friend” survey the collecting of thespecimens is not required; the simple observation ofthe animals will be recorded on the survey form. Bydescribing carefully the content of the samplings ispossible to evaluate the Soil Biodiversity Index and,therefore, the variety of the soil community of a cer-tain soil. The synthetic value obtained is used in the“Biodiversity Friend” checklist to evaluate the con-ditions of the cultivation substrate.
According to the “Biodiversity Friend” stan-dard, the technique used for the soil survey is basedon the use of the entomological litter reducer. Thesurvey is made by digging with a spade a volumeof soil of about three square decimetres. The holemust have a depth of about 25-30 cm. The soil iscollected and put into an entomological litter re-ducer with a sieve having meshes of 10 mm. Thematerial obtained is sieved again through anothersieve with 4 mm mesh. The particles of soil mustbe sieved on a white square piece of cloth (1x1 mlarge). The large soil particles collected in the sieveare put in a corner of the cloth.
At this point, the operator begins the identifica-tion of the invertebrates, directly or with the helpof a magnifying glass. Little by little the differenttaxa of invertebrates are found and identified; theirpresence is noted on the survey form. In case of un-certain identification, for large size organisms(more than 5 mm) a camera can be used, whilesmall size organisms can be collected by means ofentomological pincers or little brush and put in atest-tubes with ethyl alcohol 70% to be identifiedsuccessively.
Before starting the survey, the operator musthave the following material:
- handbooks with invertebrate identification keys - survey form for SBI-bf - Global Positioning System - entomological litter reducer - work gloves - portable spade - sieve with 4 mm mesh
- magnifying glass 10x- white cloth 1x1 m- entomological pincers - aspirator - little brush with soft bristles - test-tubes with ethyl alcohol 70% - digital camera for macro-photos
The samples must be collected in workable (in“tempera”) soil; too dry or too rainy periods mustbe avoided. The most favourable seasons arespring and early autumn. However, surveys mustbe realized with sunny and warm conditions (morethan 18° C), to stimulate the soil fauna to moveafter sieving.
If the surveys are made during a droughty springor autumn, with dryness of the superficial soil lay-ers, the samples can be taken sieving the soil col-lected from around the roots of cultivated orspontaneous plants of the crop. The most advisablething is to collect the whole plant and insert it withall its roots and soil clod in the litter reducer. In thedriest periods the pedofauna looks for moisture inthe deepest layer of the soil or near the root appara-tus of cultivated or spontaneous plants.
In the same way, further investigations by hand-collecting can be made under stones deeply buriedin the soil, if they are present in the crop.
At the end of the survey, the operator sums allthe scores registered on the form SBI-bf. Accordingto the Soil Biodiversity Index a biologically activesoil must reach a total score of 100 or more. Thesurveys must be done in an adequate number ofsamples in relation to the extension of the farm sur-face. The number of samples on each more repre-sentative crop of the farm must be proportionallyrelated to the extension of the farm (Table 6).
After having finished all the samples, in relationto the extension of the farm surface, the Soil Biodi-versity Index can be easily calculated by summingthe scores of each samples, divided by the totalnumber of samples. The ratio must be 100 or more,for a farm with soils of acceptable quality. Besidesthe surface extension, the definition of main ormore representative crops considers also the criti-cality in terms of the use of resources. The wood-lands must be considered as crops if they aremanaged using various silvicultural systems.
GIANFRANCO CAODURO ET ALII84

DISCUSSION AND CONCLUSIONS
The three indices here presented are (for surveyforms see figures 1-3) original contribution based onexisting and largely used method of assessing bio-diversity and the quality of different environmentsadapted to the operative methodology of the certi-fication protocols. The procedures here proposedare the result of a rational compromise between adetailed and complete anal-ysis and the need of fastassessing protocols for non-specialist operators. Toreduce the potential errors and approximations dueto a high level of taxonomical identification of thesamples a multidisciplinary approach has beenused. The different fields of investigation and kindof source of information allow a comparison of dif-ferent trends that can lead to a single solid conclu-sion, reducing the aberration possible in amono-thematic approach. The open structure of thesurveys and all the collateral information obtained,with every step forward a more detailed analysisbeyond the final score, allow the operator to get alsoan idea on the single issues that may threat or alterthe analysed environment, and propose resolutions.
ACKNOWLEDGEMENTS
The authors would like to thank the members ofthe Scientific Committee of the World Biodiversity
Association for their support in developing thesenew indices; their suggestions and criticisms werevery helpful in achieving our goal.
REFERENCES
Alstrup V., 1991. Effects of pesticides on lichens. Bry-onora, 9: 2–4.
ANPA, 2001. I.B.L. Indice di Biodiversità Lichenica.Manuale ANPA 2. ANPA, Roma, 85 pp.
Bartók K., 1999. Pesticide usage and epiphytic lichendiversity in Romanian orchards. The Lichenologist,31: 21–25.
Beck W.M. Jr., 1955. Suggested method for reportingbiotic data. Sewage and Industrial Wastes, 27: 1193–1197.
Black C.A. (Ed.), 1965. Method of Soil Analysis, Part 2,Chemical and Microbiological Properties, AmericanSociety of Agronomy, Inc, Publisher, Madison,Wisconsin USA, 1159 pp.Brandmayr P., Zetto T. &Pizzolotto R., 2005. I Coleotteri Carabidi per la va-lutazione ambientale e la conservazione della biodi-versità. Manuale operativo. APAT, Manuali e LineeGuida, 34: 240 pp.
Brown D.H., 1992. Impact of agriculture on bryophytesand lichens. In: Bates J.W. & Farmer A.M., 1992.Bryophytes and Lichens in a Changing Environment,Oxford, Clarendon Press, pp. 259–283.
Bunn S.E. & Arthington A.H., 2002. Basic principles andecological consequences of altered flow regimes foraquatic biodiversity. Environmental Management,30: 492-507.
Caoduro G. & Giachino P.M., 2012. “BiodiversityFriend”: certificare la conservazione della biodiver-sità in agricoltura. Regione Piemonte, Annali delSettore Fitosanitario regionale, 2011: 69–73.
Carrera M.F. & Carreras H.A., 2011. Efectos de laaplicación de glifosato sobre parámetros químico-fisiológicos en Usnea amblyoclada (Müll. Arg.)Zahlbr. Ecología austral, 21: 353-361.
Ferrington L.C. Jr. & Sealock A.W., 2005. Relationshipof benthic macroinverbetrate biodiversity to recentand past ditching practices in Hardwood Creek nearHugo, Minnesota. Interim Report, 11 pp.
Fontaine B., van Achterberg K., Alonso-Zarazaga M.A.,Araujo R., Asche M., Aspöck H., Aspöck U., AudisioP., Aukema B., Bailly N., Balsamo M., Bank R.A.,Belfiore C., Bogdanowicz W., Boxshall G., Bur-ckhardt D., Chylarecki P., Deharveng L., Dubois A.,Enghoff H., Fochetti R., Fontaine C., Gargominy O.,Lopez M.S., Goujet D., Harvey M., Heller K.G., vanHelsdingen P., Hoch H., De Jong Y., Karsholt O., LosW., Magowski W., Massard J. A., McInnes S.J.,Mendes L.F., Mey E., Michelsen V., Minelli A.,
Total Farm Surface
Number of samples
≤ 20 ha Three samples distributed on the main or more representative crops
20-200 ha 3 + (total surface – 20)/40
The result must be rounded to the in-ferior integer number. The samplesmust be distributed in the 4 main or
more representative crops
≥ 200 ha 7 + (total surface – 100)/100
The result must be rounded to the inferior integer number. The samplesmust be distributed in the 5 main or
more representative crops
Table 6. Number of soil quality sampling sites in relationto farm surface
Biodiversity indices for the assessment of air, water and soil quality of the “Biodiversity Friend” certification in temperates areas 85

Nafrıa J.M., van Nieukerken E.J., Pape T., De PrinsW., Ramos M., Ricci C., Roselaar C., Rota E., SegersH., Timm T., van Tol J. & Bouchet P., 2012. NewSpecies in the Old World: Europe as a Frontier inBiodiversity Exploration, a Test Bed for 21st CenturyTaxonomy. PLoS ONE.; 7(5):e36881.
Giachino P.M. & Vailati D., 2005. Problemi di protezionedell’ambiente ipogeo e note sull’impatto delle attivitàdi ricerca in ambiente sotterraneo. In: Gili R.R. &Peano G., 2005. L’Ambiente Carsico e l’Uomo. AttiConvegno Nazionale, Bossea (5-8 settembre 2003):303–314.
Giachino P.M. & Vailati D., 2010. The subterraneanenvironment. Hypogean life, concepts and collectingtechniques. WBA Handbooks 3, 130 pp.
ISO 10870:2012, 2012. Water quality. Guidelines for theselection of sampling methods and devices forbenthic macroinvertebrates in fresh waters. BritishStandards Institute, 38 pp.
Jones A., Stolbovoy V., Tarnocai C., Broll G., SpaargarenO., Montanarella L., Anisimov O., Arnalds Õ.,Arnoldusen A., Bockheim J., Breuning-Madsen H.,Brown J., Desyatkin R., Goryachkin S., JakobsenB.H., Konyushkov D., Mazhitova G., Mccallum I.,Naumov E., Overduin P., Nilsson, Solbakken E., PingC.L. & Ritz K.S., 2012. The State of Soil in Europe.JRC Reference Reports, European EnvironmentAgency. Report EUR 25186 EN, 71 pp.
Katzman M.T. & Cale W.G. Jr., 1990. Tropical forestpreservation using economic incentives. Bioscience,40: 827–832.
Klemm D.J., Lewis P., Fulk F., & Lazorchak J.M., 1990.Macroinvertebrate field and laboratory methods forevaluating the biological integrity of surface waters.U.S. Environmental Protection Agency, Washington,256 pp.
Liu J., Lu Z., Yang J., Xing M, Yu F. & Guo, M., 2012. Ef-fect of earthworms on the performance and microbialcommunities of excess sludge treatment process invermifilter", Bioresources Technology, 117: 214–221.
Loppi S., 2003. Mapping the effects of air pollution, ni-trogen deposition, agriculture and dust by the diver-sity of epiphytic lichens in central Italy. In: Lichensin a changing pollution environment. English NatureResearch Reports. Rep. N. 525: 37–41.
Lowrance R., Hendrix F.P. & Odum E.P., 1986. A hier-archical approach to sustainable agriculture. Ameri-can Journal of Alternative Agriculture, 1: 169–173.
Mandaville S.M., 2002. Benthic Macroinvertebrates inFreshwaters-Taxa Tolerance Values, Metrics, andProtocols. Project H-1, Soil & Water ConservationSociety of Metro Halifax, 128 pp.
Menta C., 2008. Guida alla conoscenza della biologia edell’ecologia del suolo. Funzionalità, diversità biolo-gica, indicatori. Oasi Perdisa Editore, Bologna, 304 pp.
Mora C., Tittensor D.P., Adl S., Simpson A.G.B. & WormB., 2011. How Many Species Are There on Earth andin the Ocean? PLoS Biology, 9 (8): e1001127.
National Research Council, 2009. Global Sources ofLocal Pollution: An Assessment of Long-RangeTransport of Key Air Pollutants to and from theUnited States. The National Academies Press, Wash-ington, 248 pp.
Nimis P.L., 1999. Linee guida per la bioindicazione deglieffetti dell’inquinamento tramite la biodiversità deilicheni epifiti. In: Piccini C. & Salvati S., 1999. AttiWorkshop "Biomonitoraggio della qualità dell'ariasul territorio nazionale". A.N.P.A., Roma, pp. 267–277.
Olsgard F., Somerfield P.J. & Carr M.R., 1997. Relation-ships between taxonomic resolution and data trans-formations in analyses of a macrobenthic communityalong an established pollution gradient. Marine Ecol-ogy Progress Series, 149: 173–181.
Parisi V., 2001. La qualità biologica del suolo: un metodobasato sui microartropodi. Acta naturalia de "L'AteneoParmense", 37: 97–106.
Rosenberg D.M., Davies I.J., Cobb D.G. & Wiens, A.P.1997. Ecological Monitoring and Assessment Net-work (EMAN) Protocols for Measuring Biodiversity:Benthic Macroinvertebrates in Fresh Waters. Dept.of Fisheries & Oceans, Freshwater Institute, Win-nipeg, Manitoba. 53, Appendices.
Siligardi M., Avolio F., Baldaccini G., Bernabei S., BucciM.S., Cappelletti C., Chierici E., Ciutti F., Floris B.,Franceschini A., Mancini L., Minciardi M.R.,Monauni C., Negri P., Pineschi G., Pozzi S., RossiG.L., Sansoni G., Spaggiari R., Tamburro C. &Zanetti M., 2007. I.F.F. 2007 Indice di funzionalitàfluviale APAT, Ministero dell’Ambiente e della Tuteladel Territorio e del Mare, ARPA Trento, 325 pp.
Skole D.L. & Tucker C., 1993. Tropical Deforestationand Habitat Fragmentation in the Amazon: SatelliteData from 1978 to 1988. Science, 260: 1905–1910.
United Nations, Department of Economic and Social Af-fairs, Population Division, 2012. World UrbanizationProspects: The 2011 Revision. United Nations, NewYork, 32 pp.
Vannote R.L., Minshall G.W., Cummins K.W., SedellJ.R. & Cushing C.E., 1980. The river continuum con-cept. Canadian Journal of Fisheries and AquaticSciences, 37: 130–137.
Woodiwiss F.S., 1964. The biological system of streamclassification used by the Trent River Board. Chem-istry and Industry, 14: 443–447.
Woodiwiss F.S., 1978. Comparative study of biological-ecological water quality assessment methods. Secondpractical demonstration. Summary Report. Commis-sion of the European Communities. Severn TrentWater Authority. Brussels.
GIANFRANCO CAODURO ET ALII86