biodiversity baseline assessment in the redd-plus pilot...
TRANSCRIPT

Biodiversity Baseline Assessment in the REDD-PlusPilot Area on Leyte lsland as an Input for the Elaboration of a MRV System for REDD-PlusIncluding Biodiversity Co-benefits
in collaboration with

ImprintThis publication is by the Deutsche Gesellschaft für Internationale Zusammenarbeit through the Climate-relevant Modernization of the National Forest Policy and Piloting of Reducing Emissions from Deforestation and Forest Degradation (REDD) Measures in the Philippines Project, funded by the German Federal Ministry for the Environment, Nature Conservation and Nuclear Safety (BMU) under its International Climate Initiative. The BMU supports this Initiative based on a decision of the German Parliament. For more information, see http://www.international-climate-initiative.com.
This study has been implemented by Fauna & Flora International in collaboration with the UNDP/GEF-funded NewCAPP, which cofinanced the field work for the biodiversity survey in Mt. Nacolod.
As a federally owned enterprise, GIZ supports the German Government in achieving its objectives in the field of international cooperation for sustainable development.
Statements from named contributors do not necessarily reflect the views of the publisher.
Published byDeutsche Gesellschaft für Internationale Zusammenarbeit (GIZ) GmbH
Registered officesBonn and Eschborn, GermanyT +49 228 44 60-0 (Bonn)T +49 61 96 79-0 (Eschborn)
ResponsibleFor. Ricardo L. CalderonDirectorDepartment of Environment and Natural Resouces-Forest Management BureauForest Management Bureau Building, Visayas Avenue, Quezon City 1101 PhilippinesT: 63 2 928 9313 / 927 4788
Dr. Bernd-Markus LissPrincipal AdvisorClimate-relevant Modernization of Forest Policy and Piloting of REDDC2/F PDCP Bank Centre Building, V.A. Rufino corner L.P. Leviste StreetsSalcedo Village, Makati City 1227 PhilippinesE: [email protected]: +63 2 651 5140
Authors / ResearchersNeil Aldrin D. Mallari, Ph. D., Ronald Allan Altamirano, Arvin C. Diesmos, Ph. D., Nevong Puna, Christain Supsup, Edmund Leo Rico, Jose Don De Alban, Angelica Kristina Monzon, Jack Avancena, Rizza Karen Veridiano, Augusto Asis Jr., Antonio Bringas, Sedricke Lapus, Marilyn Musa, Dennis Tablazon
Contributing Authors Nonito Antoque, Willardo Reyes, Joel Sarmiento, Sweepy Veluz, Rolly Uriza, Uldarico Carestia, Perry Buenavente
Copyright on PhotosThe photos in this publication are owned by GIZ unless otherwise indicated in the photo.
MapsThe geographical maps are for information purposes only and do not constitute recognition under international law of boundaries and territories. GIZ does not guarantee in any way the current status, accuracy and completeness of the maps. All liability for any loss or damage arising directly or indirectly from their use is excluded.
Layout / DesignRyan G. Palacol
Printed and distributed byDeutsche Gesellschaft für Internationale Zusammenarbeit (GIZ) GmbH
Place and date of publicationManila, PhilippinesJuly 2013
CitationMallari, Neil Aldrin D. et al. 2013: Biodiversity Baseline Assessment in the REDD-plus Pilot Area on Leyte Island as an Input for the Elaboration of a MRV System for REDD-plus Including Biodiversity Co-benefits. Manila, Philippines: Deutsche Gesellschaft für Internationale Zusammenarbeit (GIZ) GmbH.
ISBN: 978-971-95451-7-0


2
Acknowledgements
Fauna & Flora International would like to acknowledge the support and information provided by the following individuals and organizations:
- NewCAPP - GIZ - NMP - DENR Region VIII - PENRO Region 8 - CENRO San Juan - Local Government Unit of Silago - Barangay Catmon - Local Government Unit of Hinunangan - Barangay Upper Bantawon - Barangay San Juan - Local Government Unit of Bontoc - Local Government Unit of of Maasin - Philippine National Police and Philippine Army detachments in Sogod and Silago

3
Executive Summary The project “Climate-relevant Modernization of Forest Policy and Piloting of REDD Measures in the Philippines”, funded under the International Climate Initiative of the German Federal Ministry for the Environment (BMU), supports the country’s efforts toward forest and climate protection, and the development of appropriate policy and instruments.The project is implemented by the Deutsche Gesellschaft für Internationale Zusammenarbeit (GIZ) GmbH with the Department of Environment and Natural Resources (DENR) as the main partner, in cooperation with local government units (LGUs) and a wide range of stakeholders, in line with the National REDD-Plus Strategy (NRPS).
The project aims for an improved forest policy and the development of incentives for forest protection and rehabilitation, reduction of greenhouses gases (GHG), conservation of biodiversity and building of capacities toward this end. It focuses on forest policy reforms and REDD+ pilot activities in and around selected protected areas. In discussions with DENR, Leyte Island has been selected as a site for piloting REDD+ measures, with barangays in five municipalities of Southern Leyte Province as pilot project areas. Municipalities included are Silago, Sogod, Bontoc, Tomas Oppus and Maasin. This technical report comprises the results of the biodiversity assessment conducted by Fauna & Flora International in a key biodiversity area in Southern Leyte covering six municipalities (Silago, Hinunangan, Sogod, Maasin, Tomas Oppus and Malitbog). The study was aimed at generating practical information and key species habitat information to inform management planning. The following activities were conducted: a) identified and compared habitat types based on natural and land use stratification, b) determined anthropogenic factors influencing overstorey and understorey vegetation, c) identified the patterns of fauna–habitat associations, d) listed species baseline for future protected area management plans and monitoring programs, e) provided a guide for the design and implementation of management interventions for specific species survival within and across their range in Southern Leyte, and f) modelled species responses and/or communities to various land cover uses. The study that spanned over a month, from 8 November to 15 December 2012, recorded a total of 229 flora species in 65 families, with 31 Philippine endemics; 10 IUCN critically endangered species, which are mostly Dipterocarp species, and 20 IUCN vulnerable species. The terrestrial vertebrates accounted in the survey totalled to 212 species (Birds: 112 species, Mammals: 36 species, Herpetofauna: 64 species). Of the 112 species of birds, 41 are endemic to the Philippines and 14 are endemic to the Visayas and the Greater Mindanao faunal region. Among the 41 endemic species, 11 are in the IUCN threatened category. A total of 36 species of mammals belonging to 15 families were recorded, and 17 species (47%) are Philippine endemics of which eight are restricted only to the Mindanao faunal region. Threatened mammalian species recorded in the survey include the Golden capped fruit bat (Acerodon jubatus), endangered (EN); Sus barbatus mindanensis, vulnerable (VU), Large flying fox (Pteropus vampyrus), Philippine forest horshoe bat (Rhinolophus inops) and the Philippine tarsier (Tarsius syrichta), which are all endemic in the Philippines. Likewise, there are a total of 69 species of terrestrial amphibians and reptiles recorded across the four localities. Of the 69 herpetofaunal species, 25 species are frogs belonging to seven families, in which two of these were positively identified as new species; 23 species are lizards belonging to five families; 20 species of snakes and one species of terrestrial turtle. The general pattern of the species accumulation curves of the vertebrates found during the survey showed to approach the

4
asymptote. It also showed that the combination of anthropogenic and natural factors played a major role on species distribution and diversity. Consequently, highly disturbed areas resulted in low diversity. Results of the faunal habitat association indicated the general preference of Southern Leyte’s fauna to forest and riverine habitats. The plant communities surveyed, through canonical correspondence analyis (CCA) using 18 habitat parameters (e.g. tree counts, biomass values, increasing bamboo, herb coverage, etc.), indicated that with increasing disturbance, vectors of increasing understorey, ground and bamboo coverage as well as higher incidences of fallen trees can be observed. Similarly, through the CCA, trees associated with humans were grouped and found in areas with increasing bamboo cover and herbaceous cover. On the other hand, species known to be associated with high-quality forest seem to favor areas with less disturbance. With birds and small non-volant mammals, CCA also confirmed trends found on trees and the general pattern of diversity of the species, which increases as it approaches less disturbance, high biomass and more pristine habitats. An occupancy modelling on 21 species of birds showed that the detection probability (p) was less than one, which is influenced by environmental covariates such as tree girth (DBH), presence of palms (palm), densities of saplings (sap), coverage of rattan clumps (rat), extent of grass cover (grass) and/or the combinations of these covariates. The simple modeling exercise demonstrated how science reinforces positively guide management in protected areas or REDD+ demonstration sites. Habitat associations of trigger species and occupancy modelling can predict impacts of habitat change on species and can be reduced by addressing the pressures appropriately, taking into consideration tolerance levels. Conduct of baseline studies on fauna and flora provides a better discernment in designing appropriate monitoring protocols. Remote sensing analysis has been demonstrated in this exercise to be useful particularly in large spatial scales; however, it can only generate useful information at a certain level or resolution, stimulating the need to conduct ground truthing, which could further validate existing data and analyze the historical trend of a site’s land use. Conflicting land tenurial instruments between private individuals and government in areas visited have also been seen to hamper the implementation of conservation projects, which was resolved through the intervention of the local government unit. Ground truthed areas during the assessment revealed a different description of the site in comparsion with the existing data, particularly on maps. The rainy weather condition also hampered the conduct of the survey, which caused reduced mobility and visibility in the field. Identified threats to biodiversity include widespread illegal collection of wildlife, conflicting land tenurial issues and improper wildlife collection (e.g. bat collection in caves in Maasin). However, these threats can be addressed by having proper land use classification with strict implementation of policy and reforms that strengthen sustainable conservation initiatives through increased capacitation of stakeholders.

5
Table of Contents ACKNOWLEDGEMENTS........................................................................................................2
EXECUTIVE SUMMARY .................................................................................................... 3
ACRONYMS AND ABBREVIATIONS ................................................................................. 7
LIST OF TABLES ................................................................................................................ 8
LIST OF FIGURES ............................................................................................................. 9
LIST OF ANNEXES ............................................................................................................ 11
1. INTRODUCTION ............................................................................................................ 12 1.1 CONSERVATION IMPORTANCE ...................................................................................... 12 1.2 HISTORICAL BACKGROUND OF PROJECT ....................................................................... 12
1.2.1 GIZ REDD+ PROJECT AND PNRPS-BIODIVERSITY MRV DEVELOPMENT ................. 12 1.2.2 UNDP-GEF NEWCAPP PROJECT IMPLEMENTED BY DENR-PAWB ........................ 13
1.3 OBJECTIVES AND SCOPE.............................................................................................. 14 1.4 STUDY SITES ............................................................................................................... 14
1.4.1 BIODIVERSITY ASSESSMENTS IN SOUTHERN LEYTE ................................................. 14
2. METHODOLOGIES ........................................................................................................ 17 2.1 HABITAT SURVEYS AND MAPPING.................................................................................... 17 2.2 BIRD SURVEYS ............................................................................................................ 19 2.3 MAMMALS ................................................................................................................... 19 2.4 REPTILES AND AMPHIBIANS .......................................................................................... 20
TRANSECT SAMPLING. ................................................................................................... 20 MICROHABITAT SAMPLING. ............................................................................................. 20
2.5 DATA ANALYSIS ........................................................................................................... 20
3. RESULTS AND ANALYSIS ............................................................................................. 22 3.1 FLORA DIVERSITY STRUCTURE AND COMPOSITION ........................................................ 22 3.2 FLORISTIC COMPOSITION OF THE FOUR SITES ............................................................... 22 3.3 COMPARISON OF FOREST COVER AMONG THE FOUR SITES ............................................ 23 3.4 FREQUENCY OF SPECIES FROM THE VARIOUS DBH CLASS FROM THE FOUR SITES .......... 24 3.5 HABITAT MAPPING ....................................................................................................... 24 3.6 DIPTEROCARP AND OLD GROWTH ................................................................................. 25 3.7 SECONDARY FOREST (EARLY SECOND GROWTH AND REFORESTATION) .......................... 26 3.8 PLANTATIONS (MAHOGANY/ABACA) .............................................................................. 29 3.9 KEY TREE SPECIES ..................................................................................................... 30 3.10 VEGETATIVE HISTORY ................................................................................................ 31 3.11 FAUNA ...................................................................................................................... 31
3.11.1 BIRDS ................................................................................................................. 32 3.11.1A BIRDS SPECIES ACCUMULATION AND DIVERSITY............................................33 3.11.2 MAMMALS ........................................................................................................... 34 3.11.2A MAMMAL SPECIES ACCUMULATION AND DIVERSITY........................................ 36 3.11.3 AMPHIBIANS AND REPTILES ................................................................................. 37 3.11.3A REPTILES AND AMPHIBIANS SPECIES ACCUMULATION AND DIVERSITY.............40 3.11.4 FAUNAL-HABITAT ASSOCIATION ........................................................................... 40
3.11.4A BIRDS: BROAD HABITAT ASSOCIATION..............................................................40
3.11.4B MAMMAL: BROAD HABITAT ASSOCIATION..........................................................41
3.12 ORDINATION: SPECIES-HABITAT MODELLING................................................................42

6
3.12.1 PLANT COMMUNITY ORDINATION ................................................................................ 42 3.12.2 BIRD COMMUNITY ORDINATION .................................................................................. 46 3.12.3 NON-VOLANT SMALL MAMMALS COMMUNITY ORDINATION ............................................ 49
3.13 HABITAT ASSOCIATIONS OF INDIVIDUAL SPECIES, OCCUPANCY ESTIMATION AND MODELLING .... 51 3.13.1 BIRDS OCCUPANCY..................................................................................................... 51
4. DISCUSSIONS ..................................................................................................................... 52 4.1 DETERMINANTS OF SPECIES DISTRIBUTION AND DIVERSITY ................................................... 52 4.2 FAUNAL-HABITAT ASSOCIATION........................................................................................... 53 4.3 OCCUPANCY ..................................................................................................................... 53 4.4 MANAGEMENT OPTIONS...................................................................................................... . 53
5. IMPLICATIONS FOR MANAGEMENT PLANNING ............................................................... 54 5.1 ISSUES AND CHALLENGES IN THE FIELD .............................................................................. 56 5.2 REALITIES ON THE GROUND: THE THREATS TO BIODIVERSITY ............................................... 56
6. SUMMARY AND CONCLUSIONS ........................................................................................ 57
ANNEXES ................................................................................................................................. 59
REFERENCES ......................................................................................................................... 72

7
Acronyms and abbreviations AIC Akaike’s Information Criterion ASG Advanced Second Growth Forest CCA Canonical Correspondence Analysis CVT Cultivated DBH Diameter at Breast Height DENR Department of Environment and Natural Resources EBA Endemic Bird Area EDNSTPAP Expanding and Diversifying the National System of Terrestrial Protected Areas in
the Philippines Project ESG Early Second Growth Forest FAO Food and Agriculture Organization of the United Nations FFI Fauna & Flora International FMB Forest Management Bureau FRA Forest Resources Assessment GEF Global Environment Facility GBH Girth at Breast Height GIZ Gesellschaft fϋr lnternationale Zusammenarbeit IUCN International Union for Conservation of Nature KBA Key Biodiversity Area MRV Monitoring, Reporting and Verification MVSP Multivariate Statistical Package NewCAPP New Conservation Areas in the Philippines Project OG Old Growth Forest PAWB Protected Areas Wildlife Bureau PAO Proportion Area Occupied REDD-Plus Reduction Emission Deforestation and Degradation UNDP United Nations Development Programme

8
List of Tables Table 1. List of trigger bird species
Table 2. Codes used to represent the habitat variables for analysis
Table 3. Comparison of broad habitat type in every 50-meter distance along the established transect line
Table 4. Threatened species discovered in the study areas
Table 5. Mean of forest strata cover of the four study sites
Table 6. Frequency of tree GBH ranges of the four sites
Table 7. Key tree species in a Southern Leyte Dipterocarp forest based on importance values
Table 8. Residency, endemism, migratory, conservation status and habitat preferences of 24 species across the sites
Table 9. Bird community measures of species accumulation (Mao Tau) and diversity (H’) in four habitat types across four localities in Southern Leyte. Shown also are the corresponding total number of points of sampling effort in each habitat type.
Table 10. Identified species of mammals from the four study sites
Table11. Mammals’ community measures of species accumulation and diversity
Table 12. Herpetofaunal composition found in the four study sites
Table 13. Herpetofauna community measures of species accumulation (Mao Tau) and diversity (H’) across the four localities in Southern Leyte
Table 14. Bird–habitat association
Table 15. The broad habitat and presence (marked by “X”) of the non-volant mammals
Table 16. Summary of the results of occupancy estimstes (ψ) and detection probability (p) using PRESENCE 3.1 Softwares showing each species’ best-fitting model, naive occupancy (ψ) detection probability (p) with standard error and proportion area occupancy (ψ) with standard error
Table 17. Species and covariates’ best fitting model using PRESENCE 3.1 score by Akaike’s Information Criterion (AIC). As the AIC lowers to the most parsimonius, the AIC weight increases.

9
List of Figures
Figure 1. Study site map showing the coverage of Nacolod area, NewCAPP and GIZ REDD-Plus, and the biodiversity assessment areas
Figure 2. Maasin Southern Leyte with FFI’s transect from the biodiversity assessment
Figure 3. Processing flow chart
Figure 4. Sample template
Figure 5. Spectral responses from the early second growth, reforestation, mahogany plantation (radiance vs bands)
Figure 6. Species accumulation curve per site sampling. Solid line = Silago site, Round dot = Hinunangan site, Square dot = Sogod site and Dash = Maasin site.
Figure 7. Species accumulation curve of non-volant and volant mammals across all survey sites in Southern Leyte
Figure 8. Canonical correspondence analysis (CCA) biplot of 18 habitat parameters on the two canonical axes using Multivariate Statistical Package
Figure 9. Ordination of the 13 cases on the two canonical axes using Multivariate Statistical Package (SUG = Sugod; MSN = Maasin; HIN = Hinunangan; SIL=Silago)
Figure 10. Ordination of the 14 tree species on the two canonical axes using Multivariate Statistical Package. Codes used are listed in Table 2.
Figure 11. Canonical correspondence analysis (CCA) biplot of 18 habitat parameters and 14 tree species on the two canonical axes using Multivariate Statistical Package. Codes for habitat parameters and species centroids are listed in Tables 2 and 7, respectively.
Figure 12. Canonical correspondence analysis (CCA) biplot of 18 habitat parameters, 14 tree species and 13 cases on the two canonical axes using Multivariate Statistical Package. Codes for habitat parameters and species centroids are listed in Tables 2 and 7, respectively.
Figure 13. Ordination of 20 habitat variables on the two canonical axes from Multivariate Statistical Package (MVSP)
Figure 14. Ordination of 24 selected species on the two canonical axes from Multivariate Statistical Package (MVSP)
Figure 15. Canonical correspondence analysis (CCA) biplot of 24 species and 20 habitat variables on the two canonical axes using Multivariate Statistical Package (MVSP)

10
Figure 16. Canonical correspondence analysis showing the ordination of 19 habitat variables of two canonical axes from Multivariate Statistical Package (MVSP)
Figure 17. Mammal centroids from Multivariate Statistical Package (MVSP)
Figure 18. Mammals biplot from Multivariate Statistical Package (MVSP)

11
List of Annexes Annex 1. Species list of mammals in Silago, Hinunangan, Sogod and Maasin, Southern Leyte
Annex 2. List of birds recorded during the survey in Southern Leyte from November to December 2011
Annex 3. List of amphibians and reptiles with conservation status and site location
Annex 4. Floristic composition of Samar-Leyte Island
Annex 5. Survey transects in four localities
Annex 6. Animals and plants used by communities in Southern Leyte

12
1. INTRODUCTION
1.1 Conservation importance The Philippines has diverse and unique biodiversity that exhibits an extraordinary high level of endemism and is undisputedly one of the richest and most important in the world (WCSP 1997; Mallari et al. 2001; Mallari 2009; Catibog-Sinha and Heaney 2006). History reveals that the numerous islands that make up the country have been isolated for thousands of years from mainland Asia, leading to the evolution of exceptional and diverse flora and fauna that can be found nowhere else on earth (Esselstyn et al. 2004; Heaney et al. 2005). Present tally also accounts that there are more than 20,000 endemic species of plants and animals that have been identified in the Philippines, making it one of the world’s 17 mega-diverse countries that collectively characterizes two-thirds of the earth’s biological diversity (KBA 2007). As recognized by Wallace, floristic and fauna affinities of the Philippines are largely Oriental in character, but the archipelago lacks many of the Oriental representative species (except in Palawan) and contained significant Australian floral components, which is best represented in the eastern region of Mindanao. Meanwhile, other islands like Negros and Panay, share faunal species that are surprisingly different from those on other adjacent Visayan Islands of Leyte and Samar, whose fauna are more similar to those of Mindanao. In addition, Masbate’s fauna are also more related to Negros and Panay’s fauna than they are to the more proximal Luzon.These patterns were observed in many vertebrates including birds (Peterson et al. 2000),amphibians (Evans et al. 2003), mammals (Heaney and Regalado 1998; Steppan et al. 2003; Roberts 2006; Esselstyn and Brown 2009), reptiles (McGuire and Heang 2001) and fishes (Carpenter and Springer 2005).
The geographic location and biogeography of the Philippines render its diverse flora and fauna, but in less than a century, the country’s rapid rate of deforestation is possibly one of the greatest threats to biodiversity (Pulhin et al. 2006). Current estimates indicate that less than 20% of the Philippines’ forest cover still remains (Posa et al. 2008), of which only 6% is the original forest (Conservation International – Philippines 2006). The country has already been regarded as the “hottest of the biodiversity hot spots in the world” for having high biodiversity that is undergoing a high level of threat (Myers et al. 2000). Furthermore, the IUCN in 2004 identified 491 Philippine species as globally threatened. Aside from the picturesque landscape it has, various species also thrive among these ecosystems. Hence, the continuous degradation and fragmentation of the remaining forests in the country lead to occurrences of displacement and eventual endangerment of such diverse species. According to the latest listing of IUCN, 38.78% of the plant species (223 out of 575) and 18.38% of faunal species (482 out of 2,622) are classified as critically endangered, endangered and vulnerable (IUCN 2011). This problem on deforestation is the primary reason for our country to be a priority for biodiversity conservation (Mallari et al. 2001).
1.2 Historical background of the project
1.2.1 GIZ REDD+ Project and PNRPS-biodiversity MRV development
During the American regime, the once lush and forested areas were converted to commercial logging areas with only 19 million hectares of forest remaining (Moya and Malayang 2004). Decrease of forest cover continued over the period of 1970-1980 and was pegged at 6.46 million hectares at the end of the 80s (FAO 1989; Chokkalingam et al. 2006). More recent forest surveys (FMB 2007) would indicate an increase in forest cover of 7.17 million hectares, and

13
credits may be attributed to reforestation and forest management efforts of the government and private sector. However, these efforts must still be strengthened and made sustainable in such a way that biodiversity and community needs are well addressed amidst the issue of climate change.
The international community agrees that one way to address climate change is through the implementation of a Reducing Emissions from Deforestation and Forest Degradation, conservation and enhancement of forest carbon stocks and sustainable management of forest resources (REDD-Plus) mechanism. This new approach does not only take into account reduction of emission but also considers the various co-benefits that the community can have while participating. As a response to this opportunity, the Philippines has elaborated a National REDD-Plus Strategy that was approved by DENR in 2009 and now forms part of the NCCAP 2011-2028. In the country, pilot sites have already been identified and preparatory activities were conducted in support for the Philippine National REDD-Plus Strategy (PNRPS). The GIZ-funded project “Climate-relevant Modernization of Forest Policy and Piloting of REDD” has started their efforts toward REDD-Plus implementation since 2009 in Southern Leyte, covering the municipalities of Maasin, Sogod, Silago, Tomas Oppus and Bontoc. Part of these preparatory activities includes the assessment of the baseline conditions in the areas in terms of biodiversity and an eventual recommendation of a biodiversity monitoring scheme to be adopted at the national level. These activities are in line with the prescribed framework plan of the PNRPS, which considers the importance of social and biological diversity as co-benefits aside from the carbon credits that may be generated from the REDD-Plus mechanism. Some certification schemes use biodiversity sites for the assessment of carbon projects (CCBA) as part of a measuring, reporting and verification (MRV) scheme for REDD+.
1.2.2 UNDP-GEF NewCAP Project implemented by DENR-PAWB
Protection and conservation efforts have been long implemented in various sites in the country; however, with consistent threats besetting the natural resources, more recent conservation programs are needed at hand. Specifically, one of these conservation programs is the UNDP-GEF-funded project entitled Expanding and Diversifying the National System of Terrestrial Protected Areas in the Philippines Project (New Conservation Areas in the Philippines Project, NewCAPP). NewCAPP aims to expand and strengthen the terrestrial protected area system in the Philippines by developing new conservation models and building capacity for effective management of the system, supported by improved systemic and institutional capacities. It is being implemented in 12 pilot sites across the country including the Mt. Nacolod key biodiversity area (KBA) in Southern Leyte. NewCAPP seeks to establish an inter-LGU alliance to establish Mt. Nacolod as a conservation area under an LGU governance regime based on its biodiversity significance, which has been validated by the biodiversity assessment.
Mt. Nacolod KBA in Southern Leyte is part of the Greater Mindanao biogeographic zone and Eastern Visayas Endemic Bird Area (EBA). In addition, there have been sightings and recordings of the critically endangered Philippine Eagle and other threatened species in this area; hence, studies on their current and projected population density within the area are deemed necessary in order to effectively implement the above-mentioned project.
A biodiversity assessment conducted in the area will further identify and validate the existing data of Mt. Nacolod KBA. Results of the study will also be essential in identifying the kind of

14
management activities and biodiversity monitoring scheme that need to be prioritized for a more sustainable project implementation.
1.3 Objectives and scope Philippine biodiversity is evidently rich, unique and prominent worldwide. Yet, the capacity to conduct biodiversity studies is low, prompting to a critical lack of quantitative information on abundances and association of impacts of environmental changes on them (Mallari et al. 2001).The primary goal of this project is the conservation of the forest and biodiversity in identified areas of Southern Leyte, including the Mt. Nacolod Key Biodiversity Area.The overall objective is to generate practical knowledge and strategic species–habitat information that will be used in drafting management options toward REDD-Plus and biodiversity conservation as a co-benefit by conducting information dissemination and monitoring. This will be achieved by the delivery of the following immediate objectives, particularly:
1. To identify and compare the habitat characteristics of the different habitat types/strata vis-à-vis management zones within the framework of natural variation in vegetation and past land uses, and to determine the influence of human use on the forest overstorey and understorey characteristics of vegetation in Southern Leyte;
2. To identify the natural and anthropogenic factors that influence faunal richness and abundance of floral diversity in the different management zones in Southern Leyte, and to provide a robust species baseline for the design of a conservation area management plan and future monitoring programs;
3. To identify patterns of fauna–habitat associations that will provide guidance for the design and implementation of management interventions for particular species’ survival within Southern Leyte and across their range; and
4. To model the responses of wildlife species and/or communities to different land cover and land uses in Southern Leyte in order to provide guidance to management planners that shall balance the legislated obligations to biodiversity conservation with the principles of equitable access and benefit sharing by all relevant stakeholders in the Philippines and elsewhere.
1.4 Study sites
1.4.1 Biodiversity assessments in Southern Leyte The province of Southern Leyte, which lies in the central part of the Philippine Islands, is part of the Greater Mindanao biogeographic region, as well as the Mindanao and Eastern Visayas Endemic Bird Area (EBA). Several threatened and restricted-range bird species occurring within this EBA, including the critically endangered Philippine Eagle, have been recorded in Southern Leyte and are likely to occur in its remaining forests. One of two key biodiversity areas (KBA) identified in Leyte Island is Mt. Nacolod KBA, partly situated in Southern Leyte Province, which highlights the conservation importance of remaining critical habitats for biodiversity.

15
According to BirdLife International (2001; as shown in Table 1), there is clearly a need for survey work to determine the importance of the remaining forests within the EBA as part of the network of sites required for the conservation of the Philippine Eagle. Surveys are required to investigate whether it supports significant populations of threatened and restricted-range birds and other biodiversity. Table 1 shows a brief list of threatened bird species found in Southern Leyte and present knowledge of their population estimates.
Table 2. List of trigger bird species Species Period Population estimate Philippine Eagle (Pithecophaga jefferyi) 2001 present [units unknown] Mindanao Bleeding-heart (Gallicolumba crinigera) 2001 present [units unknown] Philippine Eagle-owl (Bubo philippensi) 2001 present [units unknown] Philippine Dwarf-kingfisher (Ceyx melanurus) 2001 present [units unknown] Silvery Kingfisher (Alcedo argentata) 2001 present [units unknown] Visayan Broadbill (Eurylaimus samarensis) 2001 present [units unknown] Source: BirdLife International, 2001.
The proposed biodiversity assessments in Southern Leyte were in support of ongoing forest management and conservation initiatives, particularly: 1) the pilot activities on Reducing Emissions from Deforestation and Forest Degradation (REDD+), particularly the “Climate-relevant Modernization of Forest Policy and Piloting of REDD” project implemented by DENR-FMB/GIZ and local partners; and 2) the UNDP-GEF-funded New Conservation Areas of the Philippines Project (NewCAPP) implemented by DENR-PAWB and its local partners .The assessment focused on the following municipalities: for the NewCAPP project – Sogod, Silago and Hinunangan; for the GIZ REDD+ Project – Sogod, Silago, Bontoc, Tomas Oppus and Maasin (note: Sogod and Silago are common areas of both projects).

16
Figure 2. Study site map showing the coverage of Nacolod area, NewCAPP and GIZ REDD-Plus, and the biodiversity assessment areas

17
2. METHODOLOGIES
The baseline study was conducted from November 7 to December 16, 2011 for both fauna and flora species in four localities in Southern Leyte where Mt. Nacolod is also situated (N 10° 27.00’, 125° 5.00’E). Mt. Nacolod is a key biodiversity area (KBA) and declared as forest reserve with total land area of 14,000 hectares. The vegetation is mainly composed of regenerating second to old growth forest and patches of cultivated area in forest edges.
2.1 Habitat surveys and mapping Habitat surveys were conducted using transects routes, established for bird census along the four sites in Southern Leyte. Along each transect route, assessment and classification of habitat for every 50-meter section were done. The conventions used for these broad habitats were classified as follows: old growth forest (OG), advanced second growth (ASG), early second growth (ESG) and cultivated (CVT). The classification of the habitat was based on the dominance of mature trees (OG), the different stages of succession following logging (ASG and ESG) and various degree of cultivation (CVT) (Mallari 2010). Cultivation is defined as areas with active or recently abandoned farmland including grasslands, brushlands, agricultural plots and small orchards with fruit trees less than (≤) 4 meters tall. Early second growth forests are areas of newly regenerating forest (less than [<] 20 years old) dominated by saplings and other small- to medium-sized trees. Advanced second growth forests are 20–40 years old, which have a less dense understorey and are dominated by medium to large trees. Old growth (i.e. primary forest or forest greater than [>] 40 years old) forests are dominated by large to very large trees and have a less complex understorey compared with early second growth and advanced second growth. For the detailed habitat measurements, habitat variables were recorded at each 250-meter section of the transect. This includes the estimated cover of bamboo, presence of rocks, estimated canopy cover (percentage cover), number of trees at mid-storey and understorey as well as presence of groundwater. Selection of the five nearest trees (between 80 and 320 girth breast height [GBH]) were done within a 10-meter radius. The trees selected were identified and measured (tree height in meters, canopy height, diameter at breast height, height of first branch) using a measuring tape for tree size and a clinometer for tree heights. Other variables recorded were evidence of scarring (indicating natural disturbances during early stages of growth), presence of termite mounds, and fruiting and flowering trees. Variable circular plot method was used with radius of 20 meters for measuring the main structure of the forest and reduced to 10 meters for other habitat parameters such as trees with below 30 centimeters DBH. At each sampling point, the following physical and structural habitat variables were sampled:
1. position and altitude using a global positioning system (GPS) receiver; 2. gradient using a clinometer; 3. diameter at breast height (DBH) of the five nearest trees, with each tree then assigned to
a size class (80–160 centimeters GBH or > 160 centimeters GBH) 4. percentage ground cover of leaf litter and herbaceous plants (vegetation less than [<] 1
meter height) in four 1 m x 1 m quadrats positioned randomly in each quarter; and 5. number of rattan clumps and small trees greater than (>) 2 meters tall and with 10–80
centimeters. The habitat sampling results were then merged with the remote sensing data. Sample forest resource assessment (FRA) of DENR/GIZ cluster plots from the Region 8 FRA field team,

18
together with additional plots indicating habitat type from the FFI biodiversity field team, was used to analyze spectral responses from specific features to represent pixels of Dipterocarp forest (old growth trees/forest), coconut, secondary forest (including second growth and reforestation areas), plantations, agriculture or crops, bare soil and built-up area (including houses and roads). There are a total of 24 plots on the three transects of FFI from the biodiversity survey, but unfortunately, only 11 plots were able to be considered as the other 13 are either cloud covered or shadowed. These 11 plots were comprised of old growth forest (karst), early second growth forest, reforestation areas, mahogany plantation and abaca plantation. Samples of other land covers were from the sample FRA plots and other easily identifiable areas in the image (i.e. built-up features).
Figure 2. Maasin Southern Leyte with FFI’s transect from the biodiversity assessment
The requirement to detect heterogeneity in the forest environment at the level to map different habitat types needs a resolution finer than the 50 meters offered by the ALOS PALSAR mosaic as it can be overly generalized. Having the availability of the high-resolution Worldview-2 image allowed us to explore the extraction of other cover types present that may not be readily understandable in coarser resolution image data.

19
Figure 3. Processing flow chart
2.2 Bird surveys Methods used in the study generally followed the variable width transect method (VWTM) (Raman 2003; Watson 2004; Alldredge et al. 2007; Mallari 2009) and variable circular plot method (VCPM) used in a recent survey by Mallari (2009) in Palawan and Marsden and Lee (2008) in Mindoro. Transect routes were surveyed for birds using a combination of transect and point count methods employing the distance sampling method. Each transect sampling effort comprised a minimum of 2 kilometers transect walked beginning at dawn, when bird activity is highest. For the point count method, birds were surveyed at points situated every 250 meters along transects. These combinations of transect and point count were repeated the following day in reverse order to minimize bias (Mallari 2009). Fourteen transect lines from the four study sites were established covering the following six municipalities of Nacolod: Silago, Sogod, Hinunangan, Maasin, Tomas Oppus and Malitbog. There is an accumulated total survey effort of 55 kilometers of transects including the reverse route while spending a total of 154 hours doing the combination of transect and point count for the four study sites in Southern Leyte.
2.3 Mammals Direct observation, ethno-survey and capture techniques such as mist netting and live-trapping were used in determining species occurrence. Indirect evidences of species presence such as feces/scats or foot prints, bite marks, etc., were noted during the survey. Mammals trapping followed the standardized method of Heaney et al. (1999) and Rickart et al. (1993), where the traps and mist nets are set for three nights and three days in each sampling

20
site in a particular area. Traps and mist nets were also set adjacent to birds transects. Eighty percent of the snap traps were set on the ground along gradient within the study plots having 5-10 meters spacing, whereas the 20% were placed on tree branches above 5 meters to catch arboreal species of non-volant mammals. Baits used include roasted coconuts coated with peanut butter and live baits such as earthworms. Live traps were re-set and its bait was changed daily during the afternoon and checked in the morning. Mist nets with a total length of 15-20 meters were set on the ground (80%) and sky nets (20%) were placed near tree canopies. These nets will be employed daily excluding rainy days, to avoid unnecessary animal deaths. The nets shall be closed in the morning to avoid birds but will be opened beginning at dusk (for insectivores) and through the night. Nets were checked and serviced (caught animals were removed and kept for identification and biometrics) every hour until before midnight. Pitfalls were also set on the ground along with live traps to catch for other non-volant mammals.
2.4 Reptiles and amphibians A combination of methods was used to sample reptiles and amphibians, transect and microhabitat samplings. Transect sampling.This method was used to generate information on species assemblages and richness of the study areas. Two types of sampling efforts were executed: sampling in a given (1) habitat type (primary, secondary forest, montane and riverine habitat), and (2) across a gradient of habitat types and elevations (the existing human trails serve as transect lines from the base up to the summit of the mountain). Transects were traversed intensively, thereby recording all individuals on the main path. Microhabitat sampling. Specific microhabitats were searched intensively for any occupying species. Sampling was conducted ranging from 5 to 30 minutes. The microhabitats that were sampled include tree hole, barks, tree buttresses, forest floor, palm, aroid leaf axils, epiphytes, tree ferns, aerial ferns, puddles, and lotic and lentic bodies of water (Diesmos 1998). Sampling methods were conducted during daylight between 0800-1100H and 1300-1600H, and night surveys were conducted between 1800 and 2300H. Frogs, froglets, tadpoles and lizards were collected by hand or with the use of hand nets and dip nets. Snake hooks or sticks were used to capture snakes. Only experienced handlers were allowed to handle snakes. Transect sampling was also established along birds transects, but some transects were set depending on habitat types like riverine and gradient. Established transect lines for herps have a total length of 110 meters with 10 stations. Ground dwelling and arboreal species of reptiles and amphibians were also noted during the survey.
2.5 Data analysis Non-parametric statistics were used to determine the species accumulation and diversity across four habitat types using Estimate S v. 8.20 (Colwell 2009). The species accumulation or Mao Tau (Sobs) was estimated from sample-based refraction. Bird species observed in four localities were pooled per habitat type. For mammals, species recorded in each locality were also pooled. Randomizations of samples were done 999 times without replacement in each data set (birds,

21
mammals and herps species diversity was represented by Shannon Wiener index [H’] (Chao and Shen 2003; Beck and Schwanghart 2010).
To determine the microhabitat associations, a total of 21 species of birds were selected randomly across four localities. The species detection (presence/absence) from 14 transects and nine repeated surveys was used in analysis including the five covariates representing different strata, overstorey (mean tree DBH), understorey (percentage cover of palms, sapling and rattans) and ground (percentage cover of grass). Program PRESENCE v 3.1 was used to generate species occupancy (ψ) and detection probability (p) (Hines 2006). Naive occupancy estimate and proportion area occupied (PAO) were calculated using single-season analysis and one group model. Detection probability (p) was also calculated using single-season analysis with custom model and was ran on different covariates having 28 combinations to obtain also the most parsimonious model through Akaike’s Information Criterion (AIC) value. Measure of accuracy of detection probability estimates was done through boot strapping technique.Fitness of model was assessed using AIC weight (ω).
Fourteen key tree species were selected based on their importance values. The formulas used were a modification of the point-centered quarter method (Cottam and Curtis 1956). For each tree, the basal area (based on the individual girths), the distance from the sampling point and the frequency of each species in the transect lines were used to derive the importance percentages. Calculations were done for each transect line, after which, the top five species per transect were selected. The presence of each species on the top five list was then tallied, and the 14 with the highest frequency values, or importance value scores, were chosen. In order to assess the interplay of habitat and disturbance variables to the key tree species, tree community ordination was done by canonical correspondence analysis (CCA). For the species data sheet, the presence of 14 trees was tabulated against the 13 transects (herein referred to as cases), whereas for the environmental data sheet, the 18 habitat parameters were tabulated against the cases. The results of the analysis were displayed in a biplot that shows the species represented as points and the habitat variables as vectors.
Table 2. Codes used to represent the habitat variables for analysis
CODE VARIABLE MeanAltitude Mean altitude per transect MeanGradient Mean gradient per transect SumTrees320 Sum of trees per transect that amount to more than 320 cm DBH SumTrees160320 Sum of trees per transect that are between 160 to 320 cm DBH SumTrees80160 Sum of trees per transect that are between 80 to 160 cm DBH SumTrees4080 Sum of trees per transect that are between 40 to 80 cm DBH SumTrees2040 Sum of trees per transect that are between 20 to 40 cm DBH SumTrees1020 Sum of trees per transect that are between 10 to 20 cm DBH SumTrees10 Sum of trees less than 10 cm DBH SumPalms Sum of counted palm trees per transect SumRattan Sum of counted rattan palms per transect MeanHerbCov Mean percent coverage of herbs per site MeanBambCov Mean percent coverage of bamboo per site MeanRockCov Mean percent coverage of rock per site MeanCanopyCov Mean canopy coverage per site MeanMidstoreyCov Mean midstorey coverage per site MeanGroundCov Mean percent coverage of litter per site SumFallenTrees Sum of counted fallen tree trunks with more than 160 cm DBH

22
3. RESULTS AND ANALYSIS
3.1 Flora diversity structure and composition A total of 14 transect routes, measuring 2 kilometers each, were establshed in four study sites covering six municipalities (Silago, Hinunangan, Sogod, Maasin, Tomas Oppus and Malitbog) in Southern Leyte. Each transect was located across different types of habitat with 41 points marked with 50 meters distance interval to get the broad habitat types. A detailed habitat assessment was conducted in nine points with 250-meter intervals. In total, there are 126 plots of detailed habitat and 564 broad habitat assessed covering an area of 27.5 kilometers. The proportion of sampling plots using broad habitat classification (Table 3) in the study site shows that ASG has the highest percentage in terms of cover with 41.49% (232 out of 564), followed by OG with 23.76% (136 out of 564), CVT with 17.55% (99 out of 564) and ESG with the lowest percentage cover of 17.20% (97 out of 564).
The result suggests that the forest habitats on the study areas are in an active state of recovery and regeneration with some remnants of pristine habitats. It is believed that this state of recovery may be linked with the ca.3 decades of communist insurgency in Southern Leyte, which may have resulted to the evacuation and out-migration of people from the communities in the forest areas and abandonment of their farmlands, allowing the forest to regenerate and the abandoned farmlands to follow and recolonize.
3.2 Floristic composition of the four sites Floristic richness was well reflected and evident from the number of species found from the study area. A total of 65 families and 229 species of flora were identified, in which 31 (13.53%) were known endemic to the Philippines. Moreover, there was also the presence of threatened species with the following statistics: 20 out of the 229 (8.73%) species were classified as vulnerable species (based from IUCN listing) and 10 out the 229 (4.37%) species were classified as critically endangered (see Table 2). Table 3. Comparison of broad habitat type in every 50-meter distance along the established transect line
AREA Habitat
CVT ESG ASG OG Hinunangan 22 38 61 2 Maasin 58 47 2 11 Silago 11 1 143 50 Sogod 8 11 26 73 Total 99 97 232 136
Note: Silago has five sampling transect, whereas the other three sites have three sampling transects.

23
Table 4. Threatened species discovered in the study areas Family name Scientific name Common name Kinds Extent
(Occurrence) IUCN
Alangiaceae Alangium longiflorum Merr. Apitan Tree VU Anacardiaceae Mangifera altissima Blco. Pahutan Tree VU Anacardiaceae Mangifera monandra Merr. Tree VU Apocynaceae Kibatalia merrilliana Tree Endemic VU Apocynaceae Kibatalia puberula Tree Endemic EN Arauacariaceae Agathis philippinensis Almaciga Tree Endemic VU Cannabaceae Celtic philippinensis Magabuyo Tree Endemic VU Combretaceae Terminalia nitens Presl. Sakèt Tree VU Dilleniaceae Dillenia megalantha Merr. Katmon Tree VU Dilleniaceae Dillenia philippinensis Rolfe Katmon Tree Endemic VU Dipterocarpaceae Dipterocarpus validus (Blume) Hagakhak Tree CR Dipterocarpaceae Hopea acuminata Merrill Manggachapui Tree Endemic CR Dipterocarpaceae Hopea quisumbingiana Gutierrez Quisumbing/Gisok
(Subyang) Tree Endemic CR
Dipterocarpaceae Parashorea malaanonan (Blanco) Bagtikan Tree CR Dipterocarpaceae Shorea almon Almon Tree CR Dipterocarpaceae Shorea astylosa Foxworthy Yakal Tree Endemic CR Dipterocarpaceae Shorea negrosensis Red-lauan Tree Endemic CR Dipterocarpaceae Shorea palosapis syn squamata Mayapis Tree Endemic CR Dipterocarpaceae Shorea/Pentacme contorta White-lauan Tree Endemic CR Dipterocarpaceae Shorea polysperma Tangile Tree Endemic CR Euphorbiaceae Macaranga bicolor Hamindang Small
tree Endemic VU
Euphorbiaceae Macaranga grandifolia (Blcol.) Merr. Takip-asim Tree Endemic VU Fabaceae Afzelia rhomboidea (Blanco) Vidal Tindalo/Balayong Tree VU Fabaceae Pterocarpus indicus Willd. Narra Tree Endemic VU Lauraceae Cinnamomum mercadoi Vid. Kalingag Small
tree VU
Myristicaceae Myristica philippensis Lamarck Duguan Tree Endemic VU Myrtaceae Syzygium aqueum Makupa/Water apple Tree VU Myrtaceae Tristania decorticata Malabayabas Tree VU Sapotaceae Palaquium philippense (Perr.) C. B.
Rob. Nato Tree Endemic VU
Lamiaceae Vitex parviflora Jussieu Molave Tree VU
3.3 Comparison of forest cover among the four sites The corresponding canopy cover of trees would likely indicate the kind of trees dominant in that area. Larger trees in a tropical environment would also have a corresponding large canopy cover; on the other hand, co-dominant, mid-storey and understorey species would have a smaller canopy cover as indicative of early stages of tree growth. The relative forest cover of the four study sites, namely: Sogod, Silago, Hinunangan and Maasin City (covering municipalities of Tomas Oppus and Malitbog), were analyzed by taking the average forest cover of the established plots per transect and per study site. Based from this analysis, results would indicate that from among the four study sites, the forests of Sogod had the highest forest cover followed by Silago, Hinunangan and, lastly, by Maasin City(based from the canopy, mid-storey and understorey values). This trend coincides with the fact that the Maasin City study site, which also covers the municipalities of Tomas Oppus and Malitbog, is an urban area; hence, there is a higher possibility of disturbance and lower vegetation cover.
Previous data from the dominant forest cover coincide with the results from the comparison of habitat types. Assessment of the habitat types was done by counting the frequency of plots where the various habitat types occurred for all the transects established in each site. The general trend is that the four sites were classified as secondary forest (early and advanced growth). This generalization was reflected from the values generated from the mid-storey forest

24
cover percentage that is indicative of a secondary forest and the frequency of plots classified under the ASG and ESG.
3.4 Frequency of species from the various DBH class from the four sites Consistent with the results from the previous analysis (indicating active regeneration), the number of species from each diameter at breast height (DBH) also follows the general trend that most of the species belong to the lower range of DBH class (e.g. >20 <40, >10 <20 and <10 centimeters). The values below were generated from accounting the number of trees that belong to each DBH class. The average for each transect and, ultimately, from each site was also computed. Results show that there were very few number of trees having greater than (>) 320 GBH and greater than (>) 160 less than (<) 320 GBH (from all the sites), meaning most of the areas within the study sites are considered as secondary forests as a larger GBH class is a characteristic of old growth forests. From among the four sites, Silago had the highest number of trees classified under the smaller range of DBH, namely, greater than (>) 40 less than (<) 20 (214 individuals), greater than (>) 10 less than (<) 20 (629 individuals) and less than (<) 10 with 1,711 individuals of trees. Silago is then followed by Maasin, Hinunangan and, lastly, Sogod (see Table 6).
Table 5. Mean of forest strata cover of the four study sites
Sites Forest strata cover (%) Canopy Mid-storey Understorey Silago 42 54.8 47 Hinunangan 33.33 48.67 39.67 Sogod 53.33 55.5 52.67 Maasin 27.67 44.33 38.33
Table 6. Frequency of tree GBH ranges of the four sites Sites Diameter class (cm) >320 >160 <320 >80 <160 >40 <80 >20 <40 >10 <20 <10 Silago 3 16 137 184 214 629 1711 Hinunangan 0 2 56 79 82 166 495 Sogod 3 13 40 53 61 107 314 Maasin 0 8 67 107 147 180 619
Note: Silago has five sampling transects, whereas the other three sites have three sampling transects.
3.5 Habitat mapping Data from the FFI biodiversity team were buffered to a 25-meter radius and overlayed on the orthorectified 2-meter multispectral image. On the zoom window is approximately a 50-meter by 50-meter plot aim to simulate the square plot that the team used in the field to perform the biodiversity assessment. All results in this discussion will account for a descriptive analysis of the visual interpretation of the two classified images just to make a general assessment and recommendation for further statistical analysis. Here is a sample template that we will use as reference for the discussion.

25
(Display#3) Class Colors (Display #4) Class Colors
Built-up (roads and houses)
Built-up (roads and houses)
Coconut
Coconut
Forest
Forest (Old growth)
Bare soil
Second growth (early second growthand reforestation)
Crops
Bare soil
Other vegetation
Crops
Plantation (mahogany and abaca)
Figure 4. Sample template (L-R): (display #1) Band5-3-2 (true color composite); (display #2) Band7-5-2 (false color composite – for vegetation detection); (display #3) Classification result (#classes); (display #4) Classification result (# classes)
3.6 Dipterocarp and old growth Most of the clusters flagged as forest/dipterocarp/old growth are partially cloud covered, which can be demonstrated from the resulting classification images we see in this section, indicated by the blue-colored pixels. On the initial classification shown in display #3, we can see that forest pixels are easily seen because they tend to clump up together, indicating homogeneity. However, when we added additional classes in the training areas such as the secondary forest and the plantation, the area has displayed a more textured environment compared with the initial assessment, although the result still retained forest pixels, especially for T2-2.0 indicative of a “forest class” cover.

26
T2-2.0: Old growth (karst)
Because this was tagged as an old growth forest over a karst environment, we would expect:
T2-3.0: Old growth (karst)
Unfortunately, for this area, it is partially cloud covered. The forest pixels from the initial classified result have been greatly reduced. On this account, the researchers cannot be sure yet if this was because of the actual cover that may not have been old growth or the data were diluted because of the haze from the near presence of the cloud such that most of the pixels were converted to secondary forest class in display #4.
3.7 Secondary growth forest (early secondary growth and reforestation)
It is seen here that initially, these areas were classified under the forest class like in display #3. Later on, during one of the discussions on habitat assessment, the need to further subdivide the forest class into subclasses was brought up and seemed promising for further analysis in future studies that can go hand in hand in developing a forest land cover map for monitoring.

27
T2-1.0: Early secondary growth
T2-8.0: Early secondary growth
T3-1.0: Early secondary growth
T3-4.0: Early second growth

28
T3-7.0: Early second growth
T3-5.0: Reforestation
T3-6.0: Reforestation
From the comparisons of displays #3 and #4, we can observe that the forest class has been broken down to three subclasses, namely, secondary forest class, plantation class and coconut class. However, the reforestation area is rather not readily separable from the secondary forest class. This may come from the understanding that reforested areas likely transition to a secondary forest in about 3-5 years with trees having comparable species present, which is why when spectral signatures are extracted, it can be seen that it becomes very similar and, therefore, hard to separate. It was also unfortunate that there is no plot representative of an advanced second growth forest in which it could have also compared with respect to the other forest subclasses.

29
Figure 5. Spectral responses from the early second growth, reforestation, mahogany plantation (radiance vs bands)
3.8 Plantation (mahogany/abaca) Initially, both mahogany and abaca were separate classifications, but in the class color assignment, color coding was used to make the identification of plantation areas more generalized. In the classification of results, it can be seen that the areas are a mixture of plantation, secondary forest, coconuts and crops.
T3-3.0: Mahogany plantation
T2-6.0: Abaca plantation
0
2000
4000
6000
8000
10000
12000
14000
0 2 4 6 8
Old growth
Early second growth
Reforestation
Mahogany Plantation
Abaca Plantation
Coconut
Houses
Roads
Bare soil

30
3.9 Key tree species In identifying key tree species (Table 7),the importance values of each tree in a transect was computed to determine the top five most important trees. With the identified top five tree species per transect, the top 14 tree species from all of the transects were identified. Table 7. Key tree species in a Southern Leyte Dipterocarp forest based on importance values Species name Common or local
name Family Importance value
score (out of 13 transects)
Code used for ordination
Shorea negrosensis
Red lauan Dipterocarpaceae 10 SNGR
Calophyllum blancoi
Bitangol; bitaog Calophyllaceae 7 CBNC
Shorea contorta White lauan Dipterocarpaceae 5 SCTR
Syzygium calubcob Kalubkob Myrtaceae 4 SYCB
Artocarpus ovatus Anubing; hindang Moraceae 4 AOVT
Ficus balete Balete Moraceae 3 FBLT
Shorea seminis Dipterocarpaceae 3 SSMN
Hopea quisumbingiana
Dipterocarpaceae 2 HQSB
Syzygium hutchinsonii
Malatambis Myrtaceae 2 SYHT
Swietenia microphylla
Mahogany Meliaceae 2 SWMR
Lithocarpus ovalis Ulayan; uwayan Fagaceae 1 LTOV
Myristica philippensis
Duguan Myristicaceae 1 MYPH
Oroxylum indicum Bignoniaceae 1 OXID
Erythrina subumbrans
Rarang; December tree
Fabaceae 1 ERSB
Note: Importance value is an overall estimate of the influence of importance of a plant or a tree species in a community.
Species code for ordination: The general format used for processing the data gathered under ordination analysis was taken from the first letter of the genus and first three letters of the specific epithet of the tree species (e.g. Shorea negrosensis, the code was SNEG).
The Dipterocarpaceae members Shorea negrosensis, S. contorta, S. seminis and Hopea quisumbingiana are familiar lowland Dipterocarp species, with known occurrences in Samar and Leyte (Margraf and Milan 1996; Pelser et al. 2011). From the study sites, Shorea negrosensis

31
and Shorea contorta were commonly found in advanced secondary growth forest and old growth forests. Syzygium calubcob and S. hutchinsonii of the Myrtaceae family are also lowland forest inhabitants (Pelser et al. 2011) together with Calophyllum blancoi of Calophyllaceae, Myristica philippensis of Myristicaceae and Lithocarpus ovalis of Fagaceae (Schade et al. 1987). Artocarpus ovatus and Ficus balete of the Moraceae family were also found to be common in the lowland Dipterocarp forests (LaFrankie 2010). The presence of these tree species was also evident in the early and advanced secondary growth forest.
Erythrina subumbrans of the Fabaceae family belongs to a genus of fast-growing species that are usually found on secondary forests (LaFrankie 2010). Oroxylum indicum of Bignoniaceae is known to be a short-lived, nomadic tree that is not found in mature forests but always in gaps and in secondary thickets. Nonetheless it is still a lowland forest inhabitant found in the Philippine islands (Pelser et al. 2011). Swietenia macrophylla is not a native of the Philippines but introduced during the Commonwealth era. It is still being planted in the country as a reforestation species because of its fast growth and high threshold value (LaFrankie 2010).
Among the species found in the survey are four Dipterocarpaceae members that are critically endangered based on the IUCN Red List (2012). These species are Hopea quisumbingiana, Shorea negrosensis, Shorea seminis and Shorea contorta. Moreover, two of the species are classified by IUCN as vulnerable: Myristica philippensis of Myristicaceae and Swietenia macrophylla of Meliaceae.
3.10 Vegetative history The plant families of the observed important species in the areas surveyed are comprised of Dipterocarpaceae, Moraceae, Myrtaceae, Fagaceae, Bignoniaceae, Meliaceae, Myristicaceae, Calophyllaceae and Fabaceae, with Dipterocarpaceae having the most members at 4 out of 14. Both Moraceae and Myrtaceae have two species each, whereas the rest have one entry. Based on a previous vegetative analysis done by Schade et al. (1987), as presented in Margraf and Milan (1996), Dipterocarpaceae is the most frequent plant family on the islands of Samar and Leyte, followed by Myrtaceae and Fagaceae. This is in coherence with the data we obtained, implying the continuing ecological relevance of these families in the area.
The Schade et al. (1987) study also enumerated the most frequent tree species in the old growth forests of Samar and Leyte. Shorea negrosensis ranked second on their list, whereas on our survey, it ranked first. It strongly suggests the sustained ecological importance of this species for the region. Other species similar to both lists is Calophyllum blancoi, which ranked 14th, Lithocarpus ovalis, which ranked 10th, and Myristica philippensis, which ranked 12th on the Schade et al. list. In our survey, these species ranked 2nd, 11th and 12th, respectively.
3.11 Fauna A total of 212 species of terrestrial vertebrates were recorded during the survey. Birds constitute half of the found fauna in Southern Leyte with 112 species; the rest are herpetofauna with 64 species and mammals with a total of 36 species, of which 17 are endemic to Philippines.

32
3.11.1 Birds A total of 112 species of birds belonging to 42 families were recorded based from transect walk, mist netting and general observation on the four study sites in Southern Leyte. Fifty-five of these 112 species are endemics, of which 41 are endemic to the Philippines and 14 are endemic to the Visayas and Greater Mindanao faunal region. Among the 41 species, 11 are in the IUCN threatened category list: the Pink-bellied Imperial Pigeon (Ducula poliocephala), Philippine Needletail (Mearnsia picina), Rufous Hornbill (Buceros hydrocorax), Pygmy Babbler (Stachyris plateni) and Yellow-breasted Tailorbird (Orthotomus samarensis) (found only in Bohol, Samar and Leyte) are listed as near-threatened (NT); the Silvery Kingfisher (Alcedo argentata), Philippine Dwarf-Kingfisher (Ceyx melanurus), Rufous-lored Kingfisher (Todirhamphus winchelli), Visayan Wattled Broadbill (Eurylaimus samarensis) and Steere’s Pitta (Pitta steerii) are listed as Vulnerable (VU); and the Tarictic Hornbill (Penelopides panini) is listed as Endangered (EN). Two species, Brown Tit-Babbler (Macronous striaticep) and Miniature Tit-Babbler (Micromacronus leytensis), are both endemic to the Greater Mindanao faunal region and in the Data Deficient (DD) list. Twenty-four bird species (see Table 8) were selected from the 102 species (see Annex 2) recorded in the transect survey. These 24 focal species were selected because they include: (1) lowland forest specialists, which also represent other species that are dependent on this type of forest; (2) understorey species, believed to be sensitive to changes in habitat quality; (3) restricted-range species or endemics, which are deemed by virtue of their small ranges to be more prone to extinction; and (4) globally threatened and near-threatened species. Detection of birds from the two visits to the transect point was pooled to calculate encounter rates (expressed as individuals per point transect + standard error). Table 8. Residency, endemism, migratory, conservation status and habitat preferences of 24 species across the sites
Species Ranges Conservation status
Principal habitat (Kennedy et al. 2000)
Alcedo argentata E VU Lowland forest,along creek or river Bolbopsittacus lunulatus E LC Lowland forest, forest and forest edge Buceros hydrocorax E NT Lowland forest, forest Centropus melanops E LC Lowland forest, forest, mid-storey Centropus viridis E LC Wide ranges, understorey Dicrurus hottentottus R LC Below 1,500 masl Ducula poliocephala E NT Below 1,500 masl Gallus gallus R LC Lowland forest up to 2000 masl,
ground Harpactes ardens E LC Lowland, forest and second growth,
mid-storey Irena cyanogaster E LC Below 1,500 masl, canopy, mid-storey Ixos everetti E LC Below 1,000 masl, forest edge Ixos philippinus E LC below 2,000 masl, all types of forest Loriculus philippensis E LC Lowland up to montane, all forest
types Macronous striaticeps E LC Below 1,500 masl, understorey Pachycephala philippinensis
E LC All forest level, understorey and mid-storey
Parus elegans E LC All forest level, canopy Penelopides panini E EN Forest and forest edge, up to 1,500
masl Pernis ptilorhynchus M Near forest below 1,500 masl Phapitreron amethystina E LC Forest and forest edge, up to 2,000
masl Phapitreron leucotis E LC Early second growth to montane up to

33
Species Ranges Conservation status
Principal habitat (Kennedy et al. 2000) 1,600
Prioniturus discurus E VU Forest and forest edge near cultivation up to 1,500
Ptilinopus occipitalis E LC Forest and forest edge, middle and upper canopy
Ptilocichla mindanensis E LC Lowland and mid-montane up to 1,400, near on ground
Todiramphus winchelli E VU Forest and forest edge, perch on canopy also come to ground
IUCN: EN = endangered, VU = vulnerable, NT = near threatened, LC = least concern.
3.11.1a Birds species accumulation and diversity A total of 101 species of birds were recorded on the transect surveys. Based on the survey, there were species observed across different habitat types and localities. However, through the Mao Tau species accumulation curve analysis, a maximum of five species may have been overlooked during the survey as indicated by the maximum standard error, which is 5 (see Table 9; standard deviations of observed species richness).The species that were overlooked may be attributed to the inclemental weather experienced during the survey. From a sampling effort of 143 points across all habitat types, the advanced second growth in Silago had the highest number of species observed (56), followed by the early second growth in Maasin (51). The least number of species recorded were in early second growth (2) and old growth (8) forests in Silago and Hinunangan, respectively (see Table 9). The possible reason for this observation pattern in Southern Leyte may be due to the disproportionality of available old growth forests with early and second growth forests. Species diversity (H’) across all habitat types follows the pattern of species observation in all localities. In general, highest diversity values were in early and advanced second growth except for Silago. This may be an artifact of sampling (only 1 point falling in ESG). Cultivated areas in Hinunangan and Maasin also showed high values of diversity index as well as in old growth forests in Silago and Sogod. Lowest diversity was obtained on the early second and old growth forests in Silago and Hinunangan. Overall, advanced second growth in Silago has the highest diversity value (H’ = 3.58), which may be attributed to the sampling effort on ASG in Silago.
The effort of the sampling was measured through species accumulation curve per transect in all study sites (see Figure 6). The Silago area has five transects where the curve is about to approach the asymptote. In the Hinunangan area, the curve did not reach the desired curve and was similar to the Maasin area. The Sogod area has increasing proportion when transect 3 was incorporated, which is when the transect was positioned toward high elevation; thus, the sample has increasing species accumulation as shown in Figure 6.

34
Table 9. Bird community measures of species accumulation (Mao Tau) and diversity (H’) in four habitat types across four localities in Southern Leyte. Shown also are the corresponding total number of points of sampling effort in each habitat type.
Habitat Survey efforts (number of points)
Species observed (Mao Tau) ± SD Species diversity (H')
Silago CVT 11 17 ± 4 2.59 Silago ESG 1 2 ± 0 0.69 Silago ASG 143 56 ± 5 3.58 Silago OG 50 36 ± 5 3.15 Hinunangan CVT 22 27 ± 4 3.06 Hinunangan ESG 38 36 ± 4 3.31 Hinunangan ASG 61 36 ± 5 3.22 Hinunangan OG 2 8 ± 3 1.98 Sogod CVT 8 11 ± 3 2.37 Sogod ESG 11 14 ± 4 2.58 Sogod ASG 26 24 ± 5 2.83 Sogod OG 73 41 ± 5 3.38 Maasin CVT 58 41 ± 5 3.31 Maasin ESG 47 51 ± 5 3.27 Maasin ASG 2 11 ± 3 2.35 Maasin OGF 11 23 ± 4 2.9
CVT = cultivated; ESG = early second growth; ASG = advanced second growth; OGF = old growth forest).
Figure 6. Species accumulation curve per site sampling. Solid line = Silago site, Round dot = Hinunangan site, Square dot = Sogod site and Dash = Maasin site.
3.11.2 Mammals A total of 36 species of mammals belonging to 15 families were recorded on the four sampled localities (Silago, Hinunangan, Sogod and Maasin), of which 13 species are non-volant
0 10 20 30 40 50 60 70
0 1 2 3 4 5
Num
ber
of S
peci
es
Number of Transects
0 10 20 30 40 50 60
0 1 2 3
Num
ber
of S
peci
es
Number of Transects
0
20
40
60
0 1 2 3
Num
ber
of S
peci
es
Number of Transects
0
20
40
60
80
0 1 2 3
Num
ber
of S
peci
es
Number of Transects

35
mammals (Crocidura beatus, Tarsiussyrichta, Macaca fascicularis, Exilisciurus concinnus, Sundasciurus samarensis, Apomys sp., Batomys salomonseni, Bullimus bagobus, Rattu severetti, Rattus tanezumi, Paradoxurus hermaphrodites, Vivera tangalunga, Susbarbatus mindanensis) and 22 are volant (Myotis muricola, Cynocephalus volans, Acerodon jubatus, Cynopterus brachyotis, Eonycteris spelaea, Haplonycteris fischeri, Harpyionycteris whiteheadi, Macroglossus minimus, Megaerops wetmorei, Ptenochirus jagori, Ptenochirus minor, Pteropus hypomelanus, Pteropus vampyrus, Rousettus amplexicaudatus, Emballonura alecto, Megaderma spasma, Hipposideros ater, Hipposideros bicolor, Rhinolophus arcuatus, Rhinolophus inops, Rhinolophus philippinensis, Rhinolophus subrufus). Of the total species of mammals recorded, 17 species (47%) are Philippine endemics, of which eight are restricted only to the Mindanao faunal region, i.e. the Philippine pygmy squirrel (Exilisciurus concinnus); Mindanao batomys (Batomys salomonseni); Mindanao ballimus (Bullimus bagobus); Samar squirrel (Sundasciurus samarensis), which is restricted only in the Samar and Leyte Islands, and the unidentified Apomys sp. The other volant mammals recorded were the Philippine flying lemur (Cynocephalus volans) and Lesser musky fruit bat (Ptenochirus minor). Table 10. Identified species of mammals from the four study sites
Family name Scientific name Common name Extent IUCN status
Crocidura beatus Mindanao Shrew
LC
Tarsiidae Tarsius syrichta Philippine Tarsier Endemic NT Cercopithecidae Macaca fascicularis Crab-eating Macaque
LC
Sciuridae Exilisciurus concinnus Philippine Pygmy Squirrel Endemic LC Sciuridae Sundasciurus samarensis Samar Squirrel Endemic LC
Apomys sp.
Muridae Batomys salomonseni Mindanao Batomys Endemic LC Muridae Bullimus bagobus Mindanao Bullimus Endemic LC Muridae Rattus everetti Philippine Forest Rat Endemic LC Muridae Rattus tanezum
Paradoxurus hermaphroditus
Vivera tangalunga
Susbarbatus mindanensis Vespertilionidae Myotis muricola Nepalese Whiskered Myotis
LC
Cynocephalidae Cynocephalus volans Philippine Flying Lemur Endemic LC Pteropodidae Acerodon jubatus Golden-capped Fruit Bat Endemic EN Pteropodidae Cynopterus brachyotis Lesser Dog-faced Fruit Bat
LC
Pteropodidae Eonycteris spelaea Dawn Bat
LC Pteropodidae Haplonycteris fischeri Philippine Pygmy Fruit Bat Endemic LC Pteropodidae Harpyionycteris whiteheadi Harpy Fruit Bat Endemic LC
Pteropodidae Macroglossus minimus Dagger-toothed Long-nosed Fruit Bat
LC
Pteropodidae Megaerops wetmorei White-collared Fruit Bat
VU Pteropodidae Ptenochirus jagori Greater Musky Fruit Ba Endemic LC Pteropodidae Ptenochirus minor Lesser Musky Fruit Bat Endemic LC Pteropodidae Pteropus hypomelanus Island Flying Fox
LC
Pteropodidae Pteropus vampyrus Large Flying-fox
NT Pteropodidae Rousettus amplexicaudatus Geoffroy's Rousette
LC
Emballonuridae Emballonura alecto Small Asian Sheath-tailed Bat
LC Megadermatidae Megaderma spasma Lesser False Vampire
LC
Hipposideridae Hipposideros ater Dusky Leaf-nosed Bat
LC Hipposideridae Hipposideros bicolor Bicolored Leaf-nosed Bat
LC
Rhinolophidae Rhinolophus arcuatus Arcuate Horseshoe Bat
LC

36
Rhinolophidae Rhinolophus inops Philippine Forest Horseshoe Bat
LC Rhinolophidae Rhinolophus philippinensis Large-eared Horseshoe Bat
LC
Rhinolophidae Rhinolophus subrufus Small Rufous Horseshoe Bat Endemic DD IUCN status categories: EX (extinct), EW (extinct in the wild), CR (critically endangered), EN (endangered), VU (vulnerable), NR (near threatened), LC (least concern), DD (data deficient) and NE (not evaluated). Based on the IUCN 2011 Red List of threatened species, the Golden-capped fruit bat (Acerodon jubatu), an endemic species in the Philippines, is listed as endangered (EN), of which two individuals were recorded in the survey site in Sogod. Another species, Sus barbatus mindanensis, is listed as vulnerable (VU) due to the decreasing population trend. Some species are listed as near threatened, such as the Large flying fox (Pteropus vampyrus), Philippine forest horshoe bat (Rhinolophus inop) and the Philippine tarsier (Tarsius syrichta), which are all endemic in the Philippines.
Of the total 218 individuals recorded on the four study areas, 63 individuals (29%) were recorded in the Sogod area and 59 (27%) were recorded from Hinunangan. The Philippine forest rat (Rattus everetti) has the highest number of individuals recorded for the non-volant mammals and the Lesser musky fruit bat (Ptenochirus minor) for volant mammals. The presence of other mammals like the Common palm civet was also observed during the study. Paradoxurus hermaphrodites and the Sus barbatus mindanensis, a sub-species of the Philippine warty pig restricted in the Mindanao faunal region, were also observed. There are two notable species of primates that were also recorded during the survey, the Crab-eating macaque (Macaca fascicularis) and Philippine tarsier (Tarsius syrichta).
The population of non-volant mammals is mainly dominated by the Muridae family (Apomys sp., Botomys salomonseni, Bullimus bagobus, Rattus everetti, R. tanezumi), whereas the volant mammals are dominated by Pteropodidae species (Acerodon jubatus, Cynopterus brachyotis, Econycteris spelea, Haplonycteris fischeri, etc.).
3.11.2a Mammal species accumulation and diversity Across four localities, 2,953 traps and 199 nets have yielded eight species of small non-volant mammals and 22 species of volant mammals, respectively (see Table 11). There were three non-volant species belonging to three families (Paradoxurus hermaphrodites, Vivera tangalunga, Sus barbatus mindanensis) that were observed and not captured. Tarsius syrichta in Silago was captured by net and by hand in Hinunangan, whereas bones of Macaca fascicularis were obtained from abandoned local traps in Silago and Sogod. Species variability of non-volant mammals across sites was not significant. The sufficiency of sampling established with this survey as asymptotes was reached across the sampling regimes (Figure 7). The results suggest that a maximum of two species may have been missed during the survey. The species accumulation (Mao Tau) indicates that highest observation of non-volant mammals is high in Sogod (5 ± 1.37) and least in Silago and Maasin. Species diversity of captured mammals follows the pattern of species observations in localities. For non-volant, diversity values was high in Sogod with five species recorded, and the lowest diversity was in Silago with only nine individuals captured belonging to three species (Apomys sp., R. everetti and C. beatus). It is also interesting to note that Sogod has the highest elevation (957 meters) among the three localities. It only indicates that diversity of small mammals occurs in high elevations. Volant mammals’ diversity was high in Maasin (H’ = 2.29) and lowest in

37
Silago (H’ = 1.52). The high diversity of volant mammals in Maasin might be attributed to numerous caves recorded in the survey sites where bats usually roost.
Table11. Mammals’ community measures of species accumulation and diversity
Locality Survey effort (number of traps)
Species observed (Mau Tau) ± standard error
Species diversity (Shannon H' mean)
Non-volant mammals Hinunangan 599 4 ± 1 1.26 Maasin 252 3 ± 1 0.99 Silago 923 3 ± 1 0.96 Sogod 1179 5 ± 1. 3.16 Volant mammals Hinunangan 35 10 ± 2 1.73 Maasin 30 12 ± 2 2.29 Silago 57 10 ± 2 1.52 Sogod 80 11 ± 2 2.12 Shown also are the corresponding number of traps or survey efforts undertaken.
Figure 7. Species accumulation curve of non-volant and volant mammals across all survey sites in Southern Leyte
3.11.3 Amphibians and reptiles Although biological expeditions have been conducted in Leyte since the 1800s, very few have centered on the amphibians and reptiles of the island. The most recent and extensive herpetofaunal study was conducted by researchers from the Visayan State College of Agriculture in collaboration with European institutions during the 1980s to early 1990s. Except for a few rapid assessment studies, virtually, there are no herpetofaunal studies that have ever been undertaken.

38
The mountain ranges of Nacolod and Cabalian in Southern Leyte Province are among the last forested areas on the island. These areas are also among the least studied in terms of biodiversity. The forests of Southern Leyte Province are home to at least 90 species of amphibians and reptiles or about 25% of the total species known in the Philippines. Of the 90 species, over 50% are found only in the Philippines and at least four species are restricted to this region. Herpetologists believe that more new species of amphibians and reptiles will be discovered in the forests of Leyte after intensive and extensive field studies have been conducted on the area.
Meanwhile, the result of the biodiversity assessment conducted in the area shows that there are a total of 69 species of terrestrial amphibians and reptiles recorded across the four localities. Of these 69 species, 25 species are frogs belonging to seven families, 23 species of lizards belonging to five families, 20 species of snakes and one species of turtle.
Table 12. Herpetofaunal composition found in the four study sites
Family name Scientific name Common name Kinds Extent IUCN status
Bufonidae Pelophryni lighti
Frogs Endemic VU
Ceratobatrachidae Platymantis bayani
Frogs Ceratobatrachidae Platymantis corrugatus
Frogs Endemic LC
Ceratobatrachidae Platymantis guentheri
Frogs Endemic VU
Ceratobatrachidae Platymantis rabori
Frogs Endemic VU
Platymantis sp.
Frogs
Platymantis sp.
Frogs
Dicroglossidae Limnonectes leytensis Small Disked Frog Frogs Endemic LC
Dicroglossidae Limnonectes magnus Giant Philippine Frog Frogs
NT
Dicroglossidae Occidozyga laevis Yellow Bellied Puddle Frog Frogs
LC
Dicroglossidae Fejervarya cancrivora Asian Brackish Frog Frogs
LC
Dicroglossidae Fejervarya vittigera
Frogs Endemic LC
Megophryidae Megophrys stejnegeri Southeast Asian Horned Toad Frogs Endemic VU
Microhylidae Kalophrynus pleurostigma
Frogs
LC
Kaloula sp.
Frogs
Ranidae Hylarana grandocula
Frogs Endemic LC
Ranidae Sanguirana albotuberculata
Frogs Ranidae Staurois natator
Frogs
LC
Rhacophoridae Nyctixalus spinosus
Frogs Endemic VU
Rhacophoridae Philautus leitensis
Frogs Endemic VU
Rhacophoridae Polypedates leucomystax White-lipped Tree Frog Frogs
LC
Rhacophoridae Rhacophorus appendiculatus Southeast Asian Tree Frog Frogs
LC
Rhacophoridae Rhacophorus bimaculatus
Frogs Endemic VU
Rhacophoridae Rhacophorus pardalis
Frogs
LC
Bronchocoela cristatella Green Crested Lizard Lizard
Agamidae Draco cyanopterus
Lizard Endemic LC
Agamidae Draco mindanensis
Lizard Endemic VU
Agamidae Gonocephalus semperi Mindoro Forest Dragon Lizard Endemic DD
Agamidae Hydrosaurus pustulatus Soa-soa Water Lizard Lizard Endemic VU
Cyrtodactylus gubaot
Lizard Endemic

39
Gekkonidae Hemidactylus frenatus Common House Gecko Lizard
LC
Gekkonidae Pseudogekko compressicorpus Cylindrical-bodied Smooth-scaled Gecko Lizard Endemic LC
Brachymeles orientalis Southern Burrowing Skink Lizard
Brachymeles paeforum PAEF Slender Skink Lizard Endemic
Brachymeles cf. talinis
Lizard
Brachymeles sp.
Lizard
Eutropis multicarinata multicarinata
Lizard
Otosaurus cumingii
Lizard
Parvoscincus steerei
Lizard
Pinoyscincus coxi coxi Cox's Sphenomorphus Lizard
Pinoyscincus jagori Agor's Sphenomorphus Lizard
Pinoyscincus mindanensis Mindanao Sphenomorphus Lizard
Scincidae Sphenomorphus acutus Pointed-headed
Sphenomorphus Lizard Endemic LC
Scincidae Sphenomorphus fasciatus Banded Sphenomorphus Lizard Endemic LC
Scincidae Sphenomorphus variegatus
Lizard Varanidae Varanus cumingi
Lizard Endemic LC
Python reticulatus
Snakes
Ahaetulla prasina preocularis
Snakes
Pareatidae Aplopeltura boa Blunthead Slug Snake Snakes
LC
Boiga cynodon Dog-toothed Cat Snake Snakes
LC
Calamariidae Calamaria lumbricoidea Variable Reed Snake Snakes
LC
Coelognathus erythrura
Snakes
Cyclocorus nuchalis taylori
Snakes
Dendrelaphis caudolineatus
Snakes
Lycodon aulicus
Snakes
Lycodon ferroni
Snakes
DD
Colubridae Oligodon modestum Spotted-bellied Short-headed Snake Snakes Endemic VU
Oxyrhabdium modestum
Snakes
Lamprophiidae Psammodynastes pulverulentus
Snakes
Rhabdophis auriculata auriculata
Snakes
Natricidae Tropidonophis dendrophiops Spotted Water Snake Snakes Endemic LC
Natricidae Tropidonophis negrosensis
Snakes Endemic VU
Elapidae Naja samarensis Samar Cobra Snakes Endemic LC
Typhlops sp.
Snakes
Viperidae Trimeresurus flavomaculatus Philippine Pit Viper Snakes Endemic LC
Tropidolaemus wagleri Wagler's Keeled Green Pit Viper Snakes
LC
Geoemydidae Cuora amboinensis Southeast Asian Box Turtle Turtle
VU
The population of frog species across the four localities is mainly dominated by families of Ceratobatrachidae and Rhacophoridae. For lizards and snakes species, it is dominated by Scinicidae and Colubridae, respectively. There are two recorded species of lizards that were known to be endemic on the island: the Cyrtodactylus gubaot and Brachymeles paeforum. There are also at least five species with new distribution records on Leyte (3 Platymantis sp., 1

40
Kaloula sp. and 1 Brachymeles sp.) and at least three new species of frogs and lizards (2 Platymantis and 1 Brachymeles) that were discovered on the recent surveys.
3.11.3a Reptiles and amphibians species accumulation and diversity To obtain the diversity results and to compare the diversity of the four sites, a non-parametric statistical analysis such as the Mau Tao and Shannon (H’) was used (see Table 13). The results show that the Sogod area is the most diverse among the other areas, which obtained a value of 41 ± 3.84 species observed (H’ = 3.27), followed by Silago with 30 ± 3.99 species (H’ = 3.0), Hinunangan with 23 ± 3.84 species and Maasin with the lowest among the four areas with 17 ± 3.53. The results of the diversity of the species were also affected by the sampling effort per site (as shown Table 13), where Maasin was considered as undersampled compared with the rest. However, the maximum number of species (± 3.5) suggests that the survey may have only missed four species.Therefore, this low species richness in Maasin is not only brought about by the low sampling effort but also by the available habitats where transect lines were positioned. It was noted that Maasin had more degraded habitats than the rest of the four sites. This is consistent with the findings in other sites in the Philippines where species richness and faunal abundance declined in the forest fragments (Diesmos 2008). Hence, the expansion of the area such as elevational gradient also changes the area’s diversity. Silago had the most number of sampling effort, but its elevational expansion is lower than 750 meters above sea level compared with the Sogod area, which has a 950 meters above sea level area characterized by good forest above.
Table 13. Herpetofauna community measures of species accumulation (Mao Tau) and diversity (H’) across the four localities in Southern Leyte
Survey area Survey effort (Number of transects)
Species observed (Mau Tao) ± standard deviation
Shannon species diversity H'
Maasin 3 17 ± 3.5 2.74 Hinunangan 11 23 ± 3.8 2.87 Silago 19 30 ± 3.9 3 Sogod 10 41 ± 3.8 3.27
Shown also are the corresponding number of transects.
3.11.4 Faunal–habitat association
3.11.4a Birds: Broad habitat association Habitat association based on Table 14 indicate that four species of birds are found to have a narrow niche width or special habitat requirement. For example, the Silvery Kingfisher, commonly found on rocks and along banks of forest streams, was recorded only on an advanced second growth (ASG), the Oriental Honey Buzzard was found only in cultivated area (CVT), the Red Jungle fowl was found in advanced second growth (ASG) and the Amethyst Brown-Dove was seen only in old growth (OG). But in the case of the Red Jungle fowl, which is known to be found in almost all types of habitat – from forest edge, early second growth to old growth (OG) – it was only recorded in advanced second growth (ASG) forest. This may be due to hunting pressure from forest edge to early second growth (ESG) as evinced by the snare traps that the team has found.

41
There are also 10 species that have broad habitat requirements and can adapt to a broad range of habitat types such as the Rufous Hornbill – usually found only in forest areas – which was also recorded in a cultivated area (CVT). This suggests a great deal of fragmentation of forest habitats in Southern Leyte. The Philippine Coucal is known to inhabit a variety of habitats from grassland to forest. The rest of the species: Hair-crested Drongo, Pink-bellied Imperial Pigeon, Yellowish Bulbul, Philippine Bulbul, Brown-tit Babbler, Elegant Tit, Visayan Tarictic, White-eared Brown Dove and Streaked Ground-Babbler, were also found to have a broad habitat range because they were observed in the four habitat types as the Rufous Hornbill.
Table 14. Bird–habitat association Species CVT ESG ASG OG Silvery Kingfisher X Guaiabero X X X Rufous Hornbill X X X X Black-faced Coucal X X X Philippine Coucal X X X X Hair-crested Drongo X X X X Pink-bellied Imperial Pigeon
X X X X
Red-Jungle fowl X Rufous-lored Kingfisher X X Philippine Trogon X X X Philippine Fairy-Bluebird
X X X
Yellowish Bulbul X X X X Philippine Bulbul X X X X Colasisi X X X Brown Tit Babbler X X X X Elegant Tit X X X X Yellow-bellied Whistler X X Visayan Tarictic X X X X Oriental Honey Buzzard
X
Amethyst Brown-Dove X White-eared Brown-Dove
X X X X
Blue-crowned Racquet-tail
X X X
Yellow-breasted Fruit-Dove
X X
Streaked Ground-Babbler
X X X X
3.11.4b Mammal: Broad habitat association As shown on Table 15, three mammal species have narrow habitat preferences (C. volans, B. cf. salomonseni, R. tanezumi). C. volans was found only in ASG, whereas Batomys cf. salomonseni was present only in old growth forest and was only captured at elevation above 900 masl. Rattus tanezumi, a species known as commensal or invasive, has been widely introduced throughout the Philippines (Heaney and Regalado 1998; Musser and Carleton 2005;

42
Larry Heaney pers. comm.) and was found encroaching in early ESG. Four species (Crocidura sp., Macaca fascicularis, Sundasciurus sp. and Apomys sp.) occupied both advanced second growth and old growth forests. These species preferred a much pristine habitat. M. fascicularis was observed to be moving farther to the forest, which might indicate hunting pressure on the area. There are also two species (Bullimus bagobus and Rattus everetti) that occupied and can tolerate all forest types. Table 15. The broad habitat and presence (marked by “X”) of the non-volant mammals
Species ESG ASG OG Crocidura beatus x x Cynocephalus volans x Macaca fascicularis x x Sundasciurus samarensis x x Apomys sp. x x Batomys salomonseni x Bullimus bagobus x x x Rattus everetti x x x Rattus tanezumi x
3.12 Ordination: Species–habitat modelling 3.12.1 Plant community ordination The canonical correspondence analyses (CCAs) of the tree surveys at 18 habitat parameters in 13 cases produced two canonical axes. The first canonical axis (eigenvalue = 0.777) accounts for 1.00 species–environment correlation, with a cumulative constrained percentage of 33.558%. This vertical axis, as shown in Figure 8, appears to be an axis of biomass. Variables found on the left-hand side, including all tree counts and forest cover vectors, indicate forests with increasing biomass values. Those on the right-hand side comprise vectors of increasing bamboo and herb coverage, and are thus consistent with the scenario of a low-biomass forest.

43
Figure 8. Canonical correspondence analysis (CCA) biplot of 18 habitat parameters on the two canonical axes using Multivariate Statistical Package
The second canonical axis (eigenvalue = 0.421) accounts for 1.00 species–environment correlation, with a cumulative constrained percentage of 51.768%. It appears to be an axis of increasing disturbance, evidenced by vectors on the lower portion that describe variables of increasing canopy and mid-storey covers. Higher tree counts are also found here. These are consistent with forests of higher quality.
On the other hand, vectors of increasing understorey, ground and bamboo coverage, as well as higher incidences of observed fallen trees, are seen on the upper portion of the second axis. These appear to be indications of greater disturbance and therefore lesser quality of the forest.
In addition to this, the position of the vector for mean altitude implies that as one moves up the elevation grid, the forest seems to be thinner. The vector for gradient suggests increased biomass in steeper areas. Both vectors do not lie far from the disturbance axis, which may indicate a balance in forest quality.
C C A variable sco resA
xis
2
Axis 1
-1.3
-2.5
-3.8
-5.0
1.3
2.5
3.8
5.0
6.3
-1.3-2.5-3.8-5.0 1.3 2.5 3.8 5.0 6.3MEANALTITUDE
MEANGRADIENT
SUMTREES4080SUMTREES2040
SUMTREES1020SUMTREES10
SUMPALMS
SUMRATTAN
MEANHERBCOV
MEANBAMBCOV
MEANCANOPYCOVMEANMIDSTOREYCOV
MEANUNDERSTOREYCOV
MEANGROUNDCOV
SUMFALLENTREES
Vector scaling: 7.23

44
Figure 9. Ordination of the 13 cases on the two canonical axes using Multivariate Statistical Package (SUG = Sugod; MSN = Maasin; HIN = Hinunangan; SIL=Silago)
The position of the sites on the axes (Figure 9) may imply the condition of the forests that were sampled. The centroids for Silago 1, 2, 4 and 5 are positioned on the areas of fewer disturbances and increasing biomass, which may suggest that these are more mature forests. Silago 3 is found together with the centroids for all the Hinunangan sites on the upper left side of the biplot. This position may indicate an intermediately disturbed forest, with the vector for increasing fallen trees pointing toward this portion. For Sogod, the centroids’ presence in the upper right corner suggests lesser biomass and an even higher disturbance. Maasin centroids 1 and 3 are plotted on the extreme right of the axis for biomass, proving that even if there is not much disturbance, the trees are thinnest among all areas sampled. It is interesting to note though that the Maasin 2 centroid is plotted together with the majority of the Silago centroids, which might indicate a more mature condition.
The formed axes also divided the species centroids (see Figure 10). The vertical Axis 1 grouped together familiar lowland Dipterocarp forest species on the left-hand side, separating it from widely distributed and known reforested species on the right. Species on the left-hand side include Shorea negrosensis, Shorea seminis, Shorea contorta, Syzygium hutchinsonii, Syzygium calubcub, Calophyllum blancoi, Lithocarpus ovalis, Hopea quisumbingiana, Myristica philippensis and Oroxylum indicum. Those on the right-hand side are Artocarpus ovatus, Ficus balete, Erythrina subumbrans and Swietenia macrophylla.
From the horizontal Axis 2, a clearer grouping can be made of the left-hand side centroids. Those placed further below (Shorea contorta, Oroxylum indicum and Myristica philippensis) are Dipterocarp species that may prefer conditions of less disturbance, rather than the species which lie near or further above the axis.
CCA case scoresA
xis
2
Axis 1
SIL1
SIL2
SIL3
SIL4
SIL5
HIN1HIN2
HIN3
SUG1
SUG3
MSN1MSN2 MSN3
-0.81
-1.63
0.81
1.63
2.44
3.25
4.06
-0.81-1.63 0.81 1.63 2.44 3.25 4.06

45
Figure 10. Ordination of the 14 tree species on the two canonical axes using Multivariate Statistical Package. Codes used are listed in Table 2.
Figure 11. Canonical correspondence analysis (CCA) biplot of 18 habitat parameters and 14 tree species on the two canonical axes using Multivariate Statistical Package. Codes for habitat parameters and species centroids are listed in Tables 2 and 7, respectively.
C C A va riable sco res
Axi
s 2
Axis 1
SNGR
CBNC
SCTR
SYCB
AO VT
FBLTSSMNHQ SB
SYHT
SW MR
LTO V
MYPHO XID
ERSB
-0.80
-1.61
-2.41
0.80
1.61
2.41
3.22
4.02
-0.80-1.61-2.41 0.80 1.61 2.41 3.22 4.02M EANALTITUDE
M EANG RADIENT
SUM TREES4080SUM TREES2040SUM TREES1020SUM TREES10
SUM PALM S
SUM RATTAN
M EANHERBCO V
M EANBAM BCO V
M EANCANO PYCO VM EANM IDSTO REYCO V
M EANUNDERSTO REYCO V
SUM FALLENTREES
Vector scaling: 3.23
C C A variab le scoresA
xis
2
Axis 1
SNGR
CBNC
SCTR
SYCB
AOVT
FBLTSSMNHQSB
SYHT
SWMR
LTOV
MYPHOXID
ERSB
-0.80
-1.61
0.80
1.61
2.41
3.22
4.02
-0.80-1.61 0.80 1.61 2.41 3.22 4.02

46
Figure 12. Canonical correspondence analysis (CCA) biplot of 18 habitat parameters, 14 tree species and 13 cases on the two canonical axes using Multivariate Statistical Package. Codes for habitat parameters and species centroids are listed in Tables 2 and 7, respectively.
A superimposition of the habitat parameter vectors and species centroids is presented in Figure 4. From this, the habitat preferences of the key tree species can be observed. Those on the left-hand side of the vertical axis are species that prefer higher biomass, more mature forests, whereas those on the right are leaning toward thinner stands. More specifically, the centroid for Swietenia macrophylla leans toward high herb coverage and is found near the Maasin 1 and 3 centroids (Figure 12). That of Erythrina subumbrans seems to prefer higher bamboo cover areas, whereas Ficus balete is suggested to be associated with higher altitude areas (Figure 11).
3.12.2 Bird community ordination Canonical correspondence analysis (CCA) of the bird survey was based on 14 transect lines with 123 points or observation stations. Axis 1 (Figure 10) vectors positioned in the left-hand side are the variables indicating evidence of pristine habitat with vectors associated with increasing dominance of large trees and canopy cover percentage, tree height and tree DBH. The vectors for habitat variables position in the right-hand side of the axis are influenced by the proximity to the open areas (i.e. habitat near cultivation and more disturbed area) as evidenced by grass and increasing ground cover. This means that there is an axis of decreasing forest quality. The second canonical axis, the vector on the upper portion, are variables associated with forest characteristics proximate to the less pristine habitat (i.e. increasing proportion of second-generation forest type as evidenced by the increasing understorey parameters), whereas the vector in the lower portion has variables associated with forest interior (e.g. increasing number proportion to tree height, increasing DBH, canopy cover, tree and other height with less understorey biomass). This axis shows a decreasing habitat quality as a result of the proportion of the disturbances and habitat alteration.
C CA joint plot
Axi
s 2
Axis 1
SIL1
SIL2
SIL3
SIL4
SIL5
HIN1HIN2
HIN3
SUG1
SUG3
MSN1MSN2 MSN3
SNGR
CBNC
SCTR
SYCB
AOVT
FBLTSSMNHQSB
SYHT
SWMR
LTOV
MYPHOXID
ERSB
-0.81
-1.63
-2.44
0.81
1.63
2.44
3.25
4.06
-0.81-1.63-2.44 0.81 1.63 2.44 3.25 4.06MEANALTITUDE
MEANGRADIENT
SUMTREES4080SUMTREES2040
SUMTREES1020SUMTREES10
SUMPALMS
SUMRATTAN
MEANHERBCOV
MEANBAMBCOV
MEANCANOPYCOVMEANMIDSTOREYCOV
MEANUNDERSTOREYCOV
SUMFALLENTREES
Vector scaling: 3.74

47
The centroids of 12 bird species (Figure 4) in axis 1 (Prioniturus discurus, Loriculus philippinensis, Ixos everetti, Dicrurus hottentottus, Pachycephala philippinensis, Ducula poliocephala, Phapitreron amethystine, Centropus melanops, Penelopides panini, Buceros hydrocorax, Ptilinopus occipitalis, Todirhamphus winchelli) were projected on the left-hand side, indicating preference of mature forest habitat as an indication of increasing tree DBH, canopy crown, and height and other forest quality indications. One species (Alcedo argentata) is an outlier. The centroids of 10 species (Gallus galus, Harpactes ardens, Macronous striaticeps, Parus elegans, Irena cyanogaster, Phapitreron leucotis, Ixos philippinus, Bolbopsitattacus lunulatus, Centropus viridis, Pernis ptilorhynchus) were projected on the right-hand side, indicating the preference of habitat is much proportionate to disturbances as an indication of increasing ground cover, grass, ferns and herbs. In the second canonical axis (axis 2), the centroids of nine species (H. ardens, P. elegans, M. striaticeps, P. discurus, P. mindanensis, I. everetti, D. hottentottus, I. cyanogaster, P. leucotis) were projected at the upper portion of the axis, indicating the preferences of actively generating forest as shown by increasing understorey habitat variables. The centroids of the species at the lower portion preferred more forest quality. The centroids of three species (Phachycephala philippinensis, Ixos philippinus, Phapitreron leucotis) were neither at the extremity nor at the center of the axis. There are four species (G. gallus, P. occipitalis, T. winchelli, P ptilorhynchus) that are outliers.
Figure 13. Ordination of 20 habitat variables on the two canonical axes from Multivariate Statistical Package (MVSP)

48
Figure 14. Ordination of 24 selected species on the two canonical axes from Multivariate Statistical Package (MVSP)
Figure 15. Canonical correspondence analysis (CCA) biplot of 24 species and 20 habitat variables on the two canonical axes using Multivariate Statistical Package (MVSP)

49
3.12.3 Non-volant small mammals community ordination Canonical correspondence analysis (CCA) was done for nine non-volant mammal species surveys covered by 13 sampling points and 19 habitat variables. Axis 1, the vectors positioned on the left-hand side, shows variables of generating habitat as evidenced by presence of ground cover, understorey, grass, pandan and bamboo. The vector for the habitat variables on the right-hand side of the axis shows the variables with more defined forest quality as evidenced by increasing dominant big trees and tree height, with canopy cover. These indicate that this canonical axis means increasing forest quality. The second canonical axis, the vector on the upper portion, shows a variable associated with less pristine habitat as an indication of the presence of actively generating forest habitat. The vector on the lower portion shows a variable with increasing habitat complexity as an indication of more mature habitat as evidenced by increasing tree canopy cover, height and DBH. These indicate that this canonical axis means decreasing habitat quality. The centroids of five mammalians species in axis 1 (Rattus everetti, Crocidura sp., Batomys cf. salomonseni, Macaca fascicularis, Apomys sp.) were projected in the left-hand side, indicating the presence of understorey or increasing ground cover, whereas the centroids of another two species (Sundasciurus sp., Rattus tanezumi) were projected at the right-hand side, indicating a more complex forest structure. The centroid of one mammal species of (Bullimus bagobus) was neither on the extremity of this axis nor at the center. The centroids of species in axis 2 (Rattus tanezumi, Crocidura sp.) were projected at the upper portion, indicating that its prefered proportion is less complex forest (i.e. early second growth or degraded forest type), while the centroids of most of the species in axis 2 were projected in the middle of the lower part of the axis, indicating much more complex habitat structure of the forest. The centroids of three species (Batomys cf. salomonseni, Bullimus bagobus, Sundasciurus sp.) were neither at the extremity nor at the center of the axis.
Figure 16. Canonical correspondence analysis showing the ordination of 19 habitat variables of two canonical axes from Multivariate Statistical Package (MVSP)

50
Figure 17. Mammal centroids from Multivariate Statistical Package (MVSP)
Figure 18. Mammals biplot from Multivariate Statistical Package (MVSP)
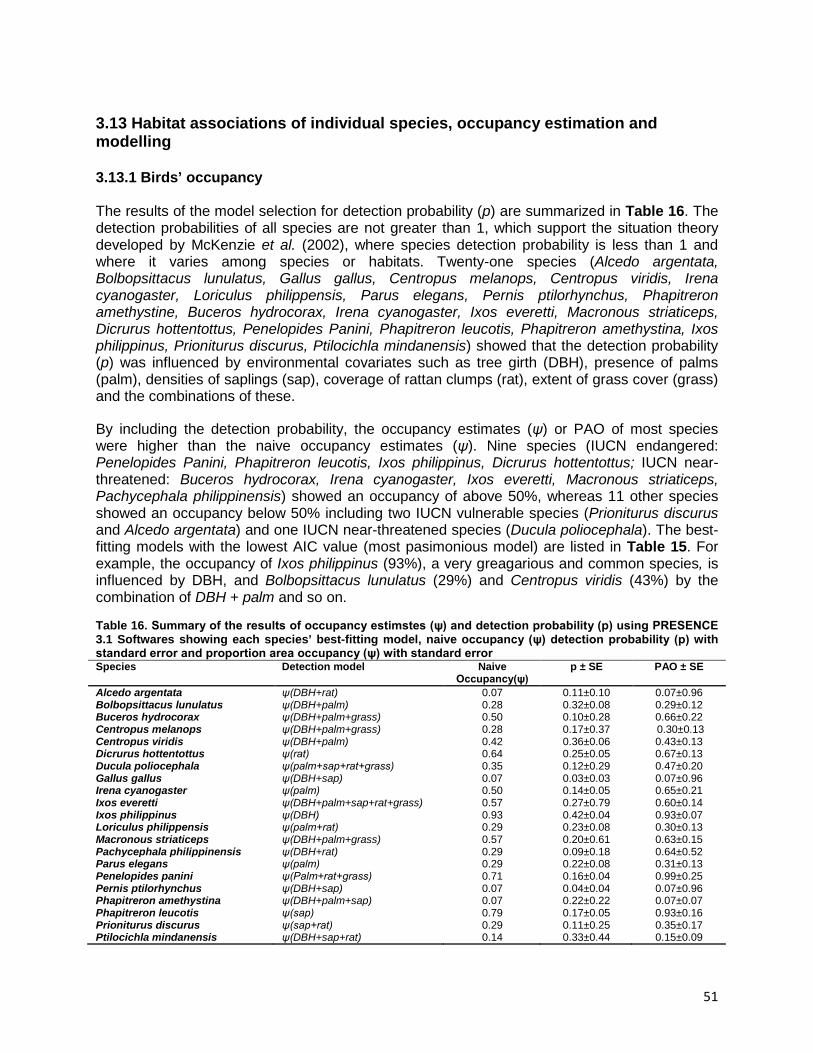
51
3.13 Habitat associations of individual species, occupancy estimation and modelling 3.13.1 Birds’ occupancy The results of the model selection for detection probability (p) are summarized in Table 16. The detection probabilities of all species are not greater than 1, which support the situation theory developed by McKenzie et al. (2002), where species detection probability is less than 1 and where it varies among species or habitats. Twenty-one species (Alcedo argentata, Bolbopsittacus lunulatus, Gallus gallus, Centropus melanops, Centropus viridis, Irena cyanogaster, Loriculus philippensis, Parus elegans, Pernis ptilorhynchus, Phapitreron amethystine, Buceros hydrocorax, Irena cyanogaster, Ixos everetti, Macronous striaticeps, Dicrurus hottentottus, Penelopides Panini, Phapitreron leucotis, Phapitreron amethystina, Ixos philippinus, Prioniturus discurus, Ptilocichla mindanensis) showed that the detection probability (p) was influenced by environmental covariates such as tree girth (DBH), presence of palms (palm), densities of saplings (sap), coverage of rattan clumps (rat), extent of grass cover (grass) and the combinations of these.
By including the detection probability, the occupancy estimates (ψ) or PAO of most species were higher than the naive occupancy estimates (ψ). Nine species (IUCN endangered: Penelopides Panini, Phapitreron leucotis, Ixos philippinus, Dicrurus hottentottus; IUCN near-threatened: Buceros hydrocorax, Irena cyanogaster, Ixos everetti, Macronous striaticeps, Pachycephala philippinensis) showed an occupancy of above 50%, whereas 11 other species showed an occupancy below 50% including two IUCN vulnerable species (Prioniturus discurus and Alcedo argentata) and one IUCN near-threatened species (Ducula poliocephala). The best-fitting models with the lowest AIC value (most pasimonious model) are listed in Table 15. For example, the occupancy of Ixos philippinus (93%), a very greagarious and common species, is influenced by DBH, and Bolbopsittacus lunulatus (29%) and Centropus viridis (43%) by the combination of DBH + palm and so on.
Table 16. Summary of the results of occupancy estimstes (ψ) and detection probability (p) using PRESENCE 3.1 Softwares showing each species’ best-fitting model, naive occupancy (ψ) detection probability (p) with standard error and proportion area occupancy (ψ) with standard error Species Detection model Naive
Occupancy(ψ) p ± SE PAO ± SE
Alcedo argentata ψ(DBH+rat) 0.07 0.11±0.10 0.07±0.96 Bolbopsittacus lunulatus ψ(DBH+palm) 0.28 0.32±0.08 0.29±0.12 Buceros hydrocorax ψ(DBH+palm+grass) 0.50 0.10±0.28 0.66±0.22 Centropus melanops ψ(DBH+palm+grass) 0.28 0.17±0.37 0.30±0.13 Centropus viridis ψ(DBH+palm) 0.42 0.36±0.06 0.43±0.13 Dicrurus hottentottus ψ(rat) 0.64 0.25±0.05 0.67±0.13 Ducula poliocephala ψ(palm+sap+rat+grass) 0.35 0.12±0.29 0.47±0.20 Gallus gallus ψ(DBH+sap) 0.07 0.03±0.03 0.07±0.96 Irena cyanogaster ψ(palm) 0.50 0.14±0.05 0.65±0.21 Ixos everetti ψ(DBH+palm+sap+rat+grass) 0.57 0.27±0.79 0.60±0.14 Ixos philippinus ψ(DBH) 0.93 0.42±0.04 0.93±0.07 Loriculus philippensis ψ(palm+rat) 0.29 0.23±0.08 0.30±0.13 Macronous striaticeps ψ(DBH+palm+grass) 0.57 0.20±0.61 0.63±0.15 Pachycephala philippinensis ψ(DBH+rat) 0.29 0.09±0.18 0.64±0.52 Parus elegans ψ(palm) 0.29 0.22±0.08 0.31±0.13 Penelopides panini ψ(Palm+rat+grass) 0.71 0.16±0.04 0.99±0.25 Pernis ptilorhynchus ψ(DBH+sap) 0.07 0.04±0.04 0.07±0.96 Phapitreron amethystina ψ(DBH+palm+sap) 0.07 0.22±0.22 0.07±0.07 Phapitreron leucotis ψ(sap) 0.79 0.17±0.05 0.93±0.16 Prioniturus discurus ψ(sap+rat) 0.29 0.11±0.25 0.35±0.17 Ptilocichla mindanensis ψ(DBH+sap+rat) 0.14 0.33±0.44 0.15±0.09

52
Table 17. Species and covariates’ best fitting model using PRESENCE 3.1 score by Akaike’s Information Criterion (AIC). As the AIC lowers to the most parsimonius, the AIC weight increases. Species Model AIC ω K -2log
Alcedo argentata ψ(DBH+rat) 12.28 0.14 3 6.28 Buceros hydrocorax ψ(DBH+palm+grass) 69.56 0.68 4 61.56 Bolbopsittacus lunulatus ψ(DBH+palm) 59.90 0.14 3 53.90 Centropus melanops ψ(DBH+palm+grass) 50.12 0.55 4 42.12 Centropus viridis ψ(DBH+palm) 90.95 0.10 3 84.95 Dicrurus hottentottus ψ(rat) 114.36 0.27 10 94.36 Ducula poliocephala ψ(palm+sap+rat+grass) 57.96 0.22 5 47.96 Galus galus ψ(DBH+sap) 14.55 0.07 3 8.55 Irena cyanogaster ψ(palm) 79.67 0.13 2 75.67 Ixos everetti ψ(DBH+palm+sap+rat+grass) 106.75 0.25 6 94.75 Ixos philippinus ψ(DBH) 175.49 0.13 2 171.49 Loriculus philippensis ψ(palm+rat) 59.01 0.12 3 53.01 Macronous striaticeps ψ(DBH+palm+grass) 98.07 0.49 4 90.07 Pachycephala philippinensis ψ(DBH+rat) 39.32 0.12 3 33.32 Parus elegans ψ(palm) 60.33 0.10 2 56.33 Penelopides Panini ψ(Palm+rat+grass) 95.58 0.24 4 87.58 Pernis ptilorhynchus ψ(DBH+sap) 14.55 0.07 3 8.55 Phapitreron amethystina ψ(DBH+palm+sap) 17.53 0.12 4 9.53 Phapitreron leucotis ψ(sap) 117.48 0.12 2 113.48 Prioniturus discurus ψ(sap+rat) 49.95 0.17 3 43.95 Ptilocichla mindanensis ψ(DBH+sap+rat) 30.91 0.21 4 22.91 The covariates are labelled as follows: DBH = average breast height diameter of all five largest tree presence in the area, palm = mean percentage of palm >2 meters, sap = average number of sappling within 10-meter radius plot, rat = average number of rattan >2 meters height within 20-meter radius plot, and grass = mean of grass percentage in the plot.
4. DISCUSSION
4.1 Determinants of species distribution and diversity The combinations of natural and anthropogenic factors are considered to have a significant influence on species distributions and diversity (Mallari 2009), such as climate, geographic ranges and vegetation types (Cueto and Casenave 1999). The pattern of increase in habitat heterogeneity on the structure and composition of vegetation becomes complex if the niche diversity and species diversity increases (Cramer and Willig 2002; Tews et al. 2004; Gingold et al. 2010; McClain and Barry 2010). For small non-volant mammals, it is known that elevational gradient in tropical regions also has greater effects on species richness and diversity (Rickart et al. 1993; Heaney 2001). As shown in Figure 7, the result of the surveys confirmed that the species accumulation in different elevations has reached the asymptote. In the case of the four localities, Silago has the highest diversity of non-volant mammals (Table 10), wherein it also has the highest elevation (945 meters). For birds, reptiles and amphibians, diversity and richness were high in early and advanced second growth habitats. Diversity and richness of flora species on the four localities were defined by proximity of the area to the communities where it is prone for resource extraction (Mallari 2009). As also shown in the result, the geographic range also defines the species endemism across the four localities. In fact, many of the species recorded are known to be endemic in the Mindanao faunal region, and some are restricted only on the island. The increase of species endemism on the island also contributed to species diversity. There are also anthropogenic disturbances observed on the area such as the small patches of “kaingin” in Silago and the illegal hunting of wildlife in Sogod and Silago.

53
Meanwhile, conversion of land use to abaca, banana and mahogany plantations was observed on the localities of Maasin and Hinunangan.These disturbances have influenced the diversity of species in the surveyed localities where the lowest diversity was observed in cultivated areas.
4.2 Faunal–habitat association In general, terrestrial fauna is dependent on the forest and riverine habitats (streams, rivers surrounded by forest), thus requiring forest-dominated habitats for their existence. Interestingly, data from recent ecological studies show that even disturbed original forests such as secondary forest or second growth vegetation, mixed with artificial or man-made forest (i.e. reforestations), still harbor considerable diverse and endemic species. It appears that some species could tolerate some degree of disturbance provided that the original vegetation is protected and left out to regenerate.
Buffer zones surrounding disturbed original vegetation are very important management strategies. In the Philippines, it has been a tradition to establish at least 1 kilometer of buffer zone around a protected core. Unfortunately, concrete data on the proper delineation of buffer zones based on biological data (e.g. proper area and size) on Philippine vertebrate species are non-existent. In general, it is suggested that the largest possible area of original vegetation (forest) and the largest possible area of buffer zone should be delineated as protected and management areas.
4.3 Occupancy Birds are the most vocally distinctive in most of the species; therefore, the team assumed that the detection probabilities were constant. Presence or absence surveys for species are commonly used in a wide variety of ecological applications. However, in all such applications, an observed species absence (or more correctly, the non-detection of the species) does not imply that the species is genuinely absent from a sampling location. Frequently, a species can be present at an area but go undetected due to random chance. Such “false absences” lead to incorrect inferences if the imperfect detection of the species is not accounted for (McKenzie 2005).New classes of models, called occupancy models,were developed to solve the problems created by imperfect detectability (McKenzie et al. 2002, 2003, 2004). In the recent years, site occupancy modeling has become increasingly useful to ecologists because the only data requirements are based on the detection or non-detection of a species over several sampling occasions (McKenzie et al. 2002; Linkie et al. 2007; Weller 2008). McKenzie et al. (2002) described a method that allows for unbiased estimation of the proportion of area occupied by a species in a single season, in scenarios where the species cannot always be detected with certainty. The occupancy model selection accounted with the survey effort is influenced by habitat covariates.
4.4 Management options
Option 1: Secure the remaining forest area in Silago, Hinunangan and Sogod through protected area proclamation but with a scheme of sustainable management of resources.
Securing the remaining forest in the three localities will definitely have a positive impact on biodiversity. It was proposed that these areas should have high priority for conservation, and there is a need to proclaim it as a protected area, but the proposed type of protected area will

54
not be as conventional. Because many communities in these areas are dependent on forest natural products and in order to have an effective management of the protected area, sufficient budget is needed. Putting economic value in a protected area is quite essential to support the management of natural resources and sustain the community’s basic needs. Therefore, this will be the first model of a protected area in the Philippines where it allows sustainable extraction of resources. Having said this, strategic and sustainable management of our forest will simultaneously secure biodiversity and basic needs of the people.
Option 2: Expand the forest area in Tomas Oppus, Malitbog and Maasin by increasing reforestation activities and minimizing the expansion of agricultural plantations.
Tomas Oppus has the smallest forest fragment (based on the computed value, it has a total of 4,352.22 hectares) of forest, followed by Malitbog and Maasin. Expansion of forest in these three localities might be very expensive and requires extra effort, but this option is also important due to many species based on the model will be affected by the decrease in forest. Numerous caves that serve as roosting sites for bats were also recorded in these areas and other import species of mammals were observed. Based on the model, avoiding a 10% decrease of forest in Tomas Oppus and at least 40-50% in Malitbog and Maasin will have a positive impact on biodiversity; otherwise, it will affect the species with a large area of occupancy. Therefore, reduction or minimizing agricultural expansion will benefit both biodiversity and REDD+ initiatives. Avoiding forest degradation and increase of reforestation activities will enhance carbon stocks.
Option 3: Designate permanent or shifting plot for agricultural activities and provide alternative livelihoods.
Defining permanent plots for agricultural activities will avoid forest degradation and reduce pressures on biodiversity. Our model suggests that forest-dependent species are highly vulnerable to fragmentation. Generalist species of birds, such as C. viridis, P. elegans and G. gallus, are likely benefiting from cultivated areas, but most of them are least concern compared to vulnerable species that are endangered and endemic. Creating permanent plots may seem contradictory especially when it comes to soil nutrient cycle; thus, shifting plots is another option. Establishment of shifting plots may allow the soil to regain its nutrients and regenerate vegetation.
Providing alternative livelihoods will also reduce the impacts of degradation on biodiversity by diverting the community’s practices (e.g. hunting) and interest.
5. IMPLICATIONS FOR MANAGEMENT PLANNING The simple modeling exercise demonstrates how science can positively drive management in protected areas or REDD+ demonstration sites. In effect, the habitat associations of trigger species coupled with the occupancy (how much of the habitat each species uses) predicted impacts of habitat change on species can confidently be mitigated by appropriately addressing the pressures on the species in relation to its level of tolerance or revision of the management zoning of the incipient protected area. This would place the conservation of advanced secondary and old growth forest at the heart of the new management plan: any negative impacts on these areas risk compromising the protected area’s ability to meet its mandated obligations to maintain its biodiversity values.Therefore, there are issues related to tenure or use rights that have an impact on these key habitats; these should be reviewed and appropriate agreements be made.

55
It is important to recognize one feature shared by many of the priority-based evaluations for global conservation that these areas are already in a marked state of degradation. Thus, for example, 34 global hotspots have already lost c.80% of their primary vegetation (CI 2009). Even areas that receive higher degrees of protection status are highly vulnerable to threats outside the protected area boundaries, thus emphasizing the need for realism and practicality, combined with solid scientific evidence, in any measures to minimize the impact of land use on biodiversity (Novacek and Cleland 2001). In the Philippines, there is a long history of traditional land tenure in most of the key areas for biodiversity conservation that are not yet legally declared. The process of establishing these sites as protected areas include imposition of protective legislation through management zones to prevent further degradation by controlling access that results in conflicts. These zones are perceived to disenfranchise and marginalize many indigenous peoples, landowners, local farmers and residents (Bryant 2000; Dressler 2006). As a result, resolution of these conflicts become the major preoccupation of protected areas management. This, coupled with the low technical capacity in protected areas staff to measure conservation success, means conservation targets set in management planning become confined to result indicators that fail to monitor the response of biodiversity to management prescriptions. Thus, management achievements are accounted for by the number of timber poachers apprehended or the number of wildlife/forest wardens deputized, not by monitoring the population increases or shrinkage of occupancy of/in threatened species or the expansion of areas of regeneration and rehabilitation. Clearly, approaches are needed to improve the ability of protected area managers to set measurable conservation targets and monitor conservation success (Myers 2003b; Eken et al. 2004; Rodrigues et al. 2004b) while minimizing social costs by promoting transparency, facilitating communications and fully involving all stakeholders (Brotherton 1996; Severino 2000; De Lopez 2001; White et al. 2002; Weladji and Tchamba 2003; Usongo and Nkanje 2004; Hovardas and Poirazidis 2007). Habitat loss and fragmentation are two of the most pressing problems in wildlife management and biodiversity conservation (Shafer 1990) in developing countries (Barbier 1993; Brooks et al. 1997a; Brook et al. 2003; Anderson et al. 2007). In the Philippines, it was reported that at least 70% of the natural habitats had disappeared in the last 30 years, and the remaining intact habitats are largely fragmented (Myers et al. 2000; Myers 2003a). The commonly used figures are based on land cover analysis of the Philippines stating that 97% of the country’s lowland old growth has been lost (WRI/IUCN/UNEP/UNDP 1994), with annual change in forest cover of −157,400 hectares or −2.1% per year (Tan 2000) owing to logging and conversion of forest to production, industrial, agriculture and residential areas (Kummer 1992a,b; Myers et al. 2000; Posa et al. 2008). Monitoring and forecasting the effects of these habitat alterations on agreed biodiversity indicators, e.g. biodiversity intactness index, etc., are currently lacking in many protected areas (Scholes and Biggs 2005; Butchart et al. 2006a; Hess et al. 2006; Mace and Baillie 2007), especially in the Philippines (Dinerstein and Wikramanayake 1993; Danielsen et al. 2005b). A number of monitoring methodologies such as remote-sensed “change detection” protocols (Jeanjean and Achard 1997; McDonald 2003; Kintz et al. 2006; Goosem 2007; Knick and Rotenberry 2000) provide useful information for protected areas to develop mitigating measures. However, often, there is a lag between management decisions and the scales and speed at which these changes happen and are detected (Brooks et al. 1999; Brook et al. 2003; Myers 2003b; Ernoult et al. 2006). By the time these results have been handed over to protected area managers, large tracts of key habitats may have been cleared and a number of species displaced or extirpated. Tools are needed to guide protected area managers in making sound management decisions as well as providing measures of change to serve as “early warning signals” that trigger adaptive management.

56
Regional conservation plans are increasingly used to plan and protect biodiversity at large spatial scales; however, the means of quantitatively evaluating their effectiveness are rarely specified. Multiple-species approaches, particularly those which employ site–occupancy estimation, have been proposed as robust and efficient alternatives for assessing the status of wildlife populations over large spatial scales, but the implemented examples are few (Weller 2008). Integration of occupancy modeling to BMS will improve the protocol as it would rectify the biases of imperfect detection caused by observers’ biases, which are influenced by environmental covariates and temporal changes (Mallari 2009). Baselining the current flora and fauna composition of a certain place provides better insight on how to design appropriate monitoring protocols. This inventory takes into account the species and ecosystem that need to be effectively prioritized through management measures based on the result of the study. One useful tool in obtaining baseline data for the said study is to conduct ground truthing. Ground truthing is a tool used in validating existing data and in analyzing the historical trend of the study site, though the use of new technology and digital images of the site can now be obtained using satellite images. But the remote-sensed data or image can only provide useful information at a certain resolution, prompting a need for ground truthing, which can provide more accurate and current data of the site.
5.1 Issues and challenges in the field
There have also been issues and challenges encountered by the team during the field activities that are worth mentioning. The first and most important would have been the existing conflicting tenural instruments. The different tenurial claims of private individuals and government on the project area can hamper implementation of the project. In addition, ground truthing validation also resulted to a different land use description. Thus, it was highly recommended by the team that the issues regarding conflicting tenural instrument and land use description be settled with the assistance of the local government unit (LGU) prior to the project implemention. Lastly, weather condition, especially the rain, has been a factor in reduced mobility and visibility during the field survey.
5.2 Realities on the ground: The threats to biodiversity
Illegal collection and poaching of wildlife is rampant on the project site. There have been personal sightings by the team that wildlife was treated as pets and hunted for food for personal consumption and for sale on the market. Hunting of birds species such as doves and pigeons, including Varanus and Hydrocephalus, and threatened species such as T. lucionensis and B. hydrocorax is indeed unrestrained on the area. Another observation on the site was that even at such an early age, some children were already practicing hunting of wildlife. These scenarios reflect the very poor knowledge in conservation on the said area. The need for an information, education and communication (IEC) campaign regarding the importance of biodiversity should be taken into consideration. Aside from the IEC campaign, alternative livelihood should also be promoted on the area so the people will not result in wildlife trading. Forest conversion to agriculture land is also one threat to the loss of biodiversity of the project site as most of the forest areas are now being used for planting crops for food and construction supplies. As observed, there are newly opened forest areas on the project site that were

57
converted into coconut and banana plantations. These land convertions lead to the degradation of forest cover, which affects the wildlife inhabiting the forest areas.
The conflicting land tenurialship, as previously mentioned, has a major effect on the land classification and conservation efforts of the LGU. According to the Defending the Gains of Tenurial Reforms Report, the complexities of implementation of the many laws on access to land require joint coordination of the different agencies of the government. It was also mentioned on the report that the mixed responsibilities resulted not only in backlogs but also contradicting implementation. Thus, the need for this issue to be resolved prior to the implementation of the project is crucial for the project’s success. In addition, other problems like hunting pressure on certain species and land conversion can be alleviated if tenurial instruments are clear to the people. Habitat is always prone to destruction during improper wildlife collections (i.e. caves in Maasin). But it was ensured by the team that sampling protocols have been observed during the survey so as not to disturb the habitat and species. Accessibilty of the area is a factor for conservation effort. If the area is far from human settlements, it is more likely to be pristine and preserved. The identified issues and threats to biodiversity can be addressed by proper land use classification aided by strict implementation of policy and reforms that would strengthen sustainable conservation efforts though capability building of the stakeholders.
1. Data provides better insight on how to design monitoring protocols. 2. Remotely sensed data or image can only give us useful information at a certain
resolution (for management planning). Therefore, there is still a need for ground truthing. 3. Never underestimate a patch of forest. 4. Hunting pressure on certain species and land conversion can be alleviated if tenurial
instruments are clear to the people.
6. SUMMARY AND CONCLUSIONS
The following summary of findings and conclusions can be derived from the assessment:
• Key species with narrow niche width (low occupancy, very specific habitat requirements) include the Silvery Kingfisher (A. Argentata), Rufous-lored Kingfisher (T. Winchelli), Red jungle fowl (G. Gallus) (reduced niche width due to hunting pressure), Yellow-breasted Fruit-Dove (D. Poliocephala), Mindanao shrew (Crocidura beatus), Philippine flying-lemur (Cynocephalus volans), Samar Squirrel (Sundasciurus samarensis), Apomys sp. and Mindanao Batomys (Batomys salomonseni).
• Importance of intermediate habitats (riparian ecosystems). In management planning regimes, these are almost automatically designated as buffer zones. But clearly, this is where the highest species diversity and highest densities of key species are found.
• Overstorey habitat characteristics influence the avifauna heavily. Understorey/undergrowth influences the distribution/abundance of non-volant fauna (frogs, mammals).
• Biodiversity surveys and species ordination were performed on three areas of the Southern Leyte lowland rainforest. It was found that Dipterocarpaceae, which historically dominated these lands, still registered as the most important family, with four important

58
species identified belonging to this taxon. Shorea negrosensis (red lauan) was identified as the most important species.
• Ordination of the species vis-à-vis the habitat parameters created two axes: one of increasing biomass and another of increasing disturbance. Based on these, regions on the biplots were identified: a region of thicker, less disturbed forest and an area of thick yet disturbed forest. The locations of the species centroids in these areas then suggest their habitat preference. This contributes to knowledge than can be applied by forest managers during restoration activities.
• Baseline studies on the current flora and fauna of a certain place provide better guidance in designing a suitable monitoring system.
• Remote sensing data analysis demonstrated to be useful in generating information of an area but only at a certain resolution. However, ground truthing has been proven to be a more essential tool in terms of validating existing information of an area. Likewise, the results of the ground truthing actvitiy in this study resulted to a different description of the surveyed area.
• Conflicting tenurial instruments hindered the implementation of the project due to conflicting land classification, claims and responsibilities of the parties. However, it can be resolved through local government unit (LGU) intervention.
• Activities observed in the survey that threaten biodiversity included wildlife collection, forest conversion to agricultural uses and house construction. Poor knowledge on wildlife has also been seen to be a contributory threat on the biodiversity of Southern Leyte. This coincides with findings of the Socio-Economic Study in the REDD+ Pilot Area (GIZ 2012), which outline, inter alia, hunting activities of the locals.
• The identified issues and threats on the biodiversity of Southern Leyte can be addressed by having a proper land use classification coupled with a strict implementation of policy and reforms, and the conduct of comprehensive capacity building efforts to sustain conservation initiatives.

59
ANNEXES:
Annex 1. Species list of mammals in Silago, Hinunangan, Sogod and Maasin, Southern Leyte
Family Scientific name Common name IUCN 2011
Silago Hinunangan Sogod Maasin
Soricidae Crocidura beatus Mindanao shrew LC X X X Cynocephalidae Cynocephalus volans Philippine flying lemur LC X Pteropodidae Acerodon jubatus Golden-capped fruit
bat EN X
Cynopterus brachyotis Lesser dog-faced fruit bat
LC X X X
Eonycteris spelaea Dawn bat LC X X X X Haplonycteris fischeri Philippine pygmy fruit
bat LC X X X X
Harpyionycteris whiteheadi
Harpy fruit bat LC X X
Macroglossus minimus Dagger-toothed long-nosed Fruit Bat
LC X X X X
Megaerops wetmorei White-collared fruit bat
X
Ptenochirus jagori Greater musky fruit bat
LC X X X X
Ptenochirus minor Lesser musky fruit bat LC X X X X Pteropus hypomelanus Island flying fox LC X Pteropus vampyrus Large flying-fox NT X Rousettus
amplexicaudatus Geoffroy's rousette LC X X X X
Emballonidae Emballonura alecto Small Asian sheath-tailed bat, Philippine sheath-tailed bat
X
Megadermatidae Megaderma spasma Lesse false vampire LC X Hipposididae Hipposideros ater Dusky leaf-nosed bat,
Bi-coloured leaf-nosed bat, Dusky roundleaf bat
X
Hipposideros bicolor Bicolored leaf-nosed bat
X
Rhinolophidae Rhinolophus arcuatus Arcuate horseshoe bat
LC X
Rhinolophus inops Philippine forest horseshoe bat
NT X X
Rhinolophus philippinensis
Philippine forest horseshoe bat
X
Rhinolophus subrufus Small rufous horseshoe bat
X X
Vespertilionidae Myotis muricola Nepalese whiskered myotis
LC X
Tarsiidae Tarsius syrichta Philippine tarsier NT X X X* X* Cercopithecidae Macaca fascicularis Crab-eating macaque LC X X* X X* Sciuridae Exilisciurus concinnus Philippine pygmy
squirrel LC
Sundasciurus samarensis Samar squirrel LC X* X* X* Muridae Apomys sp. X X X Batomys salomonseni Mindanao Batomys LC X Bullimus bagobus Mindanao Bullimus LC X X X Rattus everetti Philippine forest rat LC X X X X Rattus tanezumi Oriental house rat LC X X Viveridae Paradoxuru
shermaphroditus Common palm civet LC X* X* X* X*
Vivera tangalunga Malay civet tangalunga
Suidae Susbarbatus mindanensis VU X* X* X* Cervidae Cervus mariannus Philippine brown deer VU
Note: X* species present in the area but not captured.

60
Annex 2. List of birds recorded during the survey in Southern Leyte from November to December 2011
Common name Scientific name Local name Range IUCN conservation status 2011
ARDEIDAE Black-crowned night−heron Nycticorax nycticorax M LC ACCIPITRIDAE Oriental honeybuzzard Pernis ptilorhynchus R Barred honeybuzzard Peris celebensis R Brahminy kite Haliastur indus Banog R LC Philippine serpent−eagle Spilornis holospilus R LC Philippine hawk-eagle SpIzaetus philippinensis Banog E FALCONIDAE Philippine falconet Microhierax erythrogenys E LC PHASIANIDAE Red junglefowl Gallus gallus manok-ihalas R LC RALLIDAE Barred rail Gallirallus torquatus kee-jaw R LC Slaty-legged srake Rallina eurizonoides R LC Plain bush−hen Amaurornis olivaceus tik-ling E LC COLUMBIDAE White-eared brown-dove Phapitreron leucotis E Amethyst brown−dove Phapitreron amethystina E LC Yellow-breasted fruit−dove Ptilinopus occipitalis E LC Black-chinned fruit−dove Ptilinopusleclancheri punay E LC Pink-bellied imperial−pigeon Ducula poliocephala antulihaw E NT Green imperial−pigeon Ducula aenea R LC Metallic pigeon Columba vitiensis Philippine cuckoo−dove Macropygia tenuirostris R LC Island collared−dove Streptopelia bitorquata R LC Common emerald−dove Chalcophaps indica R LC Mindanao bleeding-heart Gallicolumba criniger E PSITTACIDAE Guaiabero Bolbopsittacus lunulatus E Blue-naped parrot Tanygnathus lucionensis periko E Blue-backed parrot Tanygnathus sumatranus R Blue-crowned racquet-tail Prioniturus discurus managing E Colasisi Loriculus philippensis kusi E CUCULIDAE Hodgson's hawk-cuckoo Cuculus fugax R Drongo cuckoo Surniculus lugubris R LC Philippine coucal Centropus viridis kookook E LC Black-faced coucal Centropus melanops kookook sa
lasang E LC
STRIGIDAE Philippine scops-owl Otus megalotis E LC Philippine hawk−owl Ninox philippensis E LC PODARGIDAE Philippine frogmouth Batrachostomus septimus E LC CAPRIMULGIDAE Great eared nightjar Eurostopodus macrotis R LC Philippine nightjar Caprimulgus manillensis R LC APODIDAE Glossy swiftlet Collocalia esculenta R LC Pygmy swiftet Collocalia troglodytes E LC Philippine needletail Mearnsia picina E NT HEMIPROCNIDAE Whiskered treeswift Hemiprocne comata R LC TROGONIDAE Philippine trogon Harpactes ardens E LC CORACIIDAE Dollarbird Eurystomus orientalis bawud R LC ALCEDINIIDAE Silvery kingfisher Alcedo argentata E VU Philippine dwarf-kingfisher Ceyx melanurus E VU White-throated kingfisher Halcyon smyrnensis tikaraw R LC Rufous-lored kingfisher Todirhamphus winchelli tikaraw E VU

61
White-collared kingfisher Todirhamphus chloris tikaraw R LC MEROPIDAE Blue-throated bee−eater Merops viridis R LC Blue-tailed bee−eater Merops philippinus R LC BUCEROTIDAE Tarictic hornbill Penelopides panini tawas E EN Rufous hornbill Buceros hydrocorax kalaw E NT CAPITONIDAE Coppersmith barbet Megalaima haemacephala R LC PICIDAE Philippine pygmy woodpecker Dendrocopos maculatus batok E LC Sooty woodpecker Mulleripicus funebris batok E LC White-bellied woodpecker Dryocopus javensis batok R LC Greater flameback Chrysocolaptes lucidus batok R LC EURYLAIMIDAE Visayan wattled broadbill Eurylaimus samarensis E VU PITTIDAE Hooded pitta Pitta sordida R LC Steere's pitta Pitta steerii E VU HIRUNDINIDAE Pacific swallow Hirundo tahitica R LC CAMPEPHAGIDAE Bar-bellied cuckoo-shrike Coracina striata Black-bibbed cuckoo-shrike Coracina mindanensis Pied triller Lalage nigra R LC PYCNONOTIDAE Yellow-vented bulbul Pynonotus goiavier R Yellow-wattled bulbul Pynonotus urostictus E Philippine bulbul Ixos philippinus tagbida E Yellowish bulbul Ixos everetti E LC DICRURIDAE Spangled drongo Dicrurus hottentottus R LC ORIOLIDAE Philippine oriole Oriolus steerii E LC Black-naped oriole Oriolus chinensis orion R LC Philippine fairy-bluebird Irena cyanogaster CORVIDAE Large-billed crow Corvus macrorhynchos R LC PARIDAE Elegan tit Parus elegans E LC SITTIDAE Velvet-fronted nuthatch Sitta frontalis R LC Sulphur-billed nuthatch Sitta oenochlamys RHABDORNITHIDAE Stripe-headed rhabdornis Rhabdornis mysticalis E TIMALIIDAE Streaked ground-babbler Ptilocichla mindanensis E LC Pygmy babbler Stachyris plateni E NT Brown tit-babbler Macronus striaticeps E DD Miniature tit−babbler Micromacronus leytensis E DD SYLVIIDAE Philippine leaf−warbler Phylloscopus olivaceus E LC Philippine tailorbird Orthotomus castaneiceps E LC Yellow-breasted tailorbird Orthotomus samarensis R NT MUSCICAPIDAE Grey-streaked flycatcher Muscicapa griseisticta M LC Mangrove blue flycatcher Rhinomyias ruficauda R LC Citrine canary-flycatcher Culicicapa helianthea R LC Blue-headed fantail Rhipidura cyaniceps E PACHYCEPHALIDAE Yellow-bellied whistler Pachycephala philippinensis E LC MOTACILLIDAE Grey wagtail Motacilla cinerea M LC Yellow wagtail Motacilla flava M LC ARTAMIDAE LANIIDAE Brown shrike Lanius cristatus M LC STURNIDAE Asian glossy starling Aplonis panayensis R LC Coleto Sarcops calvus E LC

62
NECTARINIIDAE Plain-throated sunbird Anthreptes malacensis R LC Olive-backed sunbird Cinnyris jugularis R LC Purple-throatd sunbird Leptocoma sperata R LC Metallic-winged sunbird Aethopyga pulcherrima E LC Lovely sunbird Aethopyga shelleyi E LC Naked-faced spiderhunter Arachnothera clarae E LC Little spiderhunter Arachnothera longirostra R LC DICAEIDAE Olive-backed flowerpecker Prionochilus olivaceus E LC Bicolored flowerpecker Dicaeum bicolor E LC Red-keeled flowerpecker Dicaeum australe E LC Buzzing flowerpecker Dicaeum hypoleucum E LC Orange-bellied Flowerpecker
Dicaeum trigonostigma R LC
Pygmy flowerpecker Dicaeum pygmaeum E LC ZOSTEROPIDAE Everette's white-eye Zosterops everetti R LC ESTRILDIDAE White-bellied munia Lonchura leucogastra R LC
* Bold= endemic.
Annex 3. List of amphibians and reptiles with conservation status and site location
Family Scientific name Common name IUCN 2011 status
Silago Hinunangan Sogod Maasin
Frogs Bufonidae Pelophryni lighti X Ceratobatrachidae Platymantis bayani Limestone-forest
frog
Platymantis corrugatus Rough-backed forest frog
LC X X X
Platymantis guentheri Guenther's forest frog
X X X X
Platymantis rabori Rabor's forest frog VU X Platymantis sp. A (new
species) DD X
Platymantis sp. B (new species)
DD X
Platymantis sp. C DD X Dicroglossidae Limnonectes leytensis Small disked frog LC X Limnonectes magnus Giant Philippine frog NT X X X Occidozyga laevis Common puddle
frog LC X X X
Fejervarya cancrivora Crab-eating frog LC Fejervarya vittigera LC X X Megophryidae Megophrys stejnegeri Mindanao horned
frog VU X X X
Microhylidae Kalophrynus pleurostigma Black-spotted sticky frog
LC X X X
Kaloula sp. X X X Ranidae Hylarana grandocula LC Sanguirana
albotuberculata DD
Staurois natator Black-spotted rock frog
LC X X
Rhacophoridae Nyctixalus spinosus Spiny tree frog VU X Philautus leitensis Leyte tree frog VU X X X X Polypedates leucomystax White-lipped tree
frog LC X
Rhacophorus appendiculatus
Southeast Asian tree frog
LC X X X
Rhacophorus bimaculatus Tree frog VU X X Rhacophorus pardalis Tree frog LC X X Turtles

63
Geoemydidae Cuora amboinensis Southeats Asian box turtle
VU X
Lizards Agamidae Bronchocoela cristatella Green crested lizard X X Draco cyanopterus X Draco mindanensis Mindanao flying
lizard VU X
Gonocephalus semperi Mindanao forest dragon
DD X X X
Hydrosaurus pustulatus Sailfin water lizard VU Gekkonidae Cyrtodactylus gubaot* Hemidactylus frenatus Common house
gecko LC X
Pseudogekko compressicorpus
Cylindrical-bodied smooth-scaled gecko
LC X X
Scincidae Brachymeles orientalis Southern burrowing skink
Brachymeles paeforum* Brachymeles cf. talinis Duméril's short-
legged skink LC
Brachymeles sp. (possible new species) Eutropis multicarinata
multicarinata X X
Otosaurus cumingii Cuming's sphenomorphus
X
Parvoscincus steerei Steere's sphenomorphus
X
Pinoyscincus coxi coxi Cox's sphenomorphus
X X
Pinoyscincus jagori Jago's sphenomorphus
X X X X
Pinoyscincus mindanensis
Mindanao sphenomorphus
X
Sphenomorphus acutus Pointed-headed sphenomorphus
LC X
Sphenomorphus fasciatus Banded sphenomorphus
LC X X
Sphenomorphus variegatus
X X X
Varanidae Varanus cumingi Mindanao water monitor
LC X
Snakes Boidae Python reticulatus Reticulated python X Colubridae Ahaetulla prasina
preocularis Gunther’s whip snake,
LC X X
Aplopeltura boa Blunt-headed slug snake
LC X
Boiga cynodon Dog toothed cat snake
X
Calamaria lumbricoidea Variable reed snake LC X Coelognathus erythrura Reddish rat snake X Cyclocorus nuchalis
taylori Southern triangle-spotted snake
LC
Dendrelaphis caudolineatus
Striped bronzeback X
Lycodon aulicus Common wolfsnake X Lycodon ferroni DD X Oligodon modestum Luzon kukri snake VU X X X Oxyrhabdium modestum Philippine shrub
snake X X X
Psammodynastes pulverulentus
Common mock viper X X
Rhabdophis auriculata auriculata
White-lined water snake
LC
Tropidonophis dendrophiops
Spotted water snake
LC X
Tropidonophis negrosensis
VU X
Elapidae Naja samarensis Samar cobra, LC X

64
Typhopidae Typhlops sp. Blind snake X Viperidae Trimeresurus
flavomaculatus Philippine pitviper LC X
Tropidolaemus wagleri Wagler's pit viper X
Annex 4. Floristic composition of Samar-Leyte Island
Family name Scientific name Common name Extent of occurrence
IUCN status
Achariaceae Pangium edule Reinwardt Pangi Trichadenia zeylanica Adoxaceae Samcubus javanica Alangiaceae Alangium longiflorum Merr. Apitan V Alangium meyeri Anacardiaceae Dracontomelon dao (Blco) Merr. & Rolfe Dao Koordersiodendron pinnatum (Blco) Merr. Amugis Mangifera altissima Blco. Pahutan V Mangifera monandra Merr. V Rhus taitensis Guill. Annonaceae Cananga odorata (Lamk.) Hook. Ilang-ilang Cyatocalex pruniferus Dysymanchalon closiflorum Goniothalamus elmeri Merr. Polyanthea lateriflora Apocynaceae Alstonia macrophylla Wall. ex. G. Don Batino LR Alstonia scholaris (L.) R. Br. Dita Kibatalia merrilliana Endemic V Kibatalia puberula Endemic E Tabernaemontana pandacaqui Poir. Kampupot Voacanga globosa (Blco.) Merr. Bayag-usa Araliaceae Osmoxylon trilobatum (Merr.) Polyscias nodosa (Bl.) Seem. Malapapaya Scheftera sp. Arecaceae Areca sp. Caryota rumphiana Takipan Livistona rotundifolia Anahaw Oncospermum horridum Anibong Orania decipiens Endemic Sagisi Pinanga insignis Becc. Sarauag Endemic Pinanga maculata Porté ex Lem. Molted abiki Endemic Calamus sp. Ilhiun (Rattan) Calamus sp. Amerikan (Rattan) Calamus sp. Tambunganga (rattan) Calamus sp. Sahaan (Rattan) Aspleniaceae Asplenium nidus L. Pakpak-lawin Asplenium tenerum Forst. Arauacariaceae Agathis philippinensis Almaciga Endemic V Bignoniaceae Oroxylum indicum (L.) Vent. Tui Spatthodea companulata African tulip Boraginaceae Cordia dichotoma Burseraceae Canarium asperum Benth. Pagsahingin Dacryodes rostrata Lamarck Kembayau LC Cannabaceae Celtic philippinensis Magabuyo Endemic V Gironniera celtidifolia Gaudich. Parasponia rugosa Trema orientalis (L.) Bl. Anabiong Casuarinaceae Casuarina nodiflora syn rumphiana Miq. Mountain agoho Chloranthaceae Sarcandra glabra (Thunb.) Nakai Calophyllaceae Calophyllum blancoi Pl. & Tr. Bitangol Calophyllum soulattri Burm. f. Bintanggor LC Calophyllum macrocarpum Clusiaceae Garcinia rubra Merrill Kamandiis R Garcinia bentami Bunog Garcinia binucao Combretaceae Terminalia nitens Presl. Sakèt V Terminalia foetidissima Talisay gubat Cyatheaceae Cyathea negrosiana Christ. R

65
Cyathea moluccana Cyathea contaminans Cunoniaceae Weinmannia camiguinensis Dilleniaceae Dillenia indica Katmon Dillenia megalantha Merr. Katmon V Dillenia philippinensis Rolfe Katmon Endemic V Dipterocarpaceae Dipterocarpus validus (Blume) Hagakhak CE Hopea acuminata Merrill Manggachapui Endemic CE Hopea quisumbingiana Gutierrez Quisumbing Gisok (Subyang) Endemic CE Parashorea malaanonan (Blanco) Bagtikan CE Shorea almon Almon CE Shorea astylosa Foxworthy Yakal Endemic CE Shorea negrosensis Red-lauan Endemic CE Shorea palosapis syn squamata Mayapis Endemic CE Shorea/Pentacme contorta White-lauan Endemic CE Shorea polysperma Tangile Endemic CE Shorea seminis Malayakal (Uwayan) Red uwayan White uwayan Uwayan kule Ebenaceae Diospyros blancoi A. DC. Mabolo Diospyros pilosanthera Blco. Bulong-eta Diospyros pyrrhocarpa Miq. Anang Euphorbiaceae Antidesma nitidum Tul. Blumeodendron subrotundifolium Havea brasiliensis Para-rubber Homalanthus macradenius Banti (small leaf) Homalanthus sp1 Banti (small and rounded leaf) Homalanthus sp2 Banti (big and rounded leaf) Macaranga bicolor Hamindang Endemic V Macaranga grandifolia(Blcol.) Merr. Takip-asim Endemic V Macaranga hispida (Bl.) Muell.-Arg. Macaranga tanarius (L.) Muell.-Arg. Binunga Macaranga gigantifolia Binunga (big leaf) Mallotus mollisimus Mallotus philippensis (Lam.) Muell.-Arg. Endemic Melanolepis multiglandulosa (Reinw.) Alim Mallotus cumingii (Muell.-Arg.) Apanang Endemic Phyllanthus leytensis Elm. Endemic Securinega flexousa Mueller Anislag Fabaceae Acacia auriculiformes Auri Afzelia rhomboidea (Blanco) Vidal Tindalo/Balayong V Archidendron clypearia (Jack) I.C. Nielsen Unaki Bauhinia integrifolia Roxb. Agpoi/Orchid tree Bauhinia sp. Vine Cynometra bipinnata Matang-hipon Erythrina subumbrans (Hassk.) Merr. Rarang/Anii Glericidia sipium Kakawati Leucaena leocucephala Ipil-ipil Pterocarpus indicus Willd. Narra Endemic V Parkea speciosa Kupang Saraca sp.(Narrow and opposite leaves) Saraca sp.Narrow and decossotes leaves) Senna alata Palomaria Wallaceodendron celebicum Koord Banuyo Fagaceae Lithocarpus buddii (Merr.) A. Camus Babaisakan Endemic Gentianaceae Fagraea auriculata Jack Fagraea racemosa Jack ex Wall. Marikaba Gesneriaceae Cyrtandra oblongata Gnetaceae Gnetum gnemon L. var. gnemon Bago LC Hernandiaceae Illigera luzoniensis (Presl) Merr. Binat, Kuripatong Endemic Hydrangeaceae Ditchroa febrifuga Lauraceae Actinodaphne pruinosa Puso-puso Cinnamomum mercadoi Vid. Kalingag V Litsea leytensis Merr. Batikulin Endemic Malvaceae Cieba pentandra Kapok (Sterculiaceae) Colona sp. Commersonia bartramia Durio sp. Durian

66
Hibiscus tiliaceus Kleinhovia hospida L. Tan-ag Pterospermum celebicum Miq. Bayok-bayukan Pterospermum diversifolium Bl. Bayok Marattiaceae Angiopteris evecta (Forst.) Hoffm. Marattia pellucida Presl. Melastomataceae Astronia candolleana Medinilla cumingii Medinilla magnifica Melastoma malabathricum Amumusing Melostoma sp. (hairy) Ptenandra hirta Meliaceae Aphanamixis polystachia (Wall.) R.N. Parker Kangko Chisocheton pentandrum (Blancoi) Katong-matsing Dysoxylum arborescens (Blume) Miq. Kalimutain Sandoricum koetjape Santol Sandoricum sp. Santol-gubat Swietenia micropylla Mahugany Toona calantas Merr. & Rolfe Kalantas Endemic DD Moraceae Artocarpus blancoi (Elm.) Merr. Antipolo Artocarpus heterophylla Nangka Artocarpus nitidus Ficus alstisimma Tangisang layogan Ficus balete Merr. Balete Ficus benjamina L. Weeping fig Ficus botryocarpa Miq. Basikong Ficus fistulosa Reinw. ex Bl. Ficus minahassae Miq Hagimit Ficus odorata (Blco.) Merr. Pakiling Endemic Ficus nota Tebeg Ficus septica Hawili Ficus ulmifolia Is-is Endemic V Ficus variegata Tangisang bayawak Myristicaceae Myristica philippensis Lamarck Duguan Endemic V Myrsinaceae Ardisia squamulosa Presl Tagpo Endemic Ardisiapyramidalis Discocalyx lnearifolia. Loheria classifolia Myrtaceae Melaleuca cajaputi Syzygium aqueum Makupa/Water apple V Syzygium calobkob Sagimsim Syzygium curranii Curran Lipoti Syzygium samarangense Tristania decorticata Malabayabas V Tristaniopsis whiteana Tiga Pandanaceae Pandanus (Big) Pandanus (Small) Pandanus (Climber) Phyllanthaceae Antidesma bunius Aporusa Piperaceae Piper adduncum Poaceae Imperata cylindrica Kogon Polygalaceae Polygala venenosa Juss. ex Poir. Polypodiaceae Drynaria quercifolia L. (J. Sm) Oak-left fern Proteaceae Helicia velutina Pteridaceae Pteris spp. Pneumatopteris laevis pleiocnemia irregularis Rhamnaceae Ziziphus angustifolius (Miq.) Rosaceae Prunus arborea (Bl.) Kalkm. var. arborea Prunus grisea (Bl,) Kalkm. var. grisea Lago LC Rubus fraxinifolius Poiret Pinit/wild strawberry Rubiaceae Coffea sp. Kape Ixora sp. Lasianthus cf. obliquinerva Merr. Mussaenda philippica Elm. Kahoy dalaga Nauclea officinalis Bangkal Neonauclea formicaria (Elm.) Merr. Praravinia cf. mindanensis (Elm.) Brem. Psychotria pallidifolia Merr.

67
Timonius arboreus Merr. Rutaceae Lunasia amara Blco. Micromelum compressum (Blco.) Merr. Piris Sapindaceae Acer laurinum Baliag Allophyllus cobbe (L.) Raeuschel Tit berry Brucea mollis Nepheliumlappaceum Rambutan Nephelium sp. Ituman Pometia pinnata Forst. Malugai Sapotaceae Palaquium philippense (Perr.) C. B. Rob. Nato Endemic V Schizaeaceae Lygodium auriculatum (Willd.) Alst. et Holtt. Lygodium circinatum (Burm.) Sw. Nito Solanaceae Solanum anisophyllum Elm. Solanum ferox L. Tarambulo/Tarong-tarong Taccaceae Tacca palmata Bl. Payung-payong Taenitidaceae Taenitis blechnoides (Willd.) Sw. Tectariaceae Pleocnemia irregularis (Presl) Holttum Tetramelaceae Octomeles sumatrana Miq. Binuang LC Thelypteridaceae Pneumatopteris laevis (Mett.) Holttum Endemic Urticaceae Dendrocnide meyeniana Lipa Leucosyke capitellata (Poir.) Wedd. Alagasi Lamiaceae Clerodendrum interiudium Gmelina arborea Yemane Lantana camara Premna odorata Blco. Kantutay Vitex parviflora Jussieu Molave V Vitex quinata Anonymous Nepenthes sp1 Pitcher plant Nepenthes sp2 Pitcher plant (medium) Nepenthes sp3 Pitcher plant (big) Dicranopteris linearis Dicranopteris linearis-Big Bukawi (Running bamboo) Balikaw (Running bamboo) Hagonoy Triskantos (Grass) Begonia fucsioides Begonia small leaf Begonia sp. Begonia big leaf Banag (Vine) Musa textilis Abaca Tagbak Angeospteris evicta Pteris vittata Segnilla sp. Nephrolepis biserrata Pako-pako

68
Annex 5. Survey transects in four localities

69

70

71
Annex 6. Animals and plants used by communities in Southern Leyte
Species Local name Use, significance and othern information
Mammals
Flying Foxes:
Golden-crowned flying fox Acerodon jubatus
Large flying fox Pteropus vampyrus
Pteropus hypomelanus
Kabug/paniki Food, sold for cash (P30.00/piece)
Cynocephalus volans Kagwang
Long-tailed macaque Macaca fascicularis
Unggoy Food, sold for cash; ~P150-P200/kilo
Common palm civet Paradoxurus hermaphroditus
Milo For food
Malay civet Viverra tangalunga Milo For food
Philippine warty pig Sus barbatus mindanensis
Baboy ihalas For barter or sold to buy rice. ~P190.00/kilo
* Fresh tracks were still observed in municipalities of Silago, Sogod and Hinunangan during the survey.
Philippine brown deer Cervus mariannus
Usa For food. Last time they observed deer in Upper Bantawon in 1970
Birds
Red-jungle fowl Gallus gallus Manok ihalas Pet, food
Colasisi Kusi As pet,
Doves and pigeons Punay, manatad, alimoken
Food, sold for cash. Most of the time as pet.
Found in cages in several houses in the barangays near the forests.
Amphibians
Frogs Food
Reptiles
Reticulated pythonsPython reticulatus
Bitin Food
Water Monitor lizardsVaranus Hawo/halo Food, no observation was made in the area may be due to excessive hunting
Sailfin lizard Food, pet
Plants
Dipterocarp trees Selectively logged, for boat-making (Silago)

72
REFERENCES: Anonymous. http://211.114.21.20/tropicalplant/html/print.jsp?rno=137
Anonymous. http://www.bpi.da.gov.ph/Publications/mp/pdf
ASEAN Tropical Plant Database. http://211.114.21.20/tropicalplant/html/print.jsp?rno=193
Baguinon, N.T. 2002: Vegetation analysis of the Lawaan CBRM site. An Assessment of its Floristic (Seed Plants –Trees) Biodiversity.
Bailey, L.L., Simons, T.R., Pollock, K.H. 2004: Estimating site occupancy and species detection probability parameters for terrestrial salamanders. Ecological Applications, 14(3), 692-702.
Balgooy, van M.M.J. 1998: Malesian Seed Plants Vol. 2 - Portraits of Tree Families. Rijksherbarium / Hortus Botanicus, Leiden, The Netherlands. 307 pp.
Beck, J., Schwanghart, W. 2010: Comparing measures of species diversity from incomplete inventories: An update. Methods in Ecology and Evolution, 1(1), 38-44. doi: 10.1111/j.2041-210X.2009.00003.x
Catibog-Sinha, C., Heaney, L.R. 2006: Philippine Biodiversity: Principles and Practice. Haribon Foundation, Quezon City.
Chao, A., Shen, T.-J. 2003: Nonparametric estimation of Shannon’s index of diversity when there are unseen species in sample. Environmental and Ecological Statistics, 10(4), 429-443. doi: 10.1023/a:1026096204727
Colwell, R. K. 2009: EstimateS: Statistical estimation of species richness and shared species from samples. Version 8.2. User's Guide and application published at: http://purl.oclc.org/estimates.
Cottam, G., Curtis, J.T. 1956: The use of distance measures in phytosociological sampling. Ecology, 37(3), 451-460.
Cramer, M.J., Willig, M.R. 2002: Habitat heterogeneity, habitat associations, and rodent species diversity in a sand-shinnery-oak landscape. Journal of Mammalogy, 743-753.
Cueto, V.R., de Casenave, J.L. 1999: Determinants of bird species richness: Role of climate and vegetation structure at a regional scale. Journal of Biogeography, 26(3), 487-492. Published by Blackwell Publishing.
Dargantes, B.B., Koch, W. 1994: Case studies on the occupation and cultivation of the forest lands of Leyte, Philippines. Annals of Tropical Research, 16, 13-29.
Davis, S.D., Heywood, V.H., Hamilton, A.C., ed. 1995: Centres of Plant Diversity - A Guide and Strategy for their Conservation, Vol. 2: Asia, Australasia and the Pacific. Cambridge: IUCN Publications Unit.
De Guzman, E.D., Sotalbo, E.D., Umali, R.M. 1986: Guide to Philippine Flora and Fauna. Volume 3: Dipterocarps and Non-Dipterocarps. Natural Resources Management Center, Ministry of Natural Resources and University of the Philippines, Philippines.

73
Department of Environment and Natural Resources, 1998: Philippine atlas. Quezon City: Department of Environment and Natural Resources.
Forest Management Bureau. Official Website, 2003: http://forestry.denr.gov.ph/landuse8.htm# (accessed March 17, 2012).
Gingold, R., Mundo-Ocampo, M., Holovachov, O., Rocha-Olivares, A. 2010: The role of habitat heterogeneity in structuring the community of intertidal free-living marine nematodes. Marine Biology: International Journal on Life in Oceans and Coastal Waters, 157(8), 1741-1753. doi: 10.1007/s00227-010-1447-z. Retrieved from: http://escholarship.org/uc/item/6qp3406w
GIZ, 2012: Socio-Economic Baseline for the REDD+ Project Sites in Southern Leyte, Philippines. Deutsche Gesellschaft für Internationale Zusammenarbeit (GIZ) GmbH, November 2011.
Goeltenboth, F., Milan, P.P., Margraf, J. 1999: Rainforestation Farming for Biodiversity Conservation and Rural Development in the Philippines.
Heaney, L.R. 2001: Small mammal diversity along elevational gradients in the philippines: An assessment of patterns and hypotheses [Article]. Global Ecology & Biogeography, Wiley-Blackwell.
Heaney, L.R., Heideman, P.D., Rickart, E.A., Utzurrum, R.B., Klompen, J.S.H. 1989: Elevational zonation of mammals in the central philippines. Journal of Tropical Ecology, 5(03), 259-280. doi:10.1017/S0266467400003643
Heaney, L., Regalado, J.C. Jr. 1998: Vanishing Treasures of the Philippine Rain Forest: A Comprehensive Introduction to the Biodiversity of the Philippines. Chicago: The Field Museum University of Chicago Press.
Heaney, L.R., Balete, D.S., Rickart, E.A., Utzurrum, R.C.B., Gonzales, P.C. 1999: Mammalian diversity on Mt. Isarog, a threatened center of endemism on southern Luzon Island, Philippines. Fieldiana Zool., n.s. 95, 1–62.
Hines, J.E. 2006: PRESENCE2- Softwares to estimate patch occupancy and related parameters. USGS-PWRC. http://www.mbr-pwrc.usgs.gov/softwares/presence.html.
The Indi Journal, 2010: The Conservationist’s Journal on Philippine Indigenous Flora. http://www.indi-journal.info/archives
IUCN, 1997: IUCN Red List of Threatened Plants (Walter & Gillett, 1998).
IUCN, 2011: IUCN Red List of Threatened Species. Version 2011.1. <www.iucnredlist.org>. Downloaded on 23 September 2011.
LaFrankie, J. 2010: Trees of Tropical Asia: An Illustrated Guide to Diversity. Black Tree Publications.
Lamprecht, H. 1989: Silviculture in the Tropics. Deutsche Gesellschaft fuer Technische Zusammenarbeit (GTZ) GmbH, Eschborn. 296 pp.
Langenberger, G. 2000: Studies on the Foothills of Mt. Pangasugan, Leyte, The Philippines. Ecology of Tropical Forest Systems Forest Vegetation.

74
Langerberger, G. 2006: Habitat Distribution of Dipterocarp species in the Leyte Cordillera: An Indicator for Species–Site Suitability in Local ReforestationPrograms. [Original Article]. Ann. For. Sci., 63, 149–156.
Langenberger, G., Martin, K., Sauerborn, J. 2006: Vascular plant species inventory of a Philippine lowland rain forest and its conservation value. Biodiversity and Conservation, 15, 1271–1301.
Lemmens, R.H.M.J., Soerianegara, I., Wong, W.C. 1995: Plant Resources of South-East Asia. Timber trees: Minor Commercial Timbers. Backhuys Publishers, Leiden. Prosea 5(2):497.
Mabberley, D.J., Pannell, C.M., Sing, A.M. 1995: Meliaceae. In Flora Malesiana ser. I, Vol. 12 (1): 1-407.
MacClain, C.R., Barry, J.P. 2010: Habitat heterogeneity, disturbance, and productivity work in concert to regulate biodiversity in deep submarine canyons. Ecology, Ecological Society of America, 964-976.
Madulid, D.A. 2000: A Review and Assessment of the Floristic Knowledge of Samar Island. Based on literature, PNH Records and Current Knowledge.
Mallari, N.A.D. 2009: Maximising the value of ecological and socio-economic data in support of conservation planning for key understorey bird species in Palawan, Philippines. Ph. D. Dissertation. Department of Environmental and Geographical Sciences. Manchester Metropolitan University. Unpublished.
Mallari, N.D., Tabaranza, B.R. Jr., Corsby, M.J. 2001: Key Conservation Sites in the Philippines. Makati City, Philippines, Bookmark, Inc.
Management Plan, 2007: Samar Island National Park. June 2006 – May 2016.
Margraf, J., Milan, P. 1996: "Ecology of Dipterocarp Forests and Its Relevance for Island Rehabilitation in Leyte, Philippines." In Dipterocarp Forest Ecosystems: Towards Sustainable Management, edited by Andreas Schulte and Dieter Schone, 124-154. Singapore: World Scientific Publishing Co. Pte. Ltd.
McKenzie, D.I., Nichols, J.D., Lachman, G.B., Droege, S., Royle, J.A., Langtimm, C.A. 2002: Estimating site occupancy rates when detection probabilities are less than one. Ecology, 83(8), 2248–2255.
National Mapping and Resource Information Authority, 1988: Vegetation Map of Samar Island (Nos. 2520, 2525) Interpreted from 1987 SPOT Satellite Images by the Swedish Space Corporation in Cooperation with the Natural Resources Management Center. NAMRIA, Makati.
NewCAPP. Threats to Philippine Biodiversity. Accessed from http://www. newcapp.org
Pelser, P., Barcelona, J., Nickrent, D. 2011: Co's Digital Flora of the Philippines. http://philippineplants.org (accessed March 19, 2012).
Posa, M.R., Diesmos, A., Sodhi, N., Brooks, T. 2008: Hope for threatened tropical biodiversity: Lessons from the Philippines. BioScience (University of California Press) 58(3), 231-240.

75
Rickart, E.A., Balete, D.S., Heaney, L.R. 2007: Habitat disturbance and the ecology of small mammals in the Philippines.Journal of Environmental Science and Management, 10, 34–41.
Rickart, E.A., Heaney, L.R., Heideman, P.D., Utzurrum, R.C.B. 1993: The distribution and ecology of mammals on Leyte, Biliran, and Maripipi islands, Philippines. Fieldiana Zool., n.s. 72, 1–62.
Sales-Come, R., Hölscher, D. 2010: Variability and grouping of leaf traits in multi-species reforestation (Leyte, Philippines). Forest Ecology and Management, 260, 846-855.
Schade, J., et al. 1987: Forest resources of Region 8. Philippine-German National Forest Resources Inventory Project, Manila: Forest Management Bureau.
Seeber, G., Weidelt, H.-J., Banaag, V.S. 1985: Dendrological characters of important forest trees from eastern Mindanao, 2nd ed., Deutsche Gesellschaft für Technische Zusammenarbeit (GTZ)GmbH, Dag- Hammarskjöld-Weg1+2,Postfach 5180, D6236 Eschborn 1.
Steenis, C.G.G.J. van, 1972: The mountainflora of Java, Brill, Leiden, The Netherlands.
Tews, J., Brose, U., Grimm, V., Tielbörger, K., Wichmann, M.C., Schwager, M., Jeltsch, F. 2004: Animal species diversity driven by habitat heterogeneity/diversity: The importance of keystone structures. Journal of Biogeography, 31(1), 79-92. doi: 10.1046/j.0305-0270.2003.00994.x
Weidelt, H.J., Banaag, V.S. 1982: Aspects of Management and Silviculture of Philippine Dipterocarp Forests. Philippine-German Rain Forest Development Project, Eschborn, Germany. 302 pp.
Weller, T. 2008: Using occupancy estimation to assess the effectiveness of a regional multiple-species conservation plan: Bats in the Pacific Northwest. Biological Conservation, 141(9), 2279-2289.
Wildlife Conservation Society of the Philippines, Inc. 1997: Philippine Red Data Book: Red List of Threatened Animals. Makati City: Bookmark.


ISBN: 978-971-95451-7-0
Published by:Deutsche Gesellschaft fürInternationale Zusammenarbeit (GIZ) GmbH
Registered officesBonn and Eschborn, Germany
9th Floor PDCP Bank CentreV.A. Rufino corner L.P. Leviste Sts.Salcedo Village, Makati City, Philippines
T +63 2 651 5100F +63 2 753 1441E [email protected] www.giz.de