biodemography and perspectives of human lifespan extension leonid a. gavrilov, ph.d. natalia s....
TRANSCRIPT

Biodemography and perspectives of human lifespan
extension
Leonid A. Gavrilov, Ph.D.Natalia S. Gavrilova, Ph.D.
Center on Aging
NORC and The University of Chicago Chicago, USA

Statement of the HIDL hypothesis:
(Idea of High Initial Damage Load )
"Adult organisms already have an exceptionally high load of initial damage, which is comparable with the amount of subsequent aging-related deterioration, accumulated during the rest of the entire adult life."
Source: Gavrilov, L.A. & Gavrilova, N.S. 1991. The Biology of Life Span: A Quantitative Approach. Harwood Academic Publisher, New York.

Why should we expect high initial damage load in biological systems?
General argument:-- biological systems are formed by self-assembly without helpful external quality control.
Specific arguments:
1. Most cell divisions responsible for DNA copy-errors occur in early development leading to clonal expansion of mutations
2. Loss of telomeres is also particularly high in early-life
3. Cell cycle checkpoints are disabled in early development

Spontaneous mutant frequencies with age in heart and small
intestine
0
5
10
15
20
25
30
35
40
0 5 10 15 20 25 30 35Age (months)
Mu
tan
t fr
eq
uen
cy (
x10
-5)
Small IntestineHeart
Source: Presentation of Jan Vijg at the IABG Congress, Cambridge, 2003
Practical implications from the HIDL hypothesis:
"Even a small progress in optimizing the early-developmental processes can potentially result in a remarkable prevention of many diseases in later life, postponement of aging-related morbidity and mortality, and significant extension of healthy lifespan."
Source: Gavrilov, L.A. & Gavrilova, N.S. 1991. The Biology of Life Span: A Quantitative Approach. Harwood Academic Publisher, New York.

Month of Birth
Jan Feb Mar Apr May Jun Jul Aug Sep Oct Nov Dec
life
exp
ecta
ncy
at
age
80, y
ears
7.6
7.7
7.8
7.9
1885 Birth Cohort1891 Birth Cohort
Life Expectancy and Month of BirthData source: Social Security Death Master File
Published in:
Gavrilova, N.S., Gavrilov, L.A. Search for Predictors of Exceptional Human Longevity. In: “Living to 100 and Beyond” Monograph. The Society of Actuaries, Schaumburg, Illinois, USA, 2005, pp. 1-49.
Approach
To study “success stories” in long-term avoidance of fatal diseases (survival to 100 years) and factors correlated with this remarkable survival success

Centenarians represent the fastest growing age group in the industrialized countries
Yet, factors predicting exceptional longevity and its time trends remain to be fully understood
In this study we explored the new opportunities provided by the ongoing revolution in information technology, computer science and Internet expansion to explore early-childhood predictors of exceptional longevity Jeanne Calment
(1875-1997)

Revolution in Information Technology
What does it mean for longevity studies?
Millions of official census, birth, marriage, death and other records are available online now!

Predictors of Exceptional Longevity

Study 1
How centenarians are different from their shorter-
lived sibling?

Within-Family Study of Exceptional Longevity
Cases - 198 Centenarians born in U.S. in 1890-1893
Controls – Their own siblings
Method: Conditional logistic regression
Advantage: Allows researchers to eliminate confounding effects of between-family variation

Design of the Study

A typical image of ‘centenarian’ family in 1900
census

First-born siblings are more likely to become centenarians
(odds = 1.8)
Conditional (fixed-effects) logistic regressionN=950, Prob > chi2=0.0000
VariableOdds ratio
95% CIP-
value
First-born status
1.771.18-2.66
0.006
Male sex 0.400.28-0.58
<0.001

Birth Order and Odds to Become a Centenarian

Can the birth-order effect be a result of selective child
mortality, thus not applicable to adults?
Approach: To compare centenarians with
those siblings only who survived to adulthood (age 20)

First-born adult siblings (20+years) are more likely
to become centenarians (odds = 1.95)
Conditional (fixed-effects) logistic regressionN=797, Prob > chi2=0.0000
VariableOdds ratio
95% CIP-
value
First-born status
1.951.26-3.01
0.003
Male sex 0.460.32-0.66
<0.001

Are young fathers responsible for birth order effect?
Conditional (fixed-effects) logistic regressionN=950, Prob > chi2=0.0000
VariableOdds ratio
95% CIP-
value
Born to young father
1.860.99-3.50
0.056
Male sex 0.420.29-0.59
<0.001
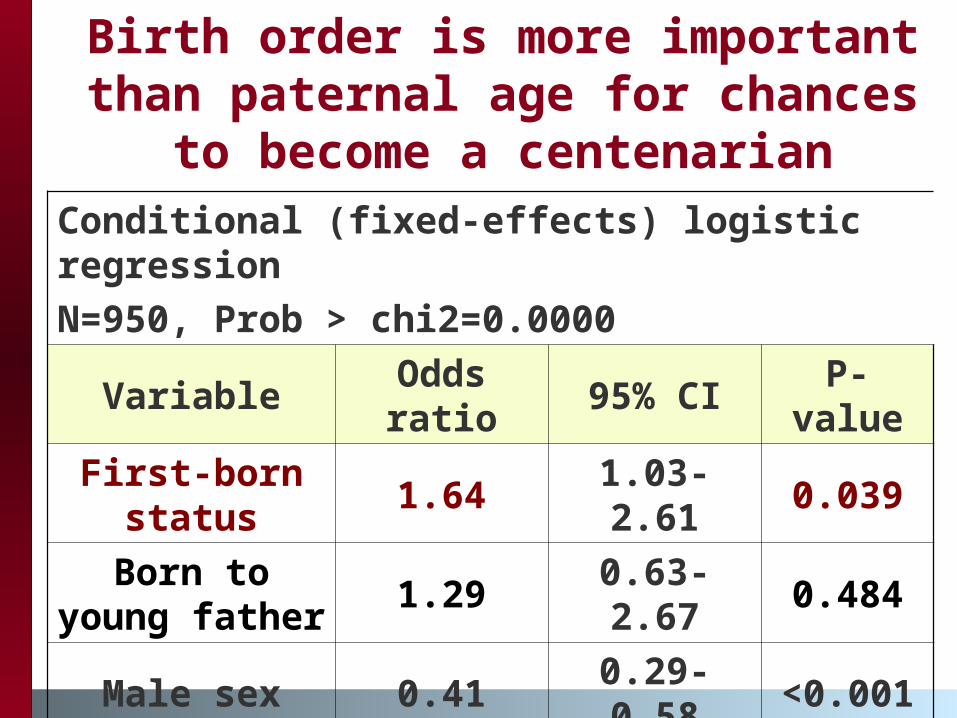
Birth order is more important than paternal age for chances
to become a centenarianConditional (fixed-effects) logistic regressionN=950, Prob > chi2=0.0000
VariableOdds ratio
95% CIP-
value
First-born status
1.641.03-2.61
0.039
Born to young father
1.290.63-2.67
0.484
Male sex 0.410.29-0.58
<0.001
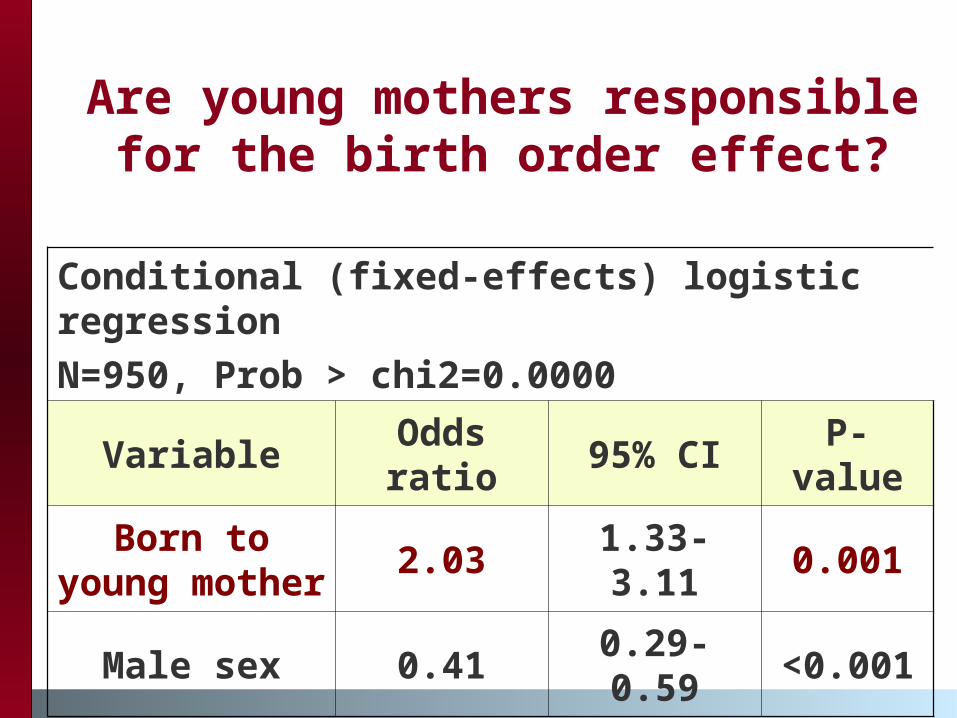
Are young mothers responsible for the birth order
effect?
Conditional (fixed-effects) logistic regressionN=950, Prob > chi2=0.0000
VariableOdds ratio
95% CIP-
value
Born to young mother
2.031.33-3.11
0.001
Male sex 0.410.29-0.59
<0.001
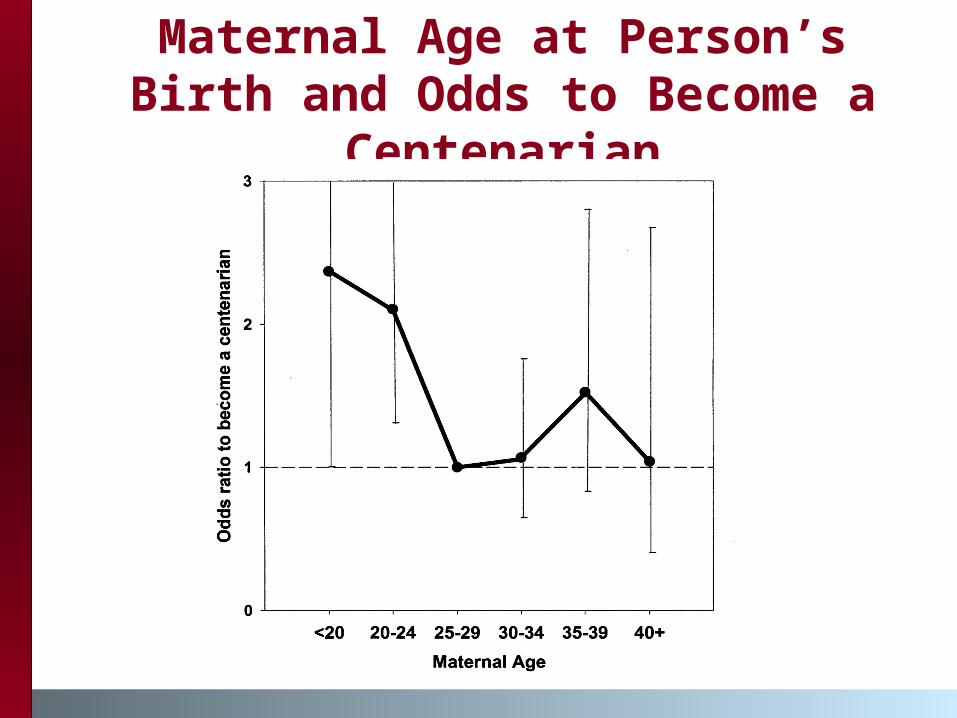
Maternal Age at Person’s Birth and Odds to Become a
Centenarian

Birth order effect explained:Being born to young mother!
Conditional (fixed-effects) logistic regressionN=950, Prob > chi2=0.0000
VariableOdds ratio
95% CIP-
value
First-born status
1.360.86-2.15
0.189
Born to young mother
1.761.09-2.85
0.021
Male sex 0.410.29-0.58
<0.001

Even at age 75 it still helps to be born to young mother (age
<25)(odds = 1.9)
Conditional (fixed-effects) logistic regressionN=557, Prob > chi2=0.0000
VariableOdds ratio
95% CIP-
value
Born to young mother
1.861.15-3.05
0.012
Male sex 0.460.31-0.69
<0.001
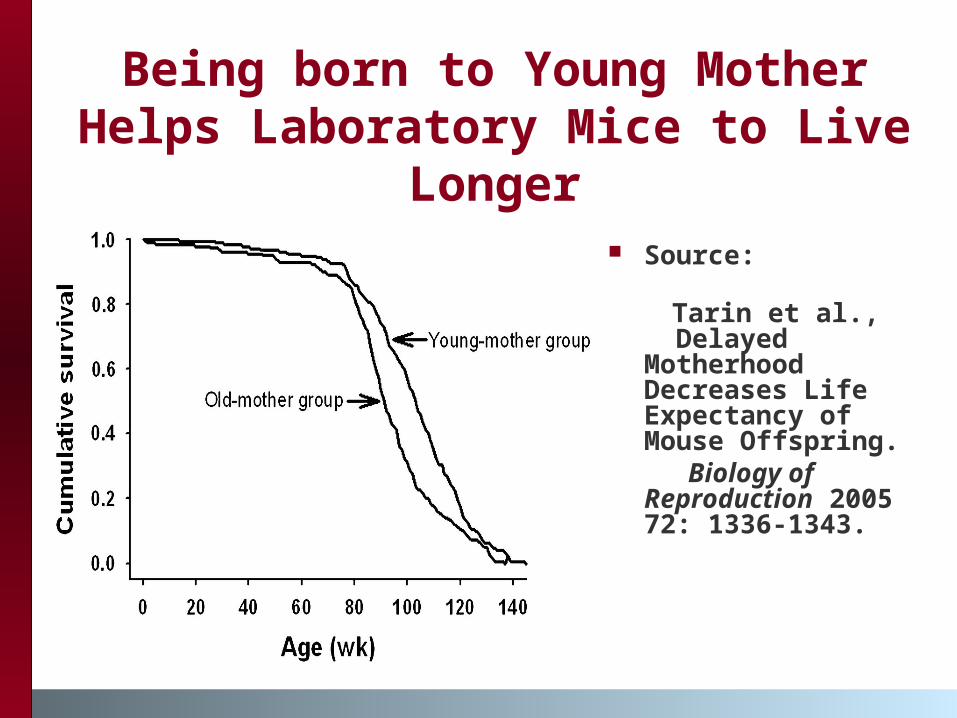
Being born to Young Mother Helps Laboratory Mice to Live
Longer Source:
Tarin et al., Delayed Motherhood Decreases Life Expectancy of Mouse Offspring.
Biology of Reproduction 2005 72: 1336-1343.

Possible explanation
These findings are consistent with the 'best eggs are used first' hypothesis suggesting that earlier formed oocytes are of better quality, and go to fertilization cycles earlier in maternal life.
Study 2
How centenarians are different from their shorter-lived peers
when compared at young adult age?

Physical Characteristics at Young Age
and Survival to 100
A study of height and build of centenarians
when they were young using WWI civil draft
registration cards

Height – What to Expect
1. Height seems to be a good indicator of nutritional status and infectious disease history in the past.
2. Historical studies showed a negative correlation between height and mortality.
3. Hence we may expect that centenarians were taller than average
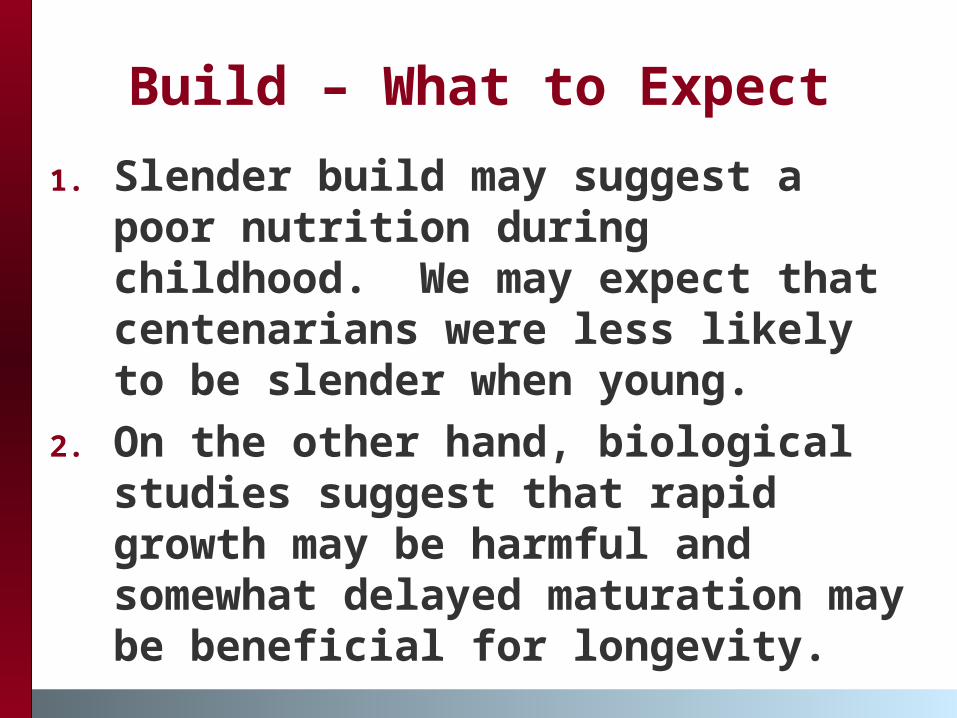
Build – What to Expect
1. Slender build may suggest a poor nutrition during childhood. We may expect that centenarians were less likely to be slender when young.
2. On the other hand, biological studies suggest that rapid growth may be harmful and somewhat delayed maturation may be beneficial for longevity.

Small Dogs Live Longer
Miller RA. Kleemeier Award Lecture: Are there genes for aging? J Gerontol Biol Sci 54A:B297–B307, 1999.
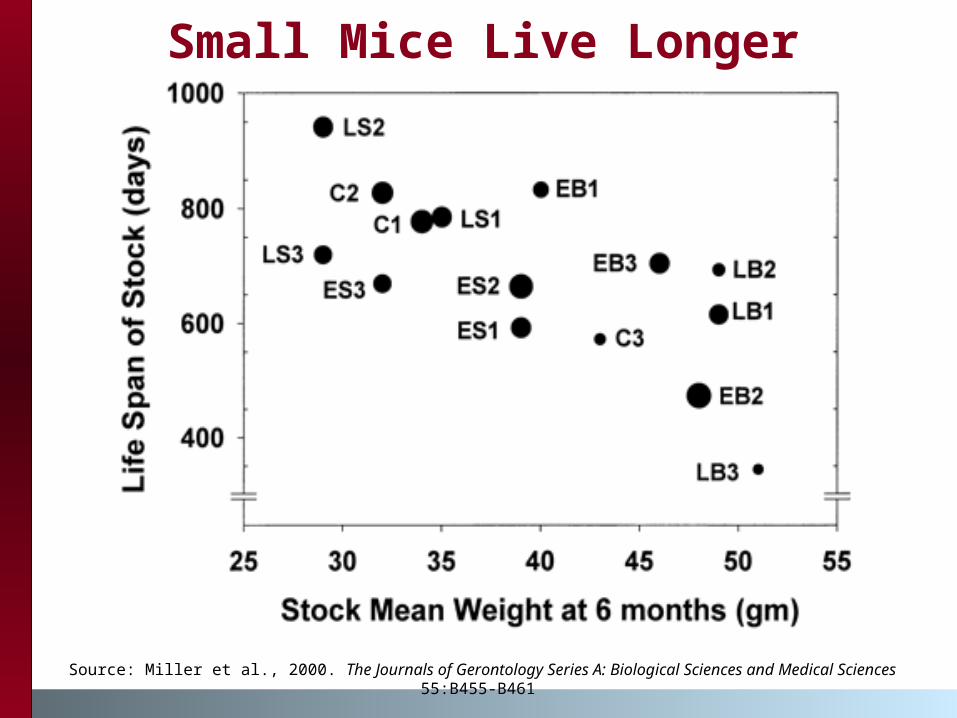
Small Mice Live Longer
Source: Miller et al., 2000. The Journals of Gerontology Series A: Biological Sciences and Medical Sciences 55:B455-B461

Design of the Study
De athw in d o w fo r
ce n te n arian s
Birthyear
Death window for controls
Controls: M ales m atched on birth year, race andcounty of registration
M ale Centenarians born in 1887(from the Social Security Adm inistration Death M aster F ile)
1887 1917-18 1987
W W I draftregistration

Data Sources
1. Social Security Administration Death Master File
2. WWI civil draft registration cards (completed for almost 100 percent men born between 1873 and 1900)

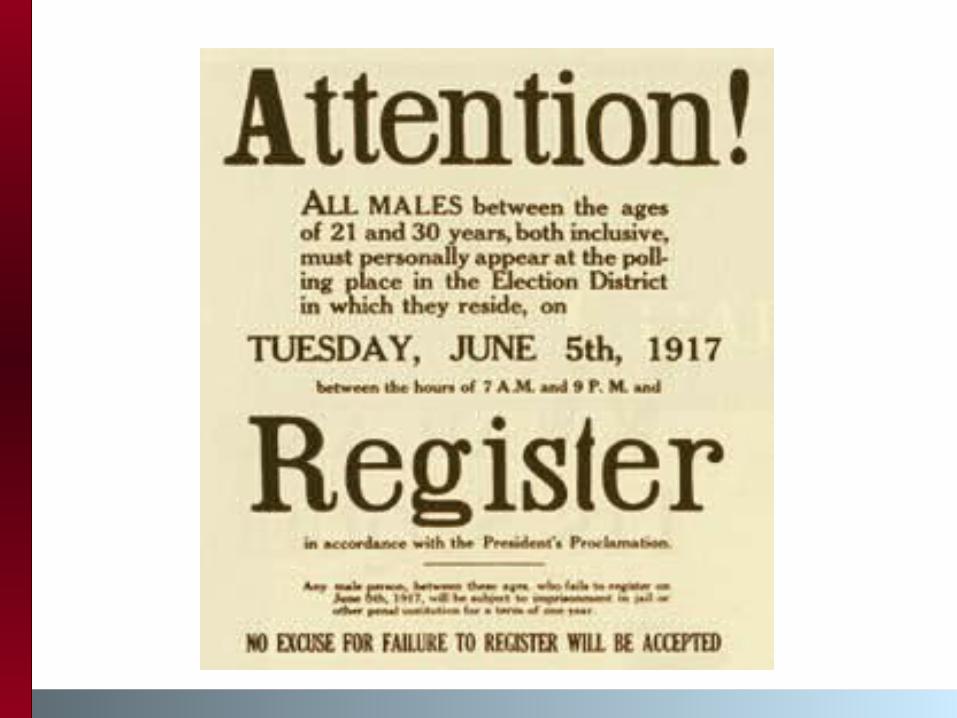
WWI Civilian Draft Registration
In 1917 and 1918, approximately 24 million men born between 1873 and 1900 completed draft registration cards. President Wilson proposed the American draft and characterized it as necessary to make "shirkers" play their part in the war. This argument won over key swing votes in Congress.

WWI Draft RegistrationRegistration was done in three parts, each designed to form a pool of men for three different military draft lotteries. During each registration, church bells, horns, or other noise makers sounded to signal the 7:00 or 7:30 opening of registration, while businesses, schools, and saloons closed to accommodate the event.

Registration Day Parade

Information Available in the Draft Registration Card
age, date of birth, race, citizenship
permanent home address occupation, employer's name height (3 categories), build (3
categories), eye color, hair color, disability

Draft Registration Card:An Example

Study Design
Cases: men centenarians born in 1887 (randomly selected from the SSA Death Master File) and linked to the WWI civil draft records. Out of 240 selected men, 15 were not eligible for draft. The linkage success for remaining records was 77.5% (174 records)
Controls: men matched on birth year, race and county of WWI civil draft registration

SAMPLE CHARACTERISTICS (%)
Centenarians
Controls
Foreign born
20.5 22.2
Married 68.4 63.7
Had children 52.6 42.1
Farmers 31.6 23.4
African Am. 5.3 5.3
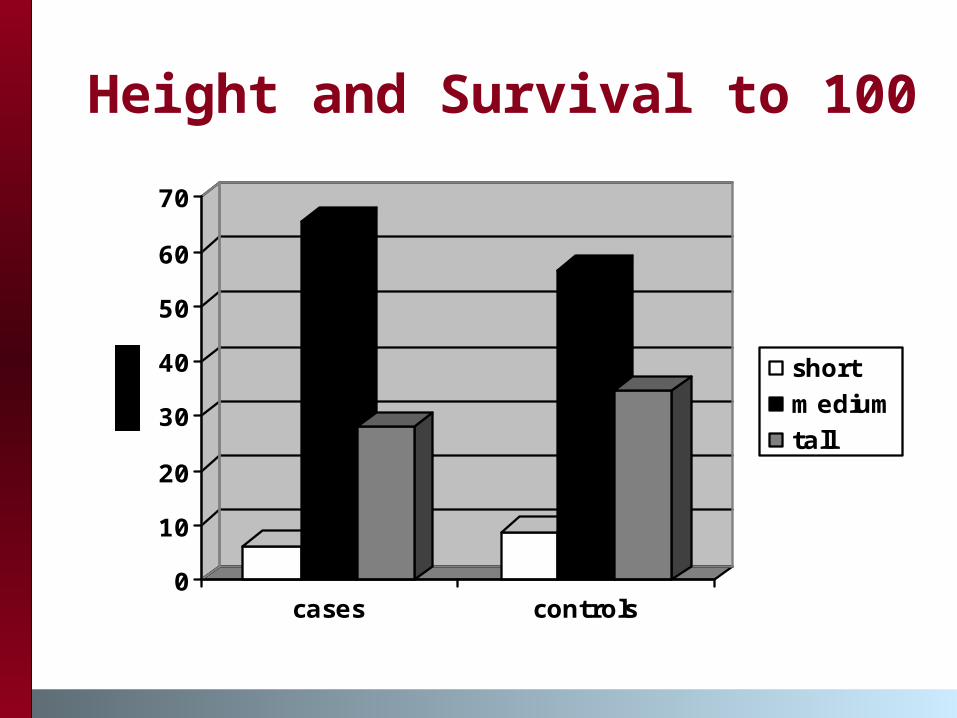
Height and Survival to 100
0
10
20
30
40
50
60
70
cases controls
shortmediumtall

Body Build and Survival to 100
0
10
20
30
40
50
60
70
cases controls
slendermediumstout

Multivariate Analysis Conditional multiple logistic
regression model for matched case-control studies to investigate the relationship between an outcome of being a case (extreme longevity) and a set of prognostic factors (height, build, occupation, marital status, number of children, immigration status)
Statistical package Stata-10, command clogit

Results of multivariate study
Variable Odds Ratio
P-value
Medium height vs short and tall height
1.35 0.260
Slender and medium build vs stout build
2.63* 0.025
Farming 2.20* 0.016
Married vs unmarried 0.68 0.268
Native born vs foreign b.
1.13 0.682

Results of multivariate study
Significant predictors only
Variable Odds Ratio
P-value
‘Slender’ body build reference: stout build
2.54 0.040
‘Medium’ body build reference: stout build
2.64 0.017
Farming 1.99 0.025

Other physical characteristics
Variable Odds Ratio
P-value
Blue eye color 1.62 0.069
‘Short’ body height reference: tall height
1.02 0.967
‘Medium’ body height reference: tall height
1.43 0.212
Other variables include body build and farming
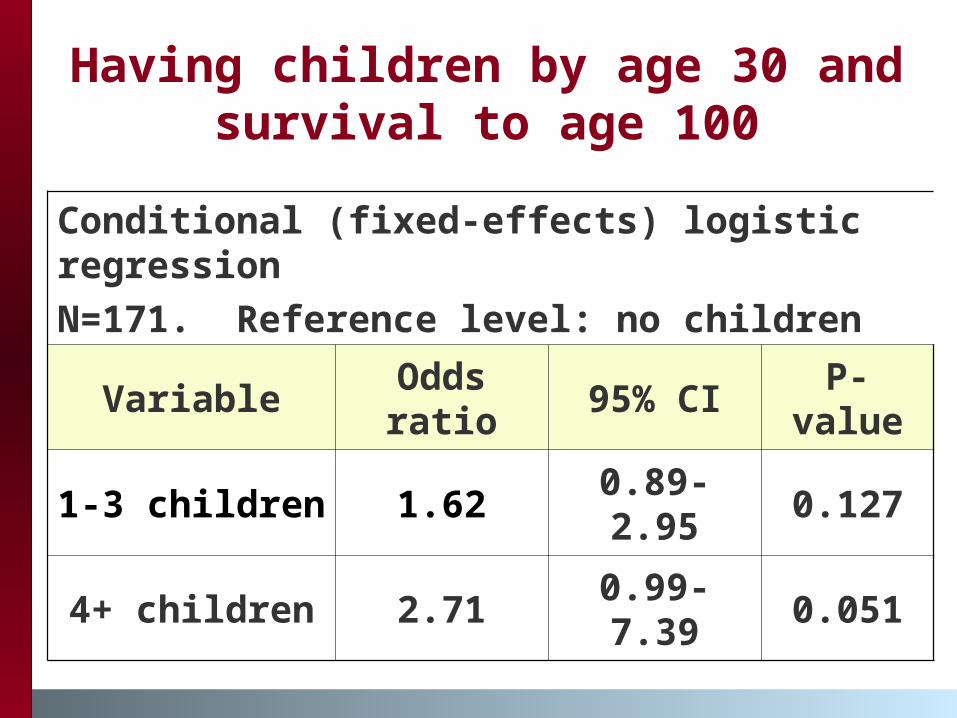
Having children by age 30 and survival to age 100
Conditional (fixed-effects) logistic regressionN=171. Reference level: no children
VariableOdds ratio
95% CIP-
value
1-3 children 1.620.89-2.95
0.127
4+ children 2.710.99-7.39
0.051
Conclusion
The study of height and build among men born in 1887 suggests that rapid growth and overweight at young adult age (30 years) might be harmful for attaining longevity

Conclusion
The study of height and body build among men born in 1887 suggests that obesity at young adult age (30 years) has strong long-lasting effect in preventing longevity

Other Conclusions
Both farming and having large number of children (4+) at age 30 significantly increased the chances of exceptional longevity by 100-200%. The effects of immigration status, marital status, and body height on longevity were less important, and they were statistically insignificant in the studied data set.

The Ongoing Project
Data for 15,031 female centenarians and 5,383 male centenarians born in 1891-1895 with known genealogies were identified for further validation. These centenarians will be compared to their peers born in the same birth year window and survived to only 70 years.

AcknowledgmentsThis study was made possible thanks to:
generous support from the National Institute on Aging and
the Society of Actuaries

For More Information and Updates Please Visit Our Scientific and Educational
Website on Human Longevity:
http://longevity-science.org
And Please Post Your Comments at our Scientific Discussion Blog:
http://longevity-science.blogspot.com/

Multivariate Analysis:Conditional logistic
regression
For 1:1 matched study, the conditional likelihood is given by:
Where xi1 and xi0 are vectors representing the prognostic factors for the case and control, respectively, of the ith matched set.
101 ))(exp(1( i
ii xx

Final Conclusion
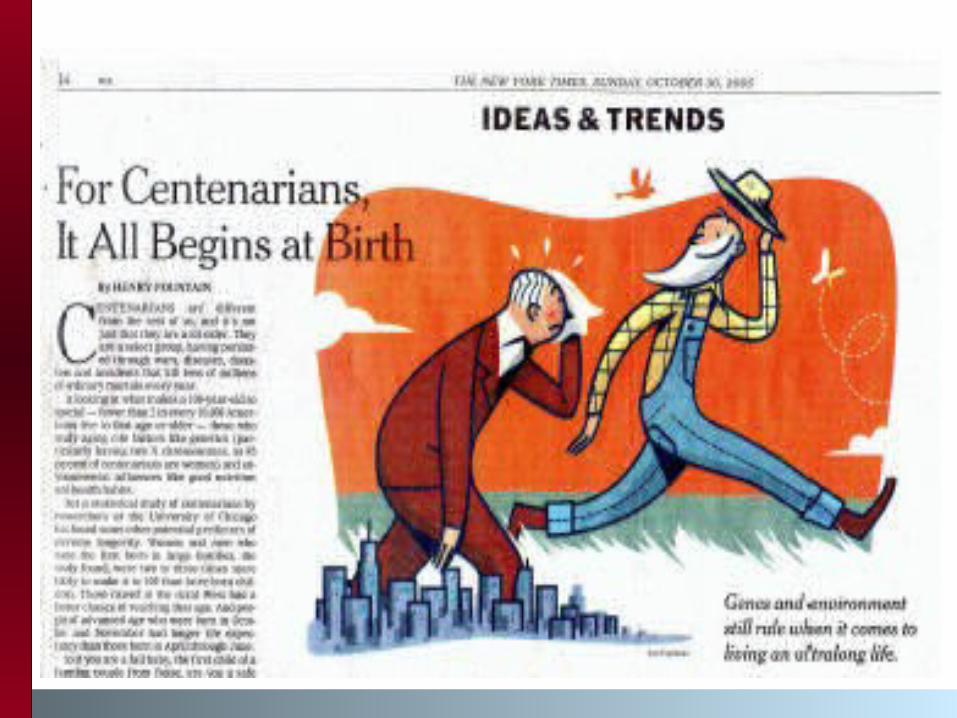
The shortest conclusion was suggested in the title of the New York Times article about this study