biocultural diversit y of urban green...
TRANSCRIPT

Report MS21:
BIOCULTURAL DIVERSITY OF URBAN GREEN SPACES IN EUROPEAN CITIES
Internal project report on the assessment of BCD in
European city regions
Work package 2: Assessment of biocultural diversity Partners involved: TUB (lead), UBER, all ULL cities & partners (UNIBA, TUB, FCRA, UL, SLU,
PROFIN)
Researchers: Ingo Kowarik, Leonie K. Fischer, Alexandra Botzat, Jasmin Honold, Janosch
Marder, Daniel Brinkmeyer (all TUB), Dagmar Haase, Nadja Kabisch (both
UBER), Tim Delshammar, Anders Busse Nielsen (both SLU), Alexander van der
Jagt, Duncan Ray (both FCRA), Mojca Nastran, Špela Železnikar, Rozalija
Cvejić, Klemen Eler, Marina Pintar (all UL), Raffaele Lafortezza, Giovanni
Sanesi, Yole DeBellis (all UNIBA), Angela Redavid, Angela Scianatico (both
PROFIN)
Description: The report outlines the assessment of biocultural diversity in Europe on
different scales as part of the EU FP7 (ENV.2013.6.2-5-603567) GREEN SURGE
project (2013-2017)
Primary authors of report:
Leonie K. Fischer, Ingo Kowarik, Alexandra Botzat, Jasmin Honold (all TUB,
Germany); Dagmar Haase, Nadja Kabisch (both UBER, Germany)
Version 1 • Oct 31st 2015

BIOCULTURAL DIVERSITY OF URBAN GREEN SPACES IN EUROPEAN CITIES • WP2 • Page 2
TABLE OF CONTENTS
1 Introduction 6
1.1 Main content of Milestone 21 6
1.2 Link to the conceptual biocultural diversity framework (WP2, task 2.1) 6
1.3 Links of task 2.2 to ULL cities and other European case study cities 8
1.4 Links of task 2.2 to other WPs and links to partners 8
2 Assessment of biocultural diversity of green spaces in European city regions 10
2.1 Conceptual approach 10
2.1.1 Research level 1: Assessment of BCD via literature review 10
2.1.2 Research level 2: Assessment of BCD via spatial analyses 10
2.1.3 Research level 3: Assessment of BCD via field survey in five ULL cities 10
3 Methods & results 11
3.1 Assessment of BCD via literature review 11
3.1.1 Methods 12
3.1.2 Results 13
3.1.3 Discussion 17
3.2 Assessment of BCD via spatial analyses 18
3.2.1 Methods 18
3.2.2 Results 20
3.3 Assessment of BCD via field survey in five ULL cities 26
3.3.1 Methods 26
3.3.2 Sample details and first results 33
4 Conclusion 35
5 Acknowledgements 37

BIOCULTURAL DIVERSITY OF URBAN GREEN SPACES IN EUROPEAN CITIES • WP2 • Page 3
6 References 38
7 Appendix 40

BIOCULTURAL DIVERSITY OF URBAN GREEN SPACES IN EUROPEAN CITIES • WP2 • Page 4
LIST OF ABBREVIATIONS
Abbreviations
BCD Biocultural diversity
BD level Biodiversity level
D Deliverable
DOW Description of work
EU European Union
GIS Geographic information system
MS Milestone
UGI Urban green infrastructure
ULL Urban Learning Lab
WP Work package
BIOCULTURAL DIVERSITY OF URBAN GREEN SPACES IN EUROPEAN CITIES • WP2 • Page 5
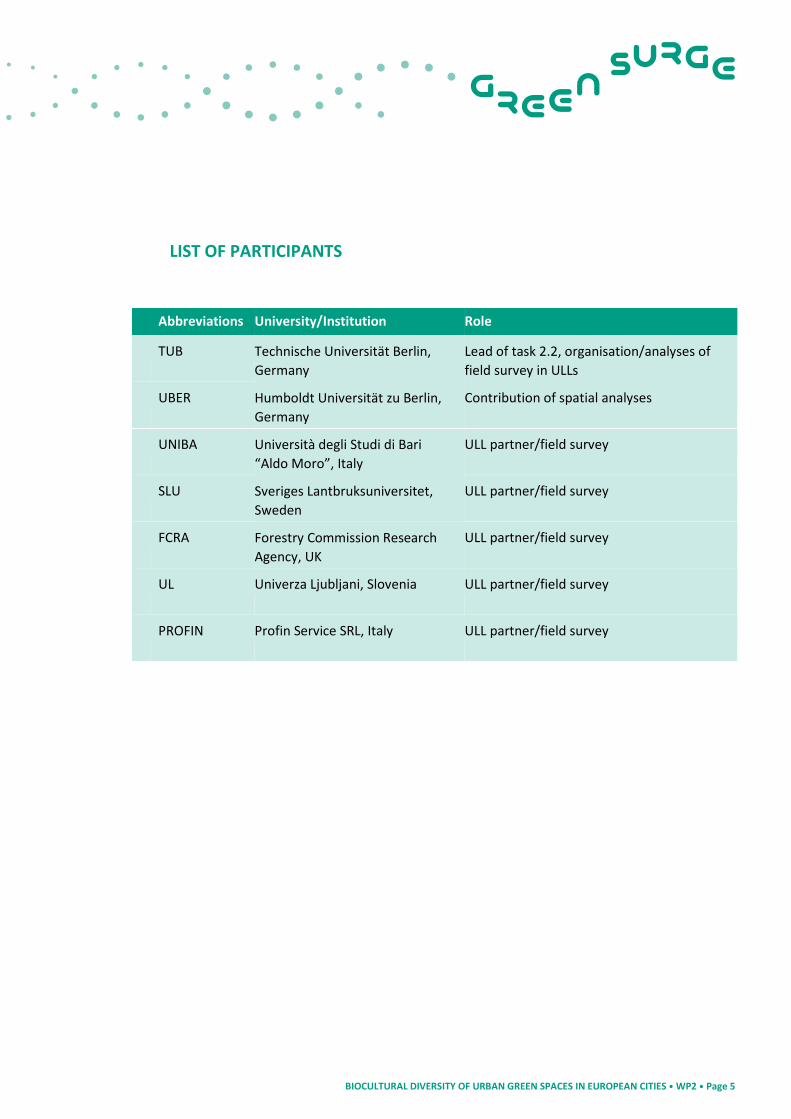
LIST OF PARTICIPANTS
Abbreviations University/Institution Role
TUB Technische Universität Berlin,
Germany
Lead of task 2.2, organisation/analyses of
field survey in ULLs
UBER Humboldt Universität zu Berlin,
Germany
Contribution of spatial analyses
UNIBA Università degli Studi di Bari
“Aldo Moro”, Italy
ULL partner/field survey
SLU Sveriges Lantbruksuniversitet,
Sweden
ULL partner/field survey
FCRA Forestry Commission Research
Agency, UK
ULL partner/field survey
UL Univerza Ljubljani, Slovenia ULL partner/field survey
PROFIN Profin Service SRL, Italy ULL partner/field survey

BIOCULTURAL DIVERSITY OF URBAN GREEN SPACES IN EUROPEAN CITIES • WP2 • Page 6
1 INTRODUCTION
1.1 Main content of Milestone 21
As described in the Description of work (DOW), this Milestone (MS) reports on the outcomes from task 2.2 in Work package (WP) 2: "By using the conceptual framework developed in Task 2.1,
this task will assess BCD [biocultural diversity] related to different types of green spaces across
European cities. It will quantify green space components and assess BCD in terms of residents with
different cultural backgrounds and socio-economic situations living in different parts of the city
(differing in quality and quantity of green space)." We thus assessed the BCD and their relationship with different types of green spaces and components of green infrastructure on three subsequent research levels:
• Research level 1: Assessment of BCD at a European level through a review of peer-reviewed papers on
the perception and valuation of biodiversity in urban green spaces.
• Research level 2: Assessment of BCD via spatial analyses of pan-European GIS data and a comparison
of spatial data between the ULL (Urban Learning Lab) cities including Bari, Berlin, Edinburgh, Ljubljana
and Malmö, and Łódź as an extra case representing an eastern European city.
• Research level 3: Assessment of BCD via a field survey that was conducted in five ULL cities on how
people with different social and cultural backgrounds perceive, value and interact with biodiversity in
urban green spaces.
Research level 1 and 2 refer to a range of European cities, including the 15 case study cities and ULL cities; the field survey of research level 3 was conducted in the ULL cities. The ULL cities are those European cities that “provide a platform for an iterative implementation and testing process
for UGI [urban green infrastructure] and promotion of BCD” (see DOW, description WP7, p. 29 and Smith et al. 2015, p. 5). We here present the overall conceptual approach for all three subsequent stages and how these are interconnected. For points (1) and (2) we document our research questions, give insights in our methods and present results. For point (3) we point out the research questions, explain the methodological approach and give an outlook on the samples. The results will be presented and discussed in the Deliverable 2.2 (D2.2) that is due in December 2015.
1.2 Link to the conceptual biocultural diversity framework (WP2, task 2.1)
The conceptual framework on BCD as given in MS20 (Vierikko et al. 2014) and D2.1 (Vierikko et al. 2015) served as a basis for the first steps taken in task 2.2: Task 2.1 developed a framework on how people in urban areas relate to urban nature and urban biodiversity. This includes how people with different cultural, socio-demographic and economic backgrounds perceive, value,

BIOCULTURAL DIVERSITY OF URBAN GREEN SPACES IN EUROPEAN CITIES • WP2 • Page 7
use or interact with urban green, e.g. by everyday practices. Also, task 2.1 laid the foundation on how to define BCD for the urban context within the Green Surge project. Vierikko et al. (2015) define urban BCD as “… a relatively recent concept emphasizing the links between biological
diversity and cultural diversity in cities or city regions. Biodiversity describes the species richness of
plant and animal species on different levels (genetic, species and habitat level). Cultural diversity
describes the variety of values, beliefs and ideas, and associated practices of different social groups.
Examples of links between biological diversity and cultural diversity in an urban setting are: urban
agricultural practices and their impact on biodiversity, distinct cultural groups and their specific
uses of urban green spaces, derelict industrial sites referring to historical cultural practices and the
biodiversity that these sites host.” (p. 56) In this task 2.2, we thus focus on the relationship between different social and cultural groups (derived, e.g. by proxies such as age structure, migration background; for a definition of cultural groups see Vierikko et al. 2015, p. 16) and different aspects of urban green space components and/or urban biodiversity at different levels. This work is part of the value research phase (Fig. 1, boxes in green; see Vierikko et al. 2015) within WP2.
Figure 1: Different research phases and methodological approaches for multi-scale BCD studies in the Green Surge project. Close collaboration with stakeholders in ULL and other cities is crucial to develop a typology and potential indicators for BCD in the urban context (from Vierikko et al. 2015, p. 21).

BIOCULTURAL DIVERSITY OF URBAN GREEN SPACES IN EUROPEAN CITIES • WP2 • Page 8
To ensure transparency and to include feedback, the concept was regularly discussed with the partners of WP2, the ULL colleagues and with other WPs face-to-face (kick-off meeting in Copenhagen in December 2013; Berlin meeting on WP2 in March 2014; Project General Assembly in Edinburgh in November 2014; Project Management Group meeting in Berlin in June 2015) and via Skype (e.g. ULL Skype meetings in March, August 2015). The concept for this task was first described officially in MS20 as part of the “first Pillar – Research on culturally significant biodiversity” (Vierikko et al. 2014, p. 13, point 4.1, second paragraph; contribution by TUB). The main research question was published in D2.1 (Vierikko et al. 2015, p. 15, point 2.1.1, second bullet point; contribution by TUB): “Do varying levels of biodiversity (…) affect human
perception, valuation of, and interaction with green spaces among different cultural groups,
between types of green spaces or between cities?“
1.3 Links of task 2.2 to ULL cities and other European case study cities
There are several connections of task 2.2 in WP2 to the ULL and the European case study cities: As given in the DOW, the assessment of BCD focused on Europe in all three research levels. Thus, Europe was set as a geographic basis for conducting the BCD assessment by means of a literature review (research level 1). Similarly, the spatial analyses (research level 2) were performed for all ULL cities and for a selection of the European case study cities. Finally, the field survey (research level 3) was conducted within all five ULL cities. Secondly, to work in accordance with the “double helix” approach, that is, connecting research and practical application in this European Union (EU) project, and especially through the work within the ULL cities, we aimed for outcomes of all three research levels that are easy to disseminate to practitioners and people who work in planning issues. The three research levels aimed to assess BCD from different angles: (a) the assessment via the literature review aggregates existing knowledge of researchers at the European level and defines knowledge gaps; (b) the assessment via spatial analyses combines data sets from the field of urban planning and geography; (c) the assessment via the field survey includes subjective perspectives of the urban population in a first step. In a second step, we aim at interconnecting the outcomes of the field survey and at reflecting them with all partners in the ULL cities. Thus, the outcomes of task 2.2 contribute to “innovative strategies for UGI planning in the ULL cities and beyond” (citation from WP diagram, see Green Surge website).
1.4 Links of task 2.2 to other WPs and links to partners
WP2, task 2.2, is strongly connected to the ULL cities and consequently also to WP7. Also, we included the topic “health” in the field survey (research level 3), which enables us to engage with WP3 that aims to determine benefits of UGI with their analyses (e.g. health issues). More of this

BIOCULTURAL DIVERSITY OF URBAN GREEN SPACES IN EUROPEAN CITIES • WP2 • Page 9
will be reported in WP3’s Deliverable D3.2: Report and factsheet about functional linkages between urban green space, BCD, human health and social cohesion (to be submitted in December 2015).

BIOCULTURAL DIVERSITY OF URBAN GREEN SPACES IN EUROPEAN CITIES • WP2 • Page 10
2 ASSESSMENT OF BIOCULTURAL DIVERSITY OF GREEN SPACES IN EUROPEAN CITY REGIONS
2.1 Conceptual approach
2.1.1 Research level 1: Assessment of BCD via literature review
This first level of assessment of BCD of green spaces in European city regions was set up as literature review of studies from both natural and social sciences (Fig. 2). It included studies on (i) the perception and valuation of biodiversity in different types of UGI components and (ii) the consideration of the cultural diversity of urban dwellers. The review was organised as an extensive desktop study and conducted by TUB.
2.1.2 Research level 2: Assessment of BCD via spatial analyses
Following the literature review, the aim of research level 2, BCD assessments via spatial data, was to combine different spatial data sets to find out the interaction between urban green space components and characteristics of the population (proxies for structures, socio-demographic/ cultural characteristics). The assessment was designed as a desktop study with spatial data from different European cities, and is a contribution by UBER. The concept was elaborated by UBER and TUB.
2.1.3 Research level 3: Assessment of BCD via field survey in five ULL cities
For research level 3, we aimed to conduct a comparative assessment of BCD in all five ULL cities at a more detailed level. We focused on exploring the relationships between different levels of biodiversity in four ubiquitous components of UGI and people with different socio-economic and cultural backgrounds. For this, we designed a field survey that combined techniques of both the natural sciences (biodiversity/vegetation assessment) and social sciences (quantitative interviews), especially the area of environmental psychology. The transdisciplinary fieldwork was conducted together with the ULL partners of WP7; it was designed and led by TUB.
Figure 2: Conceptual graph to illustrate the multi-level approach of task 2.2, comprising assessments of BCD at different research levels (level 1: literature review, level 2: spatial analyses, level 3: field survey).

BIOCULTURAL DIVERSITY OF URBAN GREEN SPACES IN EUROPEAN CITIES • WP2 • Page 11
3 METHODS & RESULTS
3.1 Assessment of BCD via literature review
This part describes the methods and first results of a literature review on the perception and valuation of biodiversity in urban green spaces. The analyses include (i) the geographical range of the studies, (ii) the different types of UGI, (iii) the coverage of different biodiversity levels (BD levels) and (iv) the cultural diversity of urban people. To disseminate the knowledge gained with this analysis, we already submitted a manuscript on a detailed review on this topic at a global scale (Botzat et al. under review; see text box below for a summary). The main results regarding the European context are reported here.
Short summary of the systematic review on how people perceive and value urban biodiversity at a global scale (Botzat et al. under review):
Recent research has emphasised the role that “urban nature” plays in delivering ecosystem services
and enhancing human wellbeing. Yet, which level of biodiversity (from ecosystems to genes) matters
to which socio-cultural groups of urban residents remains unresolved. With the intention to supply
planners and policymakers with a knowledge foundation on how to address both human wellbeing
and biodiversity conservation in cities, we reviewed the international peer-reviewed literature (200
studies) on how people perceive and value urban biodiversity. We found that the studies are not
equally distributed across (1) geographic and climatic zones, (2) different UGI types, (3) BD levels
(from ecosystems to genes), and (4) do not represent the cultural diversity of cities. Instead, they
mainly focus on temperate climates, formal UGI types like parks and forests, address biodiversity
commonly at the ecosystem level and target convenient samples of the urban population like UGI
visitors or university students. Our findings indicate that the people-biodiversity interface in cities is
largely understudied at a level that is detailed enough to approach both biological and cultural
diversity in planning and policymaking. Further research is needed in order to link strategies that
address human wellbeing and biodiversity conservation simultaneously.
Background
Recently the evidence has mounted that urban green spaces contribute largely to the liveability of cities by providing various ecosystem services and benefits such as physical health, psychological wellbeing and social cohesion (Elmqvist et al. 2013, Keniger et al. 2013, Haase et al. 2014, Kabisch et al. 2015, Shanahan et al. 2015). However, urban green spaces often differ in their spatial distribution and also qualitatively in terms of structural diversity and species richness (Strohbach et al. 2009, Shanahan et al. 2014). This might result in unequal access to the services and benefits mentioned above (Fuller et al. 2007, Stigsdotter and Grahn 2011). Yet, even if urban green spaces were available and accessible to all, only a portion of the urban population regularly uses these spaces and visitation frequency is strongly shaped by gender, age, park characteristics, cultural backgrounds, preferences and socio-economics (Lin et al. 2014, Shan 2014, Shanahan et al. 2015). Up until now, hardly any studies consider the question of which BD level (from ecosystems to genes) benefits which socio-cultural groups of the urban population. Such information would assist policy makers and urban planners in decision making. We thus

BIOCULTURAL DIVERSITY OF URBAN GREEN SPACES IN EUROPEAN CITIES • WP2 • Page 12
reviewed the scientific literature on the perception and valuation of biodiversity in European cities. Specifically we explored the following questions:
• How are the studies on perception and valuation of urban biodiversity distributed geographically
across Europe?
• Which types of UGI are examined?
• Which levels of biodiversity are researched—from ecosystems to genes?
• How is the cultural diversity of the European urban population represented in the studies?
3.1.1 Methods
We conducted a comprehensive and quantitative literature review and systematically analysed 85 papers that represent the current state of the academic literature on perception and valuation of biodiversity in European cities. Data collection
We searched the electronic database ISI Web of Science (Core Collection) for international, peer-reviewed original research papers in English that were published between 1970 and November 2014. We selected a combination of relevant search terms and grouped these into three categories: (1) perception and valuation, (2) biodiversity and (3) urban green infrastructure; we used the operators AND between categories and OR within categories. Titles, abstracts and keywords were considered. The search revealed 1,739 papers, of which we checked titles and, if necessary, abstracts for relevance and geographic region and removed records that were out of scope or did not meet general inclusion criteria, which resulted in 73 European studies. We also examined reference lists of key articles leading to 12 additional studies, which we included. These 85 papers were analysed using assessment criteria in the form of questions such as “In which European country was the study located?” in order to extract information on the (1) geographic study location, (2) UGI type, (3) BD level (from ecosystems to genes) and (4) cultural diversity. In this and in research level 3 (field survey) we needed to come up with a definition of Europe that serves as a basis for including (a) the cultural character of European people and (b) all vegetation types that are defined for Europe. We therefore define Europe as the region including those countries of the European continent that are members of the EU. We excluded non-continental and overseas territories of European member states (EU 2015). We included countries of mainland Europe as parts of the region Europe (UN 2014) that are no EU member states (e.g. Andorra, Bosnia-Herzegovina, Serbia, Kosovo, Norway, Switzerland) but that are part of Europe as defined in the World Geographical Scheme for recording plant distributions (e.g. including the regions of Russia that lie west of the Ural, but excluding Crimea) (Brummit 2001). Biodiversity levels
We assessed the 85 studies on perception and valuation of biodiversity in European cities in terms of the BD levels originating from the Convention on Biological Diversity—from ecosystems to genes—and included two additional levels: ‘green vs. grey’ and species traits, as they were commonly addressed in the studies (Tab. 1).

BIOCULTURAL DIVERSITY OF URBAN GREEN SPACES IN EUROPEAN CITIES • WP2 • Page 13
Table 1. BD levels used to categorise the studies on perception and valuation of biodiversity UGI components in European cities as well as number of studies per BD level.
Biodiversity level Description Number of studies
1 Green vs. grey natural vs. non-natural, i.e. vegetated vs.
non-vegetated urban settings such as
vegetation vs. concrete
14
2 Ecosystems spatially definite urban green spaces, e.g.
parks, forests, green roofs, plus
structurally defined areas, e.g. open parts
vs. densely vegetated parts within specific
urban green spaces
72
3 Species
communities
species assemblages or richness 28
4 Single species single species, e.g. key species 5
5 Traits traits of species or communities, e.g.
colour
2
6 Genes genetic diversity, e.g. cultural varieties or
regional seed sources
0
3.1.2 Results
General
The literature review on how people perceive and value urban biodiversity in European cities identified a number of knowledge gaps:
(a) Biodiversity as a term is often mentioned in scientific studies, but • The term is frequently used interchangeably with “nature” making it unclear which
elements and levels of biodiversity are referred to. • Variables used to measure perception and valuation of biodiversity predominantly
assess vegetation structure at the ecosystem level. • Clear evidence from finer scales like the species community or gene level is lacking;
single studies indicate that biodiversity matters, but results are controversial. • Variables are rarely related to ecological indicators of biodiversity such as species
richness. (b) Interviews are often conducted in-situ and thus relate to local BD levels. However,
people’s valuation may be influenced by the familiarity of the UGI component they are interviewed in.
(c) Studies are usually conducted in one single UGI type (e.g. park) or in one common vegetation type such as grassland in parks; the study sites are often formally planned areas designed for recreation as opposed to informal UGI components such as wastelands or roadsides.
(d) Respondents are often residents or green space visitors who may be relatively familiar with the green spaces in their neighbourhood; or they are experts who are compared to lay people, or they are university students.

BIOCULTURAL DIVERSITY OF URBAN GREEN SPACES IN EUROPEAN CITIES • WP2 • Page 14
(e) Studies mainly focus on one city with few examples comparing different cities.
Geographical spread across Europe
Most studies on the perception and valuation of urban biodiversity originate from the UK (22.4%; Fig. 3), followed by Sweden (12.9%), Germany (10.6%), Switzerland (9.4%), Finland, Italy and Spain (8.2% each). Countries from eastern Europe are clearly underrepresented—the only studies we found stem from Poland (1.2%).
Figure 3: Geographic distribution of the reviewed studies on the perception or valuation of urban biodiversity per European country (n = 85). Four studies were conducted in various locations.
Urban green infrastructure types
The majority of the studies was conducted in or referred to urban forests (38.8%) and parks (36.5%), followed by gardens (21.2%) including private, public and botanical gardens. “Informal” green spaces, such as roadsides (5.9%), wastelands (4.7%), riverine and wetland ecosystems as well as urban agriculture (3.5% each) and green roofs (2.4%), were not commonly the focus of perception and valuation studies. Biodiversity levels
Perception and valuation of urban biodiversity was most frequently assessed at the ecosystem level and decreased from ecosystems (84.7%) to traits (2.4%); the gene level was not covered. Species communities were the focus of 32.9% of perception and valuation studies and 5.9% investigated single species; the most general level, green vs. grey, was represented by 16.5% of the studies.
Cultural diversity
(a) Population sample The most frequent population sample in terms of the degree of locality were residents (43.5%) and urban green space visitors (25.9%), while people with migration background were only the subject of 8.2% of the studies. Students (17.6%) and experts (9.4%) were common population
1
2 3
7
4
9
7
53
11
7
11
8
19
Austria
Belgium
Denmark
Finland
France
Germany
Italy
Netherlands
Norway
Poland
Serbia
Spain
Sweden
Switzerland
UK

BIOCULTURAL DIVERSITY OF URBAN GREEN SPACES IN EUROPEAN CITIES • WP2 • Page 15
samples regarding occupation and interest of survey participants. Participants were regularly divided into different age groups (24.7%) for the analysis of the data, but it was uncommon to approach specific age groups (2.4%) such as young or elderly people directly. Population samples related to health issues such as hospital patients or stressed people (1.2% each) were also rarely targeted. (b) Socio-demographics The most frequently surveyed basic socio-demographics were age (92.9%) and gender (91.8%), education (34.1%), profession (32.9%) and income and ethnicity (20% each). Household-related questions were less common, e.g. marital status and number of children at home (10.6% each). Migration-specific questions were also rare and focused on time since migration (5.9%) and whether participants belonged to the first or second generation since migration (2.4%). Linkages between UGI types, BD levels and socio-demographic variables
(a) UGI types and BD levels
Figure 4: Coverage of BD levels (green vs. grey, ecosystems, species communities, species, traits) in perception and valuation studies (n = 85) in the five most commonly researched UGI types in European cities. The sum of the number of studies per BD level and per UGI type exceeds the total number of studies because several studies focussed on more than one BD level and UGI type.
The green vs. grey BD level is covered almost equally among studies conducted in or referring to different UGI types with the exception of wastelands where no green vs. grey studies have been conducted (Fig. 4). Studies at the ecosystem BD level seem to be most prominent in forests, parks and wastelands, while studies at the species community level tend to often be conducted slightly more often in gardens, but are otherwise similarly represented across all UGI types. Studies at the single species and trait levels were only the focus of garden and roadside studies.
0%
20%
40%
60%
80%
100%
Forests
(n=41)
Parks
(n=40)
Gardens
(n=30)
Roadsides
(n=10)
Wastelands
(n=5)
Pe
rce
nta
ges
of
stu
die
s
Urban green infrastructure types
Green vs. grey (n=14)
Ecosystems (n=79)
Communities (n=26)
Species (n=5)
Traits (n=2)
Biodiversity level

BIOCULTURAL DIVERSITY OF URBAN GREEN SPACES IN EUROPEAN CITIES • WP2 • Page 16
(b) UGI types and socio-demographics
Figure 5: Coverage of socio-demographic variables (age, gender, education, profession, income, origin) in perception and valuation studies (n = 85) in the five most commonly researched UGI types in European cities. The sum of the number of studies per socio-demographic variable and UGI type exceeds the total number of studies because several studies focussed on more than one socio-demographic variable and UGI type.
Age, gender and education are similarly represented socio-demographic variables in all UGI types, while questions on the type of profession of survey participants occurred slightly more often in wasteland studies (Fig. 5). Questions on income were most frequent in roadside studies, followed by garden and forest studies, but were absent in wasteland studies. The origin of study participants was most frequently surveyed in parks, followed by forests and roadsides and was not surveyed in garden and wasteland studies.
0%
20%
40%
60%
80%
100%
Forests
(n=98)
Parks
(n=92)
Gardens
(n=47)
Roadsides
(n=19)
Wastelands
(n=12)
Per
cen
tage
of
stu
die
s
Urban green infrastructure types
Age (n=86)
Gender (n=85)
Education (n=29)
Profession (n=34)
Income (n=16)
Origin (n=18)
Socio-demographic variables

BIOCULTURAL DIVERSITY OF URBAN GREEN SPACES IN EUROPEAN CITIES • WP2 • Page 17
(c) BD levels and socio-demographics
Figure 6: Coverage of socio-demographic variables (age, gender, education, profession, income, origin) in relation to the five BD levels that are addressed in perception and valuation studies (n = 85) in UGI components in European cities. The sum of the number of studies per socio-demographic variable and per BD level exceeds the total number of studies because several studies focussed on more than one socio-demographic variable and BD level.
While age, gender, education and profession were surveyed in similar frequencies across all BD levels, income was of higher interest at the trait level than at the other BD levels (Fig. 6). Questions on the origin of study participants only occurred at the ecosystem and species community levels and to a lower extend at the green vs. grey level.
3.1.3 Discussion
Our systematic review on the perception and valuation of urban biodiversity reveals that the current literature is biased in four ways. (1) Most studies originate from Central, western and northern Europe while countries in southern and especially eastern Europe are clearly underrepresented. (2) Studies primarily concentrate on formally planned UGI components, such as forests, parks and gardens whereas informal green spaces like roadsides or wastelands are largely ignored. (3) Urban biodiversity is mainly addressed at the ecosystem level while diversity at the species community or gene levels is covered to a much lower extent. (4) Hardly any studies deal with the cultural diversity of cities by directly surveying people from different socio-economic and cultural backgrounds or specific age groups. Although the people-biodiversity interface has been repeatedly emphasised in urban studies (e.g. Grimm et al. 2008, Elmqvist et al. 2013, Haase et al. 2014, Wu 2014), our understanding of these linkages at finer scales than that of ecosystems is still limited for European cities. Further, we
0%
20%
40%
60%
80%
100%
Green vs.
grey (n=42)
Ecosystems
(n=211)
Communities
(n=77)
Species
(n=11)
Traits
(n=8)
Per
cen
tage
s o
f st
ud
ies
Biodiversity levels
Age (n=111)
Gender (n=109)
Education (n=39)
Profession (n=41)
Income (n=28)
Origin (n=21)
Socio-demographic variables

BIOCULTURAL DIVERSITY OF URBAN GREEN SPACES IN EUROPEAN CITIES • WP2 • Page 18
lack evidence on the needs and valuations of a variety of social-cultural groups for the design of more or less biodiverse green spaces. However, urban planners and policymakers need to be able to make informed decisions regarding the people-biodiversity interface. They thus need strategies on how to link biological and cultural diversity in cities, i.e. on the contribution of specific components of nature or levels of biodiversity towards benefitting the human population in general and groups with different socio-cultural backgrounds in particular. These identified critical knowledge gaps indicate opportunities for future transdisciplinary research on BCD in cities. In Deliverable 2.2 we will report with more detail on the actual results of the review on how people perceive and value biodiversity in European cities by illustrating some representative examples.
3.2 Assessment of BCD via spatial analyses
In order to get a first overview on the spatial patterns of both green infrastructure and habitat diversity on the one hand and (potential) cultural diversity on the other, a pan-European analysis has been conducted using the following proxies:
• Urban green area (within the administrative boundaries of the cities; representing open space and
mixed habitats)
• Forest area (within the administrative boundaries of the cities; representing woodland habitats)
• Population density (representing the total number of potential beneficiaries of urban green and
forest area distributed over the administrative city area), percentage of foreigners (representing the
share of residents who do not have the citizenship of the country of current usual residence regardless
of the place of birth with migration and presumably different cultural background) and age
dependency ratio (representing population being 65 years of age and older divided by population
being 25-64 years of age).
3.2.1 Methods
Both land cover data and socio-demographic data are used for calculation of statistical and GIS models. Tab. 2 summarises the data used, the respective time period and source of data. Land cover data stem from the European Urban Atlas land cover dataset (EEA). The data in the Urban Atlas refer to 299 larger urban zones, which refer to commuting zones around cities. Urban Atlas data are based on satellite images with a 2.5-m spatial resolution. It thus provides comparable land use data for all European core cities and respective larger urban zones with more than 100,000 inhabitants. The analyses in this MS focus exclusively on the core cities. Therefore, core cities were delineated using the core city layer from the Urban Audit (European Commission 2004), which refers to administrative city boundaries. A list of the cities included in the analyses is presented in the Appendix A1. Data on urban green spaces
In the Urban Atlas, 21 thematic classes, including diverse urban fabric, transportation, industrial and environmental classes, are distinguished (EEA 2011). This classification of urban land cover and land use is, thus, finer than commonly used datasets of land cover and land use. In particular, the Urban Atlas includes groups of different urban fabric classes according to density and a ‘‘land without current use’’ class, which represents brown fields. For assessments on the green

BIOCULTURAL DIVERSITY OF URBAN GREEN SPACES IN EUROPEAN CITIES • WP2 • Page 19
infrastructure, the classes “urban green areas” and “forest areas” are used. According to the definition given in the Mapping Guide for a European Urban Atlas (EEA European Commission, 2011) “urban green areas” include public green areas designated for predominantly recreational use (gardens, zoos, parks, castle parks). Not included in this definition are private gardens within housing areas, cemeteries and patches of natural vegetation enclosed by built-up areas without being managed as urban green areas. “Forest areas” include tree canopy cover of more than 30%, tree height greater than 5m and bushes and shrubs at the fringe of the forest. Also included are plantations such as Populus plantations, Christmas tree and new forest plantations. Unfortunately, the class “agricultural areas, semi-natural areas and wetlands” combines land that can potentially serve as green space (i.e. grasslands, semi-natural land) with land of low recreational value (i.e. arable land). We therefore excluded it from our analysis. We also decided not to include the Urban Atlas class 142 “sports and leisure facilities” in our definition of urban green space because the class “sports and leisure facilities” includes race courses and areas of sport compounds (e.g. football stadiums, tennis courts, golf courses), which (a) can also be covered by hard surfaces (except of golf courses) to a high degree, and (b) might not be publicly available and thus not accessible to all urban residents (they may provide other important ecosystem services, nevertheless). Both restrictions might lead to an underestimation of the per capita green space values. The Urban Atlas land use data refers to the year 2006; a follow-up version that should be based on 2012 imagery is in preparation and expected to be published in 2015.
Table 2: Data used for calculation on EU-core city and ULL scale
Source Temporal scale Source
Administrative city boundaries
2004 GISCO Urban Audit
http://ec.europa.eu/eurostat/web/gisco/geodata/r
eference-data/administrative-units-statistical-units
Demography GEO STAT Grid 2011 GISCO 2014
http://ec.europa.eu/eurostat/web/gisco/geodata/re
ference-data/population-distribution-demography
Urban green space (class urban green
areas 141 and class forest areas 30)
2006 Urban Atlas 2006
(EEA, http://www.eea.europa.eu/data-and-
maps/data/urban-atlas)
Percentage of foreigners 2008/2014 Urban Audit Data Explorer
http://ec.europa.eu/eurostat/de/data/database
Age dependency ratio 2008/2014 Urban Audit Data Explorer
http://ec.europa.eu/eurostat/de/data/database
Data on human population
For population data, a 1-km² grid dataset for the EU was used, that was produced by the ESSnet project GEOSTAT, launched in co-operation with the European Forum for GeoStatistics (EFGS 2011). For cultural data we used data for the variable “percentage of foreigners”, which were provided by the EUROSTAT Urban Audit Data Explorer. The data refer to the selection period 2008-2014 and are provided for core cities and are, thus, comparable to the Urban Atlas spatial

BIOCULTURAL DIVERSITY OF URBAN GREEN SPACES IN EUROPEAN CITIES • WP2 • Page 20
delineation (see Kabisch and Haase 2013 for a methodological comparison). We had to exclude some of the Urban Atlas cities for which no or insufficient data was available. For data on the age structure of the population we used the age dependency ratio (population being 65 years of age and older divided by population being 25-64 years of age), which was provided by the EUROSTAT Urban Audit Data Explorer.
Limitations
Land cover data is based on geographical distributive shape files, which are georeferenced and given for concrete geographic information (coordinates). Population data is based on a grid file, which gives us at least a sense of population density distribution on a 1-km² grid base. The data for percentage of foreigners and age dependency ratio are, however, only provided for a total city level. There is no geographic background except for the detail of city name and respective country. A spatial analysis linking land cover (including indicators of access to a certain green space) and the distribution of percentage of foreigners/age dependency ratio on a smaller scale is therefore not possible with these kinds of data sets. Further, it needs to be acknowledged that the land cover data from the Urban Atlas date back to 2006. Certainly, land cover values have changed in the meantime. Land cover data, thus, may not represent the current status of city land cover. However, the Urban Atlas is the only publicly available data base, which provides such detailed land cover information at the city level covering around 300 large European cities.
3.2.2 Results
Distribution of human population
Fig. 7a presents population density and percentage of foreigners in the European core cities. The population density refers to three density classes, which represent quantiles. Highest population density values can be found for cities in the UK and for some cities in Poland and in the Baltic states. Scandinavian cities but also a number of cities in southern European countries show lower values. Fig. 7b shows the distribution of the percentage of foreigners in the core cities of Europe, whereas data is not available for all cities. Low values below 3.5% are shown by eastern European countries such as Poland or the Czech Republic. High values of more than 10% can be found in northern Italy, western Germany and in southern Mediterranean cities of Spain.

BIOCULTURAL DIVERSITY OF URBAN GREEN SPACES IN EUROPEAN CITIES • WP2 • Page 21
Figure 7: (a) Population density and (b) percentage of foreigners in three classes representing quantiles of European core cities.
Age structure in European cities
Looking at the European city regions analysed, our spatial analyses shows that southern and Central European cities in Italy, some in Spain and most of the cities in Germany have a middle to high age dependency ratio meaning that the share of older people is high compared to those aged between 25 and 64 years. Cities in eastern and northern Europe such as Polish or Czech cities, Scandinavian and also British cities have a comparative young population when the age dependency ratio is concerned.
Figure 8: Age dependency ratio for European cities in the Urban Audit (2011/12).
Distribution of urban green spaces
The distribution of European cities according to per capita green space in European city regions shows a clear divide between northern and southern Europe. Northern European cities have higher value of per capita green space of more than 20m² per person while those in southern

BIOCULTURAL DIVERSITY OF URBAN GREEN SPACES IN EUROPEAN CITIES • WP2 • Page 22
European countries show comparative low values of per capita green space with values below 11m² per person.
Figure 9: Per capita green space for European cities (using Green urban areas).
Top cities in providing urban green space
When looking at specific cities, Fig. 10 shows the top 20 and bottom 20 cities according to population density and per capita green urban area. Densest cities include a range of capital cities such as Paris, Athens, Bucharest, Brussels, Lisbon or Copenhagen. Lowest density values are represented by Scandinavian cities such as Umea or Uppsala. Those Scandinavian cities also show the highest per capita green space values, whereas Mediterranean cities show the lowest values. The low population density and high per capita green space in many Scandinavian cities is due to the fact that they are very large by area. This is also true for Ljubljana.
Figure 10: Population density in the core city areas of the Urban Atlas cities (EEA 2010) shown for the bottom 20 and the top 20 cities as extreme cases, and for ULL cities. The red line shows the mean value among all cities in the sample.

BIOCULTURAL DIVERSITY OF URBAN GREEN SPACES IN EUROPEAN CITIES • WP2 • Page 23
Figure 11: Per capita green urban area in the core city areas of the Urban Atlas cities (EEA 2010) shown for the bottom 20 and the top 20 cities as extreme cases, and for ULL cities. The red line shows the mean value among all cities in the sample.
Overlap of population density and green spaces in ULL cities
In this MS we studied the ULL cities from Green Surge, which are Berlin, Malmö, Ljubljana, Edinburgh and Bari. We also studied Łódź. For a detailed ULL city description of land cover and population numbers, see Hansen et al. (2015) and Cvejić et al. (2015). Fig. 12 shows how different both provision and distribution of green urban areas and forest areas in comparison to population-distribution data can be within single European cities: in Berlin and Ljubljana, dense core areas partly overlap with green space but are predominantly surrounded by large green urban areas and forests. In contrast, the city of Bari provides rather low values of green space or forest in its administrative boundaries (based on the Urban Atlas data from 2006). Cities like Edinburgh or Malmö show larger green spaces at their western and southern peripheries, which have no overlap with population concentration.

BIOCULTURAL DIVERSITY OF URBAN GREEN SPACES IN EUROPEAN CITIES • WP2 • Page 24
Figure 12: Distribution of population as total numbers in grid cells. Presentation of urban green areas and forest areas in the ULL cities and in Łódź as a case study representing an eastern European city.
The bi-variate regression diagrams in Fig. 13 reflect the distribution of population and green space as presented in the maps in Fig. 12. Berlin has large parts of urban green in its outer parts near the city border where population density is lower. This relation is underlined by a significant R² value. In those cells with high total population numbers, lower shares of green space can be found. The same relation appears for Ljubljana and Łódź. The regression result is interesting for Bari. We found a significant, positive relationship between total population number in a grid cell and the share of urban green in the grid cells. Bari has comparatively low shares of green space but those green areas existing are situated in the city centre where most of the population lives. Again, it needs to be highlighted that land cover data are from 2006 and values may have changed in the meantime.

BIOCULTURAL DIVERSITY OF URBAN GREEN SPACES IN EUROPEAN CITIES • WP2 • Page 25
Figure 13: Linear regression between population number in grid cells and share of urban green (green urban areas and forest areas) for the ULL cities and Łódź.

BIOCULTURAL DIVERSITY OF URBAN GREEN SPACES IN EUROPEAN CITIES • WP2 • Page 26
3.3 Assessment of BCD via field survey in five ULL cities
3.3.1 Methods
In this section we report on the methodological approach of research level 3, the field survey on BCD. We give an outlook on the samples, but there are no results presented here, which will be reported in detail in D2.2. The field survey aimed at assessing how people with different social and cultural backgrounds value, perceive and interact with biodiversity in UGI components. This assessment was conducted in the five ULL cities, that is, Bari (Italy), Berlin (Germany), Edinburgh (UK), Ljubljana (Slovenia) and Malmö (Sweden). The field survey’s objective was to close important gaps in BCD assessments that were revealed by the preceding research levels. The literature review on the perception and valuation of biodiversity in UGI components (research level 1) identified severe knowledge gaps and limitations in this research field in European urban areas. For a summary, see general results in section 3.1.2. Therefore, specifications for the field survey in WP2, task 2.2, were drawn from this gap of knowledge, and resulted in the following implementations:
• To use vegetation-ecological indicators of biodiversity such as species richness • To use site-independent biodiversity stimuli and to conduct interviews in more than one
green space • To use more than one UGI type in the assessment, and to go beyond widely studied UGIs,
e.g. generate data for parks plus forests plus roadsides plus wastelands to include less frequently assessed and also novel and informal types of urban green spaces
• To use more than one vegetation type, e.g. managed grassland plus “wild” herbaceous vegetation plus “wild” forest
• To approach different human population groups in terms of their social and cultural backgrounds, including those that are largely underrepresented in relevant studies (e.g. elderly people, people with health problems or migration background)
• To include more than one European urban area to compare the above within and between different local contexts
Since the spatial analyses in research level 2 clearly suggest important inequities in terms of access to biodiversity in the studied cities we also included characteristics of the distribution of the human population and the green space distribution in the ULL cities in our experimental design. As a result, we were led by the following research questions, also illustrated by Fig. 14:
Does varying species richness affect human perception, valuation of, and interaction with green
spaces …
… between UGI types?
… between ULL cities?
… among various human population groups?

BIOCULTURAL DIVERSITY OF URBAN GREEN SPACES IN EUROPEAN CITIES • WP2 • Page 27
Figure 14: Concept and experimental design of research level 3 in WP2, task 2.2, the field survey.
Questionnaire versions and development
• We applied two media to interview respondents, a paper-and-pencil version and an online version (Unipark, QuestBack GmbH, Cologne; see Fig. 15). The paper-and-pencil version was conducted by experienced staff of the respective ULL teams and followed a standard protocol.
• The questions and stimuli material were tested in cognitive interviews with a very diverse group of people (e.g. one young person, one elderly person, one person with high, one with low education level, one with migration background) for a first revision of verbalisation, wording and the stimuli material. The questionnaire was then tested in an extensive pre-test phase in Berlin in 2014 with about 1,000 respondents in both versions. A large share of the respondents filled in the questionnaire again after a defined time period so that we could test verbalisation, wording and the stimuli material for adjustments. For the main survey in 2015, we used a revised version of the 2014 questionnaire.
• In the 2014-version of the questionnaire we incorporated the feedback of the ULL partners, of other WP2-partners who were involved in the development of the conceptual framework on BCD and of colleagues who worked on questionnaires in other WPs (ULL partners plus Arjen Buijs, Marleen Buizer, Rieke Hansen, Stephan Pauleit, Emily L. Rall, Kati Vierikko).
• It took the respondents about 10 to 15 minutes to fill out the questionnaire; this was adequately tested beforehand (pre-test) and also monitored in the records of the online versions.
• Where possible, we used a 5- or 7-point Likert scale to obtain graded responses. • All questions were kept as simple as possible to also be able to approach people with
lower education level or impeded comprehensive skills.

BIOCULTURAL DIVERSITY OF URBAN GREEN SPACES IN EUROPEAN CITIES • WP2 • Page 28
Figure 15: Screenshot of online survey in the English version in Edinburgh in 2015. The stimuli material (here: park meadow series) could be enlarged by clicking on a picture.
Data assessment: biodiversity and socio-economic parts
• The questionnaire was developed to have two parts: a first part that included questions on the perception and valuation of, and interaction with biodiversity and urban nature at a general level, and a second, socio-cultural part. The first part referred to four specific UGI types: park, forest, roadside and wasteland.
• Of the first part (biodiversity and urban nature), respondents were given a defined selection of questions regarding two of the four investigated UGI types to minimise time effort. The second part on the social and cultural backgrounds of the respondents was the same for all respondents and, e.g. contained questions on gender, age, education level and migration background.
• To cover four different UGI types (park, forest, wasteland, roadside) each respondent answered the part “Park” plus one of the other three UGI types (either “Forest”, “Wasteland” or “Roadside”). This resulted in three versions (Park-Forest, Park-Wasteland, Park-Roadside), which were randomly and evenly distributed between respondents.
• To assess how different people perceive and value varying levels of biodiversity we used country-specific, and thus regionally coherent photographic stimuli material, which was part of the biodiversity part.

BIOCULTURAL DIVERSITY OF URBAN GREEN SPACES IN EUROPEAN CITIES • WP2 • Page 29
• The questions of the socio-demographic part were partly adapted from the European social survey (ESS, Round 6 in 2012), a large academically driven cross-national social survey that has been conducted every two years across Europe since 2001 (ESS, online resource). Therefore, the questions we included provide an adaptation to the different European cultures (e.g. for the country-specific education systems), were largely tested beforehand and allowed for further evaluations of our samples such as representativeness.
Stimuli material
• For each UGI type, we presented the interviewee a set of photo collages that showed a standard situation within the respective UGI type, e.g. a meadow in a park. The photos used for the collages were taken in each ULL city to produce a local context for the respondents of each ULL in both the background and foreground of the stimuli (Fig. 16a, b). Due to limitations in the photographic raw material of some ULLs, we replaced single pictures by collages from other ULLs after checking whether the pictured vegetation assemblage was also common for the other city. Thus, with few exceptions, each ULL used a country-specific stimuli set. Each photo collage was used in three BD levels, that is, we retouched the front part of the picture and filled in three different pictures that showed three BD levels (low, medium, high), respectively (Fig. 16b). All pictures stemmed from sites that were similar in vegetation structure but differed in plant species richness (standard vegetation assessment). Pictures were taken according to a standard protocol: the stimuli material for each ULL city contained photo collages for four UGI types with three BD levels each, of which all exact species numbers and cover had previously been assessed. For roadsides we included a fourth collage that showed a situation with no vegetation at all (bare ground). See Fig. 17 as an example for the four stimuli series park, forest, wasteland and roadside in an ULL.
• Being aware that various contextual aspects may influence a respondent’s perception and valuation of stimuli material, we retrieved some general features from the literature that had to be avoided while taking the pictures (e.g. water, uneven landscape, litter, fences, people, animals). Additionally, research on the best camera settings resulted in a standard protocol on how a picture scene of the raw material (to be used in the collages) had to be set: for example, detailed instructions ensured that pictures were taken in comparable light and weather conditions (e.g. bright sunlight was avoided). Also, camera settings were mandatory, such as a specific lens height and angle of the camera, to ensure comparability between the ULL’s stimuli series. The standard protocol also included instructions to design the stimuli material as naturalistic as possible: for example, the instructions for the camera settings defined a specific focal length that corresponds to the human field of vision.
• Photographs and vegetation data were collected in late spring/early summer in 2014 for the ULLs Berlin, Ljubljana and Malmö and for the ULLs Bari and Edinburgh in 2015.

BIOCULTURAL DIVERSITY OF URBAN GREEN SPACES IN EUROPEAN CITIES • WP2 • Page 30
Figure 16: Creation of stimuli material for one ULL city, shown for the example of Berlin, park meadow, for (a) the background layer and (b) the front layer including one of the three BD levels, respectively.

BIOCULTURAL DIVERSITY OF URBAN GREEN SPACES IN EUROPEAN CITIES • WP2 • Page 31
Figure 17: Stimuli material for one ULL city (Berlin) and four UGI types (from top): parks, forests, wastelands, roadsides, in three BD levels (left to right: low, medium, high biodiversity). The latter UGI type contained a fourth picture collage that showed no vegetation around the street tree’s base.
Translation of questionnaire versions
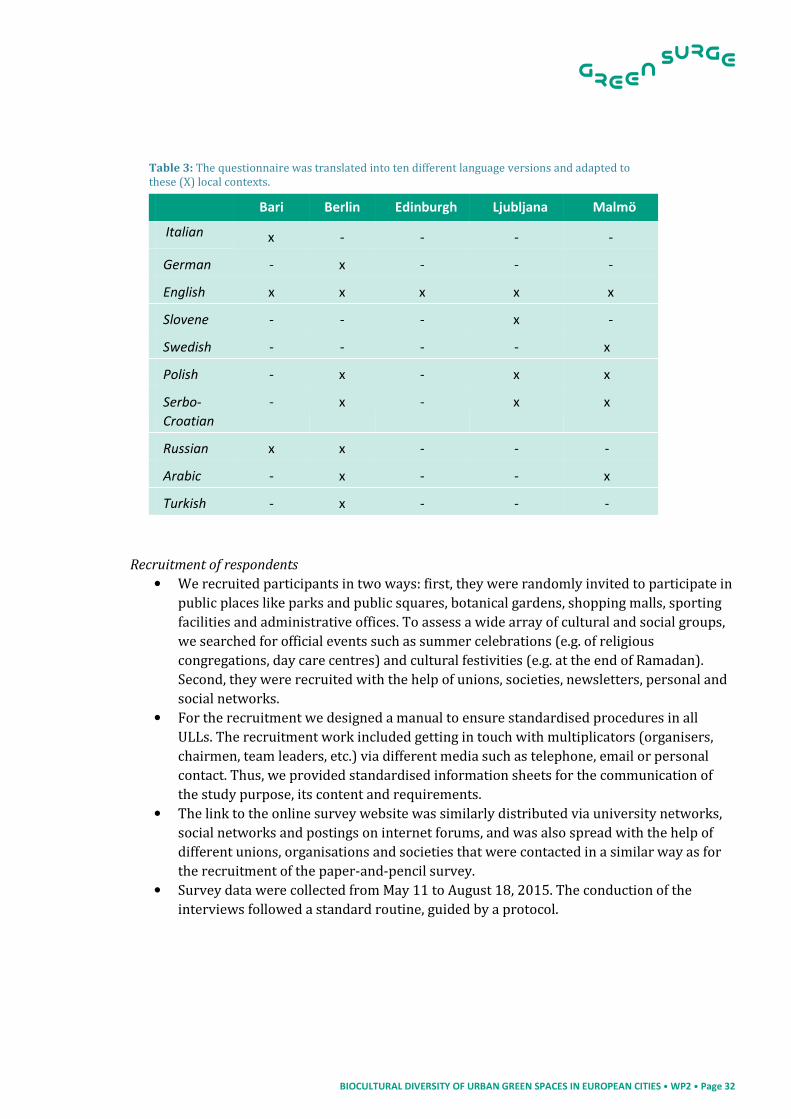
• In total, we translated the questionnaire into ten languages, to also be able to approach people with migration background that felt more confident in their native language (Tab. 3). We selected the languages that represented the major migrant groups in each ULL. We excluded those groups that had less than 1,000 individuals listed for a city in official census data. All language versions were adapted to the regional context but differed as little as possible (e.g. the Polish version for Berlin and Malmö differed exclusively in those questions with regional adaptation, e.g. to take into account that these countries have different ways of describing the levels in their educational systems). The translation was conducted by a team of a scientist (member of the core group of Green Surge) and two native speakers (for a first translation and a back-translation, which was compared to the original version). Differences in the original and the back-translation (wording, verbalisation) were discussed and adjusted by the translation team. The translation in and the back-translation from each language version strictly followed the same protocol. The translation in the ULL languages Swedish, Slovenian and Italian was conducted in the respective ULL teams, the translations to the other languages were conducted by the TUB team.
BIOCULTURAL DIVERSITY OF URBAN GREEN SPACES IN EUROPEAN CITIES • WP2 • Page 32
Table 3: The questionnaire was translated into ten different language versions and adapted to these (X) local contexts. Bari Berlin Edinburgh Ljubljana Malmö
Italian x - - - -
German - x - - -
English x x x x x
Slovene - - - x -
Swedish - - - - x
Polish - x - x x
Serbo-
Croatian
- x - x x
Russian x x - - -
Arabic - x - - x
Turkish - x - - -
Recruitment of respondents
• We recruited participants in two ways: first, they were randomly invited to participate in public places like parks and public squares, botanical gardens, shopping malls, sporting facilities and administrative offices. To assess a wide array of cultural and social groups, we searched for official events such as summer celebrations (e.g. of religious congregations, day care centres) and cultural festivities (e.g. at the end of Ramadan). Second, they were recruited with the help of unions, societies, newsletters, personal and social networks.
• For the recruitment we designed a manual to ensure standardised procedures in all ULLs. The recruitment work included getting in touch with multiplicators (organisers, chairmen, team leaders, etc.) via different media such as telephone, email or personal contact. Thus, we provided standardised information sheets for the communication of the study purpose, its content and requirements.
• The link to the online survey website was similarly distributed via university networks, social networks and postings on internet forums, and was also spread with the help of different unions, organisations and societies that were contacted in a similar way as for the recruitment of the paper-and-pencil survey.
• Survey data were collected from May 11 to August 18, 2015. The conduction of the interviews followed a standard routine, guided by a protocol.

BIOCULTURAL DIVERSITY OF URBAN GREEN SPACES IN EUROPEAN CITIES • WP2 • Page 33
3.3.2 Sample details and first results
The results of the field survey will be reported in detail in D2.2 (December 2015). Here, we give a short overview on how the collected responses are distributed between main categories such as UGI types, survey methods or age and gender. In total we collected responses from 3,577 respondents that can be used for further analyses. Distribution among questionnaire versions
Regarding all ULL cities together, the distribution of responses of the online versions versus the paper-and-pencil versions of the questionnaire was balanced (55% online vs. 45% paper-and-pencil interviews; Tab. 4). The data gathered was equally distributed among questionnaire types in two cities (Edinburgh, Malmö). Distribution among UGI type versions
The collected answers were very evenly distributed between the three UGI versions of the questionnaire (Tab. 4). Table 4: Summary of total numbers of respondents per survey method (paper-and-pencil version, online version) and UGI versions. Shown are numbers of those interviews that can be used for further statistical analyses; the total amount of participants was larger.
Bari Berlin Edinburgh Ljubljana Malmö
Total 877 1242 445 523 490
Paper-and-pencil interviews 252 721 225 176 252
Online survey 625 521 220 347 238
UGI versions
Park - Roadside 295 409 146 178 168
Park - Forest 285 414 152 182 166
Park - Wasteland 297 419 147 163 156
Distribution among selected socio-demographic and cultural variables
In all cities, more women filled out the questionnaire than men. With values of about 40% men and about 60% women in most cities (Tab. 5), the data were still similarly balanced between female and male respondents as they are in comparably large surveys (Engel et al. 2012). The average age ranged between 32 years in Bari (standard deviation: 14.6 years) to 44 years in Edinburgh and Malmö (standard deviation: 16.0 years and 17.9 years, respectively). Most ULL cities predominantly used the questionnaire version in their local language or the English version. Exclusively the Berlin ULL used the range of other languages (Arab, Turkish, Polish, Serbo-Croatian, Russian), and Malmö additionally employed the Arab version of its questionnaire. The migration status of the interviewees (including parent and grandparent generations) ranged from 4% (Ljubljana) to 46% (Malmö).

BIOCULTURAL DIVERSITY OF URBAN GREEN SPACES IN EUROPEAN CITIES • WP2 • Page 34
Table 5: Summary of total numbers of respondents per gender, the respondents’ mean age and the languages used in the ULLs.
Bari Berlin Edinburgh Ljubljana Malmö
Gender Female
Male
56%
44%
58%
42%
56%
44%
67%
33%
58%
42%
Average age (years) 32 40 44 34 44
Languages
used
Italian
German
English
Slovene
Swedish
Polish
Serbo-croatian
Russian
Arabic
Turkish
X
-
X
-
-
-
-
Not used.
-
-
-
X
X
-
-
X
X
X
X
X
-
-
X
-
-
-
-
-
-
-
-
-
X
X
-
Not used.
Not used.
-
-
-
-
-
X
-
X
Not used.
Not used.
-
X
-
Migration background of
respondents
(incl. parent and grandparent
generation)
14% 37% 35% 4% 46%
BIOCULTURAL DIVERSITY OF URBAN GREEN SPACES IN EUROPEAN CITIES • WP2 • Page 35
4 CONCLUSION
From the results presented in this MS for three subsequent research levels, we are able to draw some first conclusions on • how BCD is considered in urban research studies that have been conducted so far in Europe,
and which important knowledge gaps remain (research level 1, assessment of BCD via literature review);
• how population characteristics and UGI components are related at an aggregated spatial level (research level 2, assessment of BCD via spatial analyses);
• how different social and cultural groups perceive, value and interact with UGI components (biodiversity, UGI types; research level 3, assessment of BCD via field survey).
Research level 1, the literature review, revealed that important areas of research are understudied in European cities. Up to now, most studies on the perception and valuation of urban nature focus on the ecosystem level. Especially at the species level, outcomes of perception and valuation studies vary widely, and the gene level is not studied at all. Also, a range of important socio-demographic and cultural characteristics of the population sample are not systematically included in most studies. First results thus clearly indicate unexploited opportunities in linking biological and cultural diversity in urban assessments. From research level 2, the spatial analyses, we conclude that urban green areas and forest areas are distributed differently in European cities. Whereas some European urban regions have rather few green spaces in the inner parts of their cities, other urban areas show a greater or more even distribution of the green spaces over the whole city area. The analyses also demonstrate that data on such a broad spatial scale are vastly inconsistent, making overarching spatial analyses still difficult. Demographic and socio-demographic data are comparatively up-to date, while land cover data stem from 2006. Recent data would certainly provide a more realistic picture of the urban green areas actually present in European cities. For some cities provision with urban green may have increased since 2006, whereas for others urban green may have decreased. Therefore, once updated Urban Atlas data are available, maps will be redeveloped to reflect these new data. Research level 3, the field survey, specifically picked up on the outcomes of research level 1 and started to close knowledge gaps on the perception, valuation of and interaction with biodiversity and UGI types at a more detailed level. The field study was successfully performed in five ULL cities and will allow us to further analyse links between patterns of perception, valuation and interaction on the one hand and the socio-demographic and cultural backgrounds of the respondents on the other. In contrast to most other studies in this field, we will be able (i) to include not only general socio-demographic variables such as gender and age in our analyses but a combination of these with more detailed variables such as possible migration history or health status of the respondents; (ii) to explicitly analyse the survey responses regarding different degrees of biological richness at the species level. More will be reported in D2.2. We expect that the final results in D2.2 will allow us to draw conclusions on the populations’ views and needs in terms of a broad array of UGI types and different levels of biodiversity. Further steps may then allow recommendations on how future design and planning of UGI can integrate the needs of a wide range of population groups with different social and cultural
BIOCULTURAL DIVERSITY OF URBAN GREEN SPACES IN EUROPEAN CITIES • WP2 • Page 36
backgrounds. Reflecting these outcomes especially with the ULL partners and within the ULL cities will disseminate the knowledge gained at a very practical level, giving way to a more sustainable design of urban green spaces.

BIOCULTURAL DIVERSITY OF URBAN GREEN SPACES IN EUROPEAN CITIES • WP2 • Page 37
5 ACKNOWLEDGEMENTS
We say a big thank you to all respondents of the field survey, the institutions that supported and helped distribute the survey in their surroundings and all the dedicated helpers in the field. Also, we would like to thank the Green Surge colleagues Arjen Buijs, Marleen Buizer, Birgit Elands, Rieke Hansen, Jari Niemelä, Stephan Pauleit, Emily L. Rall, Mike Smith and Kati Vierikko for their helpful comments on the concept of this task and earlier drafts of this MS.
Figure 18: The Berlin core team of the field survey in summer 2015 in the garden of the Department of Ecology, Technische Universität Berlin. The T-shirt shows a combination of symbols of Green Surge and TU Berlin and a leaf of the tree of heaven (Ailanthus altissima) to support corporate identity during the field study in Berlin.

BIOCULTURAL DIVERSITY OF URBAN GREEN SPACES IN EUROPEAN CITIES • WP2 • Page 38
6 REFERENCES
Brummit, R. K., 2001: World geographical scheme for recording plant distributions. Edition 2. International Working Group on Taxonomic Databases For Plant Sciences (TDWG) by the Hunt Institute for Botanical Documentation, Carnegie Mellon University, Pittsburgh. 153p.
Botzat, A., Fischer, L. K. and I. Kowarik, under review. Unexploited opportunities in approaching liveable and biodiverse cities. A review on urban biodiversity perception and valuation.
Cvejić, R., Eler, K., Pintar, M., Železnikar, Š., Haase, D., Kabisch, N. and M. Strohbach, 2015: A typology of urban green spaces, ecosystem provisioning services and demands. Published project report GREEN SURGE Deliverable 3.1, web: greensurge.eu. 68p.
Engel, U., Bartsch, S., Schnabel, C. and H. Vehre, 2012. Wissenschaftliche Umfragen: Methoden und Fehlerquellen. Campus Verlag, Germany.
Elmqvist, T., Fragkias, M., Goodness, J., Güneralp, B., Marcotullio, P. J., McDonald, R. I., Parnell, S., Schewenius, M., Sendstad, M., Seto, K. C. and C. Wilkinson, 2013. Urbanization, Biodiversity and Ecosystem Services: Challenges and Opportunities: A Global Assessment. Springer, Netherlands.
European Commission, 2004. Urban Audit—Methodological Handbook. Office for Official Publications of the European Communities, Luxembourg.
EEA European Commission, 2011. Mapping guide for a European urban atlas. http://www.eea.europa.eu/data-and-maps/data/urban-atlas/mapping-guide (online resource)
EU (European Union), 2015: European member countries. http://europa.eu/about-eu/countries/member-countries/ (online resource: 2015-10-01)
European Social Survey, Round 6, online resource at http://www.europeansocialsurvey.org/ (online resource)
Fuller, R. A., Irvine, K. N., Devine-Wright, P., Warren, P. H. and K. J. Gaston, 2007. Psychological benefits of greenspace increase with biodiversity. Biology Letters 3: 390-394.
Grimm, N. B., Faeth, S. H., Golubiewski, N. E., Redman, C. L., Wu, J. G., Bai, X. M. and J. M. Briggs, 2008. Global change and the ecology of cities. Science 319: 756-760.
Haase, D., Larondelle, N., Andersson, E., Artmann, M., Borgstrom, S., Breuste, J., Gomez-Baggethun, E., Gren, A., Hamstead, Z., Hansen, R., Kabisch, N., Kremer, P., Langemeyer, J., Rall, E. L., McPhearson, T., Pauleit, S., Qureshi, S., Schwarz, N., Voigt, A., Wurster, D. and T. Elmqvist, 2014. A quantitative review of urban ecosystem service assessments: concepts, models, and implementation. Ambio 43: 413-433.
Hansen, R., Buizer, M., Rall, E., DeBellis, Y., Davies, C., Elands, B., Wiersum, F. and S. Pauleit, 2015. Report of case study city portraits. APPENDIX - GREEN SURGE study on urban green infrastructure planning and governance in 20 European case studies. Published project report GREEN SURGE, web: greensurge.eu. 271p.
Kabisch, N. and D. Haase, 2013. Green spaces of European cities revisited for 1990–2006. Landscape and Urban Planning 110: 113-122.
Kabisch, N., Qureshi, S. and D. Haase, 2015. Human-environment interactions in urban green spaces - A systematic review of contemporary issues and prospects for future research. Environmental Impact Assessment Review 50: 25-34.
Keniger, L. E., Gaston, K. J., Irvine, K. N. and R. A. Fuller, 2013. What are the benefits of interacting with nature? International Journal of Environmental Research and Public Health 10: 913-935.
Lin, B. B., Fuller, R. A., Bush, R., Gaston, K. J. and D. F. Shanahan, 2014. Opportunity or orientation? Who uses urban parks and why. Plos One 9: e87422.
Shan, X.-Z., 2014. Socio-demographic variation in motives for visiting urban green spaces in a large Chinese city. Habitat International 41: 114-120.

BIOCULTURAL DIVERSITY OF URBAN GREEN SPACES IN EUROPEAN CITIES • WP2 • Page 39
Shanahan, D. F., Lin, B. B., Gaston, K. J., Bush, R. and R. A. Fuller, 2014. Socio-economic inequalities in access to nature on public and private lands: a case study from Brisbane, Australia. Landscape and Urban Planning 130: 14-23.
Shanahan, D. F., Lin, B. B., Bush, R., Gaston, K. J., Dean, J. H., Barber, E. and R. A. Fuller, 2015. Toward improved public health coutcomes from urban nature. American Journal of Public Health 105(3): 470-477.
Smith, M., Van der Jagt, A. and B. Ambrose-Oji, 2015. Local learning alliances established in five urban learning labs. Published project report GREEN SURGE Deliverable 7.1, web: greensurge.eu. 37p.
Stigsdotter, U. K. and P. Grahn, 2011. Stressed individuals’ preferences for activities and environmental characteristics in green spaces. Urban Forestry & Urban Greening 10: 295-304.
Strohbach, M. W., Haase, D. and N. Kabisch, 2009. Birds and the city: urban biodiversity, land use, and socioeconomics. Ecology and Society 14(2): 31.
UN (United Nations), 2014: Composition of macro geographical (continental) regions, geographical sub-regions, and selected economic and other groupings. http://unstats.un.org/unsd/methods/m49/m49regin.htm#europe (online resource: 2015-10-01)
Vierikko, K., Elands, B., Száraz, L. and J. Niemelä, 2015. Biocultural diversity – concept and assessment. Published project report on BCD concept and explorative survey of BCD in 20 European cities. Published project report GREEN SURGE Deliverable 2.1, web: greensurge.eu. 59p.
Vierikko, K., Niemelä, J., Elands, B. and M. Buizer, 2014. Conceptual framework for biocultural diversity Milestone 20. Published project report GREEN SURGE Milestone 20, web: greensurge.eu. 21p.
Wu, J. G., 2014. Urban ecology and sustainability: The state-of-the-science and future directions. Landscape and Urban Planning 125: 209-221.

BIOCULTURAL DIVERSITY OF URBAN GREEN SPACES IN EUROPEAN CITIES • WP2 • Page 40
7 APPENDIX
Appendix A1: List of cities used in spatial analyses (research level 2). Grouping of cities in the European macro-geographical region is based on UN Composition of macro-geographical (continental) regions, geographical sub-regions, and selected economic and other groupings (http://unstats.un.org/unsd/methods/m49/m49regin.htm#europe). ULL cities are displayed in bold.
Names Country Region Europe
Wien AT Western Europe
Graz AT Western Europe
Linz AT Western Europe
Salzburg AT Western Europe
Innsbruck AT Western Europe
Bruxelles / Brussel BE Western Europe
Antwerpen BE Western Europe
Gent BE Western Europe
Charleroi BE Western Europe
Liège BE Western Europe
Brugge BE Western Europe
Namur BE Western Europe
Sofia BG Eastern Europe
Plovdiv BG Eastern Europe
Varna BG Eastern Europe
Burgas BG Eastern Europe
Pleven BG Eastern Europe
Ruse BG Eastern Europe
Vidin BG Eastern Europe
Lefkosia CY Southern Europe
Praha CZ Eastern Europe
Brno CZ Eastern Europe
Ostrava CZ Eastern Europe
Plzen CZ Eastern Europe
Ústí nad Labem CZ Eastern Europe
Olomouc CZ Eastern Europe
Liberec CZ Eastern Europe
Ceské Budejovice CZ Eastern Europe
Hradec Králové CZ Eastern Europe
Pardubice CZ Eastern Europe
Karlovy Vary CZ Eastern Europe
Jihlava CZ Eastern Europe
Berlin DE Western Europe
Hamburg DE Western Europe
München DE Western Europe
Köln DE Western Europe
Names Country Region Europe
Frankfurt am Main DE Western Europe
Essen DE Western Europe
Stuttgart DE Western Europe
Leipzig DE Western Europe
Dresden DE Western Europe
Düsseldorf DE Western Europe
Hannover DE Western Europe
Nürnberg DE Western Europe
Wuppertal DE Western Europe
Bielefeld DE Western Europe
Halle an der Saale DE Western Europe
Magdeburg DE Western Europe
Wiesbaden DE Western Europe
Göttingen DE Western Europe
Darmstadt DE Western Europe
Trier DE Western Europe
Freiburg im Breisgau DE Western Europe
Regensburg DE Western Europe
Frankfurt (Oder) DE Western Europe
Weimar DE Western Europe
Schwerin DE Western Europe
Erfurt DE Western Europe
Augsburg DE Western Europe
Bonn DE Western Europe
Karlsruhe DE Western Europe
Mönchengladbach DE Western Europe
Mainz DE Western Europe
Kiel DE Western Europe
Saarbrücken DE Western Europe
Koblenz DE Western Europe
København DK Northern Europe
Århus DK Northern Europe
Odense DK Northern Europe
Aalborg DK Northern Europe
Tallinn EE Northern Europe
Tartu EE Northern Europe

BIOCULTURAL DIVERSITY OF URBAN GREEN SPACES IN EUROPEAN CITIES • WP2 • Page 41
Names Country Region Europe
Athina EL Southern Europe
Thessaloniki EL Southern Europe
Pátra EL Southern Europe
Irakleio EL Southern Europe
Larisa EL Southern Europe
Volos EL Southern Europe
Ioannina EL Southern Europe
Kavala EL Southern Europe
Kalamata EL Southern Europe
Madrid ES Southern Europe
Barcelona ES Southern Europe
Valencia ES Southern Europe
Sevilla ES Southern Europe
Zaragoza ES Southern Europe
Málaga ES Southern Europe
Murcia ES Southern Europe
Las Palmas ES Southern Europe
Valladolid ES Southern Europe
Palma de Mallorca ES Southern Europe
Santiago de Compostela ES Southern Europe
Vitoria/Gasteiz ES Southern Europe
Oviedo ES Southern Europe
Pamplona/Iruña ES Southern Europe
Santander ES Southern Europe
Toledo ES Southern Europe
Badajoz ES Southern Europe
Logroño ES Southern Europe
Bilbao ES Southern Europe
Córdoba ES Southern Europe
Alicante/Alacant ES Southern Europe
Vigo ES Southern Europe
Gijón ES Southern Europe
Santa Cruz de Tenerife ES Southern Europe
Helsinki / Helsingfors FI Northern Europe
Tampere / Tammerfors FI Northern Europe
Turku / Åbo FI Northern Europe
Oulu / Uleåborg FI Northern Europe
Paris FR Western Europe
Lyon FR Western Europe
Toulouse FR Western Europe
Strasbourg FR Western Europe
Bordeaux FR Western Europe
Nantes FR Western Europe
Names Country Region Europe
Lille FR Western Europe
Montpellier FR Western Europe
Saint-Etienne FR Western Europe
Le Havre FR Western Europe
Amiens FR Western Europe
Rouen FR Western Europe
Nancy FR Western Europe
Metz FR Western Europe
Reims FR Western Europe
Dijon FR Western Europe
Poitiers FR Western Europe
Clermont-Ferrand FR Western Europe
Caen FR Western Europe
Limoges FR Western Europe
Besançon FR Western Europe
Grenoble FR Western Europe
Ajaccio FR Western Europe
Toulon FR Western Europe
Tours FR Western Europe
Aix-en-Provence FR Western Europe
Marseille FR Western Europe
Nice FR Western Europe
Lens - Liévin FR Western Europe
Budapest HU Eastern Europe
Miskolc HU Eastern Europe
Nyíregyháza HU Eastern Europe
Pécs HU Eastern Europe
Debrecen HU Eastern Europe
Szeged HU Eastern Europe
Gyõr HU Eastern Europe
Kecskemét HU Eastern Europe
Székesfehérvár HU Eastern Europe
Dublin IE Northern Europe
Cork IE Northern Europe
Limerick IE Northern Europe
Galway IE Northern Europe
Waterford IE Northern Europe
Roma IT Southern Europe
Milano IT Southern Europe
Napoli IT Southern Europe
Torino IT Southern Europe
Palermo IT Southern Europe
Genova IT Southern Europe

BIOCULTURAL DIVERSITY OF URBAN GREEN SPACES IN EUROPEAN CITIES • WP2 • Page 42
Names Country Region Europe
Firenze IT Southern Europe
Bari IT Southern Europe
Bologna IT Southern Europe
Catania IT Southern Europe
Venezia IT Southern Europe
Verona IT Southern Europe
Cremona IT Southern Europe
Trento IT Southern Europe
Trieste IT Southern Europe
Perugia IT Southern Europe
Ancona IT Southern Europe
l'Aquila IT Southern Europe
Pescara IT Southern Europe
Campobasso IT Southern Europe
Caserta IT Southern Europe
Taranto IT Southern Europe
Potenza IT Southern Europe
Catanzaro IT Southern Europe
Reggio di Calabria IT Southern Europe
Sassari IT Southern Europe
Cagliari IT Southern Europe
Padova IT Southern Europe
Brescia IT Southern Europe
Modena IT Southern Europe
Foggia IT Southern Europe
Salerno IT Southern Europe
Vilnius LT Northern Europe
Kaunas LT Northern Europe
Panevezys LT Northern Europe
Luxembourg LU Western Europe
Riga LV Northern Europe
Liepaja LV Northern Europe
Valletta MT Southern Europe
Gozo MT Southern Europe
's-Gravenhage NL Western Europe
Amsterdam NL Western Europe
Rotterdam NL Western Europe
Utrecht NL Western Europe
Eindhoven NL Western Europe
Tilburg NL Western Europe
Groningen NL Western Europe
Enschede NL Western Europe
Arnhem NL Western Europe
Names Country Region Europe
Heerlen NL Western Europe
Breda NL Western Europe
Nijmegen NL Western Europe
Apeldoorn NL Western Europe
Leeuwarden NL Western Europe
Warszawa PL Eastern Europe
Lódz PL Eastern Europe
Kraków PL Eastern Europe
Wroclaw PL Eastern Europe
Poznan PL Eastern Europe
Gdansk PL Eastern Europe
Szczecin PL Eastern Europe
Bydgoszcz PL Eastern Europe
Lublin PL Eastern Europe
Katowice PL Eastern Europe
Bialystok PL Eastern Europe
Kielce PL Eastern Europe
Torun PL Eastern Europe
Olsztyn PL Eastern Europe
Rzeszów PL Eastern Europe
Opole PL Eastern Europe
Gorzów Wielkopolski PL Eastern Europe
Zielona Góra PL Eastern Europe
Jelenia Góra PL Eastern Europe
Nowy Sacz PL Eastern Europe
Suwalki PL Eastern Europe
Konin PL Eastern Europe
Czestochowa PL Eastern Europe
Radom PL Eastern Europe
Plock PL Eastern Europe
Kalisz PL Eastern Europe
Koszalin PL Eastern Europe
Lisboa PT Southern Europe
Porto PT Southern Europe
Braga PT Southern Europe
Funchal PT Southern Europe
Coimbra PT Southern Europe
Setúbal PT Southern Europe
Ponta Delgada PT Southern Europe
Aveiro PT Southern Europe
Faro PT Southern Europe
Bucuresti RO Eastern Europe
Cluj-Napoca RO Eastern Europe

BIOCULTURAL DIVERSITY OF URBAN GREEN SPACES IN EUROPEAN CITIES • WP2 • Page 43
Names Country Region Europe
Timisoara RO Eastern Europe
Craiova RO Eastern Europe
Braila RO Eastern Europe
Oradea RO Eastern Europe
Bacau RO Eastern Europe
Arad RO Eastern Europe
Sibiu RO Eastern Europe
Târgu Mures RO Eastern Europe
Piatra Neamt RO Eastern Europe
Calarasi RO Eastern Europe
Giurgiu RO Eastern Europe
Alba Iulia RO Eastern Europe
Stockholm SE Northern Europe
Göteborg SE Northern Europe
Malmö SE Northern Europe
Jönköping SE Northern Europe
Umeå SE Northern Europe
Uppsala SE Northern Europe
Linköping SE Northern Europe
Örebro SE Northern Europe
Ljubljana SI Southern Europe
Maribor SI Southern Europe
Bratislava SK Eastern Europe
Kosice SK Eastern Europe
Banská Bystrica SK Eastern Europe
Nitra SK Eastern Europe
Presov SK Eastern Europe
Zilina SK Eastern Europe
Names Country Region Europe
Trnava SK Eastern Europe
Trencín SK Eastern Europe
London (Ballungsraum) UK Northern Europe
West Midlands urban area UK Northern Europe
Glasgow UK Northern Europe
Liverpool UK Northern Europe
Edinburgh UK Northern Europe
Manchester UK Northern Europe
Cardiff UK Northern Europe
Sheffield UK Northern Europe
Bristol UK Northern Europe
Belfast UK Northern Europe
Newcastle upon Tyne UK Northern Europe
Leicester UK Northern Europe
Derry UK Northern Europe
Aberdeen UK Northern Europe
Cambridge UK Northern Europe
Exeter UK Northern Europe
Lincoln UK Northern Europe
Wrexham UK Northern Europe
Portsmouth UK Northern Europe
Worcester UK Northern Europe
Coventry UK Northern Europe
Kingston-upon-Hull UK Northern Europe
Stoke-on-trent UK Northern Europe
Wolverhampton UK Northern Europe
Nottingham UK Northern Europe