bioagent detection using miniaturized nmr and...
TRANSCRIPT
SANDIA REPORT SAND2006-6931 Unlimited Release Printed November 2006
Bioagent Detection Using Miniaturized NMR and Nanoparticle Amplification: Final LDRD Report Todd M. Alam, Catherine F. M. Clewett, David P. Adams, John D. Williams, Hongyou Fan, Andrew F. McDowell, Natalie L. Aldolphi, and Laurel O. Sillerud Prepared by Sandia National Laboratories Albuquerque, New Mexico 87185 and Livermore, California 94550 Sandia is a multiprogram laboratory operated by Sandia Corporation, a Lockheed Martin Company, for the United States Department of Energy’s National Nuclear Security Administration under Contract DE-AC04-94AL85000. Approved for public release; further dissemination unlimited.

2
Issued by Sandia National Laboratories, operated for the United States Department of Energy by Sandia Corporation. NOTICE: This report was prepared as an account of work sponsored by an agency of the United States Government. Neither the United States Government, nor any agency thereof, nor any of their employees, nor any of their contractors, subcontractors, or their employees, make any warranty, express or implied, or assume any legal liability or responsibility for the accuracy, completeness, or usefulness of any information, apparatus, product, or process disclosed, or represent that its use would not infringe privately owned rights. Reference herein to any specific commercial product, process, or service by trade name, trademark, manufacturer, or otherwise, does not necessarily constitute or imply its endorsement, recommendation, or favoring by the United States Government, any agency thereof, or any of their contractors or subcontractors. The views and opinions expressed herein do not necessarily state or reflect those of the United States Government, any agency thereof, or any of their contractors. Printed in the United States of America. This report has been reproduced directly from the best available copy. Available to DOE and DOE contractors from U.S. Department of Energy Office of Scientific and Technical Information P.O. Box 62 Oak Ridge, TN 37831 Telephone: (865) 576-8401 Facsimile: (865) 576-5728 E-Mail: [email protected] Online ordering: http://www.osti.gov/bridge Available to the public from U.S. Department of Commerce National Technical Information Service 5285 Port Royal Rd. Springfield, VA 22161 Telephone: (800) 553-6847 Facsimile: (703) 605-6900 E-Mail: [email protected] Online order: http://www.ntis.gov/help/ordermethods.asp?loc=7-4-0#online
3
SAND2006-6931 Unlimited Release
Printed November 2006
Bioagent Detection Using Miniaturized NMR and Nanoparticle Amplification:
Final LDRD Report
Todd M. Alam *a, Catherine F. M. Clewett a, David P. Adams b, John D. Williams c, Hongyou Fan d, Andrew F. McDowell e, Natalie L. Aldolphi e
and Laurel O. Sillerud f
a Department of Electronic and Nanostructured Materials, b Department of Thin Film, Vacuum and Packaging,
c Department of Photonics and Microsystems Technology, d Department of Ceramic Processing and Inorganic Materials,
Sandia National Laboratories, Albuquerque, NM
e New Mexico Resonance, Albuquerque, NM
f Department of Biochemistry and Molecular Biology, University of New Mexico, Albuquerque, NM
Abstract
This LDRD program was directed towards the development of a portable micro-nuclear magnetic resonance (µ-NMR) spectrometer for the detection of bioagents via induced amplification of solvent relaxation based on superparamagnetic nanoparticles. The first component of this research was the fabrication and testing of two different micro-coil (µ-coil) platforms: namely a planar spiral NMR µ-coil and a cylindrical solenoid NMR µ-coil. These fabrication techniques are described along with the testing of the NMR performance for the individual coils. The NMR relaxivity for a series of water soluble FeMn oxide nanoparticles was also determined to explore the influence of the nanoparticle size on the observed NMR relaxation properties. In addition, The use of commercially produced superparamagnetic iron oxide nanoparticles (SPIONs) for amplification via NMR based relaxation mechanisms was also demonstrated, with the lower detection limit in number of SPIONs per nanoliter (nL) being determined.
* Author to whom correspondence should be addressed: [email protected]
4
Acknowledgements
The progress made in this LDRD project is the result of contributions from a
number of team members both here at Sandia National Laboratories, at the University of
New Mexico and the company New Mexico Resonance. These members include C.
Clewett, D. P. Adams, C. Benally, A. Fresquez, V. C. Hodges, K. Peterson, M. J. Visale,
R. Torres, J. D. Williams, L. O. Sillerud, R. E. Serda, A. F. McDowell, and N. L.
Adolphi.
Sandia is multiprogram laboratory operated by Sandia Corporation, a Lockheed
Martin Company, for the United Stated Department of Energy’s National Nuclear
Security Administration under Contract DE-AC04-94AL85000. This work was supported
under the Sandia LDRD program (Project 90506).
Definitions NMR – Nuclear Magnetic Resonance µ-NMR – Micro-NMR MRI – Magnetic Resonance Imaging µ-coil – Micro-coil SPION – Super Paramagnetic Iron Oxide Nanoparticles CTAB - Cetyltrimethylammonium Bromide

5
Table of Contents Acknowledgments........................................................................................................................... 4 Executive Summary .........................................................................................................................9 1. Introduction..................................................................................................................................9 2. NMR Relaxation by Paramagnetic Nanoparticles .....................................................................13 2.1 NMR Relaxivity..................................................................................................................15 3. Water Soluble Paramagnetic Nanoparticles...............................................................................16 3.1 Synthesis of Fe and FeMn Oxide Water Soluble Nanoparticles.........................................16 3.1.1 Synthesis of 12 nm FeMn Oxide Water Soluble Nanoparticles ....................................17 3.1.2 Preparation of Water Soluble Nanoparticles..................................................................18 3.2 NMR Experimental Details.................................................................................................18 3.3 Particle Size Versus Relaxation ..........................................................................................19 3.4 Impact on Project Nano-Detection Scheme........................................................................24 4. Solenoid Detection Coil Development ......................................................................................25 4.1 Analysis of Coil Resistance and SNR for Thin Ribbon Wire.............................................25 4.1.1 Small Wire Limit ..........................................................................................................26 4.1.2 Large Wire Limit ..........................................................................................................27 4.1.3 Ribbon Wire, Intermediate Limit..................................................................................28 4.1.4 Ribbon Wire in the Small Wire Limit...........................................................................29 4.1.5 Implications for Coil Design.........................................................................................31 4.2 Fabrication Details ..............................................................................................................32 4.3 Micro-Coil Tuning Circuit..................................................................................................36 4.4 Low Field NMR Experimental Details ...............................................................................39 4.5 Low-Field NMR Testing of Solenoid Micro-Coil ..............................................................40 4.6 Impact on Micro-NMR Development.................................................................................44 5. Planar Spiral Micro-Coil Development .....................................................................................45 5.1 Fabrication Details .............................................................................................................45 5.2 Low-Field NMR Testing of Planar Spiral Micro-Coils.....................................................49 5.3 Impact on Micro-NMR Development................................................................................51 6. Demonstration of SPION Detection ..........................................................................................52 6.1 Low-Field NMR Relaxation Experiments .........................................................................53 6.2 SPION Induced Relaxation................................................................................................53 6.3 Impact of SPION Amplification for Bioagent Detection ..................................................58 7. Portable MAGRITEK NMR Instrument....................................................................................63 8. Conclusions................................................................................................................................65 9. References..................................................................................................................................67 Appendix 1. Spiral µ-coil fabrication layout .................................................................................73 Appendix 2. Analysis of spiral µ-coil performance.......................................................................74 Appendix 3. DC resitivity analysis of spiral µ-coils......................................................................82 Appendix 4. Layout for 40 MHz tune circuit ................................................................................85 Distribution ....................................................................................................................................87

6
List of Figures
Figure 1. Schematic representation of nanoparticle amplification ................................................11 Figure 2. Growth mechanism for nanoparticle synthesis...............................................................17 Figure 3. Variation of NMR R2 relaxation with Fe concentration.................................................21 Figure 4. Variation of NMR R1 relaxation with Fe concentration.................................................23 Figure 5. Sequence for fabrication of solenoid µ-coil ...................................................................35 Figure 6. SEM and photo of solenoid µ-coil .................................................................................36 Figure 7. Tuning and matching circuit...........................................................................................39 Figure 8. Determination of π pulse ................................................................................................41 Figure 9. 1H NMR spectrum from solenoid 550/400 µ-coil ..........................................................42 Figure 10. 1H NMR spectrum of ethanol using the 550/400 µ-coil...............................................43 Figure 11. Process diagram for production of planar spiral NMR µ-coils ....................................46 Figure 12. Gold induction coil on alumina substrate.....................................................................47 Figure 13. Photograph of 15 turn spiral µ-coil ..............................................................................48 Figure 14. 1H NMR spectrum of ethanol from planar spiral µ-coil...............................................50 Figure 15. Photograph of Dynabead SPION..................................................................................52 Figure 16. Measurement of T1 relaxation in µ-coil........................................................................54 Figure 17. 1H NMR spectra for different Dynabead concentrations .............................................55 Figure 18. Change in relaxation and relaxivity with bead concentration ......................................57 Figure 19. MAGRITEK NMR system...........................................................................................64 Figure 20. 40 MHz µ-NMR probe .................................................................................................65 Figure 21. 40 MHz µ-NMR probe with 3-way micro-positioner ..................................................65

7
List of Tables Table 1. NMR relaxivity for different nanoparticles .....................................................................22 Table 2. SNR variation for coil design limits ................................................................................30 Table 3. Fit parameters for ethanol spectrum ................................................................................43 Table 4. Summary of planar spiral µ-coils ....................................................................................51

8

9
Bioagent Detection Using Miniaturized NMR and Nanoparticle Amplification:
Final LDRD Report
Executive Summary
The development and testing of two different µ-coil platforms for nuclear
magnetic resonance (NMR) detection were completed under this LDRD project. The
performance of these NMR µ-coils allowed the demonstration of SPION
(superparamagnetic iron oxide nanoparticle) amplification via induced changes in the
NMR relaxation rates of the carrier solvent water. A detection limit of 10 particles/nL
was experimentally measured for the first prototype solenoid µ-coil design. These results
clearly show that nanoparticle amplification for µ-NMR can be used for detection of
bioagents.
1. Introduction
The reliable detection of bioagents in a range of sensing environments requires
the development of multiple detection platforms. NMR spectroscopy is widely used for
the real-time identification of chemical species in solids, liquids and gases because it can
easily detect and characterize all components of mixtures without requiring separations or
any specific sample preparation. Unfortunately, the low sensitivity of NMR spectroscopy
means that the detection limits of biological and chemical warfare agents are many orders
below the lethal dose. In addition, high resolution NMR spectroscopy detection of dilute
biological agents such as tumor cells, bacteria, bacteria toxins or viruses in fluid samples
is complicated by the presence of the dominant background water signal.
10
However, recent developments in Micro-Electromechanical Systems (MEMS),
micro-fluidics and biological nanotechnology have supplied the basis for new
applications of NMR with high specificity for the detection and quantification of
biological materials in water. The first advance has been the development of
superparamagnetic iron oxide nanoparticles (SPIONs) for magnetic resonance imaging
(MRI) [1], where they are enjoying multiple applications as biological MRI contrast
agents [2-5]. These iron oxide particle systems are also known as SPIO
(superparamagnetic iron oxide), WSIO (water-soluble iron oxide), MPIOs (micrometer-
size iron oxide particles) and USPIOs (ultra-small dextran-coated iron oxide particles).
Nanoparticles can be coupled with biologically specific recognition ligands to target
epitopes involved in diseases, like cancer, and has been the focus of fluorescence- based
detection schemes [6]. This bio-conjugation can also be detected by NMR using SPIONs
and the resulting changes in NMR relaxation properties of the solution. For example, the
HER-2 protein is over-produced in many breast cancers and has been the subject of
successful NMR imaging experiments where cells displaying this protein have been
specifically imaged by means of SPIONs labeled with anti-her-2 antibodies [7-10]. This
bio-specific recognition of SPIONs has also been extended to DNA-based nanoparticle
assembly [11], and modified phospholipid constructs [12].
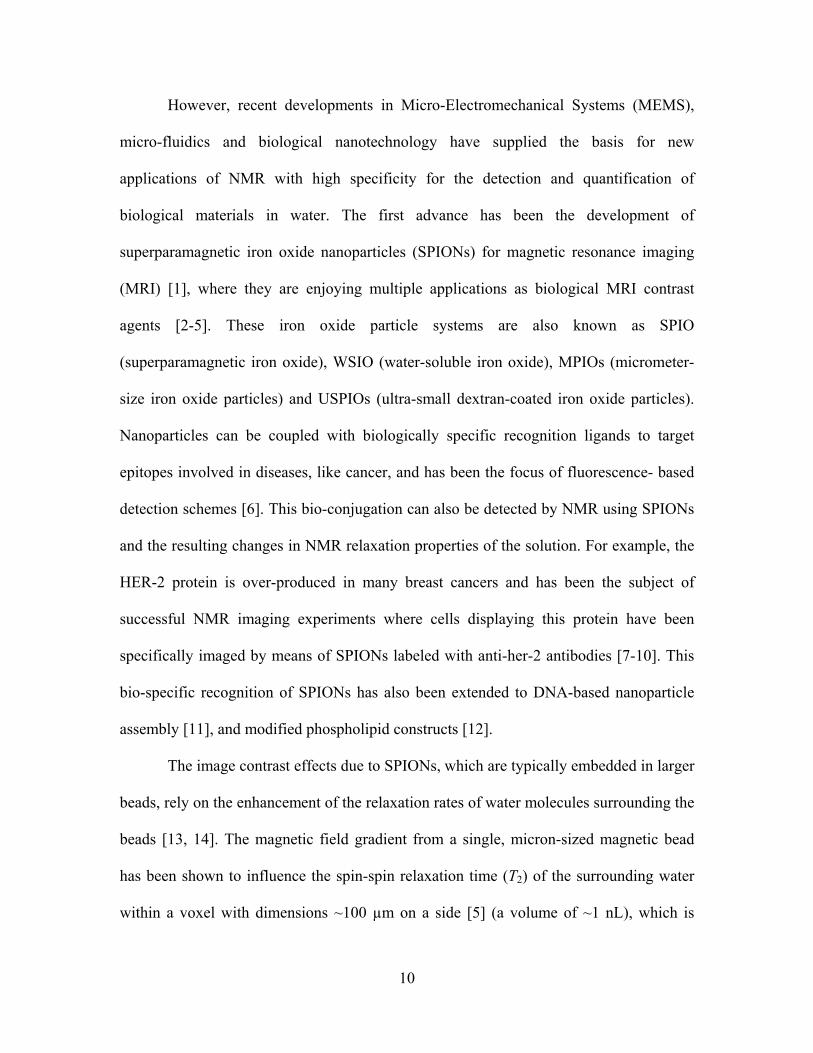
The image contrast effects due to SPIONs, which are typically embedded in larger
beads, rely on the enhancement of the relaxation rates of water molecules surrounding the
beads [13, 14]. The magnetic field gradient from a single, micron-sized magnetic bead
has been shown to influence the spin-spin relaxation time (T2) of the surrounding water
within a voxel with dimensions ~100 µm on a side [5] (a volume of ~1 nL), which is

11
~1000 times larger than that of a single cell. Thus, for a small biological object bound to
a magnetic bead in water, the change in the NMR signal caused by the presence of the
object is greatly amplified by the effect of the magnetic bead on the surrounding water. In
this LDRD project the induced T2 relaxation effect of the magnetic beads is used not for
image contrast, but simply as a means of detecting the presence of these bio-conjugated
SPIONs in a small in-vitro sample. The generalized principal behind this nano-amplified
NMR detection scheme is shown in Figure 1.
In principle, a single biological object bound to a magnetic bead can be detected
in vitro using a NMR µ-coil with a diameter in the 100 µm range, for which the NMR
sample volume is similar to that of the volume influenced by a single bead. This is the
motivation for the second component of this research, and it utilizes the development of
µ-coils for NMR detection. In recent years significant advances in the development and
fabrication of µ-coils (size < 1 mm) for NMR have continued [15-17]. Both planar
surface µ-coils and solenoid µ-coils have been developed for a wide range of applications
[18-36]. To enhance sensitivity for tiny samples, much of the work with micro-coils has
utilized the high fields produced by strong super-conducting magnets, only a limited few
Nano Self-AssemblySelective Binding Amplification Detection
SuperparmagneticBioagent Nanoparticle
Sensor
Bioagent
MEMS - NMR
Induced WaterRelaxation
~1014-1016 spinsVirus, cellProtein, DNA
Nano Self-AssemblySelective Binding Amplification Detection
SuperparmagneticBioagent Nanoparticle
Sensor
Bioagent
MEMS - NMR
Induced WaterRelaxation
~1014-1016 spinsVirus, cellProtein, DNA
Nano Self-AssemblySelective Binding Amplification DetectionNano Self-AssemblySelective Binding Amplification Detection
SuperparmagneticBioagent Nanoparticle
Sensor
Bioagent
MEMS - NMR
Induced WaterRelaxation
~1014-1016 spinsVirus, cellProtein, DNA
SuperparmagneticBioagent Nanoparticle
Sensor
Bioagent
MEMS - NMR
Induced WaterRelaxation
~1014-1016 spins
Bioagent
MEMS - NMR
Induced WaterRelaxation
~1014-1016 spinsVirus, cellProtein, DNA
Figure 1: Schematic representation of the nanoparticle amplification.

12
have been directed towards optimization at low magnetic field strengths [37]. However,
the small size of a NMR µ-coil suggests a different possibility: the miniaturization of the
magnet, and indeed the entire experiment, through the use of small permanent magnets.
While the weaker field of a permanent magnet poses a sensitivity challenge, distortions of
the magnetic field due to the proximity of the coil to the sample will be reduced at lower
fields. Further more, iron oxide particles typically achieve their saturation magnetization
in a field of only 0.5–1 Tesla. Thus, for our proposed detection scheme, low-field
operation is ideal because it lengthens the T2 of the background fluid without reducing the
T2 relaxivity of the magnetic beads. Combining µ-coil technology with a compact
permanent magnet has the added benefits of reducing the cost, maintenance, and space
requirements of the NMR system, and enabling portability. The long-range goal of the
research performed under this LDRD is the development of such a portable NMR system
capable of detecting minute (even single-particle) quantities of biological materials in
fluid samples.
In Section 3 we will describe the synthesis of paramagnetic nanoparticles, and the
impact of nanoparticle size on the NMR relaxation properties. In Section 4 we report the
development of the solenoid µ-coil for NMR detection, while in Section 5 we describe
the development of the planar spiral µ-coil for NMR. In section 6 we demonstrate the
amplification of NMR relaxation and detection via SPIONs, while in Section 7 we
describe the initial construction of a µ-NMR system here at Sandia National Laboratories.

13
2. NMR Relaxation by Paramagnetic Nanoparticles
Since the mid 1980’s superparamagnetic contrast agents have been pursued for
use in MRI. These materials have been based primarily on the water insoluble iron oxide
crystal forms of maghemite (γ-Fe2O3) or magnetite (Fe3O4). A variety of organic
modifications have been used to increase the solubility of these iron oxide crystal forms.
As an example in Section 3 we describe a series of nanoparticles utilizing either lipid or
CTAB (cetyltrimethylammonium bromide) modified surface that greatly increase the
water solubility of the iron oxide particles. Nanocrystals of Fe3O4 between 4 and 15 nm
contain thousands of paramagnetic Fe ions (Fe2+ and Fe3+) that are magnetically ordered
within the crystal such that the net magnetic moment of the particles are much larger than
the individual paramagnetic ion.
Superparamagnetism is characterized by the large magnetic moment of these
nanoparticles in the presence of an external magnetic field, while retaining no residual
magnetic moment following removal of the external magnetic field. This is in contrast to
ferromagnetic particles which retain a magnetic moment at zero magnetic field strength
once they have been magnetized. All iron oxide based contrast agents to date are
superparamagnetic.
The presence of a large magnetic moment in the superparamagnetic particles
changes the NMR relaxation mechanism from the inner-sphere/outer-sphere dipolar
relaxation (observed for Gadolinium chelates) to a long-range susceptibility induced
relaxation mechanism. The spins experience local field gradients that lead to loss of spin
coherence during the NMR experiment.

14
The susceptibility (χ) is the constant defining the relationship between induced
magnetization (M) and the applied magnetic field (H):
M Hχ= i (2.1)
For iron oxide particles at low magnetic field strengths M is given by:
20 / 3M Nm H kTµ= (2.2)
here N is the number of paramagnetic particles per volume voxel, m is the magnetic
moment of paramagnetic particle, µ0 the free space permeability, k is the Boltzmann’s
constant and T is the temperature. This allows the susceptibility to be defined by
20 / 3Nm kTχ µ= (2.3)
This shows that the change in the local susceptibility is proportional to the number of iron
oxide particles present and the square of magnetic moment. For superparamagnetic
nanoparticles this magnetic moment is commonly the saturation magnetization which is
reached for magnetic field strengths between 0.5 to 1.5 Tesla. This saturation
magnetization depends on both the size and the aggregation state of the nanoparticles,
and will be explored in Section 3.

15
2.1 NMR Relaxivity
The effectiveness of the relaxation agent on either the spin-spin relaxation rate R2
(inverse of the relaxation time, = 1/T2) or the spin-lattice relaxation rate R1 ( = 1/T1) is
defined by
0
2 2 20
1 1 1
R R r C
R R rC
= +
= + (2.4)
where C is the concentration of the relaxation agent, R2,1 are the measured relaxation
rates, 02,1R is the relaxation rate in the absence of agent, and r2,1 are the relaxivity (units =
s-1 mM-1). This relaxivity is a measure of how much the relaxation varies with added
agent, and is the standard by which different superparamagnetic nanoparticles can be
compared.

16
3. Water Soluble Paramagnetic Nanoparticles
To explore this size and aggregation effect on the NMR relaxation properties
noted above a series of FeO and FeMnO nanoparticles were tested. These nanoparticles
had well defined and controlled diameters, with different core compositions and surface
modifications.
3.1 Synthesis of Fe and FeMnO Oxide Water Soluble Nanoparticles
The synthesis of FeMn oxide nanoparticles is carried out by thermal decomposition of
iron pentacarbonyl, Fe(CO)5 (Note that Fe(CO)5 is a toxic liquid and should be handled
in a well ventilated hood), and reduction of Mn(II) acetylacetonate, Mn(acac)2, in a hot
organic solvent with oleic acid and oleylamine as surfactants, using standard Schlenk line
techniques under dry nitrogen gas protection. The organic solvent can be dioctyl ether,
benzyl ether, octadecene, or mixture of these. Particle size can be generally controlled by
simply adjusting the molar ratio of surfactants to precursors. The particle size is slightly
bigger if 1-hexadecanediol is not used as a reducing agent. The size of the FeMnO
nanoparticles will be further increased by decreasing the heating rate and increasing the
intermediate reaction temperature. A schematic of the mechanism for colloidal growth
and the resulting SEM showing the monodisperse nature of these nanoparticles is shown
in Figure 2.

17
3.1.1 Synthesis of 12 nm FeMn Oxide Nanoparticles
Under flow of nitrogen (~5mL/min), Mn(acac)2 (0.5 mmol) was mixed with
benzyl ether (10 mL) and heated to 100 °C. Under a blanket of nitrogen, Fe(CO)5 (1
mmol), oleylamine (4 mmol), and oleic acid (4 mmol) were then added. The mixture was
heated to 240oC at a heating rate of ~15 °C/min., and incubated at this temperature for
one hour to assure complete decomposition of Fe(CO)5, and then heated to reflux
(295~300oC). The mixture was kept refluxing at this temperature range for 2 hours.
During this time, slow nitrogen flow (~1mL/min) was introduced from time to time to
remove some low boiling-temperature by-products and maintain the refluxing
temperature between 295~300oC. The reaction mixture was allowed to cool to room
temperature by removing the heating source. FeMnO nanoparticles were precipitated out
and washed twice with ethanol. The precipitates were re-dispersed in a 10 mL of hexane
50 nm
50 nmSun, SH; Zeng, H; et al., JACS 2004 v.126, no.1, p.273-279
50 nm
50 nm
50 nm
50 nmSun, SH; Zeng, H; et al., JACS 2004 v.126, no.1, p.273-279
Figure 2: (A) The growth mechanism and the impact of time on the particle size. (B) Drawing of the generalized reaction set-up. SEM photos of the poly-dispersed nanoparticles obtained from this synthetic protocol.

18
with small amounts of oleic acid and oleylamine. Further centrifugation was used to
remove any un-dispersible precipitates in the hexane. The final FeMnO nanoparticles are
stored in hexane with small amounts of stabilizers (oleic acid and oleylamine). A similar
procedure was used for the synthesis of the Fe3O4 nanoparticles.
3.1.2 Preparation of Water Soluble Nanoparticles
In a typical nanoparticle-micelle synthesis procedure, a concentrated suspension
of nanoparticles in chloroform was added to an aqueous solution containing a mixture of
surfactants or phospholipids. Addition of the nanoparticle chloroform suspension into the
surfactant/lipid aqueous solution under vigorous stirring resulted in the formation of an
oil-in-water micro-emulsion. Evaporation of chloroform during heating (40-80˚C, ~10
minutes) transfers the nanoparticles into the aqueous phase by an interfacial process
driven by the hydrophobic van der Waals interactions between the primary alkane of the
stabilizing ligand and the secondary alkane of the surfactant, resulting in
thermodynamically defined inter-digitated bilayer structures surrounding each
nanoparticle and form nanoparticle-micelles.
3.2 NMR Experimental Details
The solution state 1H NMR spectra were obtained on a Bruker DRX400
instrument at an observed frequency of 400 MHz using standard conditions at room
temperature and a 5mm double resonance probe. The chemical shifts were referenced to
the secondary external standard TMS (δ = 0 ppm). The spin-lattice relaxation time T1 was
measured using an inversion recovery pulse sequence, while the spin-spin relaxation time
T2 was measured using a Hahn echo. Both sets of data were fit using the Bruker software

19
XWINMR by integrating over the entire peak and fitting the exponential curves. For
initial measurements, 1 µL of the superparamagnetic nanoparticles were added to 500 µL
of DI H2O. To study the effects of concentration, additional 2 µL aliquots of sample were
added to the test tube, and the relaxation measurements were taken. The range of
paramagnetic materials added was 1-11 µL. The tubes were shaken immediately prior to
the relaxation measurements to ensure that the paramagnetic beads were not settled in the
bottom of the test tube. The relaxivities were calculated by fitting the measured relaxation
rates to Eqn. 2.4.
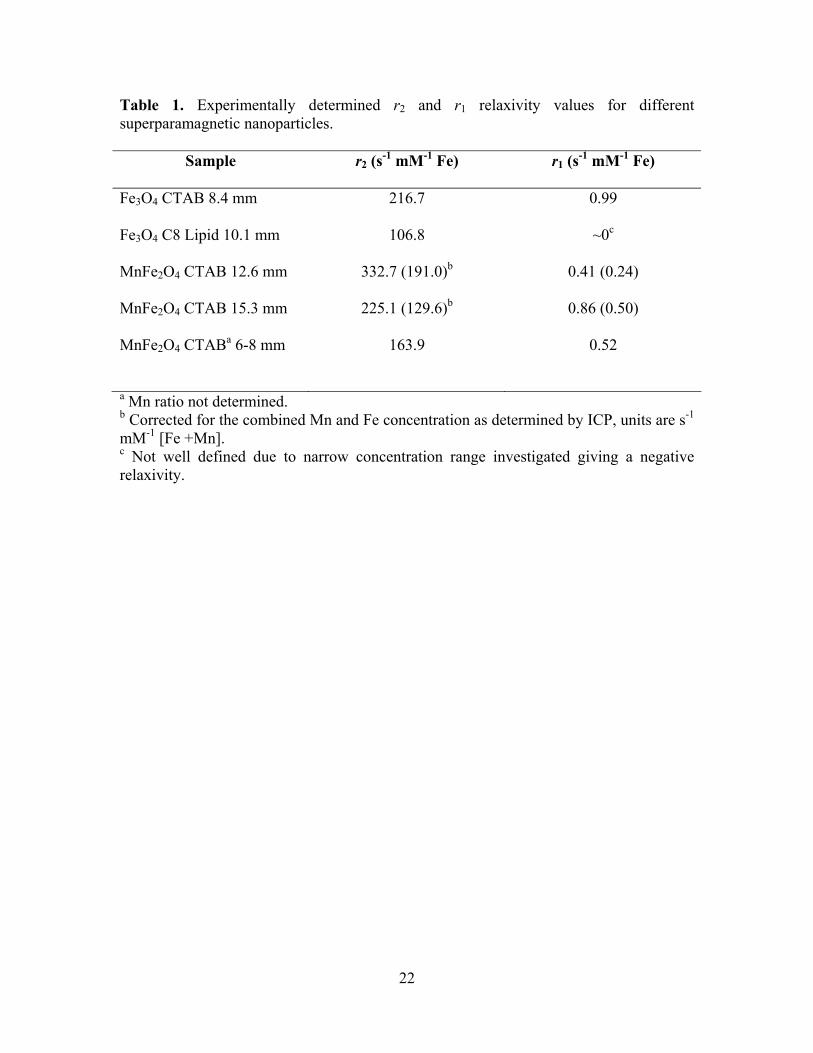
3.3 Particle Size Versus Relaxation
The spin-spin relaxation rate R2 ( = 1/T2) as a function of Fe concentration for the
different superparamagnetic nanoparticles is shown in Figure 3. The spin-lattice
relaxation rate R1 ( = 1/T1) as a function of Fe concentration for the different
superparamagnetic nanoparticles is shown in Figure 4. The measured relaxivities are
given in Table 1. Even though the sample selection is limited a few observations can be
made. The MnFe2O4 nanoparticles show the highest relaxivity, but this can be attributed
to the large nanoparticle size, plus the presence of Mn which is also paramagnetic. ICP
(inductively coupled plasma) atomic adsorption analysis was used to determine the
solution Mn and Fe concentrations. The Mn/Fe ratios observed by ICP experimentally for
the MnFe2O4 nanoparticles were 1/1.37 and 1/1.57 for the 12.6 and 15.3 nm particles,
respectively. This is significantly different from the 1/2 ratio predicted based on chemical
formulation. This result demonstrates that the compositions of the synthesized
nanoparticles were not the ratio formulated, and suggests a higher ratio of Mn

20
incorporation into the nanoparticles. The relaxivity rates can be corrected for the presence
of Mn and are also given in Table 2. Following this correction for the measured
concentration of Mn, the Fe3O4 CTAB modified superparamagnetic nanoparticle (8.4
mm) gave both the highest r2 and r1 relaxivity. A comparable C8 lipid modified
nanoparticle gave a r2 relaxivity that was ~2 times smaller, but analysis of this sample
was difficult due to the very low concentration thus limiting the range of concentrations
measured in the relaxation experiments. Part of this difference may arise from
aggregation effects of CTAB versus C8 lipid, as this is also known to greatly influence
relaxivity.
There is an initial increase in the relaxivity with increasing size for the MnFe2O4
nanoparticles, followed by a decrease in the observed r2 and r1 relaxivity above ~ 12 nm.
This is in contrast to previous studies that show a steady increase in the relaxivity with
increasing particle size through 15 nm [38]. Part of this discrepancy may arise from the
observed frequency at which these experiments were performed (400 MHz versus 40 to
60 MHz). Our initial goal was to measure these relaxivities at the lower field strengths
using the MAGRITEK console system described in Section 7, but this milestone was not
completed prior to the ending of this project.

21
1/T2 vs "concentration"400 MHz
Fe Concentration (mmoles/L)0 1 2 3 4 5
1/T
2 (s-1
)
0
200
400
600
800
1000
1200
1400
1600Fe3O4 CTAB 8.4 nmFe3O4 C8 lipid 10.1 nmMnFe2O4 CTAB 12.6 nmMnFe2O4 CTAB 15.3 nmMnFe2O4 CTAB 6-8 nmRelaxivity Regression
Figure 3: The variation of the water R2 relaxation rate with concentration for a series of different superparamagnetic nanoparticles.
22
Table 1. Experimentally determined r2 and r1 relaxivity values for different superparamagnetic nanoparticles.
Sample r2 (s-1 mM-1 Fe) r1 (s-1 mM-1 Fe)
Fe3O4 CTAB 8.4 mm 216.7 0.99
Fe3O4 C8 Lipid 10.1 mm 106.8 ~0c
MnFe2O4 CTAB 12.6 mm 332.7 (191.0)b 0.41 (0.24)
MnFe2O4 CTAB 15.3 mm 225.1 (129.6)b 0.86 (0.50)
MnFe2O4 CTABa 6-8 mm 163.9 0.52
a Mn ratio not determined. b Corrected for the combined Mn and Fe concentration as determined by ICP, units are s-1 mM-1 [Fe +Mn]. c Not well defined due to narrow concentration range investigated giving a negative relaxivity.

23
1/T1 vs "concentration"400 MHz
Fe Concentration (mmoles/L)0 1 2 3 4 5
1/T
1 (s-1
)
0
2
4
6
Fe3O4 CTAB 8.4 nmFe3O4 C8 lipid 10.1 nmMnFe2O4 CTAB 12.6 nmMnFe2O4 CTAB 15.3 nmMnFe2O4 CTAB 6-8 nmRelaxivity Regression
Figure 4: The variation of the water R1 relaxation rate for a series of different superparamagnetic nanoparticles.
24
3.4 Impact on Project Nano-Detection Scheme
Based on these limited results it appears that superparamagnetic Fe3O4
nanoparticles should be employed as they give a higher relaxivity than the MnFe2O4
nanoparticles. These results also demonstrated that there is a high degree of variability in
the Mn/Fe ratio with changes in particle size, suggesting a non-uniform precipitation
event is occurring during the colloidal preparation of these nanoparticles. Unless this
variation can be better controlled the utility of the mixed MnFe2O4 nanoparticles for
quantitative detection work is highly questionable. Finally, one of the milestones for this
project was the bio-conjugation of these Sandia prepared nanoparticles to anti-bodies. It
was hoped that these smaller nanoparticles could be tested and compared to the larger
commercially available SPIONs utilized in Section 6. Unfortunately, this work was not
completed.

25
4. Solenoid Detection Coil Development
Under this LDRD program two separate µ-coil detection platforms were explored.
The first (described here) is based on the most common solenoid coil design, but utilizes
a unique production method. The second detection design utilizes a planar µ-coil, and
will be described in Section 5. The final objective was to construct µ-coils where the
detection volume was on the order of 100’s of µm in order to optimize the effect of
superparamagnetic nanoparticle relaxation.
4.1 Analysis of Coil Resistance and SNR for Thin Ribbon Wirea
The fabrication technique that produces the focused ion beam (FIB) solenoid µ-
coil (details in section 4.2) utilized a metal plating process with very thin films. The film
thickness greatly impacts the performance of the µ-coil, and raises some theoretical
limitations (discussed in this section). When the dimensions of the wires of a coil
operated at RF frequencies become large when compared to the skin depth, the resistance
of the coil becomes much larger than one would expect based on the coil’s cross-
sectional area. The reason is that the eddy currents induced in the wire by the alternating
magnetic field due to the RF current tend to force the current to the outer regions of the
wire. Hence the area of the wire carrying current is reduced. At high frequencies, the
current is effectively confined to a region within a skin depth of the wire surface.
Peck, Magin, and Lauterbur offer an analysis of micro-coils built with wires of
circular cross-section [39]. The dependence of coil signal–to-noise (S/N) on design
parameters such as the coil diameter and number of turns is given both in the limit of
large wire diameter, appropriate for conventionally sized NMR solenoid coils, as well as
a This detailed analysis was provided by Andrew McDowell at New Mexico Resonance, Albuquerque, NM.

26
the limit in which the wire diameter becomes less than the skin depth (δ), a limit which
can be approached with µ-coils. Peck, et al., assume some geometrical constraints (coil
aspect ratio of h/dcoil =1.5, coil spacing relative to wire diameter of s/d = 1.5), which may
or may not be important for the ribbon wire coil. Hence, we extend their theoretical
considerations.
The signal-to-noise ratio (SNR) per unit sample volume for a solenoidal coil of
fixed aspect ratio (h/dcoil) in which the coil resistance is the dominant noise source can be
expressed:
20 / coil
coil
n dSNRR
ω∝ (4.1)
The constraints of coil geometry, combined with the skin depth, result in the SNR with
dependence on Rcoil, n, dcoil, and ω0, which are the coil resistance, number of coils, coil
diameter and observed frequency, respectively. These dependencies change form as a
function of wire size and shape. This allows us to ask: “Given a sample size and shape,
how many turns should the coil have?” To place the ribbon wire results in context, we
first summarize the circular wire results of Peck et al. [39].
4.1.1 Small Wire Limit
In the limit of small wires or large skin depth (d/δ <<1), the entire cross sectional
area of the wire carries current. At a fixed aspect ratio (h/dcoil) and relative turn spacing,

27
the diameter of the wire must decrease as the number of turns of wire is increased. The
coil resistance is given by
3
coilcoil
nRd
∝ (4.2)
One power of n comes from the length of the wire, while the other two come from the
decrease in cross-sectional area of the wire. Increasing dcoil serves to lengthen the wire,
but also provides for an increase of the wire diameter since the overall length scale of the
coil is increased. The expected signal-to-noise ratio is now given by
20
coil
SNRndω∝ (4.3)
which is the same as Eqn. [8] in Peck et al. [39].
4.1.2 Large Wire Limit
In the limit of small skin depth or large wire (d/δ >>1), the circular wire only
carries current in the region within one skin depth of its surface. Hence the effective
cross-sectional area of the wire is reduced to πdδ, which yields a coil resistance given by
20coilR n ξ ω∝ (4.4)

28
where ξ is used to account for the proximity effect, in which eddy currents due to the flux
from neighboring wires contribute to the redistribution of the current. One expects 1< ξ
< 3, roughly. The dependence on ω0 comes from the skin depth. The dependence on n
and dcoil is reduced from the small wire result (Eq. 4.2) because a reduction in the wire
diameter has a smaller impact on the effective cross-sectional area than for the small-wire
case. The corresponding SNR equation is
7 / 40
coil
SNRd
ωξ
∝ (4.5)
4.1.3 Ribbon Wire, Intermediate Limit
A flat ribbon wire allows an intermediate situation, in which the skin depth is
small compared to the wide dimension but large compared with the thin dimension. At
an observed frequency of 44.6 MHz, the skin depths of copper and gold are 10 µm and
12 µm, respectively. Hence, the proposed ribbon of dimensions 45 µm x 5 µm falls into
the intermediate limit. In this limit, the current will be confined to a region of width δ
near the edges of the ribbon. If we let τ be the thin dimension, the effective cross
sectional area of the wire is 2τδ, yielding a coil resistance of
0coilcoil
n dR
ξ ωτ
∝ (4.6)

29
Since the width of the ribbon has no impact on the effective area in this limit, the
influence of either n or dcoil is “reduced” even below that of the small circular wire case.
The corresponding signal-to-noise equation is
( )
7 / 40
3/ 2coil
nSNRdω τ
ξ∝ (4.7)
4.1.4 Ribbon Wire in the Small Wire Limit
As the ribbon width (w) is reduced, eventually the skin depth is less than w/2. In
this limit, the entire wire once again carries current. In this case, the effective cross
sectional area is simply τw. In this limit, the width of the ribbon wire is inversely
proportional to the number of turns, for fixed coil length. Hence the resistance is
2
coilcoil
n dRτ
∝ (4.8)
We have dropped reference to the proximity effect factor ξ under the assumption that
current already spread across the wire will not be significantly moved by flux from
neighboring turns. This yields
( )
20
3/ 2coil
SNRdω τ∝ (4.9)
30
Note that this result is comparable to the LARGE wire limit not the small wire limit for
round wire. The reason for this apparent discrepancy is that the cross sectional area for
the ribbon is inversely proportional to n, just as in the large (round) wire limit. Note that
it is possible to reach the narrow wire limit without having wire width w, be inversely
proportional to the number of turns. Such a coil would have a large turn-to-turn spacing
(and weak proximity effect). In this case the resistance would be given by
coilcoil
n dRwτ
∝ (4.10)
This yields
( )
20
3/ 2coil
n wSNRd
ω τ∝ (4.11)
This result indicates that such a coil is poorly engineered, at least from a signal to noise
perspective; the SNR could be increased by increasing either n or w so that there is not so
much excess space between turns.

31
4.1.5 Implication for Coil Design
In Peck [39], the coil aspect ratio (h/ dcoil) and turn-to-turn spacing (s/d) are held
fixed, both at a value of 1.5. For the ribbon coil in the intermediate limit, there is no
reason to impose the turn spacing limit, aside from considerations that closely spaced
turns might boost the strength of the proximity effect (i.e., the value of ξ). Assuming that
we will build a ribbon coil that does not violate the spirit of these constraints, we might
directly compare the above results:
Table 2. SNR variation for coil design limits.
Limit SNR Dependence
Small wire (d << δ) coilnd
20ω
Large wire (d >> δ) ξ
ωcoild
4/70
Ribbon (intermediate limit) ( ) ξτω
2/3
4/70
coildn
Ribbon (small wire limit) ( ) 2/3
20
coildτω
The ribbon wire in the intermediate size limit encourages maximizing the number of
turns, while the small wire limit encourages a low number of turns. The microcoils built
for the experiments of Peck, et al. [39], had only 5 turns. Note that the benefit of

32
minimizing the coil size scale is larger for the ribbon coil than for the other types. The
above equation describes the benefits of maximizing the number of turns for a ribbon coil
up to the limit when the ribbon wire width becomes only a few skin depths. Beyond that
limit, increasing the number of turns requires decreasing the width. In this case, the
ribbon is no longer in the intermediate limit, but is more like the large wire. In a similar
vein, the thickness of the ribbon can be increased up to a limit set by twice the skin depth
before the intermediate limit is breached. In this case, additional thickness has no impact
on the coil performance, since adding ribbon thickness can be done without changing n.
It would appear that the optimal ribbon geometry would be a thickness
mt µδ 202 ≈≤ and a width of mw µδ 202 ≈≥ .
4.2 Fabrication Details
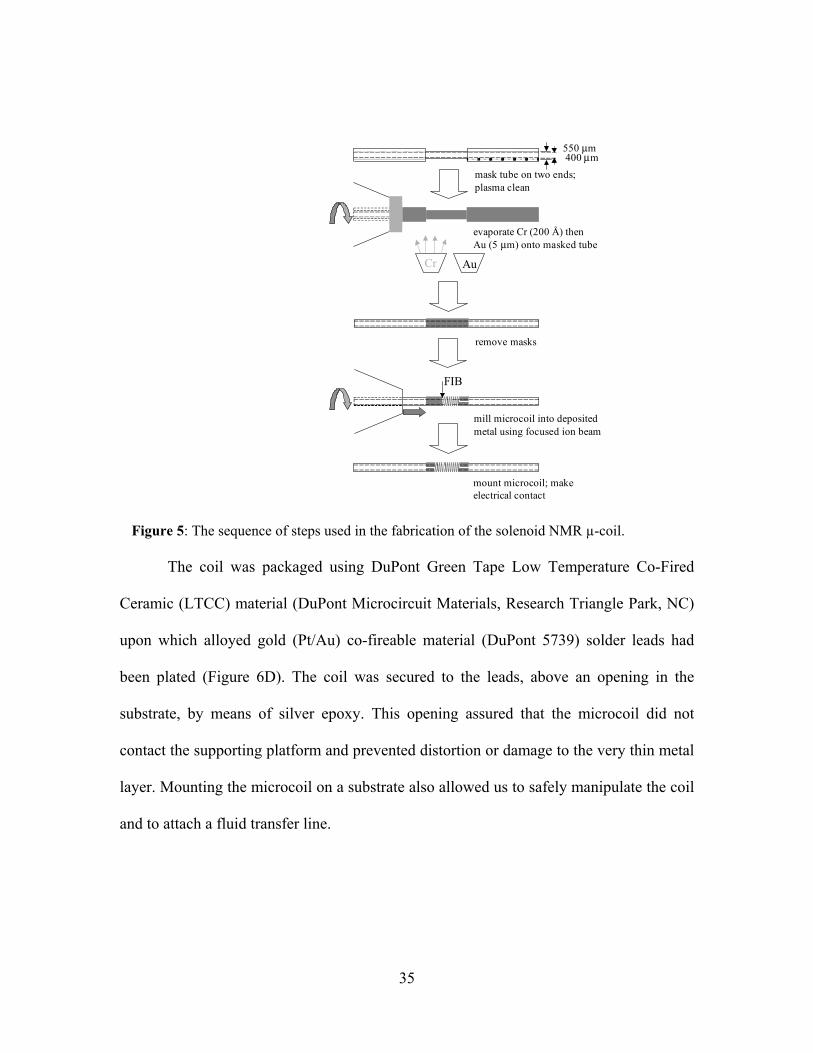
The solenoid µ-coils were fabricated [40] onto 2.5-cm long quartz tubes
(Vitrocom, Mountain Lakes, NJ) having a 550 µm outer diameter and 400 µm inner
diameter using the procedure depicted in Figure 5. These coil dimensions will commonly
be denoted as 550/400. Each tube was cleaned using hydrogen peroxide followed by
acetone and isopropyl alcohol. After wet chemical treatment, the tubes were masked on
each end, and the 6.2 mm unmasked center targeted for metal deposition was etched for
15 min using an 100 W O2/Ar plasma. The central region length was chosen based on the
coil design with two 2-mm long cuffs on either end. The masked tubes were mounted into
individual pin vice fixtures for metal deposition. A stage having eight individual rotation
stations contained within a high-vacuum thin film deposition chamber allowed for
simultaneous coating of multiple tubes at a constant working distance of 35 cm. Electron

33
beam evaporation was used to deposit a thin Cr layer (200 Å ) followed by a relatively
thick Au layer (5 µm) around the circumference of the tubes. Deposition rates were
chosen to minimize the stress in the layers. After removal of the tubes from the
deposition system, the masks were removed using acetone, and the tubes were re-
mounted into pin vice fixtures for rotation within the focused ion beam (FIB) system.
Thirty keV Ga ions emitted from a liquid metal ion source were used to remove the
Au/Cr layer in order to define the coil and the neighboring cuffs. The ion beam was
focused to a width of approximately 0.5 µm using a dual-lens Magnum ion column (FEI
Co., Hillsboro, OR) and steered across areas outlined by the operator until all the metal
was removed from targeted regions. Rates of metal removal were on the order of 10
µm3/s when using a 20 nA Ga beam. Minimal heat and force accompany FIB
bombardment. The secondary electron intensity was monitored during ion bombardment
to ensure complete removal of metal and slight penetration into the quartz. An example
coil is shown in Figure 6A with areas removed by the FIB appearing relatively dark due
to the low secondary electron intensity. As indicated in Figure 5, step 4, and the
schematic in Figure 6B, the sample was rotated by an in-vacuum, single-axis rotary stage
and translated by a high precision x–y stage along the tube axis in order to define a helix
[40]. The motion-control system, consisting of an ultra-high vacuum compatible stepper
motor (controlled by a Princeton Research Instruments stepper motor unit) and a
reduction gear assembly, could orient a sample with 0.25o precision. This FIB method
could likely be extended to fabricate coils onto much smaller tubes having <50 µm OD.
The finished metal coil used in this initial 550/400 coil (Figure 6C) had 28 turns over a
length of 2.1 mm. The coil conductors were 65 µm wide with a gap between turns of 10

34
µm. The sample detection volume within the NMR microcoil was 264 nL. The filling
factor was (400/550)2 = 53%. On the 2-mm long metal cuffs, the FIB removed a 10-µm
wide line parallel to the tube axis in order to interrupt conduction. The secondary electron
detector within the FIB system also enabled registration of the coil turns. The direct
current resistance (Fluke model 179) of the coil was found to be 5.42 Ω . The resistivity
of our evaporated Au is 2.898 µ Ω -cm (measured on a flat substrate), somewhat higher
than bulk Au. Using this value and the geometry of the coil, we calculate a DC resistance
of 4.3 Ω . This differs from the measured resistance, perhaps due to contact resistance in
the silver epoxy used to attach the coil to the circuit board. The microcoil inductance was
calculated to be 93 nH.
35
The coil was packaged using DuPont Green Tape Low Temperature Co-Fired
Ceramic (LTCC) material (DuPont Microcircuit Materials, Research Triangle Park, NC)
upon which alloyed gold (Pt/Au) co-fireable material (DuPont 5739) solder leads had
been plated (Figure 6D). The coil was secured to the leads, above an opening in the
substrate, by means of silver epoxy. This opening assured that the microcoil did not
contact the supporting platform and prevented distortion or damage to the very thin metal
layer. Mounting the microcoil on a substrate also allowed us to safely manipulate the coil
and to attach a fluid transfer line.
Figure 5: The sequence of steps used in the fabrication of the solenoid NMR µ-coil.
remove masks
Cr Au
evaporate Cr (200 Å) thenAu (5 µm) onto masked tube
FIB
mill microcoil into depositedmetal using focused ion beam
mask tube on two ends;plasma clean
550 µm400 µm
mount microcoil; makeelectrical contact

36
Figure 6: Focused ion beam lathe machining of the NMR microcoil. (A) Scanning electron micrograph of a coil during the machining process. (B) Schematic of the Ga ion beam machining process. (C) SEM of the coil tested in this work. (D) The finished NMR l-coil mounted on a low temperature co-fired ceramic substrate with electrical connections. In addition to this 550/400 µ-coil, two other coils were fabricated using similar
procedures described above. The coils were fabricated on a 175 µm OD fused quartz
capillary with an inner ID of 100 µm (175/100). The first coil utilized a 60 µm conductor
width, 10 µm insulator width to give a 10 turn coil. The second 175/100 µ-coil utilized a
30 µm conductor width, with a 10 µm insulator width to give a 16 turn µ-coil. The
predicted resistance for these µ-coils was 0.52 and 1.6 Ω , respectively.
4.3 Micro-Coil Tuning Circuit
Although the 93 nH inductance of the microcoil could reach resonance at 44.2
MHz with a variable capacitor of reasonable size, we plan to work with much smaller
37
coils in the future. Such small coils are typically operated at higher frequencies [15],
where directly resonating the small inductance is feasible. This will not be an option for
smaller coils at 44.2 MHz or less, a fact that motivated us to seek alternative ways of
tuning the microcoil.
Our tuning solution was to build an auxiliary tank circuit with conventional scale
capacitors and to connect the microcoil to it. The key parameter of our microcoil that
guided the design of this tuning circuit was its very high resistance. Optimization of a
coil’s SNR is a compromise between maximizing coil efficiency, in terms of the
magnetic field produced at the sample per unit current in the coil, while minimizing the
resistive noise. The dominant noise source for our very thin, ribbon-wire coils was the
large coil resistance [39]. Therefore, the introduction of the inductor did not degrade
performance, because this extra inductance did not contribute to the losses. Our
microcoil made such a small contribution to the resonant inductance that its function was
really that of a resistor.
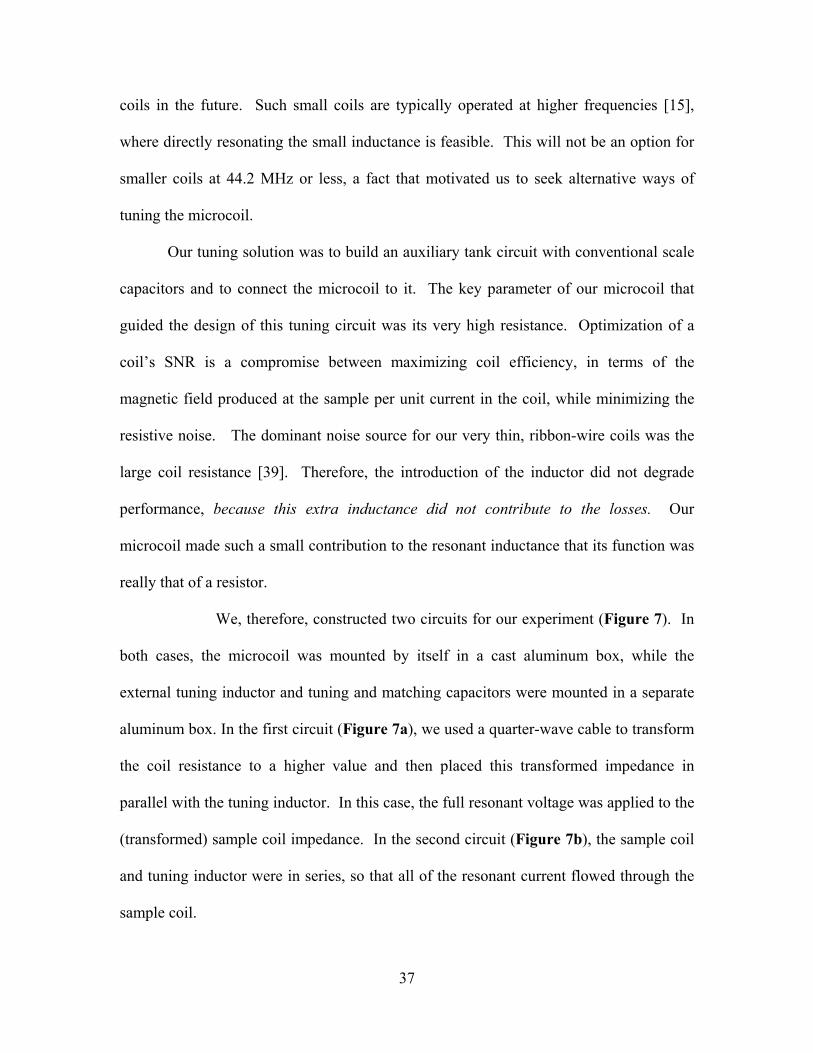
We, therefore, constructed two circuits for our experiment (Figure 7). In
both cases, the microcoil was mounted by itself in a cast aluminum box, while the
external tuning inductor and tuning and matching capacitors were mounted in a separate
aluminum box. In the first circuit (Figure 7a), we used a quarter-wave cable to transform
the coil resistance to a higher value and then placed this transformed impedance in
parallel with the tuning inductor. In this case, the full resonant voltage was applied to the
(transformed) sample coil impedance. In the second circuit (Figure 7b), the sample coil
and tuning inductor were in series, so that all of the resonant current flowed through the
sample coil.

38
The two circuits exhibited nearly identical SNR performance. All subsequent
measurements were performed with the first circuit (Figure 7a), because the remote
placement of the tuning and matching elements made it more convenient to work with.
The external “tuning” inductor in this circuit was 5 turns of 14 gauge bare copper wire,
with a calculated inductance of 0.25 µH, and a calculated resistance at 44.2 MHz of 0.07
Ω. The tuning and matching capacitances were both ~22 pF. The large value of the
matching capacitance resulted from the high losses in the microcoil. Because our
Wavetek radio frequency sweeper operates at the mW level, and we were reluctant to
subject our coil to this power, we estimated the Q of the resonant circuit by constructing a
mockup of the microcoil using robust 36 gauge copper wire and a 5 Ω resistor. The
mockup circuit had a Q of about 10, as measured from the half-power points on the
sweeper output. We also calculated the Q of the coil based on its D.C. resistance,
calculated inductance, and resonance frequency (Q = ωL/R) which gave a similar Q value
of 5.
39
Figure 7: Tuning and matching circuits for low-inductance sample coils at low frequency.
4.4 Low-Field NMR Experimental Details
The 1H NMR measurements, at a resonant frequency of 44.2 MHz, were
performed using a MRTechnology (Tsukuba City, 300-2642 Japan) console, interfaced to
a 1.04 Tesla NEOMAX permanent magnet developed for small animal MRI, but a
suitable smaller magnet could be fabricated to be used with the microcoil set up. This
system resides at New Mexico Resonance, Albuquerque, NM. The implementation of a
second micro-NMR console utilizing a MAGRITEK system and a 0.96 Tesla magnet at
Sandia National Laboratories is described in Section 7. The transmitter pulses were
output directly from the console, without a conventional radiofrequency power amplifier
≈ λ/4
CM
CT L
Microcoil
Tuning/matching circuit
CM
CT L Microcoil
Tuning/matching circuit
A
B

40
because only 0.25 mW of power was required to produce a B1 field of 0.3 Gauss (vide
infra). Liquid samples were imbibed directly into the coil form. Ethanol (100 %) was
purchased from AAPER (Shelbyville, KY).
4.5 Low-Field NMR Testing of Solenoid Micro-Coil b
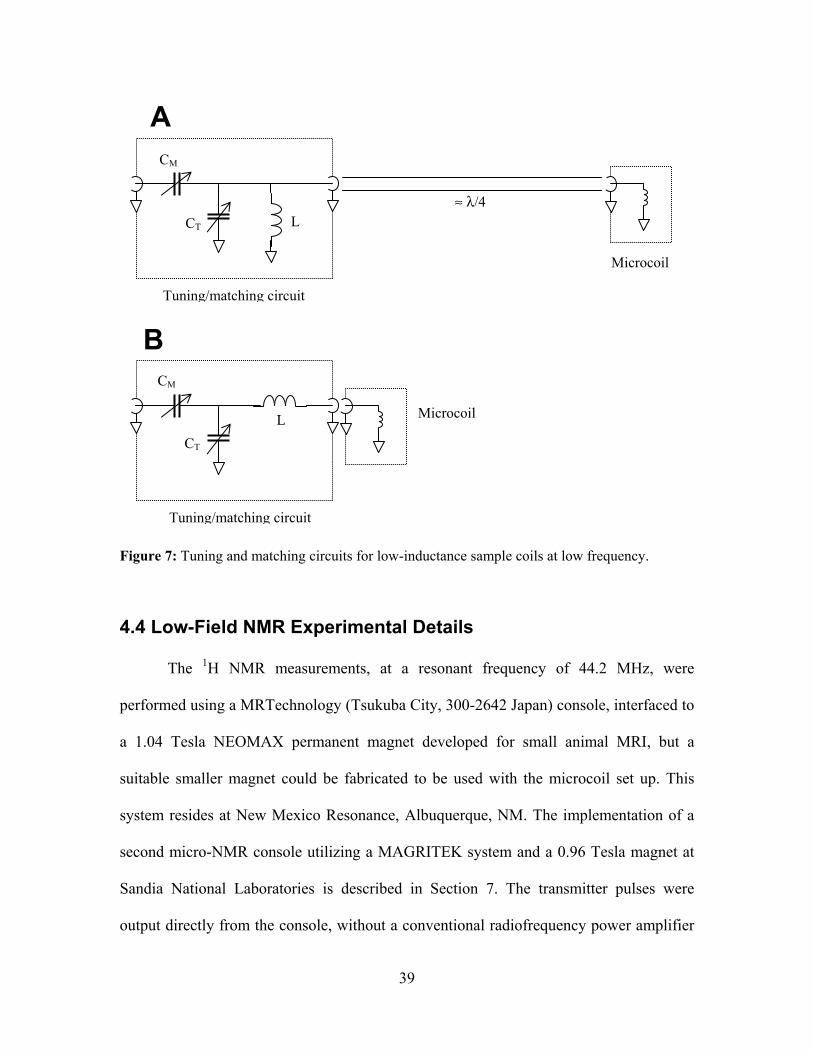
The magnetization nutation performance of the solenoid µ-coil is shown in
Figure 8, where the signal intensity, after an excitation pulse, from a sample of de-
ionized water, is plotted as a function of pulse width α. The data followed a typical sin(α)
curve, indicating uniform sample excitation by a homogeneous RF field. The π-pulse
width, determined from fitting the sine curve, was 397 ± 4 µs. The transmitter amplitude
was 0.32 V (peak-to-peak), corresponding to a power into 50 Ω of only 0.25 mW. A π/2-
pulse time of 200 µs corresponds to an RF field strength of 0.3 G (or 1.25 kHz), which is
produced in our coil by a current of 1.8 mA.
b This work has recently been published, Laurel O. Sillerud, Andrew F. McDowell, Natalie L. Adolphi, Rita E. Serda, David P. Adams, Michael J. Vasile, Todd M. Alam, “1H NMR Detection of Superparamagnetic Nanoparticles at 1T Using a Microcoil and Novel Tuning Circuit”, J. Magnetic Resonance, 181 (2006), 181-190.
41
Figure 8: Determination of the π-pulse width in the µ-coil from a water sample.
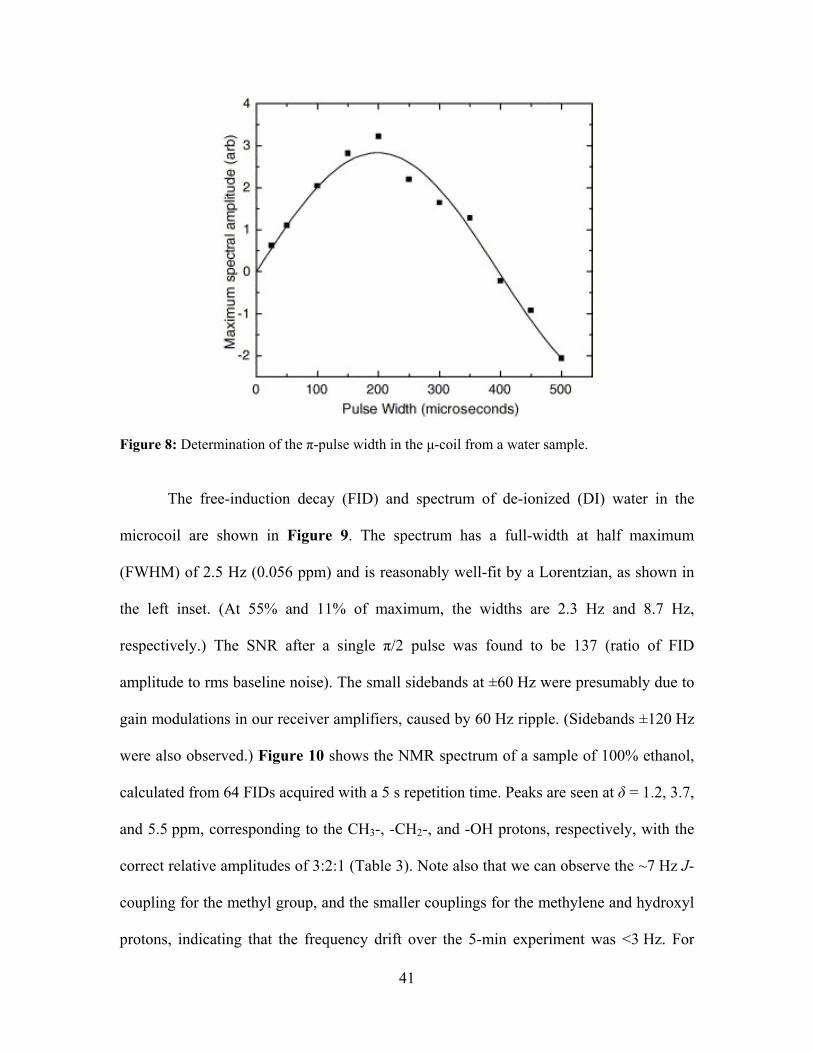
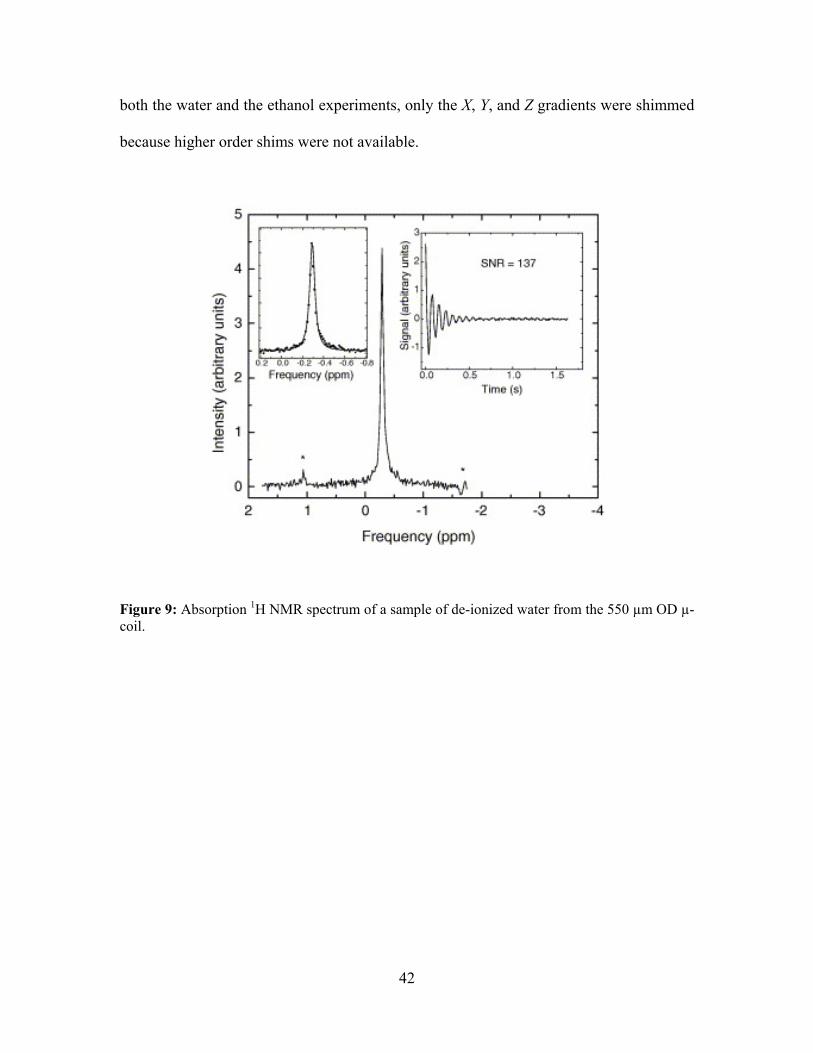
The free-induction decay (FID) and spectrum of de-ionized (DI) water in the
microcoil are shown in Figure 9. The spectrum has a full-width at half maximum
(FWHM) of 2.5 Hz (0.056 ppm) and is reasonably well-fit by a Lorentzian, as shown in
the left inset. (At 55% and 11% of maximum, the widths are 2.3 Hz and 8.7 Hz,
respectively.) The SNR after a single π/2 pulse was found to be 137 (ratio of FID
amplitude to rms baseline noise). The small sidebands at ±60 Hz were presumably due to
gain modulations in our receiver amplifiers, caused by 60 Hz ripple. (Sidebands ±120 Hz
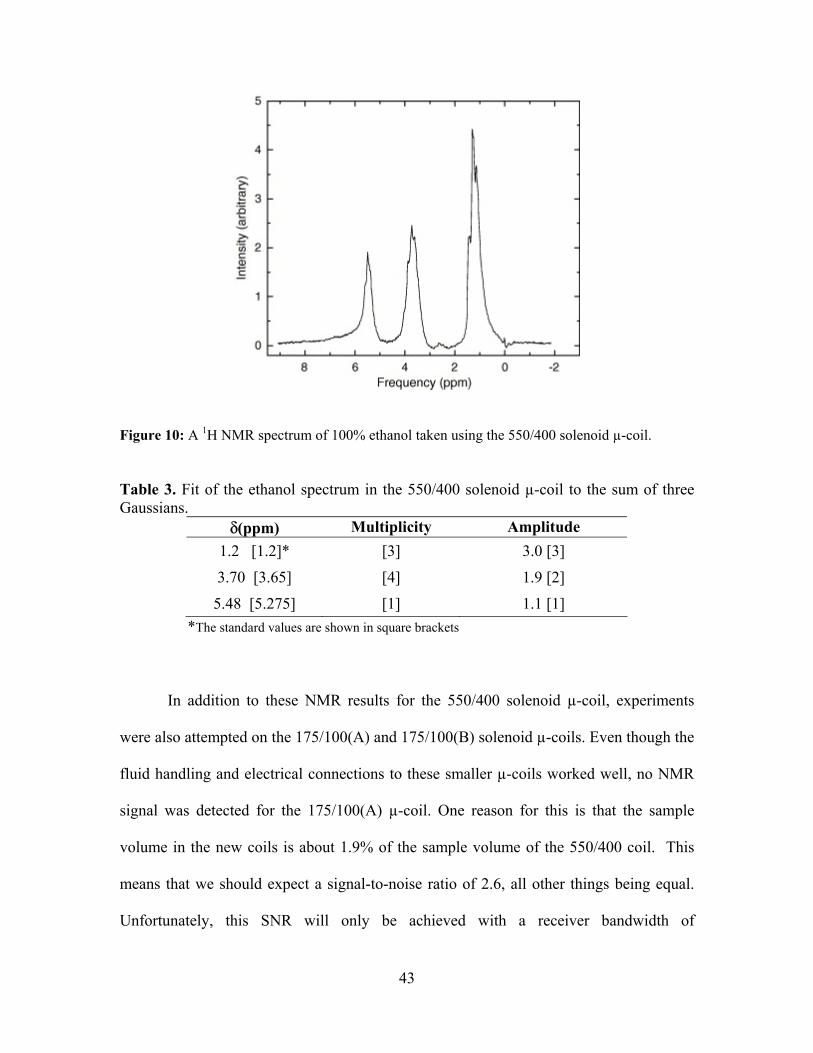
were also observed.) Figure 10 shows the NMR spectrum of a sample of 100% ethanol,
calculated from 64 FIDs acquired with a 5 s repetition time. Peaks are seen at δ = 1.2, 3.7,
and 5.5 ppm, corresponding to the CH3-, -CH2-, and -OH protons, respectively, with the
correct relative amplitudes of 3:2:1 (Table 3). Note also that we can observe the ~7 Hz J-
coupling for the methyl group, and the smaller couplings for the methylene and hydroxyl
protons, indicating that the frequency drift over the 5-min experiment was <3 Hz. For
42
both the water and the ethanol experiments, only the X, Y, and Z gradients were shimmed
because higher order shims were not available.
Figure 9: Absorption 1H NMR spectrum of a sample of de-ionized water from the 550 µm OD µ-coil.
43
Figure 10: A 1H NMR spectrum of 100% ethanol taken using the 550/400 solenoid µ-coil. Table 3. Fit of the ethanol spectrum in the 550/400 solenoid µ-coil to the sum of three Gaussians.
δ(ppm) Multiplicity Amplitude 1.2 [1.2]* [3] 3.0 [3]
3.70 [3.65] [4] 1.9 [2]
5.48 [5.275] [1] 1.1 [1] *The standard values are shown in square brackets
In addition to these NMR results for the 550/400 solenoid µ-coil, experiments
were also attempted on the 175/100(A) and 175/100(B) solenoid µ-coils. Even though the
fluid handling and electrical connections to these smaller µ-coils worked well, no NMR
signal was detected for the 175/100(A) µ-coil. One reason for this is that the sample
volume in the new coils is about 1.9% of the sample volume of the 550/400 coil. This
means that we should expect a signal-to-noise ratio of 2.6, all other things being equal.
Unfortunately, this SNR will only be achieved with a receiver bandwidth of

44
approximately 312 Hz, and a very uniform magnetic field. These requirements make
finding the resonance very difficult, and we did not see a signal. The double-pitch
175/100(B) coil should have twice the sensitivity of the 175/100(A) coils. In experiments
with this coil, we also added a new audio filter to our apparatus so that we could achieve
reliable filtering down to 125 Hz bandwidth. In tuning up this new coil, we noted that the
electrical resonance was broader than expected. The reason for this is that the coil has a
high resistance, even at DC. This resistance is about 3 times higher than calculated from
the coil geometry. It turns out that ALL the tube-based coils have this same defect,
which seriously compromises their performance as NMR detectors. We did not succeed
in seeing a signal with the double-pitch 175/100(B) coil, even with careful filtering and
searching for the resonance. We attribute this to the high resistance of this coil, which
leads to high noise levels that obscure the small signal that we expect. We cannot be sure
of the source of the high resistance, since we cannot make our own contacts to the tube-
based coil itself, owing to its fragility. However, the fact that both 550/400 coils and
175/100 coils both show a factor of 3 enhancement in their resistance seems to implicate
the plated metal layer out of which the coils are formed.
4.6 Impact on Micro-NMR Development
These results show that while these FIB fabricated NMR µ-coils can be used to
obtain results they have several limitations. The primary limitation is the high resistivity
observed in the µ-coils, which is ~ 3 times higher than that expected theoretically. This
high resistance severely degrades the performance of the µ-coils, and has resulted in the
inability to detect signal at the smaller coil dimensions. This clearly shows that the film
thickness for these type of coils needs to approach two times the skin depth thickness (2δ
45
~ 20 µm) to regain the performance. Couple this resistance issue with the complexity of
this fabrication technique and this detection platform does not appear to be one that
should be readily pursued. If a method could be developed for easy fabrication of
solenoid µ-coils with thick wire thickness, then this design would need to be re-
evaluated.
5. Planar Spiral Micro-Coil Development
The second NMR µ-coil detection platform investigated was a spiral planar coil
configuration. This type of coil has been studied extensively by other groups, and lends
itself well to lithography-type fabrication.
5.1 Fabrication Details
An Archimedes coil was chosen to provide as much uniformity as possible for a
2-D design. However, most MEMS spirals require front side connections and an
imbedded lead from the inner most winding. Both of these limitations reduced the
effectiveness of placing a highly uniform coil as close as possible to an NMR sample
with unknown geometry. The close proximity of the embedded conductor, typically a few
microns, provides asymmetrical induction in the coil. Also, the placement of electrical
leads on the front side reduces the geometrical space allowed for operation. A choice was
therefore made to provide backside connections so that the inductor could be brought as
close to any NMR sample as possible without unnecessary geometrical limits. Coils were
manufactured on alumina substrates with Au/W filled vias purchased from Micro
Substrates Corporation. The substrates purchased were 500 µm thick, which is sufficient
to eliminate inductive effects from the electrical traces on the backside. Vias were

46
roughly cylindrical with a 75 µm diameter and a minimum pitch of 150 µm and provided
through wafer electrical connections to each side of the coil. A diagram detailing the
process steps required to produce the NMR induction coil is presented in Figure 11. A
metal seed layer was then evaporated onto the bottom side of the substrate prior to spin
casting with 75 µm of NFR-015 resist. After patterning, gold was plated into the resist
mold to a thickness of 61 ± 1 µm across the entire four inch wafer. After electroplating,
the patterned surface was coated again with negative photoresist and flood exposed to
protect the backside of wafer during the remaining processing steps.
Figure 11: Process diagram for production of planar spiral NMR µ-coils.
Next, the top surface of the substrate was coated with a metal seed layer and 75 µm of
NFR-015 resist. The resist was oven baked on a chuck holding the substrate at the edges,
suspending the substrate in air to protect the resist underneath. Gold was plated into the
resist mold after patterning to generate the induction coil. The backside of the substrate
was protected against further plating by additional layer of photo-resist. Again, the
Metallization and resist patterning On backside
W/Au filled vias in Alumina
Au leads electroplated into resist pattern
Resist spun on front side
Coil pattern defined
Resist spun for electrical isolation
Au plated into pattern
Resist stripped

47
thickness and uniformity of the electroplated gold were measured to be 61 ± 1 µm across
the wafer.
After plating, the photoresist was stripped and the metal seed layer was etched to
complete the coils. Figure 12 shows scanning electron micrographs of the top and
bottom side of the substrate. A single isolated coil is shown in the top surface. Metal
vias in the substrate provide contact between each end of the coil and its respective
electrical contact on the backside. The Au/W via shown in Figure 12 (a) is cylindrical in
shape and makes contact with the end of the coil. Dimples seen in Figure 12 (b) indicate
the locations of the embedded vias underneath each lead.
(a) (b)
Figure 12: Gold induction coil on alumina substrate (a) Spiral coil with through wafer via contact
at the end. (b) Backside electrodes with dimples in the electroplated metal directly over the metal
vias.
Figure 13 shows a photograph of a 15 turn spiral coil demonstrating the uniformity of the
spacing and wire thickness. Note that the coil wires are not perfect smooth arcs, but are

48
closely linked linear sections (this can also be seen in Figure 12) resulting from the
initial design program. In addition to these circular coils a series of square µ-coils were
also fabricated (see Appendix 1). A finite element analysis of the B1 field produced by
these square µ-coils showed a very non-uniform excitation profile with nodes present at
each corner. For this reason testing of these square µ-coils was not pursued.
Figure 13: Photograph of a 15 turn circular planar spiral µ-coil.
The performance of these planar µ-coils is controlled by several design features.
These include the width of the wire, the spacing between wires, the height of the wire and
the number of turns. The inter-relationship of these different parameters on the SN
performance of these µ-coils is complex. In Appendix 2 a detailed analysis of the
calculated performance for the different production parameters in presented. The two
constraints imposed for this analysis were an operating frequency of 44 MHz, and an
excitation volume within the center of the planar coils of ~ 500 µm for comparison to the
coil dimensions of the solenoid µ-coil in Section 4. The initial coils produced have coil

49
line widths of 60 and 70 µm, with line spacings varying between 20, 30 or 40 µm and a
wire height of 60 µm. Coils with 3, 7, 10, 12 and 15 turns were produced.
A short comment on reproducibility in the µ-coil is warranted. For the initial 57
spiral µ-coils delivered the DC resistance was measured, with a summary presented in
Appendix 3. Approximately 11% of these coils showed an open circuit (high resistance),
with all of these failures determined to be between the vias and the surface coil itself.
This suggests that the through-via process could be improved for better reproducibility.
The average DC resistivity, and standard deviation (σ) measured for the 3 turn µ-coils
was 50 mΩ and σ = 7 mΩ , for the 7 turn µ-coil was 189 mΩ , with σ = 66 mΩ , for the
12 turn µ-coil was 411 mΩ , with σ = 81 mΩ , and for the 15 turn µ-coil was 552 mΩ ,
with σ = 50 mΩ . This reveals that the standard deviation in the measured resistance
varied considerably from 10% to as high as 30%.
5.2 Low-Field NMR Testing of Planar Spiral Micro-Coils
The experimental details for testing of the planar µ-coils was similar to that for
the solenoid µ-coils described in Section 4.1, and will not be reproduced here. The
samples were placed in a 500 µm/400 µm (OD/ID) capillary, and placed in the center of
the spiral µ-coil. Figure 14 shows the NMR spectrum for a planar 15 turn spiral µ-coil.
The resolution is excellent, with the J-coupling between the different protons well
resolved. This can be compared to the ethanol spectrum shown in Figure 10 for the
solenoid coil. These initial results show that the S/N and resolution are comparable
between the different detection platforms.

50
120 100 80 60 40 20 0 -20 -40 -60 -80 -100 -120
EthanolDW = 2 ms (+/- 0.25 kHz)single shotf0 = 44.2 MHz15 turn circular spiral microcoil400 micron ID capillary
Hz
Figure 14: The 1H NMR spectrum of ethanol obtained using a 15 turn planar µ-coil.
Different circular coil configurations were tested and are summarized in Table 4. The S/N
ratio obtained for these planar µ-coils is ~3 times higher than that observed for the
solenoid µ-coil in Section 4. There does not appear to be a significant change in the
observed performance with changes in the number of coils used in the design. (Note the
3- turn coil results cannot be directly compared since a doped water sample was used for
these initial tests). Additional characterization of these planar µ-coils will be performed
in the future.

51
Table 4: Summary of performance results obtained for a series of planar spiral µ-coils.
#-Turns Sample Q π/2 (µs)a SNR, BW(Hz)b FWHM (Hz)c
15 Ethanol 16 75 310 (± 500 Hz) 1.6
10 DI 25 65 420 (± 125 Hz) 1.2
7 DI 27 62 360 (±250 Hz) 2.5
3 Doped 30 -- 47 (±1000 Hz) ~15 Hz
a Ninety degree RF pulse length. b SNR = signal to noise ratio, BW = band width or filter width. c FWHM = Full width at Half Maximum line width.
5.3 Impact on Micro-NMR Development
These results are encouraging and show that a high level of S/N and narrow line
widths can be obtained using these planar spiral µ-coils. The ability to produce these µ-
coils using existing lithography techniques is promising for future integration with other
micro-devices and delivery systems. The one draw-back is the requirement for the coil to
be perpendicular to the field direction, imposing a size limitation of the gap size in the
magnet. Presently the die cut, and designed electrical connection pads for these µ-coils
impose a 5 mm size limitations. Future fabrication runs could reduce this size maximum
to a few mm without much effort. This will be the NMR µ-coil detection platform that we
pursue for future development in the micro-NMR efforts here at Sandia.

52
6. Demonstration of SPION Detection
In addition to the relaxation experiments on small superparamagnetic
nanoparticles described in Section 3, we also pursued investigations of commercial
magnetic beads or superparamagnetic iron oxide nanoparticles (SPIONs). The question
we wanted to pursue was what detection limit and amplification could be measured by
observing the changes in the water relaxation of solutions containing SPIONs. These
commercial SPIONs are readily obtained, already well characterized, very uniform, and
have surface modifications already designed for bio-conjugation. Our initial
demonstration utilizes the Dynabeads (MyOne Streptavidin) purchased from Dynal Inc.
These beads (shown in Figure 15) are composed of thousands of 8 nm SPION uniformly
dispersed in a polystyrene matrix, coated with a thin layer of polymer and a monolayer of
streptavidin.
Figure 15: Photograph of the 1µm Dynabead containing SPIONs.

53
6.1 Low-Field NMR Relaxation Experiments b
Spin–lattice 1H T1 values were obtained, using a standard inversion–recovery
sequence, from a Gd-DTPA-doped water sample, from a sample of magnetic beads in
water, and from a sample of de-ionized water. Magnetic beads (Dynabeads MyOne
Streptavidin) were purchased from Dynal Inc. The beads are 26% Fe by weight (~10% Fe
by volume) with an average diameter of 1.05 ± 0.10 µm. The stock solution has a stated
bead concentration of between 7 × 10³ and 1.2 × 10⁴ beads per nL (equivalent to ~2.6 mg
Fe/ml). NMR samples were prepared by diluting the same batch of stock solution with
de-ionized water by factors of 10, 100, and 1000 to produce nominal concentrations of
1000, 100, and 10 beads per nL. T2* was determined by collecting a single free-induction
decay (FID) and fitting the resulting spectrum with a Lorentzian, unless noted otherwise.
The relative shift of the NMR frequency of water caused by the magnetic beads was
determined by measuring the resonance frequency of each solution in a 5 mm NMR tube
in a conventional coil relative to a separate tube of deionized water. To avoid errors due
to field drift of the permanent magnet, each frequency shift measurement was performed
by switching several times between the bead solution and a deionized water sample
during a period when the frequency drift was confirmed to be <1 Hz/min. All these
SPION relaxation experiments were performed on the solenoid µ-coil described in
Section 3.
6.2 SPION Induced Relaxation
To test the ability of the NMR µ-coils to measure spin–lattice relaxation times, we
used three different water samples; the first was doped with Gd-DTPA to shorten the T1
to around 70 ms, the second consisted of pure de-ionized water, and the third contained

54
the magnetic beads (at a concentration of 1000 beads/nL) in de-ionized water. In all
cases, a single scan was acquired at each recovery time. Our results (Figure 16) show
that we can accurately measure relaxation times for both shorter (65 ms) and longer (0.6
and 1.0 s) T1 values with a standard inversion–recovery pulse sequence. The 397 µs π-
pulse gave clean inversion of the magnetization for all samples.
Figure 16: Measurement of the NMR spin-lattice T1 relaxation time in solenoid 550/400 µ-coil.

55
In Figure 17 is a comparison of the signal detected from DI water and three different
dilutions of the stock Dynabead solution, corresponding to 1000, 100, and 10 beads/nL.
The magnitude of each FID is shown so that they all appear as if they were on resonance.
The data are acquired after a single π/2 pulse, digitizing at 100 µs per point (200 µs per
point for the deionized water). The data were digitally filtered to achieve an effective
digitization time of 400 µs per point. For the 1000 beads/nL sample, 16 FIDs were
averaged together; the other data are each a single FID. The beads have two effects on the
water spectral peak: the peak broadens and shifts to lower frequencies as the
concentration of beads increases. The reduction in T2* is apparent in the FIDs. The inset
compares the spectra of the four solutions and shows both the line broadening and the
shift to lower frequency caused by the beads. Data for a 1 bead/nL sample (not shown)
were indistinguishable from the DI water data.
Figure 17: The 1H NMR spectra for different Dynabead concentrations.

56
The shift of the water resonance to lower frequency in the presence of the
paramagnetic beads is not surprising when one considers the line shape of water in a
spherical shell of radius r surrounding a magnetized bead. The line shape is a uniaxial
powder pattern (like that of the chemical shift anisotropy) due to the 3 cos2θ − 1
dependence of the z-component of the dipolar field. The most prominent feature of this
line shape is a cusp at lower frequency, corresponding to spins at θ 90, where the z-
component of the bead’s magnetic field is negative. Integrating this line shape over all r
(from rmin, at the surface of the bead, to rmax, the average distance between beads) results
in an approximately Lorentzian line shape.
The solid symbols in Figure 18A give the observed change in * *2 21/ ( )T R∆ due to
the presence of the beads, as a function of bead concentration, C. Here,
* * *2 2beadsolution 2waterR R R∆ = ∆ − ∆ , and *
2R fπ= ∆ , where ∆f is the FWHM in Hz of the
Lorentzian line fit to each spectrum in Figure 17. Note that both axes in Figure 18A are
logarithmic; the straight line (drawn as a guide to the eye) has a slope of roughly 2/3,
indicating that * 2/32R C∆ ∝ over this range of concentrations. The relaxivity * *
2 2( / )r R C= ∆
is therefore not a constant (as defined in Eqn. 2.4), but decreases with increasing
concentration as shown in Figure 18B.

57
Figure 18: (A) Change in R2 relaxation with increasing magnetic bead concentration, and (B) the relaxivity r2 as a function of concentration.
Because magnetic field gradients can cause motion of the magnetic beads with
respect to the fluid, it was not clear a priori that the concentration of beads delivered to
the microcoil would be the same as the concentration in the supply syringe. Indeed, the
measured T2*of bead solutions in the microcoil was observed to decrease over time if the
bead solution was allowed to sit motionless in the coil over several minutes, suggesting
that the spatial distribution of the beads was changing, due to clustering, settling, or
migration out of the coil. Thus, in order to validate the microcoil results, we measured the
T2*of the same bead solutions (1000, 100, and 10 beads/nL) and DI water in capped 5 mm
NMR tubes using a conventional probe in the same magnet. Each measurement was

58
performed within 20–30 s after shaking the tube to homogenize the bead solution, and the
tube was immediately extracted afterwards to visually confirm that the beads had not
settled during the measurement. (Shimming was performed on the DI water, and a sample
holder was used to position the other 5 mm tubes identically, to avoid the need to re-
shim. Repeatedly placing the same sample in the probe using this holder gave line widths
that were reproducible to ±5 Hz.) Migration of the beads was similarly observed in the
5 mm tubes (both visually and as an increase in T2* over time) if the samples were
allowed to sit in the magnet for longer time periods. The *2R∆ values measured for the
bead solutions in 5 mm tubes (open symbols in Figure 18A) are in good agreement with
those obtained for the same concentrations in the microcoil, indicating that the expected
concentrations were delivered to the microcoil.
6.3 Impact on SPION Amplification for Bioagent Detection
The rapid expansion of biomedical applications for magnetic nanoparticles
motivates a concomitant development of the means for detecting small numbers of these
intriguing agents. The most challenging goal is the detection of a single cell or molecule
labeled with one magnetic bead. As discussed above, MR imaging studies [5] indicate
that one bead can measurably influence the water signal in a region of length scale
100 µm surrounding the bead. Hence an NMR microcoil of diameter and length of this
size (i.e., a sample volume of 1 nL) should be optimal for detecting a single magnetic
bead in an in vitro sample. A coil of this size opens up the possibility of a readily portable
NMR system based on a small permanent magnet, as long as the challenges of operating
a microcoil at low frequencies can be met. The line widths for de-ionized water are
adequate for the detection of magnetic beads in water at a concentration of 10 beads/nL.

59
This inherent line width should be improved by going to smaller magnet gap sizes, for
which the field homogeneity is more uniform. Our first results indicate that this approach
will allow the detection of very dilute biological species, perhaps as rare as a single cell
or molecule labeled with a single magnetic bead.
The challenge of achieving this detection sensitivity can be discussed
quantitatively in light of the data of Figures 17 and 18. We envision that in a portable
system, a fluid containing very dilute, magnetically labeled biological objects flows
through a ~1 nL coil while the FID is monitored. The challenge is to detect the difference
between the FID of the background fluid and the same fluid containing one magnetic
bead within the coil volume. Considering Figure 17, we see that we can readily detect the
change in T2* of water due to 10 beads/nL, or roughly 3000 magnetic beads in our current
prototype microcoil (264 nL volume). If we can achieve a similar T2* for DI water (
100 ms) and adequate SNR in a coil with a 1 nL sample volume, we should easily be able
to detect 10 beads. Extrapolating the straight line in Figure 18A suggests that the *2R∆ of
one bead in a 1 nL volume is ~8 s−1, which would have caused an increase in the line
width of water in our current microcoil from ~3 to ~6 Hz. This increase should have been
detectable given our high SNR. The fact that we did not detect a change in line width due
to the 1 bead/nL solution suggests that the *2R∆ for this concentration is lower than that
predicted by extrapolating the straight line in Figure 18A. A theoretical treatment of
dipolar broadening of the NMR line due to dilute magnetic impurities indicates that the
line width will be proportional to C1/2 at higher concentrations and will be linear in C at
lower concentrations. Our slope of 2/3 suggests that we are in the transition region
between these two limits, and we should expect a higher slope at lower concentration,

60
resulting in a predicted value of *2R∆ lower than 8 s−1 at 1 bead/nL. Hence, the detection
of a single 1-µm Dynabead in a 1 nL coil will require that we achieve an even narrower
line width, while at the same time detecting adequate signal strength.
A 100 µm diameter coil (1 nL) will give substantially less signal than our 264 nL
coil due to the reduced sample size. Thus we must consider whether such a coil will have
sufficient SNR to detect 10 beads in its 1 nL volume. In the “large” microcoil data in
Figure 17, we can maximize our detection sensitivity by integrating the FIDs, say from
50 to 300 ms, which is roughly equivalent to applying strong digital filtering. These
integral values are 397 and 122 (arbitrary units), for the water and 10 beads/nL data,
respectively. The uncertainty in these values is 3, which corresponds to a signal to noise
ratio (SNR) of 133 for determining the amplitude of the water signal. The smaller 1 nL
volume coil will have much less signal, but also less noise (due to its lower resistance).
For microcoils in the limit where skin depth is small compared to wire size (which is not
quite true for our solenoid coil), the SNR per unit volume scales as the inverse of the coil
diameter (see section 4.1.5). Hence, the absolute SNR scales as the square of the linear
dimension of the sample. We are proposing to scale the sample and coil dimension down
by roughly a factor of 6, so we expect that the SNR in the determination of the integrated
water signal amplitude will be about 3.7. Hence, the 1 nL coil will require that the beads
change the area under the FID of the background water by at least 25%. Here, a
concentration of 10 bead/nL caused a 70% change in the integrated signal from 50 to
300 ms, and is therefore expected to remain detectable in the 1 nL coil, assuming we
achieve a similar background water T2*.

61
While our current prototype solenoid µ-coil is already capable of detecting the
presence of as few as 3000 magnetic beads, it has not been optimized for maximal SNR
performance for operation at 44.2 MHz. The thickness of the coil “wire” is much less
than a skin depth, which raises the resistance of the coil without providing any
improvements in signal detection. The width of the “wire” is much more than a skin
depth, so that it may be possible to increase the number of turns per unit length and gain
in coil sensitivity without suffering a nullifying increase in resistance. Careful attention to
the geometrical design of our next, smaller coil, should improve the SNR above the
estimate of ~3.7 based on this first attempt. SNR performance will be enhanced by
reducing the coil resistance, which is higher than expected in our first ion-milled coil.
Many of these issues are eliminated using the planar spiral coils described in Section 4.
Improving the line width of the background fluid places a lower demand on the SNR
performance. The use of susceptibility matching (either in the choice of evaporated
metals or via a matching fluid) and the reduction of the filling factor (by increasing the
relative wall thickness in the capillary tube) are known to improve the line widths in
small coils [41]. In addition, the magnet we have used is not very homogeneous and only
first order shims are available; a more homogeneous applied field may be required to
achieve narrower lines. Future work in optimizing the coil will also include comparisons
of both the SNR and line width performance of ion-milled coils to other types of µ-coils.
We anticipate that some compromise between line width and sensitivity will provide the
best opportunity for detecting single biological objects.
The surface of a single cancer cell (~10 µm in diameter) can bear upwards of 105
binding sites (antigens) for a particular antibody and can accommodate up to 400 1-µm
62
diameter magnetic beads, assuming monolayer coverage and random close packing. Thus
we believe that sensitivity to 10 beads would already be adequate to detect single
magnetically labeled cells. On the other hand, bacterial toxin molecules (e.g., botulism
toxin) are much smaller and would accommodate only one or a few beads, requiring
single-bead detection sensitivity. Hence, single-bead sensitivity remains our ultimate
goal. So far, our discussion of detection limits has been based on measurements of a
particular type (Dynabeads) and size (1 µm) of magnetic bead. Larger magnetic beads
(having larger magnetic moments) are available and will allow us to increase the
relaxivity of a single bead and further lower our detection limit. Shapiro et al. [5]
observed a T2* of ~14 ms from single 1.63 µm diameter Bangs microbeads in 1 nL image
voxels. Assuming that their background T2*was at least 100 ms, we calculate *
2R∆ for a
single 1.63 µm bead in a 1 nL volume to be at least 60 s−1, which should be readily
detected using a 1 nL microcoil with a background water T2* of 100 ms and a SNR of ~3.
Even larger beads (e.g., 2.8-µm and 4.8-µm Dynabeads) are commercially available, and
may be used, if necessary, to further enhance our ability to detect a single magnetic bead
in an NMR microcoil.

63
7. Portable MAGRITEK NMR Instrument
The last portion of this LDRD project involved the construction of a µ-NMR
system here at Sandia National Laboratories. All of the µ-coil NMR experiments
described in this report were performed using the console system based at New Mexico
Resonance (Albuquerque, NM). The ultimate goal was to construct a highly portable µ-
NMR system that can be directly controlled by a laptop computer either locally or via
remote wireless connections. To address this goal we have obtained a RF console system
from MAGRITEK (New Zealand) which provides the required components and can be
computer controlled via a USB connection. The NMR console system and associated
laptop computer are shown in Figure 19. This would still be considered a research device
in that it is highly flexible, and allows a range of different RF frequencies and power
amplification to be controlled. Future miniaturization of this console is easily envisioned
given the micro- to milli-Watt RF power range employed in the µ-coil NMR experiments
described in sections 4 and 5. This MAGRITEK console is run using the PROSPA
software package (display shown in Figure 19) and is highly flexible allowing the
individual users to create macros specific for their desired application.

64
Figure 19: MAGRITEK NMR system.
We have also completed the construction and initial testing of a 40 MHz NMR
probe (shown in Figures 20 and 21) to be used with this MAGRITEK console on the
0.96 Tesla magnet presently housed at Sandia. The 40 MHz tuning circuit is presented in
Appendix 4. The positioning of the µ-coils within the permanent magnetic field is known
to be very crucial, such that we have designed a coupling between this µ-probe and a 3-
way micro-positioner for fine control of the NMR probes location. This system is
presently being further developed and tested, and will be delivered to the Department of
Biochemistry and Molecular Biology, University of New Mexico as a part of a current
WRCE (Western Regional Center of Excellence) for Biodefense projects.

65
Figure 20: 40 MHz µ-NMR probe.
Figure 21: 40 MHz µ-NMR probe with 3-way micro-positioner 8. Conclusions
We have demonstrated that it is possible to detect the amplification of water
relaxation induced by the presence of SPIONs in solution using a µ-NMR device. These
results show that concentrations as low as 10 SPION particles per nL can be detected
based on NMR relaxation experiments. This LDRD provides a “proof of principle” for
the ability of µ-NMR to be used to detect bio-agents through nanoparticle amplification
at very low concentrations. To optimize the detection limit, two individual NMR µ-coil

66
platforms that have detection volumes on the order of 250 nL were fabricated and tested.
These initial µ-NMR experiments have allowed the down-selection of the planar spiral µ-
coil platform as the design that will be pursued for future µ-NMR development. We have
also demonstrated that a novel tuning circuit, capable of tuning an arbitrarily small
inductance at a frequency compatible with a permanent magnet, coupled with a
microcoil, allows spectroscopic and relaxation measurements using less than 1 mW of
radiofrequency power. (This low power requirement further aids in making the NMR
system portable.)
Micro-NMR provides a robust, portable device that allows analysis of solution
streams that are not optically transparent (blood, effluent etc.), and thus provides an
alternative µ-scale detection platform to other detection systems. Future development
directions that we will pursue for this µ-NMR device include the coupling of other µ-
fluid components to this detection platform, along with the miniaturization of the
permanent magnet system.

67
9. References
[1]. Bjornerud, A.; Johansson, L., The Utility of Superparamagnetic Contrast Agents
in MRI: Theoretical Consideration and Applications in the Cardiovascular System. NMR
in Biomedicine 2004, 17, 465-477.
[2]. Winter, P. M.; Caruthers, S. D.; Kassner, A.; Harris, T. D.; Chinen, L. K.; Allen,
J. S.; Lacy, E. K.; Zhang, H.; David, R. J.; Wickline, S. A.; Lanza, G. M., Molecular
Imaging of Angiogenesis in Nascent Vx-2 Rabbit Tumors Using a Novel avB3-targeted
Nanoparticle and 1.5 Tesla Magnetic Resonance Imaging. Cancer Research 2003, 63,
5838-5843.
[3]. Jun, Y.-w.; Huh, Y.-M.; Choi, J.-s.; Lee, J.-H.; Song, H.-T.; Kim, S.; Yoon, S.;
Kim, K.-S.; Shin, J.-S.; Suh, J.-S.; Cheon, J., Nanoscale Size Effects of Magnetic
Nanocrystals and Their Utilization for Cancer Diagnostics via Magnetic Resonance
Imaging. J. Am. Chem. Soc. 2005, 127, 5732-5733.
[4]. Perez, J. M.; Simeone, F. J.; Saeki, Y.; Josephson, L.; Weissleder, R., Viral-
Induced Self Assembly of Magnetic nanoparticles Allows the Detection of Viral Particles
in Biological Media. J. Am. Chem. Soc. 2003, 125, 10192-10193.
[5]. Shapiro, E. M.; Skrtic, S.; Sharer, K.; Hill, J. M.; Dunbar, C. E.; Koretsky, A. P.,
MRI Detection of Single Particles for Cellular Imaging. Proceedings National Academy
of Science 2004, 101, (30), 10901-10906.
[6]. Zhao, X.; Hillard, L. R.; Mechery, S. J.; Wang, Y.; Bagwe, R. P.; Jin, S.; Tan, W.,
A Rapid Bioassay for Single Bacterial Cell Quantitation Using Bioconjugated
Nanoparticles. Proceedings National Academy of Science 2004, 101, (42), 15027-15032.

68
[7]. Artemov, D., Molecular Magnetic Resonance Imaging With Targeted Contrast
Agents. Journal of Cellular Biochemistry 2003, 90, (3), 518-524.
[8]. Artemov, D.; Mori, N.; Okollie, B.; Bhujwalla, Z. M., MR Molecular Imaging of
the Her-2/neu Receptor in Breast Cancer Cells Using Targeted Iron Oxide Nanoparticles.
Magnetic Resonance in Medicine 2003, 49, (3), 403-8.
[9]. Artemov, D.; Mori, N.; Ravi, R.; Bhujwalla, Z. M., Magnetic Resonance
Molecular Imaging of the HER-2/neu Receptor. Cancer Research 2003, 63, (11), 2723-
2727.
[10]. Artemov, D.; Ravi, R.; Okollie, B.; Bhujwalla, Z. M., MR Molecular Imaging of
HER-2/neu Receptor with Targeted Contrast Agents. Proceedings of the American
Association for Cancer Research Annual Meeting
94th Annual Meeting of the American Association for Cancer Research; July 11-14,
2003; Washington, DC, USA 2003, 44, 692-693.
[11]. Perez, J. M.; O'Loughin, t.; Simeone, F. J.; Weissleder, R.; Josephson, L., DNA-
Based Magnetic Nanoparticle Assembly Acts as a Relaxation Nano-Switch Allowing
Screening of DNA-Cleaving Agents. J. Am. Chem. Soc. 2002, 124, (12), 2856-2857.
[12]. Frias, J. C.; Williams, K. J.; Fisher, E. A.; Fayad, Z. A., Recombinant HDL-Like
Nanoparticles: A Specific Contrast Agent for MRI of Atherosclerotic Plaques. J. Am.
Chem. Soc. 2004, 126, 16316-16317.
[13]. Roch, A.; Gossuin, Y.; Muller, R. N.; Gillis, P., Superparamagnetic Colloidal
Suspensions: Water Magnetic Relaxation and Clustering. J. Magnetism Magnetic
Materials 2005, 293, 532-539.

69
[14]. Roch, A.; Muller, R. N.; Gillis, P., Theory of Proton Relaxation Induced by
Superparamagnetic Particles. J. Chem. Physics 1999, 110, (11), 5403-5411.
[15]. Lacey, M. E.; Subramanian, R.; Olson, D. L.; Webb, A. G.; Sweedler, J. V., High-
Resolution NMR Spectroscopy of Sample Volumes from 1 nl to 10 µl. Chem. Rev. 1999,
99, 3133-3152.
[16]. Minard, K. R.; Wind, R. a., Solenoid Microcoil Design. Part I: Optimizing RF
Homogeneity. Concepts in Magnetic Resonance 2001, 13, (2), 128-142.
[17]. Minard, K. R.; Wind, r. A., Solenoidal Microcoil Design - Part II: Optimizing
Winding Parameters for Maximum Signal-to-Noise Performance. Concepts in Magnetic
Resonance 2001, 13, (3), 190-210.
[18]. Sorli, B.; Chateaux, J. F.; Pitival, M.; Chahboune, H.; Favre, B.; Briguet, A.;
Morin, P., Micro-spectrometer for NMR: Analysis of small Quantities in Vitro. Meas.
Sci. Technol. 2004, 15, 877-880.
[19]. Trumbull, J. D.; Glasgow, I. K.; Beebe, D. J.; Magin, R. L., Integrating
Microfabricated Fluidic Systems and NMR Spectroscopy. IEEE Transactions on
Biomedical Engineering 2000, 47, (1), 3-7.
[20]. Walton, J. H.; de Roop, J. S.; Shutov, M. V.; Goloshevky, A. G.; McCarthy, M.
J.; Smith, R. L.; Collins, S. D., A Micromachined Double-Tuned NMR Microprobe.
Anal. Chem. 2003, 75, 5030-5036.
[21]. Dechow, J.; Forchel, A.; Lanz, T.; Haase, A., Fabrication of NMR - Microsensors
for Nanoliter Sample Volumes. Micoelectronic Engineering 2000, 53, 517-519.

70
[22]. Eroglu, S.; Gimi, B.; Roman, B.; Friedman, G.; Magin, R. L., NMR Spiral
Surface Microcoils: Design, Fabrication and Imaging. Concepts in Magnetic Resonance
2003, 17B, 1-10.
[23]. Massin, C.; Boero, G.; Vincent, F.; Abenhaim, J.; Besse, P.-A.; Popovic, R. S.,
High-Q Factor RF Planar Microcoils for Micro-Scale NMR Spectroscopy. Sensors and
Actuators A 2002, 97-98, 280-288.
[24]. Massin, C.; Vincent, F.; Homsy, A.; Ehrmann, K.; Boero, G.; Besse, P.-A.;
Daridon, A.; Verpoorte, E.; de Rooij, N. F.; Popovic, R. S., Planar Microcoil-Based
Microfluidic NMR Probes. J. Magn. Res. 2003, 164, 242-255.
[25]. Rogers, J. A.; Jackman, R. J.; Whitesides, G. M.; Olson, D. L.; Sweedler, J. V.,
Using Microcontact Printing to Fabricate Microcoils on Capillaries for High resolution
Proton Nuclear Magnetic Resonance on Nanoliter Volumes. Appl. Phys. Lett. 1997, 70,
(18), 2464-2466.
[26]. Malba, V.; Maxwell, R.; Evans, L. B.; Bernhardt, A. F.; Cosman, M.; Yan, k.,
Laser-Lathe Lithography - a Novel Method for Manufacturing Nuclear Magnetic
Resonance Microcoils. Biomedical Microdevices 2003, 5, (1), 21-27.
[27]. Wolters, A. M.; Jayawickrama, D. A.; Larvie, C. K.; Sweedler, J. V., Capillary
Isotachophoresis/NMR: Extension to Trace Impurity Analysis and Improved Instrument
Coupling. Anal. Chem. 2002, 74, 2306-2313.
[28]. Wolters, A. M.; Jayawickrama, D. A.; Sweedler, J. V., Microscale NMR. Current
Opinions in Chemical Biology 2002, 6, 711-716.

71
[29]. Wolters, A. M.; Jayawickrama, D. A.; Webb, A. G.; Sweedler, J. V., NMR
Detection with Multiple Solenoid Microcoils for Continuous-Flow Cappillary
Electrophoresis. Anal. Chem. 2002, 74, 5550-5555.
[30]. Berry, L.; Renaud, L.; Kleimann, P.; Morin, P.; Armenean, M.; Saint-Jalmes, H.,
Development of Implantable Detection Microcoils for Minimally Invasive NMR
Spectroscopy. Sensors and Actuators A 2001, 93, 214-218.
[31]. Renaud, L.; Armenean, M.; Berry, L.; Kleimann, P.; Morin, P.; Pitival, M.;
O'Brien, J.; Brunet, M.; Saint-Jalmes, H., Implantable Planar RF Microcoils for NMR
Microspectroscopy. Sensors and Actuators A 2002, 99, 244-248.
[32]. Syms, R. R. A.; Ahmad, M. M.; Young, I. R.; Li, Y.; Hand, J.; Gilderdale, D.,
MEMS Helmholtz Coils for Magnetic Resonance Imaging. J. Micromechanics and
Microengineering 15, 15, S1-S9.
[33]. Goloshevky, A. G.; Walton, J. H.; Shutov, M. V.; de Ropp, J. S.; Collins, S. D.;
McCarthy, M. J., Nuclear Magnetic Resonance Imaging for Viscosity Measurements of
Non-Newtonian Fluids Using a Miniaturized RF Coil. Measurement Science and
Technology 2005, 16, 513-518.
[34]. Goloshevky, A. G.; Walton, J. H.; Shutov, M. V.; De Roop, J. S.; Collins, S. D.;
McCarthy, M. J., Integration of Biaxial Planar Gradient Coils and an RF Microcoil for
NMR Flow Imaging. Meas. Sci. Technol. 2005, 16, 505-512.
[35]. Seeber, D. A.; Cooper, R. L.; Ciobanu, L.; Pennington, C. H., Design and testing
of High Sensitivity Microreciever Coil Apparatus for Nuclear Magnetic Resonance and
Imaging. Review of Scientific Instruments 2001, 72, (4), 2171-2179.

72
[36]. Boero, G.; Frounchi, J.; Furrer, B.; Besse, P.-A.; Popovic, R. S., Fully Integrated
Probe for Proton nuclear Magnetic Resonance Magnetometry. Review of Scientific
Instruments 2001, 72, (6), 2764-2768.
[37]. Goloshevky, A. G.; Walton, J. H.; Shutov, M. V.; De Roop, J. S.; Collins, S. D.;
McCarthy, M. J., Development of Low Filed Nuclear Magnetic Resonance Microcoils.
Review of Scientific Instruments 2005, 76, 024101-024106.
[38]. Morales, M. P.; Bomati-Miguel, O.; Perez de Alejo, R.; Ruiz-Cabello, J.;
Veintemillas-Verdaguer, S.; O'Grady, K., Contrast Agents for MRI Based on Iron Oxide
Nanoparticles Prepared by Laser Pyrolysis. J. Magnetism Magnetic Materials 2003, 266,
102-109.
[39]. Peck, T. L.; Magin, R. L.; Lauterbur, P. C., Design and Analysis of Microcoils for
NMR Spectrosocopy. J. Magn. Res., B. 1995, 108, 114-124.
[40]. Vasile, M. J.; Biddick, C.; Schwalm, S., Microfabrication by Ion Milling: The
Lathe Technique. J. Vac. Sci. Technology B 1994, 12, 2388.
[41]. Webb, A. G.; Grant, S. C., Signal-to-Noise and Magnetic Susceptibility Trade-
offs in Solenoidal Microcoils for NMR. J. Magn. Res., B. 1996, 113, 83-87.

73
Appendix 1. Fabrication layout of planar spiral micro-coils with electrical contact pads shown.

74
Appendix 2. MATHCAD analysis of planar micro-coils performance for different design criteria (J. D. Williams).
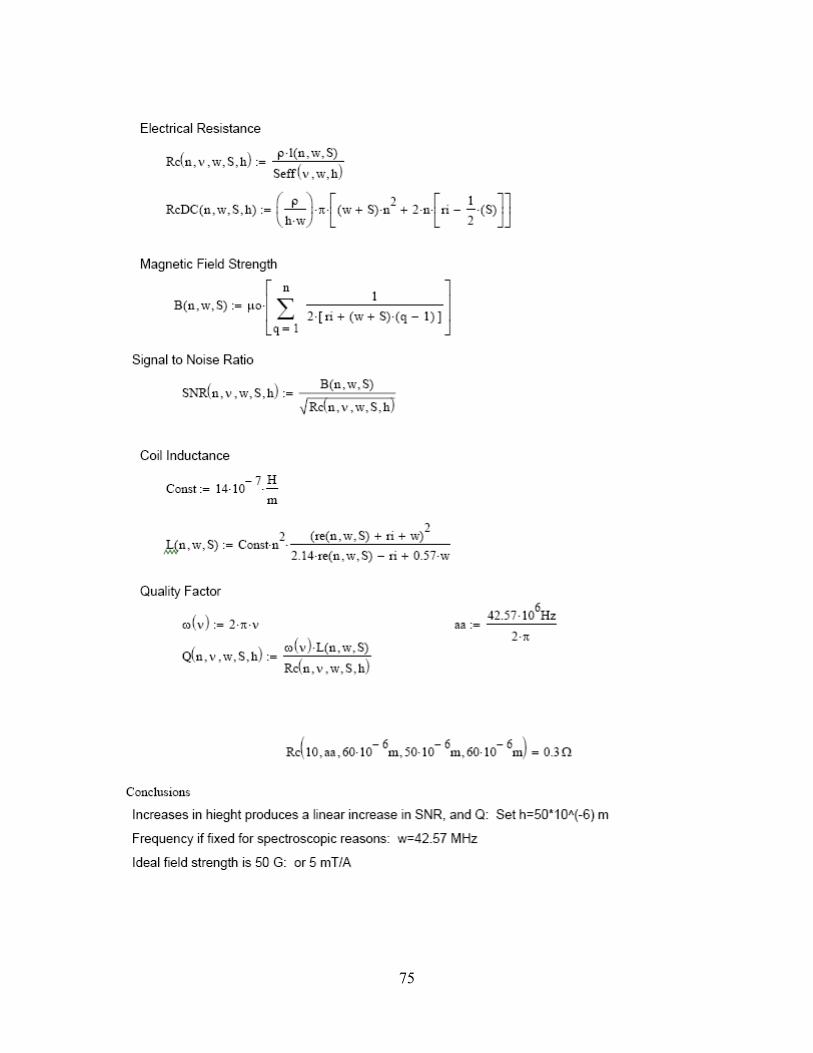
75
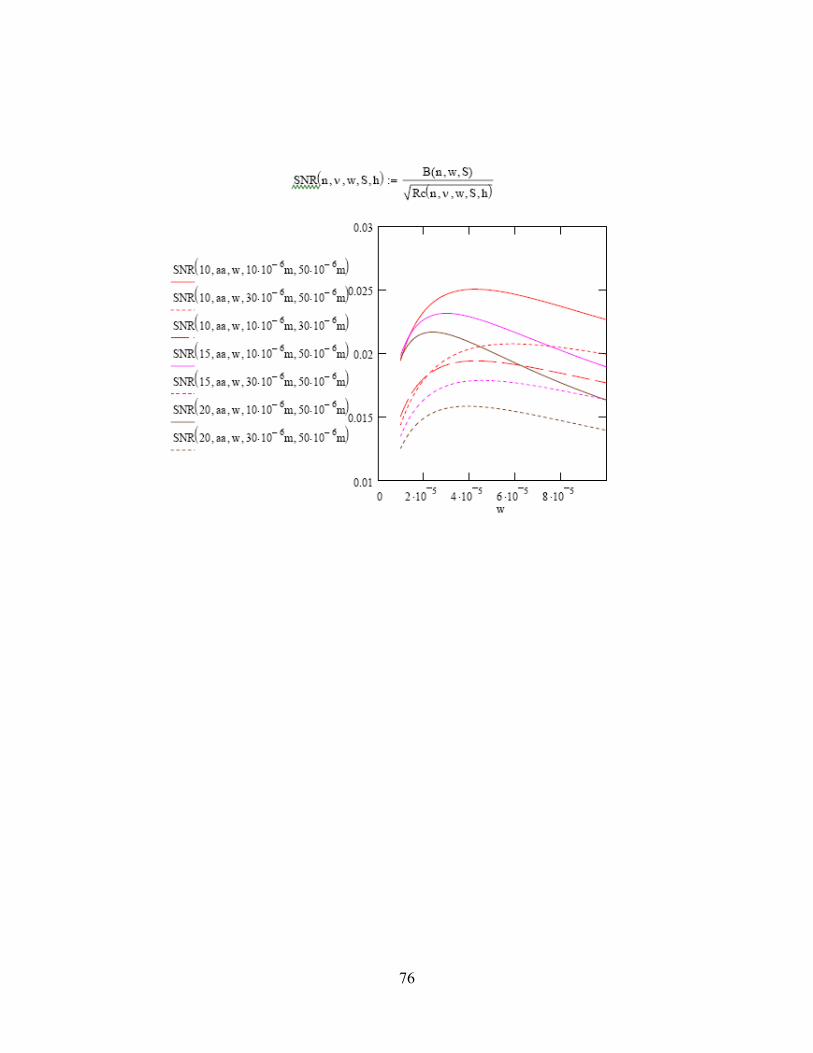
76

77

78

79

80

81

82
Appendix 3. DC Electrical Characterization of Microcoils by Edna Cárdenas and Steve Howell Electrical measurements were made on each coil using a probe station which allowed us to construct a four probe circuit connection (Figure 1). A Keithley 2700 sourced a variable DC current which was applied to a probe tip connected to one coil electrode. On the other electrode a similar probe tip completed the circuit back to the Keithley 2700. Two additional probe tips were used to measure the voltage across the coil. A Keithley 6514 electrometer recorded the voltage values. The electrometer served as a high-input impedance voltage meter, restricting the amount of current flowing through the probe tips’ electrical connection. This setup minimizes the effects of the contact resistance. The source meter was used to sweep a consecutive range of current values between -100 mA to 100 mA in 10 mA increments. From the data and using a best fit line, we obtained a value for the resistance from the slope and by using Ohm’s Law. Coils numbered five and forty were found to be damaged during optical inspection and therefore not measured. Of the remaining fifty-three coils measured, seven were found to be electrically open (13%) and labeled as damaged. Devices were determined to be an open circuit if the electrometer measured an overflow for the voltage reading, implying a break in the circuit connection through the coil. Table 1 lists the calculated resistance values for each coil measured. Table 1 Date Measured Coil # Resistance # Coils Geometry
4/6/2006 1 damaged 15 circular
4/6/2006 2 4.36E-02 3 circular
4/6/2006 3 damaged 7 circular
4/6/2006 4 2.89E-01 10 circular
4/6/2006 6 3.72E-01 7 circular
4/6/2006 7 damaged 12 circular
4/6/2006 8 4.97E-01 12 circular
4/6/2006 9 5.41E-02 3 circular
4/6/2006 10 2.48E-01 10 circular
4/6/2006 11 5.26E-02 3 circular
4/6/2006 12 4.87E-01 12 square
4/6/2006 13 1.11E+00 10 circular
4/6/2006 14 3.68E-01 12 circular
4/6/2006 15 3.88E-01 12 circular
4/6/2006 16 damaged 15 circular
4/6/2006 17 6.16E-01 12 circular
4/6/2006 18 damaged -- circular
4/6/2006 19 5.03E-01 15 circular
4/6/2006 20 damaged 15 circular
4/6/2006 21 3.38E-01 12 circular
4/6/2006 22 6.53E-02 3 square

83
Date Measured Coil # Resistance # Coils Geometry
4/6/2006 23 damaged 12 circular
4/6/2006 24 3.91E-01 10 square
Not measured 25 ---- 3 circular
4/6/2006 26 3.80E-02 3 circular
4/6/2006 27 5.79E-02 3 circular
4/6/2006 28 5.26E-02 3 circular
4/6/2006 29 5.27E-02 3 circular
4/6/2006 30 4.77E-02 3 circular
Not measured 31 ---- 3 circular
4/6/2006 32 6.79E-02 3 square
4/6/2006 33 6.88E-02 3 square
4/6/2006 34 2.21E-01 7 square
4/6/2006 35 1.48E-01 7 circular
4/6/2006 36 1.66E-01 7 circular
4/6/2006 37 1.57E-01 7 circular
4/6/2006 38 1.40E-01 7 circular
4/6/2006 39 1.60E-01 7 circular
4/6/2006 41 1.69E-01 7 circular
4/6/2006 42 4.71E-01 12 square
Not measured 43 ---- 7 circular
4/6/2006 44 4.01E-01 12 circular
4/6/2006 45 6.02E-01 15 circular
4/6/2006 46 3.71E-01 12 circular
4/6/2006 47 5.51E-01 15 circular
4/6/2006 48 2.16E-01 7 square
4/6/2006 49 4.00E-01 12 circular
4/6/2006 50 1.61E-01 7 circular
4/6/2006 51 3.84E-01 12 circular
4/6/2006 52 1.64E-01 7 circular
4/6/2006 53 3.69E-01 12 circular
4/6/2006 54 3.25E-01 12 circular
4/6/2006 55 3.77E-01 12 circular
4/6/2006 56 1.34E-02 12 circular
4/6/2006 57 5.03E-01 12 circular

84
Figure 2
Sourcemeter
Electrometer
coil electrode
Schematic of 4 probe circuit.

85
Appendix 4. Circuit layout and printed circuit board layout for 40 MHz tuning and detection circuit.

86

87
Distribution 10 MS0886 Todd M. Alam, 1816 1 MS 0885 Justine Johannes, 1810 1 MS 9292 Joe Schoeniger, 8321 1 MS 1411 Jim Voigt, 1816 1 MS 1082 John D. Williams, 1725 1 MS 1245 David P. Adams, 1245 1 MS 1349 Hongyou Fan, 1815 1 MS 1245 John Emerson, 2453 1 Prof. Cathy Clewett Physics Department Fort Hays State University 600 Park St. Hays, KS 67601 1 Prof. Laurel Sillerud Dept. of Biochemistry and Molecular Biology University of New Mexico School of Medicine Cancer Research and Treatment Center Albuquerque, NM 87131 1 Dr. Andrew McDowell New Mexico Resonance 2301 Yale Blvd SE, Suite C-1 Albuquerque, NM 1 Dr. Natalie Adolphi New Mexico Resonance 2301 Yale Blvd SE, Suite C-1 Albuquerque, NM 2 MS 9018 Central Technical Files, 8944 2 MS 0899 Technical Library, 4536