bioaccumulation of heavy metals in tilapia fish organs · j. bio. & env. sci. 2015 88 | ghannam...
TRANSCRIPT

J. Bio. & Env. Sci. 2015
88 | Ghannam et al.
RESEARCH PAPER OPEN ACCESS
Bioaccumulation of heavy metals in tilapia fish organs
Hala Elshahat Ghannam1*, Engy Salah Eldeen El Haddad1 and Abdelrahman Said
Talab2
1Pollution Laboratory, National Institute of Oceanography and Fisheries (NIOF), Cairo, Egypt
2Fish Processing and Technology Laboratory, National Institute of Oceanography and Fisheries
(NIOF), Cairo, Egypt
Article published on August 10, 2015
Key words: Heavy metals, fish organs, River Nile Rayahs.
Abstract
The bioaccumulation of Fe, Mn, Zn, Cu, Pb and Cd in the muscle, bones and gills of Nile tilapia, Mango tilapia
and Tilapia zillii collected from four Rayahs (canals) namely from El Tawfiky, El Menoufy, El Behery, and El
Nasery Rayahs, River Nile were investigated during spring 2014 till winter 2015. The results indicated that, heavy
metals showed differential bioaccumulation in fish organs muscle, gills and bones, and the accumulation pattern
as total heavy metal residues was seasonally as follows: spring> summer> winter> autumn. Moreover, the
relative accumulation of total heavy metals in the studied fish showed the following pattern: Nile tilapia <Mango
tilapia <Tilapia zillii. Also, higher concentrations of heavy metals were recorded in El-Rayah El-Tawfiky followed
by El-Rayah El-Behery> El-Rayah El-Menoufy> El-Rayah El-Nasery. Fe was the most abundant element in all
fish organs followed by Zn> Mn> Cu> Pb> Cd. Also, results revealed that, fish muscles have much lower
concentrations of all metals than bones and gills and were not significantly different from specie to others. The
concentrations of the heavy metal in muscles were within the international permissible level, so fish muscles are
safe for human consumption.
*Corresponding Author: Dr. Hala Elshahat Ghannam [email protected]
Journal of Biodiversity and Environmental Sciences (JBES) ISSN: 2220-6663 (Print) 2222-3045 (Online)
Vol. 7, No. 2, p. 88-99, 2015
http://www.innspub.net

J. Bio. & Env. Sci. 2015
89 | Ghannam et al.
Introduction
The River Nile is recognized as the longest river, and
can be considered as one of the most important rivers
in the world. At, the North of Cairo at Delta Barrage,
the River Nile bifurcates into two branches namely
Damietta and Rosetta and four Rayahs (canals)
namely El-Nasery, El-Behery, El-Menoufy and El-
Tawfiky (Saad and Goma, 1994 and Abdel Aziz,
2005).
The heavy metals in freshwater are a matter of
concern because of their toxic potential ability to be
accumulated in food chains, therefore mercury and
zinc are on first list percent of dangerous substances
(Svobodova et al. 1993; Dalman et al., 2006). The
most important heavy metals from the point of view
of water pollution are Zn, Cu, Pb. Cd, Hg, Ni and Cr.
Some of these metals (e.g. Cu. Ni, Cr and Zn) are
essential trace metals to living organisms, but become
toxic at higher concentrations. Other such as Pb and
Cd has no known biological function, but are toxic
elements (Dudka and Adriano, 1997).
Tilapia is the most familiar and popular fishes in
Egypt, as well as, in the Middle East and warm
climate countries (Philippart and Ruwet, 1982). Many
studies concentrated on the heavy metal
bioaccumulation of Tilapia fish species. These
researches showed that the accumulating extent of
heavy metals in fishes were by far dependent on the
different metals, fish species, and the tissues,
respectively. Fish are often at the top of the aquatic
food chain and may concentrate large amounts of
some metals, such as lead, cadmium, chromium,
copper, mercury, zinc and iron. These metals
accumulate differentially in fish organs and cause
serious health hazards to humans. For this reason,
the problem of fish contamination by toxic metals has
received much attention (e.g. Harms, 1975; Ramos, et
al., 1979; Wiener and Giesy,1979; Lowe, et al., 1985;
Eisenberg and Topping, 1986; Luckas, 1987; Barak
and Mason, 1990; Hernandez, et al., 1990; Gomaa et
al., 1995; Abou- Arab et al., 1996; Ibrahim, 1996;
Zyadah, 2008; Yacoub and Gad, 2012, Ghannam, et
al., 2014). Therefore this study aimed to determine
the bioaccumulation of Fe, Mn, Zn, Cu, Pb and Cd in
the muscle, bones and gills of Nile tilapia, Mango
tilapia and Tilapia zillii collected from four Rayahs
(canals) namely El Tawfiky, El Menoufy, El Behery,
and El Nasery Rayahs, River Nile from spring 2014 to
winter 2015.
Materials and methods
The present study was conducted through the
research project of freshwater and lakes division
which belongs to the National Institute of
Oceanography and Fisheries in order to identify the
environmental status of the four Rayahs (canals)
namely El Tawfiky, El Menoufy, El Behery, and El
Nasery Rayahs, River Nile from spring 2014 to winter
2015.
Study area
El Rayah El Tawfiky
El Rayah El Tawfiky (canal) is a fresh stream, which is
used for fishing, irrigation, and navigation and other
domestic uses in Egypt.Its length is about 180 km.El
Tawfiky Canal begins at the Damietta branch in El
Kanater (the only canal branches from Damietta
Branch) towards northern which is parallel to the
Damietta branch till El Mansoura city and then
branched into two sub- channels. The main canal
starts from El kanater to El Manzala counting two
sub-main branches of El Mansoura. The main
characterization of El Tawfiky canal is the existence of
several of the powers and water stations on the shore
contain great water stations as way station Banha
water and water stations own small villages found on
both sides of the canal. The First Chanel directed
northern to Damietta city. The lack of water is this
distinguished. Approximately water vanishes in the
Fareskour city. The second Canal is directed eastern
to Dekernes, El gamalia and El Manzala and finished
in Lake Manzala in the past but now not. This channel
has more water than the first channel. At the begging
three samples were collected from at the begging,
central and end of this section in the city of Manzala.

J. Bio. & Env. Sci. 2015
90 | Ghannam et al.
El Rayah El Behery
At west of delta Behery canal starts from Rosetta
branch directed to northwestern parallel to Rosetta
branch and west to Giza City. It passes through El
Behira city, Koum Hamada, Damanhour city and Alx
city. After Damanhour city, El Behery canal joins with
El Mahmoudia canal (branched from Rosetta branch)
direct to North West Alx City. Its length is about 220
km from Elkanater Elhyria to Alex.
El Rayah El Nasery
Nasery canal begins at Rosetta branch parallel to
Behery canal, then directed to North West in
direction of Nopareia City. It connected with Noubria
canal branched from Kanater Bolin then directed to
North West till reaches Mediterranean Sea through
Lake Mariut. It is characterized by many huge of
water and electricity stations specially after Lake
Noubaria.
El Rayah El Menoufy
El Rayah El Menoufy (canal) begins from Rosetta
branch through Menoufy City, El Garbia city and El
Daqhlia city, then directed north till reaches Gamsa
City and south of Lake El Brouls. It has many
branches starting from El Monfia lie El Bagoria Canal
and Tanta Navigational Canal. The Shebin Sea is the
chosen branch for the selected samples which are
directed from Santa town, then the El Mahala then
Belqas City then El Brouls.It has low level of water in
north direction as the results of its branches, till
Damietta the branch in Zefta city the water level
increases then decreases again after it branches at
Bilqas City. It is characterized by a lot of water and
electricity plants as other Canals.
Fish samples
Nile Tilapia (Oreochromis niloticus); Mango Tilapia
(Sarotherodon galilaeus) and (Tilapia zilli) were
collected directly from four Rayahs namely (El
Tawfiky, El Menoufy, El Behery, and El Nasery
Rayahs) during period from spring 2014 to winter
2015. The mean total lengths and total weights of fish
were (25.5 ± 1.32cm and 350 ± 57.73) in Nile Tilapia,
(13.5 ± 1.09 and 61 ± 13.07) in Mango Tilapia and
(10.02 ± 1.41 and 52.4± 5.26) in Tilapia zilli. Fish
samples transported using icebox to the pollution
laboratory, National Institute of Oceanography and
Fisheries. Fish samples were re-washed thoroughly
with potable water then beheaded and dissection to
obtain muscle, gills, and bones.
Fig. 1. Sampling area of four canals.
Heavy metals analysis
Fish from each group were dissected to separate
organs (flesh, gills and bones) according to FAO
methods (Dybem, 1983). The separated organs were
put in petri dishes to dry at 105 °C until reaching a
constant weight. The separated organs were placed
into digestion flasks and then add concentrated nitric
acid and perchloric acid (1:1 v/v). The digestion flasks
were then heated to 300 ºC until all the materials
were dissolved. Digest was diluted with double
distilled water appropriately. The elements Fe, Zn,
Cu, Mn, Pb and Cd were assayed using an atomic
absorption reader (SavantAAS) with GF 5000
Graphite Furnace and the results were given as µg/ g
dry wt.
Results and discussion
Iron (Fe)
Bioaccumulation of iron (Fe) in the muscle, bones
and gills of Nile tilapia, Mango tilapia and Tilapia
zillii collected from El-Nasery, El-Behery, El-Menoufy
and El-Tawfiky, River Nile during spring 2014 to
winter 2015 are represented in table (1). Generally,

J. Bio. & Env. Sci. 2015
91 | Ghannam et al.
mango tilapia fish were not found during autumn in El-Rayah El-Behery.
Table 1. Bioaccumulation of Fe in different tissues of tilapia fish species collected from River Nile Rayahs during
spring 2014 to winter 2015.
Fish species Fish
organs Seasons Tawfiky Behery Nasery Menoufy
Nile tilapia
Muscle
Sp 172.81 77.50 70.80 70.90 Su 71.30 893.08 40.70 66.10 Au 51.20 89.30 95.20 49.10 Wi 66.90 207.30 66.80 51.30
Bones
Sp 386.65 122.20 137.50 159.30 Su 55.10 55.73 109.50 141.90 Au 280.70 234.90 817.50 186.90 Wi 52.40 140.60 76.00 72.30
Gills
Sp 431.16 172.70 353.90 372.20 Su 352.90 155.01 520.17 391.30 Au 179.50 154.60 94.50 23.50 Wi 95.20 415.30 255.80 195.80
Mango tilapia
Muscle
Sp 110.50 89.80 64.20 112.00 Su 79.40 67.10 78.80 38.70 Au 222.70 NF 35.90 60.40 Wi 66.60 107.10 96.00 157.80
Bones
Sp 188.10 138.30 114.30 148.60 Su 136.10 51.30 65.90 81.50 Au 193.90 NF 110.10 205.60 Wi 45.50 157.90 109.00 98.10
Gills
Sp 473.34 155.80 176.50 416.10 Su 245.00 136.70 383.00 303.80 Au 427.60 NF 59.10 101.50 Wi 78.10 461.88 382.10 213.70
Tilapia zillii
Muscle
Sp 117.27 118.63 140.80 167.78 Su 50.30 67.70 43.70 66.70 Au 71.20 72.80 59.60 50.30 Wi 33.90 161.10 112.10 156.20
Bones
Sp 179.20 233.58 181.20 241.00 Su 98.20 382.30 64.20 109.90 Au 97.80 62.30 170.00 408.20 Wi 34.60 99.50 79.40 86.70
Gills
Sp 400.00 352.39 432.90 692.40 Su 427.87 403.87 893.08 418.96 Au 90.60 796.80 130.20 167.70 Wi 155.30 271.30 649.00 382.90
Sp: spring; Su: summer; Au: autumn; Wi: winter.
The obtained results showed that, the minimum
levels of Fe (33.90 µg/g dw) were recorded during
winter in the muscles of tilapia zillii collected from El-
Rayah El-Tawfiky, while the maximum levels (893.08
µg/g dw) of Fe during summer season in both
muscles of Nile tilapia from El-Rayah El-Behery and
gills of tilapia zillii from El-Rayah El-Nasery.
However, the bioaccumulation of Fe was Rayahs-
related as the accumulations of the heavy metals
analysed in the sampled fishes were of the following
trend: El-Rayah El-Tawfiky˃ El-Rayah El-Behery˃ El-
Rayah El-Menoufy˃ El-Rayah El-Nasery, while the
order of fish according to highest levels of Fe were:
Mango tilapia˃ Tilapia zillii˃ Nile tilapia, also, fish
organs were in the following trend: gills˃ bones˃
muscles.
El-Rayah El-Behery showed higher concentrations of
Fe in the muscle of Nile tilapia during summer
(893.08 µg/g dw) and winter (207.30 µg/g dw) and
also, in tilapia zillii muscles during summer (67.70
µg/g dw), autumn (72.80 µg/g dw) and winter (161.10
µg/g dw). El-Rayah El-Menoufy showed higher
concentrations of Fe in the muscle of Mango tilapia

J. Bio. & Env. Sci. 2015
92 | Ghannam et al.
during spring (112 µg/g dw) and winter (157.80 µg/g
dw) and also, in tilapia zillii muscles during spring
(167.78 µg/g dw). El-Rayah El-Tawfiky showed higher
concentrations of Fe in the muscle of Nile tilapia
during spring (172.81 µg/g dw), and also, in Mango
tilapia muscles during summer (79.40 µg/g dw) and
autumn (222.70 µg/g dw). The highest value (95.20
µg/g dw) of Fe was recorded in the muscle of Nile
tilapia during autumn in El-Rayah El-Nasery. The
lowest concentrations of Fe were noticed in Nile
Tilapia fish in El-Rayah El-Menoufy followed by
Mango tilapia in El-Rayah El-Nasery, and Tilapia zilli
in El-Rayah El-Tawfiky. Spring season showed higher
concentrations of Fe in comparison with other
seasons.
Manganese (Mn)
Bioaccumulation of manganese (Mn) in the muscle,
bones and gills of Nile tilapia, Mango tilapia and
Tilapia zillii collected from El-Nasery, El-Behery, El-
Menoufy and El-Tawfiky, River Nile during spring
2014 to winter 2015 are represented in table (2).
Generally, higher concentrations of Mn were recorded
in El-Rayah El-Tawfiky˃ El-Rayah El-Behery˃ El-
Rayah El-Menoufy˃ El-Rayah El-Nasery. In addition,
higher concentrations of Mn were observed in spring˃
summer˃ winter ˃ autumn. Fish gills showed higher
concentrations of Mn followed by bones, then
muscles and Tilapia zilli were higher than others in
Mn levels (Table 2). The minimum and maximum
levels (0 and 98.10 µg/g dw) of Mn were recorded
during summer in the muscle of Tilapia zillii from El-
Rayah El-Menoufy, and in bones of Mango tilapia
during spring from El-Rayah El-Tawfiky. Mn ranged
from (0-56.90 µg/g dw) in muscles, (2.36-98.10 µg/g
dw) in bones and (2.10-68.50 µg/g dw) in gills.
Table 2. Bioaccumulation of Mn in different tissues of tilapia fish species collected from River Nile Rayahs
during spring 2014 to winter 2015.
Fish species Fish
organs Seasons Tawfiky Behery Nasery Menoufy
Nile tilapia
Muscle
Sp 56.90 1.80 4.40 10.60 Su 8.20 45.20 5.50 3.80 Au 1.10 13.20 4.42 3.97 Wi 6.00 8.99 5.40 9.80
Bones
Sp 62.10 15.90 2.90 27.20 Su 15.00 5.60 15.10 14.70 Au 2.36 14.21 8.85 7.50 Wi 5.84 8.88 5.16 26.20
Gills
Sp 68.50 2.10 11.40 35.20 Su 27.10 23.50 23.00 18.60 Au 6.33 25.94 5.85 5.75 Wi 7.44 11.00 3.19 30.50
Mango tilapia
Muscle
Sp 33.00 0.90 4.60 28.00 Su 2.20 4.20 10.20 1.10 Au 35.16 NF 3.52 4.63 Wi 7.60 7.47 9.40 20.30
Bones
Sp 98.10 8.80 3.70 33.60 Su 22.50 31.00 13.70 14.90 Au 41.90 NF 6.60 8.75 Wi 8.36 11.00 6.13 31.10
Gills
Sp 60.70 9.90 8.20 35.80 Su 19.70 50.20 27.50 17.20 Au 29.18 NF 4.82 10.40 Wi 9.35 13.49 44.60 52.70
Tilapia zillii
Muscle
Sp 35.20 41.00 5.50 26.00 Su 3.20 20.60 4.10 0.00 Au 3.38 18.00 4.70 9.63 Wi 4.84 6.34 31.00 29.40
Bones Sp 52.40 36.10 12.50 32.20 Su 24.60 39.10 3.10 18.80 Au 3.77 24.00 6.78 4.78

J. Bio. & Env. Sci. 2015
93 | Ghannam et al.
Fish species Fish
organs Seasons Tawfiky Behery Nasery Menoufy
Wi 7.90 20.67 5.87 6.00
Gills
Sp 45.80 47.60 48.30 34.80 Su 30.90 23.00 45.20 25.00 Au 7.68 9.98 22.10 13.10 Wi 6.37 8.45 41.00 18.00
Sp: spring; Su: summer; Au: autumn; Wi: winter.
Zinc (Zn)
The lowest value of Zn (4.70 µg/g dw) was recorded
during autumn in the muscle of Tilapia zillii from El-
Rayah El-Behery, while the highest value (153.03
µg/g dw) recorded during winter in the gills of Mango
tilapia from El-Rayah El-Nasery (Table 3). Higher
concentrations of Zn were recorded in El-Rayah El-
Behery˃ El-Rayah El-Nasery˃ El-Rayah El-Menoufy˃
El-Rayah El-Tawfiky, while higher levels of Zn were
recorded in Tilapia zillii followed by Mang tilapia and
Nile tilapia and organs order were: gills˃ bones ˃
muscle. The higher concentrations of Zn in the
muscle, bones and gills of Nile tilapia, Mango tilapia
and Tilapia zilli collected from El-Rayah El-Tawfiky
were 80.30, 139.29 and 121.63 µg/g dw; 58.20, 83.70
and 142.20 µg/g dw; 61, 83.20 and 120.86 µg/g dw;
respectively, while in El-Rayah El-Behery recorded
98.40, 76.30 and 86; 58.60, 85.90 and 99.80 µg/g
dw; 67.30, 128.68 and 137.38 µg/g dw, respectively,
also, in El-Rayah El-Nasery recorded 58.40, 117.40
and 110.73 µg/g dw, 49.40, 67.40 and 153.03 µg/g dw
and 65.23, 136.46 and 133.55 µg/g dw, respectively.
Finally, higher levels of Zn in El-Rayah El-Menoufy
were 36.43, 76.30 and 119.91 µg/g dw, respectively, in
the muscle, bones and gills of Nile tilapia, while in
Mango tilapia were 64.40, 85.30 and 129.24 µg/g dw
and in Tilapia zillii were 96.29, 72.20 and 151.50 µg/g
dw, respectively.
Table 3. Bioaccumulation of Zn in different tissues of tilapia fish species collected from River Nile Rayahs during
spring 2014 to winter 2015.
Fish species Organs Seasons Tawfiky Behery Nasery Menoufy
Nile tilapia
Muscle
Sp 80.30 39.00 58.40 34.92 Su 49.40 98.40 43.90 32.30 Au 20.93 10.00 21.73 9.27 Wi 8.40 38.37 36.93 36.43
Bones
Sp 139.29 76.30 72.30 57.43 Su 76.30 44.60 80.50 76.30 Au 112.86 58.00 117.40 24.07 Wi 6.10 47.37 41.29 41.97
Gills
Sp 121.63 73.60 62.20 119.91 Su 94.30 86.00 110.73 87.10 Au 47.57 15.80 8.63 7.13 Wi 21.80 73.80 95.85 52.50
Mango tilapia
Muscle
Sp 41.40 51.10 46.90 64.40 Su 45.70 58.60 49.90 48.90 Au 58.20 NF 16.77 13.63 Wi 9.37 33.30 34.58 52.87
Bones
Sp 53.55 69.60 48.10 40.34 Su 83.70 85.90 67.40 85.30 Au 44.50 NF 27.40 32.17 Wi 13.33 61.70 40.24 38.63
Gills
Sp 142.20 86.60 70.00 129.24 Su 82.70 99.80 97.40 96.10 Au 43.20 NF 14.40 35.37 Wi 20.77 78.90 153.03 41.23
Tilapia zillii Muscle
Sp 61.00 56.66 65.23 96.29 Su 44.10 67.30 40.60 6.18 Au 15.03 4.70 28.47 31.67 Wi 5.57 24.70 48.20 40.20
Bones Sp 82.05 128.68 136.46 72.18

J. Bio. & Env. Sci. 2015
94 | Ghannam et al.
Fish species Organs Seasons Tawfiky Behery Nasery Menoufy Su 83.20 103.40 40.20 72.20 Au 20.10 23.90 12.50 66.27 Wi 21.83 42.30 40.47 39.93
Gills
Sp 120.86 137.38 133.55 151.50 Su 92.90 92.00 98.40 92.10 Au 23.37 133.90 12.90 8.70 Wi 40.17 48.90 121.80 108.23
Sp: spring; Su: summer; Au: autumn; Wi: winter.
Copper (Cu)
Bioaccumulation of Cu in different tissues of tilapia
fish species collected from River Nile Rayahs in the
period spring 2014 to winter 2015 are given in Table
(4). The lower and higher values of Cu were (0 and
29.80 µg/g dw). Higher values of Cu were found in
El-Rayah El-Nasery followed by El-Rayah El-
Tawfiky˃ El-Rayah El-Behery˃ El-Rayah El-Menoufy.
Mango tilapia recorded higher values of Cu followed
by Tilapia zillii˃ Nile tilapia. Fish organs were in the
order: gills˃ bones˃ muscle.
Table 4. Bioaccumulation of Cu in different tissues of tilapia fish species collected from River Nile Rayahs during
spring 2014 to winter 2015.
Fish species Organs Seasons Tawfiky Behery Nasery Menoufy
Nile tilapia
Muscle
Sp 0.00 0.00 6.10 0.99 Su 7.70 6.00 6.70 8.60 Au 8.30 6.10 5.10 5.90 Wi 1.30 3.30 18.30 18.60
Bones
Sp 2.10 2.20 4.10 1.10 Su 11.80 2.80 8.10 6.40 Au 8.20 12.40 8.50 6.90 Wi 0.30 2.80 22.20 23.60
Gills
Sp 5.40 1.10 4.80 0.86 Su 9.70 4.90 7.00 6.40 Au 6.50 7.30 6.20 5.50 Wi 2.30 6.40 22.70 29.80
Mango tilapia
Muscle
Sp 0.00 5.20 2.80 1.21 Su 7.80 10.20 11.80 4.10 Au 7.10 NF 6.20 6.00 Wi 0.20 1.50 18.00 26.20
Bones
Sp 0.87 3.00 4.10 3.40 Su 5.00 6.40 10.80 6.60 Au 8.60 NF 6.80 7.50 Wi 0.70 2.80 22.40 28.20
Gills
Sp 0.92 5.40 6.40 0.56 Su 7.80 9.30 15.60 6.80 Au 10.00 NF 5.20 5.40 Wi 3.70 4.70 26.80 25.70
Tilapia zillii
Muscle
Sp 1.00 0.80 1.53 0.00 Su 7.50 7.50 2.70 0.00 Au 7.90 8.30 4.70 8.20 Wi 0.60 1.40 21.20 26.40
Bones
Sp 2.68 0.90 2.13 1.80 Su 5.60 7.80 3.30 4.90 Au 8.80 7.50 5.80 5.90 Wi 4.60 2.90 22.70 26.60
Gills
Sp 1.14 3.00 2.67 9.40 Su 9.20 10.30 6.00 3.50 Au 8.80 5.40 7.00 6.00 Wi 2.10 3.10 19.10 28.40
Sp: spring; Su: summer; Au: autumn; Wi: winter.

J. Bio. & Env. Sci. 2015
95 | Ghannam et al.
Nile tilapia showed lowest values (0.00 µg/g dw) of
Cu in the muscle collected from El-Rayah El-Tawfiky
during spring season, while the highest value (29.80
µg/g dw) were recorded in gills collected from El-
Rayah El-Menoufy during winter season. Mango
tilapia showed lowest values (0.00 µg/g dw) of Cu in
the muscle collected from El-Rayah El-Tawfiky
during spring season, while the highest value (28.20
µg/g dw) were recorded in bones collected from El-
Rayah El-Menoufy during winter season. Tilapia zillii
showed lowest values (0.00 µg/g dw) of Cu in the
muscle collected from El-Rayah El-Menoufy during
spring season, while the highest value (28.40 µg/g
dw) were recorded in bones collected from El-Rayah
El-Menoufy during winter season.
Lead (Pb)
Bioaccumulation of Pb in different tissues of tilapia
fish species collected from River Nile Rayahs in the
period spring 2014 to winter 2015 are given in Table
(5). The minimum and maximum of Pb
concentrations in different tissues of tilapia fish
species were (0.00 and 36.90 µg/g dw). Higher values
of Pb were found in El-Rayah El-Menoufy˃ El-Rayah
El-Nasery˃ El-Rayah El-Tawfiky˃ El-Rayah El-
Behery˃. Mango tilapia recorded higher values of Pb
followed by Nile tilapia˃ Tilapia zillii. Fish organs
were in the order: gills˃ bones˃ muscle.
Table 5. Bioaccumulation of Pb in different tissues of tilapia fish species collected from River Nile Rayahs during
spring 2014 to winter 2015.
Fish species Organs Seasons Tawfiky Behery Nasery Menoufy
Nile tilapia
Muscle
Sp 8.80 4.70 6.70 15.40 Su 1.60 13.60 0.90 13.90 Au 11.10 1.40 0.00 0.00 Wi 9.20 12.00 5.20 0.00
Bones
Sp 2.30 2.80 10.80 15.90 Su 2.80 16.90 0.50 7.80 Au 0.00 0.00 3.30 12.00 Wi 9.70 29.50 3.30 0.00
Gills
Sp 3.40 7.00 10.00 12.00 Su 5.70 5.40 3.90 7.70 Au 3.30 2.80 0.00 0.00 Wi 7.60 10.30 13.50 3.50
Mango tilapia
Muscle
Sp 7.50 6.50 0.00 10.70 Su 6.80 7.20 19.40 2.40 Au NF 9.00 11.50 0.50 Wi 6.60 14.00 4.80 12.70
Bones
Sp 12.80 2.60 0.00 8.30 Su 6.00 0.10 11.30 6.60 Au NF 0.00 6.30 0.00 Wi 36.90 17.60 13.70 0.90
Gills
Sp 1.50 17.80 0.00 14.80 Su 5.40 8.10 10.10 4.30 Au NF 0.00 0.00 6.50 Wi 9.70 29.00 6.00 13.80
Tilapia zillii
Muscle
Sp 6.90 2.10 15.00 9.40 Su 3.50 6.00 3.10 16.30 Au 1.30 0.00 0.00 2.30 Wi 2.70 0.00 0.00 0.00
Bones
Sp 3.20 5.50 13.50 7.10 Su 0.60 1.30 10.10 1.80 Au 0.00 0.00 0.00 0.00 Wi 0.00 3.70 0.00 0.00
Gills
Sp 3.80 5.00 13.70 14.20 Su 5.90 2.60 1.60 4.30 Au 0.00 0.00 0.00 0.00 Wi 0.00 0.00 15.70 0.00
Sp: spring; Su: summer; Au: autumn; Wi: winter.

J. Bio. & Env. Sci. 2015
96 | Ghannam et al.
El-Rayah El-Tawfiky showed higher concentration of Pb
(36.90 µg/g dw) in the bones of Mango tilapia during
winter, while lower values (0.00 µg/g dw) were recorded
in bones and gills of Tilapia zillii during autumn and
winter. El-Rayah El-Behery showed higher
concentration of Pb (29.50 µg/g dw) in the bones of Nile
tilapia during winter, while higher concentration of Pb
(19.40 µg/g dw) in the muscle of Mango tilapia during
summer. The higher value of Pb (16.30 µg/g dw) in the
muscle of Tilapia zillii during summer
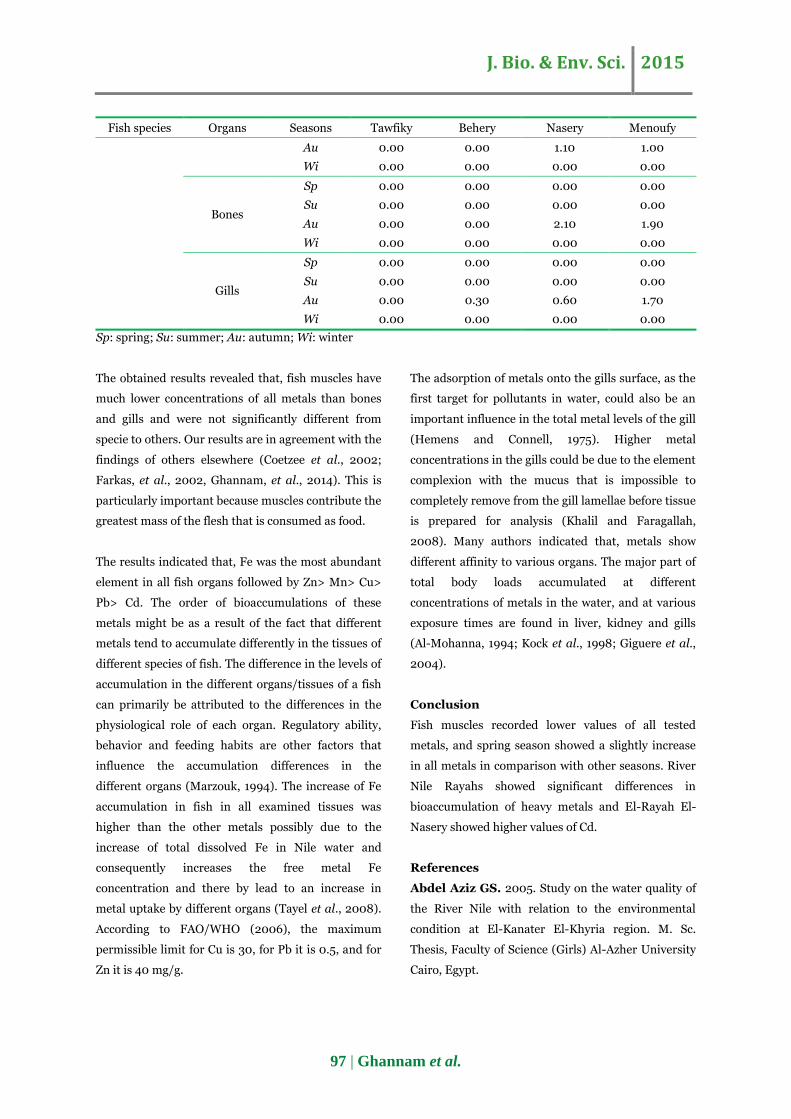
Cadmium (Cd)
From table (6) cadmium in general was not detected in
most fish organs samples except in El-Rayah El-Nasery
during autumn in collected three tilapia fish species
and ranged from (0.30-3.30 µg/g dw) in muscle of
mango tilapia and the highest in the gills of Nile tilapia.
Cd was detected only in bones of Nile tilapia collected
from El-Rayah El-Tawfiky during autumn and
recorded (1.40 µg/g dw). However, in El-Rayah El-
Behery it was recorded in two samples during autumn,
the first (1.50 µg/g dw) was the muscle of Nile tilapia
and the second (0.30 µg/g dw) was the gills of tilapia
zillii. El-Rayah El-Menoufy recorded higher levels of
Cd only in the muscle of Nile tilapia and gills of Mango
tilapia and recorded (2 and 2.60 µg/g dw), respectively.
On the other hand, the muscle, bones and gills of
Tilapia zillii recorded 1, 1.90 and 1.70 µg/g dw,
respectively, during autumn.
Table 6. Bioaccumulation of Cd in different tissues of tilapia fish species collected from River Nile Rayahs during
spring 2014 to winter 2015.
Fish species Organs Seasons Tawfiky Behery Nasery Menoufy
Nile
tilapia
Muscle
Sp 0.00 0.00 0.00 0.00
Su 0.00 0.00 0.00 0.00
Au 0.00 1.50 1.40 2.00
Wi 0.00 0.00 0.00 0.00
Bones
Sp 0.00 0.00 0.00 0.00
Su 0.00 0.00 0.00 0.00
Au 1.40 0.00 2.90 0.00
Wi 0.00 0.00 0.00 0.00
Gills
Sp 0.00 0.00 0.00 0.00
Su 0.00 0.00 0.00 0.00
Au 0.00 0.00 3.30 0.00
Wi 0.00 0.00 0.00 0.00
Mango
tilapia
Muscle
Sp 0.00 0.00 0.00 0.00
Su 0.00 0.00 0.00 0.00
Au 0.00 NF 0.30 0.00
Wi 0.00 0.00 0.00 0.00
Bones
Sp 0.00 0.00 0.00 0.00
Su 0.00 0.00 0.00 0.00
Au 0.00 NF 2.20 0.00
Wi 0.00 0.00 0.00 0.00
Gills
Sp 0.00 0.00 0.00 0.00
Su 0.00 0.00 0.00 0.00
Au 0.00 NF 0.60 2.60
Wi 0.00 0.00 0.00 0.00
Tilapia
zillii Muscle
Sp 0.00 0.00 0.00 0.00
Su 0.00 0.00 0.00 0.00
J. Bio. & Env. Sci. 2015
97 | Ghannam et al.
Fish species Organs Seasons Tawfiky Behery Nasery Menoufy
Au 0.00 0.00 1.10 1.00
Wi 0.00 0.00 0.00 0.00
Bones
Sp 0.00 0.00 0.00 0.00
Su 0.00 0.00 0.00 0.00
Au 0.00 0.00 2.10 1.90
Wi 0.00 0.00 0.00 0.00
Gills
Sp 0.00 0.00 0.00 0.00
Su 0.00 0.00 0.00 0.00
Au 0.00 0.30 0.60 1.70
Wi 0.00 0.00 0.00 0.00
Sp: spring; Su: summer; Au: autumn; Wi: winter
The obtained results revealed that, fish muscles have
much lower concentrations of all metals than bones
and gills and were not significantly different from
specie to others. Our results are in agreement with the
findings of others elsewhere (Coetzee et al., 2002;
Farkas, et al., 2002, Ghannam, et al., 2014). This is
particularly important because muscles contribute the
greatest mass of the flesh that is consumed as food.
The results indicated that, Fe was the most abundant
element in all fish organs followed by Zn> Mn> Cu>
Pb> Cd. The order of bioaccumulations of these
metals might be as a result of the fact that different
metals tend to accumulate differently in the tissues of
different species of fish. The difference in the levels of
accumulation in the different organs/tissues of a fish
can primarily be attributed to the differences in the
physiological role of each organ. Regulatory ability,
behavior and feeding habits are other factors that
influence the accumulation differences in the
different organs (Marzouk, 1994). The increase of Fe
accumulation in fish in all examined tissues was
higher than the other metals possibly due to the
increase of total dissolved Fe in Nile water and
consequently increases the free metal Fe
concentration and there by lead to an increase in
metal uptake by different organs (Tayel et al., 2008).
According to FAO/WHO (2006), the maximum
permissible limit for Cu is 30, for Pb it is 0.5, and for
Zn it is 40 mg/g.
The adsorption of metals onto the gills surface, as the
first target for pollutants in water, could also be an
important influence in the total metal levels of the gill
(Hemens and Connell, 1975). Higher metal
concentrations in the gills could be due to the element
complexion with the mucus that is impossible to
completely remove from the gill lamellae before tissue
is prepared for analysis (Khalil and Faragallah,
2008). Many authors indicated that, metals show
different affinity to various organs. The major part of
total body loads accumulated at different
concentrations of metals in the water, and at various
exposure times are found in liver, kidney and gills
(Al-Mohanna, 1994; Kock et al., 1998; Giguere et al.,
2004).
Conclusion
Fish muscles recorded lower values of all tested
metals, and spring season showed a slightly increase
in all metals in comparison with other seasons. River
Nile Rayahs showed significant differences in
bioaccumulation of heavy metals and El-Rayah El-
Nasery showed higher values of Cd.
References
Abdel Aziz GS. 2005. Study on the water quality of
the River Nile with relation to the environmental
condition at El-Kanater El-Khyria region. M. Sc.
Thesis, Faculty of Science (Girls) Al-Azher University
Cairo, Egypt.
J. Bio. & Env. Sci. 2015
98 | Ghannam et al.
Abou-Arab AAK, Ayesh AM, Amra HA, Naguib
K. 1996. Characteristic levels of some pesticides and
heavy metals in imported fish. Food Chemistry 57(1),
1-6.
Al-Mohanna MM. 1994. Residues of some heavy
metals in fishes collected from (Red Sea Coast) Jisan,
Saudi Arabia. Journal of Environmental Biology 15,
149-157.
Barak NAE, Mason CF. 1990. Mercury, cadmium
and lead in eels and roash. The effects of size, season
and locality on metal concentration in flesh and liver.
Science of the Total Environment 92, 249-256.
Coetzee L, DuPreez HH, VanVuren JHJ. 2002.
Metal concentrations in Clarias gariepinus and
Labeo umbratus from the Olifants and Klein Olifants
River, Mpumalanga, South Africa: Zinc, copper,
manganese, lead, chromium, nickel, aluminium
andiron. Water SA Journal 28(4), 433-448.
Dalman O, Demirak A, Balci A. 2006.
Determination of heavy metals (Cd, Pb) and trace
elements (Cu, Zn) in sediments and fish of the
Southeastern Aegean Sea (Turkey) by atomic
absorption spectrometry. Food Chemistry 95, 157-
162.
Dudka S, Adriano DC. 1997. Environmental
impact of metal ore mining and processing: a review.
Journal of Environmental Quality 26, 590- 602.
Dybem B. 1983. Field sampling and preparation
subsamples of aquatic organism for analysis metals
and organochlorides. FAO Fisheries Technical 212, 1-
13.
Eisenberg M, Topping JJ. 1986. Trace metal
residues in finfish from Maryland waters, 1978-1979.
Journal of Environmental Science and Health, Part B
21(1), 87-102.
Farkas A, Salianki J, Speczilar A. 2002. Relation
between growth and the heavy metal concentration in
organs of bream Abramis brama L. populating Lake
Balaton. Archives of Environmental Contamination
and Toxicology 43, 236-43.
Ghannam HE, Talab AS, Gaber SE, Jahin HS.
2014. Assessment of heavy metals distribution in
some freshwater fish organs using inductively
coupled plasma optical emission spectrometry (ICP-
OES). Ecology, Environment and Conservation
Journal 20(3), 859-870.
Giguere A, Campbell PGC, Hare L, McDonald
DG, Rasmussen JB. 2004. Influence of lake
chemistry and fish age on cadmium, copper, and zinc
concentrations in various organs of indigenous yellow
perch (Perca flavescens). Canadian Journal of
Fisheries and Aquatic Sciences 61, 1702-1716.
Gomaa MNE, Abou-Arab AAK, Badawy A,
Naguib K. 1995. Distribution pattern of some heavy
metals in Egyptian fish organs. Food Chemistry 53,
385-389.
Harms U. 1975. The levels of heavy metals (Mn, Fe,
Co, Ni, Cu, Zn, Cd, Pb, Hg) in fish from onshore and
offshore waters of the German Bight. Z Lebensm
Unters Forsch Journal 159, 125-133.
Hemens J, Connell AD. 1975. Richards Bay:
Southern bay conservation area. CSIR/ NIWR
Progress Report No. 29 CSIR, Durban, South Africa.
Hernandez F, Medira J, Ansuategui J, Lopeg
FJ. 1990. Application of simple procedure of
digestion for the determination of trace metals in
marine organisms. Analysis 18, 327-330.
Ibrahim HTM. 1996. Detection and identification of
some pesticide residues and heavy metals in Qarun
Lake and River Nile fish. M.Sc thesis, Faculty of
Agriculture, Cairo University, Egypt.

J. Bio. & Env. Sci. 2015
99 | Ghannam et al.
Khali M, Faragallah H. 2008. The distribution of
some leachable and total heavy metals in core
sediments of Manzala lagoon, Egypt. Egypt Journal of
Aquatic Research 34 (1), 1-11.
Kock G, Triendl M, Hofer R. 1998. Lead (Pb) in
Arctic char (Salvelinus alpinus) from oligotrophic
Alpine lakes: Gills versus digestive tract. Water Air
Soil Pollution 102, 303-312.
Lowe TP, May TW, Brubangh WG, Kane DA.
1985. National contaminant monitoring program.
Concentrations of seven elements in freshwater fish,
1979-1981. Archives of Environmental Contamination
and Toxicology 14, 363-383.
Luckas B. 1987. Characteristic levels of chlorinated
hydrocarbons and trace metals in fish from coastal
waters of North and Baltic Sea. International Journal
of Environmental Analytical Chemistry 29, 215-225.
Marzouk M. 1994. Fish and environmental
pollution. Journal of Veterinary Medicine 42, 51-52.
Philippart JCL, Ruwet JCL. 1982. Ecology and
distribution of tilapias. In: Lowe, R.H. and M.C.
Connell (eds.), The Biology and Culture of Tilapia, pp:
15-59. International Center for living Aquatic
Resources Management, Manila, Philippines.
Ramos A, Decompose M, Olszyna AE. 1979.
Mercury contamination of fish in Guatemala. Bulletin
of Environmental Contamination and Toxicology 22,
488-493.
Saad MAH, Goma RH. 1994. Effects of the High
Dam and Aswan cataract on the chemical
composition of the Nile waters. I: Major anions,
Verhandlungen des Internationalen Verein
Limnologie 25, 1812-1815.
Svobodova Z, Lloyd R, Machova J, Vykusova
B. 1993. Water quality and fish health,EI-FAC
Technical paper No. 54 Rome. FAO. 59p.
Tayel SI, Yacoub AM, Mahmoud SA. 2008.
Histopathological and haematological responses to
freshwater pollution in the Nile catfish Clarias
gariepinus. Journal of Egyptian Academic Society
for Environmental Development 9, 43-60.
Wiener JG, Giesy JP. 1979. Concentration of Cd,
Cu, Mn, Pb, Zn, in fishes in highly organic software
pond. Journal of the Fisheries Research Board of
Canada 36, 270-278.
Yacoub AM, Gad NS. 2012. Accumulation of some
heavy metals and biochemical alterations in muscles
of Oreochromis niloticus from the River Nile in
Upper Egypt. International Journal of Environmental
Science and Engineering 3, 1- 10.
Zyadah MA. 2008. Accumulation of some heavy
metals in Tilapia Zillii organs from Lake Manzalah,
Egypt. Turkish Journal of Zoology 23, 365-372.