bio unit 1: science safety and evidence based thinking lab safety lab equipment accuracy and...
TRANSCRIPT

Bio Unit 1: Science Safety and Evidence Based Thinking
• Lab Safety• Lab Equipment• Accuracy and Precision • Measurements• Scientific Method• Charts and Graphs

SAFETY
1. Always obtain the instructor’s permission before beginning a lab.

SAFETY
2. Read the procedure (more than once)
before beginning the experiment. Ask the instructor if you have
any questions.

SAFETY
3. Always wear safety goggles.

SAFETY
4. Always point the mouth of a test tube away from yourself and others.

SAFETY
5. Never eat or drink anything in the lab.

SAFETY
6. Remember if you need to smell a
substance, waft it toward your nose.
Do not directly smell the chemical.

SAFETY
7. When diluting an acid, always pour the acid into the water.

SAFETY
8. Reactions that produce toxic
fumes should be performed under
a fume hood.

SAFETY
9. Know the location of all the safety equipment in the lab.

SAFETY
10. Long hair, loose clothing, and jewelry should be secured and tied
back during lab procedures.

SAFETY
11. Do not handle hot or cold containers with your bare hands.
Use the proper holder for the container.

SAFETY
12. Report any and all accidents to the teacher immediately, no matter how
big or small.

SAFETY
13. Ask the teacher for the proper way to dispose of any material.

SAFETY QUESTIONS
• Now answer the safety practice questions

Safety symbols


Biohazard
Biological materials that could be harmful.
Toxic or Poisonous

CorrosiveCorrosive means
capable of destroying or eating
away by chemical means.

FlammableEasily set on
fire.

Safety GogglesGoggles MUST be
worn at all times while in the lab.

Open Flame AlertBe careful when using an open flame
as an explosion could occur.

Lab Equipment

Beaker• A beaker is used to
hold liquids.
• It is not precise enough to make
good measurements.

Graduated CylinderUsed to measure
liquid volumes (mL).
Always read a graduated cylinder from the bottom
of the meniscus.
meniscus
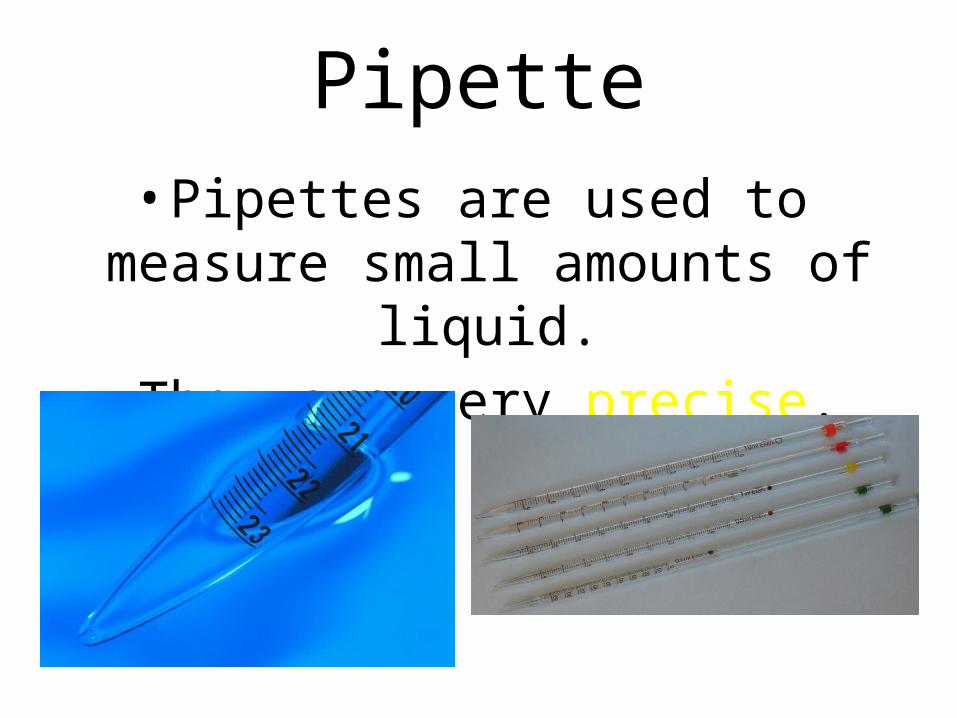
Pipette• Pipettes are used to measure small
amounts of liquid.• They are very precise.

Test Tube• A test tube is
used to hold or store liquids.
• It is not a precise measuring instrument.

Test Tube Rack • A test tube rack is
used to hold and support test tubes.

Test Tube Clamp
• Test tube clamps are used to hold a test tube while its contents are being heated.

Triple Beam Balance
• A triple beam balance is used to measure mass (kg).

Funnel• A funnel is used to
transport materials from one container into another container.

Erlenmeyer Flask• An Erlenmeyer
flask is used to hold and mix
liquids.
• It is not precise.

Ring Stand
• A ring stand is used to hold objects.

Bunsen Burner• A Bunsen burner uses
natural gas to provide a heat source.

Tongs
• Tongs can be used when
handling hot or cold
objects, such as beakers.
Accuracy & Precision

Accuracy & Precision• Accuracy = refers to how “correct” the
answer is (hitting the bull’s eye)
• Precision = refers to how small a scale is being used to make a measurement or how close measurements are to each other.

Accuracy • This is when a
measurement is closest to its true value.
• The exactly correct answer.
• The bull’s eye.

Precision
• This is the repeatability of a measurement.
• It may or may not be accurate

• Precise, but not accurate.

• Accurate and precise.

• Not accurate or precise.

A B
C DA=high precision, high accuracyB=low precision, high accuracyC=high precision, low accuracyD=low precision, low accuracy

Measurement

Tools for Measurement
• Clocks and stopwatches measure time.
• A balance is used to measure mass.
• A graduated cylinder, dropper, or Erlenmeyer flask is used to measure volume.

Length• The standard unit of
measurement to determine length is a meter (m).
• It measures the distance from one point to another.
• A ruler or meter stick are most commonly used to determine length.

Mass• Mass is the measure of the amount of matter
an object has.• It is measured in grams (g).• The tool for measuring mass is the triple beam
balance.

Volume• Volume is the amount of space
occupied by an object.

Volume• The units for volume are cubic
centimeters (cm3) or milliliters (mL).

Volume• The volume of a regular object can be
determined mathematically. – For example, the volume of a cube is length
x width x height.

Volume
• The volume of irregular objects
can be determined by displacement.

Density• Density is the mass of an object divided
by its volume.• It is measured in g/cm3.• Density helps explain why things float.

Temperature• Temperature measures how hot or cold
something is.• All measurements for temperature are taken
in degrees Celsius.• The SI unit for temperature is Kelvin (K).

Temperature• A thermometer is the most common
tool for measuring temperature.

Conversions
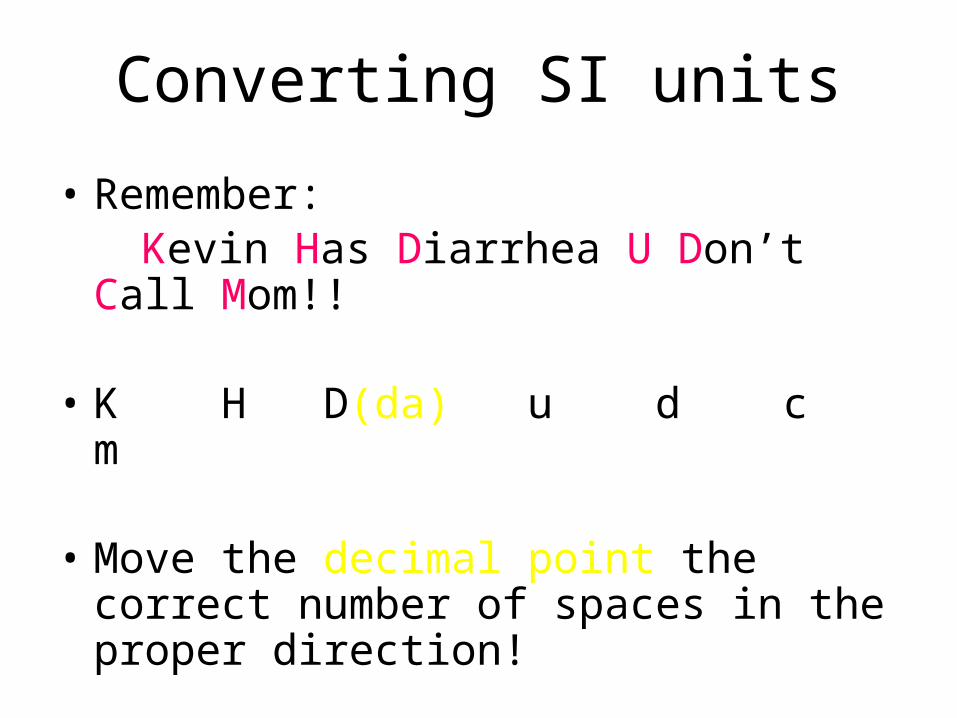
Converting SI units
• Remember: Kevin Has Diarrhea U Don’t Call Mom!!
• K H D(da) u d c m
• Move the decimal point the correct number of spaces in the proper direction!

For example: 2L = ? mL
1 2 3Step #1
k h da u d c m
(remember that u = meters, liters & grams)Step #2 – determine how many spaces are between u and mStep #3 – move the decimal in the original problem the same number of spaces and in the same direction for your answer.

• Therefore 2L = 2000mL• Remember to move the decimal the
same direction that you moved on the chart!!
2 0 0 01 2 3
. .

Practice problems
1. 35 hg = ? dg
2. 2.56 kg = ? cg
3. .065 mL = ? hL

Scientific Method - a series of steps used by
scientists to solve a problem

• What is the scientific method? It is a process that is used to find answers to questions about the world around us.
• Is there only one scientific method? No, there are several
versions of the scientific method. Some versions have more steps, while others may have only a few. However, they all begin with the identification of a problem or a question to be answered based on observations of the world around us and provide an organized method for conducting and analyzing an experiment.
• What is a hypothesis? It is an educated guess based on observations and your knowledge of the topic.
• What is data? It is information gathered during an experiment.

How Do Scientists Solve Problems?
The Scientific Method

Yes No
Yes Modify the Experimentinaccurate or
Is your data
Rewrite your procedure to addressthe
experiment flawed? the flaws in the original experiment.
No
Make a Conclusion
Write a conclusion that summarizes the important parts of your experiment and the results.
Analyze the DataIs the data reliable? Does your data and observations from the experiment support your hypothesis?
Conduct an ExperimentFollow the steps in your procedure to perform your experiment. Record data and observations!
Form a HypothesisWhat do you think will happen? Predict the answer to your question or the outcome of the experiment.
Identify the Problem (make an observation)What do you want to know or explain? Use observations you have made to write a question that
addresses the problem or topic you want to investigate.
Is the data inaccurate or the experiment flawed
Modify the ExperimentRewrite your procedure to addressthe flaws in the original experiment.
Yes
No

1. Make an observation.• Use your senses (sight, hearing, touch, etc.) to make observations.

2. Form a Hypothesis
• A hypothesis is an educated guess. It must be testable.

3. Conduct an Experiment• Design and conduct an experiment
to test your hypothesis.

4. Record and Analyze the Data
• Record and organize the data from the experiment.
• Analyze the results so that a conclusion can be formed.

5. Make a Conclusion• After analyzing your
results, make a conclusion.
• Determine if your hypothesis was right or wrong.

Scientific Theory• Theories are based upon
experimental data. • Confirmed by repeated
experiments.• Modified as new
information is gathered.

Scientific Law
• Theories become Laws when nothing changes for hundreds of years.
• Laws become theories again when new information changes them.

Experiments
The Independent Variable is the variable that can be manipulated or
changed by the scientist.

The Dependent Variable is the variable that changes because of the independent variable. It must be measured, counted,
or observed.

The control is the part of the experiment that is held constant. It
is used for comparison.

The factors that must remain the same in each experimental setup are the
constants.

Experimenting
• You are planning to grow tomatoes in your garden, but you don’t know what the best kind of fertilizer would be. At Wal-Mart you find 3 different fertilizers for tomato plants.
• Design an experiment to test which fertilizer is best.

What would the independent variable be?
The type of fertilizer What would the dependent variable be?
The growth of the tomato plants and the amount of fruit they produce.
What is the control?
The control would be the plants where NO fertilizer was added.
What are the constants?
The constants could include the amount of water, type of soil, type of tomato plant, initial size of plant, size of their containers, etc.
Charts, Tables, and GraphsAnalysis of Data

Analysis of the Data
• Data tables, flow charts and graphs present the information collected during an experiment.
• What the data shows, any trend in information is explained in the analysis of data.

• Qualitative Data is data that uses words, describing certain
characteristics. (it is cold outside)

• Quantitative Data – numerical
data, gives precise amounts
(it is 32o outside)


Pie or Circle Graphs
Pie graphs represents
parts or percents of a
whole.

Line Graph
• A line graph uses plotted
data points and lines to show
the relationship between variables.

Bar Graph
• A bar graph compares data using bars of
different heights and lengths.

Data Table
• A data table organizes data into rows and columns.
Columns
Rows

Reading Tables and Graphs
1. When a question includes a table or graph, read it first, before reading the question.
Don’t just Look at it READ IT.

While you are reading the graph, pay attention to the following:
2. What is the title, what is being measured or compared? What units (grams, mLs, minutes,
years) are given? Are the numbers or slope increasing, decreasing?
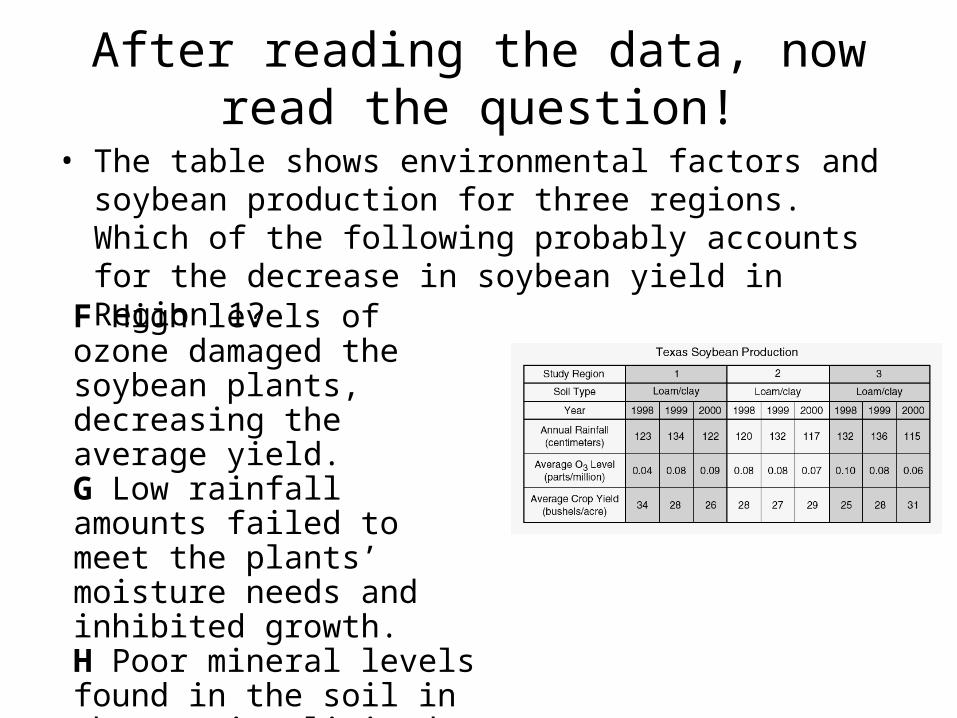
After reading the data, now read the question!
• The table shows environmental factors and soybean production for three regions. Which of the following probably accounts for the decrease in soybean yield in Region 1?
F High levels of ozone damaged the soybean plants, decreasing the average yield.G Low rainfall amounts failed to meet the plants’ moisture needs and inhibited growth.H Poor mineral levels found in the soil in that region limited the soybean harvest.J Higher-than-normal rainfall increased pest activity, decreasing the average yield.

What do you have to know?
F
*1st you really only have two choices, decreased rainfall, or O3 level. *Since the rainfall did not decrease consistently (it actually increased in 1999) that would not be a good answer. *Therefore, it must be the O3, which is the chemical formula for ozone. Answer?

Reading Graphs Always read the title. Read the x- & y-axis
labels & UNITS. What is happening?
As the pressure of oxygen increases, the % saturation is
increased.

Match the type of graph with its use.
Circle Graph
Bar Graph
Line Graph
Used to compare several categories
Shows the relationship between two measured quantities
Shows a single measurement of a number objects or events
Shows how a whole is divided into its parts.
Used to make predictions and show trends
Inference
An inference is an explanation based on observations or trends.
For example, if you wake up in the morning and see water on your car and on the ground, you could infer that it rained even though you did not actually see it happen.