bio-fuel production by using integrated anaerobic … · glucose, xylose, cellulose and micro ......
TRANSCRIPT

Bio-fuel Production by Using Integrated
Anaerobic Fermentation
A DISSERTATION SUBMITTED TO THE FACULTY OF THE GRADUATE SCHOOL
OF THE UNIVERSITY OF MINNESOTA BY
Lei Xu
IN PARTIAL FULFILLMENT OF THE REQUIREMENTS FOR THE DEGREE OF
DOCTOR OF PHILOSOPHY
Advisor: Ulrike Tschirner
Co-advisor: Jonathan Schilling
January, 2012

© Lei Xu 2012

i
ACKNOWLEDGEMENTS
First of all, the author would like to express sincere appreciation to Dr. Ulrike
Tschirner for her assistance. As an academic adviser, her guidance is the most
critical factor in developing the author’s research capability in this field. Her
encouragement and inspiration as a friend make the author’s graduate studies at the
University of Minnesota an important and graceful milestone in the whole life. The
author also wishes to thank her co-advisor, Dr. Jonathan Schilling for his valuable
advice, guidance, technical assistance and encouragement during these years.
The author thankful to Dr. Ulrike Tschirner, Dr. Jonathan Schilling, Dr. Shri Ramaswamy, Dr.
Craig Sheaffer ,and Dr. William Tai Yin Tze for their servicing as members of my examination
committee. Their patient, valuable suggestions and encouragement are highly appreciated.
The author appreciates the help from the professors at the Department of Biosystems
and Bioproducts Engineering for their valuable advices. Especially Dr. Kevin A.
Janni, who greatly contributed in guiding the research methods.
The author would like to thanks her co-workers in Kaufert Lab. Dr. Waleed Wafa
AlDajani, Dr. Jun Ai, Dr. Shona Duncan’s assistance in performing experiments
during her research and their instructive discussions were greatly help in overcoming
many challenges in my research.
The author also wants to express her gratitude to my fellow students in the
Department of Biosystems and Bioproducts Engineering, and her friends outside this

ii
department. Their supports and encouragements are critical for the author’s
graduate study life.
Finally, the author would like to take this opportunity to express her deepest love and
everlasting appreciation to her dad, mom, grandfather, and grandmother for their
life-long education, love, encouragement, sacrifice, and completely confidence on
her. All this work would be impossible without all their support.
Lei Xu

iii
ABSTRACT
Saccharification is one of the most critical steps in producing lignocellulose-based
bio-ethanol through consolidated bioprocessing (CBP). However, extreme pH and
high ethanol concentrations are commonly considered potential inhibitors for the
application of Clostridium sp. in CBP. The fermentation of several saccharides
derived from lignocellulosics was investigated with a co-culture consisting of
Clostridium themocellum and Clostridium thermolacticum with or without
immobilization. Alkali environments proved to be more favorable for ethanol
production. Fermentation inhibition was observed at high ethanol concentrations
(>8g/L) and extreme pH (>10). However, low levels of initial ethanol addition
resulted in an unexpected stimulatory impact on the final ethanol productions for all
cultures under selected conditions. The co-culture was able to actively ferment
glucose, xylose, cellulose and micro-crystallized cellulose (MCC). The ethanol
yield observed in the co-culture was higher (up to two-fold) than in mono-cultures,
especially in MCC fermentation. The highest ethanol yield (as a percentage of the
theoretical maximum) observed were 75% (w/w) for MCC and 90% (w/w) for xylose.
Immobilization technique using sodium alginate is efficient in improve the ethanol
production during co-culture fermentation, although the immobilization is not able to
change the ethanol sensitivity of this co-culture. The ethanol yield through the use
of immobilized technique increased to 97% of the theoretical efficiency for glucose.
For cellobiose and MCC under optimized condition, the ethanol yields were
approaching 85% of the theoretical efficiency. In order to examine the feasibility of
this immobilization co-culture on lignocellulosic biomass conversion, untreated and
pretreated aspen fermentations were performed. The immobilization co-culture
shows clear benefit in bio-ethanol production in CBP process. With a 3h, 9%
NaOH pretreatment, the aspen powder fermentation yield approached 78% of the
maximum theoretical efficiency, which is almost twice the yield of the untreated
aspen fermentation.
Keywords: Consolidated bioprocessing, Clostridium sp., Fermentation, Co-culture,
Lignocellulosic ethanol, Immobilization, Alginate gel

iv
TABLE OF CONTENTS
ACKNOWLEDGEMENTS …………………………...………………………….. i ABSTRACT …………………………………………………………………..…... ii TABLE OF CONTENTS …………………………………………………………. iv LIST OF TABLES ………………………………………………………………… vi LIST OF FIGURES……………………………...……………………………….. vii Chapter 1 Introduction ………………………………………...………………….. 1 1.1 Problem Statement ………………………………………………………………………...…. 1 1.2 Objectives ………………………………………………………………………………...….. 4 1.3 Significance …………………………………………………………………………..…….... 5 Chapter 2 Literature survey ………………………………………………..…….. 6 2.1 Bio-ethanol Potential ……………………………………………………………………….... 7 2.2 Feedstock ………………………………………………………………………………...….. 7
2.2.1 Sugars …………………………………………………………………………...…….. 7 2.2.2 Starch ………………………………………………………………………………..… 9 2.2.3 Lignocellulosic biomass ……………………………………………………………... 10
2.2.3.1 Lignocellulosic biomass structure and composition ……………………….... 11 2.2.3.1.1 Cellulose ……………………………………………………….… 12
2.2.3.1.2 Lignin …………………………………………………………….……….. 13 2.2.3.1.3 Hemicellulose …………………………………………………….……….. 15 2.2.3.1.4 Aspen …………………………………………………………….………… 16
2.3 Pretreatments techniques …………………………………………………………………… 17 2.3.1 Physical pretreatment ………………………………………………………….…….. 18
2.3.1.1 Mechanical pretreatment …………………………………………………… 18 2.3.1.2 Non-mechanical method …………………………………………………… 19
2.3.2 Biological pretreatment ……………………………………………………………… 22 2.3.3 Chemical pretreatment ………………………………………………………………. 23
2.3.3.1 Alkali Pretreatment …………………………………………………………. 23 2.3.3.2 NaOH pretreatment and Lime pretreatment ………………………………… 25 2.3.3.3 Ammonia pretreatment ……………………………………………………… 25 2.3.3.4 Acid Pretreatment …………………………………...………………………. 29
2.3.3.4.1 Sulfuric acid ……………………………………………………… 30 2.3.3.4.2 Organic acid ……………………………………………………… 31
2.3.4 Combination pretreatment …………………………………………………………… 32 2.4 Hydrolysis techniques ……………………………………………………………………… 33
2.4.1 Acid hydrolysis ………………………………………………………………………. 34 2.4.2 Biological hydrolysis ………………………………………………………………… 35 2.4.3 Enzymes for hydrolysis of lignocellulosic materials ………………………………… 35 2.4.4 Common Barriers and Inhibitions for Hydrolysis ...…………………………………. 37
2.4.4.1 Cellulose crystallinity ………………………………………………………. 38 2.4.4.2 Surface feature ……………………………………………………………… 38 2.4.4.3 Moisture content of cellulose ……………………………………………….. 39 2.4.4.4 DP value of the cellulose ……………………………………………………. 39 2.4.4.5 Nature of association …………………………………………………………40 2.4.4.6 Acetyl group ……...…………………………………………………………. 41 2.4.4.7 Inhibitor by-products ..……………………………………………………… 41 2.4.4.8 Extractives …………………………………………………………………. 42 2.4.4.9 Heavy metal ions …………………………………………………………… 42
2.5 Fermentation process ……………………………………………………………………… 43 2.5.1 Fermentation Micro-organisms ……………………………………………………… 43
2.5.1.1 Bacteria ……………………………………………………………………… 43

v
2.5.1.1.1 C. thermolacticum (ATCC 43739) ….…………………………..... 46 2.5.1.1.2 C. thermocellum (ATCC 27405) ……………………………….… 47 2.5.1.1.3 Ethanol Sensitivity in C. thermocellum and C. thermolacticum … 48 2.5.1.1.4 Lack of Proper Regulations in C. thermocellum and C. thermolacticum ………………...………........... ……. 49 2.5.1.1.5 Co-culture Fermentation ………………………………………… 51 2.5.1.1.6 Modification for Strain Improvement …………………………… 53
2.5.1.2 Fungi ………………………………………………………………………… 55 2.5.1.2.1 Yeast ……………………………………………………………… 55 2.5.1.2.2 Mold ……………………………………………………………… 56
2.5.2 Consolidated Bioprocess …………………………………………………………….. 56 2.5.3 Immobilization ………………………………………………………………………. 58
Chapter 3 Materials and Experimental Procedure ………...………………….. 61 3.1 Microbial Species and Media …………………………………………………………….… 61 3.2 Substrate ………………………………………………………………………………….… 61 3.3 Growth of Organisms ………………………………………………………………………. 61 3.4 Determination of Cell Mass ………………………………………………………………… 62 3.5 Biomass Characterization …………………………………………………………….…….. 62 3.6 Encapsulation ………………………………………………………………………………. 63 3.7 Lignin preparation (Organosolv pulping) ………………………………………………….. 63 3.8 Analytical Methods ………………………………………………………………………… 64 3.9 Calculation of theoretical ethanol yield …………………………………………………….. 65 Chapter 4 Results and discussion ………………………………………….…… 65 4.1 Preliminary test for parameters determination ……………………………………………... 65
4.1.1 Biomass Characterization and Fermentation of various Substrates ……………….… 65 4.1.2 Co-culture Ratio ……………………………………………………………………... 70 4.1.3 Range of Fermentation Biomass Loading Rate and Substrate Inhibition …………… 72 4.1.4 Range of Initial Ethanol Concentration ……………………………………………… 73 4.1.5 Range of Initial pH Value ……………………………………………………………. 74 4.1.6 Concentration of Alginate and Calcium Chloride …………………………………… 76
4.1.6.1 Concentration of Alginate and Beads Leakage ..………………………….… 76 4.1.6.2 Calcium Chloride Toxicity ………………………………………………….. 77
4.1.7 Organosolv Lignin toxicity ………………………………………………………….. 78 4.2 Free cell fermentation …………………………………………………………………….… 83
4.2.1 Benefit of co-culture fermentation …………………………………………………... 84 4.2.2 Impact of ethanol concentration on fermentation ……………………………………. 85 4.2.3 Substrate selectivity ………………………………………………………………….. 97 4.2.4 Impact of pH value on co-culture fermentation …..………………………………… 102 4.2.5 Interaction among factors on formation of end-products ……………..………….… 107 4.2.6 Free cell fermentation of untreated aspen powder …………………………………. 108
4.3 Immobilized cell fermentation …………………………………………………………….. 110 4.3.1 Benefit of immobilization ………………………………………………………..…. 110 4.3.2 Impact of immobilization on ethanol tolerance ………………………………….…. 111 4.3.3 Impact of immobilization on pH tolerance …………………………………………. 131 4.3.4 Impact of immobilization on substrate selectivity ………………………………….. 148 4.3.5 Immobilized cell co-culture fermentation of untreated and alkali treated
aspen powder ………………………………………………………………………. 150 4.3.5.1 Composition change and ethanol production ……………………………… 150 4.3.5.2 Preliminary test for increasing biomass loading rate for immobilized cell
Fermentation ….………………………………………………………….. 152 Chapter 5 Conclusions ..……………………………………………………….... 154 Bibliography …………………………………………………………………..… 157

vi
LIST OF TABLES
Table Page Table 2.1 Chemical composition of potential lignocellulosic biomass resources
11
Table 2.2 Hemicelluloses composition 16 Table 2.3 Summary of alkaline pretreatments of lignocellulosic biomass 28 Table 2.4 Summary of sulfuric acid pretreatments on lignocellulosic biomass
31
Table 2.5 Combination pretreatment used 33 Table 2.6 Performance of lignocelluosic biomass fermenting bacteria 45 Table 4.1 Effect of initial ethanol addition (0-4 g/L) and substrate types on ethanol production (g/L) at pH=9 for C. thermocellum mono-culture, C. thermolacticum mono-culture and co-culture fermentations. The ethanol and acetate productions are the average value of triplicates runs under each chosen condition. SD is the standard deviation of the replicates of each condition.
87
Table 4.2Effect of initial ethanol addition (0-4 g/L) and substrate types on acetate production (g/L) at pH=9 for C. thermocellum mono-culture, C. thermolacticum mono-culture and co-culture fermentations. The ethanol and acetate productions are the average value of triplicates runs under each chosen condition. SD is the standard deviation of the replicates of each condition.
88
Table 4.3 ANOVA table for ethanol production during free cell fermentation 108 Table 4.4 P value for comparison of ethanol production for immobilized cell fermentation and free cell fermentation. Variables include initial ethanol, immobilization and the interaction between these two.
113
Table 4.5 P value for comparison of acetate production between free cell fermentation and immobilized cell fermentation. Variables include initial ethanol, immobilization and the interaction between these two.
123
Table 4.6 Composition analysis for aspen wood before and after alkine pretreatment (9% NaOH,100ºC for 3 hours) and fermentation (at 4% initial ethanol level, pH=10, 57ºC for 10 days)
152

vii
LIST OF FIGURES
Figure Page Figure 2.1 Sucrose hydrolysis and ethanol formation 8 Figure 2.2 Lactose hydrolysis 8 Figure 2.3 Starch molecular structures 10 Figure 2.4 Starch hydrolysis and ethanol formation 10 Figure 2.5 Cellulose molecular structure 12 Figure 2.6 Cellulose crystalline arrays 13 Figure 2.7 The structures of lignin building blocks 14 Figure 2.8 Functional groups of lignin 15 Figure 2.9 Hydrolysis reactions of Trichoderma reesei 37 Figure 2.10 Structure of furfural and hydroxymethyl furfural 42 Figure 2.11 Bacteria xylose ulilization 46 Figure 2.12 Yeast xylose utilization 56 Figure 2.13 Ethanol Production Cost Comparison between SSCF and CBP 57 Figure 2.14 Immobilization of cells 60 Figure 4.1 Chemical compositions of aspen 67 Figure 4.2 Ethanol and acetate productions from C. thermolacticum (ATCC 43739) fermentation of various polysaccharides at 60ºC for 10 days
68
Figure 4.3 Ethanol and acetate productions from C. thermocellum (ATCC 27405) fermentation of various polysaccharides at 60ºC for 10 days
69
Figure 4.4 Ethanol and acetate productions from C. thermolacticum (ATCC 43739) fermentation of various sole carbon sources at 60ºC for 10 days
69
Figure 4.5 Ethanol and acetate productions from C. thermocellum (ATCC 27405) fermentation of various sole carbon sources at 60ºC for 10 days
70
Figure 4.6 Determination on the optimum synchronization effect of the C. thermolacticium and C. thermocellum co-culture composition on ethanol production efficiency
72
Figure 4.7 Effect of biomass loading rate on ethanol production efficiency 73 Figure 4.8 Effect of initial ethanol concentration on ethanol production efficiency
74
Figure 4.9 Ethanol and acetate yield from C. thermolacticum (ATCC 43739) fermentation at different pH value at 60ºC for 10 days
75
Figure 4.10 Effect of calcium chloride concentrations on fermentation production concentrations on cellobiose fermentation at pH=7 57ºC for 10 days
78
Figure 4.11 Effect of organosolv lignin on ethanol production during cellobiose fermentation at 57ºC pH=7 for 10 days
79
Figure 4.12 Effect of organosolv lignin on acetate production during cellobiose fermentation at 57ºC pH=7 for 10 days
80
Figure 4.13 Effect of organosolv lignin on ethanol production during micro crystal cellulose fermentation at 57ºC pH=7 for 10 days
80
Figure 4.14 Effect of organosolv lignin on acetate production during micro crystal cellulose fermentation at 57ºC pH=7 for 10 days
81
Figure 4.15 Effect of organosolv lignin on ethanol production during glucose fermentation at 57ºC pH=7 for 10 days
81
Figure 4.16 Effect of organosolv lignin on acetate production during glucose fermentation at 57ºC pH=7 for 10 days
82
Figure 4.17 Effect of organosolv lignin on ethanol production during xylose fermentation at 57ºC pH=7 for 10 days
82
4.18 Effect of organosolv lignin on ethanol production during xylose fermentation at 57ºC pH=7 for 10 days
83
Figure 4.19 Effect of pH on ethanol production at 4 g/L initial ethanol level for 89

viii
MCC fermentation at 57ºC for 10 days Figure 4.20 Effect of pH on ethanol production at 4 g/L initial ethanol level for cellobiose fermentation at 57ºC for 10 days
89
Figure 4.21 Effect of pH on ethanol production at 4 g/L initial ethanol level for xylose fermentation at 57ºC for 10 days
90
Figure 4.22 Effect of pH on ethanol production at 4 g/L initial ethanol level for glucose fermentation at 57ºC for 10 days
90
Figure 4.23 Effect initial ethanol concentrations on cellobiose fermentation at pH=9, 57ºC for 10 days
92
Figure 4.24 Effect initial ethanol concentrations on MCC fermentation at pH=9, 57ºC for 10 days
92
Figure 4.25 Effect initial ethanol concentrations on glucose fermentation at pH=9, 57ºC for 10 days
93
Figure 4.26 Effect initial ethanol concentrations on xylose fermentation at pH=9, 57ºC for 10 days
93
Figure 4.27 Relationship between optimum growth temperature and initial ethanol concentration for glucose fermentation at pH=9 for 10 days
95
Figure 4.28 Relationship between optimum growth temperature and initial ethanol concentration for cellobiose fermentation at pH=9 for 10 days
96
Figure 4.29 Relationship between optimum growth temperature and initial ethanol concentration for MCC fermentation at pH=9 for 10 days
96
Figure 4.30 Relationship between optimum growth temperature and initial ethanol concentration for xylose fermentation at pH=9 for 10 days
97
Figure 4.31 Effect of pH on ethanol production at 4 g/L initial ethanol level for co-culture fermentation on various substrates at 57ºC for 10 days
99
Figure 4.32 Effect of pH on acetate production at 4 g/L initial ethanol level for co-culture fermentation on various substrates at 57ºC for 10 days
99
Figure 4.33 Effect of pH on acetate production at 0 g/L initial ethanol level for xylose fermentation at 57ºC for 10 days
100
Figure 4.34 Effect of pH on ethanol production at 4 g/L initial ethanol level for C.thermolacticum fermentation on various substrates at 57ºC for 10 days
104
Figure 4.35 Effect of pH on acetate production at 4 g/L initial ethanol level for C. thermocellum fermentation on various substrates at 57ºC for 10 days
105
Figure 4.36 Effect of pH on acetate production at 4 g/L initial ethanol level for C. thermolacticum fermentation on various substrates at 57ºC for 10 days
106
Figure 4.37 pH effects on ethanol yield for aspen co-culture fermentation at 57ºC for 10 days with wood loading rate from 1% to 10%
109
Figure 4.38a Comparison between immobilized cell fermentation and free cell fermentation at various initial ethanol levels for glucose fermentation at pH = 7, 57ºC for 10 days
114
Figure4.38b Comparison between immobilized cell fermentation and free cell fermentation at various initial ethanol levels for glucose fermentation at pH = 8, 57ºC for 10 days
114
Figure 4.38c Comparison between immobilized cell fermentation and free cell fermentation at various initial ethanol levels for glucose fermentation at pH = 9, 57ºC for 10 days
115
Figure 4.38d Comparison between immobilized cell fermentation and free cell fermentation at various initial ethanol levels for glucose fermentation at pH = 10, 57ºC for 10 days
115
Figure 4.38e Comparison between immobilized cell fermentation and free cell fermentation at various initial ethanol levels for xylose at pH = 7, 57ºC for 10 days
116
Figure 4.38f Comparison between immobilized cell fermentation and free cell fermentation at various initial ethanol levels for xylose fermentation at pH = 8, 57ºC for 10 days
116
Figure 4.38g Comparison between immobilized cell fermentation and free cell fermentation at various initial ethanol levels for xylose at pH = 9, 57ºC for 10 days
117
Figure 4.38h Comparison between immobilized cell fermentation and free cell 117
ix
fermentation at various initial ethanol levels for xylose fermentation at pH = 10, 57ºC for 10 days Figure 4.38i Comparison between immobilized cell fermentation and free cell fermentation at various initial ethanol levels for cellobiose fermentation at pH = 7, 57ºC for 10 days
118
Figure 4.38j Comparison between immobilized cell fermentation and free cell fermentation at various initial ethanol levels for cellobiose fermentation at pH = 8, 57ºC for 10 days
118
Figure 4.38k Comparison between immobilized cell fermentation and free cell fermentation at various ethanol levels for cellobiose fermentation at pH = 9, 57ºC for 10 days
119
Figure 4.38l Comparison between immobilized cell fermentation and free cell fermentation at various ethanol levels for cellobiose fermentation at pH = 10, 57ºC for 10 days
119
Figure 4.38m Comparison between immobilized cell fermentation and free cell fermentation at various initial ethanol levels for MCC fermentation at pH = 7, 57ºC for 10 days
120
Figure 4.38n Comparison between immobilized cell fermentation and free cell fermentation at various initial ethanol levels for MCC fermentation at pH = 8, 57ºC for 10 days
120
Figure 4.38o Comparison between immobilized cell fermentation and free cell fermentation at various initial ethanol levels for MCC fermentation at pH = 9, 57ºC for 10 days
121
Figure 4.38p Comparison between immobilized cell fermentation and free cell fermentation at various initial ethanol levels for MCC fermentation at pH = 10, 57ºC for 10 days
121
Figure 4.39a Acetate production comparison between immobilized cell fermentation and free cell fermentation at various initial ethanol levels for glucose fermentation at pH = 7, 57ºC for 10 days
122
Figure 4.39b Acetate production comparison between immobilized cell fermentation and free cell fermentation at various initial ethanol levels for glucose fermentation at pH = 8, 57ºC for 10 days
124
Figure 4.39c Acetate production comparison between immobilized cell fermentation and free cell fermentation at various initial ethanol levels for glucose fermentation at pH = 9, 57ºC for 10 days
124
Figure 4.39d Acetate production comparison between immobilized cell fermentation and free cell fermentation at various initial ethanol levels for glucose fermentation at pH = 10, 57ºC for 10 days
125
Figure 4.39e Acetate production comparison between immobilized cell fermentation and free cell fermentation at various initial ethanol levels for xylose fermentation at pH = 7, 57ºC for 10 days
125
Figure 4.39f Acetate production comparison between immobilized cell fermentation and free cell fermentation at various initial ethanol levels for xylose fermentation at pH = 8, 57ºC for 10 days
126
Figure 4.39g Acetate production comparison between immobilized cell fermentation and free cell fermentation at various initial ethanol levels for xylose fermentation at pH = 9, 57ºC for 10 days
126
Figure 4.39h Acetate production comparison between immobilized cell fermentation and free cell fermentation at various initial ethanol levels for xylose fermentation at pH = 10, 57ºC for 10 days
127
Figure 4.39i Acetate production comparison between immobilized cell fermentation and free cell fermentation at various initial ethanol levels for cellobiose fermentation at pH = 7, 57ºC for 10 days
127
Figure 4.39j Acetate production comparison between immobilized cell fermentation and free cell fermentation at various initial ethanol levels for cellobiose fermentation at pH = 8, 57ºC for 10 days
128
Figure 4.39k Acetate production comparison between immobilized cell fermentation and free cell fermentation at various initial ethanol levels for cellobiose fermentation at pH = 9, 57ºC for 10 days
128

x
Figure 4.39l Acetate production comparison between immobilized cell fermentation and free cell fermentation at various initial ethanol levels for cellobiose fermentation at pH = 10, 57ºC for 10 days
129
Figure 4.39m Acetate production comparison between immobilized cell fermentation and free cell fermentation at various initial ethanol levels for MCC fermentation at pH = 7, 57ºC for 10 days
129
Figure 4.39n Acetate production comparison between immobilized cell fermentation and free cell fermentation at various initial ethanol levels for MCC fermentation at pH = 8, 57ºC for 10 days
130
Figure 4.39o Acetate production comparison between immobilized cell fermentation and free cell fermentation at various initial ethanol levels for MCC fermenation at pH = 9, 57ºC for 10 days
130
Figure 4.39p Acetate production comparison between immobilized cell fermentation and free cell fermentation at various initial ethanol levels for MCC fermenation at pH = 10, 57ºC for 10 days
131
Figure 4.40a Ethanol production comparison between immobilized cell fermentation and free cell fermentation at various pH for glucose fermentation at 0g/L initial ethanol level, 57ºC for 10 days
134
Figure 4.40b Ethanol production comparison between immobilized cell fermentation and free cell fermentation at various pH for glucose fermentation at 2g/L initial ethanol level, 57ºC for 10 days
134
Figure 4.40c Ethanol production comparison between immobilized cell fermentation and free cell fermentation at various pH for glucose fermentation at 4g/L initial ethanol level, 57ºC for 10 days
135
Figure 4.40d Ethanol production comparison between immobilized cell fermentation and free cell fermentation at various pH for xylose fermentation at 0g/L initial ethanol level, 57ºC for 10 days
135
Figure 4.40e Ethanol production comparison between immobilized cell fermentation and free cell fermentation at various pH for xylose fermentation at 2g/L initial ethanol level, 57ºC for 10 days
136
Figure 4.40f Ethanol production comparison between immobilized cell fermentation and free cell fermentation at various pH for xylose fermentation at 4g/L initial ethanol level, 57ºC for 10 days
136
Figure 4.40g Ethanol production comparison between immobilized cell fermentation and free cell fermentation at various pH for cellobiose fermentation at 0g/L initial ethanol level, 57ºC for 10 days
137
Figure 4.40h Ethanol production comparison between immobilized cell fermentation and free cell fermentation at various pH for cellobiose fermentation at 2g/L initial ethanol level, 57ºC for 10 days
137
Figure 4.40i Ethanol production comparison between immobilized cell fermentation and free cell fermentation at various pH for cellobiose fermentation at 4g/L initial ethanol level, 57ºC for 10 days
138
Figure 4.40j Ethanol production comparison between immobilized cell fermentation and free cell fermentation at various pH for MCC fermentation at 0g/L initial ethanol level, 57ºC for 10 days
138
Figure 4.40k Ethanol production comparison between immobilized cell fermentation and free cell fermentation at various pH for MCC fermentation at 2g/L initial ethanol level, 57ºC for 10 days
139
Figure 4.40l Ethanol production comparison between immobilized cell fermentation and free cell fermentation at various pH for MCC fermentation at 4g/L initial ethanol level, 57ºC for 10 days
139
Figure 4.41a Acetate production comparison between immobilized cell fermentation and free cell fermentation at various pH for glucose at 0g/L initial ethanol level, 57ºC for 10 days
145
Figure 4.41b Acetate production comparison between immobilized cell fermentation and free cell fermentation at various pH for glucose fermentation at 2g/L initial ethanol level, 57ºC for 10 days
146
Figure 4.41c Acetate production comparison between immobilized cell fermentation and free cell fermentation at various pH for glucose fermentation
146

xi
at 4g/L initial ethanol level, 57ºC for 10 days Figure 4.41d Acetate production comparison between immobilized cell fermentation and free cell fermentation for xylose at 0g/L initial ethanol level, 57ºC for 10 days
147
Figure 4.41e Acetate production comparison between immobilized cell fermentation and free cell fermentation at various pH for xylose fermentation at 2g/L initial ethanol level, 57ºC for 10 days
147
Figure 4.42 Ethanol production comparison between immobilized cell fermentation and free cell fermentation on various substrates under pH=9, at 4g/L initial ethanol level, 57ºC for 10 days
149
Figure 4.43 Accumulated ethanol production of continuous cellobiose fermentation (1% loading rate) process at pH=9, 57ºC for 10 days with 4 g/L initial ethanol concentration
153

1
Chapter 1
INTRODUCTION
1.1 Problem Statement
Affordable bio-fuel has become an important topic due to an imbalance between
supply and demand for existing energy sources as well as the problems associated
with recent fuel refinery processes (1). It is generally accepted that renewable
energy will be more sustainable and more reliable than current energy resources (2).
In the past century, the US and other countries have started to develop alternative
energy sources to support the world’s energy consumption needs and to decrease
environmental pressures (2, 3). However, one challenge of exploring bio-fuel
resources is to balance the conflict between the food crisis and the energy crisis since
most of the existing bio-fuel feed stocks are food-based. Lignocellulosic biomass
offers a great potential as a bio-fuel resource. This is mainly because
lignocellulosics are an abundant raw material and bypass the issue of utilizing food
for fuel production.
Consolidated bioprocessing (CBP) is a promising solution offering the potential for
higher efficiency and lower production cost compared to other current conversion
processes (4). Different than traditional separate hydrolysis and fermentation (SHF)
or newly developed simultaneous saccharification and co-fermentation (SSCF), the
CBP fermentation merges cellulase production, hydrolysis and fermentation all
together (5). This merging can decrease the contamination possibility during
transmission and reduce a large portion of capital cost (6). The other advantage of
2
CBP is that it inherits the capability of fermenting both pentose and hexose from
SSCF (7). However, as a relatively new technology, technical difficulties are
unavoidable, especially since during the CBP cellulase is generated inside the
reaction vessel, making this process more complex than simply adding enzymes.
Proper microbes with specific traits combined with suitable process modifications (8)
can help deal with the extreme conditions and inhibitors present in CBP fermentation.
Co-cultures have been widely studied (9). Although production of biofuels in
co-culture systems usually is higher than in their separate mono-cultures, the overall
ethanol production even in co-culture systems remains low. For wild strains, less
than 70% theoretical ethanol yield was produced per glucose equivalent (10), and
less than 66% was reported to be produced per xylose equivalent (11). In this study,
attempts were made to evaluate the potential advantages of integrating C.
themocellum and C. thermolacticum into a CBP fermentation process with respect to
ethanol and acetate formation, as compared to their mono-cultures. The ability of
this co-culture and their mono-cultures to saccharify major biomass polymers and
their fragments under a wide pH range (5-10) was examined. This innovative
co-culture containing C. themocellum and C. thermolacticum were selected because
of their remarkable de-polymerization ability for polysaccharides (12). Both
microbes can hydrolyze a wide range of saccharides and tolerate relatively high
temperatures up to 60 °C (13, 14). C. themocellum ATCC 27405 which contains
cellulosomes is proficient in converting both crystalline and amorphous cellulose
efficiently into ethanol, acetate and hydrogen (14). C. thermolacticum ATCC 43739
can produce a variety of de-polymerization enzymes but is especially apt in
degrading pentoses (13). Thus, integrating C. themocellum and C. thermolacticum

3
into the CBP fermentation can theoretically digest lignocellulosics directly into
bio-ethanol.
A secondary purpose of this research is the optimization of this co-culture
fermentation for ethanol production, and potentially reducing side reactions towards
unwanted products such as acetate. Although much research has been devoted to
investigating the effect of pH and ethanol concentrations during C. themocellum or C.
thermolacticum mono-culture fermentation processes as independent variables, less
attention has been paid to the interactions of these fermentation parameters in any of
these mono-culture fermentations. In addition, the influences of pH values and
ethanol concentration in previous studies are inconsistent (15, 16) requiring further
explorations. It is expected that the use of co-cultures influences these effects.
In addition, we explored the potential use of encapsulation to increase bio-ethanol
production with C. thermocellum and C. thermolacticum. Specifically, our project
compared the ethanol production of co-culture and mono-culture, non-encapsulated
and encapsulated strains in response to the pH change, the ethanol inhibition, and
their correlation. Ca-alginate encapsulation was applied to these microbes in this
project. The formed micro-capsules had a liquid core, in which C. themocellum or
C. thermolacticum cells were grown, surrounded by a spherical polymeric membrane.
It could be shown that the composite membrane of the capsule was able to protect the
sensitive microorganisms from the toxicity of pretreatment and fermentation (12).
Few studies have been applied to Clostridium sp. encapsulation for bio-ethanol
production. Thus, in this project, the encapsulation of C. thermocellum and C.
thermolacticum by calcium alginate, a mild matrix for living cells, will be studied to

4
prepare a high ethanol tolerance biocatalyst for the lignocellulosic biomass
fermentation. The calcium alginate is used because several successful fermentation
processes with alginate entrapment of Zymomonas mobilis (17-20), Aspergillus niger
(19) and Saccharomyces cerevisiae (20, 21) have been described. By testing the
performance of encapsulated co-culture, the immobilized co-culture fermentation
process for aspen powder was optimized.
1.2 Objectives
The overall objective of this project is to meet the demand for an inexpensive and
highly efficient integrated anaerobic Clostrdium sp. fermentation process to produce
ethanol as an energy source directly from insoluble lignocellulosic substrate (aspen).
To complete the overall objective, the following specific aims focus on several
aspects of the CBP fermentation process for Clostridium sp.
1) Test the hypothesis that the C. themocellum/C. thermolacticum co-culture
provides a higher ethanol yield or a higher sugar to end-products conversion rate
than their mono-cultures in CBP fermentation at extreme pH (5-10) and varying
ethanol concentrations (0-4%).
2) Assess whether or not the application of encapsulation results in the improvement
of ethanol tolerance, pH tolerance, sugar to end-products conversion rate, or
ethanol production in the C. themocellum and C. thermolacticum CBP
fermentation.
3) Optimize the CBP fermentation parameter (pH and wood/medium ratio) for
untreated and pretreated aspen, utilizing the conditions that provide a higher
ethanol yield in aim 1 and aim 2.
5
1.3 Significance
This work focused on several aspects of the CBP fermentation process by
Clostridium sp. with the goal to meet a demand for an inexpensive and effective
second generation bio-ethanol production. The main challenge of this fermentation
process is the efficiency of ethanol production. We assessed, if an encapsulation and
co-culture strategy is efficient in improving the Clostridium sp. CBP fermentation by
quantifying the ethanol yield in this study on various substrates. By understanding
the effect of the encapsulation and co-culture strategy, the integrated anaerobic
microbial CBP fermentation for untreated or pretreated aspen was optimized. The
condition for maximum ethanol production was defined.
The observations obtained from this study could provide practical information for
applying encapsulation and/or a co-culture method for cellulolytic and thermophilic
bacterium for a one-step bio-ethanol production.

6
Chapter 2
LITERATURE SURVEY
2.1 Bio-ethanol Potential
The liquid energy carriers produced biologically are considered to be promising
alternative energy carries because of the well established storage, logistics, and
applications methods (22). Available liquid energy carriers are mainly ethanol,
butanol, mixture of ethanol, butanol and acetone (ABE), as well as biodiesel.
Among all of these energy carriers, ethanol is beneficial in many aspects. First of
all, the production of bio-ethanol is the most established process as compared to the
processes used for other energy carriers (23). Especially, ethanol production from
agronomic plants is well established. 12.5 billion liters of ethanol are produced in
Brazil every year from sucrose (24). Almost one fourth of the cars in Brazil run on
the alternative fuel called gasohol, which is the mixture of ethanol and petroleum
(25). In the US, corn is the major substrate for bio-ethanol production. Every year,
about 5 billion liters of ethanol are produced in the US from corn kernels (24).
Furthermore, bio-ethanol is a cleaner fuel than fossil fuel. Burning ethanol made
from plants is estimated to reduce greenhouse gas emissions by 86% (26). In
addition, ethanol, as a petroleum gasoline additive, is safer than the methyl tertiary
butyl ether (MTBE) which is currently used for cleaner combustion (27). MTBE is
reported to be toxic and has a potential to contaminate ground water (27).
However, for bio-ethanol production, the transport cost per energy unit is still higher
than for petroleum. Moreover, water needed for feeding the feedstock, as well as

7
the fluctuations of feedstock availability due to weather conditions all influence the
cost of bio-ethanol.
2.2 Feedstock
An appropriate, cost effective and reliable feedstock supply, an efficient process, and
value-added by-products are all necessary to make this bio-fuel sustainable.
Currently, the bio-ethanol is mainly produced from simple structure substrates
including sugar (sucrose) and starch from agronomic plants like sugarcane and corn.
The goal is to expand feedstock sources to lignocellulosic biomass with much more
complicated structures (28).
2.2.1 Sugars
Most microorganisms possess the capacity to ferment simple hexoses (glucose,
fructose). Thus, biomass composed of high concentrations of hexose or hexose
precursors are easy to be employed for fermentation after hydrolysis, or even
pretreatments. Today, the most widely used sugar for commercial ethanol
production is sucrose in sugarcane, sugar beet, fruits, or sweet sorghum (29).
Among these feedstocks, sugarcane juice, which is extracted from sugarcane fiber, is
considered to be the main source of sucrose. During extraction, blackstrap
molasses, containing 35 – 40% sucrose and 15 – 20% invert sugars (glucose and
fructose), is produced as a by-product (30). Then the molasses can also be
fermented to produce ethanol (Figure 2.1).
Lactose, a milk sugar existing in milk and whey permeates, is the other potential
sugar for bio-ethanol production (31). This raw material has been used for

8
bio-energy production. This is because the milk permeate is low in protein (0.5%)
but high in lactose (5%) which makes it not suitable for animal feed (32). Lactose
fermentation has been studied using Clostridium thermolacticum. Acetate is the
major product in this process. In addition, ethanol, hydrogen and carbon dioxide
are produced as by-products (31). (Figure 2.2)
Hydrolysis of sucrose
Sucrose Glucose Fructose Ethanol formation
Glucose
Fructose Figure 2.1 Sucrose hydrolysis and ethanol formation
Lactose Galactose Glucose
Figure 2.2 Lactose hydrolysis
2.2.2 Starch
C2H5OH + 2CO2
C2H5OH + 2CO2
H2O Lactase

9
At present, the vast majority of industrial ethanol and almost all bio-ethanol is made
from grain (wheat, corn, barley). Starch, the key sugar component stored in the
grain, can be used for ethanol production. Starch molecules are long chains of
α-D-glucose monomers (Figure 2.3). Slightly more complex than the sugar
fermentation process, starch needs to be broken down into glucose first through
hydrolysis with amylase recovered from fungi, or diastase and maltase from
sprouting grain (Figure 2.4). Then fermentation enzymes will ferment the
fermentable sugars into ethanol and carbon dioxide. In the grain fermentation,
distillers grain which is a high protein cattle feed including fiber, protein and ash is
also produced (33).
These cheap starchy crop resources vary depending on the geographic locations.
For example, cassava grows mainly in Africa. Potato is a typical European product
and sweet potato is mainly an Asian crop. For the US, corn and wheat account for
the majority of the cereal grains. In 1990, about 200 million tons of corn was
produced in America, and 4% of them were used in ethanol production (34).
However, both sugars and starchy materials are relatively expensive for bio-fuel
production, since these materials are also important food ingredients.
Amylose

10
Amylopectin
Figure 2.3 Starch molecular structures
Amylase hydrolysis
(C6H10O5)n + nH2O n C6H12O6
Diastase hydrolysis
2(C6H10O5)n + nH2O n(C12H22O11) Starch diastase Maltose
C12H22O11 + H2O 2C6H12O6 Maltase
Ethanol formation
C6H12O6 C2H5OH + 2CO2 Figure 2.4 Starch hydrolysis and ethanol formation
2.2.3 Lignocellulosic biomass
The issue for starch and sucrose based ethanol is the high cost of using food crops, as
well as some instability due to the competition between food and energy production
(35). It is estimated, that this competition has the potential to increase food prices
by 23-25% before 2013 (36). Thus, ethanol production from lignocellulosic
amylase

11
biomass has become more attractive. Recent reports estimated that after
overcoming the technical barriers, 270 billion gallon of ethanol will be produced
using 2.45 billion metric tons of biomass (37). This estimated ethanol production is
twice the current US gasoline consumption (37).
2.2.3.1 Lignocellulosic biomass structure and composition
The lignocellulosic biomass have the potential to be used in large-scale bio-ethanol
production. A fundamental understanding of the cell wall structure is important to
eliminate the cell wall’s natural resistance to degradation through chemicals and
enzymes. The utilization of lignocellulosic biomass is mainly depending on the
composition of the biomass. Compositions of the available energy biomass
resource are listed in Table 2.1 (27, 38). Biomass with high carbohydrate content
and low lignin content is preferred.
Biomass Cellulose % Hemicellulose % Lignin %
Corn cob 45 35 15 Grasses 25-40 35-50 10-30 Wheat straw 30 50 15 Leaves 15-20 80-95 0 Cotton seed hairs 80-95 5-20 0 Coastal Bermuda grass 25 35.7 6.4 Switchgrass 45 31.4 12 Cotton Stems 37.9 20.4 24 Spruce 42 6.7 26 Aspen 47 23 23 Bagasse 44 27 19 Rice Straw 39 23 20 Corn stover 37.5 22.4 17.6 Pine wood 46.4 8.8 29.4 Poplar 49.9 17.4 18.1 Water hyacinth 33.4 19.5 9.27 Table 2.1 Chemical composition of potential lignocellulosic biomass resources
2.2.3.1.1 Cellulose

12
Cellulose, hemicellulose and lignin are the main components of plant cell walls.
Cellulose is a linear high molecular weight polymer composed of β-D-glucopyranose
units which are linked by 1-O-4 glycosidic linkages (39) (Figure 2.5). It provides
structural support and chemical resistance for the plant. Considering the uniform
hydrolysable glucose building blocks, the cellulose molecule would be the best
carbohydrate source for the fermentation process. Major functional groups,
hydroxyl groups are able to form intermolecular and intramolecular hydrogen bonds.
Intermolecular linkages which form between different molecules are responsible for
the formation of microfibril structures and highly ordered crystalline areas (Figure
2.6) (39). Cellulose in plant materials consists of both, crystalline and amorphous
areas. Because of the high energy of a large amount of hydrogen bonds, cellulose
crystalline areas are hard to degrade with enzymes or chemicals. Under normal
conditions, due to the existence of hydrogen bonds, the cellulose is relatively
insoluble. An efficient cellulose degradation technique, including effective
enzymes, high temperatures, concentrated acid or alkaline, is necessary for both
amorphous and crystalline cellulose in the conversion process.
β-D-glucopyranose units 1-O-4 glycosidic linkages
Figure 2.5 Cellulose molecular structure

13
Figure 2.6 Cellulose crystalline arrays
2.2.3.1.2 Lignin
As the second most abundant material in the plant cell wall, lignin provides
additional strength and protection against fungi and insect attack (40). The high
molecular weight (in excess of 10,000 Da) phenylpropan structure of lignin leads to
high insolubility in most solvents. Lignin significantly adds to the rigidity and
moisture resistance of the biomass (41). Furthermore, the existence of the lignin
has been considered as an inhibitor for cellulase, due to the non-productive binding
of lignin and cellulase depending on the lignin types (42). As a result, chemicals
like surfactants (43), MgSO4, and CaCl2 (44), and exogenous proteins like bovine
serum albumin (BSA) (45) are added prior to enzyme or microbe loading to reduce
the reaction between lignin and cellulase. In addition, many pretreatment methods
have been developed to diminish the obstacle of lignin. Minimizing the effect of
Intra-chain hydrogen bond
Inter-chain hydrogen bond

14
lignin inhibition depends on the source of lignocellulosic biomass, since lignin
within the lignocellulosic materials is not uniform and varies in different plants and
even in different locations of the plant. For example, in the middle lamella and
primary cell wall, lignin content is higher than in the secondary cell wall (39).
There are three monolignol building blocks for lignin: p-coumaryl alcohol, coniferyl
alcohol, and sinapyl alcohol (39) (Figure 2.7). Guaiacyl lignin is commonly found
in softwood while a mixture of guaiacyl and syringyl together with small amounts of
p-hydroxyphenyl are found in hardwood. For grass or non-wood plants, all three
units are abundant (39).
p-Coumaryl alcohol Coniferyl alcohol Sinapyl alcohol
Figure 2.7 The structures of lignin building blocks
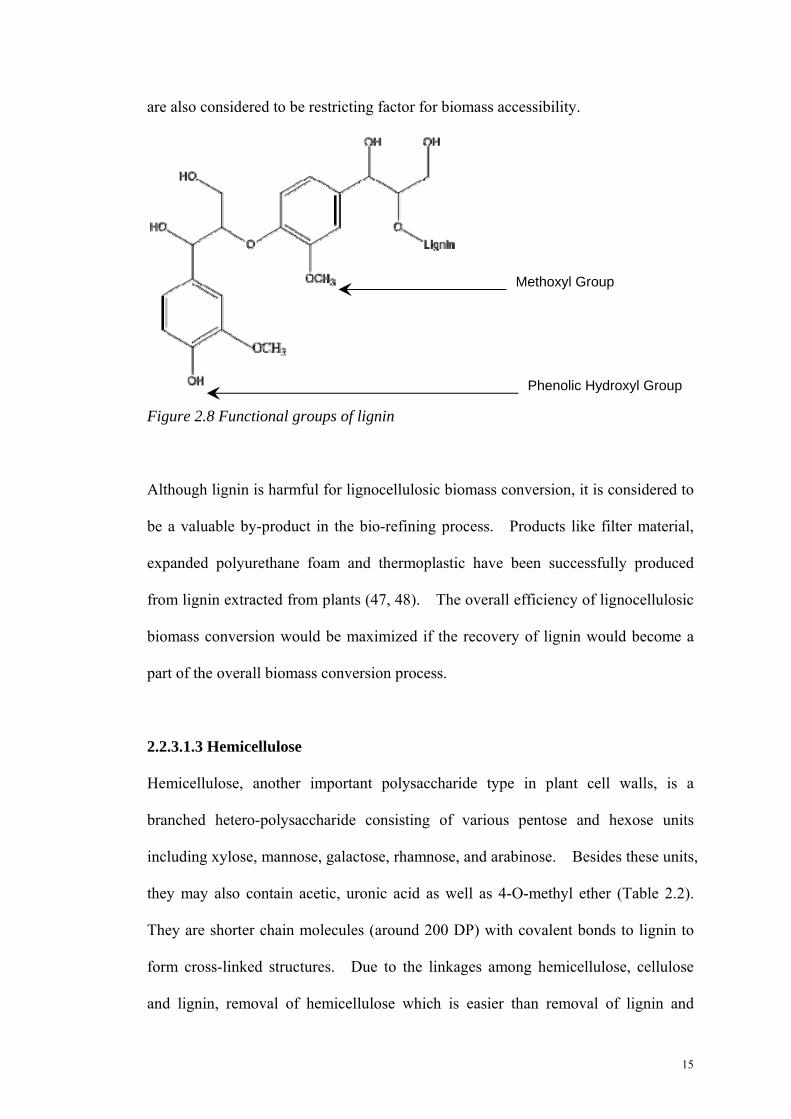
Functional groups in lignin including methoxyl groups, phenolic hydroxyl groups,
benzyl hydroxyl group, carbonyl groups and small amount of terminal aldehyde
groups are the other factors that will affect the degradation of lignin. Also the
hydroxyl and methoxyl groups in lignin precursors will interact with cellulose fibrils
(46) (Figure 2.8). The lignin carbohydrate complexes formed by the interactions
15
are also considered to be restricting factor for biomass accessibility.
Figure 2.8 Functional groups of lignin
Although lignin is harmful for lignocellulosic biomass conversion, it is considered to
be a valuable by-product in the bio-refining process. Products like filter material,
expanded polyurethane foam and thermoplastic have been successfully produced
from lignin extracted from plants (47, 48). The overall efficiency of lignocellulosic
biomass conversion would be maximized if the recovery of lignin would become a
part of the overall biomass conversion process.
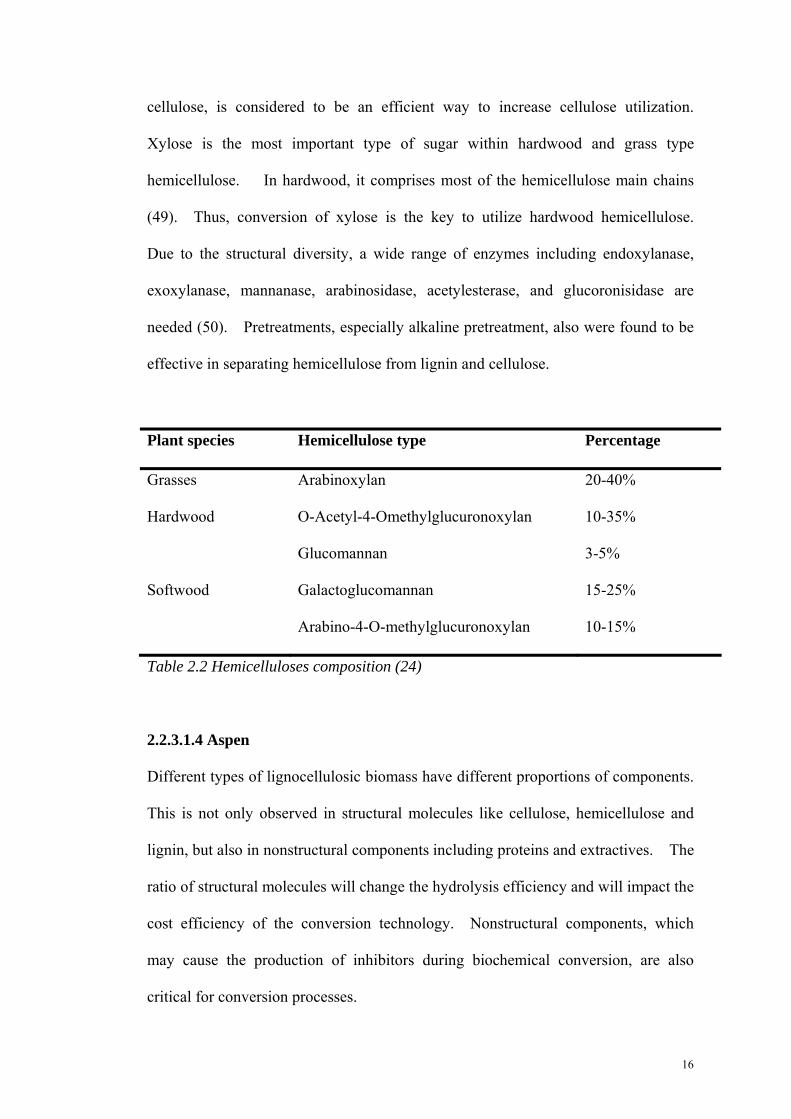
2.2.3.1.3 Hemicellulose
Hemicellulose, another important polysaccharide type in plant cell walls, is a
branched hetero-polysaccharide consisting of various pentose and hexose units
including xylose, mannose, galactose, rhamnose, and arabinose. Besides these units,
they may also contain acetic, uronic acid as well as 4-O-methyl ether (Table 2.2).
They are shorter chain molecules (around 200 DP) with covalent bonds to lignin to
form cross-linked structures. Due to the linkages among hemicellulose, cellulose
and lignin, removal of hemicellulose which is easier than removal of lignin and
Methoxyl Group
Phenolic Hydroxyl Group
16
cellulose, is considered to be an efficient way to increase cellulose utilization.
Xylose is the most important type of sugar within hardwood and grass type
hemicellulose. In hardwood, it comprises most of the hemicellulose main chains
(49). Thus, conversion of xylose is the key to utilize hardwood hemicellulose.
Due to the structural diversity, a wide range of enzymes including endoxylanase,
exoxylanase, mannanase, arabinosidase, acetylesterase, and glucoronisidase are
needed (50). Pretreatments, especially alkaline pretreatment, also were found to be
effective in separating hemicellulose from lignin and cellulose.
Plant species Hemicellulose type Percentage
Grasses Arabinoxylan 20-40%
Hardwood O-Acetyl-4-Omethylglucuronoxylan
Glucomannan
10-35%
3-5%
Softwood Galactoglucomannan
Arabino-4-O-methylglucuronoxylan
15-25%
10-15%
Table 2.2 Hemicelluloses composition (24)
2.2.3.1.4 Aspen
Different types of lignocellulosic biomass have different proportions of components.
This is not only observed in structural molecules like cellulose, hemicellulose and
lignin, but also in nonstructural components including proteins and extractives. The
ratio of structural molecules will change the hydrolysis efficiency and will impact the
cost efficiency of the conversion technology. Nonstructural components, which
may cause the production of inhibitors during biochemical conversion, are also
critical for conversion processes.

17
Aspen, a hardwood tree in the Salicaceae (Willow) family, is well understood in its
structure and chemical composition because it has been widely used in paper
industry as well as in wood industry as raw material of fiber, lumber, cut stock,
particleboard, and plywood. As a fast growing species, aspen covers over 5 million
acres in Minnesota, which is about 1/3 of the commercial forest land in the US (51,
52). However, this wide application of aspen leads to the formation of large
amounts of cutting waste, sawdust, under-utilized of remains. As large amount of
aspen waste saw dusts are available from industries, more and more researchers in
the bio-renewable energy industry have shown interest in this material.
2.3 Pretreatments techniques
As mentioned above conversion of lignocellulosic materials into ethanol has
considerable limitations because of their physical and chemical properties. Plant
cell walls have a natural resistance to chemical, physical and enzymatic degradations.
Lignin, which is the second most abundant natural polymer and currently not directly
used in ethanol production, is partially linked to the polysaccharides in the cell walls
(53-56). In addition, main component - cellulose will form crystals which are
barriers for complete sugar conversion for specific microbes (55). Therefore, an
efficient pretreatment process altering the lignocellulosics structural complex is
necessary. Possible alteration includes the removal or modification of the lignin,
degrade or removal of the hemicellulose, decrystallization of the cellulose and
increase of the accessible surface area (57, 58). The goal is to increase the
accessibility for enzymes or microbes without undesirable fractionation of
carbohydrates or formation of fermentation inhibitors, and consequently

18
improvement of the efficiency of polysaccharides degradation as well as the
production of ethanol and other value added co-products during biomass conversion.
An ideal pretreatment is performed with minimum cost and energy demand (6).
Pretreatment processes were invented as early as 1932 (59). Physical, chemical,
and biological methods are the major current pretreatment processes (1).
Combination methods which utilize at least two of these methods above to increase
pretreatment effectiveness have also been developed (59). In this section,
promising cost-efficient pretreatment methods are reviewed, followed by a brief
discussion of the pros and cons of each technology with the aim of discussing ways
to integrate the pretreatment process with consolidate bioprocessing (CBP) for
bio-ethanol production.
2.3.1 Physical pretreatment
Physical pretreatments are methods without addition of chemicals or
micro-organisms. They use external forces to reduce the lignocellulosic materials
into fine particles in order to increase the surface area of the materials. According
to the forces used, the physical pretreatment can be further divided into two
sub-catalogs: mechanical (dry, wet, vibratory ball milling) (60) and non-mechanical
method (steam explosion, irradiation and pyrolysis) (2).
2.3.1.1 Mechanical pretreatment
Mechanical pretreatments use shearing force to reduce biomass’ particle size, change
the lignocellulose structure, and reduce degree of polymerization and crystallinity of
cellulose (2). Depending on the final size of the material, the mechanical

19
pretreatment consists of milling, grinding or chipping. Chipping leads to 10 to 30
mm particles, and milling and grinding lead to 0.2 to 2 mm (27). Milling includes
ball milling, two roll milling, hammer milling, compression milling agitation bead
milling, pan milling, fluid energy milling, and colloid milling (60, 61). For aspen,
vibratory ball milling is reported to be a more effective method as compared to
ordinary ball milling (60). However, according to the research performed by
Cadoche et al, the energy input to reduce the biomass to fine particle is higher than
the theoretical energy content held in biomass, which makes the milling not
economical for most lignocellulosic biomass, especially for high moisture biomass
(62-64). Furthermore, these methods are species selective. Improper application of
mechanical pretreatment will lead to carbohydrate losses, in which case the final
fermentable sugars and ethanol yield will be reduced (65). Therefore, mechanical
pretreatment is considered to be impractical to be applied exclusively. Combination
of mechanical pretreatment and chemical size-reduction is commonly used to make
the pretreatment more cost-efficient (66).
Extrusion, which utilizes heating, mixing and shearing to increase accessibility of the
materials, is a novel promising pretreatment technology. Both physical and
chemical modifications occur as the lignocellulosic biomass passes through the
extruder (67). High efficiency makes this pretreatment method appealing (67).
2.3.1.2 Non-mechanical method
Irradiation pretreatment can be performed by Gamma-ray, microwave, ultrasound,
pulsed electrical filed, UV and electron-beam. Irradiation will cause the disruption
of beta-1,4-glycosidic bonds and cellulose crystalline structures (2). In addition, the

20
high energy of these radiations will lead to the formation of free radicals, which leads
to a further degradation of the lignocellulosic materials (68). This method is widely
used in waste water sludge pertreatment (69, 70). For the application for
lignocellulosic biomass, including rice straw, bagasse, sawdust, chaff, corn stalk,
peanut hust, and oil palm empty fruit bunch, was studied in pervious experiments (68)
by using ultrasonic irradiations. Dramatic enhancements of the enzymatic
hydrolysis efficiency were achieved (71, 72). Unfortunately, irradiation
pretreatments are reported to consume high levels of energy and require long process
time with expensive high quality equipment. Irradiation pretreatment methods by
themselves are currently limited to laboratory scale, and not considered as a feasible
solution for industrial applications.
Steam explosion is exposing biomass to steam under high pressure and temperature
followed by a decompression at the end (38). Liquid hot water (LHW) pretreatment
(co-current, counter-current, and flow through) is a pretreatment similar to steam
explosion, except that, in LHW pretreatment, instead of steam, biomass is merged
into hot water with certain pressure and temperature (6). Both these processes are
able to cleave the acetyl groups and uronic acid groups from hemicellulose and
consequentially acidify the medium. Furthermore, water at high temperature acts as
acid (73). As a result, acidic condition will cause partially hydrolysis of
hemicellulose and amorphous cellulose to oligosaccharides and to fermentable sugars,
also resulting in a more accessible material for the following hydrolysis or
fermentation steps (61). Moreover, for steam explosion, the lignin structure is
partially modified which also leads to higher digestibility of the biomass (74). In
addition, the shear forces caused by expansion contribute to the structural

21
modification (75). Both mechanisms are similar to acid pretreatment. However,
the steam explosion is able to offer higher fermentable sugar concentrations due to
the lower water content (60). There are no chemicals added in both methods. In
addition, size reduction is not required for lignocellulosic biomass since breakage of
particles will occur during pretreatments (6, 6, 73, 73), these methods are more
economic feasible in lignocellulosic conversion application. Steam explosion has
been applied on aspen in pervious papers. The total reducing sugars yield after
hydrolysis is increased over seven times with the pretreatment as compared to non
treated aspen (76).
LHW was applied on yellow poplar wood sawdust with and without pH control (77).
The pretreatment proved to involve the partial conversion of cellulose and
hemicellulose into oligosaccharides and monosaccharides. Nevertheless, during
steam explosion and LHW, high temperature is reported to increase the lattice
structure of the cellulose, and consequentially increase the cellulose crystalline (78,
79). In addition, higher pretreatment temperature also leads to increased material
solubility adding to the pretreatment yield loss (77). High severities also causes the
production of various fermentation inhibitors, includes furfural,
5-hydroxymethylfurfural (5-HMF), phenolic compounds, and aliphatic acid, (6, 41),
making this method not suitable for pretreatment with CBP. Monitoring and
controlling the pH is considered to be an efficient improvement for LHW
pretreatment (77). With controlled pH, cellulose solubility, and formation of HMF,
levulinic and formic acid are minimized (77). As a result, the pretreatment yield
loss will be minimized.

22
2.3.2 Biological pretreatment
Because of the environmental issues, more and more studies turn to biological
pretreatment methods, which use fungi, bacteria or their enzymes. Fungi are
applied as delignification agent to digest or change the lignin structure, and
hydrolyze the hemicellulose (27). As a result, enzymes used for the hydrolysis
process are able to approach polysaccharides such as cellulose and other
hemicelluloses much easier. In the present literature, various species of brown rot
fungi, white rot fungi, and soft rot fungi have been studies and summarized (27, 80).
White rot fungi only attacks lignin, but brown rot and soft rot fungi mainly attack
cellulose while slightly modifying the lignin structure (1). Among these species,
white rot fungi are more commonly used in pretreatment since they produce
lignin-degrading enzymes including laccases and peroxidases (81). Pleurotus
ostreatus is reported to be able to convert over 35% of wheat straw cellulose into
reducing sugars in five weeks (82). Stereum hirsutum was found to be very
efficient in pretreated Pinus densiflora, a type of softwood (83). Other white rot
fungi like Cyathus stercolerus, Phanerochaete chrysosporium, Phanerochaete
sordida and Pycnoporus cinarbarinus were also tested on several substrates for their
delignification efficiency (81).
Researchers agree that there are significant advantages to the biological pretreatment
methods, especially since these procedures are completely environmentally friendly
and require low energy input (67). However, the drawback of these methods
outweighs their advantages. Almost all those fungi need more than one week to
react with biomass. In addition, lignin degradation of white rot fungi requires a
carbon source, mainly cellulose and hemicelluloses, since it is a co-oxidative process.

23
Thus, while reacting with lignin, these fungi will reduce cellulose and hemicelluloses
concentration in biomass, thereby decreasing the yield of fermentable sugars (84).
As a result, although plenty of experiments have been done at lab-scale, none of the
biological pretreatments have been applied to industrial-scale production (60).
Thus these methods still need to be improved before they can be used for large-scale
production. Development of genetically modified strains with high lignin
degradation capacity and high cellulase activity are necessary (60).
2.3.3 Chemical pretreatment
Chemical pretreatments have been studied dated back to the early 1900s and several
reports have been published since 1980s comparing response of enzymatic
hydrolysis after different chemical pretreatment methods. Different than physical
methods, chemical pretreatments are mainly used for modifying the lignin in the
biomass, removing hemicellulose, and to change cellulose polymerization as well as
cellulose crystalline structure (85). Acids, alkali, salts, organic solvents as well as
oxidizing agents are all considered to be effective pretreatment agents (58).
2.3.3.1 Alkali Pretreatment
Alkali and acid pretreatments are very commonly used methods. During this alkali
pretreatment, biomass is soaked in the dilute alkali solution (0.5-2%) and treated for
varying periods of time temperature. Neutralization and removal of lignin
fragments and other inhibitors is usually involved at the end of the pretreatment.
Generally alkali conditions are less severe than other pretreatments and prevent
lignin condensation reactions. Due to the mild conditions, alkali pretreatments
usually require longer pretreatment time, pressure or addition of oxygen which will

24
facilitate some delignification (1, 86). This milder condition allows alkali
pretreatments to remove some lignin fraction without leading to severe carbohydrate
lose or inhibitor formations (79). Under alkali condition, peeling reactions, which
start from the reducing end-group of the polysaccharides, will happen and will
reduce the overall sugar yield. At high temperature, random chain cleavage will
break some of the 1-4-β-glycosidic bonds between glucose building blocks to lower
the degree of polymerization and the crystallization of cellulose (87). In this
process some lignin and hemicellulose is removed. Ether linkages between
carbohydrates and lignin are deconstructed by forming intermediate epoxide
structure. This intermediate structure allows the nucleophilic substitution (88).
In addition to the cleavage of ether bonds between carbohydrates and lignin, alkaline
can cause the cleavage of some ether bonds in lignin, which results in lignin
fragmentation (89). Ester saponification forming carboxyl and hydroxyl groups is
involved in hemicellulose, and between lignin and carbohydrates (89). The pore
size of the materials, the swelling capacity and surface area are increased (89), so
that the enzymes or microbes can penetrate easier and digest the cellulose structure
(61). Furthermore, alkali will remove the acetyl and uronic acid groups from
hemicellulose to enhance the accessibility of the enzymes (90). NaOH (91-93),
Na2CO3 (94), Ca(OH)2 (lime) (90, 95-98), KOH (87), NH4OH (99) and aqueous
ammonia (87, 100-102) were used to hydrolyze wheat straw (103), spruce wood (92),
sugarcane, cassava, peanuts wastes (94), bagasse (90), switchgrass (102, 104),
(95)corn cob (91), corn stover (96, 97), corn husk (105) and municipal solid waste (95)
(Table 2.3).

25
2.3.3.2 NaOH pretreatment and Lime pretreatment
NaOH is the most commonly used chemical among all these alkaline pretreatment
agents (1). The major reaction involved in these two pretreatments is the
intermolecular ester bonds saponification. Hemicellulose is dissolved, and cellulose
II is formed which will lead to extended swelling of the native cellulose structure and
increase of the internal surface area (61). In addition, lignin structure, cellulose
crystallinity, acetyl groups on hemicellulose, and linkage between lignin and
carbohydrates are also disrupted (58). In this case, the biomass will become more
accessible for the following hydrolysis steps. Besides NaOH, Ca(OH)2 (Lime)
pretreatment is also widely studied due to its low unit cost, safe handling and easy
recovery using CO2 (6, 87, 106). However, the equipment scaling issue makes the
commercial operation of lime pretreatment challenging (66).
2.3.3.3 Ammonia pretreatment
Ammonia will lead to a cellulose structure change from cellulose I to III (61).
Ammonilysis of esters, acetals, lactone groups also hemicellulose removal, cellulose
decrystallization and delignification will occur (61). Three techniques are involved
in using ammonia: soaking in aqueous ammonia (SAA), ammonia recycle
percolation (ARP), and ammonia fiber explosion-method (AFEX).
ARP and SAA are pure chemical pretreatment. ARP is using aqueous ammonia
(5-15%), but instead of soaking, it is performed using a flow-through reactor packed
with biomass called percolation at high temperature (80-180ºC) (107). Low
pressure is applied to the system to prevent evaporation (108). During this
pretreatment, the structure swelling and delignification are achieved by high

26
temperature. Ammoniolysis reactions result in delignification, with carbohydrates
left behind. Upon finishing the reaction, the solids are flashed to atmospheric
pressure, then washed and filtered to separate the carbohydrates. The liquid is
collected for ammonia recycling, lignin and remaining carbohydrates separations
(107). As a result, ARP is able to separate the biomass into three major components
including cellulose, pentosans or pentoses, and lignin (109). For SAA, biomass is
soaked with aqueous ammonia at low temperatures to maximize the delignification
and minimize the carbohydrate losses (110). Other than SRP, the SAA reduces the
liquid loading which reduces the energy cost of this process (109). AFEX is
considered to be a combination of chemical pretreatment and physical pretreatment
which will be discussed in the following section.
However, during the alkali pretreatments, the formation or incorporation of
irrecoverable salts leads to sever issues. The removal and lack of recyclability of
these salts limits the used of this method (6). In addition, the efficiency of alkali
pretreatment method depends on the biomass lignin content. It is proved to be more
efficient in low-lignin material pretreatments like hardwood and agricultural residues
than in high-lignin materials like softwood with lignin content over 26% (111).
Yield loss is another issue that hinders the acceptance of alkali pretreatment.
During most alkali pretreatments, hemicellulose is dissolved within alkali solutions,
and the recovery of the hemicellulose is expensive (112).

27
Ref. Feedstock Chemical Time TempºC
Increase bioconversion
Effect
(96) Corn stover 0.5 g Ca(OH)2/g raw biomass
4 weeks 55 overall yields of glucose and xylose were 93.2% and 79.5% at 15 FPU/g cellulase
Glucan (91.3%) and xylan (51.8%) were converted to glucose and xylose respectively. Of the initial lignin, 87.5% was maximally removed
(87) Sugar Cane bagasse
NaOH, NH3 (aqueous), NaOH +NH3, Ca(OH)2, and Ca(OH)2. + Na2CO3
18h 20 Enhanced the enzymatic digestibility from 20 to 72%
(*Combine with steam explosion at 200C, 6.9 MPa, and 5 min)
(100) Corn cobs/stover mixture (CCSM)
10wt% ammonia
15-60 mins
170 The ethanol yield reached 83% by SSF
Delignification of 74-80%, 50-56% of the total hemicellulose but <8% of the total glucan was solubilized
(100) switchgrass 10wt% ammonia
30-60 mins
170 The level of ethanol yield reached 84% by SSF
Delignification of 71-84%, 50-56% of the total hemicellulose. 10% of the total glucan was solubilized
(97) Corn stover 0.075 g Ca(OH)2/g raw biomass
4 hours 120 Polysaccharide conversions approaching 100%.
Loses 32% of the lignin.
(101) corn cobs/stover mixture (CCSM) and switchgrass
0.28 g H2O2/g biomass+10 wt% ammonia
90 mins 170 Digestibility of CCSM was 95%. 3-4 times higher than untreated one. and 93%,
Delignification was 94-99% (101)
(101) hybrid poplar 0.28 g H2O2/g biomass+10 wt% ammonia
90 mins 170 Digestibility of switchgrass was 93%
yielding 50% hemicellulose removal and80% delignification
(105) Bagasse ammonia water (25-28% ammonia)
20 mins 120 Enzymatic hydrolysis was effectively improved. The carbohydrate yields from cellulose and hemicellulose were 72.9% and 82.4%
(105) corn husk ammonia water (25-28% ammonia)
20mins 120 The carbohydrate yields from cellulose and hemicellulose were 86.2% and 91.9%
(102) Switchgrass 30% aqueous ammonium hydroxide
5 or 10 days
Room temperature
The percentage of maximum theoretical ethanol yield achieved was 72 with SSF
40-50% delignification. Hemicellulose content decreased by approximately 50%
(104) Switchgrass 0.1g Ca(OH)2/g dry biomass
2 hours 100 The 3-d reducing sugar yield was five times that of untreated switchgrass, the 3-d total sugar (glucose + xylose) yield was seven times, the 3-d glucose yield was five times, and the 3-d xylose yield was 21 times.
About 10% glucan, 26% of xylan and 29% of lignin became solubilized

28
(93) wheat straw 1.5% sodium hydroxide
144 hours
20 60% lignin release and 80% hemicellulose release
(92) spruce 3% NaOH/12% urea
24 hours -15 about 80% theoretical xylose yield and 60% mannose yield were obtained
Over 60% glucose conversion
(107) Oak Wood 15 wt% ammonia
40mins 170 The enzymatic digestibility of ARP-treated waste oak wood yielded 86.1% with 60 FPU/g glucan and 82.3% with 10 FPU/g glucan
82% of delignification, but retains more than 90% of the glucan content
(108) corn stover 15 wt% ammonia
60mins 170 Enzymatic digestibility of ARP-treated corn stover is 93% with 10 FPU/g-glucan enzyme loading. The ethanol yield from the SSF of low-liquid ARP-treated corn stover using Saccharomyces cerevisiae reached 84% of the theoretical maximum.
ARP process solubilizes about half of xylan, but retains more than 92% of the cellulose content.
(110) corn stover 15 wt% ammonia
12hours 60 The treated corn stover retained 100% glucan and 85% of xylan, but removed 62% of lignin. 77% of the maximum theoretical yield based on glucan and xylan for SSCF
The treated corn stover retained 100% glucan and 85% of xylan, but removed62% of lignin
(113) hybrid poplar 10 wt% ammonia solution
1hour 180 The enzymatic digestibility of the biomass pretreated at this condition (measured with enzyme loading of 30 IFPU/g dry biomass) was consistently above 90%, and the overall glucose yield (on the basis of glucose content in the original biomass) was also high at 85-90%.
The extent of delignification in the ARP process was in the range of 23-63%. solubilized significant amounts of xylan into the pretreatment effluent, yet left most of the glucan fraction intact.
(98) Hybrid poplar wood
0.4g Ca(OH)2/g dry biomass
2hours 140 or 160
72 h of enzymatic hydrolysis, the overall yields attained is 94-95 g glucan/100 g of glucan in raw biomass and 73 g xylan/100 g xylan in raw biomass
94-96% glucan and 70-74 % xylan recovered. *21.7bar
Table 2.3 Summary of alkaline pretreatments of lignocellulosic biomass

29
2.3.3.4 Acid Pretreatment
Acid pretreatment is one of the oldest and most commonly used methods. 72%
sulfurous acid was considered to be the first diluted acid used in the pretreatment
process in the US, and then 42% (w/w) hydrochloric acid hydrolysis was applied in
Germany (114). Organic acids including maleic acid and fumaric acid (115) are also
beeing studied. Both concentrated and diluted acids are applied in these acids
pretreatment procedure. Concentrated acids disturb the hydrogen bonds in
crystalline cellulose and convert crystalline cellulose into amorphous cellulose.
Furthermore, these pretreatment methods decrease the DP of cellulose and degrade
the pentoses (6). The advantage of applying concentrate acid pretreatment is that it
is not specific to biomass type. In addition, mild temperature condition and high
monosaccharide yield (over 90%) are the characteristics that made this method
appealing for decades (114). The issue with concentrated acid pretreatment is that
concentrated acids especially at higher temperatures (200-500ºC) lead to the
formation of furfural or hydroxymethyl furfural, which reduces the sugars yield
(116). The other drawback for concentrated acid pretreatment is high corrosion of
the equipments and high acid recycling cost (67). Facing these issues, diluted acid
pretreatment became more favorable in the bio-fuel industry. There are typically
two types of diluted acid pretreatments: high solid loading (10-40%)
low-temperature (less than 160ºC) batch pretreatment and low solid loading (5-10%)
high temperature (more than 160ºC) continuous-flow pretreatment (1). Besides
reactions with cellulose, diluted acid pretreatment also cause hemicelluloses
dissolution. This will release water soluble sugar monomers and oligomer from cell
wall matrix, so that the porosity of the cell wall and enzyme digestibility are both
increased. In addition, although diluted acid is not able to remove lignin,
30
researchers suggested that the lignin in biomass will be modified (109). As a result,
the diluted acid pretreatment is less flexible in choosing feedstock. Biomass with
lower lignin content is preferred. In addition, due to the mild condition, extension
of time or increase of temperature is required (114).
2.3.3.4.1 Sulfuric acid
Environmental toxicity and equipment corrosion leads to the limitation of applying
this pretreatment (117). The sulfuric acid pretreatment has been used to treat a wide
variety of lignocellulosic biomass, including switchgrass, aspen, spruceetc. (Table
2.4). Pretreatment is usually done by applying sulfuric acid (0.5%-2%) on biomass
at high temperature (130-210ºC) for a few minutes to hours (Table 2.4). Although
the sulfuric acid is appealing because of its low cost, the loss of sugars, high energy
input, restricting equipment requirements, and high disposal cost all impacts the
overall pretreatment cost. Furthermore, the by-products of this pretreatment
process, includeing furfural (from pentoses), 5-hydroxymethylfurfural (from
hexoses), acetic acid, and metal ions, are all considered to be inhibiting the
subsequent fermentation. These inhibitors are known to decrease the growth rate of
microorganisms and ethanol production during the fermentation process (118).
Cleaning processes like stream stripping are necessary prior to fermentation (119).

31
Ref Feedstock Chemical Time Temp Enzyme Loading Effect (112) Poplar wood
(Sunds Reactor)
2.0% Sulfuric acid
1.1 min 190°C 15FPU/g Cellulase 82.8% total sugar recovery
(120) Eucalyptus 1.84% sulfuric acid
30min 180°C 20 FPU cellulase & 30 CBU beta-glucosidase
Over 80% cellulose conversion
(121) spruce chips 8-10% bisulfite and 1.8-3.7% sulfuric acid
30min 180°C 14.6 FPU cellulase plus 22.5 CBU beta-glucosidase
more than 90% cellulose conversion
{{402 Monavari, S. 2009}}
Spruce chips 3% SO2 3min5min
190°C then 210°C
65 FPU/ -glucosidase IU/g g cellulase and 17-
Glucose recovery of about 80% theoretical (122)
(123) Olive tree 1.4% sulfuric acid
10 min 210°C 5 FPU/g cellulase and 15UI/g β-glucosidase
Obtain 75% of all sugars in the raw material
(124) Apple bagasse
0.8 mol L−1 Sulfuric acid
15min 121°C 15 FPU/g cellulase 0.47g/g ethanol yield
(125) Wheat straw 0.75% v/v sulfuric acid
1 hour 121°C recombinant Escherichia coli strain FBR5
74% saccharification yield
(126) Corn stover 2.0% sulfuric acid
43 min 120°C 22 FPU/g cellulase 77% xylose yield but only 8.4% glucose yield
(127) Aspne, balsam, fir, basswood, read maple, switchgrass
0.25%-1.0% w/v sulfuric acid
over approximately a 70 min
160-190°C N/A Maximum yields range from 70% (balsam) to 94% (switchgrass) for xylose, from 10.6% to 13.6% for glucose, and from 8.6% to 58.9% for other minor sugars
(128) Rice straw 0.5% sulfuric acid
10min 3min
201-234°C N/A 78.9% of xylan and 46.6% of glucan were converted to xylose and glucose
(129) Switchgrass (Panicum virgatum L.) and reed canarygrass
0 to 100 g (kg DM)−1 sulfuric acid
30-180 days
Amber temperature
Saccharomyces cerevisiae D5A
Conversion of glucose to ethanol for reed canarygrass ranged from 22% to 83%, switchgrass conversions ranged from 16% to 46%
{{418 Li,Chenlin 2010}}
switchgrass 1.2% (w/w) sulfuric acid
20min(130)
160ºC cellulase (NS50013) concentration of 50 mg protein/g glucan and β-glucosidase (NS50010) concentration of 5 mg protein/g glucan
85% glucose yield
Table 2.4 Summary of sulfuric acid pretreatments on lignocellulosic biomass
2.3.3.4.2 Organic acid
Maleic acid and fumaric acid have been studied and compared with sulfuric acid

32
pretreatment (115). They proofed to be efficient alternatives for sulfuric acid
pretreatment due to their low furfural and HMF formation which results in less
impact at the downstream process (131-134), although this downstream process is
considered to be a low-value by-product stream (109). Oxalic, salicylic and
acetylsalicylic acid are also used as catalysts for the organosolv process together with
solvents like methanol, acetone, ethanol, tetra-hydrofufuryl alcohol or triethylene
glycol (27).
2.3.4 Combination pretreatment
On the foundation of well established pretreatment methods, researchers become
focused on combination pretreatment methods which combine at least two methods
to maximize the utilization of biomass by overcoming the disadvantages of the single
methods (135).
Several combination pretreatments have been summarized by Charles E. Wyman
(59). He listed five catalogs of examples including two or more physical
pretreatments in sequence, two or more chemical pretreatment in sequence, physical
pretreatment followed by chemical pretreatment, chemical pretreatment followed by
physical pretreatment, chemical pretreatment followed by biological pretreatment
(136). More detailed examples are listed in the following table (Table 2.5).
Although these combination methods have better conversion rates compare to single
methods, they might require higher expenses because of the complexity of the
pretreatment equipments. Since the improvement is not dramatic and a large amount
of additional expense is needed for large scale combination methods, the single

33
methods are still considered to be the most economic feasible option for biomass
pretreatment.
Combinations Examples Pros Cons Ref
Physical pretreatments in sequences
Irradiation and mechanical
crushing
Shorten reaction time,
no need to neutralize,
lower energy input
Higher cost
(137)
Physical pretreatment followed by chemical
pretreatment
Ammonia fiber
explosion
No inhibitor to hydrolysis microbes,
completely lignin
separation
Incompletely lignin separate,
inhibitor to hydrolysis microbes, low yield, high cost
(119)
Chemical pretreatment followed by physical
pretreatment
Acid Steam explosion
Higher hemicelluloses
Removal. Better yield
than AFEX, no inhibitor to hydrolysis microbes
High cost
(138, 139)
Chemical pretreatment followed by biological
pretreatment
Inhibitor to hydrolysis microbes, low yield, high cost
(140)
Table 2.5 Combination pretreatment used
2.4 Hydrolysis techniques
Hydrolysis is the method by which glycosidic bonds are cleaved in lignocellulosic
substrates. The hydrolysis conditions influence the recovery of neutral sugars (141).
During hydrolysis the xylan hemicelluloses sould be completely hydrolyzed to
D-xylose (50-70% w/w) and L-arabinose (5-15% w/w), and the cellulose sould be
completely converted to glucose (142).

34
2.4.1 Acid hydrolysis
Feather and Harris found that hydrolyzed sugars are very stable in acid (143).
Sulfuric acid has been used most frequently both in diluted or concentrated solutions
for acidic hydrolysis. It is suitable for most species including wood chips, rice
straw, sugar beet pulp (144), wheat straw (145) spruce chips (146), waste cellulose
Saline crops, aspen, basswood, balsam, red maple, and switch grass (147) and so
on. Other acids such as phosphoric acid and HCl have also been used.
For diluted acid hydrolysis, high pressure and high temperature are required.
Extremely low concentrations of sulfuric acid (0.05-0.2 wt %) and high temperatures
(200 -230°C) are proven to be effective for hydrolysis of biomass (148).
Concentrated acid hydrolysis proved to provide a complete and rapid conversion of
cellulose to glucose and hemicellulose to five-carbon sugars with little degradation.
Zhou used a two-step concentrated sulfuric acid process to hydrolyze wood chips
(35°C, 80% sulfuric acid 120min for the first part, 30%, 95°C, 180 min for the
second part) and(149) reached a yield of above 90% (150). The low temperatures
and pressures employed will allow the use of relatively low cost materials such as
fiberglass tanks and piping {{500 Yat, S.C. 2006}}. However, this process
involves two reactions. First, the cellulosic material is converted to sugar which
could be used for fermentation and as the reaction continues, a second reaction takes
place. The sugars from the first reaction will convert into other chemicals such as
furfural, which will inhibit microbial reaction.
35
2.4.2 Biological hydrolysis
Considered to be a more environmentally friendly and efficient hydrolysis method,
biology technologies are also been used for the hydrolysis process. There are two
technologies being developed for hydrolysis: enzymatic conversion and direct
microbial conversion (151). Between these two methods, enzymatic conversion is
the most common one.
Enzymatic hydrolysis of cellulose to glucose is usually catalyzed by cellulase (EC
3.2) and β-glucosidase (EC 3.2.1.21) enzymes. However, due to the highly
crystalline structure of cellulose, the main problem of this reaction is the long
reaction period.
In order to get over this issue, many revisions have been done. For example, Ionic
liquid (IL) which contain 1-n-butyl-3-methylimidazolium chloride are used by Dadi
et al to disrupt the cellulose structure (152); Yanpin Lu used an “enzyme–microbe
synergy” which requires the presence of metabolically active cellulolytic microbes to
increase hydrolysis efficiently (153).
2.4.3 Enzymes for hydrolysis of lignocellulosic materials
More than fifty years ago, Reese et al. postulated that the enzymatic hydrolysis
consists of two steps (154). First of all, the active C1 site is initiating the hydrolysis
by opening up unspecified crystalline cellulose structures to produce soluble
cello-oligosaccharides. This step provides a better access for Cx sites.
Consequently, Cx will de-polymerize oligosaccharides – cellobiose to the glucose
(155). In this original model, Cx is a cellobiase, however, the precise action of C1

36
remains unknown.
With the later clarification of cellulose crystallinity structure, the Trichoderma
reesei system has proved to be a better way to interpret cellulase actions than the C1 -
Cx system (156). Trichoderma reesei consists of three major components:
endo-ß-glucanase (EC 3.2.1.4), exo-ß-glucanase (EC 3.2.1.91) and ß-glucosidase
(EC 3.2.1.21). Each of these components consists of two domains which are the
catalytic domains (CD) and cellulose binding domains (CBD) (119). These
components of Trichoderma reesei are integrated with each other in an ordered way
(Figure 2.9). Endo- ß -glucanase also called 1, 4-ß-D-glucan glucanohydrolase
form a complex with cellulose and then breaks internal bonds to disrupt the
crystalline structure of cellulose and expose individual cellulose polysaccharide
chains. This reaction yields glucose as well as cello-oligo saccharides and releases
plenty of reducing ends by random scission of cellulose chains. This is the
rate-limiting step for the utilization of cellulose. The second step is random
adsorption of exo- ß -glucanase to the cellulose surface (157). The exo- ß
–glucanases’ tunnel-shaped active sites attacks on the non-reducing end of
amorphous cellulose fractions to hydrolyze them into D-glucose and D-cellobiose
(158). At last, the small pieces of cellobiose are hydrolyzed by ß-glucosidase to
glucose (159).

37
Figure 2.9 Hydrolysis reactions of Trichoderma reesei (112)
The adsorption of enzyme is considered to be a very important step (160).
According to previous studies, the factors that will increase the availability of
enzyme binding sites includes: increase surface area, decrease particle size of
cellulose as well as removal of most of the hemicellulose (161). Application of a
proper pretreatment method has a dramatic effect on modifying the enzyme
adsorption step which will enhance enzymatic hydrolysis efficiency (161).
2.4.4 Common Barriers and Inhibitions for Hydrolysis
Many researches have proven that several structural and chemical factors will affect
the enzymatic hydrolysis efficiency. The chemical barriers are the composition of

38
cellulose, hemicellulose, lignin and acetyl groups connected to hemicelluose (162).
The physical and structural barriers include cellulose crystallinity, surface features,
particle size, moisture content of materials, cellulose degree of polymer (DP), and
carbohydrate-lignin complex structures. These factors are correlated with each
other, if one of them changes, other barriers will change as well. As a result, a
better understanding of all these factors separately as well as the interaction of these
factors would be helpful for the optimization of pretreatment in order to get a
maximum biomass conversion rate.
2.4.4.1 Cellulose crystallinity
Natural cellulose contains crystalline regions (50%-90%) as well as amorphous
regions (163). Crystalline areas of cellulose have been considered to play a critical
role in inhibiting enzymatic hydrolysis (164). Pure crystalline forms of the
cellulose were found to be more difficult to digest than the amorphous forms. This
is because the crystalline regions are closely packed and have a strong supporting
strength caused by internal and external hydrogen bonds (160). Extreme reduction
of particle size or dramatic enlargement of the surface area will give more chance to
form crystal barrier (165). However, crystallinity index is not correlated to sugar
conversion rates for all species. For example, as pointed out by Han et al., the
correlation between crystallinity index and release of fermentable sugars for rice
straw and sugarcane bagasse are quite insignificant (161).
2.4.4.2 Surface feature
Cellulose is a heterogeneous porous substrate with both internal and external surfaces
(166). Internal surface refers to the capillary structure of cellulose fiber while the

39
external surface is the area of cellulosic particles (166). Increasing the internal or
external surfaces has a direct correlation to the improvement of lignocelluolsic
biomass degradation (167). Nevertheless, both internal and external surface
accessibility are related to cellulose crystallinity and lignin presence. Decreasing
crystallinity, particle size or degree of polymerization will lead to extension of the
cellulose surface area for enzymes’ binding sites (168). As a result, surface area is
generally not considered to be an individual factor for promoting higher sugar yield
(169). For example, different conversion rates caused by different surface areas
might be because of the required surface size for the enzyme used, because of the
biomass used in the experiments, or the sensitive difference among surface area
measurement technologies rather than surface features themselves (170).
2.4.4.3 Moisture content of cellulose
It has been determined in previous studies that higher moisture content leads to better
sugar conversion rates during enzymatic hydrolysis (160). With less water content
in the biomass, capillary structure of cellulose collapse, degree of swelling decrease
and hydrolysis rates goes down as a result (171).
2.4.4.4 DP value of the cellulose
During the synthesis of the cellulose molecules, their lengths vary over a wide range.
These lengths are described by degree of polymerization (DP). It can be also
considered as the number of glycosylic residues per cellulose chain (172). During
the decrease of DP, amorphous ends have the tendency to recrystallize (6, 85, 136).
Only if the DP drops to very low values, such as 10 or 15 units, the molecules will
not be able to form new hydrogen bonds among each other, so that no new

40
crystalline areas will be re-formed (6). As a result, rate of hydrolysis will be
enhanced. However, since altering the DP usually is accompanied with the change
of crystallinity and surface properties of the biomass, it is hard to separate out the
correlation between DP and lignocellulosic biomass utilization efficiency
exclusively.
2.4.4.5 Nature of association
Avgerinos and Wang reported that altered native cellulose-hemicellulose-lignin
association would make the carbohydrates more accessible to be attacked by
enzymes (173). Because lignin and hemicellulose are deposited in the space
between amorphous regions of cellulose molecules, they will prevent chemical or
biological agents from contacting sufficient number of glucosidic links in the
cellulose to permit significant hydrolysis.
As the support material for biomass, lignin is the most recognized factor that slows
down the enzymatic hydrolysis. Several reports have shown a positive correlation
between enzyme accessibility and delignification (174). Lignin removal or proper
lignin modification causes increase of internal surface area and median pore volume
which will increase biomass digestibility (173). On the other hand, modification
and lignin removal will release more cellulose that is being trapped within the lignin
structure which will also improve the enzymatic hydrolysis efficiency (175).
However, the issue for delignification is the high process cost. Thus, extensive
delignification is not economically option in bio-ethanol production from woody
biomass.

41
Hemicellulose, which is abundant in biomass, blocks the access of cellulase to the
surface of cellulose (165). The extraction of hemicellulose in some of the initial
preparation methods for biomass will significantly increase the cellulose digestibility
(176).
2.4.4.6 Acetyl group
Acetyl groups on the xylan background will limit swellability of biomass and reduce
its digestibility (177). The removal of acetyl groups or the lowering of acetyl group
content would lead to better digestibility. Thus, acetyl group content for different
raw materials are tested for illustrating the effects on pretreatment processes.
However, removal of acetyl group would initiate the formation of acetic acid which
lowers the pH and the cell activities for enzymes.
2.4.4.7 Inhibitor by-products
Some inhibitors will be produced during pretreatment or chemical hydrolysis
procedure. For example, under oxidative condition, some glucose will be oxidized
to glucuronoside, which is more resistant to hydrolysis. The mechanism of this
inhibition is not clear yet.
During the presence of acid, both hydrolysis and condensation will happen under
vigorous condition. A small amount of compounds like hydroxymethyl furfural
(HMF) and furfural will be generated from cellulose and hemicellulose degradation
(116) (Figure 2.16). The furan ring of these compounds is provides high resistance
to chemicals and enzymes. As a result, the cell growth and respiration are
negatively affected. Comparing these two, the HMF is generally less toxic and

42
lower in concentration than furfural (178).
Furfural Hydroxymethyl furfural
Figure 2.10 Structure of furfural and hydroxymethyl furfural
Other product inhibitors are released through lignin degradation. For example,
phenolic compounds, especially low molecule weight phenolic compounds, are
considered to be a severe issue in this process. These compounds are considered to
be more toxic than furfural; they will lower the cell growth and sugar assimilation of
the microorganisms by causing the cell membrane integrity loss (179). This
degradation only occurs at high temperatures (over 180 ºC) or at the existence of
strong acid and base.
2.4.4.8 Extractives
Extractives are containing resin, tannin, and etc. They are a group of inhibitors with
lower toxicity than furfural (178). Since they are naturally occurring compounds, it
is hard to prevent their formation. The only way to deal with it is to remove or
reduce the extractives before hydrolysis and fermentation.
2.4.4.9 Heavy metal ions
Heavy metal ions caused by equipment corrosion is another issue for hydrolysis.
Although the existence of certain ions is beneficial to microbes due to their nutrient
requirements, for other organisms or enzymes, these compounds are toxic to the

43
metabolism.
2.5 Fermentation process
Traditionally, lignocellulosic materials can be first converted to fermentable sugars
consisting of mainly glucose, followed by fermentation to ethanol by using special
yeasts. This method is called separate hydrolysis and fermentation (SHF) (170).
In order to simplify the process and increase the conversion rate sugar to fuel,
simultaneous saccharification and fermentation (SSF), which is hydrolysis and
fermentation of pretreated biomass at the same time (170, 180) has been developed.
For the SHF method, yeast is used for ethanol and CO2 productions in the absence of
oxygen. Large amount of CO2 are collected with scrubbers, and used in other
industries, for example carbonating beverage productions. The main product -
ethanol has been distilled from solutions containing yeast cells and biomass residues
to reach a higher concentration (around 96%). The residues from distillation are
used for livestock feed due to high protein content (181). This traditional yeast
fermentation can be used as a standard method to show the pretreatment effects on
hydrolysis processes for future research.
2.5.1 Fermentation Micro-organisms
2.5.1.1 Bacteria
Many bacteria can perform ethanol formation by Embden-Meyerhof pathway (i.e.
Enterobacteriaceas, Spirochaeta, Bacteroides, etc.) (182) and Entner-Doudoroff
pathway (i.e. Zymomonas, etc.) (183). Besides ethanol as the major product, certain
species also produce other alcohols (butanol, isopropylalcohol, 2,3-butanediol),

44
organic acid (acetic acid, formic acid, and lactic acids), polyols (arabitol, glycerol
and xylitol), ketones (acetone) and gases (methane, carbon dioxide, hydrogen) as
by-products (85). Due to their rapid growth rate, the bacterial ethanol-production is
conventionally used in commercial production.
Microbial species for lignocellulosic biomass degradation fall into several main
genera: Bacillusm, Clostridium, Thermoanaerobacter, Zymomona, Neocallimastrix,
Piromonas, and Sphaeromonas (14). These microbes can be further divided into
two groups, aerobic and anaerobic, by the different cellulose degradation
mechanisms. For aerobic microbes, the cellulose degradation is involving the
non-complexed cellulase that secrets and releases into the environment (184). But
for anaerobic microbes, the degradation process is utilizing the membrane bonded
cellulase complex called cellulosomes (185-187). By combining various enzymes
in a complex, the degradation loss of intermediates have been dramatically reduced.
Thus, the anaerobic microbes proved to be highly efficient degradation agent
compared to the aerobes. Among these anaerobic species, Clostridium sp. stands
out due to their excellent polysaccharides degradation abilities. Detailed
applications are summarized in Table 2.6.
A combination of C. thermocellum and C. Thermolacticum has been chosen in this
project due to the following unique growth conditions and efficient degradation
capacities: a) This combination can degrade crystalline cellulose which is considered
to be one of the barriers for biomass enzyme hydrolysis (14). b) This combination
can utilize the majority of lignocellulosic biomass efficiently. C. thermocellum can
efficiently ferment hexoses and C. Thermolacticum can proficiently ferment pentoses

45
(13, 14). c) It diminishes the substrates competitions of the co-culture because two
strains are proficient in using different substrates. d) Both of these microbes
require growth at around 60 °C. At this temperature, some of the contaminations can
be omitted and a smaller temperature increase is needed for further ethanol recovery
(13, 14). e) Fermentation at the anaerobic condition will reduce the expensive
oxygen transfer step (206). Detailed information of these two microbes will be
covered later in this review.
Genus Species Hexose/ Cellulose
Pentose/ Hemicellulose
Ref.
Bacillus Bacillus macerans √ (188) Clostridium Clostridium
autoethanogenum √ (189)
Clostridium Clostridium carboxidivorans
√ √ (190)
Clostridium Clostridium acetobutylicum
√ √ (191)
Clostridium Clostridium thermocellum
√ (14)
Clostridium Clostridium thermohydrosulfuricum
√ (192)
Clostridium Clostridium thermosaccharolyticum
√ (193)
Clostridium Clostridium beijerinckii √ √ (194) Clostridium Clostridium
stercorarium √ √ (195)
Clostridium Clostridium aurantibutyricum
√ √ (196)
Enterobacteriaceae Erwinia amylovora √ √ (197)
Enterobacteriaceae Leuconostoc mesenteroides
√ √ (198)
Enterobacteriaceae Sarcina ventriculi √ (199) Enterobacteriaceae Streptococcus lactis
√ (200)
Enterobacteriaceae Spirochaeta aurantia
√ (201)
Enterobacteriaceae Spirochaeta stenostrepta
√ (202)
Enterobacteriaceae Spirochaeta litoralis
√ (203)
Thermoanaerobacter Thermoanaerobacter mathranii
√ √ (204)
Zymomonas Zymomonas mobilis √ (205) Table 2.6 Performance of lignocelluosic biomass fermenting bacteria

46
D-xylose D-xylulose D-xylulose-5-P
Central metabolic pathways
Figure 2.11 Bacteria xylose ulilization
2.5.1.1.1 C. thermolacticum (ATCC 43739)
Thermophilic anaerobic bacteria, C. Thermolacticum, can ferment a wide range of
substrates to produce acetate, hydrogen, or ethanol at optimum growth conditions:
60-65 °C under pH=6.0-7.8 (207). These substrates include natural materials like
lignocelluosic biomass or paper pulp sludge, and pure saccharides such as glucose,
cellobiose, or galactose (16, 208). For centuries, this organism has been broadly
studied in hydrogen production from milk permeate or kitchen waste (16, 31, 209-211),
in acetic acid production from lactose (209), and in the production of xylanase that
can tolerate high temperatures (80 °C) and a wide pH range (pH=3-11) (212, 213)
This strain also has potential in ethanol production since changing the growth
conditions will shift the Clostridium thermolacticum’s metabolism pathway to
produce a significant amount of ethanol (16, 214). Fardeau et al. found that C.
thermolacticum has the ability to produce ethanol (13). Similar observations also
were found in the preliminary test of my project. The preliminary results show the
cellulolytic ability of ATCC 43739 since this strain can produce ethanol when
growing it in a medium with various carbon sources. However, unlike my own
Xylose isomerase
Xylulokinase

47
preliminary results, Le Ruyet et al. noted that no cellulose is degraded and ethanol is
only observed as a minor product (215). These differences are expected because
cultivation conditions and end-product concentrations will all shift the metabolism
path of this organism (13, 216).
2.5.1.1.2 C. thermocellum (ATCC 27405)
C.thermocellum is one of the most powerful cellulose degraders (217, 217).
Cellulosomes possessed by C.thermocellum lead to itsexcellent cellulose digestion
ability (185-187). We found that highly concentrated C. thermocellum can
completely digest 0.5 g/L of No.1 Whatman filter paper within 5 days (data not
shown).
The cellulosomes are mainly responsible for cellulose saccharification, particularly
crystalline cellulose saccharification. These complexes, which are18nm in diameter,
range from 200kDa to 600kDa (218). A typical cellulosome in C. thermocellum
mainly consists of scaffolding subunits, dockerins (70 residues), cohesins (140
residues), and a carbohydrate binding module (CBM) (185). The scaffolding
subunits are the backbone of the whole cellulosome complex. Dockerins, cohesins,
and CBM bind to this backbone to promote the adherence of C. thermocellum to
cellulose and catalyze the hydrolysis of both amorphous and crystalline cellulose
(219).
In addition to cellulosome various other enzymes secreted by C. thermocellum also
contribute to its efficient biomass degradation ability. C. thermocellum can produce
cellobiose phosphorylase and cellodextrin phosphorylase to initiate the cleavage of

48
glucans into cellodextrins (cello-oligosaccharide) (220, 221) which will also provide
extra ATP for cellulase synthesis (222). C. thermocellum also expresses enzymes
containing dehydrogenase, galactouronase and pectin lyase (220, 221). Thus, C.
thermocellum exhibits the ability to produce ethanol, acetic acid and lactic acid from
lignocellulosic biomass through the Embden-Meyerhof Glycolysis Pathway (220,
223).
C. thermocellum has been used to investigate the use of direct cellulosic biomass
fermentation since 1978 (196, 224). For instance, a high ethanol amount (0.92 g/l)
was obtained from the cellulose culture containing 10 g urea/l by wild type ATCC
27405 (225). This strain has also been used to ferment paper pulp sludge, sugar
cane bagasse, wheat bran, and corn stover in solid substrate cultivations. High
ethanol concentration was also observed in paper pulp sludge fermentation (208).
The issue for C. thermocellum, however, is that xylanases synthesis. C.
thermocellum cellulosomes dose not has the capacity to hydrolyze pentose, because
no β-xylosidase activity, which is critical for xylan metabolism, is observed (226).
Instead, these xylanases are responsible for opening the access for cellulose
degradation enzymes (226). The inability of this organism to completely ferment
hemicellulose limits its utility in lignocellulosic biomass de-polymerization. We
hypothesize that the co-culture of C. thermocellum and C. thermolacticum organisms
would widen the substrate range and increase the productivity (16).
2.5.1.1.3 Ethanol Sensitivity in C. thermocellum and C. thermolacticum
Limited data are available on applying the wild type cultures of C. thermocellum and
49
C. thermolacticum in bio-ethanol production. To date, these wild type strains have
been depressed by one of the major products - ethanol (16). For C. thermolacticum,
as reported in Talabardon et al., when ethanol production reaches less than 2% v/v,
the cell growth of C. thermolacticum will completely stop and inhibit further ethanol
production (16). For C. thermocellum, an ethanol concentration of 3% v/v (207, 227)
is high enough to inhibit the cell growth, due to the irreversible cell structural
changes caused by the existence of ethanol.
Research to date has tended to explore the area of microbes modifications.
Although those modifications like direct mutations have been performed to upgrade
their tolerances and to increase their enzyme activities, the stability information of
these mutated strains is lacking. In addition, those mutated strains are designed
only for one specific method, so that they are less valuable when used for other
applications. Thus, a systematic improvement - immobilization, could be a better
approach to protect cells against the ethanol inhibitions than changing the microbes
themselves.
2.5.1.1.4 Lack of Proper Regulations in C. thermocellum and C. thermolacticum
Very little is known about proper regulations of fermentation which favor ethanol
production, although numerous factors including pH, substrates and end-products
concentration, nutrients and gaseous products have shown the impacts on the cell
growth and final ethanol and acetate yield of these strains (16, 31). In this study, pH
and substrates are the two major factors investigated.
The pH of a medium is the first factor studied since the influence of the pH value on

50
biomass conversion and ethanol production is inconsistent in pervious studies.
Take C. thermocellum for instance, fermentation performed at pH=7.2 is reported to
increase the ethanol yield but to decrease the production of lactate or acetate (15, 16).
However, a conflicting finding claims that ATCC 27405 grew better when the pH
was between 7 and 10 (229). Another study demonstrated PH=10 to be the optimum
pH for ethanol production and pH=7 for glucose accumulation (229). This
inconsistency suggests that the effect of the pH value on ethanol yield may be
associated with other fermentation parameters. Thus, the correlation between the
pH value and ethanol inhibition will be examined in this study. Through a set of
experiments we will investigate the pH value, ethanol concentration, and their
interaction on ethanol yield or biomass conversion for the strains used.
The second factor that influences the cell growth is the type and concentration of the
substrates and end-products. Generally, C.thermocellum is a long cellolextrin
degrader. The conversion rate on β-1, 3-glucan, β-1, 4-glucan or longer
cellolextrins (DP > 4) is almost 2-5 times that of the degradation of sugars such as
glucose and fructose (230, 231), although the effect of substrates is different among
C.thermocellum strains (232). Certain substrates or end-products like glucose (233)
are not only unfavorable for this strain, but also inhibit or depress metabolism (234).
Three reasons are involved in this situation: 1) utilizing longer cellolextrins will
provide more ATP per glucose during phosphrolytic cleavage (230, 235-237); 2) The
existence of insoluble substrates might trigger the cellulase activity (230, 235-237);
and 3) If cellobiose is compared to longer cellolextrins, cellobiose will cause the
substrate competition between Β-glucosidase and phosphorylase to decrease the
enzyme activities (233). For example, the amount of cellulase synthesized by C.

51
thermocellum is higher when using avicel as a substrate rather than cellobiose (233,
237). For C. thermolacticum, although most saccharides can be degraded by this
strain, the amount of ethanol or acetate produced varies according to the substrates as
shown in our preliminary study.
The substrate or end-product amounts also play a critical role for the strains,
particularly for C. thermocellum. A lower initial substrate amount and a lower
accumulated sugar concentration are favorable for ethanol production and the total
conversion rate (238). For example, C. thermocellum can only grow within
0.2%-5% of cellobiose (217, 239). Higher cellobiose does not lead to a higher
ethanol yield (240). In other words, for C. thermocellum a limited carbon source
does not appear to be a limitation of production yield, but excess carbon does (217,
241).
To improve the ethanol yield of both strains, analysis of the effects of the pH and the
substrates on the fermentation process will be done in this project. Detailed
information revealing the factors that are favorable for the ethanol-production of
these two strains will provide various strategies for a high efficient fermentation
process.
2.5.1.1.5 Co-culture Fermentation
Co-culture fermentation proved to be more efficient than mono-culture fermentation
in previous studies because of the different enzymes produced by different microbes,
so the scope of substrate utilization will be widening using proper combinations. In
this research, C. thermocellum is a strain that can produce endoglucanase and
52
xylanase. However, a large amount of sugar remains unutilized, particularly the
pentose. As a result, C. thermolacticum which can ferment pentose is applied in
this research to utilize the remaining sugars produced by C. thermocellum.
In previous papers, co-culture fermentation with one of these two microbes,
particularly C. thermocellum can be divided into two groups. The first group is the
sequential co-culture fermentation in which fermentation is performed by various
microbes one after another (242). In this case, two microbes usually require
different growth conditions. Available examples contain the co-culture of C.
thermocellum and C. acetobutylicum ATCC824 (242), C. thermosaccharolyticm
HG-2 (231), Aectogenium kivui LKT-1 or C. paraputrificum (243).
The other group of co-culture fermentation is simultaneous co-culture fermentation.
This category is considered to be a better process than sequential fermentation due to
its lower capital cost. Thus, this process is also the one that will be used in this
project. Microbes chosen in our study require similar or the same growth
conditions. Previous co-cultures of C. thermocellum were performed by applying C.
thermohydrosulfuricum 39E (240), Zymomonas mobilis (244), Zymomonas
anaerobia (245), C. thermohydrosulfuricum (246, 247) or even various C.
thermocellum strains (9). Similar to simultaneous C. thermocellum/C.
thermolacticum co-culture fermentation, the theory applied in order to achieve
complete utilization of biomass by the co-culture of C. thermocellum S-7 and C.
thermosaccharolyticum HG-4 is to ferment pentose by C. thermosaccharolyticum
and ferment hexose through C. thermocellum (216). For this co-culture
fermentation on corn stover, ethanol yield reached 9.7 g/l which is higher than

53
mono-culture fermentation (216). Nevertheless, in that study, the ethanol adapted
strain S-7 was applied which made it possible for this method to produce a high
ethanol yield. If the wild type C. thermocellum were used, the improvement is
expected to be less dramatic. For using wild type C. thermocellum in co-culture
development, the co-culture of C. thermocellum ATCC 27405 and
Thermoanaerobacter sp. stain B6A was studied (248). This co-culture was applied
on woody biomass anaerobically; 1.32g/l of ethanol was produced by fermenting
white birch (248). This yield is about 1g/l higher than the fermentation performed
by C. thermocellum ATCC 27405 (248). However, similar to other co-cultures,
using wild type ATCC 27405, low ethanol production yield is to low to be feasible
for industrial production.
Although the previous co-culture improved the ethanol yield compared to their
mono-cultures, issues including ethanol inhibition remain unsolved for wild type
microbes. In addition, no co-culture containing wild type C. thermolacticum or C.
thermocellum is reported to be capable of tolerating high ethanol concentrations and
leading to a high ethanol yield. In this case, technological improvement of wide
type C. thermolacticum/C. thermocellum co-culture or their mono-cultures is
required to further improve the fermentation efficiency
2.5.1.1.6 Modification for Strain Improvement
Although some microbes are able to ferment lignocellulosic biomass and produce
ethanol efficiently, the industrial production processes are not optimized for most
cases (249). As a result, strain improvement techniques are necessary. Improving
strains by mutations are an old but successful process in the lab.

54
Mutagenesis by applying UV light (250, 251), ethyl-methane-sulfonate (EMS) (252),
fluoropyruvate (253) or by other mutation agents, will result in bacteria strains able
to produce higher concentration of ethanol and being much more tolerant to the
end-products (254, 255). Similar to mutagenesis, directed evolution, which
involved selecting and expending the organisms with the greatest expression of the
desired traits is the other classic way of improving the strains (256). For example,
if increasing level of ethanol are applied during C. thermocellum culturing stains
with increased ethanol tolerance are selected. After this strain improvement, the
mutant strains have been investigated for increased ethanol tolerance, ethanol yield
and catabolite selectivity (216, 228). However, the issue with these traditional
methods is that the strains with new traits formed at the laboratory level are quite
instable after fermentation reactions (257). The distinguishing benefits might get
lost.
Protoplast fusion is another conventional technique for strains enhancement.
Fusing two strains lead to genome restoration which results in higher frequencies of
genetic recombination (257).
Currently, molecular based genetic and protein engineering seems to be more
appealing to researchers. DNA transformation by using plasmids, like pIMK1
plasmid (258), or knocking out the genes involving the by-product formation by
ClosTron (259), are both promising ways of improving bio-ethanol conversion with
Clostridium sp. For example, in order to efficiently utilize the xylose by
S.cerevisiae, expression of xylose reductase (XYL1) and xylitol dehydrogenase

55
(XYL2), together with the over expression of xylulokinase (XYL3) will lead to a
84% theoretical yield on 1:1 glucose/xylose mixture (260). Also, E.coli has been
used by several laborateries as a host for genetic manipulation for bio-ethanol
productions. When pyruvate decarboxylase (Pdc) and the alcohol dehydrogenase
genes (adhB) in Z.mobilis got expressed in E.coli, nearly maximum theoretical
ethanol yield was achieved from sugar mixtures (261). The scaffolding protein in
C. thermocellum (Cip A) family 3 Carbohydrate-binding modules (CBMs) is also
fused to antimicrobial peptides (AMPs) and expressed in E.coli for the directing the
binding of the AMPs (262).
2.5.1.2 Fungi
2.5.1.2.1 Yeast
Saccharomyces uvarum (263), Schizosaccharomyces pombe (264), and
Kluyueromyces sp. (265), Pachysolen tannophilus, Candida Shehatae, Pichia
stipitis, and especially Saccharomyces cerevisiae, are the major yeast species
currently used for industrial ethanol fermentation processes (266). For
yeast-mediated ethanol production, small amount of oxygen (0.05 – 0.10 mm Hg) is
reqired during the Embden-Meyerhof pathway. Besides the oxygen, nutrients are
also required as other microbial bio-fuel process to maintain the cell-related ractions
(267).
Saccharomyces cerevisiae is budding yeast that can tolerate up to 20% v/v ethanol
during fermentation which makes this strain appealing to ethanol production industry
(268). In addition, better than bacterial fermentations, yeast fermentations don’t
usually result in various by-products such as acetic acid (Figure 2.10). However,

56
this strain only utilizes hexoses, and no sufficient crystalline cellulose degradation
has been reported for this strain (269). The other drawback of using yeast in
bio-ethanol production is the acid sensitivity of yeasts. Acidic hydrolysates, even
diluted hydrolysates, are reported to inhibit the fermentation process (270). Thus,
modifications for gaining xylose-utilizing and arabinose-utilizing functions and
higher acid tolerance are developed (271).
D-xylose D-xylitol D-xylulose
Central metabolic pathways
D-xylulose-5-P
Figure 2.12 Yeast xylose utilization
2.5.1.2.2 Mold
Aspergillus niger is a soil dwelling black mold that has been used in citric acid
production (272) and cellulases and hemicellulases productions (273). Co-culture
of A.niger and S.cerevisiae are reported to have 96% of the theoretical ethanol yield
on potato starch fermentation (274).
2.5.2 Consolidated Bioprocess
CBP, also known as direct microbial conversion (DMC), is a process combining
Adlose Reductase
Xylulokinase
Xylitol dehydrogenase

57
cellulase production, hydrolysis and fermentation. The establishment of this
process is a potential way to lower the capital cost and optimize the bio-conversion
process of SSCF (Figure 2.13) (5, 275). For example, using C. thermocellum on
diluted acid pretreated hardwood will provided a higher conversion yield compared
to SSF (241). The DOE also applied both modified C. thermocellum and
Thermoanaerobacterium saccharolyticum strains to ferment both hexoses and
pentoses in CBP for ethanol production (276).
5.59
3.90
1.851.71
0.68
1.84
7.49
0
1
2
3
4
5
6
7
8
Lost Yield Ultilities Raw Materials Capital and Others
Process
Cos
t (ce
nt/g
al E
tOH
)
Cellulase Production and SSCF CBP
Figure 2.13 Ethanol Production Cost Comparison between SSCF and CBP (5)
As a relatively immature technology, however, CBP has unavoidable pitfalls mainly
due to the operation process. In the CBP, microorganisms that produce the
enzymes will be treated as living microbial systems rather than enzymes, since the
cellulase production is inside the reaction vessel. This adds up to more technical
difficulties for process engineering and also requires some more specified traits of
the microorganisms themselves (4). The other issues for CBP is, even if some
bacteria and fungus lead to better yields than SSCF, this process requires a much

58
longer reaction time, and produces numerous by-products with low value (277).
To improve this situation, some researchers have focused on microorganisms
engineering or metabolism engineering to facilitate the enzymatic expression of
microorganisms (278). Others are working mainly on process engineering methods
to optimize the microorganisms’ working conditions (279). With all these
modifications that have been made for the CBP, it has become a potential alternative
pathway with many excellent properties compared to other methods to manufacture
bio-energy although more improvements are needed.
This study is mainly focused on process development of Clostridium sp. CBP
fermentation by applying cell immobilization. Thus, I will examine a fundamental
understanding of the fermentation process including material balance and the effect
of fermentation parameters on the final product yield.
2.5.3 Immobilization
The two strains chosen for this study are sensitive to ethanol (280). One to three
percent of ethanol will depress or inhibit the fermentation process (280).
Optimizing the fermentation temperature makes the cells even more sensitive to
ethanol (281). As a result, DNA transformation (282), protein engineering (283),
and direct metabolism engineering (185) has been performed for these strains in an
attempt to upgrade its tolerance and to increase its enzyme activity.
Whole cell immobilization is another potential solution. Cell immobilization is
achieved by entrapping the cells in polymers or a porous surface, attaching the cells

59
on a surface or behind a barrier, or self-aggregating so that the cells can be reused
several times and prevent poisoning (284, 285) (Figure 2.14). For Clostridium sp.,
entrapment of cells in a porous matrix is the most common method (286). Horne
and Hsu trapped C. thermocellum ATCC27405 on bituminous coal for cellobiose
fermentation (286). Fix-bed bioreactors packed with polyurethane foam as the
support matrix can be applied for C. tyrobutyricum JM1 for an efficient and stable
hydrogen production system (287). However, weak entrapment strength, small
growth space and leakage usually limit the final immobilized cell concentration (288).
Therefore, encapsulation, a modified version of entrapment, will be used in this
project to ensure the final cell loading.
Encapsulation is a technique used with composite membranes to protect sensitive
microorganisms from being poisoned (12). Existing capsulation methods have been
summarized in Park & Chang’s paper (288). Generally, this technique is
accomplished by incorporating the active ingredients in the matrix, emulsifying the
mixture into microcapsules, and then stabilizing these microcapsules (288). A
formed microcapsule has a liquid core, in which Clostridium sp. cells are grown,
surrounded by a spherical polymeric membrane. Compared to the entrapment, this
method enhanced the stability of the membrane which provides the cells with
sufficient protection. Smaller droplets will improve the mass transport of the cell,
increase the cell loadings and enhance the control of the working parameters.

60
Figure 2.14 Immobilization of cells (285)

61
Chapter 3
MATERIALS AND METHODS
3.1 Microbial Species and Media
Both the C. thermocellum (ATCC 27405) and C. thermolacticum (ATCC 43739) used
for this study were obtained from the American Type Culture Collection (ATCC).
Media was prepared as described by He et al. (2009). The basic media was used for
both strains unless otherwise noted. All media were prepared using standard
anaerobic techniques under controlled conditions (80%N2/20%CO2). The redox
potential decrease in media was tested using resazurine which changes from reddish
pink to light yellow if reduced.
Cultures were maintained in standard media containing either a paper strip
(Whatman No.1) or sucrose (Sigma-Aldrich). The cultures were stored in the
refrigerator and were subcultured once every month. The purity of the microbes
was regularly checked under the microscope.
3.2 Substrate
Sterilized anaerobic fermentation substrate solutions containing glucose
(Sigma-Aldrich), xylose (Sigma-Aldrich), cellobiose (Sigma-Aldrich), microcrystal
cellulose (Sigma-Aldrich), or hemicellulose (Kaufert Lab, University of Minnesota,
Saint Paul, MN) were added after autoclaving the medium.
3.3 Growth of Organisms
A low initial substrate/medium ratio (1% w/v) was used and a 5 mL homogeneous

62
microbe culture with a cell weight of 5 g/L was transferred into 100 mL serum
bottles containing 50 mL of medium prepared under anaerobic conditions unless
otherwise noted. For the co-culture, the inoculation was performed by adding 2.5
mL of 5 g/L C. thermocellum and 2.5 mL of 5 g/L C. thermolacticum per 50 mL
prepared medium. Cultures incubated for 10 days at 57 °C without shaking were
analyzed for the end-products (ethanol and acetate). Fermentations on each
substrate without adjusting the pH and without adding exogenous ethanol were used
as controls and mixtures with only medium and substrates were used as blanks.
Triplicates were conducted for each treatment.
3.4 Determination of Cell Mass
The turbidities of the cultures were determined with a spectrophotometer
(Sequoia-Turner Model 340) at 575 nm using a 13mm path length test tube. The
dry cell density was determined by the relationship between dry cell weight and
opacity density (O.D.). Based on this test (original data not shown), the
relationships were found to be:
Clostridium thermolacticum 1 unit of O.D. change = 1.1 g dry cell/L
Clostridium thermocellum 1 unit of O.D. change = 0.5 g dry cell/L
3.5 Biomass Characterization
A characterization of aspen wood powder was done to provide fundamental
information about the structure of the substrates for this project. The substrates, one
of the major factors, during CBP fermentation for this project can be determined
according to a standard characterization test (289). Aspen wood chips were

63
commercial chips received from the SAPPI Mill in Cloquet, MN. Wood chips were
air dried and ground using a Thomas-Wiley Mill. The fractions pass through an
80-mesh screen to ensure uniform surface area. Prepared materials are stored in
sealed serum bottle for further use. The composition of biomass was determined
according to the NREL standard method (289).
3.6 Encapsulation
The encapsulation process was performed according to Klein’s method (290, 291).
2.5% (w/v) microbe cells were mixed with calcium chloride in a beaker and then the
cell mixture was dropped into 1 L 0.25 M sodium alginate solutions through a 23
gauge syringe needle (3 mm) at the rate of 1.5 drop/sec (292). Calcium alginate
capsules were formed immediately by ionic interaction. After 5 minutes the gelatin
pellets were removed and washed. During this project, concentration of alginate,
calcium and other gel-forming polymers were adjusted if the pore size, wall
thickness and mechanical strength needed to be changed. The entire encapsulation
process was conducted under anaerobic and sterile conditions.
3.7 Lignin preparation (Organosolv pulping)
The organosolv pulping was performed in a 2 L Parr Bench Top Reactor (Series
4520). In each batch, 100 g aspen was pulped with an ethanol and water mixture.
The ratio of ethanol and water was 6:4. The ratio of liquor to aspen was 13:1.
0.1% of MgSO4 was added to the liquor to promote lignin removal. After the aspen
chips were placed inside the reactor, the ethanol/water mixture was added, and the lid
of the reactor was sealed. Then, the temperature of the reactor was increased to and
maintained at 190ºC for three hours. Afterward, the reactor vessel was cooled

64
down to room temperature. The reactor was opened and the aspen chips drained in
a Buchner funnel. The remaining material was rinsed with the same ratio
ethanol/water mixture. Bundles of the fiber were separated in a British disintegrator.
The separated mixture and washing liquid was collected, ethanol was removed by
storing the liquid in a chemical hood for two days allowing the participation the
organosolv lignin. Participated organosolv lignin was filtered through a British
disintegrator and air dried.
3.8 Analytical Methods
End products (ethanol and acetate yield) in the water phase were determined using a
Waters high performance liquid chromatograph unit (HPLC) with a Bio-Rad Aminex
HPX-87H column with a de-ashing BIO-RAD Micro-guard refill cartridge filter.
The column temperature was set to 30 °C and the detector temperature was set to 50
°C. Waters 2414 refractive index detector and Waters 2478 dual λ absorbance
detector are used. Distilled water was used as the mobile phase delivered at the
flow rate of 0.5 mL/min, with a sample injection volume of 5 µL. Calibration
curves were generated using pure ethanol and acetate (Sigma-Aldrich) and the
culture medium. Percentages of yields for final products were calculated in relation
to original saccharides addition.
Weights of the samples (oven dried) were recorded as the inputs of the samples.
After fermentation under certain conditions, the fermented wood samples were
weighed (oven dried) again as output weights. The yield of each sample was
calculated as:
Yield (%) = (input weight / output weight) X 100%.

65
3.9 Calculation of theoretical ethanol yield
Based on hydrolysis and fermentation reaction equations of pentose:
(C5H8O4)n + nH2O n C5H10O5
3 C5H10O5 5 C2H5OH + 5 CO2
3 C5H10O5 4 C2H5OH + 7 CO2
The theoretical ethanol yields of pentoses were calculated as (10):
% minimum theoretical yield = % of xylan x 1.136 x 0.40 (g ethanol/ g biomass)
% maximum theoretical yield= % of xylan x 1.136 x 0.51 (g ethanol/ g biomass)
% maximum theoretical yield= % of xylose x 0.51 (g ethanol/ g biomass)
Based on hydrolysis and fermentation reaction equations of hexoses:
(C6H10O5)n + nH2O n C6H12O6
C6H12O6 2 C2H5OH + 2 CO2
The theoretical ethanol yield of hexose was calculated as (10):
% maximum theoretical yield = % of cellulose x 1.11 x 0.51 (g ethanol/ g biomass)
% maximum theoretical yield= % of glucose x 0.51 (g ethanol/ g biomass)
66
Chapter 4
RESULTS AND DISSCUSSION
4.1 Preliminary test for parameters determination
The preliminary study was performed before the main research to gain a fundamental
knowledge of the strains and substrates used. Although other investigators have
reported the effect of pH on the ethanol yield for these strains using several
substrates, the correlations changes caused by the chosen medium and culture
conditions are barely studied. The other focus of these preliminary experiments
was to determine the pH range and substrate types for this study based on the culture
collections obtained and cultivation condition applied.
4.1.1 Biomass Characterization and Fermentation of various Substrates
The chemical composition of the prepared aspen sample is shown in Figure 4.1. In
this figure, the glucan mainly originates from cellulose degradation and xylan from
hemicellulose degradation. As shown in the figure, glucan and xylan comprise over
60% of the aspen which indicates that cellulose and hemicellulose are the major
components within the aspen sample. Since the ethanol production in
lignocellulosic microbial fermentation in this study is based on conversion of
saccharides, the degradation of the major sacchrides is most critical. Thus, in order
to analyze the effect of major fermentation parameters, such as pH and ethanol or
substrate concentration on the process, these effects were studied using cellulose,
hemicellulose and their mono- or di-saccharides intermediates. The major
intermediates include glucose, cellobiose, and xylose. The effect of minor
sacchrides like arabinan, mannan and galactan, however, were not considered in this

67
study.
12.7
0.5
21.1
1.3
0.5
1.7
17.7
44.5
0 5 10 15 20 25 30 35 40 45 50
Others
Ash
Lignin
Galactan
Arabinan
Mannan
Xylan
Glucan
Com
pone
nts
Aspen Wood Amount %
Figure 4.1 Chemical compositions of aspen
The reported capability to digesting the five chosen substrates (glucose, cellubiose,
xylose, xylan, microcrystalline cellulose) for C. thermocellum and C. thermolacticum
varies in previous reports due to the lack of uniform cultivation conditions (13, 216).
Therefore, in this project, the wild type C. thermocellum strains ATCC 27405 and C.
thermolacticum strain ATCC 43739 were grown in the standard medium provided by
ATCC on filter paper and sucrose separately at 60 °C for 10 days. Figure 4.2 and
Figure 4.3 show the average amount of ethanol and acetate produced by fermenting
cellulose and xylan in this study. As can be seen, C. thermolacticum and C.
thermocellum are both able to utilize crystalline cellulose, commercial cellulose
powder (both crystalline and amorphous cellulose) and part of the xylan to produce
ethanol. For both fermentations, the ethanol yield is extremely low when xylan is
used as the sole carbon source. This difference in ethanol yield can be explained by
the differences in enzymatic activities in these two strains. The average amounts of

68
ethanol and acetate produced by fermenting cellobiose, xylose, and glucose are
reported in Figure 6 and Figure 4.4. Both strains C. thermolacticum and C.
thermocellum can properly convert these substrates directly into a considerable
amount of ethanol and acetate, and the amounts of end-products are considerable for
these fermentations.
These results all imply that C. thermocellum and C. Thermolacticum can utilize all
the chosen substrates. Since the fermentation for each substrate leads to
considerable amounts of ethanol or acetate, understanding the degradation
mechanisms and growth limitations for each strain on each substrate is necessary to
best utilize these strains to enhance the efficiency of CBP fermentation.
1.57
1.84
0.36
2.02 1.97
0.31
0
0.5
1
1.5
2
2.5
Micro-Crystal Cellulose Cellulose Xylan
Substrates
Pro
duct
Co
ncen
trat
ion
(mM
)
Ethanol (mM) Acetate (mM)
Figure 4.2 Ethanol and acetate productions from C. thermolacticum (ATCC 43739) fermentation of various polysaccharides at 60ºC for 10 days

69
2.01
1.18
0.06
2.65
1.74
0.23
0
0.5
1
1.5
2
2.5
3
Micro-Crystal Cellulose Cellulose Xylan
Substrates
Pro
duct
Con
cent
ratio
n (m
M)
Ethanol(mM) Acetate (mM)
Figure 4.3 Ethanol and acetate productions from C. thermocellum (ATCC 27405) fermentation of various polysaccharides at 60ºC for 10 days
24.68
19.06
9.86
0.80 0.32
15.53
11.65
8.71
3.10
0.68
0.00
5.00
10.00
15.00
20.00
25.00
30.00
Cellobiose Xylose Sucrose Aspen Glucose
Substrate
Pro
duct
Con
cent
rati
on (
mM
)
Ethanol (mM) Acetate (mM)
Figure 4.4 Ethanol and acetate productions from C. thermolacticum (ATCC 43739) fermentation of various sole carbon sources at 60ºC for 10 days

70
2.55
1.97
1.39
0.000.00
0.78
1.13
2.66
1.25
3.29
0.00
0.50
1.00
1.50
2.00
2.50
3.00
3.50
Xylose Cellobiose Sucrose Aspen Glucose
Substrate
Pro
duct
Con
cent
rati
on (
mM
)
Ethanol (mM) Acetate (mM)
Figure 4.5 Ethanol and acetate productions from C. thermocellum (ATCC 27405) fermentation of various sole carbon sources at 60ºC for 10 days 4.1.2 Co-culture Ratio
Application of the co-culture was examined in this study. However, the ratio of C.
thermocellum and C. thermolacticum are critical for the fermentation efficiency due
to the different enzymatic activities between these two strains. By adjusting the
ratio of these two co-culture components, the portion of enzymes like cellulase and
xylase are dramatically changed. As a result, in order to improve the
synchronization effect of these two microbes, optimum portion of C. thermocellum
and C. thermolacticum added during fermentation was determined. Various ratios
of C. thermocellum and C. thermolacticum co-cultures were added for fermentations
at 57 ºC on a mixture of filter paper and sucrose solution. After ten days reaction
time, a 1:1 ratio for C. thermocellum and C. thermolacticum led to the highest
ethanol production. The ethanol production efficiency was significantly lower in
the C. thermocellum/C. thermolacticum co-cultures at all other ratios tested (1:9, 2:8,

71
3:7, and 4:6) (Figure 4.6). Even with 10% change of the microbes’ ratio, about 28%
of the ethanol production decrease was detected. The more these addition rates of
these two strains varied from the 1:1 ratio, the less ethanol production efficiency was
observed. These results show that the promotion of co-culture fermentation
efficiency requires relatively equal amount of C. thermocellum and C.
thermolacticum. When one of the strain is notably domain in the co-culture (over
80%), extremely low ethanol production concentrations were obtained, which were
close to the mono-culture fermentation efficiencies. To determine whether the
ethanol production efficiency recessions were a result of the death of the minority
strain, the microorganisms remaining in fermentation mixture were subcultured into
the standard medium with sole carbon source (paper or xylose) that can only support
one species to survive. The growth of the minority strains were significantly halted
in those severely unbalanced-ratio co-cultures as compared to balanced-ratio
co-culture and mono-cultures. This result suggests the decreased ethanol
production was most likely due to the suppression of the minority microbes’ growth
possibly causing by the competitions between these strains at the beginning of the
fermentations.
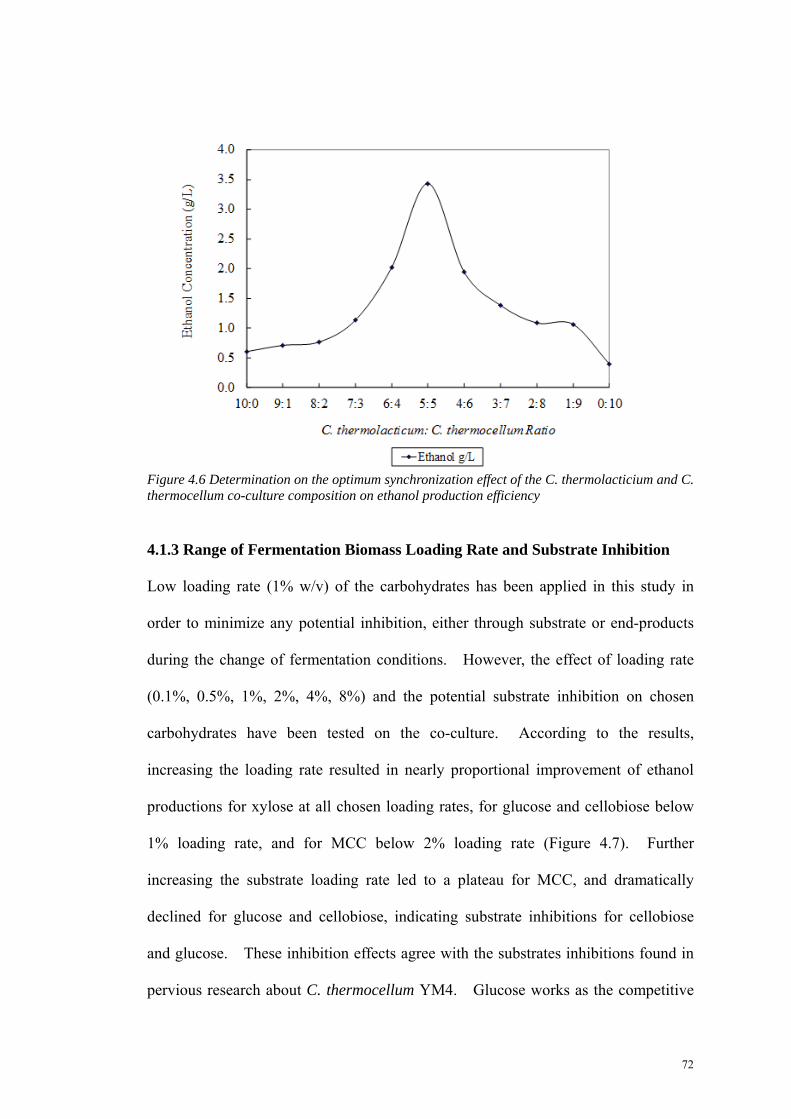
72
Figure 4.6 Determination on the optimum synchronization effect of the C. thermolacticium and C. thermocellum co-culture composition on ethanol production efficiency
4.1.3 Range of Fermentation Biomass Loading Rate and Substrate Inhibition
Low loading rate (1% w/v) of the carbohydrates has been applied in this study in
order to minimize any potential inhibition, either through substrate or end-products
during the change of fermentation conditions. However, the effect of loading rate
(0.1%, 0.5%, 1%, 2%, 4%, 8%) and the potential substrate inhibition on chosen
carbohydrates have been tested on the co-culture. According to the results,
increasing the loading rate resulted in nearly proportional improvement of ethanol
productions for xylose at all chosen loading rates, for glucose and cellobiose below
1% loading rate, and for MCC below 2% loading rate (Figure 4.7). Further
increasing the substrate loading rate led to a plateau for MCC, and dramatically
declined for glucose and cellobiose, indicating substrate inhibitions for cellobiose
and glucose. These inhibition effects agree with the substrates inhibitions found in
pervious research about C. thermocellum YM4. Glucose works as the competitive

73
inhibitor of Alpha-D-Glucose-1-Phosphate (G-1-P), Cellobiose works as the
competitive inhibitor of phosphate (Pi), and these two pairs of competences
competes with the Cellobiose Phosphorylase (CBP) active site (293). In this case,
the existence of excessive amount of glucose or cellobiose will disturb the hexose
metabolism pathway, so that less ethanol will be produced. (293)
0
0.2
0.4
0.6
0.8
1
1.2
1.4
1.6
0 1 2 3 4 5 6 7 8 9
Eth
anol
Con
cent
rati
on (
g/L
)
Carbohydrate Loading Rate (%)
Glucose Cellobiose MCC Xylose
Figure 4.7 Effect of biomass loading rate on ethanol production efficiency
4.1.4 Range of Initial Ethanol Concentration
The pH and the ethanol concentrations are the major influencing factors during the
fermentation process. Extremely high ethanol concentrations in the fermentation
cultures have been proven to inhibit or depress the fermentation process. A growth
inhibition at ethanol levels of less than 3% v/v (207, 227) has been reported for C.
thermocellum. Ten grams per liter was the highest ethanol tolerance reported for C.
thermolacticum (ATCC 43739) (16), although these sensitivities depend on the way
experiments are completed. Nevertheless, no higher ethanol tolerance has been

74
reported for these wild type strains. Thus, in this research, the maximum ethanol
tolerance was examined for the fermentation processes using these two strains. We
found that initial ethanol equivalent of 8 g/L and 16 g/L are the highest ethanol
concentration C. thermocellum and C. thermolacticum can tolerate separately (Figure
4.8). Any sample exposed to an ethanol level over 16 g/L, showed no strain growth
because of the irreversible change of cell membrane lipids through ethanol, as
discussed by Baskaran (294).
0
0.5
1
1.5
2
2.5
3
3.5
4
4.5
0 5 10 15 20
Initial Ethanol Concentration (g/L)
Eth
anol
Con
cent
rati
on (
g/L
)
C.thermocellum C.thermolacticum Co-culture
Figure 4.8 Effect of initial ethanol concentration on ethanol production efficiency
4.1.5 Range of Initial pH Value
To narrow down the pH range for this project, the wild type C. thermolacticum strain
ATCC 43739 was grown in our preliminary tests on the standard medium provided
by ATCC and on sucrose at 60 °C for 10 days. The pH of the medium was adjusted

75
from 2.0 to 12.5. Figure 4.9 summarizes the pH effect on ethanol and acetate
production for C. thermolacticum fermentation using sucrose as the sole carbon
source (standard culture substrate). As shown in this figure, the ethanol and acetate
yields are dramatically influenced by the medium pH. PH=7 is the optimum pH for
the ethanol production from sucrose. At both acidic conditions and alkaline
conditions, the yield of ethanol and acetate increase as the pH approaches 7.0.
Although the ethanol and acetate yields are lower at other pH values, between pH=5
to pH=9, a considerable amount of ethanol and acetate are still detected. Few
conversion products are observed under extremely high or low pH conditions
because these conditions lower the viability of the microbes’ cells and inhibit the
growth of the cell.
1.500.87
8.68
11.18
4.50
1.04
0.000.00
0.81
0.00
8.55
5.00
0.920.40
0.00
2.00
4.00
6.00
8.00
10.00
12.00
2.00 3.00 5.00 7.00 9.00 11.00 12.50
Medium PH
Pro
duct
Con
cent
rati
on (
mM
)
Ethanol (mM) Acetate (mM)
Figure 4.9 Ethanol and acetate yield from C. thermolacticum (ATCC 43739) fermentation at different pH value at 60ºC for 10 days
For the C. thermocellum strain ATCC 27405, previous papers have reported that wild
type C. thermocellum grows better when the pH is between 7 and 10 (229). When
76
the pH value was over 11, acetate and lactate productions decreased dramatically and
when the pH value was lower than 6, no growth was detected (229). As a result,
taking both strains into account, the pH range of this research was set to pH=5-10.
4.1.6 Concentration of Alginate and Calcium Chloride
4.1.6.1 Concentration of Alginate and Beads Leakage
As described in the introduction section, we propose to use encapsulation of C.
thermocellum and C. thermolacticum by calcium alginate, a mild matrix for living
cells, to attempt to achieve high ethanol tolerance for the lignocellulosic biomass
fermentation. The porosity of the gel is determined by the concentration of sodium
alginate, calcium chloride, as well as other chemicals within the medium. It is
reported that entrapment of chemicals including flavin, nicotinamide, and
cytochrome in the medium will diffuse 1% (w/v) of gel out of the alginate gel (295).
In this case, more extensively polymerized alginate gel is necessary; this can be
achieved by increasing the concentration of sodium alginate or calcium chloride. In
order to determine the appropriate concentration of sodium alginate, addition of 0.5%,
1%, 2%, 3%, 4%, and 5% of sodium alginate were examined for encapsulation.
According to the fermentation results, 0.5% and 1% of sodium alginate were not able
to form appropriate alginate gels due to lack of polymerization. These formless
gels were not able to hold microbes within the structures, leading to considerable
amount of leakage of cells during fermentation. 2% of the sodium alginate was the
minimum alginate concentration which resulted in the appropriate shape of alginate
beads. However, at 2% concentration, the polymerization is still not extensive
enough. A small amount of leakage of Clostridium spp spores was detected in the
fermentation systems. By increasing the alginate concentration over 4%, cell

77
leakages were no longer observed but the fermentation reactions were significantly
reduced. The ethanol production dropped about 20% when the alginate
concentration is increased from 3% to 4%. Further increase of the alginate
concentration led to further loss of cell actives, due to the increase of internal
diffusion limitations. If larger pellets were formed, the substrate equilibrium was
reached slower than when higher alginate concentration was used.
4.1.6.2 Calcium Chloride Toxicity
Calcium chloride concentration is another critical factor in adjusting the
polymerization of alginate pellets. Nevertheless, high calcium ion concentration
has been shownto affect the growth of Clostridium co-cultures (293). As a result,
the effect of calcium chloride concentration was tested on ethanol production during
immobilized cells fermentation on cellobiose at pH=7. Figure 4.10 indicates that
within the chosen concentration (1% -10%), the co-culture is not inhibited.
Contrarily, by increasing the calcium chloride concentration from 1% to 3%, the
ethanol production was increased by over 30%, suggesting that addition of calcium
chloride is beneficial for Clostridium co-culture fermentation. This effect might be
caused by the alkalinity of calcium chloride which would keep the medium pH
relatively stable. In addition, the existence of Ca2+ would also improve the
metabolism of the co-culture (296). Further increase of the calcium chloride
concentration past 3% is not able to enhance the solvent production significantly.
Thus, the lowest calcium chloride concentration (3%) leading to the higher solvent
production improvement during fermentation is chosen for the encapsulation in this
study.

78
Figure 4.10 Effect of calcium chloride concentrations on fermentation production concentrations on cellobiose fermentation at pH=7 57ºC for 10 days 4.1.7 Organosolv Lignin toxicity
Lignin and lignin fragments are the other potential inhibitors within the
lignocellulosic complex. Thus, in this study, the effects of lignin on the ethanol
production efficiency were examined.
Organosolv lignin is closer to the native lignin structure than other types of lignin,
such as Kraft lignin (297). In addition it does not contain sulfur in any form.
Similar functional groups in organosolv lignin lead to similar response towards
reactants than naturally occurring lignin. As a result, organosolv lignin is used to
exam the effect of lignin on fermentation efficiency. Figures 4.11-4.18 show the
ethanol and acetate production changes caused by addition of several levels of
organosolv lignin on carbohydrate fermentations (glucose, xylose, cellobiose and

79
MCC). Both, ethanol and acetate productions for all substrates were not
significantly changed through addition of lignin regardless of the addition rate,
suggesting that the organosolv lignin is not a significant inhibitor for the co-culture
fermentation process. However, although the structure and properties of organosolv
lignin is close to naturally occurring lignin, lignin modifications still occurred during
lignin extraction. Thus, naturally occurring lignin still has the potential to influence
the fermentation process.
Figure 4.11 Effect of organosolv lignin on ethanol production during cellobiose fermentation at 57ºC pH=7 for 10 days

80
Figure 4.12 Effect of organosolv lignin on acetate production during cellobiose fermentation at 57ºC pH=7 for 10 days
Figure 4.13 Effect of organosolv lignin on ethanol production during micro crystal cellulose fermentation at 57ºC pH=7 for 10 days

81
Figure 4.14 Effect of organosolv lignin on acetate production during micro crystal cellulose fermentation at 57ºC pH=7 for 10 days
Figure 4.15 Effect of organosolv lignin on ethanol production during glucose fermentation at 57ºC pH=7 for 10 days

82
Figure 4.16 Effect of organosolv lignin on acetate production during glucose fermentation at 57ºC pH=7 for 10 days
Figure 4.17 Effect of organosolv lignin on ethanol production during xylose fermentation at 57ºC pH=7 for 10 days

83
4.18 Effect of organosolv lignin on ethanol production during xylose fermentation at 57ºC pH=7 for 10 days
4.2 Free cell fermentation
In order to analyze the effect of major fermentation parameters on the CBP
fermentation, the conversions of selected materials such as cellulose, xylan and their
mono- or di-saccharide intermediates are investigated. The major saccharides
include glucose, cellobiose, and xylose. The effect of minor saccharides such as
arabinose mannose and galactose, however, are not considered in this study. Both
strains produce ethanol, acetate and hydrogen. But depending on the conditions, the
product distribution varies. Preliminary studies were performed with both
mono-cultures at different substrate concentrations, initial ethanol concentrations,
and pH values. 1% w/v substrate loading proved to be the most suitable for
fermentation for both strains, which agrees with earlier studies (298). Initial
ethanol equivalent of 16 g/L is the highest ethanol concentration both strains can

84
tolerate. Any sample exposed to an ethanol level over 16 g/L, showed no strain
growth because of the irreversible change of cell membrane lipids through ethanol,
as discussed by Baskaran (294). It is also observed that a pH between 5 and 10
leads to the production of ethanol and acetate, any pH below or above appears to be
unsuitable for the viability of the cells. The influences of pH, ethanol concentration
and substrate types were further compared between C. thermocellum/C.
thermolacticum mono-cultures and co-culture fermentation.
4.2.1 Benefit of co-culture fermentation
This study clearly demonstrated the advantage of applying a co-culture in CBP
fermentations to improve the ethanol production for selected substrates (299). It
demonstrated the potential of using simultaneous C. thermocellum/C.
thermolacticum co-culture to convert components of lignocellulosics directly into
ethanol and acetate. To examine tolerance towards ethanol concentration varying
amounts of ethanol were added at the beginning of the fermentation step. Initial
ethanol levels of up to 4 g/L were not only tolerated, but actually resulted in
improved ethanol production. Although this co-culture is unable to shift the
heterofermentative pathway into a homofermentative pathway or at least decrease the
acetate production, ethanol production is significantly increased compared to the
mono-cultures. Almost all the ethanol yields obtained from co-culture fermentation
are above any of its mono-culture fermentation yields, often almost tripled as
compared to the mono-cultures under identical conditions. The only exceptions are
the experiments at pH=7 to pH=9 for the substrate glucose. The optimum acetate
by-product generation, which occurs in smaller concentrations of mostly below 1 g/L,
turns out to lie in the same narrow range irrespective of the substrate or pH value
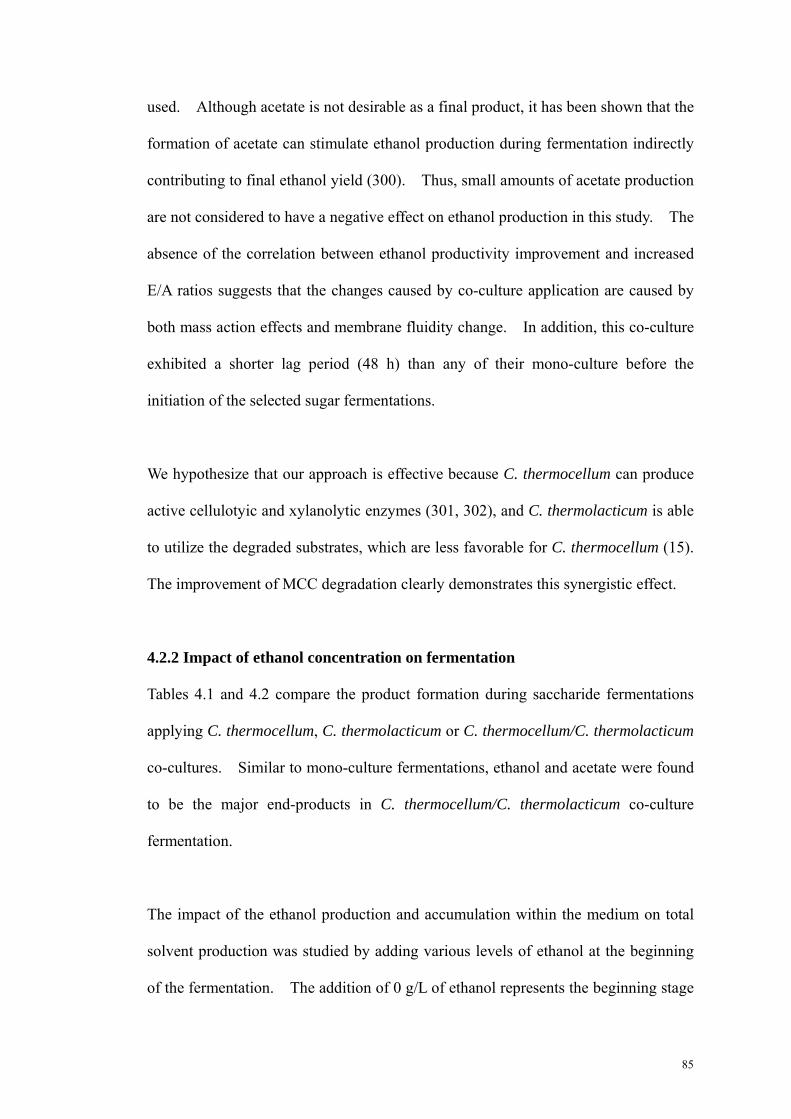
85
used. Although acetate is not desirable as a final product, it has been shown that the
formation of acetate can stimulate ethanol production during fermentation indirectly
contributing to final ethanol yield (300). Thus, small amounts of acetate production
are not considered to have a negative effect on ethanol production in this study. The
absence of the correlation between ethanol productivity improvement and increased
E/A ratios suggests that the changes caused by co-culture application are caused by
both mass action effects and membrane fluidity change. In addition, this co-culture
exhibited a shorter lag period (48 h) than any of their mono-culture before the
initiation of the selected sugar fermentations.
We hypothesize that our approach is effective because C. thermocellum can produce
active cellulotyic and xylanolytic enzymes (301, 302), and C. thermolacticum is able
to utilize the degraded substrates, which are less favorable for C. thermocellum (15).
The improvement of MCC degradation clearly demonstrates this synergistic effect.
4.2.2 Impact of ethanol concentration on fermentation
Tables 4.1 and 4.2 compare the product formation during saccharide fermentations
applying C. thermocellum, C. thermolacticum or C. thermocellum/C. thermolacticum
co-cultures. Similar to mono-culture fermentations, ethanol and acetate were found
to be the major end-products in C. thermocellum/C. thermolacticum co-culture
fermentation.
The impact of the ethanol production and accumulation within the medium on total
solvent production was studied by adding various levels of ethanol at the beginning
of the fermentation. The addition of 0 g/L of ethanol represents the beginning stage

86
of the fermentation when no ethanol has been produced. By adding ascending
amounts of ethanol from 0.5 g/L to 4 g/L at the start, this study simulated the ethanol
accumulation progress as a sequence of the continuous fermentation. Compared to
the mono-culture fermentations, C. thermolacticum/C. thermocellum co-culture
fermentation lead to higher ethanol production when the original ethanol
concentration at the start of the fermentation is around 4 g/L for all substrates used
under all pH values (Table 4.1, 4.2, Figure 4.19-4.22). However, the increase of
ethanol yield caused by applying a co-culture was observed not to correlate to
ethanol/acetate ratio improvement.

87
Table 4.1 Effect of initial ethanol addition (0-4 g/L) and substrate types on ethanol production (g/L) at pH=9 for C. thermocellum mono-culture, C. thermolacticum mono-culture and co-culture fermentations. The ethanol and acetate productions are the average value of triplicates runs under each chosen condition. SD is the standard deviation of the replicates of each condition.
C. thermocellum C. thermolacticum Co-culture
Initial Ethanol g/L
Ethanolg/L
SD Ethanol
g/L SD
Ethanol g/L
SD
Glucose 0 0.476 0.004 0.028 0.001 0.285 0.005
0.5 0.839 0.029 0.038 0.001 0.194 0.004
1 1.229 0.005 0.043 0.004 0.965 0.003
2 2.000 0. 019 0.071 0.003 1.189 0.001
4 2.638 0.050 0.116 0.004 1.358 0.001
Cellobiose 0 0.399 0.001 0.036 0.003 0.258 0.003
0.5 0.738 0.010 0.046 0.002 0.503 0.001
1 1.128 0.030 0.058 0.006 1.427 0.008
2 1.615 0.037 0.072 0.004 1.750 0.002
4 1.673 0.033 0.112 0.003 3.163 0.001
MCC 0 0.016 0.009 0.004 0.001 0.430 0.001
0.5 0.144 0.004 0.016 0.001 0.582 0.001
1 0.304 0.006 0.032 0.001 1.109 0.006
2 0.680 0.004 0.066 0.008 1.935 0.005
4 1.339 0.006 0.104 0.002 3.811 0.032
Xylose 0 0.000 0.000 0.026 0.001 0.226 0.003
0.5 0.000 0.000 0.033 0.001 0.200 0.007
1 0.000 0.000 0.037 0.001 0.217 0.001
2 0.000 0.000 0.064 0.004 0.754 0.010
4 0.000 0.000 0.097 0.083 4.539 0.011
Hemicellulose 0 0.000 0.000 0.001 0.000 0.007 0.000
(Xylan) 0.5 0.000 0.000 0.002 0.000 0.008 0.001
1 0.000 0.000 0.001 0.001 0.006 0.001
2 0.000 0.000 0.002 0.001 0.021 0.001
4 0.000 0.000 0.000 0.000 0.053 0.001

88
Table 4.2Effect of initial ethanol addition (0-4 g/L) and substrate types on acetate production (g/L) at pH=9 for C. thermocellum mono-culture, C. thermolacticum mono-culture and co-culture fermentations. The ethanol and acetate productions are the average value of triplicates runs under each chosen condition. SD is the standard deviation of the replicates of each condition.
C. thermocellum C. thermolacticum Co-culture
Initial Ethanol g/L
Acetateg/L
SD Acetate
g/L SD
Acetate g/L
SD
Glucose 0 0.689 0.007 0.028 0.001 0.533 0.001
0.5 0.672 0.001 0.026 0.001 0.666 0.006
1 0.583 0.003 0.025 0.001 0.557 0.006
2 0.472 0.002 0.024 0.001 0.437 0.002
4 0.514 0.009 0.022 0.001 0.357 0.005
Cellobiose 0 0.433 0.005 0.027 0.002 0.649 0.003
0.5 0.403 0.006 0.029 0.001 0.643 0.003
1 0.307 0.006 0.028 0.002 0.616 0.008
2 0.424 0.003 0.026 0.002 0.526 0.002
4 0.468 0.001 0.027 0.001 0.491 0.008
MCC 0 0.040 0.001 0.009 0.001 1.117 0.001
0.5 0.043 0.002 0.007 0.002 1.026 0.002
1 0.042 0.001 0.006 0.002 0.976 0.001
2 0.041 0.002 0.005 0.002 0.651 0.001
4 0.041 0.001 0.007 0.002 0.648 0.002
Xylose 0 0.000 0.000 0.029 0.002 0.453 0.001
0.5 0.000 0.000 0.028 0.001 0.397 0.001
1 0.000 0.000 0.027 0.002 0.374 0.001
2 0.000 0.000 0.027 0.002 0.373 0.004
4 0.000 0.000 0.028 0.002 0.332 0.001
Hemicellulose 0 0.000 0.000 0.065 0.009 0.010 0.001
(xylan) 0.5 0.000 0.000 0.064 0.006 0.011 0.001
1 0.000 0.000 0.055 0.008 0.010 0.001
2 0.000 0.000 0.054 0.003 0.010 0.001
4 0.000 0.000 0.000 0.002 0.009 0.001

89
Figure 4.19 Effect of pH on ethanol production at 4 g/L initial ethanol level for MCC fermentation at 57ºC for 10 days
Figure 4.20 Effect of pH on ethanol production at 4 g/L initial ethanol level for cellobiose fermentation at 57ºC for 10 days

90
Figure 4.21 Effect of pH on ethanol production at 4 g/L initial ethanol level for xylose fermentation at 57ºC for 10 days
Figure 4.22 Effect of pH on ethanol production at 4 g/L initial ethanol level for glucose fermentation at 57ºC for 10 days

91
While the ethanol production by C. thermolacticum mono-culture and co-culture are
significantly enhanced through exposure to initial ethanol levels up to 4 g/L on all
substrates and at all pH values (Table 4.1, Figure 4.19), for C. thermocellum the
positive effect of the initial ethanol appeared to be dependent on pH and substrate.
If cellobiose is added as the sole carbon source, the positive correlation between
initial ethanol addition and final ethanol concentration is terminated when the ethanol
concentration approaches 2 g/L. As the ethanol concentration exceeds 2 g/L no
additional positive effect on final ethanol yield is observed (Figure 4.23). For
glucose and MCC fermentation, the ethanol production continues to increase as the
initial ethanol concentration rises (Figure 4.24, 4.25). On the other hand, the
production decline of acetate stopped at 2 g/L of initial ethanol level, and bounces
back up slightly at 4 g/L initial ethanol level. In general, a higher initial ethanol
level favors the ethanol production for both cultures and the co-culture and is
accompanied by a lower acetate yield (Table 4.2). At the optimized condition, the
ethanol production in MCC co-culture fermentation increases from 1.0 g/L at an
initial ethanol level of 0 g/L to 3.8 g/L at an initial ethanol level of 4 g/L, an
improvement of more than 3 g/L. Moreover, for ethanol yields in xylose co-culture
fermentations, the increase reached over 4 g/L by increasing the initial ethanol
concentration from 0 g/L to 4 g/L (Figure 4.26). The initial ethanol might
contribute to changed fermentation in two ways: changing the metabolism pathway
or changing the cell membrane fluidity (303).

92
Figure 4.16 Effect initial ethanol concentrations on cellobiose fermentation at pH=9, 57ºC for 10 days
Figure 4.17 Effect initial ethanol concentrations on MCC fermentation at pH=9, 57ºC for 10 days

93
Figure 4.18 Effect initial ethanol concentrations on glucose fermentation at pH=9, 57ºC for 10 days
Figure 4.19 Effect initial ethanol concentrations on xylose fermentation at pH=9, 57ºC for 10 days

94
It is proven that the presence of ethanol will change the fatty acid composition of the
cell membrane of Clostridium sp., which leads to higher cell membrane fluidity
(303). Under extreme ethanol concentrations, which is over 8-16 g/L in this study,
this fluidity change will lead to the blockage of the glycolysis, and results in low
solvent production (304).
It is also conceivable that metabolic pathway regulation caused by the raising of the
initial ethanol level can lead to higher ethanol production. In the co-culture
fermentations, the enhancement of ethanol yield is accompanied with a decreased
acetate yield. This observation suggests that the initial existence of ethanol might
contribute to the shift of the co-culture fermentation pathway, shifting the
hetero-fermentation towards the ethanol production, while reducing acetate
production.
The other possible explanation is the interaction of the ethanol concentration and
optimum culture temperature. In this study, the C. thermocellum is the major
ethanol producer, the growth of C. thermocellum is extremely important. Previous
studies suggest that the optimum temperature for the C. thermocellum cultivation
will decrease with increasing ethanol or acetate concentrations within the medium
(298). In order to test the effect of initial ethanol concentration on optimal
temperature for this co-culture, the ethanol productions with the initial ethanol level
at 0% and 4% were examined for the co-culture fermentation at several temperatures
(55 ºC – 65 ºC). As shown in Figure 4.20-4.23, there was significant (p< 0.05)
difference in ethanol production under the different fermentation temperatures at
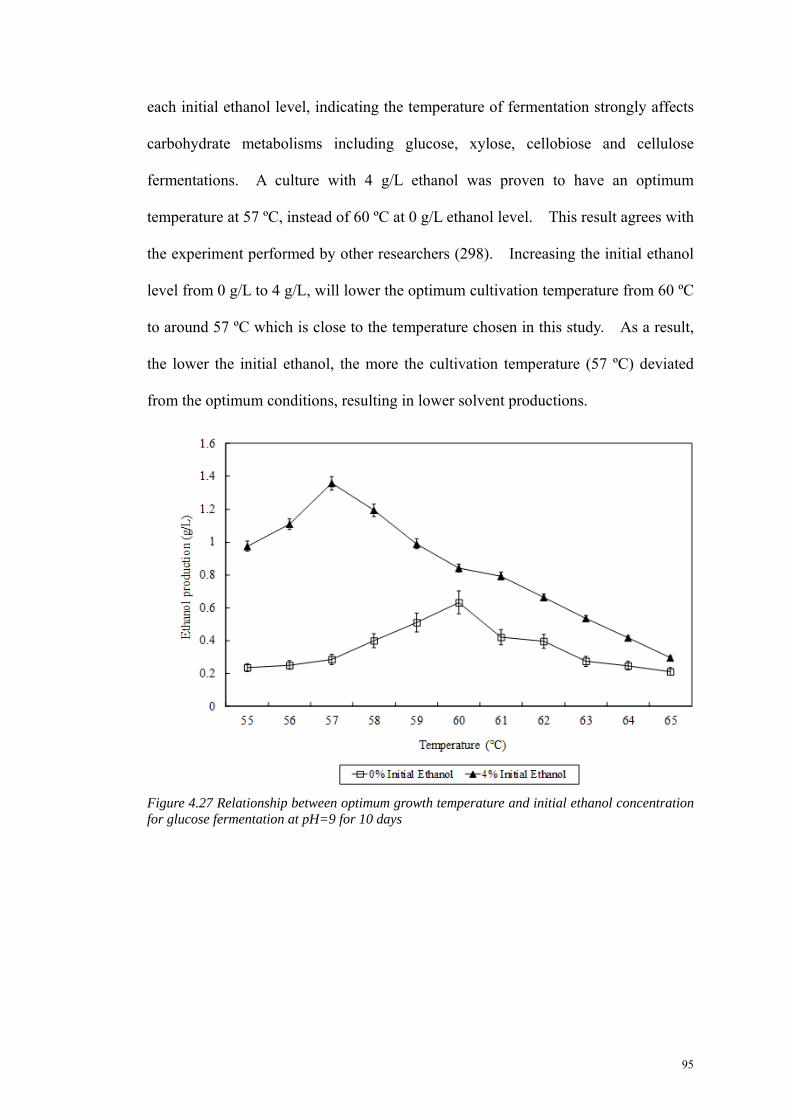
95
each initial ethanol level, indicating the temperature of fermentation strongly affects
carbohydrate metabolisms including glucose, xylose, cellobiose and cellulose
fermentations. A culture with 4 g/L ethanol was proven to have an optimum
temperature at 57 ºC, instead of 60 ºC at 0 g/L ethanol level. This result agrees with
the experiment performed by other researchers (298). Increasing the initial ethanol
level from 0 g/L to 4 g/L, will lower the optimum cultivation temperature from 60 ºC
to around 57 ºC which is close to the temperature chosen in this study. As a result,
the lower the initial ethanol, the more the cultivation temperature (57 ºC) deviated
from the optimum conditions, resulting in lower solvent productions.
Figure 4.27 Relationship between optimum growth temperature and initial ethanol concentration for glucose fermentation at pH=9 for 10 days

96
Figure 4.28 Relationship between optimum growth temperature and initial ethanol concentration for cellobiose fermentation at pH=9 for 10 days
Figure 4.29 Relationship between optimum growth temperature and initial ethanol concentration for MCC fermentation at pH=9 for 10 days

97
Figure 4.30 Relationship between optimum growth temperature and initial ethanol concentration for xylose fermentation at pH=9 for 10 days No obvious effect was detected beyond this initial ethanol level (4 g/L) within the
tolerance range. Further rising of the original ethanol concentration from 4 g/L to 8
g/L does not show additional improvement in solvent production for neither
mono-cultures nor co-culture. Higher ethanol concentrations will lead to the
termination of the fermentation. Increase of the initial ethanol concentration over 8
g/L stopped the fermentation activity completely for C. thermocellum, and the
co-culture. Initial ethanol concentrations over 16 g/L will terminate the activity of
C. thermolacticum.
4.2.3 Substrate selectivity
As shown in Table 4.1, 4.2, the substrate selection has significant impact on ethanol
and acetate yield for co-culture fermentation as well as for mono-culture

98
fermentations. Ethanol yield for C. thermocellum fermentation was non-detectible
for hemicellulose and xylose conversions. This finding agrees with previous results
demonstrating that C. thermocellum is unable to use xylose or xylan as sole carbon
sources (305). Cellobiose and glucose were metabolized preferentially for both
ethanol and acetate production. The efficiency of fermenting MCC is lower than
fermenting simple sugars, including cellobiose and especially glucose under alkaline
conditions (Figure 4.31, 4.32). Different from C. thermocellum, C. thermolacticum
can directly convert all the selected substrates (crystalline cellulose, glucose, xylose
and cellobiose) except xylan to ethanol and acetate. However, the proportions of
these two major products are dramatically different between these two strains. For
the conditions where the co-culture did not show any advantage, for example for
glucose conversion at pH=9, the end-products obtained from C. thermolacticum
fermentations were lower than product concentrations from C. thermocellum
fermentation. Only exception was the fermentation of xylose. Starting ethanol
concentration equal to 0 g/L at pH=6 is the only condition at which C.
thermolacticum produces more product than C. thermocellum (Figure 4.33). These
lower yields in C. thermolacticum fermentation can be explained by the media used
in this study, which is optimized for C. thermocellum growth. The solvent
production capacity of C. thermolacticum fermentation might not be fully utilized.

99
Figure 4.31 Effect of pH on ethanol production at 4 g/L initial ethanol level for co-culture fermentation on various substrates at 57ºC for 10 days
Figure 4.32 Effect of pH on acetate production at 4 g/L initial ethanol level for co-culture fermentation on various substrates at 57ºC for 10 days

100
Figure 4.33 Effect of pH on acetate production at 0 g/L initial ethanol level for xylose fermentation at 57ºC for 10 days
The innovative co-culture is extremely efficiently in fermenting separate components
of lignocellulosics for ethanol production. The substrates studied include cellulose,
cellobiose, and xylose, which can be explained by selective substrate utilization
ability observed in both strains. This improvement was most significant for ethanol
yield at pH=9 with high initial ethanol level (4 g/L). Under these conditions, the
ethanol yield from xylose was increased from 0.1 g/L for C. thermolacticum and 0
g/L for C. thermocellum to 4.5 g/L using the co-culture, which approaches 90% of
the theoretical xylose fermentation efficiency (Table 4.1). This agrees with former
studies showing the existence of cellulosic enzymes and xylanase in both strains (301,
302). The co-culture is extremely efficient in converting MCC to ethanol.
Ethanol yields from MCC fermentation were dramatically improved through the use
of a co-culture, from 1.4 g/L for C. thermocellum and 0.1 g/L for C. thermolacticum

101
to a maximum of 3.8 g/L fro the co-culture. This represents 1.5 mol of ethanol per
mol of sugar utilized for co-culture fermentation (around 75% of the theoretical
efficiency) (306), almost three times the ethanol yield of the combined mono-cultures.
For xylan and it fragments, an increase in the production of ethanol and acetate was
observed with the application of the co-culture. No effective enzymes capable of
fermenting high molecule weight xylan were reported in pervious studies for these
two strains, only xylanase that can utilize degraded or partially degraded xylan was
found (301, 302). In our case, the co-culture should only be able to utilize di- or
mono-saccharides, including xylose. Nevertheless, tiny amounts of polymeric
xylan are also consumed. Xylan fermentation appeared to be slower and less
effective than conversion of other fermentable sugars. This small portion of xylan
that was fermented is most possibly the modified xylan. The modifications like
acetyl group and other side chain removal, took place during xylan preparation made
part of the xylan more vulnerable to the enzymes. Thus, in this study, only small
portion of xylan has found digested. In this case, by applying the co-culture of C.
thermolacticum and C. thermocellum to lignocellulosic fermentation, optimization of
the conditions should focus on the degradation conditions for cellulosic material and
fragmentation of hemicellulose, mainly into xylose.
The polymerized hexoses appear to improve the fermentation end-product yields for
the co-culture, whereas it depresses the fermentation for the mono-cultures. For
fermentation applying a single strain, the substrate with simpler structure will be
preferred. The cellobiose and glucose, which have simpler molecular structures, are
more accessible than MCC since they don’t have access restricting crystalline areas.
This accessibility led to a higher microbial conversion which resulted in higher

102
solvent productions compared to MCC. This result is consistent with earlier
research suggesting that solubility can stimulate the fermentation (14).
It is clear that higher polymerization or lower solubility is able to initiate higher
ethanol production during co-culture fermentation as compared to monocultures.
For the co-culture increased utilization was observed for both cellobiose and MCC.
MCC is proven to be the best substrate for ethanol production in the co-culture
application in this study. However, decreased utilization of glucose was detected in
co-culture as compared to mono-culture, and this observation is consistent under all
chosen conditions. This is probably because for poly- or even di-saccharides, two
strains are able to utilize different substrate instead of competing for one specific
substrate as is the case with glucose in the system. While C. thermocellum is
degrading di- or poly-saccharides into mono-saccharides (glucose) (307), C.
thermolacticum and to some extent C. thermocellum ferment the glucose into
end-products (31, 307). However, for the fermentation with only glucose, since
both strains are able to utilize glucose, enzyme substrate competition is present
between these strains, which means the total final yield in glucose fermentation is not
improved.
4.2.4 Impact of pH value on co-culture fermentation
Determining the optimum pH range for both mono-culture fermentation systems is
critical because of the interaction between pH value and substrate influence on
microbial performance. However, the reported capability to digest the five chosen
substrates for C. thermocellum and C. thermolacticum varies in previous reports due
to the lack of uniform cultivation conditions (13, 216). In this work, the wild type

103
C. thermocellum strains ATCC 27405 and C. thermolacticum strain ATCC 43739
were grown in a standard medium as discussed by He and Sanford (300) on chosen
substrates for 10 d. The influence of pH value on end product yield is shown in
Table 4.1, 4.2. Fermentation yields for both strains were sensitive to pH changes.
The sensitivity towards pH change was enhanced with the increase of initial ethanol
concentration. When the starting ethanol concentration reaches 4 g/L, pH influence
has the maximum input on ethanol production from all substrates and for all strains.
No growth was found at a pH below 5 or above 10.
For the mono-cultures, pH=8 and pH=9 are the pH values providing the shortest lag
period during fermentation for both strains, which is usually around 72 h. The
optimum pH values for both strains dependent on the substrate. For cellulose and
its fragments, including glucose, cellobiose and MCC, the largest ethanol production
yields are found at pH=8 or 9. In contrast to this, for pentose fermentation, the
biggest ethanol productions were seen at pH=6 to pH=9.
Alkaline conditions, especially pH equal to 9, is preferred for C. thermocellum/C.
thermolacticum co-culture fermentation if the goal is high solvents production
(Figure 4.24), confirming results obtained in our mono-culture fermentations (Figure
4.12, 4.34). When the pH was adjusted to 9, the co-culture fermentation was the
most efficient ethanol producer, except for glucose. Almost all of the ethanol yields
obtained from co-culture fermentation at this pH were higher than the sum of their
mono-culture fermentations. At higher pH values (pH>9) the overall ethanol
production is reduced and the advantage of a co-culture process disappeared for the
mono sugars substrates. For MCC conversion, the co-culture was observed to be

104
more effective than mono-cultures, even at less than optimum pH. No significant
yield change was detected in xylan fermentation under high pH co-culture condition.
A decline of ethanol formation was observed as pH decreased below 9. At lower
pH, ethanol produced on selected substrates was significantly reduced.
0
0.05
0.1
0.15
0.2
0.25
5 6 7 8 9 10
pH Value
Eth
anol
Yie
ld (
g/l)
Glucose Cellobiose MCC Xylose
Figure 4.34 Effect of pH on ethanol production at 4 g/L initial ethanol level for C.thermolacticum fermentation on various substrates at 57ºC for 10 days
Similarly, the acetate production during fermentation by co-culture is higher when
the strains were grown on cellulose, cellobiose, glucose, and xylose under neutral or
alkaline conditions (Figure 4.34). Both pH=8 and pH=9 were considered as the
optimum pH for acetate production since no significant yield difference was detected
within this pH range. PH=7 resulted in a 0.1 g/L decrease in acetate production for
MCC fermentation as compared to pH=9. Acetate production on none of the other
substrates was observed to be affected by pH drop. However, once the pH dropped
below 7, the acetate formed by co-culture fermentation dropped sharply from an

105
average of 0.5 g/L to less than 0.1 g/L. In addition, under acidic conditions,
co-culture application did not show significant advantages over mono-culture
fermentations on cellobiose, glucose, hemicellulose and xylose (Figure 4.35, 4.36).
The only exception is the MCC fermentation. A higher acetate yield always existed
in co-culture fermentation of MCC, regardless of the pH. For acetate production,
instead of C. thermocellum as observed for ethanol production, C. thermolacticum
usually showed a better yield whenever co-culture did not provide any advantage.
0
0.1
0.2
0.3
0.4
0.5
0.6
5 6 7 8 9 10
pH Value
Ace
tate
Yie
ld (
g/l)
Glucose Cellobiose MCC
Figure 4.35 Effect of pH on acetate production at 4 g/L initial ethanol level for C. thermocellum fermentation on various substrates at 57ºC for 10 days

106
0
0.005
0.01
0.015
0.02
0.025
0.03
0.035
5 6 7 8 9 10
pH Value
Ace
tate
Yie
ld (
g/l)
Glucose Cellobiose MCC Xylose
Figure 4.36 Effect of pH on acetate production at 4 g/L initial ethanol level for C. thermolacticum fermentation on various substrates at 57ºC for 10 days
In the relationship between pH and solvent production, mass action effects play the
most important role. Both C. thermocellum and C. thermolacticum have a similar
metabolic pathway. During hexose fermentation, both strains convert the substrates
into pyruvate, and then into acetyl-coA and lactate. The acetyl-coA is fermented to
a reductive product (ethanol) or an oxidative product (acetate) through the
Embden-Meyerhof pathway (EMP) (31, 308). For xylose conversion, the pentose
phosphate pathway and EMP are also important (309). In the Embden-Meyerhof
pathway, during the formation of acetyl-CoA from pyruvate, pyruvate:ferredoxin
oxidoreductase (E.C. 1.2.7.1) is the key enzyme to catalyzes the pyruvate oxidative
decaboxylation (31). The optimum pH for this enzyme is reported to be around 7
(310). An activity decline of pyruvate:ferredoxin oxidoreductase will occur as the
pH decreases below neutral condition (308). Instead of producing acetyl-CoA,
glycolytic intermediates will form. Thus the yield of ethanol and acetate converted

107
from acetyl-CoA dropped sharply under acidic condition. No obvious change in
yield was detected by increasing pH from 7 to 9 for C. thermolacticum and from 8 to
9 for C. thermocellum in this research.
However, although acidic conditions reduced the solvent production, neutral
condition (pH=7) are not the optimum pH for C. thermocellum and this co-culture,
which indicates that other factors are involved in improving the co-culture activity.
Higher acetate production compared to C. thermolacticum would be a possible
reason leading to a higher optimum pH range. According to our observations, the
accumulation of acetate within the medium will bring the pH down to 6 within the
fermentation period which leads to lower yields. Thus, by applying higher initial
pH, it will take longer for the system to drop below pH 7.
In summary, the co-culture produced the largest amount of acetate during
fermentation under high initial ethanol levels, and the optimum pH of 9. For C.
thermocellum, which had slightly lower acetate production compared to co-culture,
pH=8 is efficient to provide a high pyruvate:ferredoxin oxidoreductase activity.
This result suggests that in order to archive higher solvent productions, initial mild
alkaline conditions, prompt removal of acetate from the system, or pH-control is
essential.
4.2.5 Interaction among factors on formation of end-products
Based on ethanol and acetate yield after 10 d fermentation, statistical
analysis indicated that the solvent yields were significantly related to the growth
conditions, including the interactions among application of co-culture, initial ethanol

108
level, pH value and substrate type. Interactions between each two factors, and
among these four factors were found to be statistically significant (P<0.0001) at the
95% confidence level (Table 4.3). These results demonstrated that adjustment of
pH, initial ethanol concentrations, substrates type and application of co-culture are all
interrelated. Thus, the optimization of the co-culture fermentation should not only
take the three main effects into account, the interactions among them cannot be
ignored.
Source DF SS MS F Value Pr > F 95% confidence level
Substrate 4 113.76 28.44 19238.3 < 0.0001 pH 5 13.67 2.73 185.04 < 0.0001
Initial Ethanol 4 200.67 50.17 33936.1 < 0.0001 Microbe 2 62.55 31.27 21155.4 < 0.0001
Substrate x pH 20 13.21 0.66 446.67 < 0.0001 Substrate x Initial Ethanol 16 52.67 3.29 2226.61 < 0.0001
Substrate x Microbe 8 62.75 7.84 5306.01 < 0.0001 pH x Initial Ethanol 20 3.97 0.20 134.37 < 0.0001
Microbe x pH 10 1.67 0.17 112.70 < 0.0001 Total Interaction 353 181.76 0.51 348.32 < 0.0001
Table 4.3 ANOVA table for ethanol production during free cell fermentation
4.2.6 Free cell fermentation of untreated aspen powder
The feasibility of fermenting untreated biomass by applying this co-culture was
examined. Aspen powder, due to its complicated lignocellulosic structure, was
expected to require longer fermentation times. At the optimized conditions, the
highest ethanol production of 1.28 g/L was observed. This is significantly lower
than ethanol yields observed with the pure sugar media (Figure 4.37). In addition,
this maximum ethanol production was detected at pH=10 instead of pH=9 in pure
saccharide fermentations. Higher wood loading rate did not have significantly
positive effect on ethanol production. By changing the substrate amount from 1%
to 1.5%, only a slight increase of ethanol production was observed. Further

109
increasing the aspen concentration from 1.5% to 2% only changed the ethanol yield
from 1.1 g/L to 1.2 g/L. Further increasing the wood loading rate from 2% to 10%,
however, led to a decrease of ethanol production for co-culture fermentations.
0.0
0.2
0.4
0.6
0.8
1.0
1.2
1.4
5.0 6.0 7.0 8.0 9.0 10.0pH value
Eth
anol
Pro
duct
ion
(g/L
)
1% 1.5% 2% 4% 10%
Figure 4.37 pH effects on ethanol yield for aspen co-culture fermentation at 57ºC for 10 days with wood loading rate from 1% to 10%

110
4.3 Immobilized cell fermentation
The Clostridium co-culture used in this study can effectively produce enzymes to
degrade chosen substrates. But they were proved to be sensitive to pH changes as
well as extreme ethanol concentrations. Therefore, as a potential way to modify the
the microbes responses towards ethanol and pH changes, alginate immobilization
was performed using the Clostridium co-culture. All attributes (immobilization,
initial pH, substrates and initial ethanol concentration) as main effect variables as
well as interactions among these factors were investigated. Regression analysis was
conducted to characterize the association between immobilization, and the averaged
ethanol productions or the average acetate production within the co-cultures.
Comparisons fermentation efficiency between free cell fermentation and
immobilized cell fermentation were also investigated under given initial ethanol
concentration and given initial pH values. The outcome illustrated the benefit of
using immobilization technique on this co-culture fermentation.
4.3.1 Benefit of immobilization
The benefit of applying the immobilization on chosen the Clostridium co-culture is
clearly demonstrated in CBP fermentations in improving the ethanol production for
selected substrates. This approach showed the potential of using both co-cultures and
immobilization techniques for direct ethanol production from lignocellulosics
biomass under alkali condition and up to 4 g/L of initial ethanol. Ethanol
production is dramatically improved in immobilized cell fermentation as compared

111
to free cell fermentations under almost all chosen conditions. Almost all the
ethanol yields obtained from immobilized cell fermentation are above any of the free
cell fermentation yields, approaching over 80% of the theoretical conversion
efficiency under identical conditions on all the substrate. The application of
immobilization is shifting the metabolism of ethanol production into acetate
production. The acetate generation, which is considered to have a positive
contribution to final ethanol production, turns out to lie in the same narrow range
irrespective of the substrate or pH value used (300). However, the correlation
between ethanol productivity improvement and increased E/A ratio is missing,
suggesting that mass action effects are not the only factors that influencing the final
ethanol production during immobilized cell fermentations. The other potential
influences might be caused by the existence of Ca2+, or the property changes caused
by cells’ growth state change.
4.3.2 Impact of immobilization on ethanol tolerance
The productions of ethanol and acetate as measured in the liquid samples after
completion of the fermentations were depicted in Figure 4.38. According to the
ANOVA (table 4.4), even by applying immobilization, the initial ethanol
concentration still plays a critical role in adjusting the final solvent productions
(p<0.005). However, the effect of immobilization and the interaction between
immobilization and initial ethanol concentration appeared to be not statistically
significant by holding pH values and substrates constant. The only expectations are

112
the glucose fermentation at pH=10, xyolse fermentation at pH=8, and MCC
fermentation at pH=9. These results suggest that the immobilization method
applied is not able to change the cells responds towards ethanol concentration
changes for this co-culture. This might be caused by the pore size of the alginate
gel produced. Existence of flavin, nicotinamide, and cytochrome in the medium is
proved to be able to diffuse 1% (w/v) of gel out of the pellets (295). Thus, the pore
sizes of the pellets were enlarged when the encapsulation was performed within the
cultural medium. The ethanol molecule was able to permeate the alginate gel
structure freely, indicating that the gel was not able to set up a protection for the
Clostridium sp. Extensive polymerization of the alginate gel would be a possible
way to provide extra protection for Clostridium co-culture against ethanol.
However, over-protection of the co-culture would cause the reduction of the positive
relationship between initial ethanol concentration and final ethanol production under
0-4 g/L initial ethanol levels. High degree of polymerization would also make the
transition of nutrients and wastes difficult. Thus, further augmentation of the gel
polymerization by increasing alginate concentration is not recommended for final
ethanol production enhancement. Although the micro-organisms behavior changes
with the phase of medium, the ethanol production alteration due to the ethanol
concentration change remained the same. Similar to the free cell fermentations, as
the initial ethanol concentration increases from 0 g/L to 4 g/L, the final ethanol
production is dramatically improved for all substrate under all chosen pH values.
Continuously increasing the initial ethanol concentration to 8g/L still led to the

113
decline of final ethanol production. Over 40% decrease in ethanol productions were
observed under all conditions when the initial ethanol concentration was increase
from 4 g/L to 8 g/L for immobilized cell fermentations. Except for the
fermentations performed under pH=7, and glucose fermentation performed under
pH=10, the ethanol production were considerably low (<1.0g/L) at 8g/L initial
ethanol level. Therefore, the application of immobilization is not considered to be
an efficient way to avoid ethanol inhibition at extreme levels.
PH=7 PH=8 PH=9 PH=10
Initial Ethanol <.0001 0.0003 0.0007 <.0001
Immobilization 0.4944 0.3216 0.5346 0.0238
Glucose
Interaction 0.0098 0.5734 0.0194 0.2586
Initial Ethanol <.0001 <.0001 0.0010 <.0001
Immobilization 0.7125 0.0258 0.3060 0.1764
Xylose
Interaction 0.6684 0.9239 0.4982 0.4587
Initial Ethanol <.0001 <.0001 <.0001 0.0011
Immobilization 0.2977 0.5233 0.2214 0.4381
Cellobiose
Interaction 0.3941 0.2425 0.2430 0.6542
Initial Ethanol <.0001 <.0001 <.0001 0.0004
Immobilization 0.0083 0.6586 0.0011 0.5906
MCC
Interaction 0.0690 0.7619 0.6655 0.3081
Table 4.4 P value for comparison of ethanol production for immobilized cell fermentation and
free cell fermentation. Variables include initial ethanol, immobilization and the interaction
between these two.

114
0.0
0.5
1.0
1.5
2.0
2.5
3.0
0 0.5 1 2 4 8
Initial Ethanol (g/L)
Eth
anol
Pro
duct
ion
(g/L
)
Immobilized cell fermentation Free cell fermenation
Figure 4.38a Comparison between immobilized cell fermentation and free cell fermentation at
various initial ethanol levels for glucose fermentation at pH = 7, 57ºC for 10 days
0.0
0.2
0.4
0.6
0.8
1.0
1.2
1.4
1.6
1.8
2.0
0 0.5 1 2 4 8
Initial Ethanol (g/L)
Eth
anol
Pro
duct
ion
(g/L
)
Immobilized cell fermentation Free cell fermenation
Figure4.38b Comparison between immobilized cell fermentation and free cell fermentation at
various initial ethanol levels for glucose fermentation at pH = 8, 57ºC for 10 days

115
0.0
1.0
2.0
3.0
4.0
5.0
6.0
0 0.5 1 2 4 8
Initial Ethanol (g/L)
Eth
anol
Pro
duct
ion
(g/L
)
Immobilized cell fermentation Free cell fermenation
Figure 4.38c Comparison between immobilized cell fermentation and free cell fermentation at
various initial ethanol levels for glucose fermentation at pH = 9, 57ºC for 10 days
0.0
0.5
1.0
1.5
2.0
2.5
3.0
0 0.5 1 2 4 8
Initial Ethanol (g/L)
Eth
anol
Pro
duct
ion
(g/L
)
Immobilized cell fermentation Free cell fermenation
Figure 4.38d Comparison between immobilized cell fermentation and free cell fermentation at
various initial ethanol levels for glucose fermentation at pH = 10, 57ºC for 10 days

116
0.0
0.5
1.0
1.5
2.0
2.5
3.0
0 0.5 1 2 4 8
Initial Ethanol (g/L)
Eth
anol
Pro
duct
ion
(g/L
)
Immobilized cell fermentation Free cell fermenation
Figure 4.38e Comparison between immobilized cell fermentation and free cell fermentation at
various initial ethanol levels for xylose at pH = 7, 57ºC for 10 days
0.0
0.5
1.0
1.5
2.0
2.5
3.0
0 0.5 1 2 4 8
Initial Ethanol (g/L)
Eth
anol
Pro
duct
ion
(g/L
)
Immobilized cell fermentation Free cell fermenation
Figure 4.38f Comparison between immobilized cell fermentation and free cell fermentation at
various initial ethanol levels for xylose fermentation at pH = 8, 57ºC for 10 days

117
0.0
1.0
2.0
3.0
4.0
5.0
6.0
0 0.5 1 2 4 8
Initial Ethanol (g/L)
Eth
anol
Pro
duct
ion
(g/L
)
Immobilized cell fermentation Free cell fermenation
Figure 4.38g Comparison between immobilized cell fermentation and free cell fermentation at
various initial ethanol levels for xylose at pH = 9, 57ºC for 10 days
0.0
0.5
1.0
1.5
2.0
2.5
3.0
3.5
0 0.5 1 2 4 8
Initial Ethanol (g/L)
Eth
anol
Pro
duct
ion
(g/L
)
Immobilized cell fermentation Free cell fermenation
Figure 4.38h Comparison between immobilized cell fermentation and free cell fermentation at
various initial ethanol levels for xylose fermentation at pH = 10, 57ºC for 10 days

118
0.0
0.5
1.0
1.5
2.0
2.5
3.0
0 0.5 1 2 4 8
Initial Ethanol (g/L)
Eth
anol
Pro
duct
ion
(g/L
)
Immobilized cell fermentation Free cell fermenation
Figure 4.38i Comparison between immobilized cell fermentation and free cell fermentation at
various initial ethanol levels for cellobiose fermentation at pH = 7, 57ºC for 10 days
0.0
0.5
1.0
1.5
2.0
2.5
3.0
3.5
4.0
4.5
0 0.5 1 2 4 8
Initial Ethanol (g/L)
Eth
anol
Pro
duct
ion
(g/L
)
Immobilized cell fermentation Free cell fermenation
Figure 4.38j Comparison between immobilized cell fermentation and free cell fermentation at
various initial ethanol levels for cellobiose fermentation at pH = 8, 57ºC for 10 days

119
0.0
1.0
2.0
3.0
4.0
5.0
6.0
0 0.5 1 2 4 8
Initial Ethanol (g/L)
Eth
anol
Pro
duct
ion
(g/L
)
Immobilized cell fermentation Free cell fermenation
Figure 4.38k Comparison between immobilized cell fermentation and free cell fermentation at
various ethanol levels for cellobiose fermentation at pH = 9, 57ºC for 10 days
0.0
0.5
1.0
1.5
2.0
2.5
3.0
3.5
4.0
0 0.5 1 2 4 8
Initial Ethanol (g/L)
Eth
anol
Pro
duct
ion
(g/L
)
Immobilized cell fermentation Free cell fermenation
Figure 4.38l Comparison between immobilized cell fermentation and free cell fermentation at
various ethanol levels for cellobiose fermentation at pH = 10, 57ºC for 10 days

120
0.0
0.5
1.0
1.5
2.0
2.5
3.0
0 0.5 1 2 4 8
Initial Ethanol (g/L)
Eth
anol
Pro
duct
ion
(g/L
)
Immobilized cell fermentation Free cell fermenation
Figure 4.38m Comparison between immobilized cell fermentation and free cell fermentation at
various initial ethanol levels for MCC fermentation at pH = 7, 57ºC for 10 days
0.0
0.5
1.0
1.5
2.0
2.5
3.0
3.5
4.0
4.5
0 0.5 1 2 4 8
Initial Ethanol (g/L)
Eth
anol
Pro
duct
ion
(g/L
)
Immobilized cell fermentation Free cell fermenation
Figure 4.38n Comparison between immobilized cell fermentation and free cell fermentation at
various initial ethanol levels for MCC fermentation at pH = 8, 57ºC for 10 days

121
0.0
1.0
2.0
3.0
4.0
5.0
6.0
0 0.5 1 2 4 8
Initial Ethanol (g/L)
Eth
anol
Pro
duct
ion
(g/L
)
Immobilized cell fermentation Free cell fermenation
Figure 4.38o Comparison between immobilized cell fermentation and free cell fermentation at
various initial ethanol levels for MCC fermentation at pH = 9, 57ºC for 10 days
0.0
0.2
0.4
0.6
0.8
1.0
1.2
1.4
1.6
0 0.5 1 2 4 8
Initial Ethanol (g/L)
Eth
anol
Pro
duct
ion
(g/L
)
Immobilized cell fermentation Free cell fermenation
Figure 4.38p Comparison between immobilized cell fermentation and free cell fermentation at
various initial ethanol levels for MCC fermentation at pH = 10, 57ºC for 10 days
Although the ethanol production change was reported insignificant, the

122
immobilization technique was shown to be able to reduce acetate production, the
major by-product during fermentation. As shown in Table 4.5, immobilization
modified the co-culture’s ability to produce acetate. Noticeably, less amount of
acetate were produced as compared to free cell fermentation under all conditions,
except for xylose fermentation at pH=7 (p<0.05) (Figure 4.39). Especially at pH=8,
the production of acetate dropped to less than 0.1g/L for all substrates, indicating this
immobilization technique is able shift the hetero-fermentative pathway towards the
homo-fermentative pathway by blocking the acetate production mechanisms or
shifting the acetate production to other by-products production like carbon dioxide,
since the increase of ethanol production is not related to the decrease of acetate
production. This production reduction is caused by the property changes of
Clostridium spp. after immobilization. It is possible that the immobilization change
Clostridium cell cultivation environment from liquid phase into solid phase.
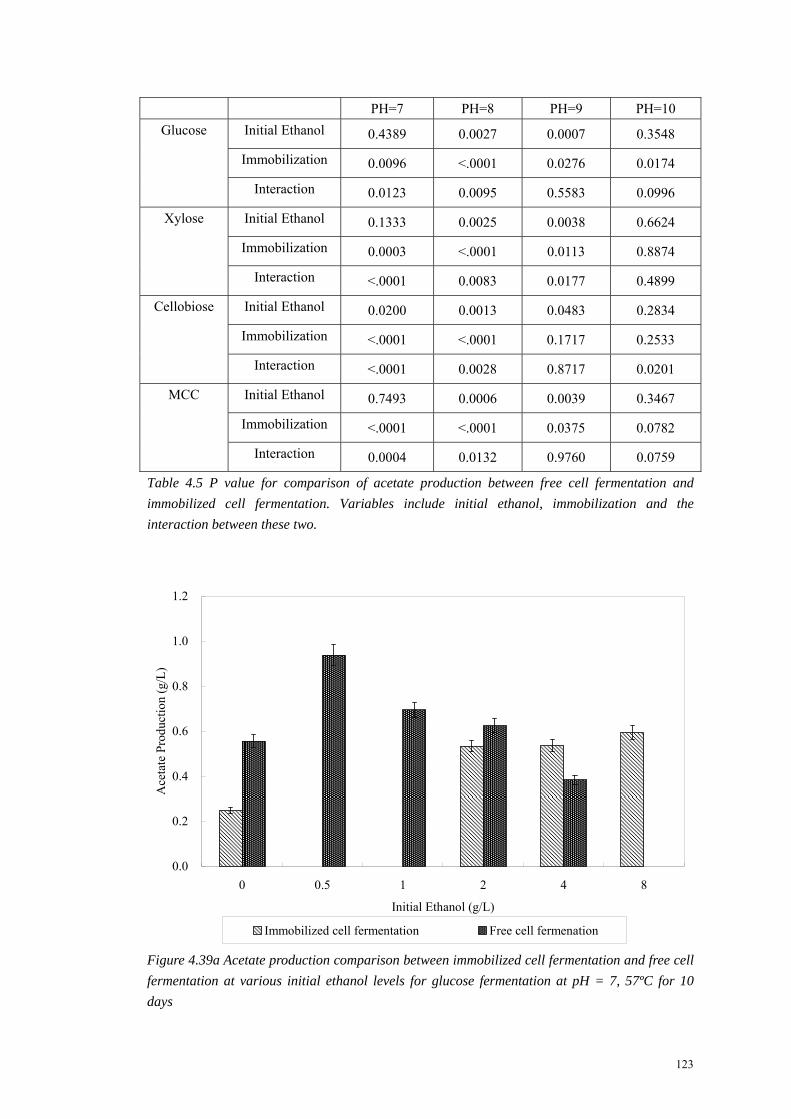
123
PH=7 PH=8 PH=9 PH=10
Initial Ethanol 0.4389 0.0027 0.0007 0.3548
Immobilization 0.0096 <.0001 0.0276 0.0174
Glucose
Interaction 0.0123 0.0095 0.5583 0.0996
Initial Ethanol 0.1333 0.0025 0.0038 0.6624
Immobilization 0.0003 <.0001 0.0113 0.8874
Xylose
Interaction <.0001 0.0083 0.0177 0.4899
Initial Ethanol 0.0200 0.0013 0.0483 0.2834
Immobilization <.0001 <.0001 0.1717 0.2533
Cellobiose
Interaction <.0001 0.0028 0.8717 0.0201
Initial Ethanol 0.7493 0.0006 0.0039 0.3467
Immobilization <.0001 <.0001 0.0375 0.0782
MCC
Interaction 0.0004 0.0132 0.9760 0.0759
Table 4.5 P value for comparison of acetate production between free cell fermentation and
immobilized cell fermentation. Variables include initial ethanol, immobilization and the
interaction between these two.
0.0
0.2
0.4
0.6
0.8
1.0
1.2
0 0.5 1 2 4 8
Initial Ethanol (g/L)
Ace
tate
Pro
duct
ion
(g/L
)
Immobilized cell fermentation Free cell fermenation
Figure 4.39a Acetate production comparison between immobilized cell fermentation and free cell
fermentation at various initial ethanol levels for glucose fermentation at pH = 7, 57ºC for 10
days
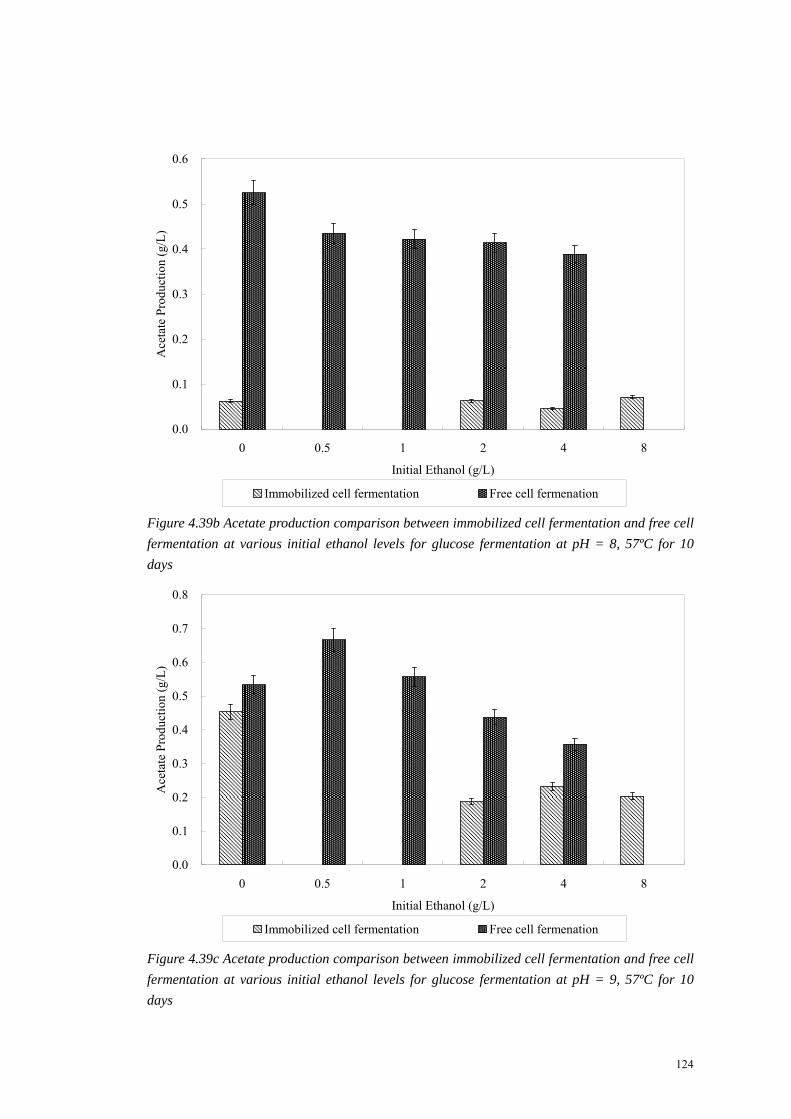
124
0.0
0.1
0.2
0.3
0.4
0.5
0.6
0 0.5 1 2 4 8
Initial Ethanol (g/L)
Ace
tate
Pro
duct
ion
(g/L
)
Immobilized cell fermentation Free cell fermenation
Figure 4.39b Acetate production comparison between immobilized cell fermentation and free cell
fermentation at various initial ethanol levels for glucose fermentation at pH = 8, 57ºC for 10
days
0.0
0.1
0.2
0.3
0.4
0.5
0.6
0.7
0.8
0 0.5 1 2 4 8
Initial Ethanol (g/L)
Ace
tate
Pro
duct
ion
(g/L
)
Immobilized cell fermentation Free cell fermenation
Figure 4.39c Acetate production comparison between immobilized cell fermentation and free cell
fermentation at various initial ethanol levels for glucose fermentation at pH = 9, 57ºC for 10
days
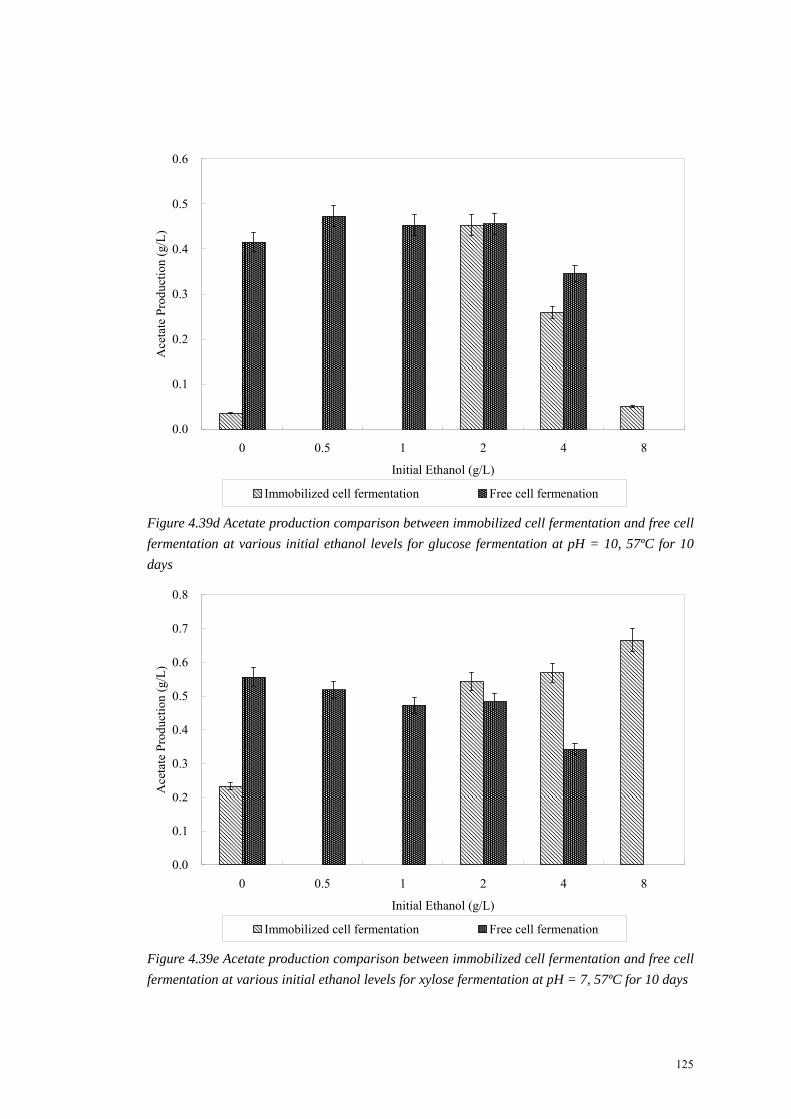
125
0.0
0.1
0.2
0.3
0.4
0.5
0.6
0 0.5 1 2 4 8
Initial Ethanol (g/L)
Ace
tate
Pro
duct
ion
(g/L
)
Immobilized cell fermentation Free cell fermenation
Figure 4.39d Acetate production comparison between immobilized cell fermentation and free cell
fermentation at various initial ethanol levels for glucose fermentation at pH = 10, 57ºC for 10
days
0.0
0.1
0.2
0.3
0.4
0.5
0.6
0.7
0.8
0 0.5 1 2 4 8
Initial Ethanol (g/L)
Ace
tate
Pro
duct
ion
(g/L
)
Immobilized cell fermentation Free cell fermenation
Figure 4.39e Acetate production comparison between immobilized cell fermentation and free cell
fermentation at various initial ethanol levels for xylose fermentation at pH = 7, 57ºC for 10 days

126
0.0
0.1
0.2
0.3
0.4
0.5
0.6
0 0.5 1 2 4 8
Initial Ethanol (g/L)
Ace
tate
Pro
duct
ion
(g/L
)
Immobilized cell fermentation Free cell fermenation
Figure 4.39f Acetate production comparison between immobilized cell fermentation and free cell
fermentation at various initial ethanol levels for xylose fermentation at pH = 8, 57ºC for 10 days
0.0
0.1
0.1
0.2
0.2
0.3
0.3
0.4
0.4
0.5
0.5
0 0.5 1 2 4 8
Initial Ethanol (g/L)
Ace
tate
Pro
duct
ion
(g/L
)
Immobilized cell fermentation Free cell fermenation
Figure 4.39g Acetate production comparison between immobilized cell fermentation and free cell
fermentation at various initial ethanol levels for xylose fermentation at pH = 9, 57ºC for 10 days

127
0.00
0.05
0.10
0.15
0.20
0.25
0.30
0.35
0.40
0.45
0 0.5 1 2 4 8
Initial Ethanol (g/L)
Ace
tate
Pro
duct
ion
(g/L
)
Immobilized cell fermentation Free cell fermenation
Figure 4.39h Acetate production comparison between immobilized cell fermentation and free cell
fermentation at various initial ethanol levels for xylose fermentation at pH = 10, 57ºC for 10
days
0.0
0.1
0.2
0.3
0.4
0.5
0.6
0.7
0.8
0.9
1.0
0 0.5 1 2 4 8
Initial Ethanol (g/L)
Ace
tate
Pro
duct
ion
(g/L
)
Immobilized cell fermentation Free cell fermenation
Figure 4.39i Acetate production comparison between immobilized cell fermentation and free cell
fermentation at various initial ethanol levels for cellobiose fermentation at pH = 7, 57ºC for 10
days
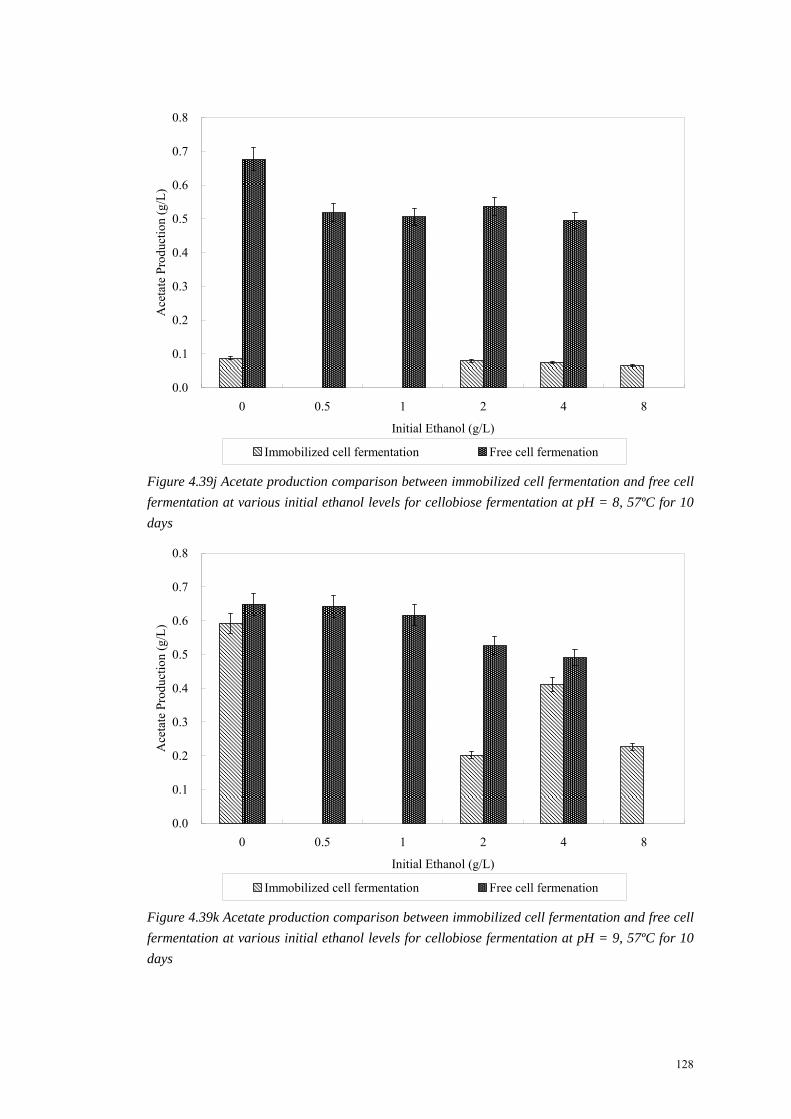
128
0.0
0.1
0.2
0.3
0.4
0.5
0.6
0.7
0.8
0 0.5 1 2 4 8
Initial Ethanol (g/L)
Ace
tate
Pro
duct
ion
(g/L
)
Immobilized cell fermentation Free cell fermenation
Figure 4.39j Acetate production comparison between immobilized cell fermentation and free cell
fermentation at various initial ethanol levels for cellobiose fermentation at pH = 8, 57ºC for 10
days
0.0
0.1
0.2
0.3
0.4
0.5
0.6
0.7
0.8
0 0.5 1 2 4 8
Initial Ethanol (g/L)
Ace
tate
Pro
duct
ion
(g/L
)
Immobilized cell fermentation Free cell fermenation
Figure 4.39k Acetate production comparison between immobilized cell fermentation and free cell
fermentation at various initial ethanol levels for cellobiose fermentation at pH = 9, 57ºC for 10
days

129
0.0
0.1
0.1
0.2
0.2
0.3
0.3
0.4
0.4
0 0.5 1 2 4 8
Initial Ethanol (g/L)
Ace
tate
Pro
duct
ion
(g/L
)
Immobilized cell fermentation Free cell fermenation
Figure 4.39l Acetate production comparison between immobilized cell fermentation and free cell
fermentation at various initial ethanol levels for cellobiose fermentation at pH = 10, 57ºC for 10
days
0.0
0.1
0.2
0.3
0.4
0.5
0.6
0.7
0.8
0 0.5 1 2 4 8
Initial Ethanol (g/L)
Ace
tate
Pro
duct
ion
(g/L
)
Immobilized cell fermentation Free cell fermenation
Figure 4.39m Acetate production comparison between immobilized cell fermentation and free cell
fermentation at various initial ethanol levels for MCC fermentation at pH = 7, 57ºC for 10 days

130
0.0
0.1
0.2
0.3
0.4
0.5
0.6
0.7
0.8
0 0.5 1 2 4 8
Initial Ethanol (g/L)
Ace
tate
Pro
duct
ion
(g/L
)
Immobilized cell fermentation Free cell fermenation
Figure 4.39n Acetate production comparison between immobilized cell fermentation and free cell
fermentation at various initial ethanol levels for MCC fermentation at pH = 8, 57ºC for 10 days
0.0
0.2
0.4
0.6
0.8
1.0
1.2
1.4
0 0.5 1 2 4 8
Initial Ethanol (g/L)
Ace
tate
Pro
duct
ion
(g/L
)
Immobilized cell fermentation Free cell fermenation
Figure 4.39o Acetate production comparison between immobilized cell fermentation and free cell
fermentation at various initial ethanol levels for MCC fermenation at pH = 9, 57ºC for 10 days

131
0.0
0.1
0.2
0.3
0.4
0.5
0.6
0.7
0.8
0 0.5 1 2 4 8
Initial Ethanol (g/L)
Ace
tate
Pro
duct
ion
(g/L
)
Immobilized cell fermentation Free cell fermenation
Figure 4.39p Acetate production comparison between immobilized cell fermentation and free cell
fermentation at various initial ethanol levels for MCC fermenation at pH = 10, 57ºC for 10 days
4.3.3 Impact of immobilization on pH tolerance
To examine the relationship between immobilization and pH changes, regression
models were fit for each treatment at fixed initial ethanol levels for certain substrates
in this study. As shown in the results (Figure 4.33), ethanol and acetate remain to
be the major end-products in immobilized C. thermocellum/C. thermolacticum
co-culture fermentation. The sensitivity towards pH change was enhanced with the
increase of initial ethanol concentration.
PH=9 was still considered to be the optimum pH for ethanol production under all
conditions, which means as the initial ethanol level increases from pH=7 to pH=9,
the final ethanol production for most substrates continuously rises and hits the

132
maximum at pH=9. This can be explained by the high oxidation / reduction
potential provide at low pH. The dehydrogenase complexes in Clostridium spp,
such as NAD+, will lose their activity under high oxidization/reduction potential. In
this case, higher pH is more favorable. Further increase of pH value of the medium
to pH=10 led to dramatic ethanol production decline for all substrates at all initial
ethanol levels probably due to enzyme denature (Figure 4.40). The only exceptions
to the optimum being at pH 9 are the glucose fermentation at 2% initial ethanol level,
and xylose fermentation at 2% initial ethanol level (Figure 4.40). Neither free cell
fermentation nor immobilized fermentation were observed being optimized at pH=9
possibly due to the interaction between pH and initial ethanol concentration.
Statistical analysis showed that both the main factors (pH value and immobilization)
and interactions are significant by holding substrate and initial ethanol constant.
Considering pH variations, the ethanol productions by immobilized cell fermentation
are significantly enhanced through exposure to most fermentation conditions. At a
given initial ethanol concentration (0-4 g/L) and a given substrate, the fermentation
using immobilized cells results in higher ethanol production than the fermentation
using free cells on average. Effect of applying immobilization technology is
significant at most conditions (p<0.01). Considerable enhancement in ethanol
productions were reported for immobilized cell fermentation as compared to free cell
fermentation. These observations proved that applying entrapment technology can
increase the cells’ ability to adapt to pH changes. PH changes within medium lead

133
to less effect on cells after being immobilized. The protection provided by the gel,
existence of calcium chloride, or cell characteristic changes caused by the
immobilization process are the potential explanations for this production
improvement.

134
0.0
0.2
0.4
0.6
0.8
1.0
1.2
1.4
1.6
7 8 9 10pH Value
Eth
anol
Pro
du
ctio
n (
g/L
)
Immobilized cell fermentation Free cell fermentation
Figure 4.40a Ethanol production comparison between immobilized cell fermentation and free cell
fermentation at various pH for glucose fermentation at 0g/L initial ethanol level, 57ºC for 10
days
0.0
0.2
0.4
0.6
0.8
1.0
1.2
1.4
1.6
1.8
2.0
7 8 9 10pH Value
Eth
anol
Pro
du
ctio
n (
g/L
)
Immobilized cell fermentation Free cell fermentation
Figure 4.40b Ethanol production comparison between immobilized cell fermentation and free cell
fermentation at various pH for glucose fermentation at 2g/L initial ethanol level, 57ºC for 10
days

135
0.0
1.0
2.0
3.0
4.0
5.0
6.0
7 8 9 10
pH Value
Eth
anol
Pro
du
ctio
n (
g/L
)
Immobilized cell fermentation Free cell fermentation
Figure 4.40c Ethanol production comparison between immobilized cell fermentation and free cell
fermentation at various pH for glucose fermentation at 4g/L initial ethanol level, 57ºC for 10
days
0.0
0.2
0.4
0.6
0.8
1.0
1.2
1.4
7 8 9 10pH Value
Eth
anol
Pro
du
ctio
n (
g/L
)
Immobilized cell fermentation Free cell fermentation
Figure 4.40d Ethanol production comparison between immobilized cell fermentation and free cell
fermentation at various pH for xylose fermentation at 0g/L initial ethanol level, 57ºC for 10 days

136
0.0
0.2
0.4
0.6
0.8
1.0
1.2
1.4
1.6
1.8
2.0
7 8 9 10
pH Value
Eth
anol
Pro
du
ctio
n (
g/L
)
Immobilized cell fermentation Free cell fermentation
Figure 4.40e Ethanol production comparison between immobilized cell fermentation and free cell
fermentation at various pH for xylose fermentation at 2g/L initial ethanol level, 57ºC for 10 days
0.0
1.0
2.0
3.0
4.0
5.0
6.0
7 8 9 10
pH Value
Eth
anol
Pro
duct
ion
(g/L
)
Immobilized cell fermentation Free cell fermentation
Figure 4.40f Ethanol production comparison between immobilized cell fermentation and free cell
fermentation at various pH for xylose fermentation at 4g/L initial ethanol level, 57ºC for 10 days

137
0.0
0.2
0.4
0.6
0.8
1.0
1.2
7 8 9 10pH Value
Eth
anol
Pro
duct
ion
(g/L
)
Immobilized cell fermentation Free cell fermentation
Figure 4.40g Ethanol production comparison between immobilized cell fermentation and free cell
fermentation at various pH for cellobiose fermentation at 0g/L initial ethanol level, 57ºC for 10
days
0.0
0.2
0.4
0.6
0.8
1.0
1.2
1.4
1.6
1.8
2.0
7 8 9 10pH Value
Eth
anol
Pro
duct
ion
(g/L
)
Immobilized cell fermentation Free cell fermentation
Figure 4.40h Ethanol production comparison between immobilized cell fermentation and free cell
fermentation at various pH for cellobiose fermentation at 2g/L initial ethanol level, 57ºC for 10
days
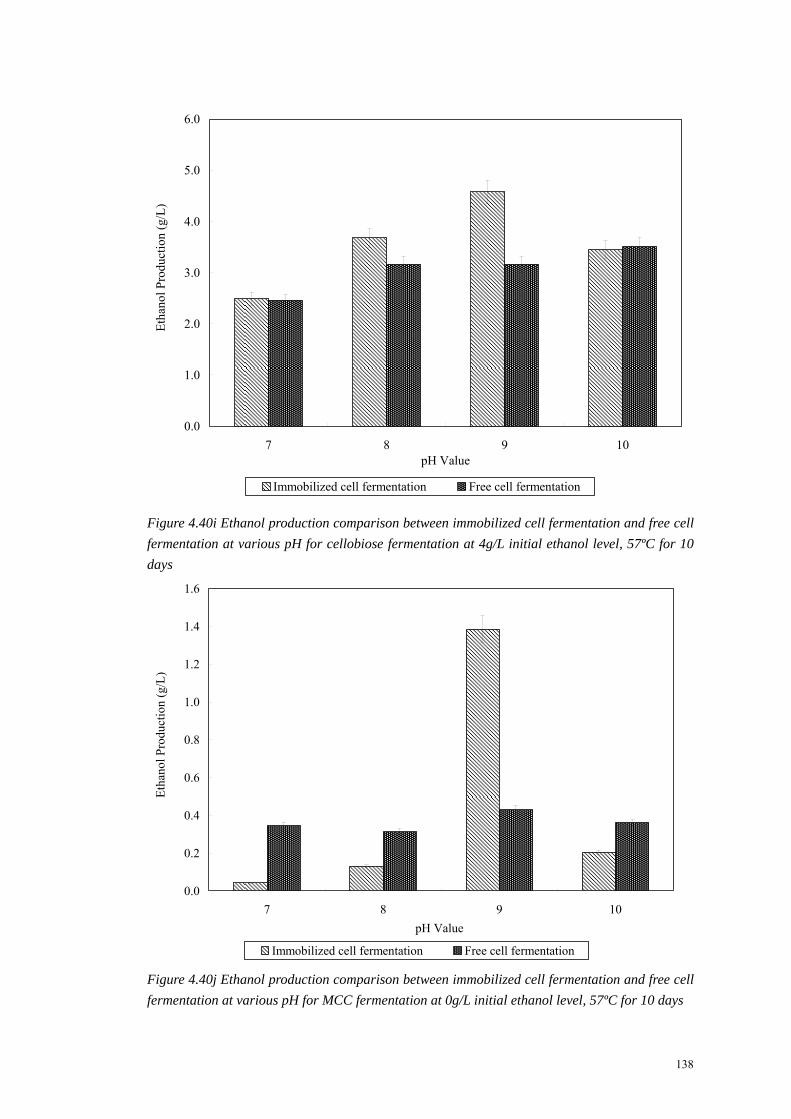
138
0.0
1.0
2.0
3.0
4.0
5.0
6.0
7 8 9 10pH Value
Eth
anol
Pro
duct
ion
(g/L
)
Immobilized cell fermentation Free cell fermentation
Figure 4.40i Ethanol production comparison between immobilized cell fermentation and free cell
fermentation at various pH for cellobiose fermentation at 4g/L initial ethanol level, 57ºC for 10
days
0.0
0.2
0.4
0.6
0.8
1.0
1.2
1.4
1.6
7 8 9 10
pH Value
Eth
anol
Pro
duct
ion
(g/L
)
Immobilized cell fermentation Free cell fermentation
Figure 4.40j Ethanol production comparison between immobilized cell fermentation and free cell
fermentation at various pH for MCC fermentation at 0g/L initial ethanol level, 57ºC for 10 days

139
0.0
0.5
1.0
1.5
2.0
2.5
3.0
7 8 9 10pH Value
Eth
anol
Pro
duct
ion
(g/L
)
Immobilized cell fermentation Free cell fermentation
Figure 4.40k Ethanol production comparison between immobilized cell fermentation and free cell
fermentation at various pH for MCC fermentation at 2g/L initial ethanol level, 57ºC for 10 days
0.0
1.0
2.0
3.0
4.0
5.0
6.0
7 8 9 10
Eth
anol
Pro
duct
ion
(g/L
)
PH Value
Immobilized cell fermentation Free cell fermentation
Figure 4.40l Ethanol production comparison between immobilized cell fermentation and free cell
fermentation at various pH for MCC fermentation at 4g/L initial ethanol level, 57ºC for 10 days

140
When the alginate is considered as protection for co-culture cells, the acetate
production is supposed to increase proportionally with the ethanol production
improvement since this improvement is caused by higher cell density achieved
during immobilized cell fermentation. With higher concentration of the cells,
higher solvent production will be reached. However, the increase of ethanol yield
caused by applying an immobilization was observed not to correlate to
ethanol/acetate ratio. Acetate productions are significantly lower in immobilized cell
fermentation as compared to free cell fermentation on cellulose, cellobiose, glucose,
and xylose under neutral or alkaline conditions (Figure 4.41). PH=8 is the
condition that leads to the sharpest acetate formed decrease by immobilized cell
fermentation as compared to free cell fermentations. For mono-sacchrides, glucose
and xylose, the drop is about 0.3 g/L. This decrease is even more dramatic for
cellobiose and MCC, an acetate production decline over 0.5 g/L was observed. A
higher acetate yield always existed in co-culture fermentation of MCC in
immobilized cell fermentation, regardless of the pH.
For the free cell fermentation, low pH leads to high oxidation/ reduction potential,
which is unfavorable for anaerobic micro-organisms’ metabolism. In this case,
lower pH will lead to the decline of the cell activity. Without protections, the cell
activity decrease will become more significant as pH is lowered. Thus, compare to
the immobilized cells, which are less effected by their environment, the ethanol
production differences between free cell fermentation and immobilized cell

141
fermentation will become larger as the pH value become much extreme for cell
growth. However, according to our results, no clear relationship between the pH
changes and ethanol production differences were observed between immobilized cell
fermentation. Thus, other changes might be involved in this fermentation process,
besides gel protection and cell population increase.
Based on some preliminary tests, the existence of Ca2+ might be the potential reason
for ethanol production improvement in the immobilization experiments. In order to
examine the influence on the addition of calcium chloride, a set of comparison
studies has been performed. The amount of calcium chloride to be used for the
immobilization process was added during free cell fermentation at pH=9 at 4 g/L
initial ethanol level for all chose substrate. The immobilized cell fermentations
performed with 3% calcium chloride appeared to be significantly better than free cell
fermentation performed with 3% calcium chloride added. Furthermore, increase of
ethanol productions is proportional with pH value increase. However, the decline
of acetate productions and disproportional increase of ethanol productions are both
found in this study, indicating that other factors, like cell characteristics changes, are
involved in the ethanol production improvement during immobilization processes.
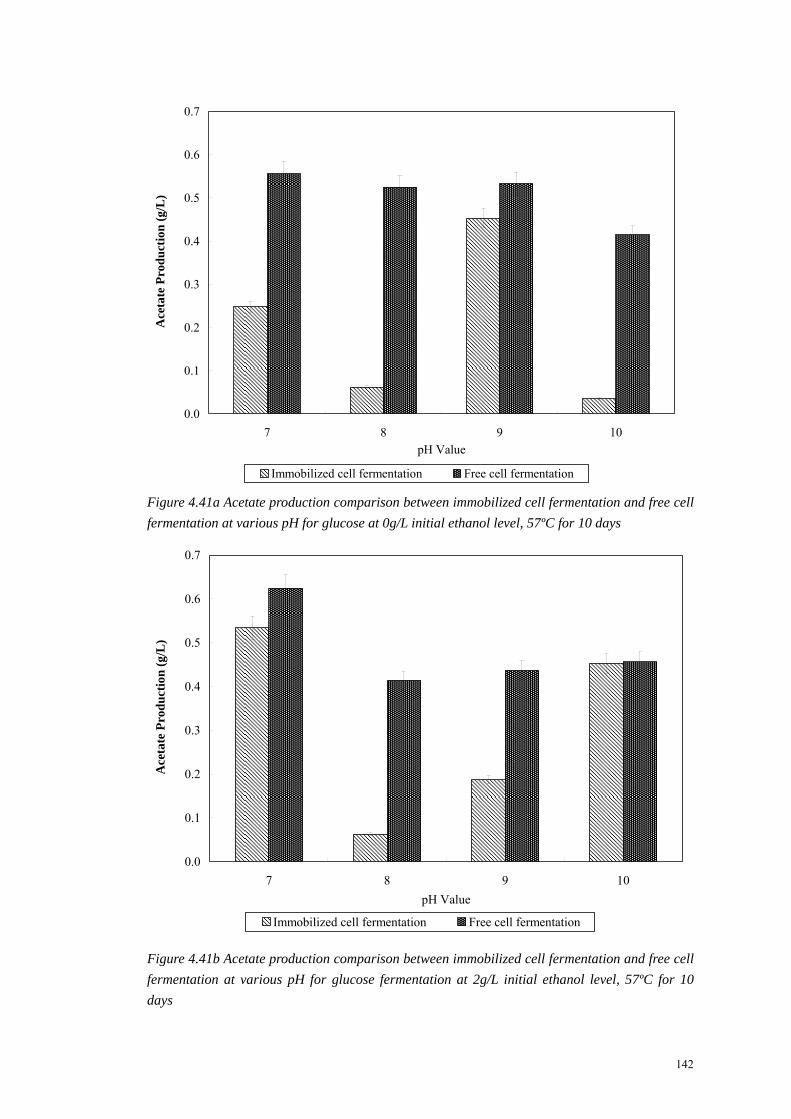
142
0.0
0.1
0.2
0.3
0.4
0.5
0.6
0.7
7 8 9 10pH Value
Ace
tate
Pro
du
ctio
n (
g/L
)
Immobilized cell fermentation Free cell fermentation
Figure 4.41a Acetate production comparison between immobilized cell fermentation and free cell
fermentation at various pH for glucose at 0g/L initial ethanol level, 57ºC for 10 days
0.0
0.1
0.2
0.3
0.4
0.5
0.6
0.7
7 8 9 10
pH Value
Ace
tate
Pro
du
ctio
n (
g/L
)
Immobilized cell fermentation Free cell fermentation
Figure 4.41b Acetate production comparison between immobilized cell fermentation and free cell
fermentation at various pH for glucose fermentation at 2g/L initial ethanol level, 57ºC for 10
days

143
0.0
0.1
0.2
0.3
0.4
0.5
0.6
7 8 9 10pH Value
Ace
tate
Pro
du
ctio
n (
g/L
)
Immobilized cell fermentation Free cell fermentation
Figure 4.41c Acetate production comparison between immobilized cell fermentation and free cell
fermentation at various pH for glucose fermentation at 4g/L initial ethanol level, 57ºC for 10
days
Figure 4.41d Acetate production comparison between immobilized cell fermentation and free cell
fermentation for xylose at 0g/L initial ethanol level, 57ºC for 10 days

144
0.0
0.1
0.2
0.3
0.4
0.5
0.6
7 8 9 10pH Value
Ace
tate
Pro
du
ctio
n (
g/L
)
Immobilized cell fermentation Free cell fermentation
Figure 4.41e Acetate production comparison between immobilized cell fermentation and free cell
fermentation at various pH for xylose fermentation at 2g/L initial ethanol level, 57ºC for 10 days
0.0
0.1
0.2
0.3
0.4
0.5
0.6
0.7
7 8 9 10pH Value
Ace
tate
Pro
du
ctio
n (
g/L
)
Immobilized cell fermentation Free cell fermentation
Figure 4.41f Acetate production comparison between immobilized cell fermentation and free cell
fermentation at various pH for xylose fermentation at 4g/L initial ethanol level, 57ºC for 10 days

145
0.0
0.1
0.2
0.3
0.4
0.5
0.6
0.7
0.8
7 8 9 10
pH Value
Ace
tate
Pro
du
ctio
n (
g/L
)
Immobilized cell fermentation Free cell fermentation
Figure 4.41g Acetate production comparison between immobilized cell fermentation and free cell
fermentation at various pH for cellobiose fermentation at 0g/L initial ethanol level, 57ºC for 10
days
0.0
0.1
0.2
0.3
0.4
0.5
0.6
7 8 9 10
pH Value
Ace
tate
Pro
du
ctio
n (
g/L
)
Immobilized cell fermentation Free cell fermentation
Figure 4.41h Acetate production comparison between immobilized cell fermentation and free cell
fermentation at various pH for cellobiose fermentation at 2g/L initial ethanol level, 57ºC for 10
days

146
0.0
0.1
0.2
0.3
0.4
0.5
0.6
7 8 9 10pH Value
Ace
tate
Pro
du
ctio
n (
g/L
)
Immobilized cell fermentation Free cell fermentation
Figure 4.41j Acetate production comparison between immobilized cell fermentation and free cell
fermentation at various pH for cellobiose fermentation at 4g/L initial ethanol level, 57ºC for 10
days
0.0
0.2
0.4
0.6
0.8
1.0
1.2
1.4
7 8 9 10
pH Value
Ace
tate
Pro
du
ctio
n (
g/L
)
Immobilized cell fermentation Free cell fermentation
Figure 4.41k Acetate production comparison between immobilized cell fermentation and free cell
fermentation at various pH for MCC fermentation at 0g/L initial ethanol level, 57ºC for 10 days

147
0.0
0.1
0.2
0.3
0.4
0.5
0.6
0.7
0.8
7 8 9 10pH Value
Ace
tate
Pro
du
ctio
n (
g/L
)
Immobilized cell fermentation Free cell fermentation
Figure 4.41l Acetate production comparison between immobilized cell fermentation and free cell
fermentation at various pH for MCC fermentation at 2g/L initial ethanol level, 57ºC for 10 days
0.0
0.1
0.2
0.3
0.4
0.5
0.6
0.7
0.8
7 8 9 10pH Value
Ace
tate
Pro
du
ctio
n (
g/L
)
Immobilized cell fermentation Free cell fermentation
Figure 4.41m Acetate production comparison between immobilized cell fermentation and free cell
fermentation at various pH for MCC fermentation at 4g/L initial ethanol level, 57ºC for 10 days

148
4.3.4 Impact of immobilization on substrate selectivity
The application of the immobilization technique on the Clostridium spp. co-culture
dramatically enhances the efficiency in converting separate components of
lignocellulosics for ethanol production. Ethanol productions from all chosen
substrates including glucose, cellulose, cellobiose, and xylose were significantly
improved under most conditions. Selectivity of the substrates remains unchanged
as compared to free cell fermentation. The improvement resulted in the best
ethanol production at pH=9 with high initial ethanol level (4 g/L) especially for
hexose fermentation. Under this condition, the ethanol yield through the use of
immobilized technique increased from 1.4 g/L to 4.9 g/L for glucose (97% of the
theoretical efficiency), from 3.2 g/L to 4.8 g/L for cellobiose (85% of the theoretical
efficiency), and from 3.8 g/L to 4.7 g/L for MCC (83% of the theoretical efficiency)
(306) (Figure 4.42). This represents almost 20% of efficiency improvement for
ethanol production compared to the maximum efficiency approached for free cell
fermentation on hexoses. Xylose fermentation was dramatically improved when
comparing immobilized cell fermentation to free cell fermentation at lower initial
ethanol level. However, at pH=9 with 4 g/L initial ethanol level, improvement of
ethanol production was not significant. Similar to free cell fermentations, the
efficiency also approached around 90% of theoretical yield in immobilized
fermentation. The MCC utilization lost its significant advantage over immobilized
cell fermentation. The MCC was not observed as the most favorable substrate for
co-culture as compared to free cell fermentation. This can be explained by the

149
properties of the alginate gel used for immobilization. With the entrapment of
alginate gel, the 18nm cellulosome degrading the MCC were retained within the gel
(218). However, due to the large MCC molecule diameter ranges, some of them
might not be able to diffuse into the immobilized cells and react with the cellulosome.
Although the immobilization was able to increase the MCC utilization efficiency,
limited molecules reacting with the cellulosome and other enzymes balanced out the
improvement. This made the MCC lose its significant advantage over cellobiose
and glucose utilization. For cellobiose and glucose, the diffusions within alginate
gel are performing well during fermentation due to their small molecule size. Thus,
the improvements of ethanol production for these substrates were more significant
than MCC fermentation.
Figure 4.42 Ethanol production comparison between immobilized cell fermentation and free cell
fermentation on various substrates under pH=9, at 4g/L initial ethanol level, 57ºC for 10 days

150
4.3.5 Immobilized cell co-culture fermentation of untreated and alkali treated
aspen powder
The feasibility of fermenting lignocellulosic biomass by applying this immobilized
co-culture was examined by applying immobilized co-culture on untreated aspen
powder and alkali pretreated aspen powder at 2% loading rate. The alkaline
pretreatment was performed by addition of 9% NaOH, heat at 100ºC for 3 hours in a
1L bioreactor. Upon complete of the pretreatment, no washing step was involved.
The treated wood and liquid was neutralized with 0.5N HCl to optimum pH (pH=9).
Composition changes as well as structural changes were investigated. At the
optimized condition, the highest ethanol production of 1.37 g/L was observed for
untreated wood fermentation and 2.78 g/L for alkaline pretreated wood.
4.3.5.1 Composition change and ethanol production
The significantly enhancement in ethanol production observed in our immobilized
cell co-culture fermentation are mainly due to the compositional modifications
during pretreatment and fermentation (Table 4.6). NaOH is strong agent, capable of
dissolving some hemicellulose while opening up the lignocellulosic structure.
Alkaline pretreatment significantly dissolved considerable amounts of xylan and
galactan although cellulose did not show much loss during pretreatment. About
27% of the original hemicellulose is dissolved in the NaOH pretreatment (311). It
also is known that alkaline treatment effectively removes the acetyl groups from
hemicelluloses, allowing easier access. In addition, some lignin was also dissolved

151
or modified during pretreatment. Since the co-culture is unable to utilize
hemicellulose, and hemicellulose is considered to be a barrier for access to cellulose,
alkaline pretreated biomass showed a clear advantage over fermentation of not
pretreated biomass. By applying the alkaline pretreatment, the ethanol production
was almost tripled. Through application of the immobilization technique to the
pretreated material, the fermentation efficiency of aspen wood approached about
79% of the maximum theoretical yield based on glucan and xylan for CBP. Even
with only the immobilization technique without pretreatment, 41.88% of the
maximum theoretical yield was observed, showing the application of immobilized
co-culture is an efficient way to convert lignocellulosic biomass into ethanol. These
results clearly demonstrate the feasibility for using immobilized Clostridium
co-culture for bio-ethanol production in a one-pot process. Even with the help of
our pretreatment process, no detoxification is required before fermentation, only
neutralization will be performed. However, for industrialization, the low biomass
loading restriction will need to be overcome.

152
Immobilization Original Cells Free Cells Immobilized Cells
Sample
Content, %
Untreated
Aspen
Alkaline
Treated
Aspen
Fermented
Untreated
Aspen
Fermented
Alkaline
Treated
Aspen
Fermented
Untreated
Aspen
Fermented
Alkaline
Treated
Aspen
Glucan 44.3 41.3 29.9 15.2 20.7 6.5
Xylan 17.9 12.3 14.8 10.1 12.5 4.7
Galactan 1.2 0.3 0.7 0.2 0.5 0.1
Arabinan 0.6 0.4 0.3 0.2 0.2 0.1
Mannan 1.7 0.8 0.9 0.5 0.5 0.2
Klason Lignin 21.2 19.4 21.1 19.3 21.1 19.2
Ethanol
Production (g/L) N/A N/A 0.58 1.47 1.37 2.78
Table 4.6 Composition analysis for aspen wood before and after alkine pretreatment (9%
NaOH,100ºC for 3 hours) and fermentation (at 4% initial ethanol level, pH=10, 57ºC for 10
days)
4.3.5.2 Preliminary test for increasing biomass loading rate for immobilized cell
fermentation
In order to further increase the biomass loading rates for ethanol production, series of
experiments stimulate the continuous fermentation process was done at pH=9 with 4
g/L initial ethanol concentration. Cellobiose was chosen as the substrate for this
process. After the 10 days fermentation, fermentation medium containing unused
substrates and final products were extracted out from reactor. Newly made medium
containing 1% cellobiose and required nutrients was added to react with the
remaining immobilized cells. The final production of ethanol for the fermentation
process was performed. Figure 4.36 illustrates the amount of ethanol produced
during this continuous fermentation process. The ethanol accumulated during this
10-day process. For the first three days, ethanol production was not noticeable due
to the growth disturbance of the immobilization process. On the fourth day, the

153
microbes start to enter the exponential growth period. Ethanol accumulation
increased dramatically. After the eighth day of fermentation, most of the existing
substrate was exhausted, and the cell growth started to decline. The maximum
ethanol production (4.8 g/L) was approached on the ninth day of the fermentation
and the production remained unchanged. If the old medium was replaced by fresh
medium, no noticeable ethanol production was detected, even after 10 days
cultivation. The immobilized cells were considered to be dead after the initial
10-day fermentation. In this case, the time of replacing the medium needs to be
optimized so that for each cycle of fermentation, the ethanol production was
optimized and the immobilized cell can be reused longer. Further investigations are
required for the continuous process optimization.
0
1
2
3
4
5
6
1 2 3 4 5 6 7 8 9 10 11 12 13 14 15 16 17 18 19 20
Days of Fermenation
Acc
umul
ated
Eth
anol
Con
cent
ratio
n (g
/L)
Ethanol Production
Figure 4.43 Accumulated ethanol production of continuous cellobiose fermentation (1% loading
rate) process at pH=9, 57ºC for 10 days with 4 g/L initial ethanol concentration
Initial Fermentation Cycle Secondary Fermentation Cycle

154
Chapter 5
CONCLUSION
This study clearly shows the technical feasibility of using lignocellulosic biomass for
ethanol production with our innovative co-culture, especially advantageous it the use
of the co-culture together with an immobilization technique. The co-culture results
shorter lag time and higher solvent production. Applying the chosen simultaneous
C. thermocellum/C. thermolacticum co-culture in CBP fermentations dramatically
improve the ethanol production for selected substrates, especially for MCC and
xylose. Furthermore, the lag time for the strains has been shortened into 48 hours.
These enhancements of MCC and xylose degradation clearly demonstrate synergistic
effect between these two strains. The co-culture is able to tolerate up to 4 g/L initial
ethanol level. Higher initial ethanol level led to improvement of ethanol production
due to the relationship between existing ethanol concentration and optimum
bacterium growth temperature. Alkaline condition, especially, pH = 9 was observed
as the most favorable condition for bio-ethanol production.
For the ethanol production, it is even further increased through the application of the
immobilization technique. Alkali condition with 4 g/L of initial ethanol is still
considered to be the optimum fermentation condition. Ethanol production is
dramatically improved in immobilized cell fermentation as compared to free cell
fermentations, approaching over 80% of the theoretical conversion efficiency under
155
identical conditions. Metabolism pathway shifting, existence of Ca2+, and the
property changes caused by cells’ growth state alteration are considered the three
possible explanations for this improvement. When comes to the influence of
immobilization on the pH sensitivity, ethanol sensitivity and substrate selectivity, the
immobilization is not able to protect the strains from extreme pH, however, ethanol
sensitivity is found to be improved. The substrate selectivity was also changed due
to the prosperities of the alginate gel. MCC is not considered to be the best
substrate that has clear advantage over glucose and cellobiose for immobilized cell
fermentations.
Comparatively higher starting pH is necessary to obtain maximum ethanol yield due
to the acetyl groups found in native aspen which, as they are released reduce the pH.
The ethanol yield obtained from untreated aspen fermentation is relatively low
compared to pure cellulosic due to the hindered accessibility of wood or lack of
fermentable substrates at the early fermentation stages. Therefore, adding sugars at
the beginning of the fermentation to initiate the microbial growth, modifying the
substrate or adding hemicellulose degraders to provide higher accessibility might be
necessary. In our study 9% NaOH was added as pretreatment agent before
immobilized co-culture are introduced. During the alkaline pretreatment,
considerable amount of hemicellulose is dissolved or modified. Thus, the
carbohydrate-lignin complex structure is disrupted. The lignocellulosic structure
provides higher accessibility to the enzymes secreted by immobilized co-culture.

156
Approximately 80% of the maximum theoretical efficiency is approached for ethanol
production, which is twice the amount of un-pretreated aspen fermentation. No
expensive detoxification process or extra piece of equipment is requires. Only a
simple neutralization within the same reactor would be necessary. This study
optimized an immobilized C. themocellum/C. thermolacticum co-culture, by
overcoming the potential inhibitor effect of high pH and high ethanol concentrations,
allowing for an effective merging of pretreatment and fermentation processes.
Immobilized co-culture CBP fermentation will result in reduced equipment and
processing cost, bringing the technology closer to economic feasibility
157
BIBLIOGRAPHY
1. Kumar P, Barrett DM, Delwiche MJ, Stroeve P. Methods for pretreatment of lignocellulosic biomass for efficient hydrolysis and biofuel production. Ind Eng Chem Res. 2009;48(8):3713-29.
2. Kumar P, Barrett DM, Delwiche MJ, Stroeve P. Pretreatment of lignocellulosic biomass for efficient hydrolysis and biofuel production. Industrial & Engineering Chemistry Research. 2009;48(8):3713-3729.
3. Organizing for America. New energy for america. . 2009.
4. Van Zyl WH, Lynd LR, Den Haan R, McBride JE. Consolidated bioprocessing for bioethanol production using saccharomyces cerevisiae . . Adv Biochem Eng Biotechnol. 2007;108:205-235.
5. Lynd LR, Zyl WHV, McBride JE, Laser M. Consolidated bioprocessing of cellulosic biomass: An update. Curr Opin Biotechnol. 2005 10;16(5):577-83.
6. Mosier N, Wyman C, Dale B, Elander R, Lee YY, Holtzapple M, et al. Features of promising technologies for pretreatment of lignocellulosic biomass. Bioresour Technol. 2005 4;96(6):673-86.
7. McMillan J D, Newman M M, Templeton D W, Mohagheghi A. Simultaneous saccharification and cofermentation of dilute-acid pretreated yellow poplar hardwood to ethanol using xylose-fermenting zymomonas mobilis. Applied biochemistry and biotechnology. 1999;79(1-3):649-665.
8. Perlack RD, Wright LL, Turhollow AF, Graham RL, Stokes BJ, Erbach DC. Biomass as feedstock for a bioenergy and bioproducts industry: The technical feasibility of a billion-ton annual supply. [Internet]. 2005:May 20th, 2011. Available from: http://feedstockreview.ornl.gov/pdf/billion_ton_vision.pdf.
9. Kleijntjens RH, De Boks PA, Luyben KCAM. A continuous thermophilic cellulose fermentation in an upflow reactor by a clostridium thermocellum-containing mixed culture. Biotechnol Lett. 1986;8(9):667-72.
10. Balusu R, Paduru RR, Kuravi SK, Seenayya G, Reddy G. Optimization of critical medium components using response surface methodology for ethanol production from cellulosic biomass by clostridium thermocellum SS19. Process Biochem. 2005 9;40(9):3025-30.

158
11. Lin Y, Tanaka S. Ethanol fermentation from biomass resources: Current state and prospects. Appl Microbiol Biotechnol. 2006;69(6):627-42.
12. Willaert RG, Baron GV. Gel entrapment and micro-encapsulation: Methods, applications and engineering principles. Rev Chem Eng. 1996;12(1-2):1-205.
13. Fardeau ML, Ollivier B, Garcia JL, Patel BKC. Transfer of thermobacteroides leptospartum and clostridium thermolacticum as clostridium stercorarium subsp. leptospartum subsp. nov., comb. nov. and C. stercorarium subsp. thermolacticum subsp. nov., comb. nov. Int J Syst Evol Microbiol. 2001 May 1;51(3):1127-31.
14. Weimer PJ, Zeikus JG. Fermentation of cellulose and cellobiose by clostridium thermocellum in the absence of methanobacterium thermoautotrophicum. Appl Environ Microbiol. 1977 February 1;33(2):289-97.
15. Talabardon M, Schwitzguebel JP, Peringer P, Yang ST. Acetic acid production from lactose by an anaerobic thermophilic coculture immobilized in a fibrous-bed bioreactor. Biotechnol Prog. 2000;16(6):1008-17.
16. Talabardon M, Schwitzguébel JP, Péringer P. Anaerobic thermophilic fermentation for acetic acid production from milk permeate. J Biotechnol. 2000 1/7;76(1):83-92.
17. Gee KB, Choi CY. A study on the ethanol production by immobilized cells of zymomonas mobilis. Korean Journal of Chemical Engineering. 1984;1(1):13-19.
18. Yamashita Y, Kurosumi A, Sasaki C, Nakamura Y. Ethanol production from paper sludge by immobilized zymomonas mobilis. Biochem Eng J. 2008 12/1;42(3):314-9.
19. Nowak J, Roszak H. Co-immobilization of aspergillus niger and zymomonas mobilis for ethanol production from starch. Polish Journal of Food and Nutrition Sciences. 1997;6(3):65-70.
20. Ryu S, Lee K. Comparison of immobilization matrix for ethanol fermentation by zymomonas mobilis and saccharomyces cerevisiae. Journal of Microbiology and Biotechnology. 1997;7(6):438-440.
21. Doruker P, Onsan ZI, Kirdar B. Ethanol fermentation by growing S. cerevisiae cells immobilized in small ca-alginate beads. Turkish Journal of Chemistry. 1995;19(1):37-42.
22. Karakashev D, Thomsen AB, Angelidaki I. Anaerobic biotechnological approaches for production of liquid energy carriers from biomass. Biotechnology Letters. 2007;29(7):1005-12.
159
23. Claassen PAM, Van Lier JB, Lopez Conteras AM, Van Niel EWJ, Sijtsma L, Stams AJM, et al. Utilisation of biomass for the supply of energy carriers. Applied Microbiology and Biotechnology. 1999;52(6):741-55.
24. Mielenz JR,. Ethanol production from biomass: Technology and commercialization status. Curr Opin Microbiol. 2001 6/1;4(3):324-9.
25. Lachke A. Biofuel from D-xylose – the second most abundant sugar. Resource. 2002;5:50-8.
26. Wang M, Wu M, Huo H. Life-cycle energy and greenhouse gas emission impacts of different corn ethanol plant types. Environmental Research Letter. 2007;2:1-13.
27. Sun Y, Cheng J. Hydrolysis of lignocellulosic materials for ethanol production: A review. Bioresour Technol. 2002 5;83(1):1-11.
28. Kim S, Dale BE. Global potential bioethanol production from wasted crops and crop residues. Biomass Bioenergy. 2004 4;26(4):361-75.
29. Grote W, Rogers PL. Ethanol production from sucrose-based raw materials using immobilized cells of zymomonas mobilis. Biomass. 1985;8(3):169-84.
30. Chaudhary N, Qazi JI. Lignocellulose for ethanol production: A review of issues relating to bagasse as a source material. African Journal of Biotechnology. 2011;10(8):1270-4.
31. Collet C, Girbal L, Peringer P, Schwitzguebel JP, Soucaille P. Metabolism of lactose by clostridium thermolacticum growing in continuous culture. Arch Microbiol. 2006;185(5):331-9.
32. Yang ST, Silva EM. Novel products and new technologies for use of a familiar carbohydrate, milk lactose. J Dairy Sci. 1995 11;78(11):2541-62.
33. Friend BA, Cunningham ML, Shahani KM. Industrial alcohol production via whey and grain fermentation. Agricultural Wastes. 1982 1;4(1):55-63.
34. Edgerton MD. Increasing crop productivity to meet global needs for feed, food, and fuel. Plant Physiology. 2009;149:7-13.
35. Agarwal AK. Biofuels (alcohols and biodiesel) applications as fuels for internal combustion engines. Progress in Energy and Combustion Science. 2007;33(3):233-71.
160
36. Rathmann R, Szklo A, Schaeffer R. Land use competition for production of food and liquid biofuels: An analysis of the arguments in the current debate. Renewable Energy. 2010 1;35(1):14-22.
37. Gong CS, Cao NJ, Du J, falsesao GT. Ethanol production from renewable resources. Advances in Biochemical Engineering/Biotechnology. 1999;65:207-41.
38. Harun MY, Dayang Radiah AB, Zainal Abidin Z, Yunus R. Effect of physical pretreatment on dilute acid hydrolysis of water hyacinth (eichhornia crassipes). Bioresour Technol. 2011 4;102(8):5193-9.
39. Wiselogel A, Tyson S, Johnson D. Biomass feedstock resources and composition. In: Wyman CE, editor. Handbook on Bioethanol: Production and Utilization. Washington DC: Taylor & Francis; 1996. p. 105-118.
40. Swain T. Tannins and lignins. In: Rosenthal GA, Janzen DH, editors. Herbivores: Their interaction with secondary plant metabolites. New York: Academic Press; 1979. p. 657–682.
41. Chandra RP, Bura R, Mabee WE, Berlin A, Pan X, Saddler JN. Substrate pretreatment: The key to effective enzymatic hydrolysis of lignocellulosics. Advances in Biochemical Engineering/Biotechnology. 2007;108:67-93.
42. Mansfield SD, Mooney C, Saddler JN. Substrate and enzyme characteristics that limit cellulose hydrolysis. Biotechnology Progress. 1999;15(5):804-16.
43. Börjesson J, Peterson R, Tjerneld F. Enhanced enzymatic conversion of softwood lignocellulose by poly(ethylene glycol) addition. Enzyme Microb Technol. 2007 3/5;40(4):754-62.
44. Liu H, Zhu J, Fu SY. Effects of lignin-metal complexation on enzymatic hydrolysis of cellulose. Journal of agricultural and food chemistry. 2010;58(12):7233-8.
45. Zheng Y, Pan ZL, Zhang RH, Wang DH, Jenkins B. Non-ionic surfactants and non-catalytic protein treatment on enzymatic hydrolysis of pretreated creeping wild ryegrass. Applied biochemistry and biotechnology. 2008;146(1-3):231-48.
46. Houtman CJ, Atalla RH. Cellulose-lignin interactions (A computational study). Plant Physiology. 1995;107(3):977-84.
47. Glasser WG, Leitheiser RH. Engineering plastics from lignin. 11. hydroxypropyl lignins as components of fire resistant foams. Polymer Bulletin. 1984;12(1):1-5.

161
48. Kosikova B, Labaj J, Slamenova D, Slavikova E, Gregorova A. Novel environmentally friendly use of lignin biomass component. In: Brenes MD, editor. Biomass and Bioenergy. Nova Science Publisher Inc.; 2006. p. 169-200.
49. Sarkanen KV, Ludwig CH, editors. Lignins occurrence, formation, structure and reactions. New York: Wiley-Interscience; 1971.
50. Thygesen A, Thomsen AB, Schmidt AS, Jørgensen H, Ahring BK, Olsson L. Production of cellulose and hemicellulose-degrading enzymes by filamentous fungi cultivated on wet-oxidised wheat straw. Enzyme Microb Technol. 2003 4/8;32(5):606-15.
51. Groff RW. Minnesota's aspen and its projected supply. St. Paul, MN: U.S. Dept. of Agriculture, Forest Service, North Central Forest Experiment Station; 1966. Report No.: Research Note NC-4.
52. Liesebach M, von Wuehlisch G, Muhs H-. Aspen for short-rotation coppice plantations on agricultural sites in germany: Effects of spacing and rotation time on growth and biomass production of aspen progenies. For Ecol Manage. 1999 8;121(1-2):25-39.
53. Zhu L, O'Dwyer JP, Chang VS, Granda CB, Holtzapple MT. Structural features affecting biomass enzymatic digestibility. Bioresource Technology. 2008;99(9):3817-3828.
54. Myung KH, Kennelly JJ. Effect of alkaline hydrogen peroxide and peracetic acid on in sacco ruminal digestibility of aspen sawdust. Asian-Australasian Journal of Animal Sciences. 1992;5(4):635-641.
55. Gharpuray MM, Lee YH, Fan LT. Structural modification of lignocellulosics by pretreatments to enhance enzymatic hydrolysis. Biotechnology and bioengineering. 1983;25(1):157-172.
56. Toyama N, Ogawa K. Sugar production from agricultural woody wastes by saccharification with trichoderma viride cellulase. Biotechnology and Bioengineering Symposium. 1975;5(Cellul. Chem. Energy Resour.):225-244.
57. Huang R, Su R, Qi W, He Z. Understanding the key factors for enzymatic conversion of pretreated lignocellulose by partial least square analysis. Biotechnology Progress. 2010;26(2):384-92.
58. Taherzadeh MJ, Karimi K. Pretreatment of lignocellulosic wastes to improve ethanol and biogas production: A review. International Journal of Molecular Sciences. 2008;9(9):1621-51.

162
59. Wyman CE. Ethanol production from lignocellulosic biomass: Overview. In: Wyman CE, editor. Handbook on Bioethanol: Production and Utilization. Washington DC: Taylor & Francis; 1996. p. 1-16.
60. Zheng Y, Pan Z, Zhang R. Overview of biomass pretreatment for cellulosic ethanol production. International Journal of Agricultural and Biological Engineering. 2009;2(3):1-18.
61. Lin KW, Ladisch MR, Schaefer DM, Noller CH, Lechtenberg, V., Tsao GT. Review on effect of pretreatment on digestibility of cellulosic materials. AIChE Symposium series. 1981;207(7):102-6.
62. Cadoche L, López GD. Assessment of size reduction as a preliminary step in the production of ethanol from lignocellulosic wastes. Biological Wastes. 1989;30(2):153-7.
63. Zhu W, Zhu JY, Gleisner R, Pan XJ. On energy consumption for size-reduction and yields from subsequent enzymatic saccharification of pretreated lodgepole pine. Bioresour Technol. 2010 4;101(8):2782-92.
64. Keshwani DR, Cheng JJ. Switchgrass for bioethanol and other value-added applications: A review. Bioresour Technol. 2009 2;100(4):1515-23.
65. Bridgeman TG, Darvell LI, Jones JM, Williams PT, Fahmi R, Bridgwater AV, et al. Influence of particle size on the analytical and chemical properties of two energy crops. Fuel. 2007 1;86(1-2):60-72.
66. Zhu JY, Pan XJ. Woody biomass pretreatment for cellulosic ethanol production: Technology and energy consumption evaluation. Bioresour Technol. 2010 7;101(13):4992-5002.
67. Alvira P, Tomás-Pejó E, Ballesteros M, Negro MJ. Pretreatment technologies for an efficient bioethanol production process based on enzymatic hydrolysis: A review. Bioresour Technol. 2010 7;101(13):4851-61.
68. Yang C, Shen Z, Yu G, Wang J. Effect and aftereffect of γ radiation pretreatment on enzymatic hydrolysis of wheat straw. Bioresour Technol. 2008 9;99(14):6240-5.
69. Doğan I, Sanin FD. Alkaline solubilization and microwave irradiation as a combined sludge disintegration and minimization method. Water Res. 2009 5;43(8):2139-48.
70. Farooq R, Rehman F, Baig S, Sadique M, Khan S, Farooq U, et al. The effect of ultrasonic irradiation on the anaerobic digestion of activated sludge. World Applied Sciences Journal. 2009;6(2):234-7.

163
71. Imai M, Ikari K, Suzuki I. High-performance hydrolysis of cellulose using mixed cellulase species and ultrasonication pretreatment. Biochem Eng J. 2004 2;17(2):79-83.
72. Yasuda K, Kato D, Xu Z, Sakka M, Sakka K. Effect of ultrasonic frequency on enzymatic hydrolysis of cellulose. Japanese Journal of Applied Physics. 2010;49(7):07HE08,07HE08-2.
73. Weil JR, Sarikaya A, Rau SL, Goetz J, Ladisch CM, Brewer M, et al. Pretreatment of yellow poplar sawdust by pressure cooking in water. Applied Biochemistry and Biotechnology. 1997;68(1-2):21-40.
74. Donaldson LA, Wong KKY, Mackie KL. Ultrastructure of steam-exploded wood. Wood Science and Technology. 1988;22:103-14.
75. Tanahashi M, Takada S, Aoki T, Goto T, Higuchi T, Hanai S. Characterization of explosion wood 1. structure and physical properties. Wood Research. 1983;69:36-51.
76. Kosaric N, Vardar-Sukan F. Potential source of energy and chemical Products . In: Roehr M, editor. The Biotechnology of Ethanol: Classical and Future Applications. Verlag GmbH, Weinheim: WILEY-VCH; 2001. p. 87-139.
77. Weil J, Brewer M, Hendrickson R, Sarikaya A, Ladisch RM. Continuous pH monitoring during pretreatment of yellow poplar wood sawdust by pressure cooking in water. Applied Biochemistry and Biotechnology. 1998;70-72(1):99-111.
78. Excoffier G, Peguy A, Rinaudo M, Vignon R. In: Focher B, Marzetti A, Crescenzi V, editors. Evolution of lignocellulosic components during steam explosion. potential applications. Proceedings of the international workshop on steam explosion techniques: Fundamentals and industrial applications; ; 1988. p. 83-95.
79. Balat M, Balat H, Öz C. Progress in bioethanol processing. Progress in Energy and Combustion Science. 2008 10;34(5):551-73.
80. Mtui G. Recent advances in pretreatment of lignocellulosic wastes and production of value added products. African Journal of Biotechnology. 2009;8(8):1398-415.
81. Kumar R, Wyman CE. Effects of cellulase and xylanase enzymes on the deconstruction of solids from pretreatment of poplar by leading technologies. Biotechnol Prog. 2009;25(2):302-14.
82. Hatakka IA. Pretreatment of wheat straw by white-rot fungi for enzymic saccharification of cellulose. Applied Microbiology and Biotechnology. 1983;13(6):350-7.

164
83. Lee JW, Gwak KS, Park JY, Park MJ, Choi DH, Kwon M, et al. Biological pretreatment of softwood pinus densiflora by three white rot fungi. Journal of Microbiology. 2007;45(6):485-91.
84. Singh P, Suman A, Tiwari P, Arya N, Gaur A, Shrivastava AK. Biological pretreatment of sugarcane trash for its conversion to fermentable sugars. World Journal of Microbiology and Biotechnology. 2008;24(5):667-73.
85. Hahn-Hägerdal B, Galbe M, Gorwa-Grauslund MF, Lidén G, Zacchi G. Bio-ethanol – the fuel of tomorrow from the residues of today. Trends Biotechnol. 2006 12;24(12):549-56.
86. Chang VS, Holtzapple MT. Fundamental factors affecting biomass enzymatic reactivity. Applied Biochemistry and Biotechnology. 2000;84-86:5-37.
87. Playne MJ. Increased digestibility of bagasses by pretreatment with alkalis and steam explosion. Biotechnology and bioengineering. 1984;26(5):426-33.
88. Evans RJ, Milne TA, Soltys MN. Direct mass-spectrometric studies of the pyrolysis of carbonaceous fuels: III. primary pyrolysis of lignin. J Anal Appl Pyrolysis. 1986 3;9(3):207-36.
89. Sun R, Tomkinson J. Comparative study of lignins isolated by alkali and ultrasound-assisted alkali extractions from wheat straw. Ultrason Sonochem. 2002 3;9(2):85-93.
90. Chang VS, Nagwani M, Holtzapple MT. Lime pretreatment of crop residues bagasse and wheat straw. Applied Biochemistry and Biotechnology. 2000;74(3):135-7.
91. Torre P, Aliakbarian B, Rivas B, Domínguez JM, Converti A. Release of ferulic acid from corn cobs by alkaline hydrolysis. Biochem Eng J. 2008 7/1;40(3):500-6.
92. Zhao Y, Wang Y, Zhu JY, Ragauskas A, Deng Y. Enhanced enzymatic hydrolysis of spruce by alkaline pretreatment at low temperature. Biotechnology and bioengineering. 2007;99(6):1320-8.
93. Sun R, Lawther JM, Banks WB. Influence of alkaline pre-treatments on the cell wall components of wheat straw. Industrial Crops and Products. 1995 7;4(2):127-45.
94. Martin C, Thomsen BA. Wet oxidation pretreatment of lignocellulosic residues of sugarcane, rice, cassava and peanuts for ethanol production. Journal of Chemical Technology and Biotechnology. 2007;82(2):174-82.

165
95. López Torres M, Espinosa Lloréns MdC. Effect of alkaline pretreatment on anaerobic digestion of solid wastes. Waste Manage. 2008 11;28(11):2229-34.
96. Kim S, Holtzapple MT. Lime pretreatment and enzymatic hydrolysis of corn stover. Bioresour Technol. 2005 12;96(18):1994-2006.
97. Kaar WE, Holtzapple MT. Using lime pretreatment to facilitate the enzymic hydrolysis of corn stover. Biomass Bioenergy. 2000 3;18(3):189-99.
98. Sierra R, Granda C, Holtzapple MT. Short-term lime pretreatment of poplar wood. Biotechnology Progress. 2009;25(2):232-332.
99. Prior BA, Day DF. Hydrolysis of ammonia-pretreated sugar cane bagasse with cellulase, β-glucosidase, and hemicellulase preparations. Applied Biochemistry and Biotechnology. 2008;146(1-3):151-64.
100. Iyer PV, Wu ZW, Kim SB, Lee YY. Ammonia recycled percolation process for pretreatment of herbaceous biomass. Applied Biochemistry and Biotechnology. 1996;57-58(1):121-32.
101. Kim SB, Lee YY. Fractionation of herbaceous biomass by ammonia-hydrogen peroxide percolation treatment. Applied Biochemistry and Biotechnology. 1996;57(8):147-56.
102. Isci A, Himmelsbach JN, Pometto AL, Raman DR, Anex RP. Aqueous ammonia soaking of switchgrass followed by simultaneous saccharification and fermentation. Applied biochemistry and biotechnology. 2008;144(1):69-77.
103. Carrillo F, Lis MJ, Colom X, López-Mesas M, Valldeperas J. Effect of alkali pretreatment on cellulase hydrolysis of wheat straw: Kinetic study. Process Biochemistry. 2005 10;40(10):3360-4.
104. Chang VS, Burr B, Holtzapple MT. Lime pretreatment of switchgrass. Applied Biochemistry and Biotechnology. 1997;63-65:3-19.
105. Kurakake M, Kisaka W, Ouchi K, Komaki T. Pretreatment with ammonia water for enzymatic hydrolysis of corn husk, bagasse, and switchgrass. Applied biochemistry and biotechnology. 2001;90(3):251-9.
106. Kim S, Holtzapple MT. Delignification kinetics of corn stover in lime pretreatment. Bioresour Technol. 2006 3;97(5):778-85.
107. Kim JS, Kim H, Lee JS, Lee JP, Park SC. Pretreatment characteristics of waste oak wood by ammonia percolation. Applied Biochemistry and Biotechnology. 2008;148(1-3):15-22.

166
108. Kim TH, Lee YY. Pretreatment and fractionation of corn stover by ammonia recycle percolation process. Bioresour Technol. 2005 12;96(18):2007-13.
109. Yang B, Wyman C. Pretreatment: The key to unlocking low-cost cellulosic ethanol. Biofuels, Bioproducts and Biorefining. 2008;2(1):26-40.
110. Kim TH, Lee YY. Pretreatment of corn stover by soaking in aqueous ammonia. Applied biochemistry and biotechnology. 2005;121-124:1119-31.
111. Bjerre AB, Olesen AB, Ferngvist T, Plöger A, Schmidt AS. Pretreatment of wheat straw using combined wet oxidation and alkaline hydrolysis resulting in convertible cellulose and hemicellulose. Biotechnology and bioengineering. 1996;49(5):568-77.
112. Wyman CE, Dale BE, Elander RT, Holtzapple M, Ladisch MR, Lee YY, et al. Comparative sugar recovery and fermentation data following pretreatment of poplar wood by leading technologies. Biotechnology Progress. 2009;25(2):333-9.
113. Yoon HH, Wu ZW, Lee YY. Ammonia-recycled percolation process for pretreatment of biomass feedstock. Applied Biochemistry and Biotechnology. 1995;51-52(1):5-19.
114. Stavrinides AJ, Phipps DA, Al-Shamma’a A. Review; current and developing lignocellulosic pretreatment methods for bioethanol production. . 2010:223-42.
115. Kootstra AMJ, Beeftink HH, Scott EL, Sanders JPM. Comparison of dilute mineral and organic acid pretreatment for enzymatic hydrolysis of wheat straw. Biochem Eng J. 2009 10/1;46(2):126-31.
116. Demirbas A. Furfural production from fruit shells by acid-catalyzed hydrolysis. Energy Sources, Part A: Recovery, Utilization, and Environmental Effects. 2006;28(2):157-165.
117. Hinman ND, Schell DJ, Riley J, Bergeron PW, Walter PJ. Preliminary estimate of the cost of ethanol production for SSF technology. Applied Biochemistry and Biotechnology. 1992;34-35(1):639-49.
118. Palmqvist E, Hahn-Hägerdal B. Fermentation of lignocellulosic hydrolysates. II: Inhibitors and mechanisms of inhibition. Bioresour Technol. 2000 8;74(1):25-33.
119. Mes-Hartree M., Saddler JN. The nature of inhibitory materials present in pretreated lignocellulosic substrates which inhibit the enzymatic hydrolysis of cellulose. Biotechnology Letters. 1983;5(8):531-6.

167
120. Wang GS, Pan XJ, Zhu JY, Gleisner R, Rockwood D. Sulfite pretreatment to overcome recalcitrance of lignocellulose (SPORL) for robust enzymatic saccharification of hardwoods. Biotechnol Prog. 2009;25(4):1086-93.
121. Zhu JY, Pan XJ, Wang GS, Gleisner R. Sulfite pretreatment (SPORL) for robust enzymatic saccharification of spruce and red pine. Bioresour Technol. 2009 4;100(8):2411-8.
122. Monavari S, Galbe M, Zacchi G. The influence of solid/liquid separation techniques on the sugar yield in two-step dilute acid hydrolysis of softwood followed by enzymatic hydrolysis. Biotechnology for Biofuels. 2009;2(6):1-9.
123. Cara C, Ruiz E, Oliva JM, Sáez F, Castro E. Conversion of olive tree biomass into fermentable sugars by dilute acid pretreatment and enzymatic saccharification. Bioresour Technol. 2008 4;99(6):1869-76.
124. Rocha MV, Rodrigues TH, de Macedo GR, Gonçalves LR. Enzymatic hydrolysis and fermentation of pretreated cashew apple bagasse with alkali and diluted sulfuric acid for bioethanol production. Applied Biochemistry and Biotechnology. 2009;155(1-3):407-17.
125. Saha BC, Iten LB, Cotta MA, Wu YV. Dilute acid pretreatment, enzymatic saccharification and fermentation of wheat straw to ethanol. Process Biochemistry. 2005 12;40(12):3693-700.
126. Lu XB, Zhang HYM, Yang J, Liang Y. Enzymatic hydrolysis of corn stover after pretreatment with dilute sulfuric acid. Chemical Engineering & Technology. 2007;30(7):938-44.
127. Yat SC, Berger A, Shonnard DR. Kinetic characterization for dilute sulfuric acid hydrolysis of timber varieties and switchgrass. Bioresour Technol. 2008 6;99(9):3855-63.
128. Karimi K, Kheradmandinia S, Taherzadeh MJ. Conversion of rice straw to sugars by dilute-acid hydrolysis. Biomass Bioenergy. 2006 3;30(3):247-53.
129. Digman MF, Shinners KJ, Casler MD, Dien BS, Hatfield RD, Jung HG, et al. Optimizing on-farm pretreatment of perennial grasses for fuel ethanol production. Bioresour Technol. 2010 7;101(14):5305-14.
130. Li C, Knierim B, Manisseri C, Arora R, Scheller HV, Auer M, et al. Comparison of dilute acid and ionic liquid pretreatment of switchgrass: Biomass recalcitrance, delignification and enzymatic saccharification. Bioresour Technol. 2010 7;101(13):4900-6.

168
131. Qian X, Nimlos MR, Davis M, Johnson DK, Himmel ME. Ab initio molecular dynamics simulations of β-d-glucose and β-d-xylose degradation mechanisms in acidic aqueous solution. Carbohydr Res. 2005 10/17;340(14):2319-27.
132. Kootstra AMJ, Mosier NS, Scott EL, Beeftink HH, Sanders JPM. Differential effects of mineral and organic acids on the kinetics of arabinose degradation under lignocellulose pretreatment conditions. Biochem Eng J. 2009 1/15;43(1):92-7.
133. Antal Jr. MJ, Mok WSL, Richards GN. Mechanism of formation of 5-(hydroxymethyl)-2-furaldehyde from d-fructose and sucrose. Carbohydr Res. 1990 5/15;199(1):91-109.
134. Antal Jr. MJ, Leesomboon T, Mok WS, Richards GN. Mechanism of formation of 2-furaldehyde from d-xylose. Carbohydr Res. 1991 9/18;217(0):71-85.
135. Schwald W, Breuil C, Brownell HH, Chan M, Saddler JM. Assessment of pretreatment conditions to obtain fast complete hydrolysis on high substrate concentrations. Applied biochemistry and biotechnology. 1989;20-21(1):29-44.
136. Philippidis GP. Cellulose bioconversion technology. In: Wyman CE, editor. Handbook on Bioethanol: Production and utilization Washington DC: Taylor & Francis; 1996. p. 253-86.
137. Kumakura M, Kojima T, Kaetsu I. Pretreatment of lignocellulosic wastes by combination of irradiation and mechanical crushing. Biomass. 1982 10;2(4):299-308.
138. Zheng YZ, Lin HM, Tsao GT. Pretreatment for cellulose hydrolysis by carbon dioxide explosion. Biotechnology Progress. 1998;14(6):890-6.
139. Emmel A, Mathias AL, Wypych F, Ramos LP. Fractionation of eucalyptus grandis chips by dilute acid-catalysed steam explosion. Bioresour Technol. 2003 1;86(2):105-15.
140. Basaglia M, Concheri G, Cardinali S, Pasti-Grigsby MB, Nuti MP. Enhanced degradation of ammonium - pretreated wheat straw by lignocellulolytic steptomyces spp. Canadian journal of microbiology. 1992;38(10):1022-5.
141. Hoebler C, Barry JL, David A, Delort-Laval J. Rapid acid hydrolysis of plant cell wall polysaccharides and simplified quantitative determination of their neutral monosaccharides by gas-liquid chromatography. Journal of Agricultural and food chemistry. 1989;37(2):360-7.
142. Cao NJ, Xu Q, Chen LF. Xylan hydrolysis in zinc chloride solution. Applied biochemistry and biotechnology. 1995;51-52(1):97-104.

169
143. Feather MS, Harris JF. Dehydration reaction of carbohydrates. In: Tipson RS, Horton D, editors. Advance in carbonhydrate chemistry and biochemistry. New York: Academic Press; 1937. p. 161-224.
144. Chamy R, Illanes A, Aroca G, Nunes I. Acid hydrolysis of sugarbeet pulp as pretreatment for fermentation. Bioresource technology. 1994;50:149.
145. Fanta GF, Abbott TP, Herman AI, Burr RC, Doane WM. Hydrolysis of wheat straw hemicellulose with trifluoroacetic acid: Fermentation of xylose with pachysolen tannophilus. Biotechnology and Bioengineering. 2004;26(9):1122-5.
146. Neureiter M, Danner H, Thomasser C, Braun R. Dilute acid hydrolysis of softwood chips for the production of hemicellulose sugars. 2007.
147. Rugg BA, Stanton R, inventors; Process for the acid hydrolysis of waste cellulose to glucose. Untied State 1982 .
148. Xiang Q, Lee YY, Torget RW. Kinetics of glucose decomposition during dilute acid hydrolysis of lignocellulosic biomass. Applied biochemistry and biotechnology. 2004;113-116:1127-39.
149. Yat SC, Shonnard DR. Kinetic characterization for pretreatment of timber varieties and switchgrass using diluted acid hydrolysis. Bioresource technology. 2006;99(9):3855-63.
150. Zhou LL, Ren ZW, Zhang SP, Yan YJ. Concentrated sulfuric acid-hydrolysis of wood chips for glucose. Acta Energiae Solaris Sinica. 2007;28(4):385-8.
151. Pessoa JR, Manciha IM, Sato S. Acid hydrolysis of hemicellulose from sugarcane bagasse. Brazilian journal of chemical engineering [Internet]. 1997;14(3).
152. Dadi AP. Enhancement of cellulose saccharification kinetics using an ionic liquid pertreatment step. Biotechnology and Bioengineering. 2006;95:904-10.
153. Lu YP, Zhang YH, Lynd LR. Enzyme-microbe synergy during cellulose hydrolysis by clostridium thermocellum . The Proceddings of the National Academy of Sciences. 2006;103(44):16165-9.
154. Miyamoto K. Cellulase production. In: Miyamoto K, editor. Renewable biological systems for alternative sustainable energy production. Miyamoto, K. ed. FAO Agricultural Services Bulletin; 1997. p. 128.
155. Reese ET, Sui RG, Levinson HS. The biological degradation of soluble cellulose derivatives and its relationship to the mechanism of cellulose hydrolysis. The Journal of Bacteriology. 1950;59:485-97.

170
156. Himmel ME, Adney WS, Baker JO, Nieves RA, Thomas SR. Cellulase: Structure, function, and application. In: Wyman CE, editor. Handbook on bioethanol: production and utilization. Washington D.C.: Taylor & Francis; 1996. p. 143-62.
157. Coughlan MP, Ljungdahl LG. Comparative biochemistry of fungal and bacterial cellulolytic enzyme systems. In: Aubert JP, Beguin P, Millet J, editors. Biochemistry and Genetics of Cellulose Degradation New York: Academic Press; 1988. p. 11-30.
158. Teeri T. Crystalline cellulose degradation: New insight into the function of cellobiohydrolases. Trends in biotechnology. 1997;15:160-7.
159. Schell DJ, Riley CJ, Dowe N, Farmer J, Ibsen KN, Ruth MF, et al. A bioethanol process development unit: Initial operating experiences and results with a corn fiber feedstock. Bioresour Technol. 2004 1;91(2):179-88.
160. Henrissat B. Cellulases and their interaction with cellulose. Cellulose. 1994;1:169-96.
161. Zhang YHP, Lynd LR. A functionally based model for hydrolysis of cellulose by fungal cellulase. Biotechnology and Bioengineering. 2006;94(5):888-98.
162. Avgerinos GC, Wang DIC. Selective solvent delignification for fermentation enhancement. Biotechnology and Bioengineering. 1983;25:67-83.
163. Walker LP, Wilson DB. Enzymatic hydrolysis of cellulose: An overview. Bioresour Technol. 1991;36(1):3-14.
164. Jeoh T, Ishizawa CI, Davis MF, Himmel ME, Adney WS. Cellulase digestibility of pretreated biomass is limited by cellulose accessibility. Biotechnology and Bioengineering. 2007;98(1):112-22.
165. Grethlein HE. The effect of pore size distribution on the rate of enzymatic hydrolysis of cellulosic substrates. Bioresource technology. 1985;3:155-60.
166. Weise U. Hornification: Mechanisms and terminology. Paperi Ja Puu-Paper and timber. 1998;80(2):110-5.
167. Shevchenko SM, Chang K, Robinson J, Saddler JN. Optimization of monosaccharide recovery by post-hydrolysis of the water-soluble hemicellulose component after steam explosion of softwood chips. Bioresour Technol. 2000 5;72(3):207-11.
168. Tsao GT, Ladisch M, Ladisch C, Hsu TA, Dale B, Chou T. Fermentation substrates from cellulosic materials: Production of fermentable sugars from cellulosic

171
materials . Annual Report on Fermentation Processes. 1978;2:1-21.
169. Gould JM. Studies on the mechanism of alkaline peroxide delignification of agricultural residues. Biotechnology and Bioengineering. 1985;27:225-31.
170. Kong F, Engler CR, Soltes EJ. Effect of cell-wall acetate, xylan backbone, and lignin on enzymatic hydrolysis of aspen wood. Biotechnology and Applied Biochemistry. 1992;34-35:23-35.
171. Esteghlalian AR, Bilodeau M, Mansfeld SD, Saddler JN. Do enzymatic hydrolyzability and simons’ stain reflect the changes in the accessibility of lignocellulosic substrates to cellulase enzymes? Biotechnology Progress. 2001;17(6):1049-54.
172. Karen M, Kleman-Leyer M, Kirk TK. Three native cellulose-depolymerizing endoglucanases from solid-substrate cultures of the brown rot fungus meruliporia (serpula) incrassata . Applied and Environmental Microbiology. 1994;60(8):2839-45.
173. Fan LT, Lee YH, Beardmore DH. Mechanism of enzymatic hydrolysis of cellulose: Effects of major structural features of cellulose on enzymatic hydrolysis. Biotechnology and Bioengineering. 1980;22:177-99.
174. Nazhad MM, Ramos LP, Paszner L, Saddler JN. Structural constrains affecting the initial enzymatic hydrolysis of recycled paper. Enzyme and microbial technology. 1995;17:68-74.
175. Han YW, Callihan CD. Cellulose fermentation: Effect of substrate pretreatment on microbial growth. Applied Microbiology. 1947;27(1):159-65.
176. Yoon HH. Pretreatment of ligninocelluosic biomass by autohydrolysis and aqueous ammonia percolation. Korean Journal of Chemical Engineering. 1998;15(6):631-6.
177. Grohmann K, Mitchell DJ, Himmel ME. The role of estare groups in resistance of plant cell wall polysaccharides to enzymatic hydrolysis. Biotechnology and Applied Biochemistry. 1989;20-21:45-61.
178. Miller EN, Turner PC, Jarboe LR, Ingram LO. Genetic changes that increase 5-hydroxymethyl furfural resistance in ethanol-producing escherichia coli LY180. Biotechnology Letters. 2010;32(5):661-7.

172
179. Preziosi-Belloy L, Nolleau V, Navarro JM. Fermentation of hemicellulosic sugars and sugar mixtures to xylitol by candida parapsilosis. Enzyme Microb Technol. 1997 8/1;21(2):124-9.
180. Wu Z, Lee Y,Y. Inhibition of the enzymatic hydrolysis of cellulose by ethanol. Biotechnology Letters. 1997;19(10):977-9.
181. Spinder DD, inventor; Simultaneous saccharification and fermenation using cellobiose fermenting yeast brettanomyces custersii. United States 1992 .
182. Mountfort DM, Roberton AM. Origins of fermentation products formed during growth of bacteroides ruminicola on glucose. Journal of General Microbiology. 1978;106:353-60.
183. Cazetta ML, Celligoi MAPC, Buzato JB, Scarmino IS. Fermentation of molasses by zymomonas mobilis: Effects of temperature and sugar concentration on ethanol production. Bioresour Technol. 2007 11;98(15):2824-8.
184. Dien BS, Cotta MA, Jeffries TW. Bacteria engineered for fuel ethanol production: Current status. Applied Microbiology and Biotechnology. 2003;63(3):258-66.
185. Maki M, Leung KT, Qin W. The prospects of cellulase-producing bacteria for the bioconversion of lignocellulosic biomass. International Journal of Biological Sciences. 2009;5(5):500-516.
186. Raman B, Pan C, Hurst GB, Rodriguez M, Jr., McKeown CK, Lankford PK, et al. Impact of pretreated switchgrass and biomass carbohydrates on clostridium thermocellum ATCC 27405 cellulosome composition: A quantitative proteomic analysis. PLoS One. 2009;4(4).
187. Bayer EA, Lamed R, White BA, Flint HJ. From cellulosomes to cellulosomics. Chemical Record. 2008;8(6):364-377.
188. Williams AG, Withers SE. The production of hemicellulose-degrading enzymes by bacillus macerans in anaerobic culture. Applied Microbiology and Biotechnology. 1985;22(3):318-324.
189. Abrini J, Naveau H, Nyns E. Clostridium autoethanogenum, sp. nov., an anaerobic bacterium that produces ethanol from carbon monoxide. Archives of Microbiology. 1994;161(4):345-351.
190. Liou JS-, Balkwill DL, Drake GR, Tanner RS. Clostridium carboxidivorans sp. nov., a solvent-producing clostridium isolated from an agricultural settling lagoon, and reclassification of the acetogen clostridium scatologenes strain SL1 as

173
clostridium drakei sp. nov. Int J Syst Evol Microbiol. 2005 September 1;55(5):2085-91.
191. El Kanouni A, Zerdani I, Zaafa S, Znassni M, Loutfi M, Boudouma M. The improvement of glucose/xylose fermentation by clostridium acetobutylicum using calcium carbonate. World Journal of Microbiology & Biotechnology. 1998;14(3):431-435.
192. Wiegel J, Ljungdahl LG, Rawson JR. Isolation from soil and properties of the extreme thermophile clostridium thermohydrosulfuricum.. J Bacteriol. 1979 September 1;139(3):800-10.
193. Freier-Schroeder D, Wiegel J, Gottschalk G. Butanol formation by clostridium thermosaccharolyticum at neutral pH. Biotechnology Letters. 1989;11(11):831-836.
194. Mutschlechner O, Swoboda H, Gapes JR. Continuous two-stage ABE-fermentation using clostridium beijerinckii NRRL B592 operating with a growth rate in the first stage vessel close to its maximal value. Journal of Molecular Microbiology and Biotechnology. 2000;2(1):101-105.
195. Adelsberger H, Hertel C, Glawischnig E, Zverlov VV, Schwarz WH. Enzyme system of clostridium stercorarium for hydrolysis of arabinoxylan: Reconstitution of the in vivo system from recombinant enzymes. Microbiology. 2004 July 1;150(7):2257-66.
196. George HA, Johnson JL, Moore WEC, Holdeman LV, Chen JS. Acetone, isopropanol, and butanol production by clostridium beijerinckii (syn. clostridium butylicum) and clostridium aurantibutyricum. Appl Environ Microbiol. 1983 March 1;45(3):1160-3.
197. Sutton DD, Starr MP. Intermediary metabolism of carbohydrate by erwinia amylovora. Journal of Bacteriology. 1960;80(1):104-10.
198. Schmitt P, Vasseur C, Phalip V, Huang DQ, Diviès C, Prévost H. Diacetyl and acetoin production from the co-metabolism of citrate and xylose by leuconostoc mesenteroides subsp. mesenteroides. Applied Microbiology and Biotechnology. 1997;47(6):715-8.
199. Finn RK, Bringer S, Sahm H. Fermentation of arabinose to ethanol by sarcina ventriculi. Applied Microbiology and Biotechnology. 1984;19(3):161-6.
200. Thomas TD, Ellwood DC, Longyear VM. Change from homo- to heterolactic fermentation by streptococcus lactis resulting from glucose limitation in anaerobic chemostat cultures. Journal of bacteriology. 1979;138(1):109-17.

174
201. Breznak JA, Canale-Parola E. Morphology and physiology of spirochaeta aurantia strains isolated from aquatic habitats. Archives of Microbiology. 1975;105(1):1-12.
202. Hespell RB, Canale-Parola E. Carbohydrate metabolism in spirochaeta stenostrepta. Journal of bacteriology. 1970;103(1):216-26.
203. Hespell RB, Canale-Parola E. Glucose and pyruvate metabolism of spirochaeta litoralis, an anaerobic marine spirochete. Journal of bacteriology. 1973;116(2):931-7.
204. Larsen L, Nielsen P, Ahring BK. Thermoanaerobacter mathranii sp. nov., an ethanol-producing, extremely thermophilic anaerobic bacterium from a hot spring in iceland. Archives of Microbiology. 1997;168(2):114-119.
205. Baratti JC, Bu'lock JD. Zymomonas mobilis: A bacterium for ethanol production. Biotechnol Adv. 1986;4(1):95-115.
206. Nochur SV, Roberts MF, Demain AL. True cellulase production by clostridium thermocellum grown on different carbon sources. Biotechnology Letters. 1993;15(6):641-646.
207. Canganella F, Wiegel J. The potential of themophilic clostridia in biotechnology. In: Woods DR, editor. The clostridia and biotechnology. Stoneham, MA: Butterworth-Heinemann; 1993. p. 393-429.
208. Chinn MS, Nokes SE, Strobel HJ. Screening of thermophilic anaerobic bacteria for solid substrate cultivation on lignocellulosic substrates. Biotechnology Progress. 2006;22(1):53-59.
209. Collet C, Gaudard O, Péringer P, Schwitzguébel J. Acetate production from lactose by clostridium thermolacticum and hydrogen-scavenging microorganisms in continuous culture—Effect of hydrogen partial pressure. J Biotechnol. 2005 8/22;118(3):328-38.
210. Li S, Kuo S, Lin J, Lee Z, Wang Y, Cheng S. Process performance evaluation of intermittent–continuous stirred tank reactor for anaerobic hydrogen fermentation with kitchen waste. Int J Hydrogen Energy. 2008 3;33(5):1522-31.
211. de Vrije T, Bakker R, R., Budde MAW, Lai MH, Mars AE, Claassen PAM. Efficient hydrogen production from the lignocellulosic energy crop miscanthus by the extreme thermophilic bacteria caldicellulosiruptor saccharolyticus and thermotoga neapolitana. Biotechnology for Biofuels. 2009;2(12):1-15.
212. Debeire P, Prien B, Strecker G, Vignon M. Purification and properties of an endo-1,4-xylanase. European Journal of Biochemistry. 1990 02/14;187(3):573-80.

175
213. Sunna A, Antranikian G. Xylanolytic enzymes from fungi and bacteria. Critical Reviews in Biotechnology. 1997;17(1):39-67.
214. Alshiyab HS, Kalil MS, Abdul Hamid A, Yusoff WMW. Improvement of biohydrogen production under increased the reactor size by C. acetobutylicum NCIMB 13357. American Journal of Environmental Sciences. 2009;5(1):33-40.
215. Le Ruyet P, Dubourguier HC, Albagnac G, Prensier G. Characterization of clostridium thermolacticum sp. nov., a hydrolytic thermophilic anaerobe producing high amounts of lactate. Systematic and Applied Microbiology. 1985;6(2):196-202.
216. Wang DIC, Avgerinos GC, Biocic I, Wang SD, Fang HY, Young FE. Ethanol from cellulosic biomass [and discussion]. Phil Trans R Soc B. 1983 Jan. 26;300(1100, Industrial and Diagnostic Enzymes):323-33.
217. Levin DB, Islam R, Cicek N, Sparling R. Hydrogen production by clostridium thermocellum 27405 from cellulosic biomass substrates. Int J Hydrogen Energy. 2006 9;31(11):1496-503.
218. Demain AL. Introductory chapter: The crucial importance of bioethanol and the contribution of anaerobic bacteria and their cellulosomes. In: Cellulosome. ; 2006. p. 1-9.
219. Felix CR, Ljungdahl LG. The cellulosome: The exocellular organelle of clostridium. Annual Review of Microbiology. 1993;47:791-819.
220. Spinnler HE, Lavigne B, Blachere H. Pectinolytic activity of clostridium thermocellum: Its use for anaerobic fermentation of sugar beet pulp. Applied Microbiology and Biotechnology. 1986;23(6):434-437.
221. Lamed RJ, Lobos JH, Su TM. Effects of stirring and hydrogen on fermentation products of clostridium thermocellum. Appl Environ Microbiol. 1988 May 1;54(5):1216-21.
222. Zhang YHP, Lynd LR. Biosynthesis of radiolabeled cellodextrins by the clostridium thermocellum cellobiose and cellodextrin phosphorylases for measurement of intracellular sugars. Applied Microbiology & Biotechnology. 2006 03;70(1):123-9.
223. Kurose N, Yagyu J, Miyazaki T, Uchida M, Hanai S, Obayashi A. Evaluation of ethanol productivity from cellulose by clostridium thermocellum. Journal of Fermentation Technology. 1986 10;64(5):447-50.

176
224. Gordon J, Cooney CL. Biochemical engineering: Renewable sources of energy and chemical feedstocks. In: Nystrom JM, Barnett SM, editors. American Institute of Chemical Engineers Symposium Series. ; 1987. p. 181-186.
225. Ozpinar O, Ozkan M. Cellulose degradation and glucose accumulation by clostridium thermocellum ATCC 27405 under different cultural conditions. Annals of Microbiology (Milano, Italy). 2007;57(3):395-400.
226. Morag E, Bayer EA, Lamed R. Relationship of cellulosomal and noncellulosomal xylanases of clostridium thermocellum to cellulose-degrading enzymes. J Bacteriol. 1990 October 1;172(10):6098-105.
227. Rani KS, Swamy MV, Seenayya G. Increased ethanol production by metabolic modulation of cellulose fermentation in clostridium thermocellum. Biotechnology Letters. 1997;19(8):819-823.
228. Rani KS, Swamy MV, Sunitha D, Haritha D, Seenayya G. Improved ethanol tolerance and production in strains of clostridium thermocellum. Journal of Microbiology & Biotechnology. 1996;12(1):57-60.
229. Zhang X, Han J, Lin P, Wang T. Studies on fermentaion of cellulose by thermophilic bacteria. Acta Microbiological Sinica. 1981;21(2):214-217.
230. Lu F, Min H, Chen M. Advances in ethanol production by cellulose decomposition with clostridium thermocellum. Food and Fermentation Industries. 1996;6:43-49.
231. Alexander JK, Connors R, Yamamoto N. In: Production of liquid fuels from cellulose by combined saccharification-fermentation or cocultivation of clostridia. Adv. biotechnol., [proc. int. ferment. symp.], 6th; ; 1981. p. 125-130.
232. Ram MS, Seenayya G. Production of ethanol from straw and bamboo pulp by primary isolates of clostridium thermocellum. World Journal of Microbiology & Biotechnology. 1991;7(3):372-378.
233. Halliwell G. Microcrystalline forms of cellulose as substrates for strains of clostridium thermocellum and cellulase formation. Process Biochemistry. 1995;30(3):243-50.
234. Lamed R, Bayer EA, Saha BC, Zeikus JG. In: Biotechnological potential of enzymes from unique thermophiles. Int. biotechnol. symp., 8th; ; 1988. p. 371-383.
235. Nataf Y, Yaron S, Stahl F, Lamed R, Bayer EA, Scheper T, et al. Cellodextrin and laminaribiose ABC transporters in clostridium thermocellum. J Bacteriol. 2009 January 1;191(1):203-9.

177
236. Lu Y, Zhang YP, Lynd LR. Enzyme–microbe synergy during cellulose hydrolysis by clostridium thermocellum. Proceedings of the National Academy of Sciences. 2006 October 31;103(44):16165-9.
237. Zhang YHP, Lynd LR. Regulation of cellulase synthesis in batch and continuous cultures of clostridium thermocellum. J Bacteriol. 2005 January 1;187(1):99-106.
238. Chinn MS, Nokes SE, Strobel HJ. Influence of moisture content and cultivation duration on clostridium thermocellum 27405 end-product formation in solid substrate cultivation on avicel. Bioresource Technology. 2008;99(7):2664-2671.
239. Brener D, Johnson BF. Relationship between substrate concentration and fermentation product ratios in clostridium thermocellum Cultures. Appl Environ Microbiol. 1984 May 1;47(5):1126-9.
240. Ng TK, Ben-Bassat A, Zeikus JG. Ethanol production by thermophilic bacteria: Fermentation of cellulosic substrates by cocultures of clostridium thermocellum and clostridium thermohydrosulfuricum. Appl Environ Microbiol. 1981 June 1;41(6):1337-43.
241. South CR, Hogsett DA, Lynd LR. Continuous fermentation of cellulosic biomass to ethanol. Applied Biochemistry and Biotechnology. 1993;39-40(587-600).
242. Yu EKC, Chan MKH, Saddler JN. Butanol production from cellulosic substrates by sequential coculture of clostridium thermocellum and C. acetobutylicum.. Biotechnology Letters. 1985;7(7):509-514.
243. Lu Y, Lai Q, Zhang C, Zhao H, Ma K, Zhao X, et al. Characteristics of hydrogen and methane production from cornstalks by an augmented two- or three-stage anaerobic fermentation process. Bioresource Technology. 2009;100(12):2889-2895.
244. Saddler JN, Chan MK, Louis-Seize G. A one step process for the conversion of cellulose to ethanol using anaerobic microorganisms in mono- and co-culture. Biotechnology Letters. 1981;3(6):321-326.
245. Saddler JN, Chan MKH. Optimization of clostridium thermocellum growth on cellulose and pretreated wood substrates. European Journal of Applied Microbiology and Biotechnology. 1982;16(2-3):99-104.
246. Saddler JN, Chan MKH. Conversion of pretreated lignocellulosic substrates to ethanol by clostridium thermocellum in mono- and coculture with clostridium thermosaccharolyticum and clostridium thermohydrosulfuricum. Canadian Journal of Microbiology. 1984;30(2):212-220.

178
247. Avgerinos GC, Fang HY, Biocic I, Wang DIC. In: A novel, single-step microbial conversion of cellulosic biomass to ethanol. Adv. biotechnol., [proc. int. ferment. symp.], 6th; ; 1980. p. 119-124.
248. Weimer PJ, Chou Y-T. Anaerobic fermentation of woody biomass pretreated with supercritical ammonia. Appl Environ Microbiol. 1986 October 1;52(4):733-6.
249. Bailey J, Birnbaum S, Galazzo J, Khosla C, Shanks J. Strategies and challenges in metabolic engineering. Annals of the New York Academy of Sciences. 1990;589:1-15.
250. Mori Y. Isolation of mutants of clostridium thermocellum with enhanced cellulase production. Agricultural and Biological Chemistry. 1990;54(3):825-826.
251. Sato K, Tomita M, Yonemura S, Goto S, Sekine K, Okuma E, et al. Characterization of and ethanol hyper-production by clostridium thermocellum I-1-B. Bioscience, Biotechnology, and Biochemistry. 1993;57(12):2116-2121.
252. Zverlov VV, Schwarz WH. Bacterial cellulose hydrolysis in anaerobic environmental subsystems—clostridium thermocellum and clostridium stercorarium, thermophilic plant-fiber degraders. Annals of the New York Academy of Sciences. 2008;1125:298-307.
253. Tailliez P, Girard H, Millet J, Beguin P. Enhanced cellulose fermentation by an asporogenous and ethanol-tolerant mutant of clostridium thermocellum. Appl Environ Microbiol. 1989 January 1;55(1):207-11.
254. Fang X, Yano S, Inoue H, Sawayama S. Strain improvement of acremonium cellulolyticus for cellulase production by mutation. Journal of Bioscience and Bioengineering. 2009 3;107(3):256-61.
255. Tailliez P, Girard H, Longin R, Beguin P, Millet P. Cellulose fermentation by an asporogenous mutant and an ethanol-tolerant mutant of clostridium thermocellum. Applied and Environmental Microbiology. 1989;55(1):203-6.
256. Rao RP, Dufour N, Swana J. Using microorganisms to brew biofuel. Vitro Cellular & Developmental Biology - Plant. 2011:1-13.
257. Chandel AK, Chandrasekhar G, Radhika K, Ravinder R, Ravindra P. Bioconversion of pentose sugars into ethanol: A review and future directions. Biotechnology and Molecular biology review. 2011;6(1):8-20.
258. Mai V, Lorenz WW, Wiegel J. Transformation of thermoanaerobacterium sp. strain JW/SL-YS485 with plasmid pIKM1 conferring kanamycin resistance. FEMS Microbiology Letters. 1997;148(2):163-7.

179
259. Maki M, Leung KT, Qin W. The prospects of cellulase-producing bacteria for the bioconversion of lignocellulosic biomass. International Journal of Biological Sciences. 2009;5(5):500-516.
260. Ho NWY, Chen Z, Brainard AP. Genetically engineered saccharomyces yeast capable of effective cofermentation of glucose and xylose. Applied and Environmental Microbiology. 1998;64(5):1852-9.
261. Ingram LO, Gomez PF, Lai X, Moniruzzaman M, Wood BE, Yomano LP, et al. Metabolic engineering of bacteria for ethanol production. Biotechnology and bioengineering. 1998;58(2-3):204-14.
262. Guerreiro CIPD, Fontes CMGA, Gama M, Domingues L. Escherichia coli expression and purification of four antimicrobial peptides fused to a family 3 carbohydrate-binding module (CBM) from clostridium thermocellum. Protein Expr Purif. 2008 5;59(1):161-8.
263. Detroy RW, Cunningham RL, Bothast RJ, Bagby M, Herman A. Biuconversion of wheat straw cellulose/hemicellulose to ethanol by saccharomyces uvarum and pachysolen tannophilu . Biotechnology and Bioengineering. 2004;24(5):1-9.
264. Jong-Gubbels P, Van Dijken JP, Pronk JT. Metabolic fluxes in chernostat cultures of schizosaccharomyces pombe grown on mixtures of glucose and ethanol. Microbiology. 1996;142:1399-407.
265. Morikawa Y, Takasawa s, Masunaga I, Takayama K. Ethanol productions from D-xylose and cellobiose by kluyveromyces cellobiovorus. Biotechnology and Bioengineering. 2004;27(4):1-5.
266. Matsushika A, Watanabe S, Kodaki T, Makino K, Sawayama S. Bioethanol production from xylose by recombinant saccharomyces cerevisiae expressing xylose reductase, NADP+-dependent xylitol dehydrogenase, and xylulokinase. Journal of Bioscience and Bioengineering. 2008 3;105(3):296-9.
267. Visser W, Scheffers WA, Batenburg-Van Der Vegte WH, Van Dijken JP. Oxygen requirements of yeasts. Applied and Environmental Microbiology. 1990;56(12):3785-92.
268. Morais PB, Rosa CA, Linardi VR, Carazza F, Nonato EA. Production of fuel alcohol by saccharomyces strains from tropical habitats. Biotechnology Letters. 1996;18(11):1351-6.
269. Xu Q, Song Q, Ai X, McDonald TJ, Long H, Ding S, et al. Engineered carbohydrate-binding module (CBM) protein-suspended single-walled carbon

180
nanotubes in water. Chemical Communications (Cambridge, United Kingdom). 2009;3:337-339.
270. Singha LK, Chaudharya G, Majumderb CB, Ghosha S. Utilization of hemicellulosic fraction of lignocellulosic biomaterial for bioethanol production. Advances in Applied Science Research. 2011;2(5):508-21.
271. Bettiga M, Bengtsson O, Hahn-Hägerdal B, Gorwa-Grauslund MF. Arabinose and xylose fermentation by recombinant saccharomyces cerevisiae expressing a fungal pentose utilization pathway. Applied and Environmental Microbiology. 2009;8(40).
272. Schuster E, Dunn-Coleman N, Frisvad J, Van Dijck P. On the safety of aspergillus niger – a review. Applied Microbiology and Biotechnology. 2002;59(4-5):426-35.
273. Kang SW, Park YS, Lee JS, Hong SI, Kim SW. Production of cellulases and hemicellulases by aspergillus niger KK2 from lignocellulosic biomass. Bioresour Technol. 2004 1;91(2):153-6.
274. Abouzied MM, Reddy CA. Direct fermentation of potato starch to ethanol by cocultures of aspergillus niger and saccharomyces cerevisiae. Applied and Environmental Microbiology. 1986;52(5):1055-9.
275. Weimer PJ, Koegel RG, Lorenz LF, Frihart CR, Kenealy WR. Wood adhesives prepared from lucerne fiber fermentation residues of ruminococcus albus and clostridium thermocellum. Applied Microbiology & Biotechnology. 2005 04;66(6):635-40.
276. Joe S A, Jenney Jr. FE, Adams MWW, Lynd LR. End-product pathways in the xylose fermenting bacterium, thermoanaerobacterium saccharolyticum. Enzyme Microb Technol. 2008 5/5;42(6):453-8.
277. Taherzadeh MJ, Karimi K. Enzyme-based hydrolysis processes for ethanol from lignocellulosic materials: A review. BioResources. 2007;2(4):707-738.
278. Nevoigt E. Progress in metabolic engineering of saccharomyces cerevisiae. Microbiol Mol Biol Rev. 2008 September 1;72(3):379-412.
279. Xiros C, Christakopoulos P. Enhanced ethanol production from brewer's spent grain by a fusarium oxysporum consolidated system. Biotechnology for Biofuels. 2009;2(1):4.
280. Vergara W. In: Improving the scenario for ethanol production: The new ethanol producers. Proc. int. symp. alcohol fuels technol., 4th; ; 1981. p. 143-150.

181
281. Herrero AA, Gomez RF. In: Inhibition of clostridium thermocellum by fermentation products and related compounds. Adv. biotechnol., [proc. int. ferment. symp.], 6th; ; 1981. p. 213-218.
282. Tyurin MV, Sullivan CR, Lynd LR. Role of spontaneous current oscillations during high-efficiency electrotransformation of thermophilic anaerobes. Appl Environ Microbiol. 2005 December 1;71(12):8069-76.
283. Ohmiya K, Sakka K, Kimura T. Anaerobic bacterial degradation for the effective utilization of biomass. Biotechnology and Bioprocess Engineering. 2005;10(6):482-493.
284. Pines G, Freeman A. Immobilization and characterization of saccharomyces cerevisiae in crosslinked, prepolymerized polyacrylamide-hydrazide. European Journal of Applied Microbiology and Biotechnology. 1982;16(2-3):75-80.
285. Karel SF, Libicki SB, Robertson CR. The immobilization of whole cells: Engineering principles. Chemical Engineering Science. 1985;40(8):1321-54.
286. Horne PN, Hsu H. Immobilization of clostridium thermocellum cells on bituminous coal particles. Anal Biochem. 1983 2/15;129(1):72-9.
287. Jo JH, Lee DS, Park D, Park JM. Biological hydrogen production by immobilized cells of clostridium tyrobutyricum JM1 isolated from a food waste treatment process. Bioresource Technology. 2008;99(4):6666-6672.
288. Park JK, Chang HN. Microencapsulation of microbial cells. Biotechnol Adv. 2000 7;18(4):303-19.
289. Sluiter A, Harnes B, Ruiz R, Scarlata C, Sluiter J. NREL laboratory analytical procedure: Determination of structural carbohydrates and lignin in biomass. [Internet]. 2008:May 11, 2009. Available from: http://www.nrel.gov/biomass/pdfs/42618.pdf.
290. Klein J, Stock J, Vorlop KD. Pore size and properties of spherical calcium alginate biocatalysts. European Journal of Applied Microbiology and Biotechnology. 1983;18(2):86-91.
291. Klein J, Vorlop KD, Steinert HJ, inventors; German Patent 1986 .
292. Loomis AK, Childress AM, Daigle D, Bennett JW. Alginate encapsulation of the white rot fungus phanerochaete chrysosporium. Current Microbiology. 1997;34(2):127-130.

182
293. Kim YK, Kitaoka M, Krishnareddy M, Mori Y, Hayashi K. Kinetic studies of a recombinant cellobiose phosphorylase (CBP) of the clostridium thermocellum YM4 strain expressed in escherichia coli . Journal of Biochemistry. 2002(132):197-203.
294. Baskaran S, Ahn HJ, Lynd LR. Investigation of the ethanol tolerance of clostridium thermosaccharolyticum in continuous culture. Biotechnol Prog. 1995;11(3):276-81.
295. Cheetham PJ, Blunt KW, Bucke C. Physical studies on cell immobilization using calcium alginate gels. Biotechnology and Bioengineering. 2004;21(12):1-14.
296. Ren NQ, Li YF, Ding J, Lin HL, Zheng GX, Chui YG. Biohydrogen II: The engineering and applications. Advance in Earth Sciences. 2004;19:542-6.
297. Dimme DR, Bozell JJ. Pulping catalysts from lignin. TAPPI Journal. 1991;75(4):239-41.
298. Kundu S, Ghose TK, Mukhopadhyay SN. Bioconversion of cellulose into ethanol by clostridium thermocellum - product inhibition. Biotechnol Bioeng. 1983;25(4):1109-1126.
299. Xu L, Tschirner U. Improved ethanol production from various carbohydrates through anaerobic thermophilic co-culture. Bioresour Technol. 2011 11;102(21):10065-71.
300. He Q, Lokken MP, Chen S, Zhou J. Characterization of the impact of acetate and lactate on ethanolic fermentation by thermoanaerobacter ethanolicus.. Bioresour Technol. 2009;100(23):5955-65.
301. Raman B, Pan C, Hurst BG, Rodriguez M, McKeown KC, Lankford KP, et al. Impact of pretreated switchgrass and biomass carbohydrates on clostridium thermocellum ATCC 27405 cellulosome composition: A quantitative proteomic analysis. PLoS ONE 4. 2009;4(4):e5271.
302. Pellerina P, Gosselina M, Lepoutrea J, Samaina E, Debeire P. Enzymic production of oligosaccharides from corncob xylan. Enzyme Microb Technol. 1991;13(8):617-21.
303. Herrero AA, Gomez RF, Roberts MF. Ethanol-induced changes in the membrane lipid composition of clostridium thermocellum.. Biochim Biophys Acta. 1982 12/8;693(1):195-204.

183
304. Herrero AA, Gomez RF, Roberts MF. 31P NMR studies of clostridium thermocellum: Mechanism of end product inhibition by ethanol. J Biol Chem. 1985;260(12):7442-51.
305. Prates JAM, Tarbouriech N, Charnock SJ, Fontes CMGA, Ferreira LMA, Davies GJ. The structure of the feruloyl esterase module of xylanase 10B from clostridium thermocellum provides insights into substrate recognition. Structure. 2001 12;9(12):1183-90.
306. Kim YJ, Weigand AW. Experimental analysis of a product inhibited fermentation in an aqueous two-phased system. Appl Biochem Biotechnol. 1992;34-35(1):419-30.
307. Shoham Y, Lamed R, Bayer EA. The cellulosome concept as an efficient microbial strategy for the degradation of insoluble polysaccharides. Trends Microbiol. 1999 7/1;7(7):275-81.
308. Bothun GD, Knutson BL, Berberich JA, Strobel HJ, Nokes SE. Metabolic selectivity and growth of clostridium thermocellum in continuous culture under elevated hydrostatic pressure. Appl Microbiol Biotechnol. 2004;65(2):149-57.
309. Jeffries TW. Conversion of xylose to ethanol under aerobic conditions by candida tropicalis.. Biotechnol Lett. 1981;3(5):213-8.
310. Meinecke B, Bertram J, Gottschalk G. Purification and characterization of the pyruvate-ferredoxin oxidoreductase from clostridium acetobutylicum.. Arch Microbiol. 1989;152(3):244-50.
311. Xu L, Tschirner U. Peracetic acid pretreatment of alfalfa stem and aspen biomass . BioResources. 2012;7(1):203-16.