bio-demographic change and socio-economic trends in bulgaria
TRANSCRIPT

Economics and Human Biology 1 (2003) 413–428
Bio-demographic change and socio-economictrends in Bulgaria
Rossitsa RangelovaInstitute of Economics, Bulgarian Academy of Sciences, Aksakov Street, PO Box 788, Sofia 1040, Bulgaria
Received 1 September 2003; received in revised form 1 September 2003; accepted 1 September 2003
Abstract
Recent bio-demographic change in Bulgaria is analysed in conjunction with socio-economictrends. The exceptionally serious problem of the “ageing population” is outlined, and its mainsocio-economic consequences are discussed. The main reason for the population aging is the lowfertility rate and the large number of emigrants, especially during the last decade. For the populationin Bulgaria to grow at all, policies need to be adopted to increase the fertility rate, lower theemigration rate, and provide incentives for those who have already left the country to return.Furthermore, social policies are needed to support the family, in order to encourage fertility andimprove the social and health status of population. The socio-economic crisis that began in the1990s must be overcome before the standard of living can increase.© 2003 Elsevier B.V. All rights reserved.
JEL classification: J1; I12; P27; P52
Keywords: Bio-demographic change; Ageing population; Health; Bulgaria
1. Introduction
In the last decade the dynamics of Bulgarian population worsened beyond even the mostpessimistic forecasts. Since 1990, the population has aged considerably and now ranksamong the 10 countries with the largest share of population over age 60, just after Italy,Greece, Germany, Japan, Sweden and Belgium (United Nations, 1999). In 2001, the shareof the old reached 22% of the total and it is likely to increase further. Bulgaria is also amongthe countries with the fastest rate of depopulation in Europe (Table 1).
In the context of ongoing radical political and socio-economic changes followed by adeep economic crisis, the future of the Bulgarian population is precarious. The interest
E-mail address: [email protected] (R. Rangelova).
1570-677X/$ – see front matter © 2003 Elsevier B.V. All rights reserved.doi:10.1016/j.ehb.2003.09.001

414 R. Rangelova / Economics and Human Biology 1 (2003) 413–428
Table 1Basic demographic indicators for selected European countries, 1989–2000
Country Years (Per 1000 population) Life expectancy atbirth (1995–2000)(years)Crude
birth ratesCrude deathrates
Infantmortalityrates
Naturalincrease
EU membersAustria 1995 11.0 10.1 5.4 0.9 73.7 (m)
2000 9.6 9.3 4.8 0.3 80.1 (f)
Belgium 1995 11.4 10.2 5.8 1.2 73.9 (m)2000 11.3 10.3 4.9a 1.0 80.6 (f)
Germany 1995 9.4 10.8 5.3 −1.4 73.4 (m)2000 9.2 10.1 4.5a −0.9 79.9 (f)
Greece 1995 13.3 9.6 8.1 0.1 75.5 (m)2000 12.6 10.5 6.1a 1.2 80.6 (f)
Italy 1995 9.2 9.7 6.2 −0.5 75.1 (m)2000 9.4 9.7 4.6 −0.3 81.4 (f)
Netherlands 1995 12.3 8.8 5.4 3.5 75.0 (m)2000 13.0 8.8 5.1 4.2 80.6 (f)
Sweden 1995 11.7 11.0 4.1 0.7 76.2 (m)2000 10.2 10.5 3.4 −0.3 80.8 (f)
EU candidate countriesBulgaria 1989 12.5 11.9 14.4 0.6 67.8 (m)
1995 8.6 13.6 14.8 −5.0 74.9 (f)2000 9.0 14.1 13.3 −5.1
Czech Republic 1995 9.3 11.4 7.6 −2.1 68 (m)2000 8.8 10.6 4.1 −1.8 75 (f)b
Estonia 1995 9.1 14.1 16.0 −5.0 64 (m)2000 9.3 12.7 – −3.4 75 (f)b
Hungary 1989 11.7 13.7 15.7 2.0 64.5 (m)1995 11.0 14.2 10.6 −3.2 73.8 (f)2000 9.7 13.5 9.3 −3.8
Latvia 1995 8.6 15.5 18.4 −6.9 63 (m)2000 – 13.6 10.5 – 75 (f)b
Lithuania 1995 11.1 12.2 13.0 −1.1 65 (m)2000 9.3 10.5 – −1.2 76 (f)b
Poland 1989 14.8 10.0 16.0 4.8 66.7 (m)1995 11.2 10.0 13.4 1.2 75.7 (f)2000 9.8 9.5 8.1 0.3
Romania 1989 16.0 10.7 26.9 5.3 66.0 (m)1995 10.4 12.0 21.1 −1.6 73.2 (f)2000 10.4 11.4 18.6 −1.0
Slovakia 1995 11.5 9.8 12.0 1.7 67 (m)2000 10.2 9.8 – 0.4 75 (f)b

R. Rangelova / Economics and Human Biology 1 (2003) 413–428 415
Table 1 (Continued )
Country Years (Per 1000 population) Life expectancy atbirth (1995–2000)(years)Crude
birth ratesCrude deathrates
Infantmortalityrates
Naturalincrease
Slovenia 1995 9.5 9.5 8.0 0.0 68 (m)2000 9.1 9.3 – −0.2 78 (f)b
Other countriesRussia 1995 14.9 9.5 21.0 −5.4 62 (m)
2000 15.3 8.7 – −6.6 74 (f)b
Ukraine 1995 15.3 9.5 16.0 −5.8 64 (m)2000 15.4 7.8 – −7.6 74 (f)b
m, Male; f, female.Sources: UNs, Monthly Bulletin of Statistics, December 2001; World Statistics Pocketbook,UNs, New York, 1997; Recent Demographic Developments in Europe, 2001.
a 1999.b 1995.
in these issues has been motivated by the mutual relationship between bio-demographicand socio-economic phenomena and processes. Bulgaria underwent a slow and difficulttransition to a market economy in the 1990s. As a result Bulgarian GDP in 2000 was stillonly 70% of its 1989 level, while that of the Czech Republic was about 97%, Hungary’swas 104%, Slovakia’s 108%, Slovenia’s 111%, and Poland’s 125%, according to IMFdata (Bulgaria: Selected Issues and Statistical Appendix, 2001, p. 79). The official rate ofunemployment was high (14% in 2003), and real incomes decreased sharply. Due to thebudget deficit, the share of social expenditures decreased significantly.
At the same time, preparation for integration into the European Union (EU) is a highpriority. However, Bulgaria’s level of the economic development is relatively low: it hasone of the lowest per capita incomes among those invited to negotiate for membership, andits GDP per capita (in purchasing power parity (PPP) terms) is only about one fourth of theEU average. This poses a great challenge for Bulgaria.
The worsening of the demographic situation and health status of population at a time ofeconomic and social crisis is the most alarming phenomena in Bulgaria during the transitionperiod. There are some differences among the candidate countries from Central and East-ern Europe (CEECs), but most have experienced deterioration of demographic and healthindicators during the transition years (Table 1). The economic situation adversely affectedthe access to health services. This article analyses the recent socio-demographic situationin Bulgaria.
2. Bio-demographic characteristics of Bulgaria
2.1. Basic data
Nearly three decades ago, demographers predicted a negative rate of natural increase inBulgaria by the year 2000, but it became a reality well before that, already in 1990. The rateof natural increase was at least positive previously, although continuously decreasing: from
416 R. Rangelova / Economics and Human Biology 1 (2003) 413–428
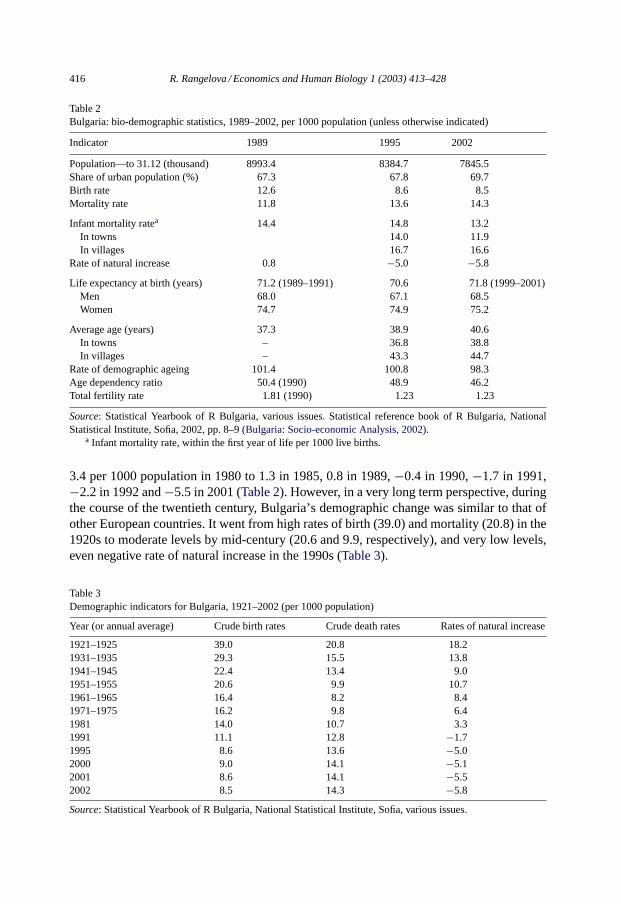
Table 2Bulgaria: bio-demographic statistics, 1989–2002, per 1000 population (unless otherwise indicated)
Indicator 1989 1995 2002
Population—to 31.12 (thousand) 8993.4 8384.7 7845.5Share of urban population (%) 67.3 67.8 69.7Birth rate 12.6 8.6 8.5Mortality rate 11.8 13.6 14.3
Infant mortality ratea 14.4 14.8 13.2In towns 14.0 11.9In villages 16.7 16.6
Rate of natural increase 0.8 −5.0 −5.8
Life expectancy at birth (years) 71.2 (1989–1991) 70.6 71.8 (1999–2001)Men 68.0 67.1 68.5Women 74.7 74.9 75.2
Average age (years) 37.3 38.9 40.6In towns – 36.8 38.8In villages – 43.3 44.7
Rate of demographic ageing 101.4 100.8 98.3Age dependency ratio 50.4 (1990) 48.9 46.2Total fertility rate 1.81 (1990) 1.23 1.23
Source: Statistical Yearbook of R Bulgaria, various issues. Statistical reference book of R Bulgaria, NationalStatistical Institute, Sofia, 2002, pp. 8–9 (Bulgaria: Socio-economic Analysis, 2002).
a Infant mortality rate, within the first year of life per 1000 live births.
3.4 per 1000 population in 1980 to 1.3 in 1985, 0.8 in 1989,−0.4 in 1990,−1.7 in 1991,−2.2 in 1992 and−5.5 in 2001 (Table 2). However, in a very long term perspective, duringthe course of the twentieth century, Bulgaria’s demographic change was similar to that ofother European countries. It went from high rates of birth (39.0) and mortality (20.8) in the1920s to moderate levels by mid-century (20.6 and 9.9, respectively), and very low levels,even negative rate of natural increase in the 1990s (Table 3).
Table 3Demographic indicators for Bulgaria, 1921–2002 (per 1000 population)
Year (or annual average) Crude birth rates Crude death rates Rates of natural increase
1921–1925 39.0 20.8 18.21931–1935 29.3 15.5 13.81941–1945 22.4 13.4 9.01951–1955 20.6 9.9 10.71961–1965 16.4 8.2 8.41971–1975 16.2 9.8 6.41981 14.0 10.7 3.31991 11.1 12.8 −1.71995 8.6 13.6 −5.02000 9.0 14.1 −5.12001 8.6 14.1 −5.52002 8.5 14.3 −5.8
Source: Statistical Yearbook of R Bulgaria, National Statistical Institute, Sofia, various issues.

R. Rangelova / Economics and Human Biology 1 (2003) 413–428 417
Table 4Population age structure in Bulgaria, 1887–2002
Year Up to age 14 15–64 65 and over
1887 41.4 52.1 6.51892 41.7 52.6 5.71900 40.2 54.7 5.11910 39.8 54.9 5.31920 36.2 58.0 5.81926 34.9 59.3 5.81934 35.5 59.3 5.21946 27.9 66.3 5.81960 26.0 66.4 7.61970 22.7 67.5 9.81980 22.1 65.9 12.01990 20.1 66.5 13.41995 17.7 67.1 15.22000 15.5 68.2 16.32001 15.1 68.4 16.52002 14.6 68.4 17.0
Values are in percents.Source: Statistical Yearbook of R Bulgaria. National Statistical Institute, Sofia, variousyears.
The period 1960–1999 was one of accelerating demographic change. The large-scaleindustrialization of the 1960s brought about substantial internal migration from villages tothe urban centers, which resulted in a seriously unbalanced age structure in rural areas. Theinternal migration was most intensive in the 1950s and 1960s, while external migration wasminimal. Mainly old people remained in the countryside with harmful consequences on thereproductive ability of the rural population.
The period 1970–1989 was characterized by relatively stable demographic processes.Bulgaria entered the second demographic transition with declining birth and mortality rates.Yet, the economic and social crisis accompanying the collapse of the centrally plannedeconomy in 1989 had a substantial impact on demographic processes (Table 2). Birth ratescontinued to decline (Table 1), and mortality rates also tended to diminish until 1960 (reach-ing 8.1). Thereafter, mortality rates gradually increased, reaching 11.8 in 1989. However,by the turn of the twenty-first century, it exceeded 14 per 1000 population. Such processesclearly lead to changes in the age structure (Table 4).
The change in the age structure was very seriously influenced by the exile of 300,000Bulgarian Turks into Turkey in 1989 and by the emigration of primarily young people,which reached as high as about 45,000 people per annum. Hence, the total number ofemigrants plus exiles reached some 800,000, i.e., about 9% of the population in 1989. Themain emigration flows were to the USA, Canada, Germany, Austria, Italy, and France.
2.2. Problems of reproduction
The total fertility rate in 2002 was 1.23 well below that the minimum of 2.1 neededfor a stationary population (Table 2). At the same time, average age of maternity has beenvery low. In fact, Bulgaria has the highest adolescent birth rate in Europe, indicative of

418 R. Rangelova / Economics and Human Biology 1 (2003) 413–428
inefficient planning of pregnancies and births. There was also an increase in prematurebirths from 60.6 per 1000 in 1980 to 66.0 in 1990, 81.0 in 1993. Thereafter, it graduallybegan to decrease (Bulgaria, 1995. Situation of Women, p. 10). Unwanted births are an-other negative phenomenon. Born and neglected children in the state institutions, both withor without renouncement of parents’ rights, represent a serious economic, but above allsocio-psychological problem for society.
The increasing number of children with low birth weight has harmful consequences—a higher infant mortality and morbidity rates—and further socio-economic disadvantageslater in life. The share of low-weight babies (under 2500 g) varies from 50% in Bangladeshto 4% in Finland. In the case of Bulgaria, it has moved from 5.3% in 1978 to 6.1% in 1990,and 7.3% in 1992 staying at that level in the subsequent years.1 The mothers of a large shareof these babies tend to be very young, of low education, and often unmarried, and of thelowest socio-economic status.
The above indicators reflect a specific phenomenon for the early transition years—asharply worsened reproductive process, which has begun to stabilize gradually after 1993.The average age of maternity, for example, increased from 23.6 years in 1992 to 25.4 in 2002.Other related indicators, however, remained unfavorable. Maternal mortality in Bulgaria isone of the highest in Europe, in particular for women above age 30. Young educated women,who pursue careers and postpone having children until after age of 30, run a serious riskin pregnancy. Another worrying statistic is that in 1993 only 30% of women were deemedhealthy or practically healthy, down from 68% 10 years ago (Bulgaria, 1995. Situation ofWomen, pp. 7–8).
2.3. Dynamics of the population ageing
During the period 1887–2002 the share of young people in the population declinedcontinually and at an accelerating rate in the 1990s.2 The total number of the children (0–14years) decreased between 1960 and 2002 by some 756,000. The number of children born in1989 was 105,180, while in 2001 it was only 68,180. In contrast, the number of persons olderthan 65 increased continuously mainly because of longer life expectancy. These changes inthe age distribution indicate an imbalance that is not very conducive to the reproduction ofBulgaria’s population. In 1990, the share of the young people (0–14) was 20.1% and thatof the old people (65 and over) was 13.4%, but by the beginning of the twenty-first centurythe share of the old people was already higher than that of the young (Table 4). At the sametime the share of the working age population (15–64) has changed by less than 2% points(from 66.5% in 1990 to 68.4% in 2002). This means that the age pyramid is narrowing atthe bottom and widening at the top.
1 This indicator is not regularly reported in the Bulgarian health statistics, but some studies present a goodoverview (Bulgaria, 1995. Situation of Women, p. 8,Feschieva, 1997).
2 The process of ageing population is defined as increasing of the differences of the share of the predominatedpart (over 50%) of the age groups or when the differences in the share of the groupsx andx − 1 increase. It isknown from demographic statistics that population ageing can be general (when in the dominated age groups thenumber of the people in the previous group is less than in the following group), total (when the number of thepeople in every following age group is higher than that of the previous), partly (when only in some age groups thenumber of the people is higher than that of the previous group), etc.

R. Rangelova / Economics and Human Biology 1 (2003) 413–428 419
Table 5Average age and index of population ageinga in Bulgaria, 1960–2002
Year Average age (years) Index of ageing Year Average age (years) Index of ageing
1960 31.9 29.2 1995 38.4 85.91970 34.0 42.8 2000 39.9 105.11980 35.3 54.1 2001 40.1 109.11990 37.1 66.6 2002 40.6 116.4
Source: Statistical Yearbook of R Bulgaria, National Statistical Institute, various issues.a Number of persons 65 years of age and over per 100 children of age 0–14.
The tendency for the crude death rate to increase in Bulgaria as well as other East-Europeancountries has been referred to as the “paradox of the demographic transition” (Kaloianov,2001). From a theoretical viewpoint at the present stage of the demographic transition, themortality rate should decrease in these countries. This has not happened, however. Theaverage age of the population has exceeded 40 years (Tables 4 and 5).
The dynamics of the indexes of ageing illustrates the gravity of the situation. The processwas less intense in the period 1960–1990, during which it increased from 29.3 to 66.6%,whereas by 2002 it reached 116.4%. This implies that there are more old people in thepopulation than young ones. Various projections demonstrate that the process of populationageing in Bulgaria will worsen in all likelihood.Donkov (1999)has developed 10 sce-narios for the dynamics of the Bulgarian population up to 2050. These scenarios combinedifferent hypotheses for the future dynamics of the three basic variables (fertility, mortal-ity and migration). The first scenario assumes a total fertility rate of 2.1 and provides themost favorable projection of the future course of population decline. Even according to thebest-case scenario, Bulgaria’s population of 8.3 million in 1997, would become 5.8 millionby 2050, and is more likely to be less than 5 million.
3. Bulgaria’s ageing population in an international context
3.1. Evolution of the age structure
The current process of population ageing is affected by the trends of birth rates, whilethe trends of mortality rates are of secondary importance. According to theUnited Nations(1997a, 1997b), the share of people older than 60 is about 10% of the total world population,but it is much higher in the developed countries, about 19% (22.5% in Bulgaria in 2002),and lower in the developing countries (nearly 7%), which are in an earlier stage of thedemographic transition. UN projections indicate that by 2050 those over 65 will makeup 20% of the global population. Moreover, the share of the over 85 in the population isexpected to increase even more rapidly due to the prolonged life expectancy (Heller et al.,1986). By 2020, the least developed countries are expected to have the structure of the mostdeveloped countries in 1970 (OECD, 1997a).
3.2. Demographic change by sex
Although ageing population is observed for both sexes, females predominate at olderages. This is particularly the case in countries with a low birth rate such as northern Italy

420 R. Rangelova / Economics and Human Biology 1 (2003) 413–428
or Germany where this ratio among the elderly reaches 645 men to 1000 women, while inNorth America it is 765. In Bulgaria it is 946 (2002). According to projections, these shareswill decrease to about 725 in Europe until 2020.
The growing sex differential in mortality observed in many countries obtains also inBulgaria. Until 1960, the life expectancy of men was about 4 years less than that of women.However, the gap has now increased to nearly 7 years (Table 2). In contrast, the mortalityrate of men older than 90 has actually been lower than that of females since mid-1970s(Golemanov, 2000). There are no explanations for this phenomenon.
3.3. Economic aspects of ageing population
In practice, there are several main channels through which population ageing affectsthe economy: decreasing labor supply, declining savings, and increasing health care andpensions expenditure. The increasing share of the elderly in the total population posesoverall macroeconomic problems in financing the associated intergenerational transfer ofresources (Rangelova, 1991). According to the life-cycle hypotheses of saving, older peopleare expected to spend accumulated savings, so that the total savings available to the economywill have a tendency to decline. The demographic changes will, therefore, have an affecton economic growth. By 2020, savings at the national level is expected to decrease in manycountries (OECD, 1997a). The largest effect is expected in Japan, GDP would decrease by14% compared to 1995, if demographic trends persist. The GDP in Europe is expected todiminish by about 4.5%, unless the demographic trends are offset by some growth-inducingfactors such as technological change.
3.4. Socio-economic status of the elderly
Because of their longer life spans and lower life-time earnings women tend to fall moreoften into poverty in their advanced age than do men. Women’s income is considerablelower than men’s because of the shorter and interrupted participation in the labor force,tendency for part time work, and lower salaries. In the EU, 15% of men over 60 live alone,while for women the percentage is 39% (Van Solings et al., 1998). Because of the smallernumber of siblings, older people can rely less on relatives for help in case of chronic diseaseor disability in their old age. This requires the necessity of extension of the public system forthis kind of health care. In Bulgaria, as in the other transition countries, the economic andsocial changes affected most people, the welfare of older people living on a fixed incomewas most adversely impacted. Their living standard is extremely low, characterized by ahigh rate of unemployment, poverty and malnutrition (United Nations, 1997b).
3.5. Health care aspects of ageing population
Health expenditures decrease sharply after the first year of life, increase moderatelythereafter to age 60 and accelerate sharply thereafter. Hence, as the share of the elderlyincreases, the demand for medical services tends to increase accordingly. Personal healthexpenditures double after age 70 and double again after age 80 (OECD, 1997b). Part ofthis tendency is related to cost improvements in medical technology. A rational health

R. Rangelova / Economics and Human Biology 1 (2003) 413–428 421
strategy is difficult to devise under such conditions. An effective health policy requiresa detailed understanding of local conditions—ecological, social, demographic, economic,and political—that affect health. Important investments and behavioral changes are neededin many key areas beyond the health sector itself (Macroeconomics and Health, 2001).
4. Social and economic trends over the transition period in Bulgaria
4.1. Economic trends
The youth dependency ratio (I), the number of children aged 0–14 per 100 workingage population (aged 15–64) has decreased markedly since 1960 and the rate of declineduring the last decade (1990–2000) was three times higher than that in first three decades(1960–1990) (Fig. 1). In contrast, the elderly dependency ratio (II), i.e., the number ofpeople 65 and over per 100 working age population (aged 15–64) in 2000 is over two timeshigher than in 1960. The two effects cancel each other, so that the total dependency ratio(III) has remained about constant at about 50% during the period under consideration.
The ageing of the labor force in Bulgaria is likely to have important implications for pro-ductivity growth, the rate of technological change, as well as on the savings-consumptionof the population. Furthermore, the skills and qualification of the Bulgarian labor forcecorrespond to an out-of-date industrial structure, putting additional pressure on the labormarket, and burdens the state budget on account of the required social benefits and in-surance payments. The new reality requires new education policies including languagecompetence, computer skills, and willingness to be flexible to adapt to new needs of theeconomy.
4.2. Social trends
There has been a deep economic crisis in Bulgaria over the last 13 years (Table 3). Thedecline in real wages has been particularly worrisome. It has been caused not only by theincreases in the price level, but also by a failure of productivity to grow sufficiently. Pensionsare about a third of average salaries, a very low level. In addition, the unemployment rate isextremely high: 662,000 (17.9% of the economically active population). In addition, thereare some half a million discouraged workers (December 2000), which are not included inthe official statistics. Hence, the actual number of unemployed, who do not contribute tothe insurance funds is closer to 1.1 million. Thus, in 2002 only about a half of those over 15years of age were economically active. This is the main reason for the increased problemsof the pension system, not only the process of population ageing (Table 6).
The latest project of the World Bank, Sofia Office has produced many indicators on thesocial status of the population in Bulgaria.3 The findings depict improved living standardsbut concerns remain for some pockets of extreme destitution that persist in the country.
3 The primary source of quantitative information on the living standard is the Bulgaria Integrated HouseholdSurvey (BIHS), which was conducted by the Gallup International in Sofia in collaboration with the World Bank in1995, 1997 and 2001. The survey covers a sample of 2500 households and is nationally representative. Householdwelfare is measured by means of aggregate consumption.

422R
.Rangelova
/Econom
icsand
Hum
anB
iology1
(2003)413–428
I
II
III
0
10
20
30
40
50
60
1960 1970 1980 1990 2000
%
I
II
III
Fig. 1. Dependency ratios of working-age population (%) in Bulgaria, 1960–2000.Legend: (I) Youth dependency ratio: number of children from 0 to 14 years of ageper 100 working age population (aged 15–64). (II) Elderly dependency ratio: number of people aged 65 and over per 100 working age population (aged 15–64). (III)Dependency ratio: number of children (aged 0–15) and people aged 65 and over per 100 working age population (aged 15–64).Source: calculated on the basis of datain Statistical Yearbook of R Bulgaria, National Statistical Institute, Sofia, various issues.

R. Rangelova / Economics and Human Biology 1 (2003) 413–428 423
Table 6Basic socio-economic indicators for Bulgaria, 1990–2002
Year Real GDP(1990= 100)
Real wage(1990= 100)
CPI (December/December index, %)
Employment(% change)
Unemploymentrate (%)
1991 88.3 61.0 573.7 −13.0 10.81992 81.8 68.8 179.5 −8.1 12.61993 80.6 69.6 163.9 −1.6 13.01994 82.1 57.1 222.0 0.6 12.81995 84.2 53.9 133.0 1.2 11.11996 75.0 44.5 411.0 0.1 12.51997 69.5 36.1 678.6 −2.6 11.71998 71.9 44.3 101.7 −1.4 12.21999 73.7 48.3 107.0 −2.6 16.02000 71.3 53.9 111.4 −4.7 17.92001 75.1 55.7 104.7 −1.3 17.62002 86.1 65.2 103.8 0.8 16.8
Source: Statistical Yearbook of R Bulgaria, National Statistical Institute, various issues.
Table 7Poverty rates in selected countries of Central and Eastern Europe
Poverty line Bulgaria Latvia Romania Ukraine Estonia Hungary Poland
1995 1997 2001 1998 1998 1999 1998 1997 1998
US$ 2.15/day 3.1 21.1 6.4 6.6 6.8 3.0 2.1 1.3 1.2US$ 4.3/day 18.2 68.0 29.1 34.8 44.5 29.4 19.3 15.4 18.4
Source: Proceedings of Workshops on Living Standards and Poverty in Bulgaria—Results from a New WorldBank Survey, The world Bank Sofia Office, 4–5 April 2002, pp. 9, 53 (“Proceedings of Workshops on LivingStandards”, 2002); Making Transition Work for Everyone, World Bank, 2000.
Although poverty levels in 2001–2002 were less than one-third of the ones observed duringthe economic crisis of 1996–1997, they remain stubbornly above the pre-crisis levels. Basedon the US$ 2.15/day poverty level, poverty since 1995 has more than doubled. Based onthe absolute poverty line of US$ 4.3/day, which is perhaps a more adequate threshold forsome of the new EU accession countries, one Bulgarian in three lives below the povertyline (Table 7).
The poor are made up of families with many children, unemployed and their families,workers with low education, ethnic minorities (Roma, Turkish), and rural households. TheTurkish and Roma minorities represent about 2/3 of the poor in Bulgaria. A Roma individualis 10 times more likely to be poor than average. Yet, pensions at least keep the aged abovethe poverty line (“Proceedings of Workshops on Living Standards”, 2002, pp. 10–11).
In 2000, the average expenditure per capita was700 per annum.4 A very high percentageof the expenditure was for foodstuffs, over 40% for all groups and nearly half for the elderly(Table 8). In contrast, in Slovenia, the Czech Republic and Slovakia this proportion is
4 One Bulgarian lev, i.e., the national currency unit (BGL) is equal to approximately Euro 0.51.

424 R. Rangelova / Economics and Human Biology 1 (2003) 413–428
Table 8Structure of the average expenditure of Bulgaria’s population per capita by age (years) and by expenditure groupin 2000 (percent)
<30 31–35 36–40 41–45 46–50 51–55 56–60 >60
Foodstuff 41.6 41.0 40.7 40.2 40.9 41.4 44.4 49.4Spirits and tobacco products 6.2 4.8 4.3 4.6 4.2 4.3 3.8 2.7Maintenance of the house 10.8 11.3 10.6 10.4 11.0 11.9 12.7 14.1Health care 2.4 2.3 2.3 2.2 2.5 3.2 3.8 5.4Household plot 1.2 1.3 1.5 1.5 1.8 2.3 3.8 4.7Ratio of the above groups’ sum to
average expenditure98.7 96.2 94.2 98.5 99.9 105.8 107.9 98.8
Note: The total sum is not equal to 100, because not all of the expenditure groups are included.Source: Calculatedon data in “Households’ Budgets in 1995–2001”. Department “Statistics on the Households”, National StatisticalInstitute, Sofia, 2001, p. 25.
about 20–25%, in Poland about 30% (Bulgaria: Socio-economic Analysis, 2002, p. 32). Inaddition, the foodstuff consumption is limited to a few basic products.
About 40% of the population consider that their health status worsened in 2001 (everysecond woman and every third man) (Bulgaria: Socio-economic Analysis, 2002). Educationis perhaps the only positive social indicator. In 2001, 71% of the population aged 25–64had a secondary or higher education, which is above the EU average. The number of peoplewith a higher education in Bulgaria (13%) is also above the EU average (11%). However,Bulgaria is lagging behind in the school enrollment of children. Only 96% of the childrenare enrolled, whereas the EU average is 99%.5 In addition, skill levels are still well belowwhat would be needed for an effective labor force.
4.3. Health aspects
The people’s health status in Bulgaria has deteriorated markedly during the period oftransition to a market economy. There are data on the subjective assessment (perception)of Bulgarians for their health status at the beginning of the transition (1990) and in 1997(Table 9). In 1990, nearly half of the people assessed their health as satisfactory, but in1997, the proportion decreased to just over one third. Part of the deterioration was due tothe aging of the population, but not all.
The mortality rates are also unfavorable. The age-standardized mortality rates for thetransition countries are nearly two thirds higher than those in the developed areas of Europe.In the former socialist countries, in particular Bulgaria, diseases of the circulatory system(cardiovascular) are particularly high (Table 10). While the morbidity rate from tuberculosis,a disease indicative of poverty, decreased sharply between 1980 and 1990 (from 178.2 per100,000 population in 1980 to 108.1 in 1989), in the transition period the trend reversed(Fig. 2). In 2000, the rate was 173.4, and in 2001, it was 185.0, thereby exceeding the 1980level. For the whole period under review these figures are higher in the villages than in thetowns. The morbidity rate of malignant neoplasms in Bulgaria also increased: in 1980 it
5 The prevailing share of these children are from Roma origin. Due mainly to their families’ poverty they couldnot afford to go to school. Recently, a special social programme was implemented including many of these childrenin education.

R.R
angelova/E
conomics
andH
uman
Biology
1(2003)
413–428425
0
20
40
60
80
10 0
12 0
14 0
16 0
18 0
20 0
1980 1985 1990 1995 2000
a
b
c
Fig. 2. Morbidity rate of tuberculosis in Bulgaria, 1980–2000 (per 100,000 population).Legend: (a) total number; (b) newly recorded; (c) tuberculosis of respiratoryorgans.Source: Health Protection, Publication of the National Statistical Institute and the National Health Care Information Centre, Sofia, 1990 and 2001, p. 41 and p. 46.

426 R. Rangelova / Economics and Human Biology 1 (2003) 413–428
Table 9Perception for health status of the Bulgaria’s population aged 45 and over, 1990 and 1997
Age (in years) Very good Good Satisfactory Bad Very bad Total
Health status in 199045–54 9.2 34.5 48.3 5.7 2.3 100.055–64 4.3 34.3 46.4 10.7 4.3 100.0Over 65 2.9 15.0 48.6 26.4 7.1 100.0
Total 4.9 27.0 47.7 15.5 4.9 100.0
Health status in 199745–54 3.0 43.0 37.0 13.0 4.0 100.055–64 3.4 31.8 44.6 15.5 4.7 100.0Over 65 4.4 17.5 37.6 24.9 15.6 100.0
Total 3.8 27.8 39.7 19.2 9.5 100.0
Source: Data on the Second and Third waves of the World Values Survey, carried out in 1990 and 1997, respectively.This study is based on a unified survey organised by the United Nation in over 40 countries in the world, includingBulgaria (seehttp://www.nsi.bg).
Table 10Age-standardized mortality rates from selected causes in 1994/1997 (per 100,000)
Countries All Causes of death
Circulatory system Neoplasms Respiratorydeseases
Roadaccident
Suicide Other
Total Heart
Austria 732.3 367.0 147.9 184.6 30.0 11.0 19.9 119.8Belgium 770.2 267.7 81.0 214.5 62.0 15.4 17.2 193.4France 639.7 182.8 54.3 194.3 39.6 13.5 19.4 190.1Germany 764.1 343.8 151.2 196.7 44.0 10.7 13.9 155.0Greece 689.8 334.6 90.4 162.6 37.3 22.2 3.1 130.0Bulgaria 1162.2 706.4 231.4 163.6 58.2 13.3 15.7 205.0Estonia 1155.2 613.7 373.3 200.7 36.6 15.5 37.4 251.3Hungary 1205.5 602.2 256.8 283.9 51.4 13.7 31.4 222.9Poland 1048.3 524.6 105.7 213.8 38.4 17.2 14.4 239.8Romania 1285.9 794.4 261.5 165.8 92.0 13.9 12.7 207.1Slovenia 864.3 358.9 108.4 212.7 61.5 17.4 29.2 184.6Russia 1429.0 755.7 357.5 195.8 69.0 19.4 39.2 350.0
Source: National Statistical Institute, Sofia (seehttp://www.nsi.bg/State/Bulgaria-World/Health.htm).
was 1280 per 100,000 population, in 1989–1674, reaching 2463 in 2000, and continuing toincrease to 2756 in 2002.
The present deterioration in health status in Bulgaria is due partly to a generalized break-down of the public health care system. The reform of the health system did not start untilJuly, 2000, but it is too early to see any of its advantages. During the transition period, theCEECs changed the health care system from the Soviet Semashko-model to the Bismarckianmodel.6 It will take considerable time, however, before the new system bears fruit.
6 The Semashko model was introduced in the former Soviet Union in 1920, and after the World War II imple-

R. Rangelova / Economics and Human Biology 1 (2003) 413–428 427
4.4. Concluding remarks
Demographic development in Bulgaria is in a process of severe stagnation or even de-cline. The most negative aspects are the depopulation and the high rate of ageing of thepopulation. Bulgaria’s deep socio-economic crisis is having a further negative impact ondemographic developments. Aging population have a number of harmful economic andsocial consequences. Older people tend to dissave, and consequently, as a rule, an agingpopulation puts pressure on living standards as well as on the health care system. In Bulgariathe situation is aggravated by the shortage of health insurance funds and by the state budgetdeficit, as well as by the large number of the elderly who have higher medical expendituresper capita than average (United Nations, 1997b). As a consequence, health indicators weredeclining in the 1990s.
The demographic composition of Bulgaria, as well as that of the other Eastern-Europeancountries is close to that of the EU average. They face similar problems of ageing. Withthe social and economic integration on trial as never before, the EU policy must succeedin achieving its commitments to reduce poverty in the accession countries and improve thehealth status of the populations. For the population in Bulgaria to grow at all, policies needto be adopted to increase the fertility rate. In addition, emigration rates must be lowered.Demographers have forecast a decline in the migration outflow, from about 45,000 in the1990s to about 10,000 per annum by 2010 (Donkov, 1999). The government should alsoconsider incentives to attract back to the country those who have already emigrated. Fur-thermore, social policies are needed to support the family, in order to encourage fertility andimprove the social and health status of population. Perhaps the most important preconditionfor both the resumption of population growth and improvements in the health status of thepopulation would be to overcome the socio-economic crisis that began in the 1990s and toincrease the standard of living.
References
Bulgaria, 1995. Situation of Women. National and Global Development. UNDP and Ministry of Foreign Affairs,Sofia.
Bulgaria: Selected Issues and Statistical Appendix, 2001. International Monetary Fund, Washington, DC. IMFCountry Report, March 2001, No. 01/54.
Bulgaria: Socio-economic Analysis. National Statistical Institute, Sofia, 2002 (in Bulgarian).Donkov, K., 1999. Forecast of Bulgarian Population for the Period 1997–2050, vol. 2. National Statistical Institute,
Sofia, pp. 18–42 (in Bulgarian).
mented in the other former socialist countries in Central and Eastern Europe. The model was characterized bycentralized state financing of the health care system and state owned health units, including hospitals. Health carewas classified as a non-productive sector, and there was no private health care. Government exercised full controlover the health activity, which were (theoretically) accessible for all citizens. Because there were no criteria forevaluation of the medical teams’ work, the efficiency of the health care system gradually declined. In contrast, theBismarckian model was developed in 1881 in Germany, and is based predominantly on health insurance funds,which are organizationally independent from the government. Today, it is used with some modifications in manyEuropean countries. Health insurance funds are cumulated under the Health Insurance Act.

428 R. Rangelova / Economics and Human Biology 1 (2003) 413–428
Feschieva, N., 1997. Low-Weight Born Babies—A Qualitative Characteristic of the Population. Population. Reviewof the Institute of Demography. Bulgarian Academy of Sciences, Anniversary Issue, no. 12, pp. 46–53 (inBulgarian).
Golemanov, N., 2000. The Sex Difference in Mortality: Biological Fate or Life Style? Population. Review of theInstitute of Demography, Bulgarian Academy of Sciences, Anniversary Issue, pp. 47–61 (in Bulgarian).
Heller, P.S., et al., 1986. Aging and Social Expenditure in the Major Industrial Countries, 1980–2025. InternationalMonetary Fund, Washington, DC. Occasional Paper no. 47, September.
Kaloianov, T., 2001. Population Aging in Bulgaria During the Period 1960–1999, vol. 2. National StatisticalInstitute, Sofia, 2001, pp. 62–73 (in Bulgarian).
Macroeconomics and Health: Investing in Health for Economic Development. Report of the Commission onMacroeconomics and Health. Presented by Jeffrey D. Sachs, Chair to Gro Harlem Brundtland, Director-Generalof the WHO on 20 December 2001, WHO, Geneva.
OECD, 1997a, The World in 2020: Towards a New Global Age. OECD, Paris.OECD, 1997b, Aging in OECD Countries. A critical policy challenge. Social Policy Studies, no. 20, Paris.Proceedings of Workshops on Living Standards and Poverty in Bulgaria—Results from a New World Bank Survey,
The World Bank Sofia Office, 4–5 April 2002.Rangelova, R. 1991. Forecasting the Social Expenditures in the Seventh Most Developed Countries, vol. 3.
Economic Thought, Journal of the Institute of Economics, Bulgarian Academy of Sciences, pp. 81–92 (inBulgarian).
United Nations, 1997a. The Sex and Age Distribution of the World Populations. The 1996 Revision. Departmentof Economic and Social Affairs. Population Division. United Nations, New York.
United Nations, 1997b. Older Persons in Countries with Economies in Transition: Designing a Policy Response,Guidelines for Practical Strategies. Sales No E.96.IV.12. United Nations, New York.
United Nations, 1999. ST/ESA/SER.A/179. Sales No E.99.XII.11.Van Solings, H., et al., 1998, Population, Labour and Social Protection in the European Union: Dilemmas and
Prospects. Interdisciplinary Demographic Institute, The Hague, Netherlands. Report no. 52.