binocular single vision - repub.eur.nl arne lex.pdf · responding retinal points have (by...
TRANSCRIPT

BINOCULAR SINGLE VISION PSYCHOPHYSICAL STUDIES ON UNDERLYING SENSORY AND MOTOR PROCESSES

The picture on the cover shows a collection of 'twos' of variable size and orientation which may be interpreted as a 'one'. The picture symbolizes the conclusion in this thesis that singleness of binocular vision, in spite of disparities between the retinal images in the two eyes, seems to be an interpretation (the 'one') of poorly reproducible, inaccurate and inconspicuous but nevertheless perceiVable cues pointing to doubleness of vision (the 'twos'). The picture was made in analogy to Figure 60 in the book 'Godel, Escher and Bach: an Eternal Golden Braid' by Douglas R. Hofstadter.

BINOCULAR SINGLE VISION PSYCHOPHYSICAL STUDIES ON UNDERLYING
SENSORY AND MOTOR PROCESSES
PROEFSCHRIFT
TERVERKRIJGING VAN DEGRAAD VAN DOCTOR IN DE GENEESKUNDE
AAN DE ERASMUS UNIVERSITEIT ROTTERDAM OP GEZAG VAN DE RECTOR MAGNIFICUS
PROF. DR. J. SPERNA WEILAND EN VOLGENS BESLUIT VAN HET COLLEGE VAN DEKANEN.
DE OPEN BARE VERDEDIGING ZAL PLAATSVINDEN OP WOENSDAG 4 NOVEMBER 1981 DES NAMIDDAGS
TE2.00 UUR
DOOR
ARNE LEX DUWAER
GEBOREN TE MAKASSAR
DELFT UNIVERSITY PRESS/1981

PROMOTOR : PROF. DR. G. VAN DEN BRINK CO-REFERENTEN: PROF. DR. H. BOUMA
PROF. DR. H. COLLEWIJN

Aan mijn ouders en Ada
Dit onderzoek was mogelijk dankzij een subsidie van de Nederlandse Organisatie voor Zuiver Wetenschappelijk Onderzoek (Z.W.O.) via d.e Nederlandse Stichting voor Psychonomie en werd uitgevoerd op de afdeling Biologische en Medische Natuurkunde van de Erasmus Universitei·t te Rotterdam.
vi

I.
CONTENTS
SYNOPSIS
1.1 Introductory remarks
1.2 Basic problems associated with binocular single vision
1.3 Formulation of the problems
1.4 Towards an understanding of the sensory processes underlying binocular single vision
1.5 Cooperation between motor and sensory processes underlying binocular single vision
1.6 Binocular single vision under highly demanding conditions
1.7 Conclusions
1.8 Concluding remarks
II. TOWARDS AN UNDERSTANDING 0F THE SENSORY PROCESSES UNDERLYING
BINOCULAR SINGLE VISION
2.1 What is the diplopia threshold?
A.L. Duwaer and G. van den Brink (1981a), Perception & Psychophysics 29, 295-309.
2.2 The effect of presentation time on detection and diplopia
thresholds for vertical disparities. A.L. Duwaer and G. van den Brink (1981d), Vision Research, in press.
2.3 Detection of vertical disparities.
A.L. Duwaer and G. van den Brink (1981e) , Vision Research, submitted.
III. COOPERATION BETWEEN MOTOR AND SENSORY PROCESSES UNDERLYING
1
2
3
6
7
10
12
13
13
15
16
32
46
BINOCULAR SINGLE VISION 69
3.1 Foveal diplopia thresholds and fixation disparities.
A.L. Duwaer and G. van den Brink (1981b), Perception & Psychophysics, in press. 70
3.2 Diplopia thresholds and the initiation of vergence eye
movements. A.L. Duwaer and G. van den Brink (1981c), Vision Research,
in press. 92
vii
IV. BINOCULAR SINGLE VISION UNDER HIGHLY DEMANDING CONDITIONS
4.1 Assessment of retinal image displacement during active head
movement using an afterimage method.
A.L. Duwaer (1981f), Vision Research, submitted.
4.2 A second look at the nonmotor component of the fusional
response to vertical disparity using an afterimage method.
A.L. Duwaer (1981g), J. Opt. Soc. Am., submitted
V. VALIDITY OF THE SUBJECTIVE NONIUS-LINE METHOD TO DETERMINE
OCULAR ALIGNMENT
5.1 Comparison of subjective and objective measurements of ocular
alignment in the vertical direction.
A.L. Duwaer, G. van den Brink, G. van Antwerpen and C.J.
Keemink (1981h), Vision Research, submitted.
SUMMARY
SAMENVATTING
CURRICULUM VITAE
viii
115
!16
134
149
!50
!61
!67
173

I
SYNOPSIS
1. 1 INTRODUCTORY REMA.RKS
The present thesis deals with binocular single vision.
By closing one of the two eyes alternately (in particular in the presence of
nearby objects), one can easily see that we are confronted with two different
images of the outside world. Nevertheless, when we look at this world with both
eyes we still perceive it for the greater part singly. This in spite of the
fact that the two images often differ so much that the world would be perceived
as clearly double if the same images did not enter the visual system through
different eyes but, projected on top of each other, through the same eye. This
singleness of binocular vision is accomplished by motor processes which use the
eye muscles to direct the eyes towards the same point in space, and by sensory
processes in the brain which avoid doubling of the binocular image.
Interpretation of certain types of differences between the images in the two
eyes results in stereopsis (depth perception) which disappears when one of the
eyes is closed. As a result, the observer can assess the occurrence of these
image differences not only by using the comparatively inconspicuous and inaccu
rate information provided by image doubling, which is the subject of the pre
sent thesis, but also indirectly by using the conspicuous and accurate depth
cue. It was decided to avoid this complication by confining the study to those
situations where these interfering depth effects did not occur.
The processes underlying binocular single vision have been studied in psy
chophysical experiments. Subjects were asked to make judgments on the percepts
evoked by visual stimuli. The procedures and stimuli chosen were such that they
practically guaranteed that the judgmPnts were always based on the same infor
mation. In this way the mysteriously variable nature of a person's psyche,
which is unavoidably involved in the judgments, was restricted.
The material of this thesis consists of eight articles which have been sub
mitted for publication to several international journals. In the present thesis,
the articles have been organized according to their subjects to form four
2
chapters (II - V) •
1.2 BASIC PROBLEMS ASSOCIATED WITH BINOCULAR SINGLE VISION
The basic problems associated with binocular single vision that are dealt with
in the present study will be explained with reference to the diagrams of Fig. 1.
A
lUAu: w
-J L disparity
c
~··fo··-·:,A··~· ·-· f;lll ~ / .. UlJ ~·~ ·.:
~ .'-<a-, Oe-6A"
disparity d!ffer1:lrce
B
mA[[ tr5
D
li~l .. ,)) ..... Jill LkJ t····~ UQJ
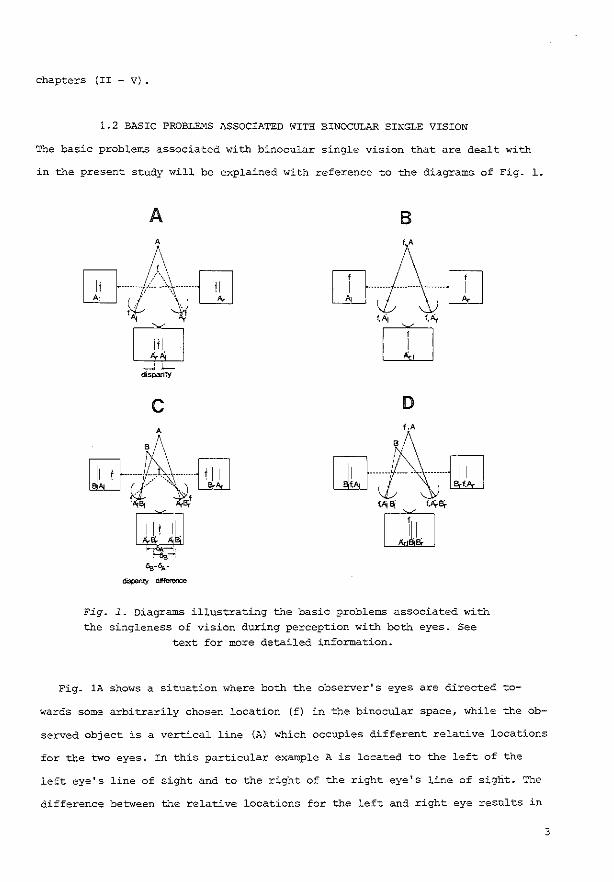
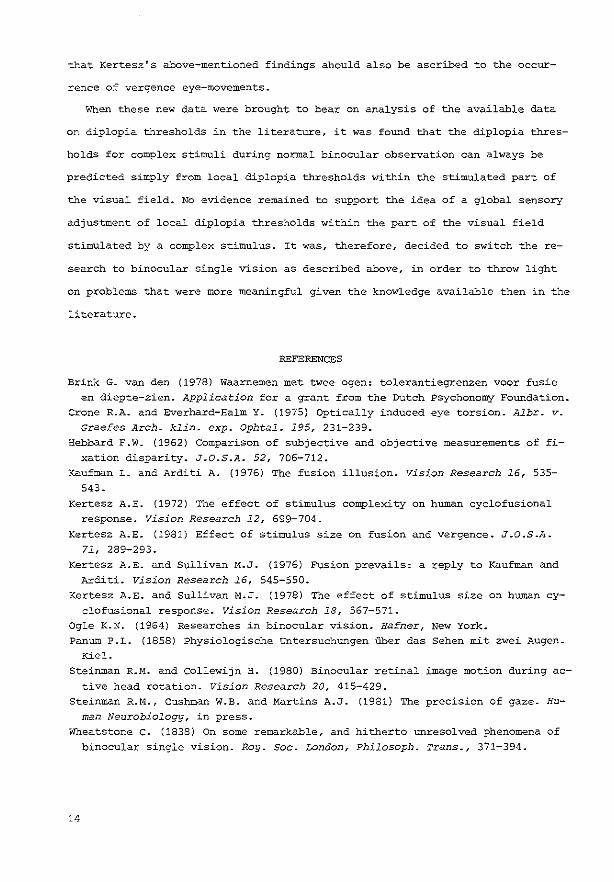
fA Bi f,A(Bf rn Fig. 1. Diagrams illustrating the basic problems associated with the singleness of vision during perception with both eyes. See
text for more detailed information.
Fig. 1A shows a situation where both the observer's eyes are directed to-
wards some arbitrarily chosen location (f) in the binocular space, while the ob-
served object is a vertical line (A) which occupies different relative locations
for the two eyes. In this particular example A is located to the left of the
left eye's line of sight and to the right of the right eye's line of sight. The
difference between the relative locations for the left and right eye results in
3
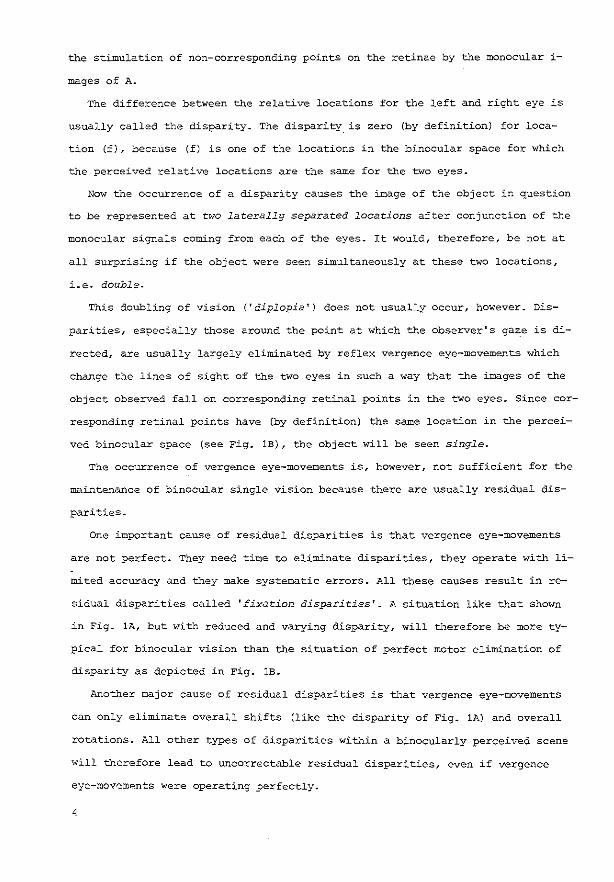
the stimulation of non-corresponding points on the retinae by the monocular i
mages of A.
The difference between the relative locations for the left and right eye is
usually called the disparity. The disparity is zero (by definition) for loca
tion (f), because (f) is one of the locations in the binocular space for which
the perceived relative locations are the same for the two eyes.
Now the occurrence of a disparity causes the ~age of the object ir. question
to be represented at two laterally separated locations after conjunction of the
monocular signals coming from each of the eyes. It would, therefore, be not at
all surprising if the object were seen simultaneously at these two locations,
i.e. double.
This doubling of vision ('diplopia') does not usually occur, however. Dis
parities, especially those around the point at which the observer's gaze is di
rected, are usually largely eliminated by reflex vergence eye-movements which
change the lines of sight of the two eyes in such a way that the images of the
object observed fall on corresponding retinal points in the two eyes. Since cor
responding retinal points have (by definition) the same location in the percei
ved binocular space (see Fig. lB), the object will be seen single.
The occurrence of vergence eye-movements is, however, not sufficient for the
maintenance of binocular single vision because there are usually residual dis
parities.
One important cause of residual disparities is that vergence eye-movements
are not perfect. They need time to eliminate disparities, they operate with li
mited accuracy and they make systematic errors. All these causes result in re
sidual disparities called 'fixation disparities'. A situation like that shown
in Fig. lA, but with reduced and varying disparity, will therefore be more ty
pical for binocular vision than the situation of perfect meter elimination of
disparity as depicted in Fig. lB.
Another major cause of residual disparities is that vergence eye-movements
can only eliminate overall shifts (like the disparity of Fig. lA) and overall
rotations. All other types of disparities within a binocularly perceived scene
will therefore lead to uncorrectable residual disparities, even if vergence
eye-movements were operating perfectly.
4
An example of a scene containing uncorrectable residual horizontal dispari
ties is shown in Fig. lC. we see here two objects A and B, arranged in such a
way that the disparity OA for the image of A differs from that COB) for the i
mage of B. This disparity difference is possible because of the lateral separa
tion of the two eyes. When vergence-movements now eliminate the disparity OA
for the image of A, there will be a residual disparity coB - OA) for the image
of B (see Fig. 1D). This disparity can only be eliminated by vergence eye-move
ments at the cost of a residual disparity (0A - OB) for the image of A. It
should be noticed that the disparities (OB - 6A) or (6A - OB) are not the only
uncorrectable residual disparities in Fig. 1c. Object B is closer to the left
eye than it is to the right eye, so the image of B will be larger in the left
eye than in the right one. This apparent size difference results in disparities
that cannot be fully eliminated by vergence eye-movements either.
Apart from these uncorrectable residual disparities due to the lateral se
paration of the eyes, there will usually also be uncorrectable residual dispa
rities due to differences in properties between the two eyes. A rather common
difference of this type is that between the refractive powers of the two eyes,
which results in an apparent size difference called 'aniseikonia'.
Residual disparities that are not eliminated by vergence eye-movements do
not always lead to diplopia. Panum (1858) found that this could be ascribed to
the occurrence of a sensory disparity threshold for the perception of diplopia.
This 'diplopia threshold' forms the basis for one of the two major aspects of
sensory evaluation of disparities. The other aspect is 'stereopsis' (depth per
ception), which was first described by Wheatstone (1838). Wheatstone discovered
that a disparity difference in the horizontal direction (e.g. OA - OB in Fig.
1C) is a necessary and sufficient stimulus for the perception of stereoscopic
depth difference. This impression of stereoscopic depth when two monocular 2-
dimensional stimuli with horizontal disparity differences are observed is the
basis for the popular 'stereo viewer'. It is interesting to note from a compa
rison of the Figs. 1C and lD that the disparity difference does not change
when the fixation point (f) changes. This explains why stereopsis is not being
affected by varying small fixation disparities, due to involuntary eye-move
ments (see chapter III) .
5

Singleness of binocular vision despite disparities as well as doubleness of
binocular vision due to disparities may be perceived with and without stereos
copic depth differences (see e.g. Ogle, 1964) _ This illustrates that the depth
cue about the occurrence and magnitude of disparities - which is accurate and
conspicuous - is added to the information about image doubling due tc the dis
parity - which is less accurate and conspicuous. The processes underlying the
diplopia threshold are therefore usually studied for disparities in the verti
cal direction, thus avoiding the complications caused by the occurrence of ste
reoscopic depth differences (see e.g. Kertesz, 1972; Kaufman and Arditi, 1976)
The same strategy will be followed in the present study.
Summing up, we may state that the factors underlying binocular single vi
sion are the tendency for visual disparities to be corrected by vergence eye
movements, in combination with the occurrence of a sensory threshold for the
perception of diplopia, that should be differentiated from stereopsis.
1.3 FORMULATION OF TEE PROBLEMS
consultation of the literature at the start of the present study revealed one
major issue which had not really been tackled and another which though investi
gated was still unresolved- The former concerns the cooperation between ver
gence eye-movements aimed at minimizing the disparities on the retinae of the
two eyes on the one hand and the sensory processes underlying the diplopia
threshold on the other. The latter concerns the nature of the sensory proces
ses underlying the diplopia threshold. A major traditional view is that the
occurrence cf this threshold is due to a fusion mechanism eliminating retinal
disparities (see e.g. Kertesz, 1972; Kertesz and Sullivan, 1976). According to
the opposing view there is no 'real threshold' for disparities and, consequent
ly, no sensory fusion mechanism. The diplopia threshold would be just a dispa
rity value set by applying a lenient criterion to judge the deterioration of
singleness due to the disparity (Kaufman and Arditi, 1976) _ It was the objec
tive of the present study to throw light on both these issues. This was done
by performing psychophysical experiments using primarily horizontal lines with
vertical disparity between the images in the two eyes as test stimuli-
6

1.4 TOWARDS AN UNDERSTANDING OF THE SENSORY
PROCESSES UNDERLYING BINOCLLAR
SINGLE VISION
The nature of the sensory processes underlying the diplopia threshold has been
studied first by a detailed analysis of the nature of the diplopia threshold
(see Chapter 2.1). The overall results of this analysis strongly suggest that
the diplopia threshold is indeed not a 'real' threshold, i.e. not the rigid
boundary of a dead zone in which the disparities are eliminated. It appears to
be rather a disparity value set by a lenient criterion for singleness of vision
which leads to useful interpretation of the percept of the stimulus without
-3
R
---
I I
i probability of occurrence
''SINGLENESS"
' -'
-2 -1 0 2
effective disparity in intemal representation (in ~~ondard ciev!ation vni~s)
I I R R,L R
R, L
3
R
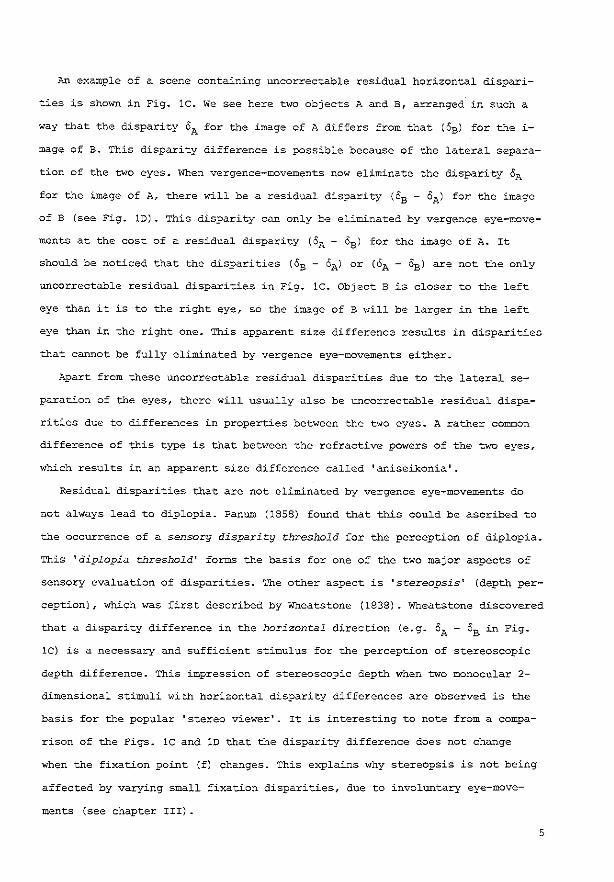
Fig. 2. Schematic representation of the distribution of effecti
ve disparity in internal representations of a stimulus without disparity. The distribution function shown is a normalized Gaussian one. The lOwer part of the figure gives the locations in binocular space of a line L in the left eye and a line R in the right eye when the disparity between L and R is negative, zero or positive. Vertical lines are depicted with horizontal dis-
parity and horizontal lines with vertical disparity.
7
disparity, given the variability of this percept due to intrinsic noise in the
disparity domain. This statement will be clarified with reference to Fig. 2.
The broken line in Fig. 2 represents the distribution of the effective dis
parity in a large number of internal representations of the stimulus without
disparity. The effective disparity can differ from zero because of the intrin
sic noise in the disparity domain which reflects the limited accuracy and re
producibility with which disparity information is coded. The vertical bars in
dicate the disparity values where 'singleness' typically ends. It may be noti
ced that the absolute magnitude of these values is the same for positive and
negative effective disparities. This is due to the fact that disparities of
opposite sign produce the same separations between the monocular images (see
lower part of Fig. 2). The disparity values where 'singleness' ends correspond
approximately to the maximum values of the effective disparity in internal re
presentations of the stimulus without disparity. Comparison of the whole area
under the distribution function and the part of this area between the vertical
bars shows that nearly all internal representations of the stimulus without
disparity will be classified as 'single'. This makes this particular single
ness criterion useful. It may be regarded as a lenient criterion, since sub
jects are capable of using sharper criteria corresponding to smaller disparity
values. A serious drawback of the use of sharper criteria is their restricted
utility, due to the fact that the percepts of the stimulus without disparity
can be classified in two different ways when sharper criteria are used.
It will be clear that the diplopia threshold as defined above appears to be
brought about in a rather arbitrary way by use of a lenient criterion amidst
many possible criteria. However, this threshold remains of interest because of
its f~irly large size - which reflects the fact that the changes in the bino
cular percepts introduced by the disparity are processed by the visual appara
tus in such a way that the overall visual impression received by the subject
is relatively inconspicuous and vague: a separation equal to the disparity can
be observed much more clearly when the same monocular stimuli are presented to
a single eye.
Our study of the nature of the diplopia threshold provides strong indica
tions that the occurrence of this threshold should not be ascribed to a senso-
8

ry fusion mechanism that gradually eliminates disparities. This conclusion was
confirmed by the results of a detailed analysis of the effect of the presenta
tion time of a vertical disparity on its detection and recognition on the ba
sis of deteriorated singleness (see Chapter 2.2). If a fusion mechanism were
involved, the detection and recognition of the disparity should get worse at
longer presentation times, because the dynamics of this perceptual mechanism
should give better elimination the longer the disparity is presented. The de
tection and recognition was, however, found to improve with increasing presen
tation time. This almost makes it untenable to assert that the occurrence of
diplopia thresholds is a result of a sensory mechanism that gradually elimina
tes disparities. It is much more likely that the occurrence of diplopia thres
holds is due to some kind of failure of a 'signal-detection' process (disparity
being the signal) aimed at revealing the disparity.
This assertion was strongly supported by the finding that it appeared to be
possible to formulate a signal-detection model for detection of vertical dispa
rities which holds under a wide variety of stimulus conditions (see Chapter 2.3).
This model has two essential features, viz. (a) loss of information about the
sign of disparities reflecting the fact that disparities of opposite sign re
sult in the same percept (cf. Fig. 2) and (b) the presence of intrinsic noise,
reflecting the limited accuracy and reproducibility with which disparity infor
mation was found to be coded. A peculiarity of this noise is that its level
(the width of the effective disparity distribution of Fig. 2) varies throughout
the disparity domain with a minimum at an intermediate non-zero disparity value.
In the present study, this minimum is the only psychophysical evidence that the
internal representations of small disparities (leading to singleness of binocu
lar vision) might differ from the internal representations of large disparities
(leading to doubleness of binocular vision).
The overall results suggest that singleness of binocular vision despite re
tinal disparities is due to (functional) failure of a sensory detection process
aimed at revealing the retinal disparities. This failure seems to be primarily
due to the tendency of observers to use lenient assessment criteria, to the pre
sence of intrinsic noise throughout the disparity domain (reflecting the limi
ted accuracy and reproducibility with which disparity information about image
9
doubling is coded) and to loss of information about the sign of disparity (re
flecting the fact that positive and negative retinal disparities - e.g. image in
right eye displaced in an upward direction and in the left eye in a downward di
rection from the corresponding positions in. the two eyes, and vice versa- re
sult in the same amount of doubling of the binocular image).
1.5 COOPERATION BETWEEN MOTOR AND SENSORY
PROCESSES UNDERLYING BINOCULAR
SINGLE VISION
The cooperation between vergence eye-movements aimed at minimizing retinal dis
parities on the one hand and the processes underlying sensory tolerance to the
se disparities on the other was studied by comparing the accuracy of vergence
eye-movements and the magnitude of the diplopia threshold in the same subjects
w~d under the same stimulus conditions.
The accuracy of vergence eye-movements was assessed in the vertical and ho
rizontal directions by measuring the distribution of the fixation disparities
occurring spontaneously during continuous observation of a fixation stimulus
(see Chapter 3.1). This accuracy was also assessed in the vertical direction
by dete=mining the smallest disparities that, when presented abruptly, initiate
vergence eye-movements (see Chapter 3.2) •
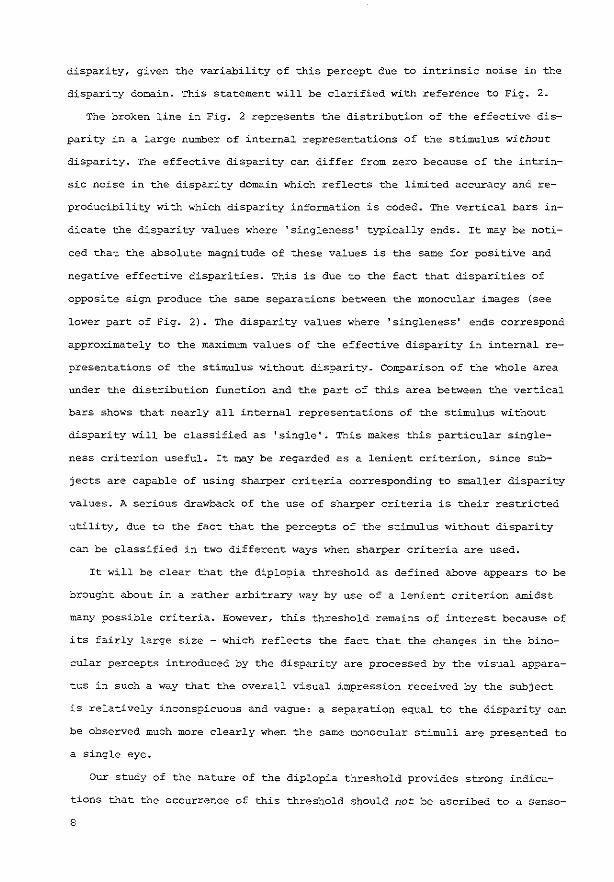
The accuracy of vergence eye-movements was determined by a subjective align
ment method in which the subject judges the relative displacement between di
choptically presented nonius lines (see Fig. 3). The relative displacement be
tween the nonius lines is a measure of_the fixation disparity between the eyes
{Hebbard, 1962; Crone and Everhard-Halm, 1975; see Chapter V). Fixation dispa
rities down to about 0.3' of arc can be detected by this method.
The major finding was that the accuracy of vergence eye-movements is remar
kably good in the vertical direction. Vergence eye-movements may be initiated
by a vertical disparity in the fovea as small as the angular distance between
the centres of two neighbouring receptors. At the periphery of the visual
field, they can even be initiated by vertical disparities smaller than the
distance between the centres of neighbouring receptors. The vergence eye-move
ments are so accurate that the residual fixQtion disparities left are far too
10

left-eye stimulus
percept in case of
fixation disparity
right-eye s-timulus
Fig. 3. Principle of the subjective alignment method used to determine the accuracy of vergence eye-movements in the vertical
and horizontal direction.
small to result in diplopia.
The vergence eye-movements in the horizontal direction were found to be less
accurate than in the vertical direction. The diplopia thresholds for horizontal
disparity (being larger than the diplopia thresholds for vertical disparity)
are nevertheless substantially J;arger than the residual horizontal fixation
disparities.
The findings conclusively demonstrate that the processing of disparities
may be remarkably accurate in both the horizontal and vertical directions, but
that the natures of these accurate processes differ essentially in these two
directions. Vertical disparities not containing meaningful information are ac-
curately eliminated by vergence eye-movements. The meaningful (depth) informa-
tion conveyed by relative horizontal disparities, on the other hand, is accura-
tely evaluated by stereopsis. conscious perception of image doubling as a re-
sult of the meaningless part of information about residual vertical and hori-
zontal disparities as such is avoided by comparatively large diplopia thres-
holds and comparatively inaccurate sensory processing.
The overall results suggest that the key-factor in the cooperation between
vergence eye-movements aimed at minimizing retinal disparities on the one hand
and the processes underlying sensory tolerance to these disparities on the o-
ther is, that the sensorimotor system controlling vergence eye-movements in
response to retinal disparities is more sensitive and accurate than the sense-
ry system controlling the psychophysical assessment of these disparities in
11

terms of image doubling. Retinal disparities, especially those around the fixa
tion point, are thus continuously materially eliminated by vergence eye-move
ments with a more than sufficient accuracy.
1.6 BINOCULAR SINGLE VISION UNDER HIGHLY
DEMANDING CONDITIONS
Several recently published reports claim a quite surprising reduction of the
accuracy of ocular alignment and a rise in the diplopia threshold by more than
an order of magnitude when visual tasks are performed under two highly deman
ding conditions, viz. binocular fixation during active head rotation (Steinman
and Collewijn, 1980; Steinman et al., 1981) and forced vertical divergence
(Kertesz, 1981).
It should however be noted that in these studies ocular alignment was asses
sed indirectly by taking the angular position of sucion-type contact lenses
mounted to the eyes as a measure of the directions of the visual axis. More
over, such contact lenses place an unnatural load on the subjects besides the
load caused by the highly demanding test conditions themselves; they are thus
likely to interfere with the visual apparatus and to distract the subjects from
their visual task. It was therefore decided to repeat the above-mentioned ex
periments with a specially designed afterimage method measuring ocular align
ment with the aid of afterimages serving as temporary retinal 'landmarks' ;
this method is direct, contrary to the suction-type lens method, and certainly
interferes much less with the subject's performance of his visual task.
Under these more natural conditions, ocular alignment on an unequivocally
defined fixation marker during binocular fixation with active head rotation
was found to be an order of magnitude better than previously reported (see
Chapter 4.1). The same holds true for ocular alignment on a stimulus during
forced vertical divergence, provided that the singleness of binocular vision
is not disrupted, e.g. by false correlation of noncorresponding parts of the
stimulus (see Chapter 4.2). These new results suggest that it may not be ne
cessary after all to assume the activation of special neuronal processes rai
sing the diplopia thresholds to explain binocular single vision under highly
demanding conditions as the above-mentioned authors have done; according to
12

our measurements, the accuracy of ocular alignment is quite high enough to
explain this singleness of vision itself.
1.7 CONCLUSIONS
The overall results of the present study suggest that binocular single vision
is brought about by (extremely) accurate elimination of disparities by vergence
eye-movements in combination with a sensory tolerance. This sensory tolerance
reflects our conclusions that (a) singleness of binocular vision is just a le
nient criterion amidst the many possible criteria which could be used to judge
the disparity information and (b) disparity information about image doubling
is inaccurately, inconspicuously and not very reproducibly coded in conscious
perception.
The main functions of this sensory tolerance seem to be to avoid diplopia a
round the fixation point due to comparatively small fixation disparities and to
avoid diplopia in the rest of the visual field due to fixation disparities or
other types of disparities remaining after the reflexive elimination of dispa
rities around the fixation point by vergence eye-movements.
1.8 CONCLUDING REMARKS
The present study was prompted by unpublished determinations of diplopia thres
holds for complex stimuli by Van den Brink (1978), which indicated that diplo
pia thresholds for vertical disparities in complex stimuli could not simply be
predicted from local diplopia thresholds within the stimulated part of the vi
sual field. These results, together with similar findings by Kertesz (1972),
suggested the occurrence of a global adjustment of local diplopia thresholds.
The initial purpose of the present study was to analyse this adjustment by de
termining diplopia thresholds for a variety of stimuli using as many different
types of disparities as possible.
It was discovered during the first two months of this study that the appa
rent global adjustment of local diplopia thresholds for complex stimuli should
not be ascribed to sensory processes but to the occurrence of vergence eye-mo
vements minimizing overall disparities (cf. Chapter 4.2). At about the same
time, Kertesz and Sullivan (1978) published data which conclusively showed
13
that Kertesz's above-mentioned findings ahould also be ascribed to the occur-
renee of vergence eye-movements.
When these new data were brought to bear on analysis of the available data
on diplopia thresholds in the literature; it was found that the diplopia thres-
holds for complex stimuli during normal binocular observation can always be
predicted simply from local diplopia thresholds within the stimulated part of
the visual field. No evidence remained to support the idea of a global sensory
adjustment of local diplopia thresholds within the part of the visual field
stimulated by a complex stimulus. It was; therefore, decided to switch the re-
search to binocular single vision as described above, in order to throw light
on problems that were more meaningful given the knowledge available then in the
literature.
REFERENCES
Brink G. van den (1978) Waarnemen met twee ogen: tolerantiegrenzen voor fusie en diepte-zien. Application for a grant from the Dutch Psychonomy Foundation.
Crone R.A. and Everhard-Balm Y. (1975) Optically induced eye torsion. Albr. v.
Graefes Arch. klin. exp. Ophtal. 195, 231-239. Eebbard F.W. (1962) Comparison of subjective and objective measurements of fi
xation disparity. J.O.S.A. 52, 706-712. Kaufman L. and Arditi A. (1976) The fusion illusion. Vision Research 16, 535-
543.
Kertesz A.E. (1972) The effect of stimulus complexity on human cyclofusional response. Vision Research 12; 699-704.
Kertesz A.E. (1981) Effect of stimulus size on fusion and vergence. J.O.S.A.
71, 289-293.
Kertesz A.E. and Sullivan M.J. (1976) Fusion prevails: a reply to Kaufman and Arditi. Vision Research 16, 545-550.
Kertesz A.E. and Sullivan M.J. (1978) The effect of stimulus size on human cyclofusional response. Vision Research 18, 567-571.
Ogle K.N. (1964) Researches in binocular vision. Hafner, New York. Panum P.L. (1858) Physiologische Untersuchungen Uber das Sehen mit zwei Augen.
Kiel. Steinman R.M. and Collewijn E. (1980) Binocular retinal image motion during ac
tive head rotation. Vision Research 20; 415-429. Steinman R.M., Cushman W.B. and Martins A.J. (1981) The precision of gaze. Hu
man Neurobiology, in press. Wheatstone c. (1838) On some remarkable; and hitherto unresolved phenomena of
binocular single vision. Roy. Soc. London, Philosoph. Trans., 371-394.
14
II
TOWARDS AN UNDERSTANDING
OF THE SENSORY PROCESSES
UNDERLYING BINOCULAR SINGLE VISION
Chapter II deals with an unresolved controversy in the literature when the present study was started. This controversy con
cerned the nature of the sensory processes underlying binocular single vision. A major traditional view is that these sen
sory processes are a fusion mechanism elialinating the discrepancies between the images on the retinae of the two eyes (the 'retinal' disparities). According to the opposing view there
is no such fusion mechanism. Three studies were performed in connection with this contro
versy. In the first study the magnitude and nature of the di
plopia threshold, that is, the value of the retinal disparity at which binocular single vision ends, have been investigated.
In the second study the effect of stimulus presentation time
on detection and diplopia thresholds for vertical disparities
has been determined in order to find out whether the processing is aimed at eliminating or revealing these disparities.
In the third study the detectability of differences between two different vertical disparities has been determined as a
function of the reference disparity in order to find out whether this detectability is so much worse around zero disparity
(where binocular single vision occurs) than at comparatively
large reference disparities (where diplopia occurs) that it
has to be assumed that there is a disparity-eliminating pro
cess operating around zero disparity.
15

2.1 What is the diplopia threshold?
A. L. DUWAER and G. VAN DEN BRINK Department of Biological and Medical Physics, Erasmus University Rotterdam
3000 DR Rotterdam, The Netherlands
The magcitude and nature of the diplopia threshold. that is, the value of the retinal disparity at which binocular single vision ends. were studied in four experiments. The results show that the magnitude of the diplopia threshold is highly dependent on the subject tested (differences up to a factor of 6), the amount of training the subject has received (differences up to a factor of 2.5). the criterion used for diplopia (limits for unequivocal singleness of vision were up to a factor of 3 lower than thos"e for Unequivocal doubleness of vision). and the conspicuousness of disparity that can be influenced both by the surrounding stimuli (differences up to a factor of 3.5) and stereoscopic depth (differences up to a factor of 4.5). Our data do not confirm previous :fmdings of interference effects associated with the initial appearance of binocular disparity when test stimuli are presented tachistoscopically. A remarkable f"mding was that the magnitude of the diplopia threshold seems to be determined by the amount of intrinsic noise in the disparity domain. as revealed by the standard deviations of the thresholds for tachistoscopically presented test stimuli. The overall results suggest that the diplopia threshold is. in essence. not the rigid boundary of a dead zone. but. rather. a disparity level corresponding to a lenient criterion for singleness of vision which leads to useful interpretation of the percept of the stimulus without disparity. given the variability of this percept due to intrinsic noise in the disparity domain.
An important aspect of human binocular vision is that a single visual percept can be obtained from two monocular images. This singleness of vision is accomplished by motoric alignment of the eyes so as to minimize the overall retinal disparity between the two monocular images and sensory integration of residual disparities. The sensory integration-usually called binocular fusion-can occur only when the residuaL retinal disparities between the two monocular images remain within certain limits.
Binocular fusion of parts of the images with horizontal disparity occurs practically without loss of disparitJ' information. since only very small horizontal disparities (~ 1 ')1 do not give rise to a sensation of depth. Binocular fusion of image parts with vertical disparity, on the other hand, is usually assumed to result in a loss of disparity information, because no systematic perceptual change analogous to depth has yet been reported.2
This study is concerned with the diplopia threshold. that is, the largest value of the retinal disparity that does not disrupt binocular single vision.
Measured values of the diplopia threshold quoted in the literature have little or no utility, due to the
We would like to thank G. L van der Wildt, A. E. H. Peters. and Ch. M. M. de Ween for helpful discussions, and C. J _ Keemink and J. B. P. van Deursen for their technical assistance. Thi~ investiSJ.tion was supported by the Netherlands Organization for the Advancement of Pure Research (ZWO}. Requests for reprints may be scm to A. L. Duwaer. Dcparunem of Biological and Medical Physics. Erasmus University Rotterdam, P.O. Box 1738, 3000 DR Rotterdam, The Netherlancb.
Copyright 1981 Psychonomic Society. Inc.
16
enormous variation between the results reported by different authors. Reported diplopia thresholds have ranged from 2' to 20' for horizontal disparity in the fovea, from 3' to 16' for vertical disparity in the fovea, and from 1.4° to 7° for cyclodisparity (references will be given below). The situation is much the same for diplopia thresholds in the periphery of the visual field. For instance, at an eccentricity of 4 o -5°. diplopia thresholds from 4' to 100' have been reported (Crone & Leuridan. 1973). Moreover, the smallest reported thresholds are so low that they can be accounted for by monocular acuity, so that it is not even necessary to assume the existence of binocular fusion (see, e.g., Kaufman & Arditi. 1976a, 1976b). It is, therefore, of practical, as well as fundamental, importance to unravel the causes of this large variability in the size of the reported diplopia thresholds.
The purpose of the present investigation was to study the diplopia thresholds for vertical and horizontal disparity by evaluation of the criterion for binocular single vision. We also evaluated (1) possible interference effects associated with initial appearance of binocular disparity when test .stimuli are presented tachistoscopically, (2) difference in the conspicuousness of information about the presence of disparity, and (3) possible systematic difference between subjects.
We have found evidence that different authors used different criteria for binocular single vision. In Woo's (1974) study, the criterion is likely to have been a perceptual change in the singleness of the line (e.g., broadening), as the report~ diplopia thresholds (1.8'

-2.0' for a vertical line with horizontal disparity presented in the fovea for 100 msec) are not even large enough to compensate for the specified line width (2.1 ').The same holds true for the small thresholds that can be inferred from the data of Kaufman and Arditl (1976b): 1.4°-1.6° cyclodisparity in horizontal lines 2° long (corresponding to 1.5 '-1.8' vertical disparity at 1 o eccentricity) is detectable (d' = .61-2.11). Kaufman and Arditi determined the detectability of disparities, taking any changes in the appearance of the binocular image into account. On the other hand, when the transition from singleness to doubleness of vision is stressed for determination of the threshold, much larger diplopia thresholds are found (Mitchell, 1966: 6.8 '-11.5' for horizontal disparity and 4.5 '-8.0' for vertical disparity; Crone & Leuridan, 1973: 9'-20' for horizontal disparity and 5'-16' for vertical disparity, values estimated from the author's graphs; Sheedy & Fry, 1979: 5' -6' for vertical disparity; Kertesz, 1973, and Kertesz & Sullivan, 1976: 4°-7° cyclodisparity for horizontal lines 2° long, which yields vertical disparities of 4.2' -7.4' at 1 o eccentricity). The data of Sheedy and Fry are interesting because they reveal shifts of the binocular images by .25' to 1.4' (mean value .8') for a vertical disparity of 4', which is less than their reported diplopia threshold. Since the mean 500Jo detection threshold for shifts under the particular stimulus condition amounted to about .35' (estimated from the specified mean width of the psychometric curves), Sheedy and Fry would have reported lower diplopia thresholds if they, like Kaufman and Arditi (1976b). had used detectability of disparity as the criterion for diplopia. For a proper interpretation of diplopia thresholds, it seems, therefore, necessary to discriminate carefully between at least two "thresholds'': on the one hand, a threshold reflecting the ability to recognize a stimulus with retinal disparity (which we shall can the "singleness limit" from now on) and, on the other hand, the more commonly used threshold for the perception of two separate images (called the "doubleness threshold'' below). Both thresholds were determined in our study.
Kertesz and Sullivan (1976) argued that diplopia thresholds for tachistoscOpically presented disparities will be smaller than those for continuously presented disparities because of interference by the initial appearance of binocular disparity. This "initial appearance cue" is assumed to be caused by the slowness of binocular fusion, as a result of which the visibility of the disparity is not reduced immediately. If this is indeed the case, most recent data on the diplopia threshold will be affected by this cue, as nearly all recent work in this field has been done with tachistoscopically presented stimuli. We judged this question to be important enough to deserve investigation, and therefore determined the singleness limits and doubleness thresholds for both tachistoscopically
and continuously presented test stimuli with disparity. In the case of continuously presented test stimuli, the disparity level was slowly changed, in order to avoid such transient effects as the initial appearance cue.
Kertesz and Sullivan (1976) also argued against the use of stimuli with conspicuous monocular cues about the presence of disparity, as used, for example, by Kaufman and Arditi (1976b). These conspicuous monocular cues are claimed to reduce the measured diplopia thresholds. We investigated this effect by using three different fixation markers giving monocular cues with different levels of conspicuousness.
GENERAL METHODS
Stimulntor
The stimuli were presented in an electronic stereoscope consisting of a white background screen (diameter 15". mean luminance level of 3 cdlm') and two XYZ displays (Philips PM3233 oscilloscopes with green P31 phosphor in Experiment I and HP1321A displays with white P31 phosphor in Experiments 2. 3, and 4). The displays were viewed dichoptically through two beam splitters, positioned dir~tly in front of the subject's eyes and adjusted so as to present the two displays in the same direction at a ftxation distance of 105 em. The luminance of the (line) stimuli on the displays was adjusted to 1.8 log units above the (contrast) threshold for the perception of the stimulus. The widths of the stimuli were .3 mm (1.0') for the Philips display and .35 mm (1.2') for the HP1321A display.> The angular dimensions of the images on the two displays were equalized to within an aeeuracy of .3' when being looked at through a telescope (magnification 30). The parameter in the experiments was the disparity between certain parts of the stimuli on the display screens. The level of the dispar· ity had an accuracy of 0.1' and was controlled by a microprocessor and an 8-bit digital-to-analog convertor. The alignment and identity of the Stimuli were checked with the telescope before and after each experimental session.
Psychophysical Measuring Procedures
Most of the results presented below were based on a "threealternative classification" of the test stimulus. but some data were gathered by a .. two-alternative forced-choice·· method. We shall now describe these two approaches in turn.
Three-Alternative Classification (see Figure I) Our three-alternative classiftcation is an extension of the two
alternative classification. widely used in this fteld. in which the
r o ~ "1 O.>j 00
Figure 1. Schematic representation of the frequency of seeinl,! (FOS) unequivOCl."ll singleness (1) and unequivocal doubleness (2) a'> a function of the disparity level in a das.'lificntion procedure with neither une<julvocnl singleness nor unequivocal doublcncs.'> a'l the third ulternativc (?).
17
subjc:ct is only allowc:d to answc:r "single:" or ''double:.·· We: found that these: catc::goric:s wc:rc: not adequate: bc:causc: of the: occurrc:ncc: of transitional percepts between singlc:nc:ss and doublc:nc:ss.
Our first altc:rnative, "(I)," was an unequivocal single: image which was dc:fmc:rl as the "intc:mal reprc:sc:ntation of the percept of the stimulus without disparity" (a sharp line:. not broadc:nc:d. not "restless," and pc:rcdved by both c:yes). This internal represc:ntation was built up by familiarizing the: subjc:a with the: percept of the: stimulus without disparity. The second altc:mative, "(2)," was an unequivocal double image which was definc:d as the percept of two lines (with a separation). Whc:n the percept was neither unequivocally single nor unequivocally double, the: subject was asked to selea the third alternative, "(?)," and to describe the transitional percc:pt afterwards. The disparity level above which an unequivocally single image: is no longc:r seen determines the: threshold for a perceived deviation from the intc:mal representation of the: pc:rcept of the stimulus without disparity. We: shall refc:r ro this threshold as the: singleness limit (SL) from now on. The disparity level above which unequivocally double images are seen will be called the doubleness threshold (DT). The subjed:s wc:re asked to classify in this way the: percepts evokc:d by tachistoscopically presented test stimuli and by continuously visible test stimuli.
Tachistoscopic presentation. In the: case of tachistoscopic pr<.-sentation, the subjea initiated presentation of the test stimulus by pressing a button. The stimulus was then presented with a constant disparity. selected at random by a microprocessor from J 2 preselected vaJues covering a sufficiently wide range to evoke: all possible percepts. The: subject then classified the percept. The subject was instructed to look at the fixation markc:r with clos.e anc:ntion for at lea.~t 2-3 sec between successive stimulus presentations. In each session, the: subjec:t had to classify the percepts evoked by the 12 disparity valuc:s 20 times each. After that, the: sc:ssion was repeated at least once again with 12 interpolated disparity values, until a frequc:ncy-of-sccing (FOS) curve was obtainc:d for each of the three image: classes in which c:ach transition from 0 to I was based either on at lc:ast four diffc:rc:nt points, c:ach point based on at least 20 observations. or on the maximum numbc:r of points givc:n the available resolution of .33'.
Cont.ll~uogs presentlltion. The procedure was diffc:rc:nt for continuous observation of the: test stimulus. Hc:re each run was started by the: subject with the aid of a switch. Two to S sec later, the: disparity slowly changed in steps of .33 ', .66', or 1.32 ·.The: disparity started at a preselected positive value and thc:n decrt.:asro through zc:ro to a presdectc:d negative value: or increased through zc:ro from negative to positive:. The subject was askc:d to keep a button pressed as long as the percept of the stimulus fc:ll into the: intermediate category (''?," i.e .• neither unequivocal singleness nor uneQuivocal doub!c:ness). At the c:nd of each run, the subjc:ct was to indie<ite (by prc:ssing the appropriate button) whether his/hc:r attention had bc:en diverted or the fixation marker had not remained unequivocally single: during the run. If so. the: data were automatically excluded from the subsequent analysis. The subject continued until 20 good runs were: completed. The direction of the change in disparity was then reversc:d, and anothc:r sc:ries was bc:gun. The recordings were usc:d tO construct FOS curves for each of the three image classes.
Calculation or thresholds. The FOS curvc:s obtained were fittc:d by a convolution of normaJizc:d Gaussian noise and hypothetical rc:gions of disparity in which one of the thrc:e image classes is aJways sc:c:n. Each abrupt transiton between neighboring regions was defined to be a "threshold" with the: standard deviation of the Gaussian noise: as its sta.ndard deviation. This implies that the thresholds wc:rc: calculated undc:r the assumption that, at c:ach illsparity. one of the three percepts was always sec:n. but that the: effective locations of the transitions between the pc:rcepts varied due to intrinsic additive: Gaussian noise:. AU thresholds and standard deviations are means of the: values found at positive: and negative: disparities. The data for cominuous presentation of the test stimulus wc:rc: also averaged ovc:r the valuc:s obtained with increasing and decreasing disparity.
18
Table 1 Details of the Subjects
Sub-Optica.l Correction Visual Acuity
jcct Ago Sex L R L R s A.L.D. 25 M S- .75 s- .75 S/4 5/4 w C.J.K. 38 M 5/4 5/4 30" B.D.L. 32 M 5~3.25 s- 3.00 5/4 5/4 ·30" A.E.H.P. 25 F S-4.75* S- 4.75* 5/4 5/4 w T.H.S. 27 M S-7.00 s- 7.0o* 5/4 5/4 60" CJ.D. 19 M S-9.00 5-II.OO 5/4 5/4 30"
Note-L =left. R:::: right, S =stereo. Visual acuity was determined with the aid of the Landolt-C chart. Stereo acuity (in seconds) was rested with the TNO test based on random-dot patterns in anagliph form (Lameris. Utrecht, The Netherlands). Optical correction is expressed in diopters. •These subjects also viewed through an artificial pupil of diameter 2.5 mm.
Two-Alternative Forced Choice In this method, each trial was staned by the subject's pressing
a button. The test stimulus was thc:n prc:sented twice: first 5 sec after initiation and thc:n 3 sec aftc:r initiation. In one of the two presentation intervals, the: test stimulus contained a disparity; in the othc:r. it did not. The subject was asked to decide which intc:rval contained the: disparity. The corrc:a answc:rs for S0-100 trials were accumulated. At least three different disparity valuc:s were: used tO dc:tc:rmine the disparity levc:l producing 7511/'o correct answers (which corresponds to a detc:aion level of SO%). This value: will be called the "deteaion threshold." The detectionthreshold data presented bdow are mc:ans of the: valuc:s obtained at positive: and negative disparity.
E;i;perimental Procedure The: subject was alignc:d in the test setup and providc:d (if neces
sary) with optical correction in ordc:r to achieve optimum sharpness of the perceived stimulus. The subject•s hc:ad was fl.Xed by using a bite-board. The luminance level of the stimuli on the screens was adjusted to 1.8 log units above the threshold for perception of the stimulus. The subject was thc:n informed of the experimental procedure described above. and was allowed ample: time to loolc at the: various stimuli and to familiarize him- or herself with the associated percepts. The cxperimc:nts were then run as described in detail above. The subjects were aslcc:d to take a rest whc:n they felt tired or when the sharpness of the: pc:rcc:ived image detc:riorated. The constancy of each subject's performance: was monitored during collection of threshold data. When. by visual inspection of the FOS curves obtained, an apparent threshold shift was noticed, the preceding pan of the expcrimc:nt was rc:pc:ated until no funher shift was apparent. Threshold shifts occurred mainly during the: first few experimental sessions ror each subject.
Subjects
Six subject~ panicipated in the various experimc:nt5 (see Table I). Only Subject A.L.D.-one of the: authors-was aware of the: purpose: of the experiments. All but one: had to be corrected optically to achieve: optimum sharpness of the perceived stimulus. In ordc:r to obtain long-term stability for optimum sharpness, artificial pupils (diametc:r, 2.5 mm) had to be used with two subjects (Subjec:ts A.E.H.P. and T.H.S.).
EXPERIMENT 1: THRESHOLDS FOR VERTICAL DISPARITY
Method
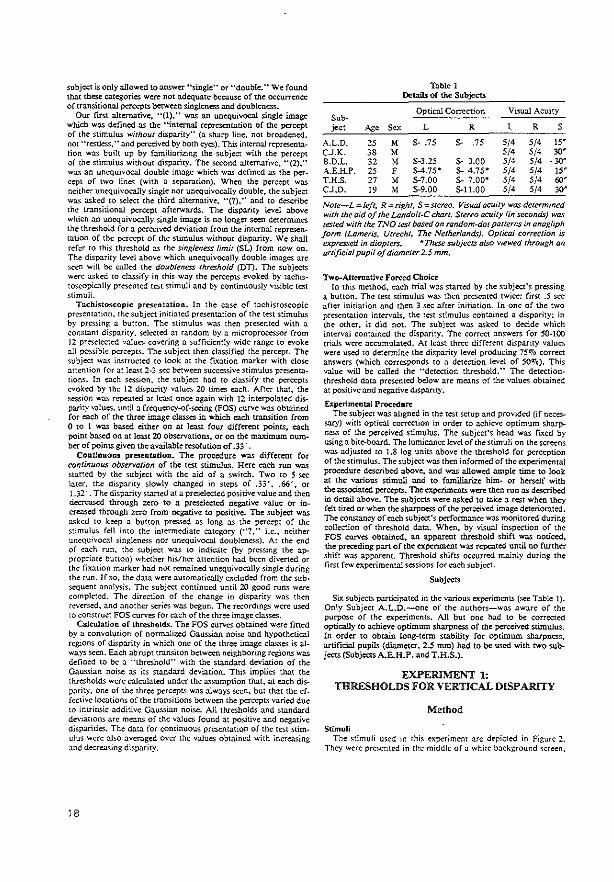
Stimuli The stimuli used in this experiment are depictc:d in Figure 2.
Thc:y were presented in the middle of a white background screc:n,
A
'! " " I r
B
G G I r
c ------ ------
I r
Figure :z. Scbematlc n:spresenW!oo or tbe stlmcli used In Experiment 1. Tbe letters I and r stand for presentstlo11 to tbe left and rig!lt eye. respectively. The broken line used to represent the S' fixation circle mean." that this marker di..'iappears during the course of each trial before presentation of the stimulus.
on which the venical orientation was marked by means of a black line (width 1.0') with a gap 1.5° wide in the middle, where the stimuli were presented. The stimuli on the display screen consisted of a fiXation marker and a test stimulus.
Fixation markers. The fiXatiOn circle shown in Figure 2A. indicated by''[O]" from. now on. had a diameter ofS'. The subjects were instructed to look at the middle of the circle, while waiting for the test stimulus. The circle disappeared 200 m.sec before the test stimulus appeared and reappeared .6 sec after the test stimulus had vanished. This f!Xation marker can be regarded as giving highly inconspicuous cues concerning monocular displacements.
The fiXation circle of Figure 2B (indicated by .. 0 .. ) had a diameter of 1° and was continuously visible. With tachistoscopic presentation of the test stimulus, the subjects were instructed to look at the center of the circle. With continuous presentation of the test stimulus. the subjects were instructed to look alternatdy at the upper and lower halves of the circle, switching their gaze regularly to avoid fading of the test lines. This fixation marker may be regarded as giving monocular disparity cues of intermediate conspicuousness.
The left-hand line in Figure 2C was the third fJ.Xation marker (indicated by "-"). It was also continuously visible. It had a length of 30' and was laterally separated from the test line by 3'. The subjects were instructed to look at the right-hand part of this marker, switching their gaze regularly from this part to the middle, when the test stimulus was continuously visible. This marker provides a highly conspicuous cue for monocular displacements.
Test stimulus. The test stimulus was a pair of dichoptic horizontal lines with a length of 30', a width of 1.0', and a variable vertical disparity.
When the test stimulus was pre.~ented w.chistoscopically, the presentation time was 200 msec. {Such test stimuli are simply called .. 200 msec" from now on.) This presentation time is a compromise between allowing as much time as possible for fusion to develop,
on the one hand. and preventing a raising of disparity thresholds by the interference of fusional eye movements. on the other. Experimentally, this r:llsing was found not to occur for presentation times up to at least 200 msec. This agrees with data in the literature on reaction times of fusional eye movements. Fusional eye movements in the horizontal direction start after about .2 sec (Mitchell. 1970). A presentation time of about 200 msec has the further advantage of providing a relatively familiar stimulus form: Large vertical foveal disparities are likely to t-e present for at least the reaction time of fusional eye movements in daily life.
When the test stimulus was presented continuously, the vertical disparity chanf;ed in steps of .33' at intervals of 800 msec, that is, at a rate of .4' /sec (such stimuli are called .. .4' sec·'" or ".4 arc min/sec''). The interference of fusional eye movements was minimized by foveal fixation of the marker. When fusional eye movements did. nevertheless, occur during the run. the subject could pereeive this from the change that occurred in the appearance of the fixation marker. which did not remain single and usually became unequivocally double. Runs in which fusional eye movements were noticed were disregarded.
Messurlng Procedure The psychophysical measuring procedure used was three
alternative classification.
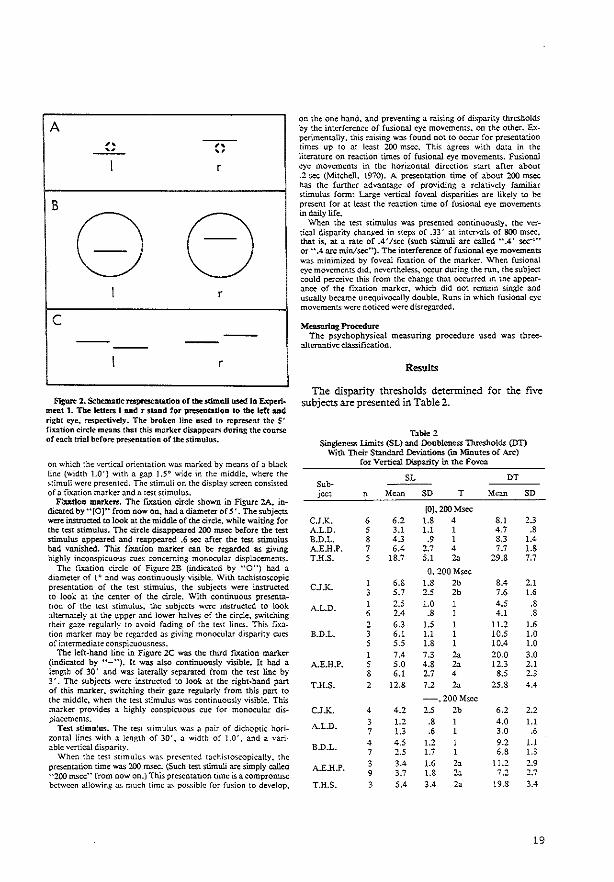
Results
The disparity thresholds determined for the five subjects are presented in Table 2.
Table 2 Singleness Limits (SL) and Doubleness Tiuesholds (DT)
With Their Standard Deviations (m Minutes of Arc) for Vertical Disparity in the Fovea
Sub-SL DT
jcct n Mean SD T Mom SD
[0].200Msec C.J.K. 6 6.2 !.8 4 8.1 2.3 A.L.D. 5 3.1 1.1 1 4.7 .8 B.D.L. 8 4.3 .9 1 8.3 !.4 A.ER.P. 7 6.4 2.7 4 7.7 !.8 T.H.S. 5 18.7 5.1 "" 29.8 7.7
0. 200 Msec
C.J.K. 1 6.8 1.8 2b 8.4 2.1 3 5.7 2.5 2b 7.6 !.6
A.L.D. 1 2.5 LO 4.5 .8 6 2.4 .8 4.1 .8
2 6.3 !.5 11.2 !.6 B.D.L. 6.1 1.1 10.5 l.O
5.5 !.8 10.4 !.0 1 7.4 7.3 "" 20.0 3.0
A.E.H.P. 5 5.0 4.8 "" 12.3 2.1 8 6.1 2.7 4 8.5 2.3
T.H.S. 2 12.8 7.2 "" 25.8 4.4
-.200Msec
C.J.K. 4 4.2 2.5 2b 6.2 2.2
A.L.D. 3 1.2 .8 4.0 1.1 7 1.3 .6 3.0 .6
B.D.L. 4 4.5 1.2 9.2 1.1 7 2.5 !.7 6.8 1.3
A.Eli.P. 3 3.4 !.6 ,, 11.2 2.9 9 3.7 !.8 "" 7.2 2.7
T.H.S. 3 5.4 3.4 "" 19.8 3.4
19

Subject
C.J.K.
A.L.D.
B.D.L.
n
2 2 9
2 A.E.H.P. 6
T.H.S.
C.J.K.
A.L.D.
B.D.L.
A.ER.P.
T.H.S.
10
4 8 6 4
11 4
Table 2 (continued)
SL
SD T
0, .4 Arc Min/Sec 3.0 .6 1/3* 4.0 .6 1.9 .5 4.3 .8 1 7.7 2.2 3 6.4 1.2 3 4.4 1.4 1 8.0 1.3 2a/3t
-, .4 Arc Min/Sec 2.8 .7 1/3* 1.9 .4 1.2 .3 3.1 .6 1 4.0 1.4 3 3.4 1.4 3 5.8 1.8 2a/3t
DT
SD
6.5 .8 6.9 .9 4.5 .5 8.0 .7
17.0 2.1 12.8 2.0
8.8 1.8 17.0 3.3
7.2 1.6 3.9 .5 3.5 .5 7.0 .6
}2.0 2.5 9.1 1.6
17.9 2.8
Nou·-T=-translliona/ percept: (/)broadened, blurred, restless tmage; (2) displaced single image, (a) ima~:e of right eye, (b) image o/ lej£ eye; {3) rivalry between the images in the left and right eyes; (4) subject not able lO specify the transitional percept. n =session number. "Near SL = 1; near DT""3- tFor positive vertical disparity (image in right eye up, left eye down) and for negafive disparities (nghr eye down, left eye up) near SL=-2a; for negative disparllies near DT =- 3.
The singleness limits were found to vary between 1.2 I and 19 1
• and the doubleness thresholds between 3.0 1 and 30'. Taken together, the range found is in good agreement with the overall range of diplopia thresholds reported by other authors (see the introduction).
The following, more detailed analysis is based upon the thresholds obtained in the last session of each expe..iment, when the subjects had reached stable performance. Tnese thresholds are presented in Figgure 4.4 One of the subjects took a lot of experimental time to reach a stable performance. As shown in Figure 3, the thresholds decreased by up to 11.5' (a factor of 2.3) from the start of the experiments to the end. The occurrence of this training effect has been both reported (see, e.g., Ogle, 1964) and denied (see, e.g., Mitchell. 1966) in the literature.
Differences Between Subjects Inspection of Figure 4 reveals that differences be
tween subjects are the most important cause of the large ra.TJ.ge of observed disparity thresholds.
It should be borne in mind that a large interindividual variability for a sensory threshold as such is not a surprising result, given the known interindividual variability of up to 1 order of magnitude for detection thresholds of, for example, the auditory system (Dadson & Kin.;, 1952) and the vestibular system (Clark & Stewart, 1969).
The interindividual variability is also reflected in the standard deviations of the thresholds. When the
20
thresholds are expressed in standard-deviation units. the variability is reduced5 (see Figure4). This implies that the interindividual relevance of this signal-tonoise ratio of the threshold is greater than that of the threshold itself. An important theoretical implication of this finding will be discussed below (see Summary and Conclusions of this section).
One of the possible factors underlying the enormous differences between the subjects seems to be the optical correction applied. In Figure 5, the disparity thresholds obtained in the first session of each experiment are compared with the optimum optical correction. Inspection of this figure shows that the initial threshold-especially the doubleness threshold-is higher when the optimum correction is larger. This can be made plausible in several ways.
One might argue that this dependency on optimum optical correction originates from the angular reduction of the retinal images that may occur in corrected myopes. This angular reduction does not occur when the need for optical correction is caused only by an elongated eye, but it does occur when the refractive power of the eye is too large (Ogle. 1971). Although we did not establish the nature of the myopias (so they might have had a refractive origin). we can still exclude angular reduction of the retinal images as the major cause of the higher thresholds at larger optimum optical corrections, because: (I) training may reduce the thresholds of subjects with large optimum optical corrections (see Figure 3); (2) the dependency .on optimum correction should then be the same for all thresholds, which is not the case; and (3) the maximum effect of this angular reduction is comparatively small. A psychophysical experiment showed that a change of the effective refractive power of the eye by addition of a correction lens results in a perceived angular reduction of only 2.2o/o per diopter for the spectacles used. This implies that the actual disparity thresholds may be smaller by, at most. OOJo for 0 d, 1.7o/o for -.75 d, 6.9% for -3.15 d. 10.5% for -4.75 d. and 15.4% for -7 d.
It is more likely that the dependency of the thresholds on the optimum optical correction reflects adaptation to vertical disparities in daily life as a result of small rotations in the frontal plane of an observer's spectacles.
Another cause of the interind.ividual variability of disparity thresholds. may be systematic differences in the accuracy of the alignment of the eyes. Our study on this was reported in Duwaer and van den Brink (Note 1).
The Criterion for Diplopia The geometric means of the singleness limits are a
factor of 1.5 to 2.6 less than the geometric means of the doubleness thresholds.
The differences are es~ially large for continuous presentation of the test stimulus and for tachistoscopic presentation in combination with the fixation line. A
20
0
0 0
• 3 0 ·;; .s .;; 0 ; • 10 ~ ~
0 -~ .,
2 4 6 8 10
session number
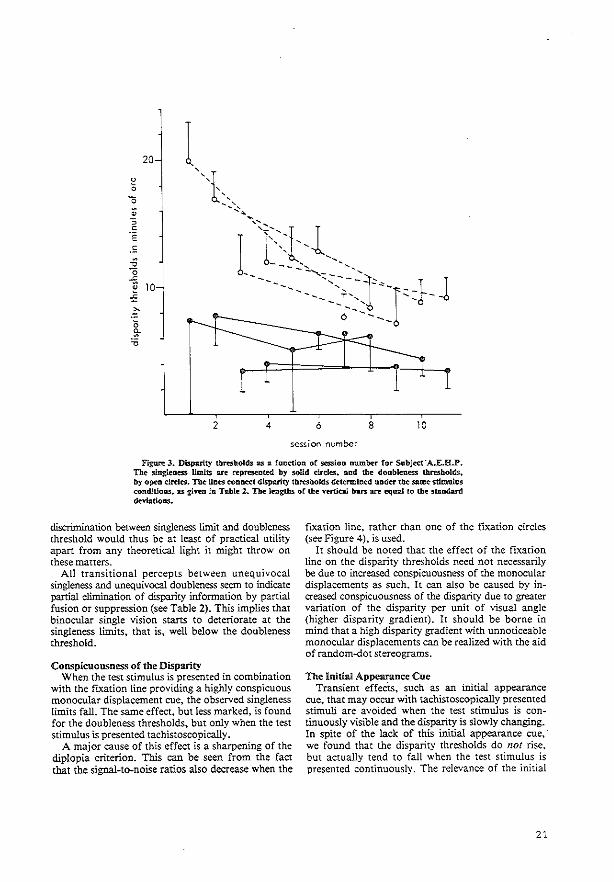
Figul:'e 3. Disparity thresholds as a function of sessioo number for Subject ·A.E.H.P. The singleness limits are represeDted by solid circles, and tbe doubleness thresl:tolds, by open circles. The U11es couoect disparity tbrcsbolds determillled onder tbe same stimulus rondltions. as given In Table 2. The lengths of the vertical bars IU't' equal to the stli.Ddard deviations.
discrimination between singleness limit and doubleness threshold would thus be at least of practical utility apart from any theoretical light it might throw on these matters.
All transitional percepts between unequivocal singleness and unequivocal doubleness seem to indicate partial elimination of disparity information by partial fusion or suppression (see Table 2). This implies that binocular single vision starts to deteriorate at the singleness limits, that is, well below the doubleness threshold.
Conspicuousness of the Disparity When the test stimulus is presented in combination
with the ftxation line providing a highly conspicuous monocular displacement cue, the observed singleness limits fall. The same effect, but less marked, is found for the doubleness thresholds, but only when the test stimulus is presented tachistoscopically.
A major cause of this effect is a sharpening of the diplopia criterion. This can be seen from the fact that the signal-to-noise ratios also decrease when the
ftxation line, rather than one of the ftxation circles (see Figure 4), is used.
It should be noted that the effect of the fixation line on the disparity thresholds need not necessarily be due to increased conspicuousness of the monocular displacements as such. It can also be caused by increased conspicuousness of the disparity due to greater variation of the disparity per unit of visual angle (higher disparity gradient). It should be borne in mind that a high disparity gradient with unnoticeable monocular displacements can be realized with the aid of random-dot stereograms.
The Initial Appearance Cue Transient effects, such as an initial appearance
cue, that may occur with tachistoscopically presented stimuli are avoided when the test stimulus is continuously visible and the disparity is slowly changing. In spite of the lack of this initial appearance cue, we found that the disparity thresholds do not rise. but actually tend to fall when the test stimulus is presented continuously. The relevance of the initial
21
4()
1 4()
0
0 '0 0 ~ 0 3 0 ~ -10 10 ~ •• 0
] .c 0 0 0 ..
~ :~ ! ... 00 4 • • 0 -• 0 • • ~ 0 • ~ <» • 0 ~
C>
-~ 0 0
[o] 0 0 [o] 0 0
200 200 200 0.4' 0.4' 200 200 200 0.4' 0.4'
e 4() m'~ m~c msec sec-1 ,ec- m'ec msec =~ sec-1 ~c- 4()
0 0 ., 0
0 0 ~ 0 0
$; ~ .. .. •• 10 .. 10 ~
~ ..
0 0 - - .. ~
0 g ~ 0 0 0
li • .. 4 0 4 ~ e 0 •
0 c .. ! •
~ ~ 0
"' :0 , 0 ~ [ o] 0 0 [ o] 0 0
200 200 200 0.4' 0.4' 200 200 200 0.4' 0.4' msec msec msec sec-1 sec-1 msec msec m~c sec-1 sec-1
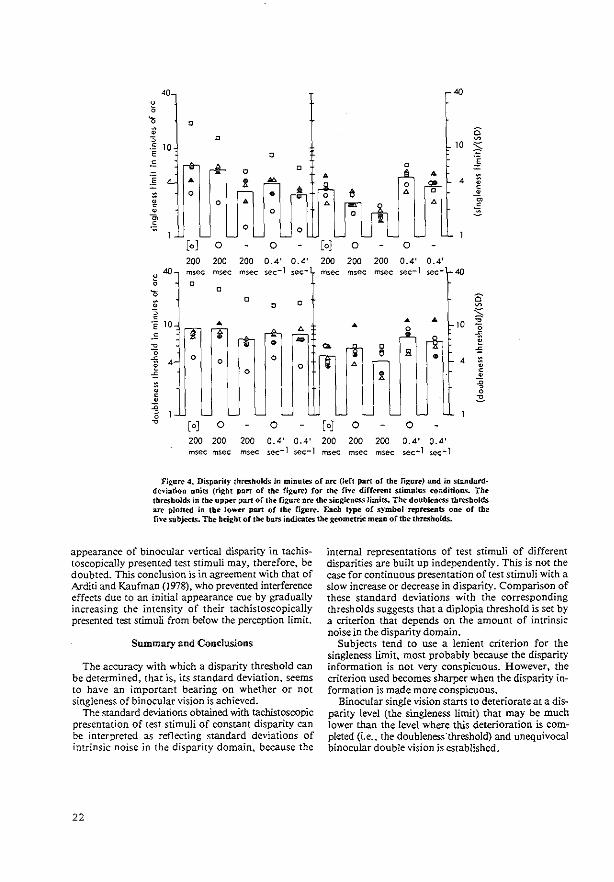
Figure 4. Disparity thresholds in minutes of ate (l~ft part of lhe figure) and in standanl· deviation units (rijl;bt part of the figure) for the five dirfl.•rcnl stimulus conditions. The thresholds in the upper part of the fi11;ure are the sillglenes..'i limits. The doubleness thresholds are ploUed in the lower pan of the figure. Eneh type of symbol represents one of the five subjects. The height of the bars indicates the geometric mean of the thresholds.
appearance of binocular vertical disparity in tachistoscopically presented test stimuli may, therefore, be doubted. This conclusion is in agreement with that of Arditi and Kaufman (1978), who prevented interference effects due to an initial appearance cue by gradually increasing the intensity of their tachistoscopically presented test stimuli from below the perception limit.
Summary and Conclusions
The accuracy with which a disparity threshold can be determined, that is, its standard deviation, seems to have an important bearing on whether or not singleness of binocular vision is achieved.
The standard deviations obtained with tachistoscopic presentation of test stimuli of constant disparity can be interpreted as reflecting standard deviations of intrinsic noise in the disparity domain, because the
22
internal representations of test stimuli of different disparities are built up independently. This is not the case for continuous presentation oftest stimuli with a slow increase or decrease in disparity. Comparison of these standard deviations with the corresponding thresholds suggests that a diplopia threshold is set by a criterion that depends on the amount of intrinsic noise in the disparity domain.
Subjects tend to use a lenient criterion for the singleness limit, most probably because the disparity information is not very conspicuous. However, the criterion used becomes sharper when the disparity information is made more conspicuous.
Binocular single vision starts to deteriorate at a disparity level (the singleness limit) that may be much lower than the level where this deterioration is completed (i.e., the doubleness·rhreshold) and unequivocal binocular double vision is established.
t l 0, 200m~< -,200m'"'"
20 ,.P'"~--.0 p 20
"~ '
' Q
" ~-
:f ~
J' 0 -2 _, _,
-2 _, -6
Optirroftopti<::ol corr.,ctio~ ;~ dioptre'-
0, 0.4 orcmin/;t'c 1-, 0.4 orcmin;..,c
20 20
:/I:::::::= ' -2 -4 -6
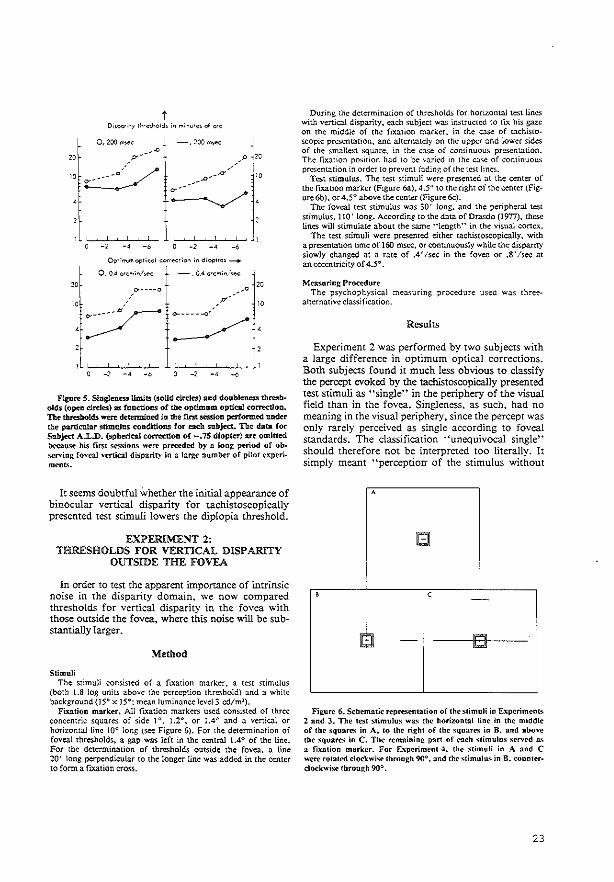
Flgun- 5. S!nglencs:JI.imits (sol.id circles) and doublene:~S thrul:lohis (open clrdes) as fuoctions of the optimum optteaJ eorrectio11. The thresbo!ds were determined In the fir:5t uss.ioa pcrfonntd under the particular stimuJus conditions for esch subject. The data for" Subject A.L.D. (spberic:al eorrectio11 o! -.75 diopter) ~~n omlned because his first sessions were preceded l>y ll. lonji! period of observin~: foveal vertical disparit~' in a lar£.e :~umber or ll'ilot experiments.
It seems doubtful Whether the initial appearance of binocular vertical disparity for tachistoscopically presented test stimuli lowers the diplopia threshold.
EXPERIMENT 2: THRESHOLDS FOR VERTICAL DISPARITY
OUTSIDE THE FOVEA
In order to test the apparent importance of intrinsic noise in the disparity domain, we now compared thresholds for vertical disparity in the fovea with those outside the fovea, where this noise will be substantially larger.
Method
Stimuli The stimuli consisted of a fixation marker, a test stimulus
(both 1.8 log units above the perception threshold) and a white background {15° x !5°; mean luminance level 3 cd/m').
Fixntion mnrker. All fiXation markers used consisted of three concentric squares of side 1°, Lr, or 1.4° and a vertical or horizontal line 10" long (see Figure 6). For the determination of foveal thresholds, a gap was left in the cerural 1.4" of the line. For the determination of thresholds outside the fovea. a line 20' long perpendicular to the longer line was added in the center to form a fixation cross.
During the determination of threshold;; for horizontal test lines with vertical disparity. each subject was instructed to fix his gaze on the middle of the fixation marker. in the case of tachistoscopic presentation. and alternately on the upper and lower sides of the smallest square. in the c-.J.Se of continuous presentation. The fb::ation position had to be varied in the case of continuous presentation in order to prevent fading of the test lines.
Test stimulus. The test stimuli were presented at the center of the fiXation marker (Figure 6a). 4.5" to the right of the center (Figure 6b). or 4.5° above the center (Figure 6e).
The foveal test stimulus was 30' long. and the peripheral test stimulus. 110' long. According to the data of Drasdo (1977). these lines will stimulate about the same "length .. in the visual cortex.
The test stimuli were presented either tachistoscopically, with a presentation time of 160 mscc. or continuously while the disparity slowly changed at a rate of .4' /sec in the fovea or .8' /see at an eccentricity of 4.5°.
Measuring Procedure The psychophysical measurmg procedure used was three
alternative c\assi fication.
Results
Experiment 2 was performed by two subjects with a large difference in optimum optical corrections. Both subjects found it much less obvious to classify the percept evoked by the tachistoscopically presented test stimuli as "single,. in the periphery of the visual field than in the fovea. Singleness, as such, had no meaning in the visual periphery, since the percept was only rarely perceived as single according to foveal standards. The classification "'unequivocal single" should therefore not be interpreted too literally. It simply meant "perceptiorr of the stimulus without
A
[-
I
I I •
I ' --
r -- 8
Figure 6. Schematic representation of the stimuli in Experiments 2 and 3. The lest stimulus was the horilontal line in the middle of the squa~ in A. to the right of the squares in B. and above the squares in C. The remaining pllrt of eaeh stimulus served ll.\
a fi:wtion marker. For Experiment 4. the stimuli in A and C were rotated eloekwise through 90°. and the stimulus in S. counterclockwise through 90°.
23

disparity.'' Subject A.L.D. noticed that when the test stimulus was presented tachistoscopically without disparity. the percept varied between single and double according to the foveal standards.6 Being a highly skilled observer, Subject A.L.D. was able to apply the criteria "very good single,'' "single" (i.e .. the ensemble of percepts evoked by the stimulus without disparity). and '·not unequivocally double" consistently. The FOS curves obtained with the aid of these criteria are given in Figure 7 A. When these curves are fitted by a convolution of normalized Gaussian noise and a range of disparities in which the percept in question is always seen. a remarkable result emerges. The limits of the above-mentioned ranges. the ''thresh~ olds. •• can vary between 3 ' and 16', while the accuracy with which these limits are determined changes much less (see Figure 7B). What is important here is this accuracy, that is, the amount of noise in the disparity domain. The classification "single" and "unequivocal double" are just two possible criteria on an apparently continuous scale. It also becomes
_,. ->0 0 " "'
_[:l" ___ .... ~· .. _____ _ ..
---4'·•c":_L..Q.._t.._,~,:·•~-. -----
-····n·--~--_, ->0 0 " "'
evident why the singleness limit is roughly equal to twice its standard deviation. This standard deviation should be interpreted as reflecting the intrinsic noise in the disparity domain. As a result of this noise. a stimulus without disparity will result in an internal representation with an effective disparity of up to about 2~3 times the standard deviation of the noise. Apparently, the subjects "choose .. their criterion for unequivocal singleness at this disparity level.
The data also indicate that binocular singleness or doubleness is determined by absolute retinal disparities and not by relative disparities in the stimulus. This may be concluded from the finding that optimum singleness (the center of the region of unequivocal singleness) was located at the nonzero stimulus dis~ parities (+12' for Subject C.J.D. and -4' for Sub~ ject A.L.D.) that compensated as well as possible the retinal disparities introduced by the cyclophorias of 2.5° extorsion in Subject C.J .D. and .8° intorsion in Subject A.L.D.' Because of the cyclophoria in Subject C.J.D., the effective disparity level of the
->0 0 "
[ .. ~··-~-·-];·--.. . · .. . .. .. • 1+7 ...... _
1+?
_, ->0 "
FOS
VERTICAL DTSJ>ARITY IN MINUTES OF ARC
24
Fij!ure 7A. Frequencies of ~ecinJ! ··wry xood sinJ!Ie'' images (""0."' four sessions). ""sin2!e"' imaJ!es (''1," i.e •• the <.'nsemblc or percepts <.'Voked by the stimulus without retinal disparity. three sessions). :~~.nd '"not unequivoally double"' im:ages (''l + '! :· three sessioDS). represented by 50IId drcles, :as functions of the vertical disparity in 2 W.dlistoscopically preseu.ted borizontaJ nne IOClltt'd 4.5'' to tbe right or lhc fixation point. These dab were obl:lined [or Subject A.LD. Each experimental point WllS obtained from 20 trials. The :~~.Symmetries in the frequencies of ~in~ curves :~~.re caused by the cyclophoria in this ~ubject (see text).

• -~--o
~-
. ,
5 15 20
dispodty tf.reshold in minvtes of ore
Figure 7B. The mean standard deviation of each •"threshold" (the mean standard devi:ltiOn of the distributions used to fit !he experimentnl points in Figure 7A) are ploncd as a function of the disparity threshold. The open squares represent .. very good single .. images. the solid circles. ••sinltle .. images. and the open circles. "not unequivOC!Illy double .. images. The dotted line is obtained by linear regression. with the standud deviation as dependent variable.
stimulus without disparity fell only just within the singleness limits!
The singleness limits and doubleness thresholds obtained are presented in Table 3.
At an eccentricity of 4.5°. the thresholds obtained vary between 6' and 30'. This is appreciably less than the range reported in the literature, which ex· tends up to 60' (Crone & Leuridan, 1973). Our major finding is that, just as in the fovea, the signal-tonoise ratios of the singleness limits for tachistoscopic presentation of the test stimulus amount to about 2. The finding of a relatively constant signal-to-noise ratio for thresholds of different sizes thus seems to apply not only imerindividually, but also intraindividually at different eccentricities.
Conclusions
The results of Experiment 2 confirm, and even reinforce, the importance of the amount of intrinsic noise in the disparity domain for the size of diplopia thresholds. It is, furthermore, evident that the singleness limits and doubleness thresholds are based on just two criteria on a continuous scale of possible
criteria which even extends below the singleness limit. The results also suggest that the singleness/double
ness disparity thresholds are determined by absolute retinal disparities and not by relative disparities in the stimulus as is, for example, the case for the detection threshold for horizontal disparity when detection is based on relative stereoscopic depth .
EXPERIMENT 3: DETECTABILITY OF VERTICAL DISPARITY
If even the singleness limit can be regarded as simply the result of applying a lenient criterion on a continuous scale of possible criteria, the detection threshold determined in a discrimination task that invites the subject to use the sharpest possible criterion should be below the singleness limit. 8 This was checked in Experiment 3.
Method
Stimuli The stimuli were the same as those used as in Experiment 2.
The test stimulus was only presented tachistoscopically. with a presentation time of 160 mse<:. The rclerence stimulus contained no retinal vertical disparity.
Measuring Proeednn-The psychophysical measuring procedure used was two
alternative forced choice.
Results
Experiment 3 was performed with the same two subjects used in Experiment 2. The results are given in Table 4.
Inspection of Tables 3 and 4 shows that all detection thresholds are. indeed, smaller than the corresponding singleness limits. The most remarkable performance was that of Subject C.J.D., who was found to be capable of detecting a foveal vertical disparity of only 2.2', although his singleness limit amounted to 7.0' and his diplopia threshold to as much as 19', under the same stimulus conditions. This subject reported that he discriminated between the stimuli on the basis of minor differences in unequivocally single images. These differences between successive presentations were smaller than the variation of the percept evoked by the test stimulus without disparity in a large number of successive presen-
Tabie3 Singleness Limits (SL) and Dou.blcncss Thresholds (DT) W1th Thcir Standard Deviations (m Minu.tes of Arc) for Vertical Disparity
in the Fovea, 4S to the Right of the F"vcation Point (4.5/0) and 4.5° Above the Fix:ltion Point (4.5/90)
Fovea 4.5/0 4.5/90
160 Msec .4 Arc Min/Sec 160 Msec .8 Arc Min/Sec 160 Msec .8 Arc Min/Sec
SL DT SL DT SL DT SL DT SL DT SL DT Sub· ------ -- ---jcct M SD M SD M SD M SD M SD M SD M SD M SD M SD M SD M SD M SD
A.L.D. 2.0 .7 3.6 .8 1.6 .5 4.7 .6 8.1 4.4 14.4 4.8 6.3 1.5 16.2 1.4 10.1 5.1 22.9 5.0 6S 2.0 18.4 2.4 C.J.D. 7.0 4.4 19.3 2.5 3.6 1.3 13.0 2.0 16.9 7.7 29.3 6.4 9.6 3.9 19.7 3.8 19.0 7.8 27.6 4.8 14.0 3.0 23.6 3.2
25

Tabk4 Detection Thresholds (i.n Minutes of Arc) forVertk:lll Disparity
in tbe Fovea., 4.5° to tbe Rigbt of tbe Fl.u.tioa Point (4.5/0). and 4.5" Above tbe FID:tion Poi.nt (4.5/90)
Subject
A.L.D. C.J.D.
Fovea
1.6 2.2
160 Mscc
4.5/0
5.3 14.1
4.5/90
6.1 145
tations. which had not been noticed until this test procedure was applied. It should be noted that the difference between Subjects A.L.D. and C.J.D. became negligible in this experiment as far as the detectability of foveal disparity was concerned. However, their impression of the stimulus just above the detection threshold differed substantially: Subject A.L.D. certainly did not perceive an unequivocal single line; instead, he saw a restless, blurred, broadened line. It is not unlikely that this difference is due to the higher intrinsic noise level in Subject C.J.D., as a result of which he may have been more accustomed to the occurrence of these intermediate disparities.
In analyzing the magnitude of the detection thresholds found for vertical disparities, it mU5t be reminded that these thresholds have a lower limit determined by the amount of intrinsic noise in the disparity domain." This lower limit is equal to .955 X the standard deviation of the intrinsic noise for the case of ideal signal detection without any loss of disparity information. Since both positive and negative vertical disparities result in a separation (without sign) of the test lines. it is not unlikely that information about the sign of the disparity is lost. Such a loss of sign information would raise the lower limit of the detection threshold to 1.49 x the standard deviation of the intrinsic noise. Comparison of the measured detection thresholds with lower limits predicted on the basis of the standard deviations of the singleness limit and doubleness threshold as estimates of the standard deviation of the intrinsic noise suggests that it is necessary to assume some loss of disparity information to explain these results. In the highly practiced subject, A.L.D., this loss of information can be almost entirely ascribed to loss of information about the sign of disparities (in itself, quite a likely effect). This makes it tempting to deny the existence of any insurmountable loss of information about the magnitude of vertical disparities, that is, the occurrence of dead zones or· of irreducible Panum's fusional areas for vertical disparities.
Conclusion
The detection threshold for vertical disparity (determined by a two-alternative forced-choice pro-
26
cedure) is lower than the singleness limit and, of course, than the doubleness threshold (both determined by the three-alternative classification procedure above). This implies that neither the singleness limit nor the doubleness threshold can be interpreted as the boundary of a region of disparities in which the information about the size of disparity is lost. This agrees with similar results obtained by Kaufman and Arditi (1976b) for stimuli with cyclodisparity.
EXPERIMENT 4o THRESHOUJS FOR HORIZONTAL DISPARITY
In a final experiment, we gathered some data on the magnitude of thresholds for horizontal disparity.
Method
Stimuli The stimuli were the same as those of Experiment 2, except
that they were rotated through 90° in the frontal plane (Figures 6A and 6C: dockwise rotation; Figure 6B: counterdockwise rotation). The foveal thresholds were determined while the subjects looked at the middle of the lower side of the smallest square in the =e of tachistoscopic presentation and alternately at the left and right end of this side in the case of continuous presenta.tion. The thresholds outside the fovea were determined while the subject flXed. his gaze on the center of the fOOLtion marker in the case of tachistoscopic presentation and .alternately on the left and right sides of the smallest :;quare in the case of continuous presentation. The fixation position had to be varied in the case of continuous presentation in order to prevent fading of the test lines.
Mea<q~ring Procedure The psychophysical measuring procedures used were both three
alternative dassification and two-alternative forced choice.
Results
Experiment 4 was performed with two subjects. both of whom were found to base the detection threshold for horizontal disparity on the perception of relative depth in an otherwise unequivocal single image.9 These detection thresholds were much lower than those for vertical disparity. They amounted to .2 1 -.3 1 in the fovea and to .8 1 -1.0' at an eccentricity of 4.5°. These values are comparable to those obtained by other authors (e.g., Ogle, 1964).
When the horizontal disparity is further increased, the relative depth increases and, in addition, the appearance of the "single" percept, apal''t from its depth, changes. Both subjects characterized this change as a gradual increase in "glow," that is. diffuse irradiance. around the line. At an eccentricity of 4.5°, the line with glow eventually changes into one restless object of indeterminate appearance at an intermediate lateral position and with depth. At still larger disparities, the line becomes unequivocally double while the impression of depth strongly deteriorates. These descriptions are similar to those given by Ogle (1964), if Ogle's

"fused line" is interpreted as a fine without a substantial amount of "glow.,.
For determination of the singleness limits and doubleness thresholds, the subjects were instructed to disregard the complicating occurrence of depth and to concentrate on the appearance of the line perpendicular to the line of sight. The results are presented in Table 5.
The foveal disparity thresholds vary between 4 1
and 22' .10 This covers a substantial part of the range of values reported in the literature (see the introduction). The same can be said of the thresholds at an eccentricity of 4.5°, for which values between 13 1
and 135' were obtained. The differences between thc.: two subjects become sma!Ier when the thresholds are expressed in standard-deviation units and when the test line is continuously visible while the disparity slowly changes.
Conclusions
For horizontal disparities, disparity thresholds can be obtained that can vary by up to two orders of magnitude (in the fovea: .25' -22.2'; at an eccentricity of 4.5°, 1'-135'). The detection thresholds found here are markedly lower than those for vertical disparity. The singleness limits and doubleness thresholds, on the other hand. are higher than those for vertical disparity. The latter is not surprising, since, because of the accompanying occurrence of stereoscopic depth, deviations from singleness as a result of horizontal disparity are much less conspicuous.
DISCUSSION
Which Threshold is the Diplopia Threshold? The singleness limits and doubleness thresholds,
especially in the fovea, occur at disparity levels at which the interpretation of the binocular percept in terms of singleness and doubleness undergoes its two major changes. The singleness limit specifies the disparity level at which the perceived singleness of the stimulus starts to deteriorate, and the doubleness threshold marks the disparity level at which this deterioration is completed. The singleness limit and the doubleness threshold should thus be regarded as lower and upper limits of "the" diplopia threshold.
Although the detection thresholds are of major theoretical importance in the evaluation of the nature of the diplopia threshold, they have little or no utility as diplopia thresholds. The detection threshold for horizontal disparity is not at all useful as a diplopia threshold, because it is based on differences in depth in otherwise unequivocal single images. although there is evidence that this depth cue differs essentially from the singleness doubleness cue: Depth is based on a processing of relative disparities in the stimulus (disparity gradients; Duwaer & van den Brink, Note 1), whereas the results of our Experiment 2 suggest that the singleness/doubleness cue is determined by absolute retinal disparities. The detection threshold for vertical disparity-though most probably based on a cue that does not differ essentially from the singleness/ doubleness cue- is not so useful as a practical diplopia threshold because it specifies the performance of disparity detection in a discrimination task that is optimum for this purpose without considering the singleness of binocular vision as such.
What Determines the Magnitude of the Diplopia Threshold?
Our results -suggest that an important determinant of the magnitude of the diplopia threshold is the amount of intrinsic noise in the disparity domain. When there is more noise, for example, outside the fovea or in some other subject, the diplopia threshold is higher.
The magnitude of the diplopia threshold also depends on the conspicuousness of changes in singleness due to the disparity. When these changes are made more conspicuous, for example, by the use of a fixation marker to make monocular displacements much more noticeable or with the aid of large disparity gradients, the diplopia thresholds reduce." On the other hand, when the changes in singleness due to disparity are less conspicuous, for example, as a result of the absence of conspicuous monocular displacements or the occurrence of stereoscopic relative depth, the diplopia thresholds are higher.
The magnitude of the diplopia threshold was finally found to depend on the amount of training received by the subject and on systematic differences between subjects, in particular the optimum optical correction applied.
Table 5 Singleness limits (SL) and Doubleness Th:reshold.s (DT) With Tilcir Standard Deviations (Ill Minutes of Arc) for Horizontal Disparity
in the Fovea, 4S to the Right of the Fixation Point (4.5/0) and 4S Al?ove the Fixation Point.{4.S/90)
Fovea 4.5/0 4.5/90
160 Msec .4 Arc Min/Sec 160 Msec 1.6 Arc Min/Sec 160 Msec 1.6 Arc Min/Sec
DT SL DT SL DT SL DT --=-.:___ ---- --------SL
Sub-SL DT DT SL
ject M SD M SD M SD M SD M SD M SD M SD M SD M SD M SD M SD M SD
A.L.D. 4.8 1.5 7.5 1.5 3.9 .7 7.7 .7 13.5 7.4 23.1 11.3 I9.3 4.2 50.2 5.9 I3.6 I2.5 32.9 IS.7 14.8 4.1 52.1 4.9 C.J.D. 14.3 4.7 22.2 3.6 6.0 1.9 15.1 1.9 58 25 135 28 18.4 7.3 32.2 5.8 38 IS 53 IS 20.1 5.5 43.5 6.6
27

Our results show that there is no need to assume interference due to initial appearance of binocular disparity for tachistoscopically presented test stimuli on the magnitude of the diplopia threshold. This may be concluded from the fact that the diplopia thresholds obtained with a continuously presented test stimulus were not consistently higher than those obtained for a tachistoscopically presented test stimulus.
What is the Diplopia Threshold? Our results strongly suggest that the diplopia thresh
old is, in essence, not the rigid boundary of a dead zone, but a disparity level corresponding to a lenient criterion for singleness which leads to a useful interpretation of the percept of the stimulus without disparity, given the variability of this percept, due to intrinsic noise in the disparity domain.
What is Binocular Fusion? The occurrence of binocular single vision in spite
of disparities is generally ascribed to a process called binocular fusion. Our data confirm the conclusion of Kaufman and Arditi (1976a, 1976b) that the word "fusion" should not be interpreted too literally. It should be seen as the combined occurrence of an accurate combination of monocular localizations resulting in either stereoscopic depth or an intermediate binocular localization (Sheedy & Fry, 1979) and an inaccurate and inconspicuous representation of the part of the disparity information that encodes the appearance of the image, already accurately determined before binocular combination.
REFERENCE NOTE
1. Duwaer, A. L .• & Brink. G. van den. Foveal diplopia thresholds and )J.Xalion disparities. Submitted for publication. 1980.
REFERENCES
ARDITI, A., & KAUFMAN, L. Singleness of vision and the initial appe<:~.rance of binocular disparity. Vision Research, 1978. 18, 117·120.
·CLAHK. B., & STEwART, J.D. Effects of angular acceleration on man: Thresholds for the perception of roration and the oculogyral illusion. Aerospace Medicine, 1969.40,952-956.
CRONE. R. A.. & LEUR!DAN, P.M. A. Tolerance for aniseikonia. I. Diplopia thresholds in the vertical and horizontal meridians of the visual field. II. Determination based on the amplitude of cyclofusion. Albrecht v. Grae/es Archiv fUr Klinisches und Experimentdle Ophthalmolot:k. 1973, 188. 1-22.
DADSON. R. S., & KING. J. H. A determination of the normal threshold of he<:~.ring and its relation to the standardization of the audiometers. Journal of U;ryn?,o!ozy and Otolozy. 1952, 66. 366-378.
DRASOO. N. The neural representation of visual space. Nature, 1977. 266. 554-556.
KAuFMAN, L., & ARDtTI. A. Confusion prevails. Vision Research. 1976.16.551-552. (a)
KAUFMAN, 1., & ARDITI, A. The fusion illusion. Vision Research, 1976.16.535-543. (b)
KERTESZ, A. E. Disparity detection within Panum's fusioru:U area~. Vision Research. 1973. 13. 1537-1543.
28
KERTESZ. A. E .• & SuLLIVAN, M. J. Fusion prevails: A reply to Kaufman andArditi. Vision Research, 1976, 16.545-550.
MITCHELL. D. E. Retinal disparity and diplopia. VJSion Research, 1966,6.441-451.
MrTCHELt... D. E. Propenies of stimuli eliciting vergence eye movements and stereopsis. Vision Research, 1970, 10, 145-162.
OcLE. K. N. Researches in binocular vision. New York: Hafner. 1970.
OcLE. K. N. Optics. Springfield. Ill: Thomas, 1971. PALMER. D. A. Measurement of the horizontal extent of Panum's
area by a method of constant stimuli. Optica Acta, 1961. 8, 151-159.
SHEEDY, J. E .. & FRY, G. A. The perceived direction of the binocula.rimage. Vision Research, 1979, 19.201-2ll.
Woo. G. C. S. The effect of exposure time on the foveal size of Panum'sarea.. Vision Research, 1974.14,473-480.
NOTES
I. In this paper. all retinal disparities and dimensions of perceived images are expressed in degrees of arc or minutes of arc. which, for the sake of simplicity, are denoted by, for example, ··so•• or ''1 ' ... respectively.
2. With the exception of the "'induced effect": In some subject~ and under some stimulus conditions. stereoscopic depth can b<· induced by vertical magnification of one of a pair of monocular images (Ogle. 1964).
3. The line width was measured at a fomtion distance of lO em by determining the separation between two lines giving rise to a just noticeable gap.
4. Analysis of varianec shows that the difference between the geometric means of the singleness limits and the do11bleness thresholds is significant [F(I,4) > 23, p < .011 for all stimulus conditions. The effect of the criterion on the ge<Jmetric means of the signal-to-noise ratios is significant (p < .05) only for "0. 200 msec" [F(I,4)=28. p< .01). for··-. 200msec" [F(I,4)= 16.5. p< .02], and for"- • .4arc min/sec'' [F(l.4) =21.7, p < .0!].
The singleness limits for the test line in combination with the flxation line are significantly lower than those for the test line in combination with the iL'I:ation circles [F(1,4) > 20, p < .01]. The singleness limits expressed in standard-deviation units are lower for the test line in combination with the fixation line when the former is presented tachistoscopically [F(1.4) > 7.4, p < .OS].
The doubleness thresholds for the tachistoscopically presented test line in combination with the fixation line are lower than those of the tachistoscopically presented test line in combination with the fixation circles [F(1,4) > IS. p < .02]. The f~:<ation marker does not have a significant effect on the doubleness thresholds expressed in standard-deviation units [F(I ,4) < 5.5, p > .06].
The only significant effect of the presentation time on the size of the disparity thresholds oceurs for the singleness limits in combination with the fixation circle [F(l,4) =25, p < .01]. The pre-.entation time influences the magnitude of the singleness limits expressed in standard-deviation units for both f~:<ation stimuli [F(l.4) > 12. p < .02] and the magnitude of the doubleness thresholds expressed in standard-deviation units when the fixation line is used [F(l,4)-= 14, p < .02).
S. Analysis of variance of the effect of the criterion and stimulus conditions on geometric means shows that differences between subjects are not a significant source of variance [F(l,4) < 7.7. p >.OS] for the thresholds expressed in standard-deviation units, whereas these differences were significant [F(l,4) > II, p < .02] for the absolute values of the thresholds.
6. This agrees with results obtained by Palmer (1961). He found that the frequency of seeing a single image does not always reach the value 1.0 for a stimulus without disparity in the visual periphery, which implies that even this stimulus must have been seen as double in part of the presentations.
7. These cyclophoriaS were discovered only after the investigation had been under way for some time. Their value was estimated

with the aid of a pair of dichoptic horizontal lines, seen in diplopia.
8. See Appendix. 9. It is our finding that relative depth is not always seen under
all stimulus conditions. If it is not seen. the percept at intermediate horizontal disparities is remarkably similar to that at intermediate vertical disparities.
10. When Subject A.L.D. looked at the upper part of a vertical focation line that was 30' long and positioned 3' below a 30'-long vertical test line with horizontal disparity, the doubleness threshold even fell to 2.2' :t .8' when the test line was presented tachistO~copical!y with a presentation time of 200 mscc.
1 I. An imponant example of a dichoptic stimulus with highly noticeable monocular displacement is a stimulus with cyclodisparity, ~ince the thresholds for the perception of tilt in monocular lines with cyelorotation are low compared with the corresponding diplopia thresholds (see. e.g, Kaufman&Arditi. 1976b).
APPENDIX
Threshold Considerations
Different assumptions may be made concerning the processes underlying the diplopia threshold. The consequences of the various assumptions will be discussed.
1. If the disparity thresholds are "real" thresholds. that is, if they correspond to the boundary of a dead zone, which is wide in comparison with the intrinsic noise in the disparity domain, then the following relation exists between the detection threshold (obtained in a discrimination task). the singleness limit. and the doubleness threshold (both obtained in a three-alternative classification task):
Detection threshold= singleness limit
co: doubleness threshold.
This can be understood when it is remembered that all three thresholds here refer to the disparity that gives 500Jo frequency of seeing the disparity in the stimulus.
2. If. on the other hand, the disparity thresholds are not .. real" thresholds but are determined with reference to criteria chosen from a continuous scale of possible criteria extending to zero disparity in a disparity domain with constant additive intrinsic noise, then the detection threshold will be determined by signal-detection considerations.
If no loss of disparity information may be expected during signal detection. the following is obtained:
Detection threshold""' .955 x standard deviation of singleness limit
-== .955 x standard deviation of doubleness threshold.
Signal detection with loss of information about the sign of the disparity would result in:
Detection threshold= 1.49 X standard deviation of singleness limit
= 1.49 x standard deviation of doubleness threshold.
These relations may be derived as follows: In the two· alternative forced-choice procedure, the subject is comparing the percepts of two stimuli presented in succession in order to determine which percept embodies a disparity. In the three-alternative classification, the subject is assessing the percept of each stimulus presented with reference to two criteria. that is. two disparity levels.
(a) Assume that the internal representation of the disparity in the test stimulus is increased with a sample of a normalized Gaussian distribution so that the density function of a large number of internal representations of the same stimulus disparity is:
l t-(d-d)j p(d)o::: _,.....exP~. odv 2n: '"'d
where d =disparitY, 6 =disparity in the test stimulus, and ad-== standard deviation of the additive Gaussian noise.
{b) Assume that the internal representations of stimuli presented in succession are mutually independent.
Under these assumptions, the statistics of the decisions in the three-alternative classification procedure are governed by the distribution p(d). This implies that the standard deviation of the disparity thresholds obtained with this procedure is equal to ad.
The frequency of correct discrimination, Pc{6). in the two..alternative forced-choice situation when there is no loss of disparity information. is given by:
where Psn ==the probability that the in~ernal representation of the stimulus with disparity is located at disparity x,
and Pn(d < x) =the probability that the internal representation of the stimulus without disparity is located at a disparity that is smaller than x,
The frequency of correct detection will be 500Jo for Pc(6') = .75. which corresponds to 6' = .955a1. •
The frequency of correct discrimination, PC(d). in the two-alternative forced-choice procedure when information about the sign of the disparity is lost is given by:
= J; HPsn<d = +x) + Psn(d = -x))P n< -x < d < +x)}a x.
where PsnCd = ±x) =the probability that the internal representation of the stimulus with disparity is located at disparity ±x.
29

Psn(d'= ±x) ""-- exp 2
1 t-(+x-6)'] odvrzn 2od
and Pn(-x<d<+x)=the probability that the internal representation of the stimulus without disparity is located between the disparities -xand +x,
L+x 1 ~-d'] P0 (-x<d<+x)= _ --exp 20:?" act. x odv"'2n d
The frequency of correct detection will be 50% for PC(O") = .15, which corresponds to d~ = 1.49oct.
(Received for publication June, 30, 1980; accepted revision received January 12, 1981.)
30

3!
2.2 THE EFFECT OF PRESENTATION TIME ON DETECTION AND DIPLOPIA
THRESHOLDS FOR VERTICAL DISPARITIES
* A.L. Duwaer and G. van den Brink
ABSTRACT
Detection and diplopia thresholds for vertical disparities are
found to decrease when the presentation time of the stimulus with disparity is increased betweer- 20 msec and 2 sec. This result supports the following notions previously put forward in
literature: a) the human visual system embodies detection pro
cesses which reveal vertical disparities; there is no sensory
fusion mechanism in this system that gradually conceals verti
cal disparities; b) the detection of vertical disparity in ta
chistoscopically presented stimuli is not based upon the ini
tial appearance of the stLmulus with disparity.
INTRODUCTION
There is disagreement in the literature about the nature of the processes un-
derlying singleness of binocular vision in spite of retinal disparities. Some
investigators ascribe its occurrence to an active fusion mechanism that P-limi-
nates disparities (Kertesz and Sullivan, 1976) _ Others claim that it simply re-
fleets a failure to detect the disruption of singleness caused by disparities.
The latter hypothesis is based on the findings that singleness of binocular vi-
sion is just due to use of a lenient criterion amidst the many possible crite-
ria which could be used to judge the disparity information - and that this par-
ticular type of disparity information is inaccurately and inconspicuously coded
by the relevant parts of the human visual system (Kaufman and Arditi, 1976a,
*Department of Biological and Medical Physics, Erasmus University Rotterdam,
P.O. Box 1738, 3000 DR Rotterdam, The Netherlands
32

1976b; Arditi and Kaufman, 1978; Duwaer and Van den Brink, 1981a).
An important stimulus parameter which has not yet been dealt with in this
discussion is the effect of the presentation time of the stimulus with dispa-
rity.
This presentation time can be used as a tool to discriminate between the
two above-mentioned hypotheses. If an elimination mechanism such as fusion is
involved, the dynamics of the perceptual system should give better elimination
the longer the disparity is presented. Hence, the various thresholds for the
detection or recognition of disparities should rise with increasing presenta-
tion time1
) On the other hand, if binocular singleness is simply due to a de-
tection failure, the detection and recognition of disparities should improve
the longer the disparity is present. This would imply that the disparity thres-
holds should fall with increasing presentation time.
Experiments with a variable presentation time may also help to resolve the
disagreement between Kertesz and Sullivan (1976) on the one hand and Kaufman
and Arditi (1976a, 1976b) and Arditi and Kaufman (1978) on the other, about
the influence of the initial appearance of a binocular disparity in tachistos-
copic presentation on the detectability of the disparity. If the presentation
time is short, only the initial appearance will be perceived. If the detecta-
bility of the disparity at short presentation times - which must be based on
the initial ~ppearance - is lower than that at long presentation times, the
latter must be based not upon the initial appearance, but upon final appea-
ranees.
So far, the effect of presentation time has only been determined for hori-
zontal disparities in three studies (Palmer, 1961; Mitchell, 1966; Woo, 1974)
which produced inconsistent results, and for detection thresholds for relati-
ve horizontal disparities when depth cues were found to determine the detec-
tion (Ogle and Weil, 1958; Shortess and Krauskopf, 1961) _
The discussion about the mechanism underlying binocular single vision was,
however, based upon data collected with vertical disparities, where stereos-
copic depth effects that interfere with interpretation of the percepts and the
results can be avoided.
The purposes of the present study were:
33

-to provide data on the effect of presentation time on the detection and diplo-
pia thresholds for vertical disparities;
-to use these data to throw light on the mechanism underlying binocular single
vision and the role of the initial appear.ance of binocular disparity.
METHODS
The effect of presentation time on the detection and diplopia thresholds was studied in a highly practised subject (ALD, one of the authors 2)) for the sti
mulus with aniseikonic vertical disparity shown in Fig. 1. This stimulus was chosen because it did not provide the subject with depth cues and because it does not cause vergence eye-movements in response to the disparity between the lines {Duwaer and Van den Brink, 1981c). Thanks to the absence of vergence eyemovements, presentation times longer than 0.2 sec {the reaction time of vergence eye-movements; Westheimer and Mitchell, 1956) can be used.
This line stimulus was presented in an electronic stereoscope consisting of two (HP 1321A) XYZ displays (white P31 phosphor) mounted 105 em from the
subject's eyes with a white background {mean luminance level 3 cd/m2, sides 15°) 3). The line width of the stimuli amounted to 0.35 mm or 1.2'. The luminance of the stimuli was adjusted to 1.8 log units above the (contrast) perception threshold at long observation times, unless mention is specifically made to the contrary. The subject's head was immobilized with a bite-board.
;--------~ disporiry
' .......•.. ==t::::,::
' ' L:
::.t::::::;
10° of ore fixcrtion c:ross
L=l0 or8°oforc:
Fig. 1- Schematic representation of the stimuli presented to the left and right eyes. A disparity of opposite sign is obtained when the displacements of the lines are such that the separation between the upper and lower line is larger (instead of
smaller) in the right eye than in the left eye.
~he stimulus (see Fig. 1) consisted of a continuously visible Cross fixated at the centre, together with a pair of horizontal lines presented either tachistoscopically with a constant disparity and presentation times of 20, 60, 160, 560 or 2000 msec, or continuously while the disparity slowly increased or
34
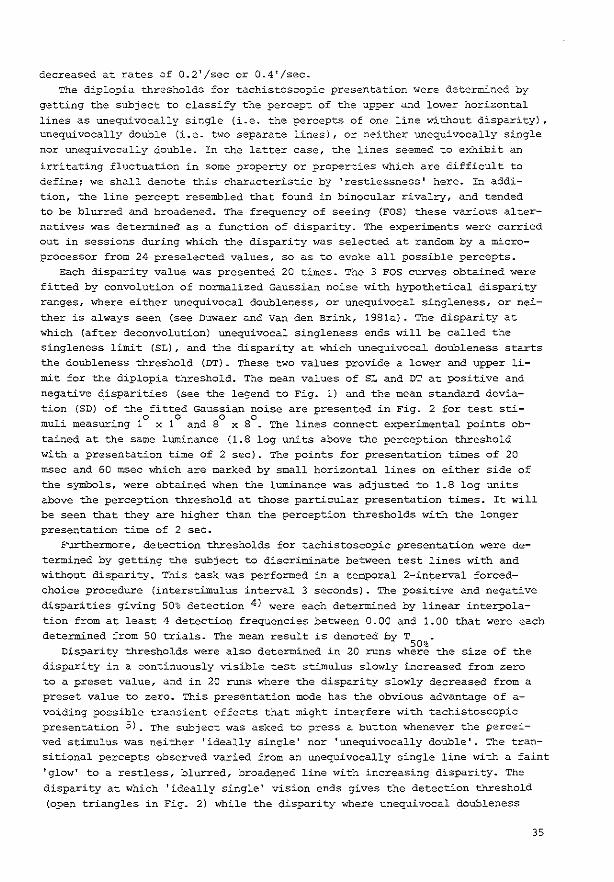
decreased at rates of 0.2'/sec or 0.4'/sec. The diplopia thresholds for tachistoscopic presentation were determined by
getting the subject to classify the percept of the upper and lower horizontal lines as unequivocally single (i.e. the percepts of one line without disparity), unequivocally double (i.e. two separate lines), or neither unequivocally single
nor unequivocally double. In the latter case, the lines seemed to exhibit an
irritating fluctuation in some property or properties which are difficult to define; we shall denote this characteristic by 'restlessness' here. In addition, the line percept resembled that found in binocular rivalry, and tended to be blurred and broadened. The frequency of seeing (FOS) these various alternatives was determined as a function of disparity. The experiments were carried out in sessions during which the disparity was selected at random by a ~eraprocessor from 24 preselected values, so as to evoke all possible percepts.
Each disparity value was presented 20 times. The 3 FOS curves obtained were fitted by convolution of normalized Gaussian noise with hypothetical disparity ranges, where either unequivocal doubleness, or unequivocal singleness, or neither is always seen (see Duwaer and Van den Brink, 1981a). The disparity at which (after deconvolution) unequivocal singleness ends will be called the singleness limit (SL), and the disparity at which unequivocal doubleness starts the doubleness threshold (DT). These two values provide a lower and upper limit for the diplopia threshold. The mean values of SL and DT at positive and negative disparities (see the legend to Fig. 1) and the mean standard deviation (SD) of the fitted Gaussian noise are presented in Fig. 2 for test sti-
o 0 0 0 muli measuring 1 x 1 and 8 x 8 . The lines connect experimental points ob-tained at the same luminance (1.8 log units above the perception threshold with a presentation time of 2 sec). The points for presentation times of 20 msec and 60 msec which are marked by small horizontal lines on either side of the symbols, were obtained when the luminance was adjusted to 1.8 log units above the perception threshold at those particular presentation times. It will be seen that they are higher than the perception thresholds with the longer presentation time of 2 sec.
Furthermore, detection thresholds for tachistoscopic presentation were determined by getting the subject to discriminate between test lines with and without disparity. This task was performed in a temporal 2-interval forcedchoice procedure (interstimulus interval 3 seconds). The positive and negative disparities giving 50% detection 4) were each determined by linear interpolation from at least 4 detection frequencies between 0.00 and 1.00 that were each determined from 50 tr~als. The mean result ~s denoted by T
50% Disparity thresholds were also determined in 20 runs where the size of the
disparity in a continuously visible test stimulus slowly increased from zero to a preset value, and in 20 runs where the disparity slowly decreased from a preset value to zero. This presentation mode has the obvious advantage of avoiding possible transient effects that might interfere with tachistoscopic presentation 5). The subject was asked to press a button whenever the perceived stimulus was neither 'ideally single' nor 'unequivocally double'. The transitional percepts observed varied from an unequivocally single line with a faint
'glow' to a restless, blurred, broadened line with increasing disparity. The disparity at which 'ideally single' vision ends gives the detection threshold (open triangles in Fig. 2) while the disparity where unequivocal doubleness
35

starrs gives the doubleness threshold (DT).
20 4() 100 200 400 1000 2000
1
24 ~ 24
• 20
-~--~ 8° X 8°
20
v ~ 16 • I 16 «
·------0 •· • ~
5 12 o, - 12 -z --
" --o,
;; -o- -o-', -' ~
8 ~ ' .... 0 __ SL 8
"' ----=::;- ----- o--------o ~
c.... ~... Tso<?o 0 4 4 4
"' -c--- ·--- 4 --:s::.-----0------- c--------a !,! so " > 0 0
20 4() 100 200 400 1000 2000 0.4' of or~ 1
PRESENTATION DURATION IN MSEC ,.,
20 40 100 200 400 1000 2000
1
12 ~ 12
10 • 1° X 1° 10
~--v ~
8 8 « -o- ·~ 0
~
DT 5 6 • ·------ • I 6 z o, • I • " -;; -~ -o-
' ~ 4 -- 4
"' -·- --~ -t~. 'o ___ SL
0
-·-------0~ ----o--------o
"' 2 2
!,! -o---- • rso% 4
4
~ --c-------~--------& ~
t > so 0 0
20 4() 100 200 400 1000 2000 0.2'
PRESENTATION DURATION IN MSEC of or~1 ,.,
36

Fig. 2. Doubleness thresholds (DT: solid circles), singleness
limits (SL: open circles), detection thresholds (Tso~: solid triangles; for continuously visible test lines: open triangles) and mean standard deviation of DT and SL (SD: open squares), as functions of the presentation time. The lines connect experimental points obtained at the same luminance {1.8 log units above the perception threshold at a presentation time of 2 sec) . The data obtained after correction for the decrease of brightness found at presentation times of 20 msec and 60 msec are indicated by symbols with small horizontal lines on either side. The data obtained with slowly changing disparities in continuously visible test lines are plotted on the right-hand side of each graph. The standard errors of SL and DT are a factor 5 smaller than the specified standard deviation (SD). The standard errors of the detection thresholds are a factor
holds. Fig. 2 shows data obtained 0
(L=S , see Fig. 1) and data for a
10 smaller than the 0 0
thres-with
0 a 8 x 8 test stimulus
1 X 1 0 0
test stLmulus {L=l ) •
RESULTS
The major findings are:
-the two diplopia thresholds (DT and SL), their mean standard deviation {SD)
and the detection thresholds (T ) fall with increasing presentation time espe-50%
cially up to about 0.2 sec. This effect can only partially be ascribed to
changing brightness due to the finite integration time of luminance processing,
because the drop also occurs when the luminance of the test lines is increased
at the short presentation times in order to correct for this brightness effect
(data obtained with this correction are denoted by symbols with small horizon-
tal lines on either side).
-the thresholds for tachistoscopic presentation with long presentation tLmes
hardly differ from those obtained with continuously visible test lines where the
disparity slowly increases or decreases6). This demonstrates that there are no
interfering transients in tachistoscopic presentation.
A third finding can be deduced from a detailed comparison of the detection
threshold (T ) and the standard deviation {SD). 50%
It has been shown in previous studies (Duwaer and Van den Brink., 1981a,
1981c), that the quotient {T /SD) can be used to evaluate whether the detec-50%
tion threshold (T ) obtained in a 2-alternative forced-choice procedure can 50%
be accounted for by pure signal detection without loss of disparity informa-
37

--MEASURED DETECTION THRESHOLDS
------ PREDICTION WITH LOSS OF SIGN INFOR!v\ATJON
----PREDICTION WITHOUT LOSS OF lNFOR/11\ATION
8 8 ---·········- .. ~. 8°x8°
__________________ :~ 4 4
0 0 20 40 100 200 400 1000 2000
4 4
2 2
0 0 20 40 100 200 400 1000 2000
PRESENTATION DURATION IN MSEC-----
Fig. 3. Comparison of the measured detection thresholds and the predicted values when there is loss of information about the
sign of disparities (Tso%, predicted = 1.49 SD) and when there is no loss of disparity information (Tso%, predicted= 0.955 SD) . !!Jr-asured points at 20 msec and 60 msec presentation times
represent the means of the data for the two luminance levels.
tion. In the case of signal detection without loss of disparity information
- which implies that detection failures are only ascribed to the occurrence of
noise (see also Fig. 4) - the detection threshold (T ) should be equal to 50%
0.955 times the standard deviation (SD). Comparison of this prediction with the
measured detection thresholds (see Fig. 3) shows that this hypothesis must be
rejected. The measured detection thresholds are systematically larger than the
predicted values, which implies there is loss of disparity information.
One evident cause of such loss of disparity information is that disparities
of ~pposite sign (see legend to Fig. 1) result in the same percepts, i.e. blur-
red, broadened, restless and/or doubled lines. This loss of information about
the sign of disparities increases the predicted detection threshold to 1.49 ti-
roes the standard deviation (see Fig. 4) • Comparison of this prediction with the
measured detection thresholds (see Fig. 3) suggc~ts that a major part of the
38
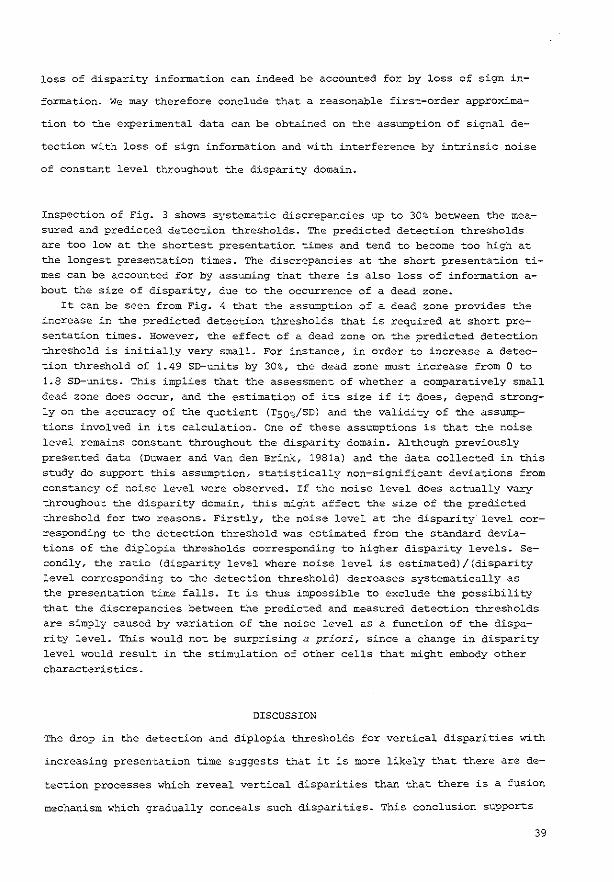
loss of disparity information can indeed be accounted for by loss of sign in-
formation. We may therefore conclude that a reasonable first-order approxima-
tion to the experimental data can be obtained on the assumption of signal de-
tection with loss of sign information and with interference by intrinsic noise
of constant level throughout the disparity domain.
Inspection of Fig. 3 shows systematic discrepancies up to 30% between the measured and predicted detection thresholds. The predicted detection thresholds are too low at the shortest presentation times and tend to become too high at the longest presentation times. The discrepancies at the short presentation times can be accounted for by assuming that there is also loss of information about the size of disparity, due to the occurrence of a dead zone.
It can be seen from Fig. 4 that the assumption of a dead zone provides the increase in the predicted detection thresholds that is required at short presentation times. However, the effect of a dead zone on the predicted detection threshold is initially very small. For instance, in order to increase a detection threshold of 1.49 SD-units by 30%, the dead zone must increase from 0 to 1.8 SD-units. This implies that the assessment of whether a comparatively small dead zone does occur, and the estimation of its size if it does, depend strong
ly on the accuracy of the quotient (TSQ%/SD) and the validity of the assumptions involved in its calculation. One of these assumptions is that the noise level remains constant throughout the disparity domain. Although previously presented data (Duwaer and Van den Brink, 1981a) and the data collected in this study do support this assumption, statistically non-significant deviations from constancy of noise level were observed. If the noise level does actually vary throughout the disparity domain, this might affect the size of the predicted threshold for two reasons. Firstly, the noise level at the disparity level corresponding to the detection threshold was estimated from the standard deviations of the diplopia thresholds corresponding to higher disparity levels. Secondly, the ratio (disparity level where noise level is estimated)/(disparity level corresponding to the detection threshold) decreases systematically as the presentation time falls. It is thus impossible to exclude the possibility that the discrepancies between the predicted and measured detection thresholds are simply caused by variation of the noise level as a function of the disparity level. This would not be surprising a priori, since a change in disparity level would result in the stimulation of other cells that might embody other characteristics.
DISCUSSION
The drop in the detection and diplopia thresholds for vertical disparities with
increasing presentation time suggests that it is more likely that there are de-
tection processes which reveal vertical disparities than that there is a fusion
mechanism which gradually conceals such disparities. This conclusion supports
39
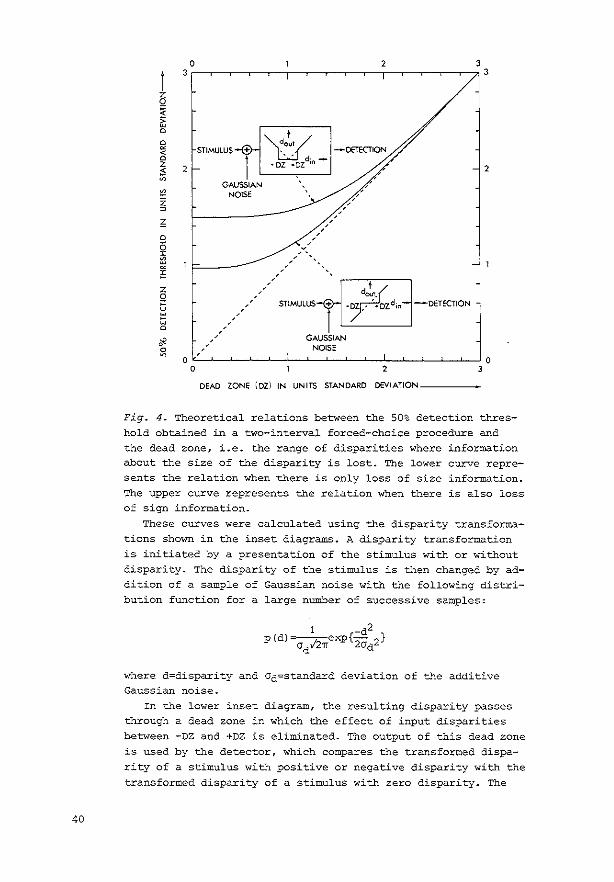
40
0 2 3
1 3 3
z Q ~ ~ 0 I 0 ~ ~ STIMULUS + -DETECTKlN < 0
1 d -z 2 -DZ •DZ '0
2 ~ ~
' ' GAUSSIAN '
" NOISE ' ' z ' ' ~ ' ' ' ~ ' ' '
0 ' '
~ '
' " ' ::! ' ' ' ;!: ' ' '
' ' ifm z ' 0 ' . " ' ' STIMULUS + - zd;n- --DETECTION
~ ' ' ' ' 0 ' '
ifl ' ' GAUSSIAN 0 ' ' NOISE ~ ' 0 0
0 2 3
DEAD ZONE (DZ) IN UNITS STANDARD DEVIATION
Fig. 4. Theoretical relations between the 50% detection threshold obtained in a two-interval forced-choice procedure and the dead zone, i.e. the range of disparities where information about the size of the disparity is lost. The lower curve represents the relation when there is only loss of size information. The upper curve represents the relation when there is also loss of sign information.
These curves were calculated using the disparity transformations shown in the inset diagrams. A disparity transformation is initiated by a presentation of the stimulus with or without disparity. The disparity of the stimulus is then changed by addition of a sample of Gaussian noise with the following distribution function for a large number of successive samples:
where d=disparity and Od=standard deviation of ~~e additive Gaussian noise.
In the lower inset diagram, the resulting disparity passes through a dead zone in which the effect of input disparities between -DZ and +DZ is eliminated. The output of this dead zone
is used by the detector, which compares the transformed disparity of a stimulus with positive or negative disparity with the transformed disparity of a stimulus with zero disparity. The
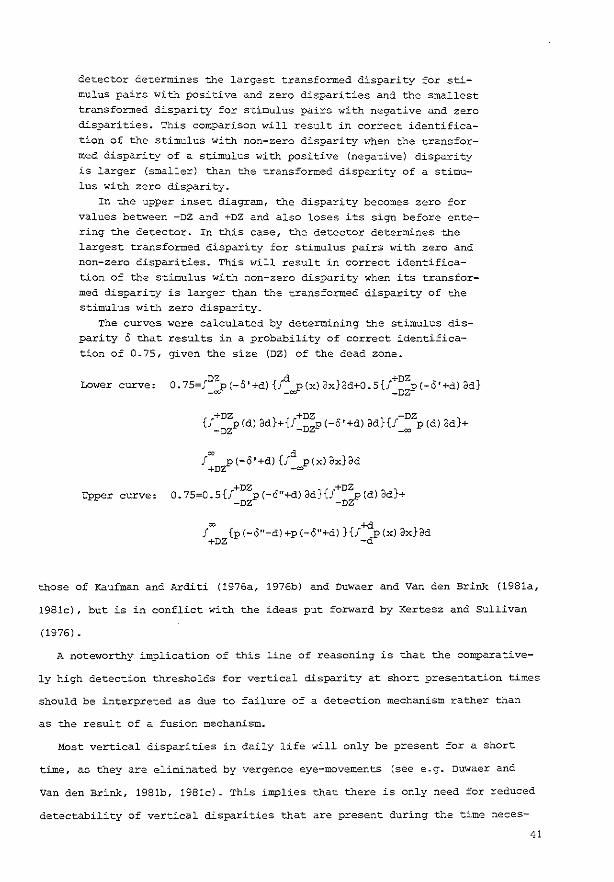
detector determines the largest transformed disparity for stimulus pairs with positive and zero disparities and the smallest transformed disparity for stimulus pairs with negative and zero disparities. This comparison will result in correct identification of the stimulus with non-zero disparity when the transformed disparity of a stimulus with positive (negative) disparity is larger (smaller) than the transformed disparity of a stimulus with zero disparity.
In the upper inset diagram, the disparity becomes zero for values between -DZ and +DZ and also loses its sign before entering the detector. In this case, the detector determines the largest transformed disparity for stimulus pairs with zero and non-zero disparities. This will result in correct identification of the stimulus with non-zero disparity when its transformed disparity is larger than the transformed disparity of the stimulus with zero disparity.
The curves were calculated by determining the stimulus disparity 0 that results in a probability of correct identification of 0.75, given the size (DZ) of the dead zone.
Lower curve: ,.DZ d +DZ 0.75=, p(-o'+dl{f p(x)3x}3d+0.5{! p(-o'+dl3d}
-oo -oo -DZ
+DZ +DZ -DZ {f_
02p(d)3d}+{J_02p(-o'+d)3d}{f_
00 p(d)3d}+
00 d J p(-o'+d){J p(x)3x}3d
+Dz- -oo
Upper curve: +DZ +DZ o. 75=o.5U pt-o"+dl 3d}U Pldl 3d}+ -DZ -Dz-
00 +d J {p(-o"-dl+p(-o"+dl ){! p(xl 3x}3d
+DZ -d
those of Kaufman and Arditi (1976a, 1976b) and Duwaer and Van den Brink (1981a,
1981c), but is in conflict with the ideas put forward by Kertesz and Sullivan
(1976).
A noteworthy implication of this line of reasoning is that the comparative-
ly high detection thresholds for vertical disparity at short presentation times
should be interpreted as due to failure of a detection mechanism rather than
as the result of a fusion mechanism.
Most vertical disparities in daily life will only be present for a short
time, a~ they are eliminated by vergence eye-movements (see e.g. Duwaer and
van den Brink, 1981b, 1981c). This implies that there is only need for reduced
detectability of vertical disparities that are present during the time neces-
41
sary to complete motoric elimination by vergence eye-movements. The observed
reduction in detectability at short presentation times is thus quite a func-
tional arrangement!
It further follows from our study that the detection of vertical disparity
in tachistoscopic presentations is based upon final appearances of the stimu-
lus with disparity and not upon its initial appearance. This may be concluded
from the finding that the detectability of the disparity in the initial per-
cept is worse than in final percepts, as evidenced by the lower detection
thresholds at long presentation times, both with the initial percept (tachis-
toscopic presentation) and without it (continuous presentation). This conclu-
sian, again, supports those of Kaufman and Arditi (1976b), Arditi and Kaufman
(1978), and Duwaer and Van den Brink (1981a, 1981c) and is in conflict with
those of Kertesz and Sullivan (1976).
A drop in the detection threshold with increasing presentation time has
been observed not only for vertical disparity. A similar result has e.g. also
been obtained for relative horizontal disparity when depth cues determine the
detection (Ogle and Weil, 1958; Shortess and Krauskopf, 1961). This implies
that there is no active fusion mechanism which gradually conceals relative ho-
rizontal disparities either. Relative horizontal disparities are thus also mo-
re likely to be revealed by detection processes. A revealed relative horizon-
tal disparity may, however, tend to conceal the doubling of the binocular ima-
ge induced by the disparity as such, because a revealed relative horizontal
disparity is interpreted as being caused by relative depth that presupposes
one single binocular image. This suggests that the apparent gradual disappea-
ranee of diplopia induced by horizontal disparity as such which may be obser-
ved in complex scenes should be ascribed to detection processes that need ti
me to reveal relative horizontal disparities?)
The effect of presentation time on the detection threshold for relative ho-
rizontal disparity and relative displacement in a vernier paradigm cannot be
attributed to detection processes that use the extra information in the spa-
tial domain coming from retinal image displacements due to involuntary eye-
movements during presentation of the stimulus (Shortess and Krauskopf, 1961;
Keesey, 1960). Variation in the retinal image displacement due to involuntary
42

eye movements is thus unlikely to be the cause of the effect of presentation
time on the detection thresholds for vertical disparity.
The overall result of the extra information provided by longer observation
times is likely to be an increase of the signal-to-noise ratio of the internal
representation of the spatial parameter. At the present state of our knowledge
of the neural mechanisms involved, we can only speculate about the way in which
this is accomplished.
ACKNOWLEDGEMENTS
This research was supported by a grant from the Netherlands Organization for the Advancement of Pure Research (Z.W.O.). We would also like to thank Mrs. A. E.H. Peters and Dr. C.M.M. de Weert for helpful discussions and Mr. C.J. Keemink and Mr. J.B.P. van Deursen for their technical assistance.
REFERENCES
Arditi A. and Kaufman L. (1978) Singleness of vision and the initial appearance of binocular disparity. Vision Research 18, 117-120.
Duwaer A.L. and Brink G. van den (1981a) What is the diplopia threshold? Percep
tion & Psychophysics 29, 295-309. Duwaer A.L. and Brink G. van den (1981b) Foveal diplopia thresholds and fixation
disparities. Perception & Psychophysics, in press. nuwaer A.L. and Brink G. van den (1981c) Diplopia thresholds and the initia
tion of vergence eye-movements. Vision Research, in press. Kaufman L. and Arditi A. (1976a) The fusion illusion. vision Research 16, 535-
543. Kaufman L. and Arditi A. (1976b) Confusion prevails. Vision Research 16, 551-
552. Keesey U.T. (1960) Effects of involuntary eye-movements on visual acuity. J.D.
S.A. 50, 769-774. Kertesz A.E. and Sullivan M.J. (1976) Fusion prevails: a reply to Kaufman and
Arditi. Vision Research 16, 545-550. Mitchell D.E. (1966) Retinal disparity and diplopia. Vision Research 6, 441-
451.
Ogle K.N. and Weil M.P. (1958) stereoscopic vision and the duration of the stimulus. Archs. Ophthal. 59, 4-17.
Palmer D.A. (1961) Measurement of the horizontal extent of Panum's area by a method of constant stimuli. Optica Acta 8, 151-159.
Shortess G.K. and Krauskopf J. (1961) Role of involuntary eye-movements in stereoscopic acuity. J.O.S.A. 51, 555-559.
westheimer G. and Mitchell A.M. (1956) Eye-movement respor.ses to convergence stimuli. Archs. Ophtha1. 55, 848-856.
woo G.c.s. (1974) The effect of exposure time on the foveal size of Panum's area. vision Research 14, 473-480.
43

NOTES
1. A necessary condition for a rise in the thresholds with increasing pre
sentation durations is that the detection or recognition should be based upon
the final appearances of the image with disparity and not upon transient ini
tial appearances.
2. A serious drawback of the use of dichoptic stimuli with vertical dispari
ties is that the subject has to be highly practised in order to be reasonably
sure of stable sensory performance, since the thresholds fall with increasing
practice, even when the test subject has already had a_substantial amount of
practice (Duwaer and Van den Brink, 1981a; Arditi and Kaufman, 1978).
Subject ALD has normal acuity, stereopsis and binocular single vision.
3. In this paper, all angular measures will be expressed simply in degrees
( 0 ) or minutes (') without the qualification 'of arc' each time.
4. The percentage detection is calculated from the percentage identification
by correction for the a-priori detection probability according to the expres
sion:
~ detection = 2 x (~ identification - 50) •
5. Transient appearances in the disparity domain are more reliably avoided
by slowly increasing and decreasing the disparity in continuously visible sti
muli than by gradual appearance and disappearance of the stimuli with dispari
ty, by luminance variation. The latter method was used by Arditi and Kaufman
(1978) in their study of the possible interference of the initial appearance
of binocular disparity on the detection of tachistoscopically presented dispa
rities.
6. During the determination of detection thresholds with continuously visi
ble test lines in which the disparity slowly increased, the subject was asked
to indicate at which disparity the percept started to deviate from the percept
of the stimulus without disparity which he had just seen. This is comparable
to the conditions under which detection thresholds for tachistoscopically pre
sented test stimuli were determined. On the other hand, if the disparity falls
during the experimental run, the reference percept of the stimulus without dis
parity is only available in the form of a memorized internal representation.
This implies that the detection thresholds for tachistoscopic presentation
should be compared with those for continuously visible lines in which the dis
parity is slowly increased.
It should be noted that such a restriction is not necessary for the double
ness thresholds, because these thresholds are determined by classification u
sing an internal representation of doubleness, irrespective of the mode of
presentation.
7. The major cause of the disappearance of diplopia induced by horizontal
disparities around the fixation point is elimination of these disparities by
vergence eye-movements.
44

45
2.3 DETECTION OF VERTICAL DISPARITIES
* A.L. Duwaer and G. van den Brink
ABSTRACT
Psychometric curves determined for the detection of differences between vertical disparities as a function of the reference disparity for three presentation times (20 msec, 160 msec and 2 sec) and for two eccentricities of the stimulus (0.5° and 4°) are presented.
The results show that the detectability of disparity differences first increases and then decreases when the reference disparity is increased from zero. It further appears that the only effect of the stimulus presentation time and eccentricity on the psychometric curves and their dependency on the reference disparity is that the effective disparities observed are multiplied by a constant factor.
The experimental data can be described by a signal detection model with two special features around zero disparity where binocular single vision occurs, viz. loss of information about
the sign of disparity and presence of intrinsic noise at a level up to 25% higher than the minimum level found at intermediate disparities.
INTRODUCTION
The phenomenon of binocular single vision despite retinal disparities has long
been ascribed to the existence of a sensory dead zone for disparities (known
as Panum's area) in which information about the size of disparity is elimina-
ted by a fusional mechanism. Recent researches have, however, provided strong
indic~tions against this traditional view; they suggest that singleness of bi-
nocular vision is simply the result of use of a lenient criterion chosen from
* Department of Biological and Medical Physics, Erasmus University Rotterdam, P.O. Box 1738, 3000 DR Rotterdam, The Netherlands
46

among many possible criteria for judging the rather inaccurate, not very repro
ducible information about singleness of doubleness provided by retinal dispari
ty. Observers tend to use a lenient criterion for singleness because the chan
ges in the singleness of the binocular percepts introduced by the disparity
are processed by the visual apparatus in such a way that the overall visual im
pression received by the subject is relatively inconspicuous and vague: a sepa
ration equal to the disparity can be observed much more clearly when the same
monocular stimuli are presented to a single eye.
The idea that singleness of binocular vision is brought about by the use of
lenient criteria and not by sensory dead zones for disparities is based on the
observation that observers can judge disparity information about singleness or
doubleness consistently and about as accurately using sharper criteria at lo
wer disparities (Duwaer and Van den Brink, 1981a) , and - even in the absence
of stereoscopic depth cues - can reliably detect disparities much smaller than
the 'diplopia threshold' i.e. the disparity at which binocular single vision
ends and diplopia emerges (Kaufman and Arditi, 1976a, 1976b; Duwaer and Van
den Brink, 1981a, 1981b, 1981c). It should however be borne in mind that obser
vers do have to be specially instructed or biased to use these sharper single
ness criteria at lower disparities, e.g. by getting them to discriminate be
tween zero and nonzero disparities.
The idea that there may be no sensory fusion mechanism eliminating retinal
disparities, as postulated in traditional theories, is based not only on the
apparent absence of sensory dead zones for disparities but also on the results
of an analysis of the effect of the presentation time of a disparity on its de
tection and recognition on the basis of deteriorated singleness. If a fusion
mechanism were involved, the detection and recognition of the disparity should
get worse at longer presentation times because the dynamics of this mechanism
would be expected to give better elimination the longer the disparity is pre
sented. The detection and recognition was, however, found to improve with in
creasing presentation time. This suggests that it is much more likely that de
tection and recognition of retinal disparity is hampered by some kind of fai
lure of a 'signal-detection' process (disparity being the signal) aimed at re
vealing the disparity of which the performance improves the longer the dispa-
47

1 I rity is presented (Duwaer and Van den Brink, 1981c) .
These recent researches thus suggest that the fusional mechanism postulated
in traditional theories should be replaced by some kind of signal-detection
process of limited detection performance. This limited performance seems to be
primarily due to the tendency of observers to use lenient assessment criteria,
to the presence of a certain amount of intrinsic noise throughout the dispari-
ty domain (reflecting the limited accuracy and reproducibility with which dis-
parity information is coded), and to loss of information about the sign of the
disparity (reflecting the fact that disparities of opposite sign produce the
same separations between the monocular images; see e.g. Fig. 1; Duwaer and Van
den Brink, 1981a, 1981c). It should be noted that these results suggest that
the only phenomenon encountered around zero disparity (where binocular single-
ness occurs) which is not found at higher disparities (where diplopia occurs)
is the (in itself trivial) loss of sign information.
We designed an experiment which can throw new light on this issue of the
kind of binocular process operating around zero disparity, by determining the
detectability of disparity differences - i.e. the acuity with which a stimulus
of given disparity can be discriminated from a stimulus with reference dispa-
rity - as a function of the reference disparity. Zero reference disparity
(turning the experiments into common ones on the detectability of disparities)
is then considered to be just one of the many possible values. The underlying
idea is as follows: Discrimination between low disparities and zero disparity
is an instance of the more general task of discriminating between two dispari-
ties of any value. If there is a special kind of binocular process operating
around zero disparity, then discrimination between a low disparity and zero
disparity (which will be both affected by this process) ought to differ in so-
me way from discrimination between two higher disparities (which will not be
affected by this process).
As a baseline for the evaluation of the data, the two major predictions
concerning the detectability of disparity differences will be derived in the
next section using some straightforward signal-detection considerations. The
first prediction is that the detectability of disparity differences with zero
reference disparity should be worse than the detectability of disparity diffe-
48
rences with comparatively large reference disparities, but only by the small
factor 1.56 when the detectabilities are characterized as the disparity diffe-
rences that yield detection rates of SO~. The second major predection arising
from the signal-detection considerations is that the detection data obtained
under different stimulus conditions should become equal when the disparities
are normalized with respect to the noise level, because this noise level is the
only free parameter in these considerations. This implies that the only effect
of different stimulus conditions on the detection data should be a change in
effective disparities by a constant factor. It should be noted that deviations
of the data from the baseline set by these two predictions would suggest that
there are more special occurrences around zero disparity (where binocular sin-
gleness is perceived) than only loss of information about the sign of the dis-
parity.
The detection data were collected in the form of psychometric curves for
vertical disparities permitting isolation of the singleness cue from the depth
cue that would accompany it for horizontal disparities. The stimuli were pre-a o 2)
sented at two eccentricities {0.5 and 4 ) Since previous data suggested
that a simple signal-detection account of the d~ta might break down at short
presentation times {Duwaer and van den Brink, 1981c), measurements were per-
formed at three presentation times (20 msec, 160 msec and 2 sec) to test this
possibility.
METHODS
Subject: The detection data presented were obtained from a subject {ALD, one of the
authors), who was highly trained in such sensory tasks. One can therefore be reasonably sure that the data reflect stabilized sensory performance. This subject was a corrected myope {-0.75 D for left and right eyes) and had normal visual acuity, stereopsis and binocular single vision.
Stimulus The experiments were performed using the stimulus with aniseikonic vertical
disparity shown in Fig. 1. This stimulus was chosen a) because it did not provide the subject with depth cues3l and b) because it does not initiate vergen
ce eye-movements in response to the disparity between the lines (Duwaer and
Van den Brink, 1981b). Thanks to the absence of vergence eye-movements, presentation times longer than 0.2 sec {the reaction time for vergence eye-movements;
49

!--------~
' ··-----'--::r:::a::
' ' L: '
10° of o~ fixcti<:O'I c:rou
t=cl0 or8°ofo~
Fig. 1. Schematic representation of the stimuli presented to the left and right eyes. A stimulus with disparity of opposite sign is obtained when the displacements of the lines are such that the separation between the upper and lower line is larger (instead of
smaller) in the right eye than in the left eye.
Westheimer and Mitchell, 1956) can be used. The stimulus consisted of a continuously visible cross at the centre
of the visual field and a pair of horizontal test lines (1° x 1° or go x g0 ) presented tachistoscopically with presentation times of either 2 sec, 160 msec or 20 msec.
This stimulus was presented in an electronic stereoscope consisting of two XYZ displays (HP 1321A with white P31 phosphor) mounted 105 em from the subjects eyes and a white background (mean luminance 3 cd/m2 , sides 15°). The line
width of the stimuli amounted to 0.35 mm, or 1.2'. The luminance of the stimuli was adjusted to 1.g log units above the (contrast) perception threshold. In order to achieve this brightness level for the presentation time of 20 msec, the luminance had to be increased by about 0.6 log units. we therefore also
carried out runs for a presentation time of 20 msec with the same luminance as that of the stimulus at long presentation time. This stimulus condition will be denoted by '20 msec, L~L2000' in the figures. The subject's head was immobilized with a bite-board.
Procedure
The subject was asked to discriminate between test lines with a certain test disparity and those with a reference disparity. The only available cue for the detection of a difference between a test disparity and a reference disparity was found to be the amount of deterioration of singleness, which can be characterized as the simultaneous occurrence of restlessness, blurring and broadening of the single line at smaller disparities, gradually changing into separation between two lines at larger disparities4).
The discrimination task was performed in a two-interval forced-choice procedure {interstimulus interval 3 seconds) in which the subject had to decide which interval contained more of the above-mentioned cue, i.e. in which interval the lines were further from pure singleness. The correct interval was ran-
50

domized with equal a-priori probabilities amounting to 0.5 with the aid of a microprocessor. The subject was highly practised in performing this discrimination task with the sharpest possible criterion as a result of many preliminary discriminations (wiL~ and without feedback concerning the correct solutions) in a large number of preceding experiments~ The detection frequency for each disparity difference (test disparity - reference disparity) was determined in 100 trials of two successive stimulus presentations each, to give one point on the psychometric curve.
The psychometric curves were plotted with the frequency of seeing more of the above-mentioned cue ('FOS') as ordinate. It may be noted that a FOS of 0.5 corresponds to the chance-level because of the two-interval forced-choice procedure used. A schematic illustration of the FOS curves thus obtained as a function of the test disparity is given in the left-hand graphs of Fig. 2 for zero reference disparity (A), for an intermediate reference disparity {B) and for a comparatively large reference disparity (C). The reference disparities are indicated in this figure by solid bars and 'RE'. The parameter of interest in the present study is not disparity as such, but the difference between the test disparity and the reference disparity. The psychometric curves were, therefore, plotted as a function of the disparity difference as indicated in the right-hand graphs of Fig. 2. The detectability of disparity difference will be defined as the disparity difference that yields detection rates of 50% which corresponds to FOS values of 0.25 or 0.7S for the two-interval forced-choice procedure used. These disparity differences will be called 'Thresholds'. They are indicated by horizontal bars and arrows in Fig. 2.
wr~en the reference disparity is zero (see left-hand graph of Fig. 2A) the FOS increases from the chance level O.S to 1.0 for both positive and negative disparity differences. The disparity differences that yield a FOS of 0.75 were taken as thresholds. For positive reference disparities (see left-hand graphs of Fi?S- 2B and 2C), the FOS also increases for positive disparity differences. The positive disparity differences that yield a FOS of 0.7S were again taken as the thresholds. For negative disparity differences the FOS first decreases below O.S before it increases through O.S to 1.0. When the FOS did not drop below 0.25 (see left-hand graph of Fig. 2B), the difference between the disparity that yields a FOS of 0.75 and the disparity corresponding to the reference disparity of opposite polarity was taken as the threshold. When the FOS did drop below 0.25 (see left-hand graph cf Fig. 2C), the threshold was taken as the negative disparity difference that yields a FOS of 0.2S. The thresholds were determined by linear interpolation of detection frequencies that were each obtained from 100 trials of two successive stimulus presentations each.
In fact, in order to eliminate the influence of various systematic changes in the visual performance, these 100 determinations were divided into two lots of SO trials, the measuring sequence being as follows. For a given set of stimulus conditions, first curve A in the right-hand half of Fig. 2 was determined with SO trials per point, the various points being taken in a random sequence. Then curve B was determined in the same way, and finally various curves c, the reference disparity being increased each time.
The curves were then determined in the reverse order (various curves C with decreasing reference disparity - B - A), with another 50 trials per experimental point, for the same stimulus conditions, and the results for the two bat-
51

ches of 50 trials were averaged to obtain the final value of each experimental
point. The sets of curves (A 1 B and C) for other stimulus conditions were then de
termined in the same way. The determination of each curve took roughly half a day. If time allowed~
two curves could be determined during a single day~ the subject being allowed suitable periods of rest between measurements.
The data presented in this study (see Fig. 3) are based on a total of 32900 trials of two successive stimulus presentations each.
52
"' 0
1.;. ••
+±:!: *+*
.--· /
-:
./
DISPARITY
[
'"
A
B
c
L " ' .
'"~---······
u:" ...... , . -., ·-----... ~---
DISPARITY DIFFERENCE
Fig. 2. Schematic representation of the psychometric curves obtained at zero reference disparity (Fig. 2A) 1 an intermediate positive reference disparity (Fig. 2B) and a large positive reference disparity (Fig. 2C). The left-hand curves are plotted as a function of the disparity, the reference disparities being indicated by the vertical bars marked 'RE'. The right-hand curves are plotted as a function of the disparity difference. The horizontal arrows indicate the size of the 'threshold' for the detection of disparity differences. The psychometric curves were calculated using a detection model involving loss of information about the sign of disparities and a constant noise level (measured in terms of the standard deviation of the Gaussian
noise). Schematic representations of the stimuli are given above the psychometric curves for negative, zero and positive dis-
parities.
Signal detection considerations A signal detection model will be used to evaluate the experimental data ob
tained in this study. This model is generalized in such a way that it can also account for the elimination of disparities e.g. by a fusional mechanism.
The model assumes that the disparity (0) in the stimulus is first transfor
med by addition of a disparity value (d) that is a sample of normalized Gaus-v sian noise with the following distribution function for successive samples:
1 -d2 p(d)~/2 xp{2 ol cr rr cr-
where cr is the standard deviation of the additive Gaussian noise. The resulting Oisparity (d+0) is then further modified by a transformation
function which causes information about the sign of the disparity to be lost and a dead zone {DZ) to occur in which the disparity is eliminated:
output disparity output disparity
[input disparity[ 0
[input disparity[ > DZ [input disparity[ ~ DZ
It should be noted that a nonzero value of DZ turns the model into one in which the elimination of disparities (e.g. by a fusional mechanism) around zero disparity can be accounted for, whereas a zero value for DZ turns the model into one in which loss of sign information can be the only special occurrence around zero disparity.
This transformation is followed by a detection stage which determines whether the thus transformed value of the test disparity 0 exceeds the transformed value of the reference disparity Ore£· It can be shown (see e.g. Duwaer and Van den Brink, 1981a, 1981b) that the' frequency of seeing more signal'
(FOS), i.e. the probability that the transformed value of 0 is larger than the
transformed value of oref' is given by
+DZ +DZ oo FOs~o.s(J pC-o+dJ 3d}(J pC-o +dl 3d}+.' {pC-o-dJ+pC-o+dJ l
-DZ -DZ ref +DZ
+d {! p(-o +xi 3x}3d -d ref
The same signal transformations can, of course, be used to derive a formula for the frequency of seeing singleness in a classification procedure aimed at
determination of the diplopia thresholds- The transformed value of the test disparity 0 is then compared with some internal (untransformed) reference disparity Ore£ which is set by the particular criterion for singleness used (see e.g. Duwaer and Van den Brink, 1981a).
The simplest case (I) is the model without dead zone (DZ=O) and a constant noise level throughout the disparity domain (cr=SD) which was discussed in the Introduction. The predictions derived from this model - indicated by broken lines in Figs. 2, 3, 4 and 5 - will be used as a baseline for the evaluation of the data. One important prediction arising from this line of argument is that
53

the (50~ correct) detection threshold occurs at the test disparity 0=1.49 SD units for zero reference disparity C0ref=0) and at the disparity difference jO-OrefJ=0.955 SD units for large reference disparities cJOrefJ>3 SD units), so that the detection threshold for zero reference disparity is a factor 1.56 (=1.49/0.955) larger than that for large reference disparities. In this simplest case, all predictions become equal when the test disparity and reference disparity are both normalized with respect to the value for SD, as SD is the only free Farameter. Another major prediction is, therefore, that the detection data obtained under different stimulus conditions that may result in different values for SD, should become equal when the disparities are normalized with respect to the noise level.
Apart from this simplest model, two other theoretical cases will be discussed. Model II had no dead zone (DZ=O), while the noise is a function (f) of the test disparity 6 in the stimulus (O=f(6)) instead of being constant throughout the disparity domain. This mcdel would imply that the accuracy and reproducibility with which disparity information is coded are different at different disparity values. As such this would not be surprising because of the fact that disparity is a spatial parameter so that a change in disparity will lead to the stimulation of other cells which may embody other characteristics or tx~es of binocular combination. The only feature assumed for model III is that it contains a dead zone (DZ~O) in which information about the size of disparities is lost. The occurrence of a dead zone might be due to a rigid threshold or to a fusional process gradually eliminating the disparity.
RESULTS AND DISCUSSION
The psychometric curves observed for the 8 different stimulus conditions are
presented in Fig. 3. All data obtained with positive disparity differences are
denoted by open symbols, and those obtained with negative disparity differen-
ces by solid symbols. The corresponding threshold values are given in Table 1.
54
Fig. 3. Experimentally obtained psychometric curves as a function of the disparity difference (in minutes of arc) for various reference disparities (indicated by different symbols) and eight different stimulus conditions. The broken lines represent the values predicted by the model I described in this paper (involving signal detection with loss of sign information and a standard deviation of the intrinsic noise equal to mean detection threshold for zero reference disparity/1.49). The differences between the calculated psychometric curves at large reference disparities were less than the width of the broken lines. The data obtained at positive disparity differences are indicated by open symbols and those at negative disparity diffe-
rences by solid symbols.

0
, 0
0
'·,0· ";' 'OOO ,.,;~--_.~···'
.·· . 0 --~ -··
,,. ~/
•.. ·· _. .-·o
0.5/~ ,,
. ...:· _.-4··
REFERENCE DISPARITY
o.o o·
o.• 0.85'
... · ... 0.,-f:-----l----+----i--
·.~
;- ..... -.... __
---0.0 DISPARITY DIFfERENCE IN MINUTES OF ARC
Figure 3A
'·0 I o.,-1--~-c-~'--t-----~---~-
o •• ••
-~---· o.o l.:i
~-
'·o· ' .. -···
0 o.5¥-·c··,,--~---~----~-'·0
o .o. •••• v -~
-· 05'-~-"'-"--~f----t----+--· ...
0.0 DISPARITY DiffERENCE IN MINUTES OF ARC
Figure 3B
55

55
"l
I
,0, 1~ 20 M~EC
. ... ---~------o·"
REFERENCE ; ___ .••. '1------ 01$PAAITY
o.• o·
---;
''+--~""':.:____~---~--~--~-
o• 1.1>· '·': -~---····: __ .... ·
Q 0.~- .••• •"q.···.···~····" I
0
-~--
,,~.::_--+----+---+---+----+--
• DISPARITY DIFFERENCE IN MINUTES OF ARC
Fi9ure 3C
' '
.$.!' 10.2'
]4--'~·~·,:.":~.c~_,_ .. c_:_,_-_',_=_~_·_~_--_._-_ .. _;_--_. ____ ._ .. _.2_._ .. _~-• o·
:1 ... ·· ' /'/· '.····· ·•····· o.• 2.6-
,,
_..e-------;; o>f+c--.-~---;----+-----~------+---...
DISPARITY DIFFERENCE IN MINUTE$ OF ARC
Figure 3D
.$.( IO.i
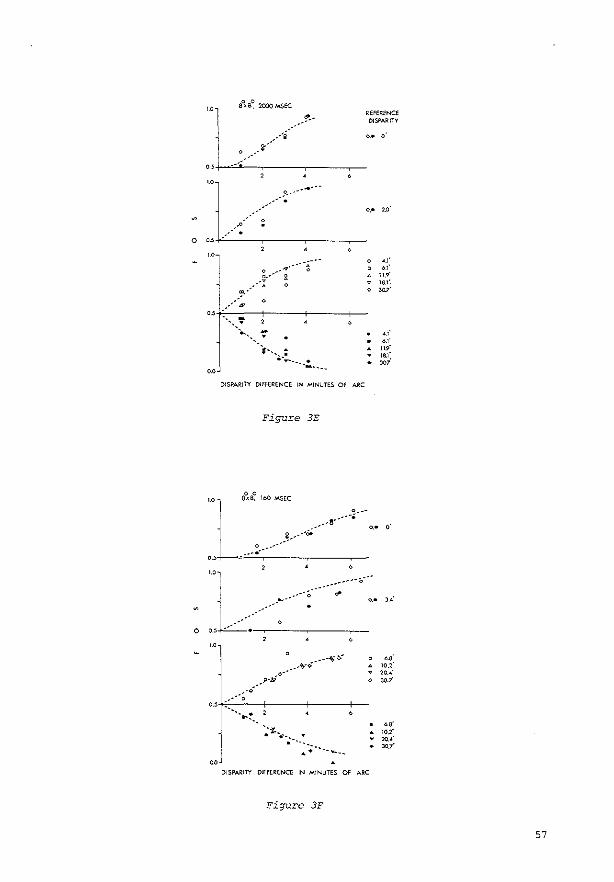
''1
1 / '·' _.-;
' . -----
••• 0
... ~ .
REFERENCE DISPARITY
o.• o·
o,• 2.0· ''I ----~----~---
o os+~--------,------,-------r--
"1 : ---· _ .. ;----~- &
••• .0. 0 ~-
• .- <> •• 8
0.~ •• -. -·--:_ ': ·-.
i---•. :._ --:... __ _
DISPARITY DIFfERENCE IN MINUTES Of ARC
Figure 3E
0 0 Sx8, 160 MSEC
.--~-----.:;;
v 0
~.r oJ"
11.9'
16.1'. ,~-
4.1' o.r
• 11.9" 18.1'
• )07.
,, I o.o+--~~--c·~··~----~-------
"L---·'·--·~---·-·~-----·;.":.,.·· o o.:; --···· •----'-----------
.!iJ·J!io·
,, 10.2' 20.4'
0 30.7'
.·o·· .-·· 0 o.of'cc--'---+-------+-------+--
·--.... ~. 2 0
:·-r..~--.. ---
DISPARITY DIFfERENCE IN MINUTES OF ARC
Figure 3F
... .. 10.2' ... 20.«' • JOf
57

58
~!---··· o· -· ---
~~~--~~··--~----~--,
DISPARITY DIFFERENCE IN MINUTES Of ARC
Figure 3G
• REFERENCE ••• --·· DtSPAAITY
o.• o·
o• s.a·
102" 1:"..:.1" 23.1"
0 30.7"
10.2" 1:5.)"
... ~3.1"
'""
'.·'.,11----,~~"'"~"'"'c"'c_K_. __ , __ ,rw-oo------,--'--_--_-_-_·',·_-_-_--_·_:_-_-_-__ __ !!. -· •• --~----~-·o
-----
!.-
0 o.• ,.
' "
'·'· 0 ------~------------______ .:--~- __ ...
0 0.5 ___ .--..
o.•
" :
, ______ ; ______ ! ------ .:-· •
0 ------~-----,,~~-:'-+---__, ___ --+----+----+--
-..----- . ":"·--
. ---_;.;-----~~-
DISPARITY DIFFERENCE IN MINUTES OF ARC
Figure 3H
"
.
s.a·
10.2 15.3 23.]"_
~'
10.1 1.'>3:
n' ,., .

Table 1. Thresholds (in minutes of arc) for the detection of positive disparity differences (TD+) and negative disparity differences (TD-) at different reference disparities (dre in
minutes of arc).
Stimulus dre TD - TD+ Stimulus dre TD - TD+
gO x go, 2000 msec 0 -2.8 +2.5 10 X 1o, 2000 msec 0 -1.04 +0.82
2.0 -2.7 +2.1 0.85 -0.68 +0.64
4.1 -1.7 +1.4 2.4 -0.41 +0.36
6.1 -2.2 +2.0 4.8 -0.67 +0.69
11.9 -2.5 +2.6 10.2 -0.73 +0.84
18.1 -2.1 +2.1
30.7 -2.9 +3.0
0 0 0 0 -1.73 +1.56 8 X 8 ' 160 msec 0 -4.4 +4.0 1 X 1 ' 160 msec 0
3.4 -4.2 +4.1 1.19 -0.95 +0.88
6.8 -2.2 +2.1 3. 1 -0.91 +0.81
10.2 -2.7 +3.1 4.4 -0.91 +1.06
20.4 -3.3 +3.2 10.2 -1.20 +1.23
30.7 -2.6 +3.3
80 0 X 8 '
20 msec 0 -7.7 +7.8 1 0 0
X 1 ' 20 msec 0 -3.1 +3.5
5.8 -6.5 +5.6 2.6 -1.67 +1.86
10.2 -5.9 +3.9 5.1 -1.44 +1.57
15.3 -4.6 +3.2 10.2 -1.66 +1. 94
23.2 -4.3 +4.3
30.7 -4.4 +4.7
80 X 8 0
' 20 msec 0 -7.5 +7.7 1 0 0
X 1 ' 20 msec 0 -3.0 +3.0
L=L 5.8 -4.4 +3.6 L=L 2.6 -1.32 +1.39 2000
10.2 +3.4 2000
5.1 -1.44 +1.57 -5.3 15.3 -3.8 +4.4 10.2 -1.66 +1.94
23.2 -4.4 +4.8
30.7 -5.1 +5.4
Inspection of Table 1 and Fig. 3 reveals two major findings:
-Under all stimulus conditions, the detection thresholds first decrease (by a-
bout a factor two) and then increase when the reference disparity is increased
from zero;
-The corresponding psychometric curves for different presentation times and ec-
centricities differ primarily in their slopes which suggests that the main ef-
fects of presentation time and eccentricity on the psychometric curves may be
represented by multiplying the effective disparities by a constant factor.
5S

An important implication of the second finding is that a first-order appro-
ximation to the psychometric curves can be obtained using a model with one fr.eP
parameter, viz. a magnification factor in the disparity domain. An example of
such a model is the above-~entioned model I, which involves signal detection
with loss of sign information (without a dead zone), the standard deviation
(SD) of the ncise being a parameter which was fixed for each stimulus condi-
tion by making the mean detection threshold for zero reference disparity (T ) 50%
equal to 1.49 SD, i.e. the value of the predicted threshold for given SD. The
various psychometric curves for the different reference values were then cal-
culated using (T /1.49) as standard deviation of the intrinsic noise. The 50%
results of these calculations are indicated by broken lines in Fig. 3. It can
be seen that they give a reasonable first-order approximation to the eA~eri-
mental data which indicates thut the model involving signal detection with
loss of sign information and a constant noise level is not far from the truth.
It may be noted that the description is as good for the shortest presentation
times as it is for the longer ones.
We will now proceed with a more detailed analysis of the data on the basis
of Figs. 4 and 5. Fig. 4 displays the thresholds for the detection of dispari-
ry difference expressed in SD (T /1.49) units as a function of the reference 50%
disparity expressed in the same SD units. Fig. 5 displays the psychometric cur-
ves obtained with zero reference disparity as a function of the test disparity,
also expressed in SD units. The broken lines in these figures again represent
the prediction according to model I - i.e. on the assumption of signal detec-
tion with loss of sign information and a constant noise level.
It may first of all be noted in Figs. 4 and 5 that the normalized data for
the different stimulus conditions are remarkably alike, despite differences in
the absolute disparity level (in minutes of arc) of up to a factor 3. This sug-
gests that the main effects of presentation time and eccentricity on the psy-
chometric curves as well as on their dependency on reference disparity may be
represented by multiplying the effective disparities by a constant factor.
Inspection of Figs. 4 and 5 also shOws that loss of sign information can-
not be the only special thing that happens around zero disparity. This may be
concluded from an unexpected change in the threshold level: the drop in the
60
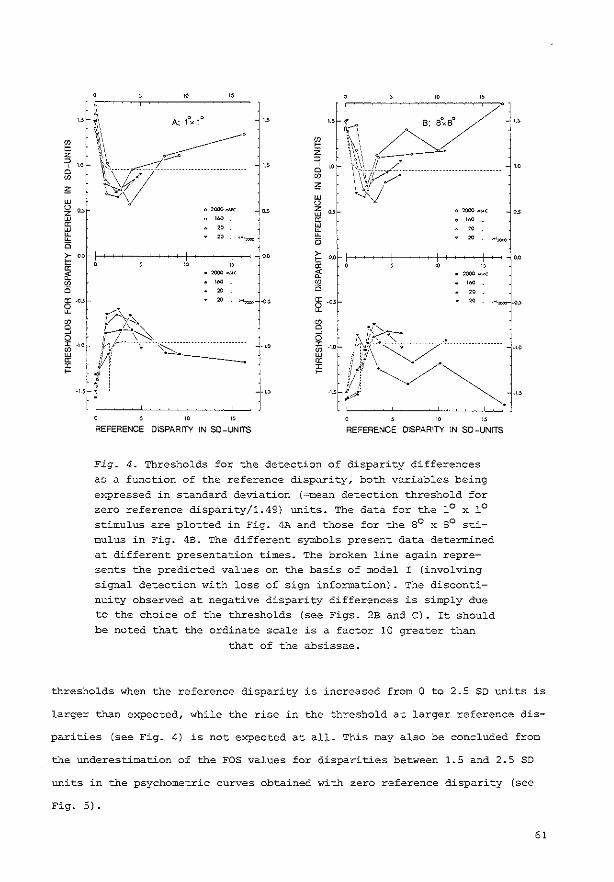
~ . ~ -" " ~: ·=-
'~
" . "
REFERENCE DISPARITY IN SO-UNITS REFERENCE DISPARITY IN SO-UNITS
Fig. 4. Thresholds for the detection of disparity differences as a function of the reference disparity, both variables being expressed in standard deviation (=mean detection threshold for zero reference disparity/1.49) units. The data for tt.e 1° x 1°
stimulus are plotted in Fig. 4A and those for the 8° x 8° stimulus in Fig. 4B. The different symbols present data determined
at different presentation times. Tr.e broken line again represents the predicted values on the basis of model I (involving signal detection with loss of sign information). The discontinuity observed at negative disparity differences is simply due to the choice of the thresholds (see Figs. 2B and C). It should be noted that the ordinate scale is a factor 10 greater than
that of the absissae.
thresholds when the reference disparity is increased from 0 to 2.5 SD units is
larger than expected, while the rise in the threshold at larger reference dis-
parities {see Fig. 4) is not expected at all. This may also be concluded from
the underestimation of the FOS values for disparities between 1.5 and 2.5 SD
units in the psychometric curves obtained with zero reference disparity {see
Fig. 5).
61

'' so'.1.o. oz-o.o so'-0.9. DZ-1.31,
DISPARITY IN SO-UNITS
'' '' DISPARITY IN SO-UNITS
0. 2Q()() .....soc
'"
20 ;L~s.ooo
Fig. 5. Psychometric curves for zero reference disparity as a function of the disparity in standard deviation (=mean detection threshold for zero reference disparity/1.49) units. The
data of Fig. SA were obtained with the 1° x 1° stimulus, and those of Fig. SB with the go x go stimulus. The different symr
bols represent data for the different presentation times. The
various broken and dotted lines and the asteriks represent
predictions based on various signal detection models (see text) •
The results, therefore, suggest that there are more special occurrences a-
round zero disparity than only loss of sign information. Two possible extra oc-
currences are an increased noise level without dead zone (model II) or a dead
zone without increased noise level (model III). These alternatives will be
discussed in turn. In both alternatives it must be assumed that the noise le-
vel increases with increasing disparities above about 2.5 SD units as eviden-
ced by the flattening of the psychometric curves for increasing reference dis-
parities (see Fig. 3) and the increase of the corresponding thresholds (see
Fig. 4).
62

Increased noise level around zero disparity without dead zone (model II)
We would like to start by stressing once again that variation in the noise
level throughout the disparity domain (reflecting variation of the accuracy and
reproducibility of disparity coding for different disparities) as such is not
surprising, since disparity is a spatial parameter. A change in disparity will
thus lead to the stimulation of other cells which may embody other characteri
stics or types of binocular combination.
The unexpected large drop in the threshold when the reference disparity is
increased from zero to 2.5 SD units (see Fig. 4) could indicate an increased
noise level around zero disparity without dead zone (model II). The assumption
of signal detection with loss of sign information but without dead zone would
namely require that the standard deviation of the noise for disparities up to
at least the detection threshold at 1.49 SD units should amount to 1 SD unit.
This standard deviation around zero disparity would then be larger than the ac
tual standard deviation for disparities of 2 SD units, as estimated from the
observed thresholds. According to the expression SD ~ (threshold for detection
of disparity difference I 0.955), this standard deviation amounts to 0.8 SD u
nits for the 1° x 1° stimulus and 0.9 SD units for the 8° x 8° stimulus. It
should be noticed that if the noise level does not increase towards zero dis
parity, a detection threshold of 1.49 SD units would require the occurrence of
a dead zone.
The same increase of noise level from 0.8 SD units (for the 1° x 1° stimu
lus) or 0.9 SD units (for the 8° x 8° stimulus) at disparities of 2 2.5 SD u
nits to a level of 1 SD unit at zero disparity without the occurrence of a dead
zone can also be used to give a good prediction of the FOS values of the psy
chometric curves obtained with zero reference disparity (see Fig. 5). Such a
description, e.g. with a noise level of 0.8 SD units between 1.8 and 2.5 SD u
nits increasing to 1 SD unit at zero disparity, is indicated in Fig. SA by as
terisks. This description gives an even better fit than the corresponding des
cription with the same noise level but with a dead zone (model III) which will
be discussed in the next section.
63
Dead zone without increased noise level around zero disparity (model III)
The unexpectedly large drop in the threshold when the reference disparity
i~ increased from zero to 2.5 SD units (see Fig. 4) and the underestimation of
FOS values for disparities between 1.5 and 2.5 SD units in the psychometric
curves obtained with zero reference disparity (see Fig. 5) can also be accoun
ted for by the occurrence of a dead zone without increased noise level around
zero disparity. For instance, if the standard deviation of the noise remains
constant for disparities smaller than 2 SD units, a detection threshold of 1.49
SD units for zero reference disparity can be obtained with a dead zone amoun
ting to 1.36 SD units for a standard deviation of 0.8 SD units and to 1.31 SD
units for a standard deviation of 0.9 SD units. The corresponding predictions
of the psychometric curves obtained with zero reference disparity are plotted
in Fig. 5 as the upper dotted lines. It will be seen that these predictions a
gree well with the experimental data.
It should be noticed that the magnitude of the dead zone required for these
descriptions is closely linked to the noise level (DZ = constant x standard de
viation of noise) and would, for instance, fall when the presentation time of
the stimulus is increased. This indicates that if there is indeed a dead zone,
its occurrence cannot be due to a fusion mechanism of the traditional variety
that gradually eliminates information about the size of disparities (see Intro
duction).
CONCLUSIONS
All our experimental data on the detection of vertical disparities can be des
cribed to a reasonable approximation by a model involving signal detection
without dead zone but with two other special features around zero disparity
where binocular single vision occurs, viz. loss of information about the sign
of the disparity and intrinsic noise at a level up to 25% higher than the mi
nimum level at intermediate disparities (amounting to about 2.5 SD units, i.e.
a factor 1. 7 above the detection threshold for zero reference disparity). A mo
del with a dead zone and a noise level that is not increased around zero dispa
rity can also be used to describe the data. However, the magnitude of the dead
zone required to fit the experimental data would be so small in comparison to
64
the noise level and so closely linked to the latter that we prefer the first-
mentioned description without dead zone and with increased noise level around
zero disparity, not least because the noise level does not remain constant
throughout the disparity domain anyway. If the reader nevertheless prefers a
model with dead zone, (s)he should bear in mind that the effect of presentation
time on the data obtained indicates that the occurrence of such a dead zone
cannot be attributed to a fusion mechanism of the traditional variety gradual-
ly reducing the effective size of the disparity (to zero) •
Our results indicate an increased detectability of disparity differences at in-
termediate (reference) disparities, even after correction for loss of sign in-
formation around zero disparity. Foster (1979) has argued that such an increa-
sed detectability of differences between two values of a certain parameter may
indicate a boundary between two different internal representations of the para-
meter. Arguing along these lines, we could thus say that our data seem to point
to a boundary between the internal representations of small disparities (lea-
ding to binocular single vision) and of large disparities (leading to binocu-
lar double vision or diplopia) • The boundary between those two internal repre-
sentations as revealed by the detection data presented here is however not ve-
ry marked, which explains why it has not been noticed before (see e.g. Kaufman
and Arditi, 1976a; Duwaer and van den Brink, 1981a).
Comparison of the detection threshold with the mean standard deviation of the diplopia thresholds in another study provided indications that a dead zone might develop when the presentation time is shortened (Duwaer and Van den Brink, 1981c). It is now clear that these indications were due to the systematic drop in disparity level in SD (=TS0%/1.49) units of the diplopia thresholds and the accompanying drop in noise level in the relevant disparity range of 8 -2 SD units.
ACKNOWLEDGEMENTS
We would like to thank Dr. c.M.M. de Weert and Mrs. A.E.H. Peters for helpful discussions, Mr. C.J. Keemink and Mr. J.B.P. van Deursen for their technical
assistance, Dr. R.H. Bathgate for improving the English, and the Netherlands Organization for the Advancement of Pure Research (Z.W.O.) for the funds which made this investigation possible.
65
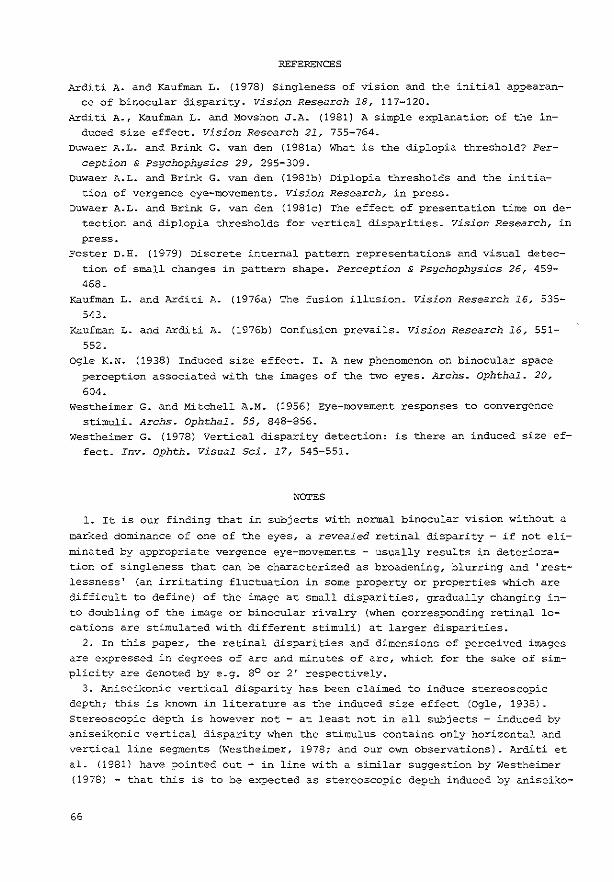
REFERENCES
Arditi A. and Kaufman L. (1978) Singleness of vision and the initial appearance of binocular disparity. Vision Research 18, 117-120.
Arditi A., Kaufman L. and Movshon J.A. (1981) A simple explanation of tl1e induced size effect. Vision Research 21, 755-764.
Duwaer A.L. and Brink G. van den (1981a) What is the diplopia threshold? Perception & Psychophysics 29, 295-309.
Duwaer A-L- and Brink G. van den (1981b) Diplopia thresholds and the initiation of vergence eye-movements. Vision Research, in press.
Duwaer A.L. and Brink G. van den (1981c) The effect of presentation time on detection and diplopia thresholds for vertical disparities. Vision Research, in press.
Foster D.H. (1979) Discrete internal pattern representations and visual detec
tion of small changes in pattern shape. Perception & Psychophysics 26, 459-468.
Kaufman L. and Arditi A. (1976a) The fusion illusion. Vision Research 16, 535-
543. Kaufman L. and Arditi A. (1976b) Confusion prevails. Vision Research 16, 551-
552.
Ogle K.N. (1938) Induced size effect. I. A new phenomenon on binocular space perception associated with the images of the two eyes. Archs. Ophthal. 20,
604. westheimer G. and Mitchell A.M. (1956) Eye-movement responses to convergence
stimuli. Archs. Ophthal. 55, 848-856. westheimer G. (1978) Vertical disparity detection: is there an induced size ef
fect. Inv. Ophth. Visual Sci. 17, 545-551.
NOTES
1. It is our finding that in subjects with normal binocular vision without a
marked dominance of one of the eyes, a revealed retinal disparity - if not eli
minated by appropriate vergence eye-movements - usually results in deterioration of singleness that can be characterized as broadening, blurring and 'restlessness' (an irritating fluctuation in some property or properties which are difficult to define) of the image at small disparities, gradually changing into doubling of the image or binocular rivalry (when corresponding retinal locations are stimulated with different stimuli) at larger disparities.
2. In this paper, the retinal disparities and dimensions of perceived images are expressed in degrees of arc and minutes of arc, which for the sake of simplicity are denoted by e.g. 8° or 2' respectively.
3. Aniseikonic vertical disparity has been claimed to induce stereoscopic depth; this is known in literature as the induced size effect (Ogle, 1938). Stereoscopic depth is however not - at least not in all subjects - induced by aniseikonic vertical disparity when the stimulus contains only horizontal and vertical line segments (Westheimer, 1978; and our own observations). Arditi et al. (1981) have pointed out - in line with a similar suggestion by Westheimer (1978) - that this is to be expected as stereoscopic depth induced by aniseiko-
66

nic vertical disparity is based on false correlation of noncorresponding horizontally disparate stimulus parts which is likely to occur only for oblique stimulus lines.
4. During the last few sessions with the go x go stimulus and a presentation time of 160 msec which were done with the reference disparity of 3.4' and negative disparity differences, the subject saw a disparity-induced change in the orientation in the fronto-parallel plane (so without the occurrence of stereoscopic depth effects) of the lower pair of test lines. This change of orientation had not been noticed before and could not be seen under the other stimulus conditions. The subject disregarded this cue during the collection of the remaining detection data for the stimulus in question. The occurrence of this cue was probably due to partial suppression of the left-hand part of the lower test line in one eye and of the right-hand part of this line in the other.
67

68

III
COOPERATION BETWEEN
MOTOR AND SENSORY PROCESSES
UNDERLYING BINOCULAR SINGLE VISION
Chapter III describes the results of two studies of a major a
spect associated with binocular single vision which had not
been really tackled before, viz. the cooperation between vergence eye-movements aimed at minimizing retinal disparities by
aligning the eyes on the one hand and the processes underlying
sensory tolerance to these disparities on the other.
In the first study, the magnitude of foveal diplopia thres
holds has been compared with the magnitude of 'fixation' disparities occurring spontaneously during continuous binocular fixation due to the limited accuracy of {motor) ocular align
ment. Furthermore, the spread of these foveal diplopia thres
holds has been compared with the spread of the fixation dispa
rities.
In the second study, the largest vertical (retinal) dispari
ties {at eccentricities of 0.5 to 4 degrees of arc in the vi
sual field) that do not cause image doubling have been compared with the corresponding smallest vertical {retinal) dispa
rities that can initiate vergence eye-movements. In both studies, a subjective nonius-line method was used to
obtain data on ocular alignment {cf. Chapter V).
69

3.1 FOVEAL DIPLOPIA THRESHOLDS
AND
FIXATION DISPARITIES
• A.L. Duwaer and G. van den Brink
~BSTRACT
comparison of the magnitude and intrinsic spread of foveal diplopia thresholds with the accuracy of ocular alignment as determined with a subjective alignment method shows that: {a) the accuracy of alignment in the vertical direction {within 1'-2') is remarkably good and much better than in the horizontal direction; {b) the largest disparities occurring due to restricted alignment accuracy are usually substantially smaller than the foveal diplopia thresholds; {c) interindividual variability in the magnitude of foveal diplopia thresholds is not only due to interindividual variability in the alignment accuracy; {d) the spread of foveal diplopia thresholds exceeds the spread of ocular alignment, which implies that the noise in the foveal disparity domain is not only due to the restricted alignment accuracy but also to sensory processes. Finally, the data confirm that, unlike the case with diplopia thresholds, the spread of stereoscopic thresholds is not affected by the restricted alignment accuracy.
INTRODUCTION
When an observer with normal binocular vision looks with both eyes at an object
the eyes align with respect to the fixated part of the object in such a way tha
the images in the foveae of the two eyes fall on nearly corresponding retinal
locations.
Ocular alignment is however not perfect which results in residual dispari-
* Department of Biological and Medical Physics, Erasmus University Rotterdam, P.O. Box 1738, 3000 DR Rotterdam, The Netherlands
70

ties called fixation disparities. These fixation disparities are of special in
terest because they have to be tolerated sensorially _if binocular single vision
is to be maintained.
The purpose of the present study was to compare the size of the fixation dis
parities occurring during steady binocular fixation with the foveal diplopia
threshold (i.e. the value of the retinal disparity at which binocular single vi
sion ends).
The data available in the literature on the accuracy of ocular alignment du
ring steady binocular fixation show large differences: the reported standard de
viations (SD) of this accuracy vary between 1• 1 l and 8' (Riggs and Ratliff,
1951: SD<1'; Ditchburn and Ginsberg, 1953 and Krauskopf, Cornsweet and Riggs,
1960: SD = 1.9' - 2.5'; Fender and Julesz, 1967: SD = 7' - 8'). This implies
that the maximum fixation disparities occurring during steady binocular fixa
tion which have to be tolerated sensorially if binocular single vision is to be
maintained vary between 2' and 20' (2 - 3 times SD) in different studies.
A large variability in the literature is not only found for the reported ac
curacy of ocular alignment but also for the reported foveal diplopia thresholds
(see e.g. Duwaer and Van den Brink, 1981).
Because of these variabilities, the comparative magnitudes of fixation dis
parities and foveal diplopia thresholds can only be analysed properly when they
are both obtained in the same subjects and under the same stimulus conditions.
In the literature, data of this kind have only been gathered with a rather
restricted accuracy for one subject, the quantity being measured the horizontal
disparity (Palmer, 1961). These data suggest that the foveal diplopla threshold
for horizontal disparity is substantially larger than the largest. horizontal
fixation disparities due to the restricted accuracy of ocular alignment. It is
worth noting that this would imply a discrepancy between the minimum sensory
tolerance to horizontal disparities needed to maintain binocular single vision
given the accuracy of ocular alignment on the one hand, and the actual sensory
tolerance measured on the other.
In the present study additional data will be provided and analysed concer
ning the comparative magnitudes of fixation disparities and foveal diplopia
thresholds during steady binocular fixation for both horizontal and vertical
71
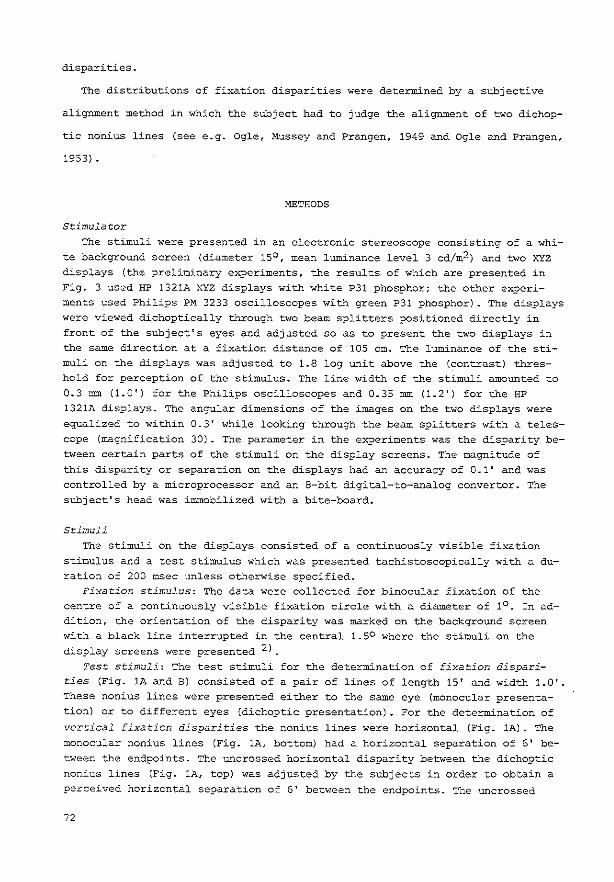
disparities.
The distributions of fixation disparities were determined by a subjective
alignment method in which the subject had to judge the alignment of two dichop-
tic nonius lines (see e.g. Ogle, Mussey and Prangen, 1949 and Ogle and Prangen,
1953).
METHODS
Stimulator
The stimuli were presented in an electronic stereoscope consisting of a white background screen (diameter 15°, mean luminance level 3 cd/m2) and two XYZ displays (the preliminary experiments, the results of which are presented in Fig. 3 used EP 1321A XYZ displays with white P31 phosphor; the other experiments used Philips PM 3233 oscilloscopes with green P31 phosphor) . The displays were viewed dichoptically through two beam splitters positioned directly in front of the subject's eyes and adjusted so as to present the two displays in the same direction at a fixation distance of 105 em. The luminance of the stimuli on the displays was adjusted to 1.8 log unit above the {contrast) threshold for perception of the stimulus. The line width of the stimuli amounted to 0.3 mm (1.0') for the Philips oscilloscopes and 0.35 mm (1.2') for the HP 1321A displays. The angular dimensions of the images on the two displays were equalized to within 0.3' while looking through the beam splitters with a telescope (magnification 30). The parameter in the experiments was the disparity between certain parts of the stimuli on the display screens. The magnitude of
this disparity or separation on the displays had an accuracy of 0.1' and was controlled by a microprocessor and an 8-bit digital-to-analog convertor. The subject's head was immobilized with a bite-board.
Stimuli The stimuli on the displays consisted of a continuously visible fixation
stimulus and a test stimulus which was presented tachistoscopically with a duration of 200 msec unless otherwise specified.
Fixation stimulus: The data were collected for binocular fixation of the centre of a continuously visible fixation circle with a diameter of 1°. In addition, the orientation of the disparity was marked on the background screen with a black line interrupted in the central 1.50 where the stimuli on the display screens were presented 2) .
Test stimuli: The test stimuli for the determination of fixation disparities (Fig. 1A and B) consisted of a pair of lines of length 15' and width 1.0'. These nonius lines were presented either to the same eye (monocular presentation) or to different eyes (dichoptic presentation) • For the determination of
vertical fixation disparities the nonius lines were horizontal {Fig. 1A). The
monocular nonius lines (Fig. 1A, bottom) had a horizontal separation of 6' between the endpoints. The uncrossed horizontal disparity between the dichoptic nonius lines (Fig. lA, top) was adjusted by the subjects in order to obtain a perceived horizontal separation of 6' between the endpoints. The uncrossed
72
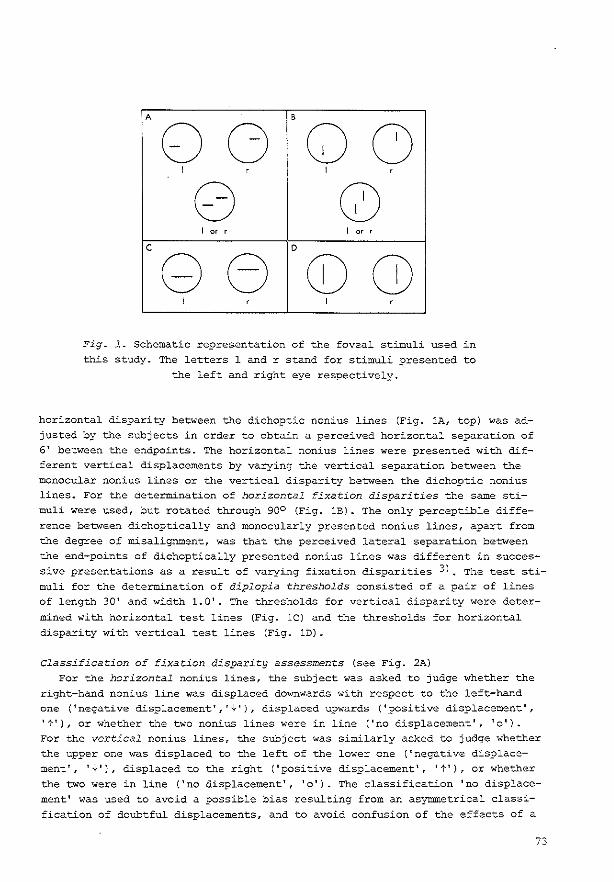
A B
0 G 0 G I ' I '
0 0 I -' I -'
c D
G G ~ ~ I ' I '
Fig. 1. Schematic representation of the foveal stimuli used in this study. The letters 1 and r stand for stimuli presented to
the left and right eye respectively.
horizontal disparity between the dichoptic nonius lines (Fig. lA, top) was adjusted by the subjects in order to obtain a perceived horizonta: separation of 6' between the endpoints. The horizontal nonius lines were presented with different vertical displacements by varying the vertical separation between the monocular nonius lines or tl1e vertical disparity between the dichoptic noniliS lines. For the determination of horizontal fixation disparities the same stimuli were used, but rotated through goo (Fig. lB). The only perceptible difference between dichoptically and monocularly presented nonius lines, apart from the degree of misalignment, was that the perceived lateral separation between the end-points of dichoptically presented nonius lines was different in successive presentations as a result of varying fixation disparities 3). The test stimuli for the determination of diplopia thresholds consisted of a pair of lines of length 30' and width 1.0'. The thresholds for vertical disparity were deter
mined with horizontal test lines (Fig. lC) and the thresholds for horizontal disparity with vertical test lines (Fig. lD).
Classification of fixation disparity assessments (see Fig. 2A) For the horizontal nonius lines, the subject was asked to judge whether the
right-hand nonius line was displaced downwards with respect to the left-hand one ('negative displacement' ,'*'J, displaced upwards ('positive displacement', 't'), or whether the two nonius lines were in line ('no displacement', 'o'). For the vertical nonius lines, the subject was similarly asked to judge whether the upper one was displaced to the left of the lower one ('negative displacement', '+'), displaced to the right ('positive displacement', 't'), or whether the two were in line ('no displacement', 'o'). The classification 'no displacement' was used to avoid a possible bias resulting from an asymmetrical classi
fication of doubtful displacements, and to avoid confusion of the effects of a
73
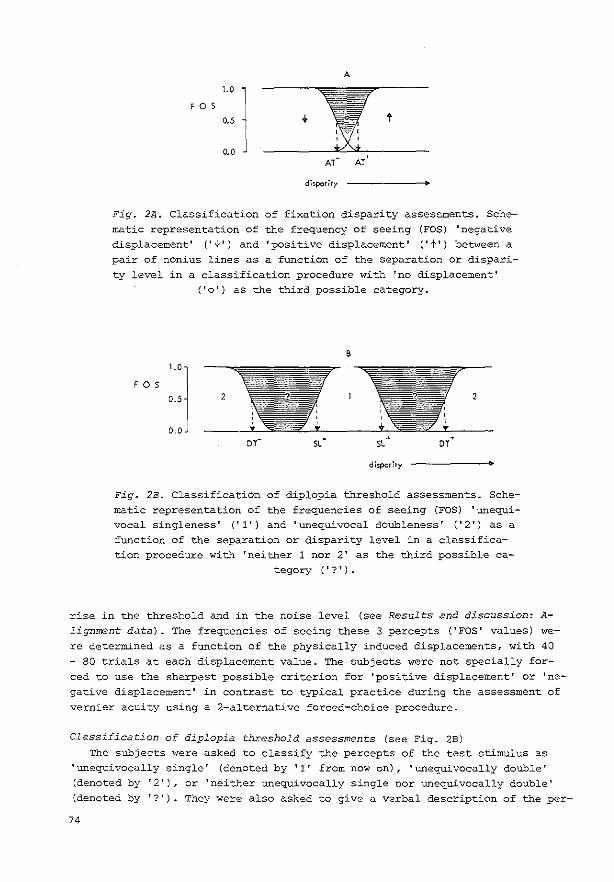
A
t F 0 S 1.0 l
0.5
0.0
dhpority
Fig. 2A. Classification of fixation disparity assessments. Schematic representation of the frequency of seeing (FOS) 'negative displacement' (' .J..' ) and 'positive displacement' (' t') between a
pair of nonius lines as a function of the separation or disparity level in a classification procedure with 'no displacement'
(' o') as the third possible category.
B
F 0 S
0 :l 2
0 0 - -DT SL
disparity
Fig. 2B. Classification of diplopia threshold assessments. Schematic representation of the frequencies of seeing (FOS) 'unequivocal singleness' ('1') and 'unequivocal doubleness' {'2') as a
function of the separation or disparity level in a classification procedure with 'neither 1 nor 2' as the third possible ca-
tegory ('?').
rise in the threshold and in the noise level (see Results and discussion: Alignment data). The frequencies of seeing these 3 percepts ('FOS' values) were determined as a function of the physically induced displacements, with 40 - 80 trials at each displacement value. The subjects were not specially forced to use the sharpest possible criterion for 'positive displacement' or 'negative displacement' in contrast to typical practice during the assessment of vernier acuity using a 2-alternative forced-choice procedure.
Classification of diplopia threshold assessments {see Fig. 2B) The subjects were asked to classify the percepts of the test stimulus as
'unequivocally single' (denoted by '1' from now on), 'unequivocally double' (denoted by '2'), or 'neither unequivocally single nor unequivocally double' {denoted by '?'). They were also asked to give a verbal description of the per-
74

cepts they assigned to the last-mentioned class. Unequivocal doubleness was defined as the perception of two lines with a se
paration between them. Unequivocal singleness was defined as the percept of the test stimulus without disparity. For presentation times of 200 msec, the test stimulus without disparity was always seen as a sharp line, not broadened, not restless and displaced. However, for 20 msec presentation times the line perceived was regularly broadened, blurred and 'restless' as though the stimulus contained a disparity. The subjects were instructed not to incorporate these percepts in a new definition of singleness, but to classify them as transitional percepts ('?'). FOS values for these 3 percepts were determined as a function of the disparity, with 40-80 trials at each disparity value.
Calculation of the thresholds The FOS curves obtained were fitted by a convolution of normalized Gaussian
noise and 3 hypothetical disparity ranges, in each of which one of the three possible percepts ('1', '?' or '2', see Fig. 2B, or·~·, 'o' or 't', see Fig. 2A) is always seen. Each (abrupt) transition between neighbouring regions is defined as a 'threshold', with the standard deviation of the fitted Gaussian noise as its standard deviation. This implies that the thresholds were calculated under the assumption that at each disparity one of the three possible percepts is always seen, but that the effective locations of the transitions between the different possibilities vary due to intrinsic additive Gaussian noise. It may be noticed in Fig. 2 that the above-mentioned convolution simply results in an integrated Gaussian distribution function (see the FOS curves for ·~·, 't', '1', '?' and '2' in Fig. 2) unless the separation between neighbouring transitions is small in comparison with the amount of noise (see the FOS curves for 'o', indicated by the boundary of the shaded area in Fig. 2A, and for '1' in Fig. 6}.
The difference between the disparities or separations at which the lines are optimally aligned and those at which 'alignment' ends after deconvolution will be referred to as the 'alignment threshold' ('AT') from now on, the threshold corresponding to the disparity at which unequivocal singleness ends the 'singleness limit' ('SL') and the threshold corresponding to the disparity at which unequivocal doubleness begins the 'doubleness threshold' ('DT'). Each of these thresholds has one value at positive values of the disparity {denoted by the suffix'+') and one value at negative disparities (denoted by the '-' suffix). The singleness limit and doubleness threshold may be regarded as lower and up
per limits of 'the' diplopia threshold, while the mean fixation disparity 'F' as determined in this study is defined as the mean of AT- and A~ for dichoptic nonius lines. The measure of the spread of F used in this study is described in Results and discussion: The distribution of fixation disparities.
Experimental procedure The data were collected in sessions of 240 trials each. Each session lasted
about 30-45 minutes with a rest period of at least 15 minutes between sessions. On a given day, 2 or 4 sessions were held. Sessions for the determination of fixation disparities were alternated by diplopia threshold sessions.
In each session the subject had to classify 12 different disparity values 20 times. He or she started each trial by pressing a button. After 0.5 sec the stimulus appeared with a constant disparity or separation which was selected at
75
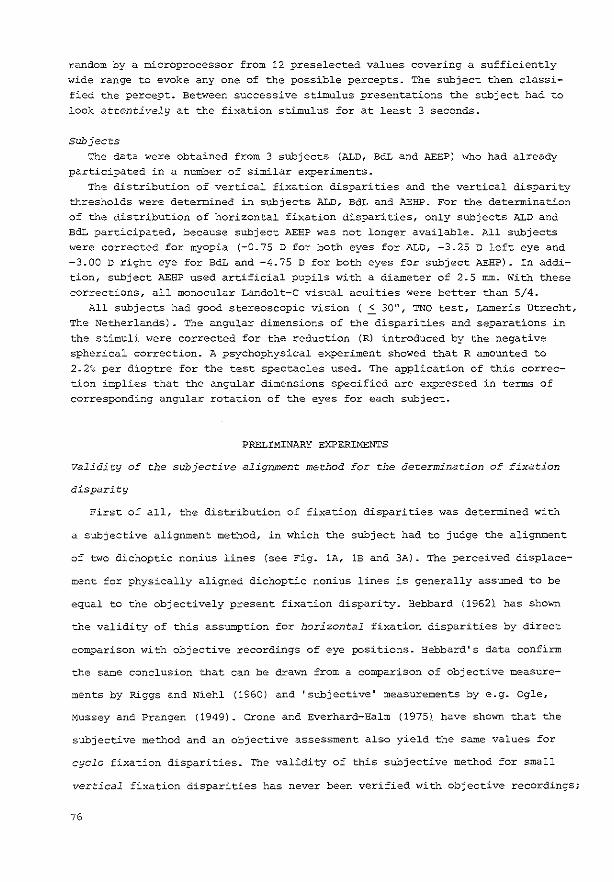
random by a microprocessor from 12 preselected values covering a sufficiently wide range to evoke any one of the possible percepts. The subject then classified the percept. Between successive stimulus presentations the subject had to look attentively at the fixation stimulus for at least 3 seconds.
Subjects The data were obtained from 3 subjects (ALD, BdL and AEBP) who had already
participated in a number of similar experiments. The distribution of vertical fixation disparities and the vertical disparity
thresholds were determined in subjects ALD, BdL and AEHP. For the determination of the distribution of horizontal fixation disparities, only subjects ALD and BdL participated, because subject AEHP was not longer available. All subjects were corrected for myopia {-0.75 D for both eyes for ALD, -3.25 D left eye and -3.00 D right eye for BdL and -4.75 D for both eyes for subject AEHP). In addition, subject AEBP used artificial pupils with a diameter of 2.5 rom. With these corrections, all monocular Landolt-C visual acuities were better than 5/4.
All subjects had good stereoscopic vision ( ~ 30", TNO test, Lameris Utrecht, The Netherlands) . The angular dimensions of the disparities and separations in the stimuli were corrected for the reduction (R) introduced by the negative spherical correction. A psychophysical experiment showed that R amounted to 2.2% per dioptre for the test spectacles used. The application of this correction implies that the angular dimensions specified are expressed in terms of corresponding angular rotation of the eyes for each subject.
PRELIMINARY EXPERIMENTS
Validity of the subjective alignment method for the determination of fixation
disparity
First of all, the distribution of fixation disparities was determined with
a subjective alignment method, in which the subject had to judge the alignment
of two dichoptic nonius lines (see Fig. 1A, lB and 3A). The perceived displace-
ment for physically aligned dichoptic nonius lines is generally assumed to be
equal to the objectively present fixation disparity. Hebbard (1962). has shown
the validity of this assumption for horizontal fixation disparities by direct
comparison with objective recordings of eye positions. Hebbard's data confirm
the same conclusion that can be drawn from a comparison of objective measure-
ments by Riggs and Niehl (1960) and 'subjective' measurements by e.g. Ogle,
Mussey and Prangen (1949). Crone and Everhard-Halm (1975). have shown that the
subjective method and an objective assessment also yield the same values for
cyclo fixation disparities. The validity of this subjective method for small
vertical fixation disparities has never been verified with objective recordings;
76

1-
Fig. 3A. Schematic representation of the line stimuli used to
obtain the data of Fig. 3B. The letters 1 and r stand for pre
sentation to the left and right respectively.
vertical disparity in nonius lines for alignment in minutes of ore
/ /
-10
g / /
/
ALD o 8° of ore square • 1° of arc square
/ /
/ /
g // /
/
/ /
/
/
+10
/ /
/ /
/
g // /
/
/ /
/
/ a>/
/ /
+10
vertical disparity in square in minutes of ore
-10
Fig. 3B. Test of validity of subjective alignment method for determination of fixation disparity. Vertical disparity to be introduced between the nonius lines in order to obtain optimum alignment, as a
function of the vertical disparity between the squares. The standard errors (n=Sl are smaller than the size of the symbols.
77

however, we did test it by means of a simple psychophysical experiment in
which the subject (ALD) looked at the portion of a vertical fixation line (of
length 10°) between two dichoptic nonius lines (of length 20') with a randomly
chosen vertical disparity. The nonius lines were positioned at the centre of
the vertical fixation line and of squares (of side 1° or 8°) , the two squares
being presented dichoptically with a certain amount of vertical disparity (see
Fig. 3A). The subject was asked to adjust the vertical disparity in the nonius
lines so that they became optimally aligned. The whole stimulus was then remo
ved and again presented with other vertical disparities between the nonius li
nes and squares. The whole adjustment proCedure was repeated to give five ad
justments, for vertical disparities of ± 10', ± 5' and 0' between the squares.
The mean values of the adjusted vertical disparities between the nonius lines
are plotted in Fig. 3B as a function of the vertical disparity between squares
of side 1° (solid circles) and 8° (open circles).
Inspection of Fig. 3B shows that, apart from an offset of about 0.9', the
vertical displacement induced between the dichoptic nonius lines is equal to
the vertical disparity between squares of side 1° and even 8°. It is high-
ly unlikely that the displacement induced in the nonius lines is due to a sen
sory process as this would require interaction between the square and the,
otherwise uncorrelated, nonius lines over distances in the visual field up to
at least 4° with an accuracy of at least 1'. It is therefore concluded that the
perceived vertical displacement between a pair of physically aligned dichoptic
nonius lines is indeed equal to the vertical fixation disparity. This conclusion
is supported by the fact that the observed variation with time of the relative
vertical displacement of the nonius lines in response to _abrupt presentation of
vertical disparity closely resembles the variation of vergence eye-movements
with time, as reported by Perlmutter and Kertesz (1978).
The apparent alignment of the eyes to stimuli with vertical disparities has
previously been reported by e.g. Burian (1939) and Ogle and Prangen (1953).
Influence of stimulus presentation time
In nearly all the experiments described in the present paper we used tachis
toscopically presented test stimuli with presentation times of 200 msec and
78
random variation of the magnitude and sign of the disparity in successive pre
sentations. This presentation time is short enough to prevent interference from
fusional eye-movements under the applied stimulus conditions, as may be conclu
ded from the finding that the diplopia threshold did not fall when the presen
tation time was decreased from 200 msec to 100 msec and from reported data on
reaction times of fusional eye-movements which show that these movements, if
they occur, start after about 0.2 sec and certainly not before 0.1 sec (West
heimer and Mitchell, 1956) _
A presentation time of 200 msec is, however, not short enough to 'freeze'
the eye-movements, i.e. to prevent displacements of the images of the test sti
mulus on the retinae due to involuntary eye-movements during presentation of
the test stimulus. This can only be accomplished with much shorter presenta
tion times. An important disadvantage of much shorter presentation times is,
however, that they give foveal diplopia thresholds which can often be fully
accounted for by monocular resolution, i.e. the effects of particular interest
to us are completely eliminated under these conditions (Woo, 1974; Woo and
Reading, 1978). This is confirmed by the results of some of our own experi
ments, presented in Fig. 6 and Table 2, using presentation times of 20 msec.
The singleness limit for vertical disparity between dichoptic test lines (sti
mulus of Fig. 1C) then amounts to 1.4' (SD ~ 1.6') which is equal to the
singleness limit for vertical separation between monocular test lines (stimulus
of Fig. 1C, but with both horizontal lines presented to one eye} which amounts
to 1.4' (SD = 0.5')- The dichoptic data just contain more noise.
When the involuntary eye-movements are not frozen, there will be some varia
tion of the fixation disparity due to involuntary eye-movements with a stimu
lus presentation time of 200 msec. This variation was found to be so small
that the subjects did not notice it, either during determination of diplopia
thresholds or during the determination of the fixation disparity by the align
ment meth?d. It was, nevertheless, explicitly taken into account in the deter
mination of both the diplopia thresholds and the distribution of fixation dis
parities by 'sampling' the fixation disparities with the test lines for 200
msec.
79

RESULTS AND DISCUSSION
The diplopia thresholds and alignment data determined using horizontal test li-
nes with vertical disparity or separation are presented in Tables lA and 2A,
and those determined using vertical test lines with horizontal disparity or se-
paration in Tables 1B and 2B.
80
Table lA. Alignment data (in minutes of arc) for horizontal test lines with vertical separation or disparity.
subject AT In ± snln ATix ± sniM p*l snip
ALn 0.6 ± 0.6 0.4 ± 0.25 +0.5 0.5
BdL 0.7 ± 0.6 0.4 ± 0.3 +0.4 0.5
AEHP 1.6 ± 1.2 0.6 ± 0.3 -0.7 1.2
ALn, 20 msec 0.5 ± 0.7 0.5 ± 0.25 +0.6 0.65
*) "+" right eye points to a higher position than left eye
" - " right eye points to a lower position than left eye
Table lB-. Alignment data .(in minutes of arc) for vertical test
lines with horizontal separation or disparity.
subject p**)
ALn 0.7 ± 1.6 0.5 ± 0.35 +5.0 1.6
BdL 1.1 ± 1.7 0.4 ± 0.3 +7.4 1.7
ALD, 20 msec 0.9 ::!: 1.6 0.5 ± 0.3 +5.6 1.6
**) "+"
AT In snln ATIM sniM p
snip
- eyes' convergence 'behind' the fixation stimulus
dichoptic alignment threshold; standard deviation of AT]n; monocular alignment threshold; standard deviation of AT]M; mean fixation disparity; {(SD]nl2- (sn]MJ2}~ ~standard deviation of the di
stribution of fixation disparities.

Table 2A. Thresholds with standard deviations for vertical dis-parity (in minutes of arc) .
subject SL+ ± SD T DT+ ± SD SL- ± SD T DT- ± SD
ALD 3.2 ± 0.9 1 5.0 ± 0.9 -1.4 ± 0.7 1 -2.9 ± 0.7
BdL 4.7 ± 1.4 9.5 ± 0.8 -5.5 ± 2.0 1 -9.9 ± 1.1
AEHP 4.6 ± 3.1 2 7.1 ± 1.8 -6.3 ± 1.9 2 -8.1 ± 2.3
ALD, 20 msec 2.0 ± 1.6 4.8 ± 1.4 -0.8 ± 1.6 1 -3.1 ± 1.6
SL singleness limit;
T transitional percept between SL and DT; DT doubleness threshold; "+" "-"
test line in stimulus for right eye higher than in stimulus for left eye; test line in stimulus for right eye lower than in stimulus for left eye.
Transitional percepts (T) 1: broadening, blur, restlessness
2: subject not able to specify the percept
Table 2b. Thresholds with standard deviations for horizontal disparity (in minutes of arc).
subject SL+ ± SD T DT+ ± SD SL - ± SD T
ALD 1.0 ± o.s*l 2a 7.8 ± 2.2 -1.0 ± 0.5 2b
BdL 0.9 ± 0.6 2a 23 ± 3.3 -4.1 ± 2.0
ALD, 20 msec 6.7 ± 2. 1 1 11.0 ± 2.1 +0.5 ± 2.1 1
SL singleness limit;
T transitional percept between SL and DT; DT doubleness threshold;
-DT
c5.7
-13.0
-2.9
± SD
± 1.6
± 2.4
± 2.5
"+" uncrossed horizontal disparity (equivalent to test line 'behind' the fixation stimulus) ;
,_, crossed horizontal disparity (equivalent to test line 'in front of' the fixation stimulus) .
Transitional percepts (T) 1 : broadening, blur, restlessness
2a: unequivocal singleness, image apparently behind fixation stimulus
2b: unequivocal singleness, image apparently in front of fixation stimulus
*) After a training period, subject ALD virtually lost the percept 'no depth' so that only the percepts 'in front' or 'behind' remained. A 2-alternative
forced-choice procedure showed that this subject could then detect a disparity of 0.2' of arc 50% correctly.
81
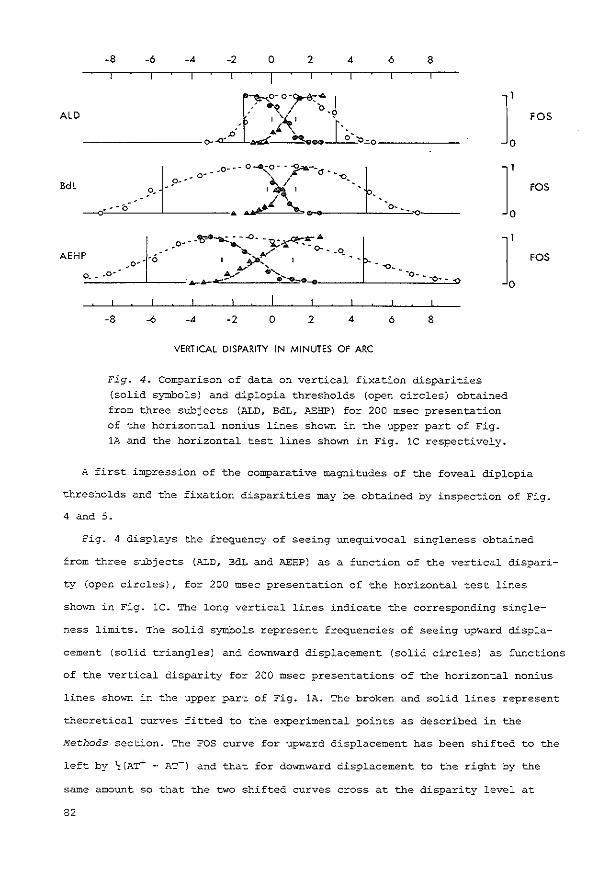
ALD
Bdl
-8 -6 -4 -2 0 2 4 6 8
l~o~9'-~:_J
I '.(_I ' .. £.'""'(, r ..
--------o- ....:(~-_1_£-o~o------ ]0
1
]0
1
]' 0
-8 --6 -4 -2 0 2 4 6 8
VERTICAL DISPARITY IN MINUTES OF ARC
Fig. 4. Comparison of data on vertical fixation disparities (solid symbols) and diplopia thresholds (open circles) obtained from three subjects (ALD, BdL, AEHP) for 200 msec presentation of the horizontal nonius lines shown in the upper part of Fig. lA and the horizontal test lines shown in Fig. lC respectively.
FOS
FOS
FOS
A first impression of the comparative magnitudes of the foveal diplopia
thresholds and the fixation disparities may be obtained by inspection of Fig.
4 and 5.
Fig. 4 displays the frequency of seeing unequivocal singleness obt4ined
from three subjects (ALD, BdL and AEEP) as a function of the vertical dispari-
ty (open circles), for 200 msec presentation of the horizontal test lines
shown in Fig. lC. The long vertical lines indicate the corresponding single-
ness limits. The solid symbols represent frequencies of seeing upward displa-
cement (solid triangles) and downward displacement (solid circles) as functions
of the vertical disparity for 200 msec presentations of the horizontal nonius
lines shown in the upper part of Fig. lA. The broken and solid lines represent
theoretical curves fitted to the experimental points as described in the
Me~hods section. The FOS curve for upward displacement has been shifted to the
left by ~(AT+- AT-) and that for downward displacement to the right by the
same amount so that the two shifted curves cross at the disparity level at
82
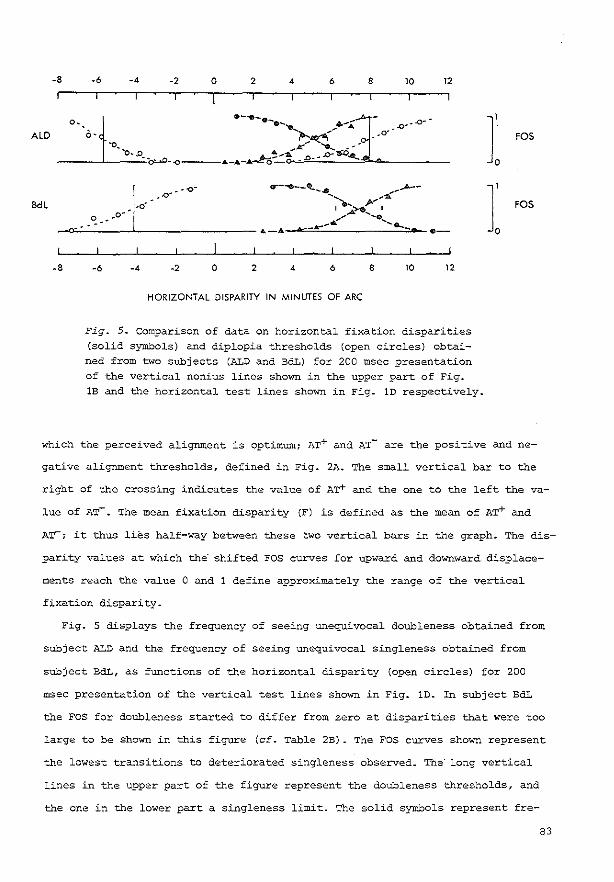
-8
ALD
Bdl
-8
-6 -4 -2 0 2 4 6 8 10 12
-6 -4 -2 0 2 4 6 8 10 12
HORIZONTAL DISPARITY IN MINUTES OF ARC
Pig. 5. Comparison of data on horizontal fixation disparities (solid symbols) and diplopia thresholds (open circles) obtained from two subjects (ALD and BdL) for 200 msec presentation of the vertical nonius lines shown in the upper part of Fig. lB and the horizontal test lines shown in Fig. lD respectively.
I FOS
I FOS
which the perceived alignment is optimum; AT+ and AT- are the positive and ne-
gative alignment thresholds, defined in Fig. 2A. The small vertical bar to the
right of the crossing indicates the value of A~ and the one to the left the va
lue of AT-. The mean fixation disparity (F) is defined as the mean of AT+ and
A~; it thus lies half-way between these two vertical bars in the graph. The dis-
parity values at which the shifted FOS curves for upward and downward displace-
ments reach the value 0 and 1 define approximately the range of the vertical
fixation disparity.
Fig. 5 displays the frequency of seeing unequivocal doubleness obtained from
subject ALD and the frequency of seeing unequivocal singleness obtained from
subject BdL, as functions of the horizontal disparity (open circles) for 200
msec presentation of the vertical test lines shown in Fig. lD- In subject BdL
the FOS for doubleness started to differ from zero at disparities that were too
large to be shown in this figure (cf. Table 2B) _ The FOS curves shown represent
the lowest transitions to deteriorated singleness observed. The long vertical
lines in the upper part of the figure represent the doubleness thresholds, and
the one in the lower part a singleness limit. The solid symbols represent fre-
83

quencies of seeing displacements to the right (solid triangles) and to the left
(solid circles) as a function of the horizontal disparity for 200 msec presen
tation of the vertical nonius lines depicted in the upper part of Fig. lB. The
FOS curves shown have been shifted in such a way that the extreme values of the
horizontal fixation disparities correspond approximately to the disparity va
lues at which the shifted FOS curves for perceived horizontal misalignments
reach the values 0 and 1 (cf. discussion of Fig. 4).
The major conclusions which can be drawn from Fig. 4 and 5 are that the di
plopia thresholds are substantially larger than the range of fixation dispari
ties, that the vertical fixation disparities remain remarkably small, and that
the vertical fixation disparities are much smaller than the horizontal ones.
We will now proceed to a more detailed analysis of the data. The magnitude
of the diplopia thresholds as such will not be discussed, as this has already
been done in a previous paper (Duwaer and Van den Brink, 1981).
Alignment data
It should be noted that the monocular alignment thresholds are not directly
comparable with the vernier acuities. The monocular alignment threshold ('ATIM')
given in Table 1 corresponds to 'false alarm rates' - i.e. the rates at which
physically negative displacements are classified as 'positive displacement' or
vice versa of 2% to 9%, whereas the vernier acuity is usually defined as the
displacement that results in the much larger false alarm rate of 25~ 4 ) .
Inspection of Table 1 shows that the dichoptic alignment threshold ('ATin'l
tends to be larger than the corresponding monocular alignment threshold (ATIMl.
This might indicate an effective threshold for the processing of displacements
between dichoptic nonius lines which is not present in the processing of dis
placements between monocUlar nonius lines. The advantage of the classification
we used in this study with 'undetermined displacement' as the third category
besides 'positive displacement' and 'negative displacement' is that the slopes
of the FOS curves for 'positive displacement' and 'negative displacement' do
not decrease as a result of the threshold, as would be the case without the
third category when the subject is not biased to use one of the two assessment
criteria in case of undetermined displacements. This implies that the effect of
84
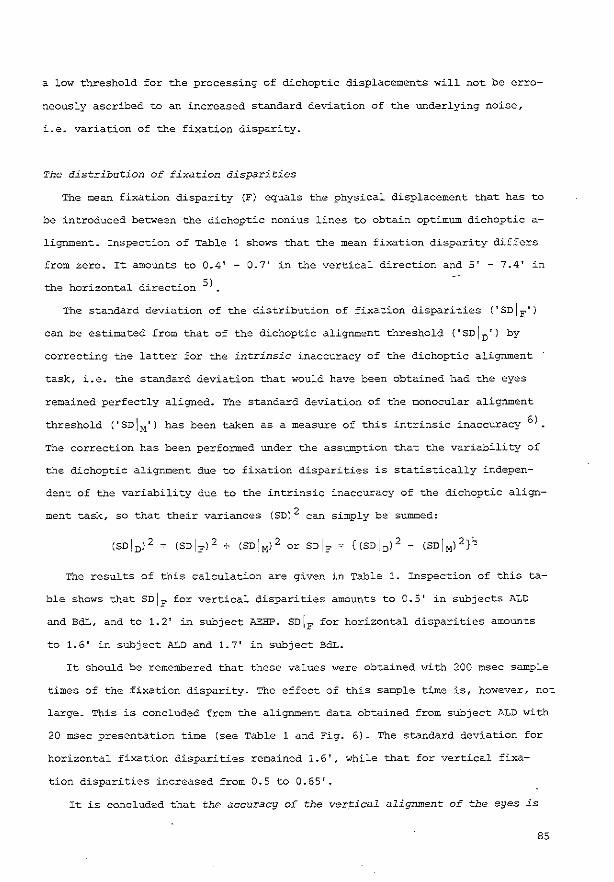
a low threshold for the processing of dichoptic displacements will not be erro
neously ascribed to an increased standard deviation of the underlying noise,
i.e. variation of the fixation disparity.
The distribution of fixation disparities
The mean fixation disparity (F) equals the physical displacement that has to
be introduced betwe2n the dichoptic nonius lines to obtain optimum dichoptic a
lignment. Inspection of Table 1 shows that the mean fixation disparity differs
from zero. It amounts to 0.4' - 0.7' in the vertical direction and 5' - 7.4' in
the horizontal direction S)
The standard deviation of the distribution of fixation disparities ('SD[F')
can be estimated from that of the dichoptic alignment threshold ('SD] 0 ') by
correcting the latter for the intrinsic inaccuracy of the dichoptic alignment
task, i.e. the standard deviation that would have been obtained had the eyes
remained perfectly aligned. The standard deviation of the monocular alignment
threshold ('SD[M') has been taken as a measure of this intrinsic inaccuracy 6 )
The correction has been performed under the assumption that the variability of
the dichoptic alignment due to fixation disparities is statistically indepen
dent of the variability due to the intrinsic inaccuracy of the dichoptic align
ment task, so that their variances (SD) 2 can simply be summed:
The results of this calculation are given in Table 1. Inspection of this ta
ble shows that sn[F for vertical disparities amounts to 0.5' in subjects ALD
and BdL, and to 1.2' in subject AEHP. SD[F for horizontal disparities amounts
to 1.6' in subject ALD and 1.7' in subject BdL.
It should be remembered that these values were obtained with 200 msec sample
times of the fixation disparity. The effect of this sample time is, however, not
large. This is concluded from the alignment data obtained from subject ALD with
20 msec presentation time (see Table 1 and Fig. 6). The standard deviation for
horizontal fixation disparities remained 1.6', while that for vertical fixa
tion disparities increased from 0.5 to 0.65'.
It is concluded that the accuracy of the ver~ical alignment of the eyes is
85
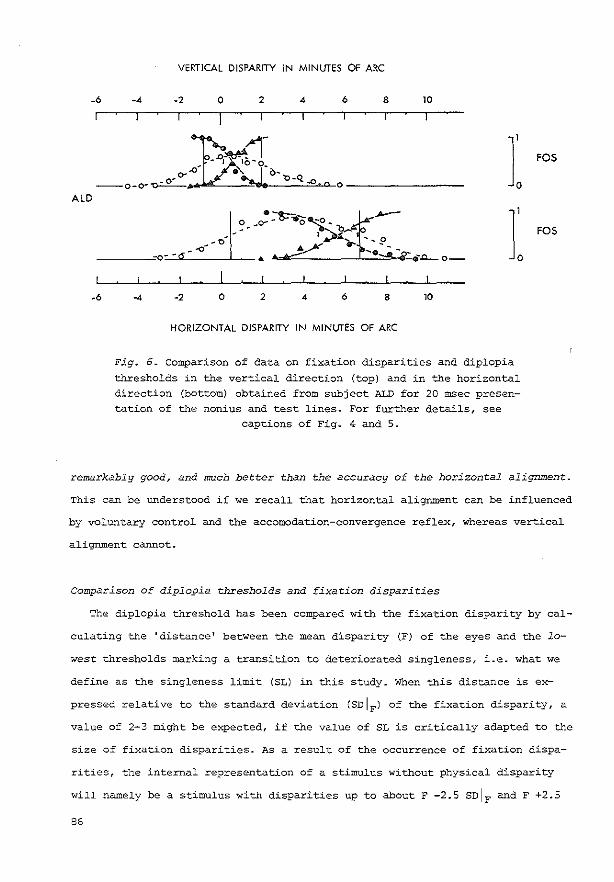
VERTICAL DISPARITY IN MINUTES OF ARC
-A -2 0 2 A 6 8 10
o-""-----o-o-~ ... ~~-
ALD
]10
-6
I -2 0 2 4 6 8 10
HORIZONTAL DISPARITY IN MINUTES OF ARC
Fig. 6. Comparison of data on fixation disparities and diplopia
thresholds in the vertical direction (top) and in the horizontal direction (bottom) obtained from subject ALD for 20 msec presentation of the nonius and test lines. For further details, see
captions of Fig. 4 and 5.
FOS
FOS
remarkably good, and much better than the accuracy of the horizontal alignment.
This can be understood if we recall that horizontal alignment can be influenced
by voluntary control and the accomodation-convergence reflex, whereas vertical
alignment cannot.
Comparison of diplopia thresholds and fixation disparities
The diplopia threshold has been compared with the fixation disparity by cal-
culating the 'distance' between the mean disparity (F) of the eyes and the lo-
west thresholds marking a transition to deteriorated singleness, i.e. what we
define as the singleness limit (SL) in this study. When this distance is ex
pressed relative to the standard deviation (SDipl of the fixation disparity, a
value of 2-3 might be expected, if the value of SL is critically adapted to the
size of fixation disparities. As a result of the occurrence of fixation dispa-
rities, the internal representation of a stimulus without physical disparity
will namely be a stimulus with disparities up to about F -2.5 snip and F +2.5
86

SD[p. Criteria for deteriorated singleness chosen at these disparity values
would therefore lead to a useful interpretation of singleness given the intrin
sic variability of singleness due to variable fixation disparities. However,
the distances found are much larger than 2-3 sn[F-units. For vertical dispari
ties they amount to 3.8- 5.4 in subject ALD, 8.6- 11.8 in subject BdL and
4.5 - 4.8 in subject AEHP. Nevertheless, these diplopia thresholds do show cri
tical adaptation to the overall amount of intrinsic noise present, as can be
seen from the fact that these thresholds, expressed in terms of their own stan
dard deviations, amount to 2.9 for subject ALD, 3.0 for subject BdL and 2.2
for subject AEHP. The diplopia thresholds for horizontal disparities are not
critically adapted to the fixation disparity either: the distances in SD[p
units found here amount to 1.8- 6.7 in subject ALD and 6.8- 9.2 in subject
B~.
It may thus be concluded that the largest fixation disparities occurring due
to restricted alignment accuracy are usually substantially smaller than the fo
veal diplopia thresholds obtained with 0.2 sec presentation time. However, sin
ce the results of a previous study indicate that the foveal diplopia thresholds
tend to fall when the presentation time is increased beyond 0.2 sec (Duwaer and
Van den Brink, 1981), the discrepancy between the actual diplopia threshold and
the minimum diplopia threshold needed to maintain binocular single vision given
the accuracy of ocular alignment might become smaller for continuous observa
tion of the test stimulus.
Inspection of Tables 1 and 2 also shows that the diplopia thresholds of the
subjects BdL and AEHP are larger than those of subject ALD, while only the fi
xation disparities of subject AEHP are larger than those of subject ALD. It
follows that the interindividual variability in the foveal diplopia threshold
cannot always be ascribed to interindividual variability in the fixation dis~
pa:ity.
The influence of fixation disparities on the spread of disparity thresholds
The standard deviations of stereoscopic disparity thresholds based upon the
appearance of relative depth (0.5' - 0.6', see Table 2) are much smaller than
those of the horizontal fixation disparity (1.6' - 1.7', see Table 1).
87

This finding confirms that the accuracy of stereoscopic disparity thresholds
is not influenced by variation in the fixation disparity due to involuntary
eye-movements.
This is, however, hardly surprising when we remember that fixation dispari
ties do not introduce relative disparity which could interfere with the percei
ved relative depth (stereopsis). At most, fixation disparities could be expec
ted to interfere with perceived absolute depth. However, perceived absolute
depth is apparently also subject to a process of sensory stabilization of the
outside world, just like absolute position: the things we see do not appear to
move around, when the totality of images on the retina shifts due to eye-move
ments.
our data support the conclusion that the accuracy of disparity thresholds
based upon the perception of singleness and doubleness, i.e. diplopia thres
holds, is restricted by the variability of the fixation disparity. However,
this is not the only factor involved, as can be inferred from the finding that
the standard deviations of the diplopia threshold are systematically larger
than the corresponding standard deviations of the fixation disparity.
Sensory noise in the disparity domain
The finding that the standard deviation of the diplopia threshold is syste
matically larger than that of the fixation disparity implies that the sensory
processes underlying the diplopia thresholds also introduce a substantial a
mount of noise in the foveal disparity domain. Assuming statistical indepen
dence of fixation disparity and sensory noise, the standard deviation of the
latter can be calculated from that of the diplopia threshold. The results of
this calculation show that the mean standard deviation of the sensory noise a
mounts to 0.6' for vertical disparities and 1.0' for horizontal disparities in
subject ALD, 1.2' for vertical disparities and 2.0' for horizontal disparities
in subject BdL, and 2.0' for vertical disparities in subject AEHP.
The results obtained in subject ALD with presentation times of 20 msec show
that the foveal sensory noise increases when the presentation time of the test
stimulus is reduced. It has been shown in a previous study (Duwaer and Van den
Brink, 1981) that the sensory noise also increases outside the fovea.
88
Retinal stimuli during the determination of diplopia thresholds
The observed range of fixation disparities provides us with information a
bout the stimuli present on the retinae during the determination of diplopia
thresholds.
The most prominent transformation of the physical stimulus during its passa
ge to the retinal stimulus apart from the above-mentioned introduction of noi
se, is the addition of an overall mean horizontal disparity shift of 5' - 7.3'.
The effect of this overall horizontal disparity will be small for the diplo
pia thresholds for vertical disparity, since the test stimulus consisted of ho
rizontal lines that will only be affected effectively by horizontal disparity
near the end-points.
The overall horizontal disparity shift can, however, be expected to have a
large effect on the diplopia threshold for horizontal disparity, since it pro
vides the subject with conflicting cues about the presence of horizontal dis
parity. A test stimulus without relative physical disparity still leads to a
retinal image with substantial absolute disparity. Conversely, a retinal sti
mulus without absolute disparity is only produced by a non-zero relative phy
sical disparity. Moreover, an increase in absolute retinal disparity could in
dicate either an increase or a decrease in relative physical disparity. It
seems evident that the occurrence of these conflicting cues is responsible for
the large difference between the diplopia thresholds for crossed and uncrossed
retinal disparities in subject ALD (see Fig. 5). It should be noted that the
evident effect of relative disparity on the magnitude of the singleness limit
and doubleness threshold is not necessarily conveyed by relative depth, as the
asymmetry also occurred at 20 msec presentation times when relative depth was
only rarely perceived (see Fig. 6 anC Table 2B). The observed interference of
relative disparity with the magnitude of diplopia thresholds based upon abso
lute disparity is in agreement with earlier findings of interference of sur
rounding stimuli with the conspicuity of an absolute disparity (Duwaer and Van
den Brink, 1981).
CONCLUSIONS
-The foveal diplopia thresholds were found to be substantially larger than the
89
minimum diplopia thresholds needed to maintain binocular single vision given
the accuracy of ocular alignment.
-Interindividual variability in the foveal diplopia threshold was found to be
not always caused by interindividual variability in the size of fixation dispa-
rities.
-The accuracy of vertical alignment of the eyes is remarkably high which implies
that there is hardly any need for sensory tolerance to foveal vertical dispari-
ties.
ACKNOWLEDGEMENTS.
We would like to thank G.J. van der Wildt, A.E.H. Peters and C.M.M. de Weert for helpful discussions, C.J. Keemink and J.B.P. van Deursen for their technical assistance, R.H. Bathgate for improving the English, and the Netherlands Organization for the Advancement of Pure Research (ZWO) for financial support.
REFERENCES
Burian H.M. {1939) Fusional movements. Archs. Ophthal.21, 486-491. Crone R.A. and Everhard-Halm Y. {1975) Optically induced eye torsion. Albrecht
v. Graefes Archiv fUr Klin. und Exp. Ophthal. 195, 231-239. Ditchburn R.W. and Ginsberg B.L. {1953) Involuntary eye movements during fixa
tion. J. Physiol. London 119, 1-17. Duwaer A.L. and Brink G. van den {1981) ~{hat is the diplopia threshold? Percep
tion & Psychophysics 29, 295-309. Fender D. and Julesz B. {1967) Extension of Panum's area in binocularly stabi
lized vision. J.Q.S.A. 57, 819-830. Hebbard F.W. {1362) Comparison of subjective and objective measurements of fi
xation disparity. J.O.S.A. 52, 706-712. Krauskopf J., Cornsweet T. and Riggs L. {1960) Analysis of eye movements during
monocular and binocular fixation. J.O.S.A. 50, 572-578. Ogle K.N., Mussey F. and Prangen A.deH. (1949) Fixation disparity and the fusio
nal processes in binocular single vision. Am. J. Ophthal. 32, 1069-1087.
Ogle K.N. and Prangen A.deH. {1953) Observations on vertical divergences and
hyperphorias. Archs. Ophthal. 49, 313-334. Palmer D.A. (1961) Measurement of the horizontal extent of Panum's area by a
method of constant stimuli. Optica Acta 8, 151-159. Perlmutter A.L. and Kertesz A.E. (1978) Measurement of human vertical fusional
response. Vision Research 18, 219-223. Riggs L.A. and Niehl E.W. (1960) Eye movements recorded during convergence and
divergence. J.o.s.A. 50, 913-920. Riggs L.A. and Ratliff J. (1951) visual acuity and the normal tremor of thee
yes. Science 114, 17. Westheimer G. and Hauske G. (1975) Temporal and spatial interference with ver-
90
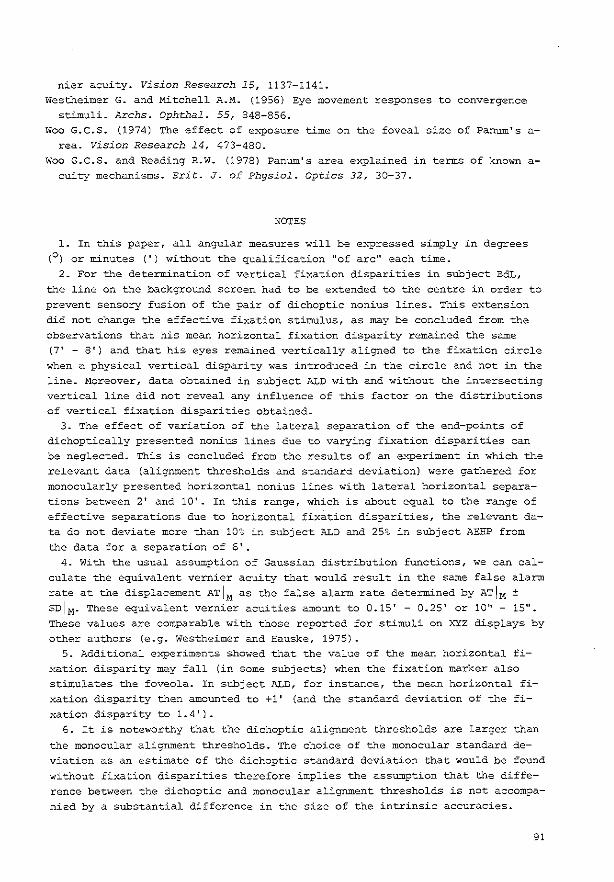
nier acuity. Vision Research 15, 1137-1141.
Westheimer G. and Mitchell A.M. (1956) Eye movement responses to convergence stimuli. Archs. Ophtha1. 55, 848-856.
Woo G.C.S. (1974) The effect of exposure time on the foveal size of Panum's area. Vision Research 14, 473-480.
Woo G.C.S. and Reading R.W. (1978) Panum's area explained in terms of known acuity mechanisms. Brit. J. of Physiol. Optics 32, 30-37.
NOTES
1. In this paper, all angular measures will be expressed simply in degrees (0 ) or minutes (') without the qualification "of arc" each time.
2. For the determination of vertical fixation disparities in subject BdL, the line on the background screen had to be extended to the centre in order to prevent sensory fusion of the pair of dichoptic nonius lines. This extension did not change the effective fixation stimulus, as may be concluded from the observations that his mean horizontal fixation disparity remained the same (7' - 8') and that his eyes remained vertically aligned to the fixation circle when a physical vertical disparity was introduced in the circle and not in the line. Moreover, data obtained in subject ALD with and without the intersecting vertical line did not reveal any influence of this factor on the distributions of vertical fixation disparities obtained.
3. The effect of variation of the lateral separation of the end-points of dichoptically presented nonius lines due to varying fixation disparities can be neglected. This is concluded from the results of an experiment in which the relevant data (alignment thresholds and standard deviation) were gathered for monocularly presented horizontal nonius lines with lateral horizontal separations between 2' and 10'. In this range, which is about equal to the range of effective separations due to horizontal fixation disparities, the relevant data do not deviate more than 10% in subject ALD and 25% in subject AEHP from the data for a separation of 6'.
4. With the usual assumption of Gaussian distribution functions, we can calculate the equivalent vernier acuity that would result in the same false alarm rate at the displacement AT[M as the false alarm rate determined by AT[M ±
sn[M- These equivalent vernier acuities amount to 0.15'- 0.25' or 10"- 15".
These values are comparable with those reported for stimuli on XYZ displays by other authors (e.g. westheimer and Hauske, 1975).
5. Additional experiments showed that the value of the mean horizontal fixation disparity may fall (in some subjects) when the fixation marker also stimulates the foveola. In subject ALD, for instance, the mean horizontal fixation disparity then amounted to +1' (and the standard deviation of the fixation disparity to 1.4').
6. It is noteworthy that the dichoptic alignment thresholds are larger than
the monocular alignment thresholds. The choice of the monocular standard deviation as an estimate of the dichoptic standard deviation that would be found without fixation disparities therefore implies the assumption that the difference between the dichoptic and monocular alignment thresholds is not accompanied by a substantial difference in the size of the intrinsic accuracies.
91
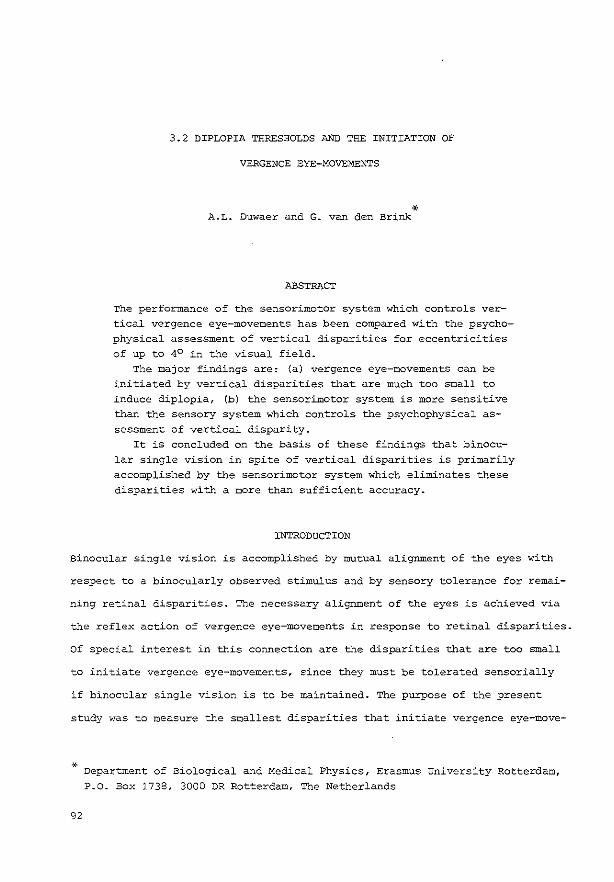
3.2 DIPLOPIA THRESHOLDS AND THE INITIATION OF
VERGENCE EYE-MOVEMENTS
* A.L. Duwaer and G. van den Brink
ABSTRACT
The performance of the sensorimotor system which controls vertical vergence eye-movements has been compared with the psychophysical assessment of vertical disparities for eccentricities of up to 4° in the visual field.
The major findings are: (a) vergence eye-movements can be initiated by vertical disparities that are much too small to induce diplopia, (b) the sensorimotor system is more sensitive than the sensory system which controls the psychophysical assessment of vertical disparity.
It is concluded on the basis of these findings that binocular single vision in spite of vertical disparities is primarily accomplished by the sensorimotor system which eliminates these disparities with a more than sufficient accuracy.
INTRODUCTION
Binocular single vision is accomplished by mutual alignment of the eyes with
respect to a binocularly observed stimulus and by sensory tolerance for remai-
ning retinal disparities. The necessary alignment of the eyes is achieved via
the reflex action of vergence eye-movements in response to retinal disparities.
Of special interest in this connection are the disparities that are too small
to initiate vergence eye-movements, since they must be tolerated sensorially
if binocular single vision is to be maintained. The purpose of the present
study was to measure the smallest disparities that initiate vergence eye-move-
-l<- Department of Biological and Medical Physics, Erasmus University Rotterdam, P.O. Box 1738, 3000 DR Rotterdam, The Netherlands
92

ments and to compare them with the smallest disparities that result in diplo
pia {i.e. disruption of binocular single vision) and the smallest disparities
that can be detected by the sensory system which controls the assessment of
singleness of binocular vision.
This study extends the analysis given in a previous study of the relation
between the sensorimotor system controlling vergence eye-movements and the sen
sory system controlling the psychophysical assessment of disparities (Duwaer
and Van den Brink, 1981b). This earlier study was based on comparison of fo
veal diplopia thresholds and the accuracy of alignment of the eyes during con
tinuous observation of a fixation stimulus.
The relation between the sensory system and the sensorimotor system is ana
lysed here on the basis of threshold data obtained in a yes-no psychophysical
procedure (Experiment 1) commonly used to determine diplopia thresholds, and
threshold data obtained in a discrimination task (Experiment 2) which is ideal
for the determination of detection thresholds. Stimuli with vertical disparity
were used in this study because vergence eye-movements in response to vertical
disparity are not subject to interference from voluntary control and the accom
modation-convergence reflex as may be the case for vergence eye-movements in
response to horizontal disparity (Ellerbrock, 1949; Ogle and Prangen, 1953;
Crone, 1973; Houtman, 1979), and to avoid interference from stereoscopic depth
effects. The data for the present study were collected for a situation in which
the sensorimotor system controlling vergence eye-movements was allowed ample
time to operate (2 sec), while the visual stimuli with disparity which were
presented were of adequate contour length. These experimental conditions were
chosen to eliminate the effect of spurious stimuli in the visual field that
could also activate the sensorimotor system, to allow for the slowness of ver
gence eye-movements in response to vertical disparities (Perlmutter and
Kertesz, 1978) and to simulate day-to-day visual conditions reasonably close
ly.
The occurrence of vergence eye-movements in response to vertical disparity
was determined by a subjective alignment method in which the subject had to
judge the alignment of two dichoptic nonius lines. The perceived misalignment
for physically aligned nonius lines is generally accepted to be equal to the
93
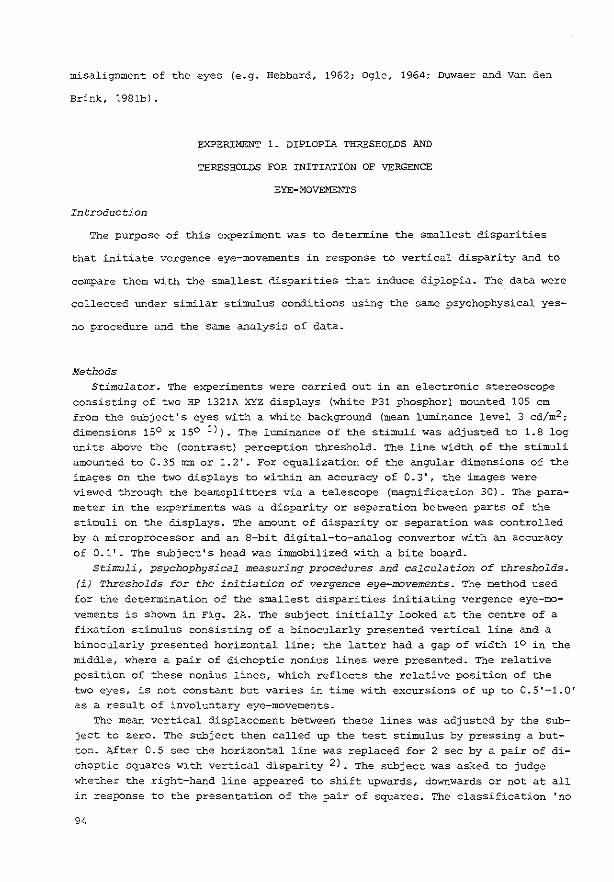
misalignment of the eyes (e.g. Hebbard, 1962; Ogle, 1964; Duwaer and Van den
Brink, 1981b).
EXPERIMENT 1. DIPLOPIA THRESHOLDS AND
THRESHOLDS FOR INITIATION OF VERGENCE
EYE-MOVEMENTS
Introduction
The purpose of this experiment was to determine the smallest disparities
that initiate vergence eye-movements in response to vertical disparity and to
compare them with the smallest aisparities that induce diplopia. The_ data were
collected under similar stimulus conditions using the same psychophysical yes-
no procedure and the same analysis of data.
Methods Stimulator. The experiments were carried out in an electronic stereoscope
consisting of two HP 1321A XYZ displays (white P31 phosphorl mounted 105 em
from the subject's eyes with a white background (mean luminance level 3 cd/m2; dimensions 150 x 150 1)). The luminance of the stimuli was adjusted to 1.8 log
units above the (contrast} perception threshold. The line width of the stimuli amounted to 0.35 mm or 1.2'. For equalization of the angular dimensions of the
images on the two displays to within an accuracy of 0.3', the images were viewed through the beamsplitters via a telescope (magnification 30). The para
meter in the experiments was a disparity or sepa.ration between parts of the
stimuli on the displays. The amount of disparity or separation was controlled by a microprocessor and an 8-bit digital-to-analog convertor with an accuracy
of 0.1'. The subject's head was immobilized with a bite board.
Stimuli, psychophysical measuring procedures and calculation of thresholds. (i) Thresholds for the initiation of vergence eye-movements. The method used
for the determination of the smallest disparities initiating vergence eye-mo
vements is shown in Fig. 2A. The subject initially looked at the centre of a fixation stimulus consisting of a binocularly presented vertical line and a
binocularly presented horizontal line; the latter had a gap of width 10 in the
middle, where a pair of dichoptic nonius lines were presented. The relative position of these nonius lines, which reflects the relative position of the
two eyes, is not constant but varies in time with excursions of up to 0.5'-1.0' as a result of involuntary eye-movements.
The mean vertical displacement between these lines was adjusted by the subject to zero. The subject then called up the test stimulus by pressing a but
ton. After 0.5 sec the horizontal line was replaced for 2 sec by a pair of dichoptic squares with vertical disparity 2). The subject was asked to judge
whether the right-hand line appeared to shift upwards, downwards or not at all
in response to the presentation of the pair of squares. The classification 'no
94
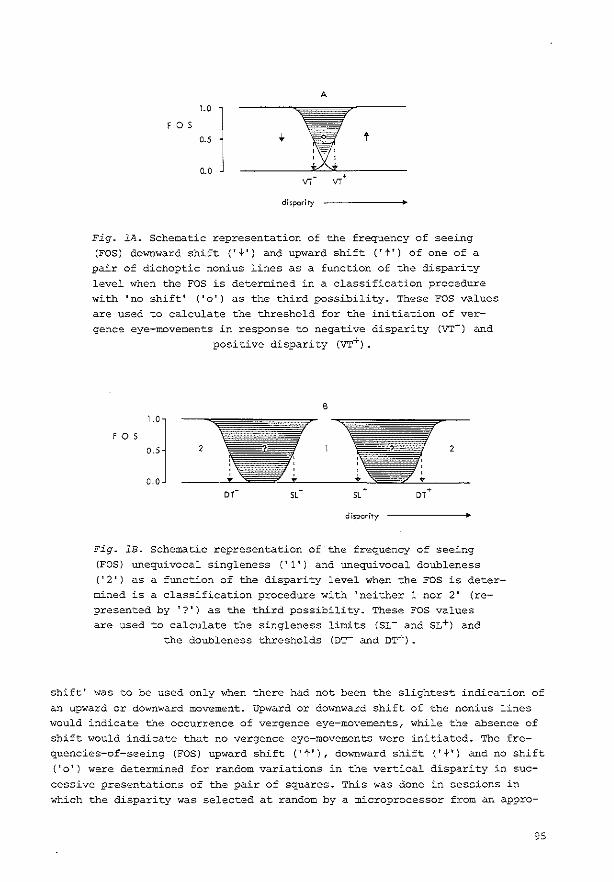
A
t f 0 s LO I
o.s
0.0
disparity
Fig. lA. Schematic representation of the frequency of seeing {FOS) downward shift ('~') and upward shift ('t') of one of a pair of dichoptic nonius lines as a function of the disparity level when the FOS is determined in a classification procedure with 'no shift' ('o') as the third possibility. These FOS values
are used to calculate the threshold for the initiation of vergence eye-movements in response to negative disparity (VT-) and
positive disparity (VT+).
B
f 0 s 2
Fig. lB. Schematic representation of the frequency of seeing (FOS) unequivocal singleness ('1') and unequivocal doubleness {'2') as a function of the disparity level when the FOS is determined is a classification procedure with 'neither 1 nor 2' (represented by '?') as the third possibility. These FOS values are used to calculate the singleness limits (SL- and sL+) and
the doubleness thresholds (Dr and D~) .
shift' was to be used only when there had not been the slightest indication of
an upward or downward movement. Upward or downward shift of the nonius lines would indicate the occurrence of vergence eye-movements, while the absence of shift would indicate that no vergence eye-movements were initiated. The frequencies-of-seeing {FOS) upward shift ('t'), downward shift ('+') and no shift ('o') were determined for random variations in the vertical disparity in suc
cessive presentations of the pair of squares. This was done in sessions in which the disparity was selected at random by a microprocessor from an appro-
95
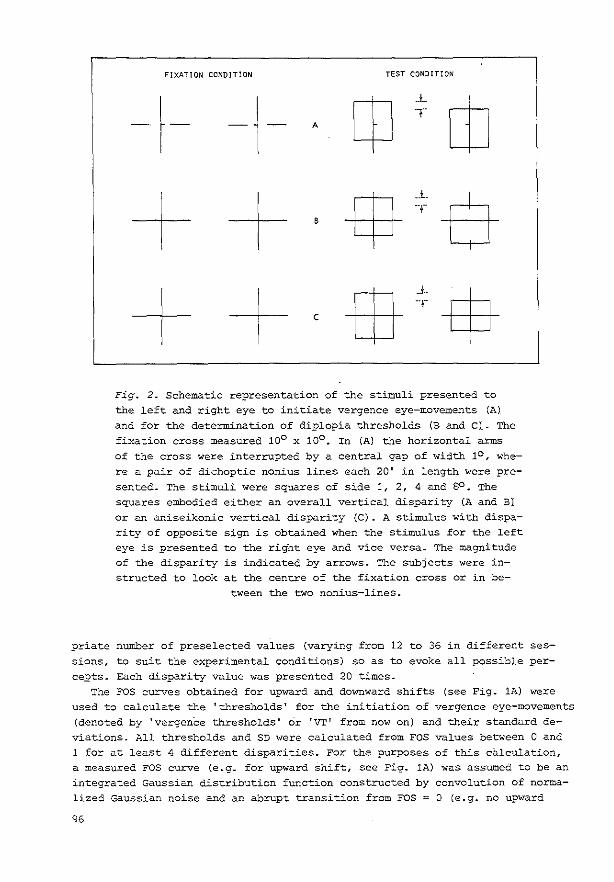
FIXATION CONDITION
t- -i ++ ++
A
B
c
TEST CONDITION
Jj]_ _j_ __cb_ LjJ T -cp-
Fig. 2. Schematic representation of the stimuli presented to the left and right eye to initiate vergence eye-movements (A)_ and for the determination of diplopia thresholds (Band CI. The fixation cross measured 10° x 10°. In (A) the horizontal arms of the cross were interrupted by a central gap of width 1°, where a pair of dichoptic nonius lines each 20' in length were presented. The stimuli were squares of side 1, 2, 4 and SO. The squares embodied either an overall vertical disparity (A and BI or an aniseikonic vertical disparity (C). A stimulus with disparity of opposite sign is obtained when the stimulus for the left eye is presented to the right eye and vice versa. The magnitude of the disparity is indicated by arrows. The subjects were instructed to look at the centre of the fixation cross or in be-
tween the two nonius-lines.
priate number of preselected values (varying from 12 to 36 in different sessions, to suit the experimental conditions) so as to evoke all possible percepts. Each disparity value was presented 20 times.
The FOS curves obtained for upward and downward shifts (see Fig. lA) were used to calculate the 'thresholds' for the initiation of vergence eye-movements (denoted by 'vergenCe thresholds' Or 'VT' from now on) and their standard deviations. All thresholds and SD were calculated frQm FOS values between 0 and 1 for at least 4 different disparities. For the purposes of this calculation, a ~easured FOS curve (e.g. for upward shift, see Fig. lA) was assumed to be an integrated Gaussian distribution function constructed by convolution of normalized Gaussian noise and an abrupt transition from FOS ~ 0 (e.g. no upward
96

2A. 2 = 28, 160 m>K 2fl, 0.,4' or 0.8' OK _,
2C, 2""' 0
30 ACD
·r ACD 30 MMR 30 AEMR
VT, SL VT, OT VT, SL VT, DT
~ ' 20 20 20 20
-'
·-
.%r.k~ A , <
.~:!1:// 0
] [I ~
1 /"
~l;l TT10
T, : " RO
f~/ RO
~ 1--A r ; IV/ 1/
~r ~::1 'i/
l.-l-1--l LI ' L.l_L___l I-Ll--l . . 0 ' 0 2 ' 0 ' 0 2 A
eCC<mtTicfty in dog""'' of ore
A B c D
Fig. 3. Various thresholds for vertical disparity, plotted as functions of the eccentricity of the horizontal sides of the squares with vertical disparity. The thresholds for the initiation of vergence eye-movements (VT) for 2-sec presentation of overall vertical disparity (stimulus of Fig. 2A) are indicated by solid triangles, the diplopia thresholds obtained with 160-
msec presentation of overall vertical disparity (stimulus of Fig. 2B) by open circles, the diplopia thresholds obtained with
slowly changing overall vertical disparity (stimulus of Fig. 2Bl by solid circles and the diplopia thresholds obtained with 2-sec presentation of aniseikonic vertical disparity (stimulus of Fig. 2C) bY solid squares. The singleness limits (SL: A and C) and ~e doubleness thresholds (DT: B and D) were obtained from the highly practised subject ALD (A and B) and from the untrained subject AEMR (C and D). The length of the vertical bars is equal
to the SD for the threshold in question.
shifts at all) to FOS ~ 1 (e.g. always an upward shift). The disparity at which this transition occurs was defined to be the threshold (i.e. VT+ in the present example) with the SD of the fitted Gaussian noise as its SD. The SE of the thresholds are a factor 5 smaller than these SD. The means of VT- for downward displacement and VT+ for upward displacement for squares of side 1, 2, 4 and go are plotted in the Figs. 3A, 3B, 3C and 3D as solid triangles, as a function of the eccentricity of the horizontal sides of the squares with ver-
97

tical disparity. (ii) Diplopia thresholds. In order to compare thresholds for the initia
tion of vergence eye-movements with the diplopia thresholds that would have been found if vergence eye-movements had not occurred, we had to change the stimulus conditions so as to prevent vergence eye-movements from influencing the diplopia thresholds. This was done by extending the horizontal fixation line into the central 1° gap and keeping it continuously visible and by presenting the squares in one of the three following ways:
(a) Tachistoscopically, with presentation times of 160 msec which is less than the reaction time of vergence eye-movements (Westheimer and Mitchell, 1956) and less than the 2-sec presentation time used for the determination of vergence thresholds (see Fig. 2B).
(b) Continuously, with a gradual change in the vertical disparity of 0.4'/ sec for the 1 and 2° squares and (in order to speed up the experiment) of 0.8'/ sec for the 4 and 8° squares (see Fig. 2B). Under these conditions the horizontal fixation line was found to be capable of preventing vergence eye-movements in response to the vertical disparity in the squares. It may be noted that the presentation time in this mode is greater than the value of 2 sec used for the determination of vergence thresholds.
(c) Tachistoscopically, with the same presentation time (2 sec) as for the determination of vergence thresholds. Interference from vergence eye-movements was avoided in this case by presenting the disparities in the upper and lower sides of the squares not with the same sign (resulting in 'overall' vertical disparity; see Fig. 2B) but with opposite signs (resulting in 'aniseikonic' vertical disparity; see Fig. 2C). When the subject looks at the centre of the squares with aniseikonic vertical disparity, vergence eye-movements do not occur at all in response to the disparity in the horizontal sides. Qualitative observations indicated that the percept of a pair of squares with overall vertical disparity did not differ from that of the same pair of squares with aniseikonic vertical disparity.
The subject was asked to look at the centre of the fixation stimulus and to classify the percept evoked by the pair of squares (see Fig. 1B) as either unequivocally single ('1': the perceived square shows no disparity), unequivocally double ('2': two overlapping squares with a separation between the corresponding horizontal sides) or neither of these ('?': one square is seen, the horizontal sides of which exhibit blurring, broadening, 'restlessness' and percepts resembling those found in binocular rivalry). In the cases with ta
chistoscopic presentation (a) and (c) above the frequencies of seeing unequivocal singleness (1), unequivocal doubleness (2) and neither unequivocal singleness nor unequivocal doubleness (?) were determined with random variation in the vertical disparity in successive presentations as described above for t~e determination of the vergence thresholds. When the test stimulus was
presented continuously, the FOS values were determined in 20 runs with a gradual increase in disparity and in 20 runs with a gradual decrease in disparity, while the subject looked at the central 1° of the horizontal fixation line, varied the fixation position slightly in order to prevent fading of the dichoptic squares and kept pressing a button as long as the percept of the
98

squares was neither unequivocally single nor unequivocally double.
The FOS curves obtained for unequivocal singleness and unequivocal doubleness (see Fig. 1B) were used to calculate upper and lower limits for 'the' diplopia threshold, and their SD. All thresholds and SD were calculated from FOS values between 0 and 1 for at least 4 different disparities, on the assumption that the observed FOS curves for singleness and doubleness are convolutions of normalized Gaussian noise and hypothetical regions of disparities where one of the three image classes is always seen. The disparity at which unequivocal singleness ends after deconvolution will be called the singleness limit ('SL': see Fig. 1B) and the disparity at which unequivocal doubleness starts the doubleness threshold ('DT': see Fig. 1B) from now on. The thresholds plotted in Fig. 3 are the means of those obtained at positive and negative disparities and (in the case of continuous presentation of the stimulus), also the means of the thresholds obtained with increasing and decreasing disparity. The SE of th~ thresholds are a factor 5 less than the SD. The thresholds obtained with 160-msec presentation of squares with overall vertical disparitJ are indicated in Fig. 3A, 3B, 3C and 3D by open circles, those obtained with continuous presentation of squares with overall vertical disparities are represented by solid circles and those obtained with 2-sec presentation of squares with aniseikonic vertical disparity by solid squares.
Results and discussion
The data presented in Fig. 3A and B were obtained frOm a highly practised sub
ject (ALD, one of the authors, corrected myope: left and right eye -0.75D 3))
and those in the Figs 3C and 3D from a subject without any training in the per-
formance of such visual tasks (AEMR, emmetropic) •
The threshold for the initiation of vergence eye-movements (VT) is plotted
in Fig. 3A, B, C and D (solid triangles) as a function of the eccentricity of
the sides of the square with disparity. It will be seen that this threshold
is roughly constant at 1' for all eccentricities, with a SD of less than 0.8'.
It is noteworthy that the centre of the region bounded by VT- and VT+ lies at
the non-zero disparity of -0.8' (square presented to right eye 0.8' lower than
that for left eye) for subject ALD and of -0.5' for subject AEMR, indica-
ting that the sensorimotor system operates with reference to small non-zero
fixation disparities. The remarkably small value of the vergence thresholds
agrees with the finding of Burian (1939) that the eyes can align to stimuli
at eccentricities of up to 12° in the visual field. Comparison of the vergence
threshold and its SD shows that the region of disparities bounded by VT- and
VT+ where the subject did not see disparity-induced changes in the alignment
99
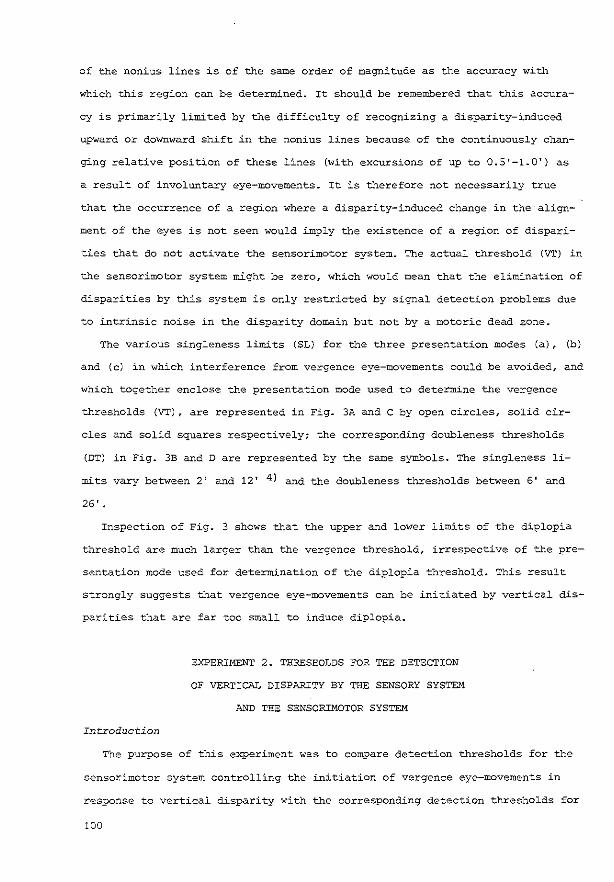
of the nonius lines is of the same order of magnitude as the accuracy with
which this region can be determined. It should be remembered that this accura
cy is primarily limited by the difficulty of recognizing a disparity-induced
upward or downward shift in the nonius lines because of the continuously chan
ging relative position of these lines (with excursions of up to 0.5'-1.0') as
a result of involuntary eye-movements. It is therefore not necessarily true
that the occurrence of a region where a disparity-induced change in the align
ment of the eyes is not seen would imply the existence of a region of dispari
ties that do not activate the sensorimotor system. The actual threshold (VT) in
the sensorimotor system might be zero, which would mean that the elimination of
disparities by this system is only restricted by signal detection problems due
to intrinsic noise in the disparity domain but not by a motoric dead zone.
The various singleness limits (SL) for the three presentation modes (a), (b)
and (c) in which interference from vergence eye-movements could be avoided, and
which together enclose the presentation mode used to determine the vergence
thresholds (VT), are represented in Fig. 3A and C bY open circles, solid cir
cles and solid squares respectively; the corresponding doubleness thresholds
(DT) in Fig. 3B and D are represented by the same symbols. The singleness li
mits vary between 2' and 12' 4 ) and the doubleness thresholds between 6' and
26'.
Inspection of Fig. 3 shows that the upper and lower limits of the diplopia
threshold are much larger than the vergence threshold, irrespective of the pre
sentation mode used for determination of the diplopia threshold. This result
strongly suggests that vergence eye-movements can be initiated by vertical dis
parities that are far too small to induce diplopia.
Introduction
EXPERIMENT 2. THRESHOLDS FOR TEE DETECTION
OF VERTICAL DISP~TY BY THE SENSORY SYSTEM
AND THE SENSORIMOTOR SYSTEM
The purpose of this experiment was to compare detection thresholds for the
sensorimotor system controlling the initiation of vergence eye-movements in
response to vertical disparity with the corresponding detection thresholds for
100
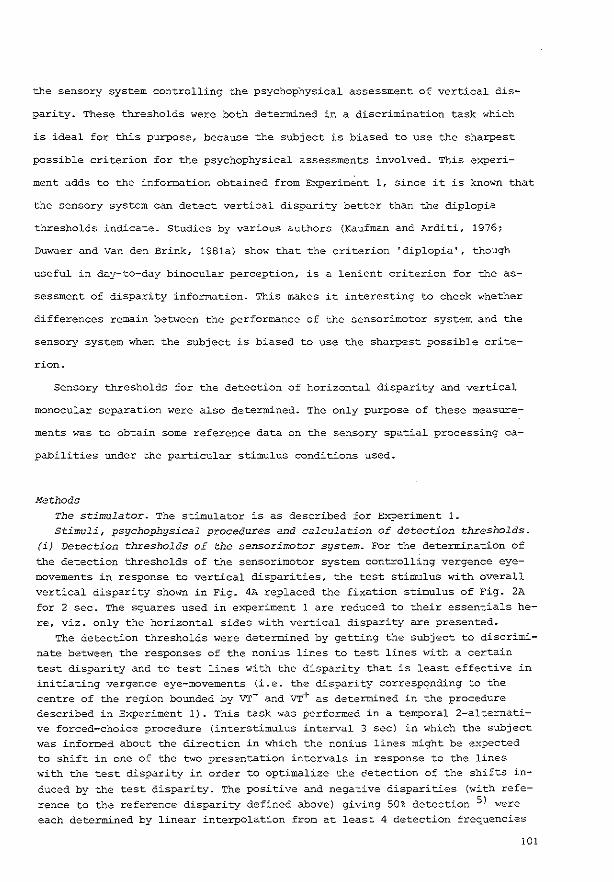
the sensory system controlling the psychophysical assessment of vertical dis-
parity. These thresholds were both determined in a discrimination task which
is ideal for this purpose, because the subject is biased to use the sharpest
possible criterion for the psychophysical assessments involved. This experi-
ment adds to the information obtained from Experiment 1, since it is known that
the sensory system can detect vertical disparity better than the diplopia
thresholds indicate. Studies by various authors (Kaufman and Arditi, 1976;
Duwaer and Van den Brink, 1981a) show that the criterion 'diplopia', though
useful in day-to-day binocular perception, is a lenient criterion for the as-
sessment of disparity information. This makes it interesting to check whether
differences remain between the performance of the sensorimotor system and the
sensory system when the subject is biased to use the sharpest possible crite-
rion.
Sensory thresholds for the detection of horizontal disparity and vertical
monocular separation were also determined. The only purpose of these measure-
ments was to obtain some reference data on the sensory spatial processing ca-
pabilities under the particular stimulus conditions used.
Methods
The stimulator. The stimulator is as described for Experiment 1. Stimuli, psychophysical procedures and calculation of detection thresholds.
(i) Detection thresholds of the sensorimotor system. For the determination of
the detection thresholds of the sensorimotor system controlling vergence eyemovements in response to vertical disparities, the test stimulus with overall vertical disparity shown in Fig. 4A replaced the fixation stimulus of Fig. 2A for 2 sec. The squares used in experiment 1 are reduced to their essentials here, viz. only the horizontal sides with vertical disparity are presented.
The detection thresholds were determined by getting the subject to discriminate between the responses of the nonius lines to test lines with a certain
test disparity and to test lines with the disparity that is least effective in initiating vergence eye-movements (i.e. the disparity corresponding to the centre of the region bounded by VT- and VT+ as determined in the procedure described in Experiment 1). This task was performed in a temporal 2-alternative forced-choice procedure (interstimulus interval 3 sec) in which the subject was informed about the direction in which the nonius lines might be expected to shift in one of the two presentation intervals in response to the lines with the test disparity in order to optimalize the Detection of the shifts in
duced by the test disparity. The positive and negative disparities (with reference to the reference disparity defined above) giving 50% detection S) were each determined by linear interpolation from at least 4 detection frequencies
101

A t
Fig. 4. Schematic representation of the test stimuli used for determination of the thresholds for: initiation of vergence eyemovements (A); detection of vertical disparity (Band C); detection of monocular vertical separation (D and E) ; detection of horizontal disparity (F and G) .
The distance between the two test lines (without disparity or separation) was equal to their length and amounted to 1, 2, 4 or go_ Stimuli D-G were only used to obtain some reference data serving as measures of the capabilities of sensory processing
under the particular experimental condit±ons used.
between 0.00 and 1.00 that were each determined from 50 trials. The mean result is indicated in Fig. SA, SB and Sc by solid triangles. The SE of these thresholds is a factor 10 smaller than the thresholds themselves.
(ii) Sensory thresholds for the detection ?f vertical disparity. For the determination of the detection thresholds of the sensory system controlling the
psychophysical assessment of vertical disparity, the test stimulus with aniseikonic vertical disparity shown in Fig. 4C replaced the fixation stimulus of Fig. 2B fer 2 sec. Aniseikonic vertical disparity was used to prevent vergence eye-movements from interfering with the results. In addition the sensory detection thresholds for 160-msec presentation of aniseikonic vertical disparity (see Fig. 4C) were compared with the sensory detection thresholds for 160-msec presentation of the overall vertical disparity (see Fig. 4B) used to determine
102

o 4B, 160 msec
1J 4C, 160 mwc . 4(D,E)
12 ~0 • 4A l • 4C, 2 ~0 44A •4G2sec
5 .t. 4A, 2 sec 5 0 4(D,E), gop 5 o 4F
0
' '0 e 4 ' 4 4 . ' ,.
'i ' ., '· ~~· ·' 3 ' ' 3 3 ' ' • ~
' o:
0 ' o'
"' o' • " 2 ' 2 2 'o 0
~ 0
' 0 • . • ~ 1 . •' ~ • ,-' .olD ..------· ·-·· ~ ·-""--:6 ... - ...-.t.-:::5 ::- .:·--:..-..:lib
10"-~--
0 2 4 0 2 4 0 2 4
ec:centric:ity in degre~ of ore
A B c Fig. 5. Detection thresholds (for 50% correct detection) obtained from subject ALD in the temporal 2-alternative forced-choice procedure, plotted as functions of the eccentricity of the lines with disparity or separation. The 50% detection thresholds for
the initiation·of vergence eye-movements in response to overall vertical disparity (stimulus of Fig. 4A) are indicated in A, B and C by solid triangles.
In A, the solid squares indicate the detection thresholds for 2-sec presentation of aniseikonic vertical disparity (stimulus of Fig. 4C), the open squares the thresholds for 160-msec presentation of aniseikonic vertical disparity (stimulus of Fig. 4C) and the open circles the thresholds for 160-msec presentation of overall vertical disparity (stimulus of Fig. 4B).
In B, the solid squares indicate mean, monocular thresholds for 2-sec presentation of monocular vertical separation (stimuli of Fig. 4D and E), with overlapping lines (2 lines without separation between the midpoints) as reference stimulus and the open circles indicate mean monocular thresholds with adjacent lines (2 lines with a separation equal to the line width) as reference stimulus.
In c, the open circles indicate the thresholds for 2-sec presentation of overall horizontal disparity (stimulus of Fig. 4F)
and the solid squares the thresholds for 2-sec presentation of aniseikonic horizontal disparity (stimulus of Fig. 4G).
The data in B and C are presented only to provide some reference data serving as a measure of the capabilities of sensory processing under the particular experimental conditions used.
103

the detection thresholds of the sensorimotor system, in order to check whether these different types of stimuli yield identical thresholds when vergence eye
movements do not interfere with the results. The detection thresholds were determined by getting the subject to discri
minate between test lines with and without disparity in a temporal 2-alternative forced-choice procedure (interstimulus interval 3 sec). The positive and negative disparities giving 50% detection were each determined by linear interpolation from at least 4 detection frequencies between 0.00 and 1.00 that were each determined from 50 trials. The mean result is indicated in Fig. SA by so
lid squares for 2-sec presentation of aniseikonic vertical disparity; by open squares for 160-msec presentation of aniseikonic vertical disparity and by open circles for 160-msec presentation of overall vertical disparity.
(iii) Sensory thresholds for the de~ec~ion of monocular ver~ical separation.
For the determination of the sensory detection thresholds for monocular vertical separation, the test stimuli shown in Fig. 4D and E replaced the fixation stimulus of Fig. 2B for 2 sec.
The detection thresholds were determined by getting the subject to discriminate between test lines with and without separation in a temporal 2-alternative forced-choice procedure (interstimulus interval 3 sec). The separations giving SO% detection in the left eye (stimulus of Fig. 4D) and in the right eye (stimulus of Fig. 4E) were each determined by linear interpolation from at least 4 detection frequencies between 0.00 and 1.00 that were each determined from 50 trials. The mean result is indicated in Fig. SB by solid squares.
Detection thresholds were also determined by getting the subject to discriminate between test lines with a separation of 1.2' (equal to line width) and test l~nes with a larger separation. The mean value of the separations giving 50% detection in the left eye and right eye is indicated in Fig. 5B by open circles.
(iv) Sensory thresholds for the de~ection of borizon~al dispari~y. For the determination of sensory detection thresholds for horizontal disparity, the test st£muli shown in Fig. 4F and G replaced the fixation stimulus of Fig. 2B for 2 sec.
The detection thresholds were determined by getting the subject to discriminate between test lines with and without horizontal disparity in a temporal 2-alternative forced-choice procedure (interstimulus interval 3 secl. This discrimination was found to be based on the perception of stereoscopic depth differences. The positive and negative hor~zontal disparities giving 50% detection were each dete~ned by linear interpolation from at least 4 detection frequencies between 0.00 and 1.00 that were each determined from 50 trials. The thresholds obtained for positive and negative horizontal disparities were the same to within the experimental error. They were therefore averaged- This mean result is indicated in Fig. SC by open circles for overall horizontal disparity (stimulus of Fig. 4F) and by solid squares for aniseikonic horizontal disparity (stimulus of Fig. 4G).
Results and discussion
The data presented in Fig. 5 were obtained from a highly practised subject
104

(ALD, one of the authors), so one can be reasonably sure that they represent
stabilized sensory performance.
The 50% detection thresholds for the sensorimotor system controlling the i
nitiation of vergence eye-movements in response to overall vertical disparity
- indicated in Fig. SA, B and C by solid triangles as a function of the eccen
tricity of the horizontal lines with vertical disparity - vary between 0.4'
and 0.8' and increase with increasing eccentricity.
The corresponding 50% detection thresholds of the sensory system controlling
the psychophysical assessment of vertical disparity - indicated in Fig. SA by
solid squares as a function of the eccentricity of the horizontal lines with
vertical disparity - were obtained with 2-sec presentation of aniseikonic ver
tical disparity (stimulus of Fig. 4C). These thresholds (which increase from
1' to 3' with increasing eccentricity) will be equal to the detection thres
holds that would have been found without vergence eye-movements for 2-sec pre
sentation of the lines with overall disparity used to determine the detection
thresholds for the sensorimotor system. This may be concluded from the obser
ved equality of the SOt detection thresholds obtained with 160-msec presenta
tion of aniseikonic vertical disparity (stimulus of Fig. 4C) and those obtai
ned with 160-msec presentation of overall vertical disparity (stimulus of Fig.
4B), where it is established that vergence eye-movements do not interfere with
the results.
The major finding from experiment 2 is that the sensorimotor system control
ling vertical vergence eye-movements is apparently more sensitive to vertical
disparities than the sensory system controlling the psychophysical assessment
of vertical disparity, under the stimulus conditions used (long presentation
times and sufficient contour length with disparity).
Some reference values serving as measures of the sensory capabilities of
spatial processing under the stimulus conditions used are plotted in Fig. SB
and c. The 50% detection thresholds for 2-sec presentation of monocular hori
zontal lines with vertical separation (stimuli of Fig. 4D and E) - indicated
in Fig. SB by solid squares - amount to 0.6'-1.6', which is comparable to the
values reported by e.g. Jacobs (1979). Comparison of these thresholds with the
sensorimotor thresholds - indicated by solid triangles in Fig. SB - shows that
105
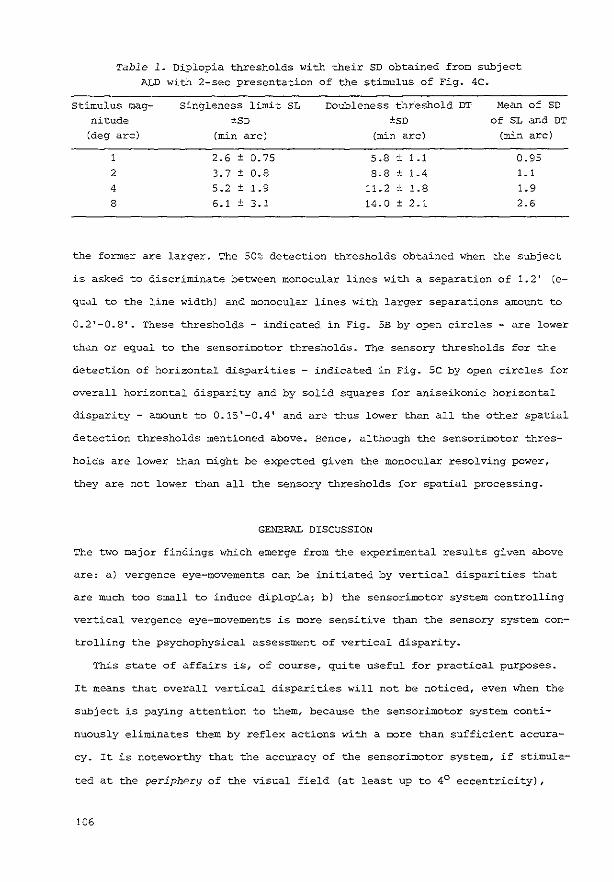
Table 1. Diplopia thresholds with their SD obtained from subject
ALD with 2-sec presentation of the stimulus of Fig. 4C.
Stimulus mag- Singleness limit SL Doubleness thr-eshold DT Mean of SD
nitude ±SD ±sn of SL and DT
(deg arc) (min arc) (min arc) (min arc)
I 2.6 ± 0.75 5.8 ± 1.1 0.95
2 3.7 ± 0.8 8.8 ± 1.4 1.1
4 5.2 ± 1.9 11.2 ± 1.8 1.9
8 6.1 ± 3.1 14.0 ± 2. I 2.6
the former are larger. The 50~ detection thresholds obtained when the subject
is asked to discriminate between monocular lines with a separation of 1.2' (e-
qual to the line width) and monocular lines with larger separations amount to
0.2'-0.8'. These thresholds- indicated in Fig. 5B by open circles- are lower
than or equal to the sensorimotor thresholds. The sensory thresholds for the
detection of horizontal disparities - indicated in Fig. 5C by open circles for
overall horizontal disparity and by solid squares for aniseikonic horizontal
disparity- amount to 0.15'-0.4' and are thus lower than all the other spatial
detection thresholds mentioned above. Hence, although the sensorimotor thres-
holds are lower than might be expected given the monocular resolving power,
they are not lower than all the sensory thresholds for spatial processing.
GENERAL DISCUSSION
The two major findings which emerge from the experimental results given above
are: a) vergence eye-movements can be initiated by vertical disparities that
are much too small to induce diplopia; b) the sensorimotor system controlling
vertical vergence eye-movements is more sensitive than the sensory system con-
trolling the psychophysical assessment of vertical disparity.
This state of affairs is, of course, quite useful for practical purposes.
It means that overall vertical disparities will not be noticed, even when the
subject is paying attention to them, because the sensorimotor system conti-
nuously eliminates them by reflex actions with a more than sufficient accura-
cy. It is noteworthy that the accuracy of the sensorimotor system, if stimula-
ted at the periphery of the visual field (at least up to 4° eccentricity),
106
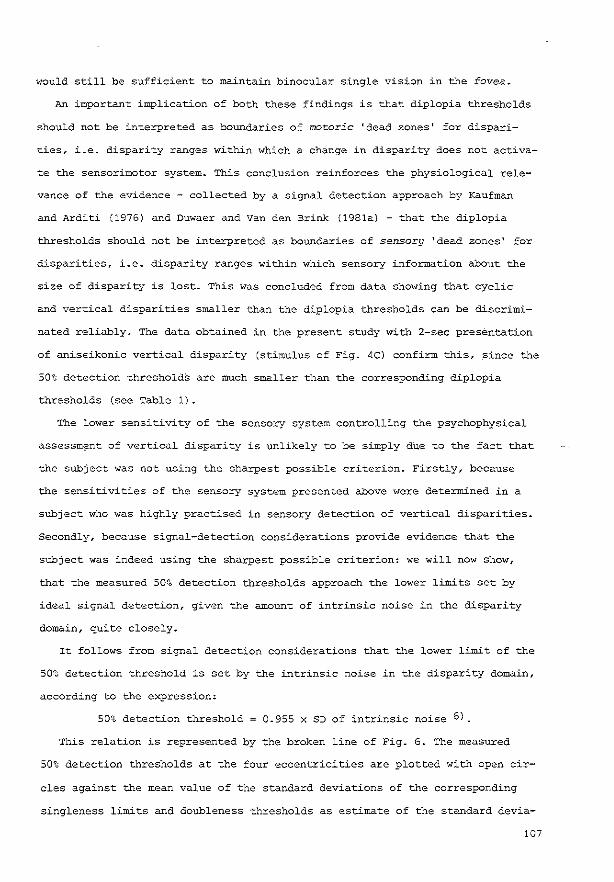
would still be sufficient to maintain binocular single vision in the fovea.
An important implication of both these findings is that diplopia thresholds
should not be interpreted as boundaries of motoric 'dead zones' for dispari
ties, i.e. disparity ranges within which a change in disparity does not activa
te the sensorimotor system. This conclusion reinforces the physiological rele
vance of the evidence - collected by a signal detection approach by Kaufman
and Arditi (1976) and Duwaer and Van den Brink (1981a) - that the diplopia
thresholds should not be interpreted as boundaries of sensory 'dead zones' for
disparities, i.e. disparity ranges within which sensory information about the
size of disparity is lost. This was concluded from data showing that cyclic
and vertical disparities smaller than the diplopia thresholds can be discrimi
nated reliably. The data obtained in the present study with 2-sec presentation
of aniseikonic vertical disparity (stimulus of Fig. 4C) confirm this, since the
50% detection thresholdS are much smaller than the corresponding diplopia
thresholds (see Table 1).
The lower sensitivity of the sensory system controlling the psychophysical
assessm~nt of vertical disparity is unlikely to be simply dUe to the fact that
the subject was not using the sharpest possible criterion. Firstly, because
the sensitivities of the sensory system presented above were determined in a
subject who was highly practised in sensory detection of vertical disparities.
Secondly, because signal-detection considerations provide evidence that the
subject was indeed using the sharpest possible criterion: we will now show,
that the measured 50% detection thresholds approach the lower limits set by
ideal signal detection, given the amount of intrinsic noise in the disparity
domain, quite closely.
It follows from signal detection considerations that the lower limit of the
50% detection threshold is set by the intrinsic noise in the disparity domain,
according to the expression;
50% detection threshold 0.955 x SD of intrinsic noise 6).
This relation is represented by the broken line of Fig. 6. The measured
50% detection thresholds at the four eccentricities are plotted with open cir
cles against the mean value of the standard deviations of the corresponding
singleness limits and doubleness thresholds as estimate of the standard devia-
!07

0
0 0
5
4
3
2
0
/ /
/
signal detection
/ /
/
/ 0/
/ 0/ /
/ /
/
0/
2
/
0 /
/ /
/
/ /
3
/ /
/
J
4
standard deviation of diplopia thresholds
in minutes of ore
5
Fig. 6. 50% detection thresholds obtained at 4 eccentricities
with 2-sec presentation of the stimulus of Fig. 4C, plotted against the mean of the SD of the corresponding singleness limits and doubleness thresholds. These values are also tabulated in Table 1. The broken line represents the relation between threshold and SD predicted on the basis of signal-detection conside-
rations, assuming no loss of disparity information.
tion of the intrinsic noise. If the measured detection thresholds were a re-
sult of pure signal detection they should lie on the broken line; and if not,
above it. Inspection of Fig. 6 shows that the 50% detection thresholds do in-
deed approach the limiting lower level of pure signal detection quite close
ly ?) . This would strongly suggest that the subject was using an assessment
criterion which was practically as sharp as possible during the determination
of sensory detection thresholds for vertical disparity. A second conclusion
which is implicit in this analysis iS that the detection thresholds obtained
can apparently be described without assuming the occurrence of a dead zone!
A third major finding is the high sensitivity of the sensorimotor system as
such. Up to eccentricities of at least 4°, a vertical disparity as small (in an-
gular measure) as the distance between the centres of neighbouring receptors in
108

the retina is enough to initiate vergence eye-movements (cf e.g. Polyak, 1941).
The determination of the sensitivity of the sensorimotor system relied on
the subject's ability to detect a change in the alignment of the nonius lines
in response to the presentation of the stimulus disparity. This detection is
hampered by the continuously changing alignment caused by involuntary eye-mo
vements. It is this difficulty that caused the apparent underestimation of the
sensitivity of the sensorimotor system and the lack of dependence on eccentri
city of stimulation in Experiment 1 (compare Figs. 3 and 5), where the detec
tion was not optimalized by informing the subject about the direction in which
to expect the alignment change 8) • We cannot however entirely exclude the pos
sibility that the sensitivity of the sensorimotor system is still being under
estimated in Experiment 2.
The sensitivity of the sensorimotor system as estimated in Experiment 2 was
found to surpass that of the sensory systems controlling the psychophysical as
sessment of vertical disparity, and the monocular resolving power. It does not
however exceed the sensory capabilities of spatial processing, as evidenced by
the still higher sensitivities found for the detection of a gap between two ad
jacent monocular lines and the detection of relative horizontal disparity using
stereoscopic depth as a cue.
The remarkably low thresholds found for the initiation of vergence eye-move
ments eliminating vertical disparities would imply a remarkably accurate align
ment of the eyes in the vertical direction. This has indeed been found to be
the case. Vertical disparities occurring spontaneously during continuous obser
vation of e.g. a circular fixation stimulus _1° in diameter remain smaller than
1' of arc (Duwaer and Van den Brink, 1981b).
It is interesting to note that these low thresholds found for the initia
tion of vergence eye-movements and the resulting accurate alignment of the e
yes strongly support the physiological relevance of the concept 'corresponding
points' on the retinae of the two eyes.
One important aspect of the sensorimotor system controlling vertical ver
gence eye-movements, used implicitly in the determination of diplopia thres
holds for long presentation times without interference of vergence eye-move
ments, has not been discussed explicitly yet. We refer to the apparent pooling
109

of disparity information in the visual field preceding the actual initiation
of vergence eye-movements.
For instance, 2-sec presentation of horizontal lines above and below the fi-
xation point with vertical disparities of the same sign initiates vertical ver-
gence eye-movements whereas presentation of the same horizontal lines for the
same time with vertical disparities of opposite sign does not apparently do so,
even when the two lines are separated by as much as 8°. This implies that one
can only determine the (absolute) detection thresholds of the sensorimotor sy-
stem with stimuli that overrule all spurious stimuli in the visual field (such
as the boundary of the background field) which might otherwise create 'vergen-
ce traps'. It also implies that one can apparently manipulate the stimulus
conditions so as to prevent or reinforce the occurrence of vergence eye-move-
ments. Experiments in this direction are now being carried out in an attempt
to specify the rules according to which the sensorimotor system pools the dis-
parity information in the visual field.
We wish to conclude with the remark that the ease and accuracy with which
vergence eye-movements are initiated in response to vertical disparity may rna-
ke the determination of the occurrence of vertical vergence eye-movements a
useful tool in the assessment of visual performance in the periphery of the vi-
sual field. The advantage of this tool is that it does not require the subject
to pay attention to the peripheral stimulus: he or she only has to perform a
simple foveal task.
ACKNOWLEDGEMENTS
We would like to thank Dr. G.J. van der Wildt, Dr. C.M.M. de Weert and Mrs. A.E.H. Peters for helpful discussions, Mr. C.J. Keemink and Mr. J.B.P. van Deursen for their technical assistance, and the Netherlands Organization for the Advancement of Pure Research (Z.W.O.) for the funds which made this investigation possible.
REFERENCES
Burian H.M. (1939) Fusional movements. Arcbs. Ophthal. 2~, 486-491.
Crone R.A. (1973) Diplopia. Elsevier, New York. Duwaer A.L. and Brink G. van den (1981a) What is the diplopia threshold? Per
ception & Psychophysics 29, 295-309.
110

Duwaer A.L. and Brink G. van den (1981b) Foveal diplopia thresholds and fixation disparities. Perception & Psychophysics, in press.
Ellerbrock V.J. (1949) Experimental investigation of vertical fusional movements. Am. J. Optom. 26, 327-337.
Hebbard F.W. (1962) Comparison of subjective and objective meas~ements of fixation disparity. J.O.S.A. 52~ 706-712.
Houtman W.A. (1979) Verticale vergentie. Dijkstra Niemeyer~ Groningen. Jacobs R.J. (1979) Visual resolution and contour interaction in the fovea and
periphery. Vision Research 19, 1187-1195. Kaufman L. and Arditi A. (1976) The fusion illusion. vision Research 16, 535-
543. Ogle K.N. and Prangen A.deH. (1953) Observations on vertical divergences and
hyperphorias. Archs. Ophtha1. 49, 313-334. Ogle K.N. (1964) Researches in binocular vision. Hafner, New York. Palmer D.A. (1961) Measurement of the horizontal extent of Panum's area by a
method of constant stimuli. Optica Acta 8, 151-159. Perlmutter A.L. and Kertesz A.E. (1978) Measurement of human vertical fusional
response. Vision Research 18, 219-223. Polyak S.L. (1941) The retina. Chicago University Press, Chicago. Westheimer G. and Mitchell A.M. (1956) Eye-movement responses to convergence
stimuli. Archs. Ophthal. 55, 848-856.
NOTES
1. In this paper, all retinal disparities and dimensions of perceived images are expressed in degrees of arc and minutes of arc, which for the sake of simplicity are denoted by e.g. '8°' or '2'' respectively.
2. The presence of the vertical sides of the squares proved to be irrelevant for the results. They were, however, not removed because their presence facilitates the determination of diplopia thresholds in untrained subjects by reminding them how lines without vertical disparity should look in the periphery of the visual field.
3. The angular dimensions were not corrected for the reduction in size of 2% introduced by the negative spherical correction of -0.75D.
4. Subject AEMR.regularly perceived the test stimulus without disparity in diplopia, as can be inferred from comparison of the singleness limit and its SD. This effect, quite often found at the periphery of the visual field (Palmer, 1961; Duwaer and Van den Brink, 1981a), reflects the fact that the percept of a stimulus without disparity at the periphery of the visual field varies between single and double accord~ng to foveal standards.
5. The percentage detection is calculated from the percentage identification
by correction for the a priori detection probability according to the expression:
~ detection = 2 x (~ identification - 50). 6. This expressiOn is derived in the Appendix. 7. It is a conspicuous result that the 50~ detection thresholds seem to beco
me smaller than the level 1.49 x SD corresponding to signal detection with the quite likely loss of information about the sign of disparities {Duwaer and Van
111

den Brink, 1981a) • Loss of sign information reflects the fact that disparities of opposite sign produce both doubling (without sign) of the binocular image.
8. Control experiments showed that the apparent underestimation of the sensitivity of the sensorimotor system in Experiment 1 was not due to the presence of the vertical sides of the squares with disparity.
APPENDIX
If the disparity thresholds are determined with reference to criteria chosen out of a continuous scale of possible criteria extending to zero disparity in a disparity domain with constant additive intrinsic noise, then the 50% detection threshold will be determined by signal detection considerations.
If no loss of disparity information may be expected during signal detection, the following relation is obtained:
50% detection threshold
0.955 x SD of singleness limit
0.955 x SD of doubleness threshold.
These relations may be derived as follows (see also Duwaer and Van den
Brink, 1981a)-In the 2-alternative forced-choice procedure, the subject is comparing the
percepts of two stimuli presented in succession in order to determine which percept embodies a disparity. In the 3-alternative classification, the subject is comparing the percept of each stimulus presented with reference to two criteria, i.e. two disparity levels.
Assume that: (i) the internal representation of the disparity in the test stimulus is increased with a sample of a normalized Gaussian distribution so that the density function of a large number of internal representations of the same stimulus disparity is:
1 -Id-ol 2
p (d) =--;--2 exp{ 2 ' }, crdv. TI cra
where d = disparity, 0 = disparity in the test stimulus, and Cfd = SD of the additive Gaussian noise. (ii) The internal representations of stimuli presented in succession are mutually independent.
Under these assumptions: the statistics of the decisions in the 3-alternative classification procedure are governed by the distribution p{d). This implies that the SD of the disparity thresholds is equal to Cfd·
The frequency of correct discrimination Pc(O) in the 2-alternative forcedchoice situation, when there is no loss of disparity information, is given by:
where Psn(d=x) = the probability that the internal representation of the stimulus with disparity is located at disparity x,
112

and Pn(d<x) ~the probability that the internal representation of the stimulus
without: disparity is located at a disparity that. is smaller than x,
The frequency of correct detection will be 50& for Pc(0J~0.75, which corre
sponds to 6~0.955od.
113

114

IV
BINOCULAR SINGLE VISION
UNDER HIGHLY DEMANDING CONDITIONS
Chapter IV deals with binocular single vision under highly de
manding conditions.
When the present thesis was nearly finished, several studies were published claiming a quite surprising reduction of the
accuracy of (motor) ocular alignment on a visual stimulus and a rise in the sensory tolerance to retinal disparities by up
to one order of magnitude under two highly demanding conditions, viz. binocular fixation during active head rOtation and
forced vertical divergence of the eyes.
These experiments were replicated in two studies using a specially designed afterimage method to measure ocular alignment
instead of the 'objective' method used in the. above-mentioned
studies which is based on the use of special suction-type con
tact lenses on the eyes.
115

4.1 ASSESSMENT OF RETINAL IMAGE DISPLACEMENT
DURING HEAD MOVEMENT USING AN
AFTERIMAGE METHOD
A.L. Duwaer*
ABSTRACT
An easily practicable afterimage method is presented which can be used to study the accuracy of binocular fixation in observers who are free to move their head during the performance of their visual task.
This afterimage method has been used to measure retinal image displacement during binocular fixation with active head rotation about a vertical axis. The results confirm previously published reports that fixation accuracy in the horizontal direction deteriorates as a result of a head rotation. However, both retinal image displacements and fixation disparities were found to remain much smaller (by a factor of 3 and 8 respectively) than the values previously reported in the literature for similar head rotations (peak-to-peak amplitude: 200, frequency: 0.66 Hz). Moreover, our results show that fixation accuracy fell not only in the horizontal direction, but also in the vertical direction by about the same factor.
It is concluded that eye-movement compensation of active head rotation may be much better than previously reported in the literature, and good enough to prevent deterioration of vi
sion. The deterioration of fixation accuracy during active head rotation does not seem to be completely due to limitation of oculomotor performance; some non-specific effects such as the increased difficulty of the (consciously performed) fixation task may also play a role.
*Department of Biological and Medical Physics, Erasmus University Rotterdam, P.O. Box 1738, 3000 DR Rotterdam, The Netherlands
116

INTRODUCTION
A technically impressive recording technique based on the use of a magnetic
field and search coils in contact annuli held on to the eyes by suction, per
mitting measurements in which the subject is free to move the head without
causing artefacts in the recording, has recently become operational (Hartman
and Klinke, 1976; Collewijn, 1977). This new technique has triggered the stu
dy of a new topic in eye-movement research, viz. the characteristics of reti
nal image motion with a freely moving head (Skavenski et al. 1979; Steinman
and Collewijn, 1980; Steinman et al., 1981). Unfortunately, the applicability
of the method is limited by the expense of the equipment involved and the comr
plexity of the measuring techniques.
These considerations encouraged us to present a much simpler method based
on a suitable afterimage technique which does not make use of expensive, com
plicated equipment and is much more convenient for the test subject, who no
longer has to have special suction-type contact annuli mounted on the eyes.
This new method permits the simultaneous determination of horizontal and ver
tical retinal image displacements, and provides direct estimates of retinal i
mage displacement without the need of applying various complicated corrections
for a) the magnification factor introduced by spectacles (cf. Ogle, 1971), b)
angular rotation of the eye compensating for the translation of the eye caused
by head rotation, and c) underestimation of image displacements (of objects
closer than optical infinity) caused by the fact that the principle nodal
point of the optics of the eye lies anterior to the centre of rotation of the
eye, so that the angle of image rotation will be greater than the rotation of
the eye relative to the target (Steinman et al., 1981).
The afterimage method has been used to assess horizontal and vertical reti
nal image displacements during active head rotation about a vertical axis, in
order to test the claims of Steinman and Collewijn (1980) and Steinman et al.
(1981) that eye-movement compensation of active head rotation is far from per
fect and that binocular vision remains single in spite of the occurrence of
horizontal fixation disparities of up to 30 1) which exceeds by far the lar
gest diplopia thresholds reported for similar stimuli (Mitchell, 1966; Duwaer
and Van den Brink, 1981a).
117
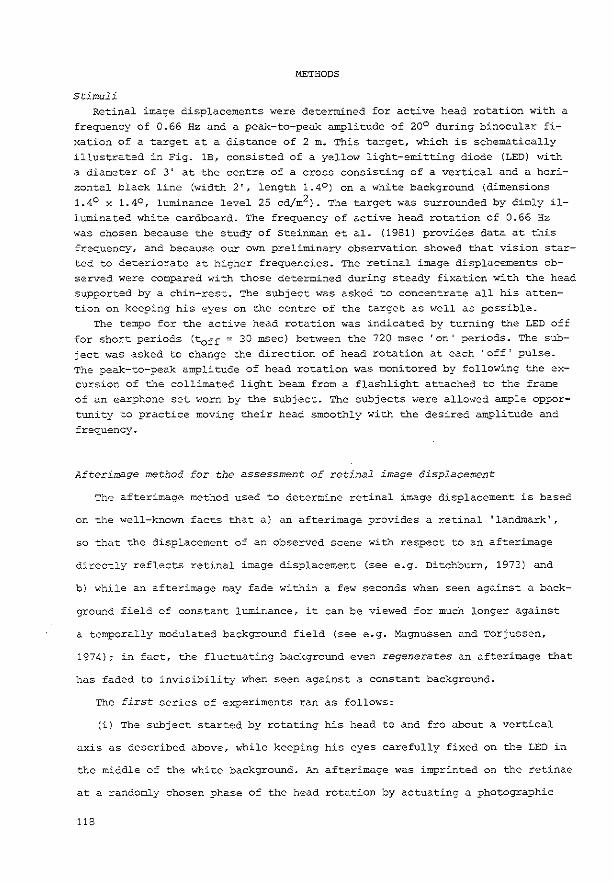
METHODS
Stimuli Retinal image displacements were determined for active head rotation with a
frequency of 0.66 Hz and a peak-to-peak amplitude of 20° during binocular fixation of a target at a distance of 2 m. This target, which is schematically illustrated in Fig. lB, consisted of a yellow light-emitting diode {LED) with a diameter of 3' at the centre of a cross consisting of a vertical and a horizontal black line {width 2', length 1.4°) on a white background {dimensions 1.4° x 1.4o, luminance le7el 25 cd/m2). The target was surrounded by dimly illuminated white cardboard. The frequency of active head rotation of 0.66 Hz was chosen because the study of Steinman et al. {1981) provides data at this frequency, and because our own preliminary observation showed that vision started to deteriorate at higher frequencies. The retinal image displacements observed were compared with those determined during steady fixation with the head supported by a chin-rest. The subject was asked to concentrate all his attention on keeping his eyes on the centre of the target as well as possible.
The tempo for the active head rotation was indicated by turning the LED off for sho=t periods {toff = 30 msec) between the 720 msec 'on' periods. The subject was asked to change the direction of head rotation at each 'off' pulse. The peak-to-peak amplitude of head rotation was monitored by following the excursion of the collimated light beam from a flashlight attached to the frame of an earphone set worn by the subject. The subjects were allowed ample opportunity to practice moving their head smoothly with the desired amplitude and frequency.
Afterimage method for the assessment of retinal image displacement
The afterimage method used to determine retinal image displacement is based
on the well-known facts that a) an afterimage provides a retinal 'landmark',
so that the displacement of an observed scene with respect to an afterimage
directly reflects retinal image displacement {see e.g. Ditchburn, 1973) and
b) while an afterimage may fade within a few seconds when seen against a back-
ground field of constant luminance, it can be viewed for much longer against
a temporally modulated background field {see e.g. Magnussen and Torjussen,
1974); in fact, the fluctuating background even regenerates an afterimage that
has faded to invisibility when seen against a constant backgrolliid-
The first series of experiments ran as follows:
{i) The subject started by rotating his head to and fro about a vertical
axis as described above, while keeping his eyes carefully fixed on the LED in
the middle of the white background. An afterimage was imprinted on the retinae
at a randomly chosen phase of the head rotation by actuating a photographic
118
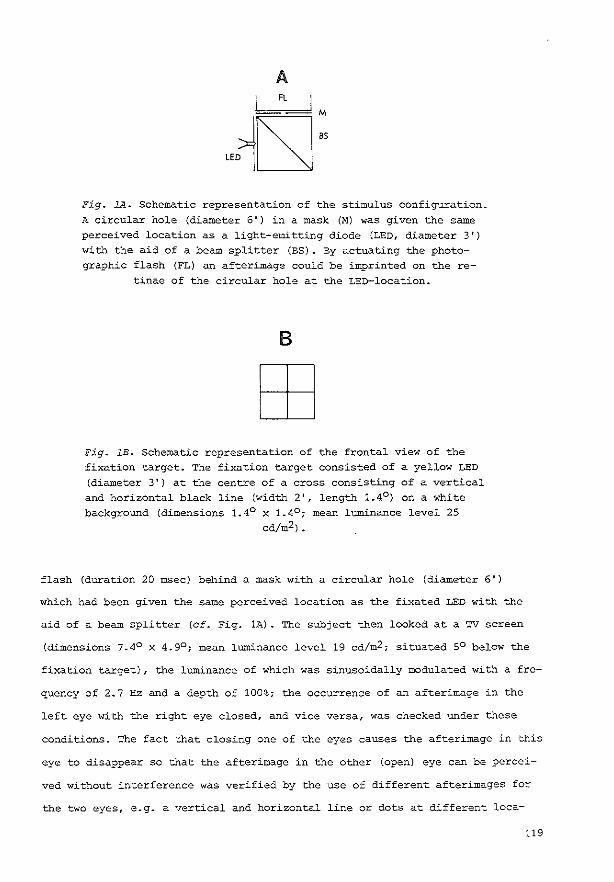
A
Fig. lA. Schematic representation of the stimulus configuration. A circular hole (diameter 6') in a mask (M) was given the same perceived location as a light-e~tting diode (LED, diameter 3')
with the aid of a beam splitter (BS). By actuating the photographic flash (FL) an afterimage could be imprinted on the re-
tinae of the circular hole at the LED-location.
B
EB Fig. lB. Schematic representation of the frontal view of the fixation target. The fixation target consisted of a yellow LED (diameter 3') at the centre of a cross consisting of a vertical and horizontal black line (width 2', length 1.4°) on a white background (dimensions 1.4° x 1.4o; mean luminance level 25
cd/m2).
flash (duration 20 msec) behind a mask with a circular hole (diameter 6')
whlch had been given the same perceived location as the fixated LED with the
aid of a beam splitter (cf. Fig. lA). The subject then looked at a TV screen
(dimensions 7.4° x 4.9°; mean luminance level 19 cd/m2; situated 5° below the
fixation target}, the luminance of which was sinusoidally modulated with a fre-
quency of 2.7 Hz and a depth of 100~; the occurrence of an afterimage in the
left eye with the right eye closed, and vice versa, was checked under these
conditions. The fact that closing one of the eyes causes the afterimage in this
eye to disappear so that the afterimage in the other (open) eye can be percei-
ved without interference was verified by the use of different afterimages for
the two eyes, e.g. a vertical and horizontal line or dots at different loca-
119

tions (cf. third series of experiments described below) . Afterimages were al
ways found to occur in both eyes (unless extinguished by closing one eye, as
indicated above) . It should be stressed that when the eye is opened again, the
afterimage reappears (until it has faded with passage of time) .
(ii) The subject subsequently looked at the white background {of constant
luminance ~evel 25 cd/m2) around the LED for 5-7 seconds until the afterimages
were no longer visible. It may be mentioned for the sake of clarity that it is
one of the essential features of this method that though the afterimages are
no longer visible under these conditions, they are still latently present, and
can be regenerated by looking at a background field of fluctuating luminance;
of course, even with a fluctuating background the afterimages do fade gradual
ly and will disappear completely in a matter of a minute or two. The afterima
ges are allowed to fade to invisibility at this stage of the experiment in or
der to prevent interference with the next fixation task, as visible afterima
ges provide the subject with information about retinal image displacements and
the preceding fixation position which could be used to control the fixation
position. The subject then lowered his chin several centimeters to put his
head on a chin rest and tried to fixate the LED as well as possible, the po
sition of the LED again being imprinted on the two retinae by actuating the
photographic flash.
{iii) The subject then quickly shifted his gaze downwards {with his chin
still on the chin rest) to the TV screen with its temporally modulated lumi
nance. ~hese viewing conditions regenerated the first afterimage, so that the
subject could now see two afterimages in each eye, the second one being appre
ciably larger and brighter than the first for about 10 - 20 seconds. The sub
ject now closed the left eye for a moment and memorized which of the two af
terimages in the right eye was produced second {being still bigger and brigh
ter). He then did the same for the afterimages in the left eye, by closing the
right eye. The x and y coordinates of the centre of the first afterimage were
then estimated with reference to the location of the centre of the second af
terimage using the scale provided by horizontal and vertical scale units of
15' depicted on the TV screen. This was done for the left eye by closing the
right eye and for the right eye by closing the left eye. The subject plotted
120

the coordinates thus observed on graph paper. He was advised to increase the
accuracy of the estimation by taking his time and by looking at the afterima
ges in the left eye and those in the right eye alternately. The diameter of
the afterimage amounted to about 0.3 scale unit (about 5') during the time
that the coordinates were estimated. The time available for the estimation was
about 1 minute, which proved to be more than sufficient after a short training
period. As soon as the afterimages were not visible anymore while looking at
the temporally modulating luminance of the TV-screen, the subject repeated the
sequence (i) , (ii) and (iii) a total of 25 times.
A second series of 25 determinations as described above was performed but
now without active head rotation in (i). Both the first and the second after
images were formed in this series with steady fixation of the head on a chin
rest. Apart from this, the experimental conditions were identical with those
described above.
Finally, a third series of experiments was carried out in which the two af
terimages in each eye were formed not by successive flashes through a mask with
one hole, but simultaneously using masks with two holes with known physical co
ordinates. The subject was told which of the two afterimages should be used as
a reference for estimation of the coordinates. The physical x and y coordinates
of the other hole varied between 0 and 1.5 scale units with x andy discrepan
cies between the coordinates presented to the two eyes of up to 0.6 scale unit.
It took the subjects 1 - 1.5 hours to do one series of experiments, several
rest periods included. The first two series were performed on the same day, the
third series on another day.
Data analysis
A coordinate obtained in the first series (with active head rotation) repre
sents the difference between a sample of the distribution of retinal image lo
cations during active head rotation with variance cr~. 66 and a sample of the di
stribution of retinal image locations without head movements with variance cr~,
plus a sample of a distribution (of variance cr~e) reflecting the limited accu
racy of the estimated coordinates as such without interference from eye-move
ments. Because of the large time interval between successive samples of the di-
121

stributions of retinal image locations and the completely different cause of
the limited accuracy of estimated coordinates as such, the samples will be sta-
tistically independent. Consequently, the coordinates will yield a distribution
of variance:
cr~.66 + a~ + cr~e (1)
A coordinate in the second series (with· no head rotation at all) represents the
difference between two statistically independent samples of the distribution
of retinal image location without head movements, plus a sample of the distri-
bution reflecting the limited accuracy of the estimated coordinates as such.
These coordinates, therefore, yield a distribution of variance:
(2)
A coordinate obtained in the third series represents the estimated coordi-
nate (ce) given the functional relation with the physical coordinate (cph),
plus a sample of the distribution reflecting the limited accuracy of the esti-
mated coordinates as such. The functional relation was chosen as:
1 " "Ph
(3)
The constant ~ was introduced to account for any systematic deviations from
the expected relation ce ~ cph· The variance cr~e of the distribution reflec
ting the limited accuracy of the estimated coordinates as such will then be
var
where eel represents the estimated coordinate given cph· Cph
It follows from (1), {2) and (4) that 2)
(4)
/crir- ~{oi + var(ce] - cph/~)} scale units {5)
cph
122

v~{ai- var(ce] - cph/a)}
Cph
scale units (6)
Using equation (3) and the fact that a physical scale unit amounts to 15' it
follows that
15a/cri1 - ~{cri + var(cel - cph/a)} minutes of arc
Cph
15a~{oi- var(ce] - cph/a)}
Cph
minutes of arc
(7)
18)
So, by calculating the standard deviations of the distribution of coordinates
in the first series with active head rotation (011 ) and in the second series
without active head rotation (o1), and by calculating the standard deviation
(Oce) of the distribution reflecting the limited accuracy of estimated coordi-
nates as such and a (~ cph/ce), we can obtain a measure of the standard devia
tion of the distribution of retinal image locations during active head rotation
(0 0 • 66 ) and during absence of head movement (00). This has been done separately
for the x and y coordinates of the afterimage in the left eye (xL and yL) and
for those of the right eye (xR and yR). In addition, the standard deviations of
the distribution of horizontal and vertical fixation disparities were calcula-
ted. This calculation was based on the standard deviations of the distribution
of discrepancies (xL - xR) and (yL - yR) between the coordinates in the left
eye and those in the right eye.
Subjects
The data were obtained from 5 subjects who all had normal stereopsis (stereoacuities better than 1 according to the random-dot TNO test distributed by
Lameris, Utrecht, The Netherlands), and {Landolt-C) visual acuities better than 1 in either eye. The subjects were emmetropic except for subject ALD who was corrected for myopia with -0.75 dioptres for both eyes.
RESULTS AND DISCUSSION
Examples of the distributions of the coordinates for the left eye {L) and for
the right eye (R) and of the distribution of the discrepancies (L-R) between
the coordinates for the left and right eyes are given in Figs. 2 and 3. These
123

_, 0
I Ox= 0.41 SCALE UNIT
Oy" 0.43 SCALE UNIT
• .... . ""'·· . •
ACTIVE HEAD ROTATION
_, 0
I Ox= O.AA SCALE UNIT
Oy= 0.43 SCALE UNIT
• • ••
_, 0
O"x"' 0.24 SCALE 1UNIT
Oy"' 0.19 SCALE UNIT
• • Of-- • ,.. . - 0 f-- t: . - 0 - ·.~·
_, • ••• •
• -1
I _, 0
•.;• •a • • •
I -1 0
(X,. Y) COORDINATES IN SCALE UNITS
1 SCALE UN IT " 15.5'
-1
I -1 0
Fig. 2. (X,Y) coordinates of an afterimage imprinted during active head rotations, with respect to a reference afterimage imprinted subsequently during steady fixation without head movement. Both afterimages represent the same point in the visual field, so that both x and y coordinates should ideally be zero if visual performance were perfect. The coordinates are expressed in (calibrated) scale units corresponding to 15.5'. The data
(comprising 25 pairs of afterimages) were obtained from subject GvA, and are presented for the left eye {L) and the right eye {R) separately. The third graph indicated by "L-R" represents
the discrepancies between the coordinates for the two eyes. The peak-to-peak amplitude of the active head rotation amounted to
20° and the rotation frequency to 0.66 Hz. The standard deviations {0x and crv) given are used to calculate the standard deviations of the~ underlying distributions of retinal image locations during active head rotation and in the absence of head mo-
vement.
- 0
-1
L-R
distributions were obtained from one of the subjects in the first series with
active head rotation {Fig. 2) and in the second series without head movements
(Fig. 3). The estimated x andy coordinates obtained from the same subject in
the third series are plotted in Fig. 4 as a function of the corresponding phy-
sical· coordinates. The broken line in Fig. 4 was obtained by fitting the rela-
tion 'estimated coordinate= 1/a x physical coordinate' by linear regression to
the experimental points together with their reflections in the origin; this
stratagem ensures that the regression line passes directly through the origin.
It should be noted that if both eyes of this subject had remained perfectly
124

-I 0
I (]X~ 0.27 SCALE UNIT
(]/ 0.31 SCALE UNIT
NO HEAD MOVEMENTS
-I 0
I Ox"' 0.27 SCALE UNIT
O"y- 0.30 SCALE UN 11
-I 0
I Ox= 0..15 SCALE UNIT
Oy= 0.14 SCALE UNIT
• of-
•• .. ~- -of-••••• .. -.. - 0 f- - 0
-I
-I
·.· .· .. •
I 0
-I
0 •
• • • • •
I -I 0
(X, Y) COORDINATE$ IN SCALE UNITS
1 SCALE UNIT"' 15.5'
-I
I -I 0
Fig. 3. (X,Y) coordinates of an afterimage imprinted without head movement, with respect to a reference afterimage imprinted under L~e same conditions (for further details, see legend to
Fig. 1).
-I
L-R
aligned with respect to the fixation target, and if the estimated coordinates
had been equal to the physical coordinates, all points in Figs. 2 and 3 would
have fallen at the origin (0,0) and all points in Fig. 4 would lie on the line
ce cph·
The fixation accuracy has been quantified by calculating the standard devia-
tions of the underlying distributions of retinal image locations without head
movement (0 0 ) and with active head rotation (0 0 _ 66 ), using equations (7) and
(8). The standard deviations Orr were calculated from the distributions shown
in Fig. 2, Or from the distributions shown in Fig. 3 and both ace and the fac
tor cph/ce from the experimental points of Fig. 4. The results of this calcula
tion are given in Table 1, together with the values calculated for the 4 other
subjects tested.
Before discussing the calculated standard deviations of the distributions of
retinal image locations in the two fixation tasks, we would like to draw the
reader's attention to one surprising and one disappointing result. The surpri
sing result is that the physical coordinates tend to be overestimated (a ~ 1).
This might point to a tendency to project the afterimages on a plane slightly
125

126
0
2 CPH / CE = 1.03 .. 2 1 SCALE UN IT= 15' • -, ;:./
~ /
/
"' • ,""* z • => t' w • • ~ -< u . / .. ~ . / .. . ,' ::?:: efPo • w 0
" /
!-' /
z Ci " 0 '• 0 •/• 0 u ,I' A 0 w
o8o ~
~ 00 / . ~ 0 0 ~ w
0
PHYSICAL COORDINATE IN SCALE UNITS
Fig. 4. X andY coordinates (in scale units= 15') of an after
image imprinted without head movement with respect to a refe
rence afterimage (both afterimages being formed at the same time, with the aid of masks with two holes), plotted as a function
of the known physical coordinates of one hole in the mask with
respect to the other. The dots represent the X andY coordinates
for 22 pairs of afterimages in the left eye and 22 pairs in the right eye, while the open circles represent the discrepancies between the coordinates for the left and right eyes. The data obtained in the X direction did not differ from those in the Y
direction. The broken line was obtained by fitting by linear regression the relation 'estimated coordinate~ &x physical coordinate' to the experimental points and the mirror images of these points in the third quadrant (the points (-x, -y)); this stratagem ensures that the regression line passes through the
origin.
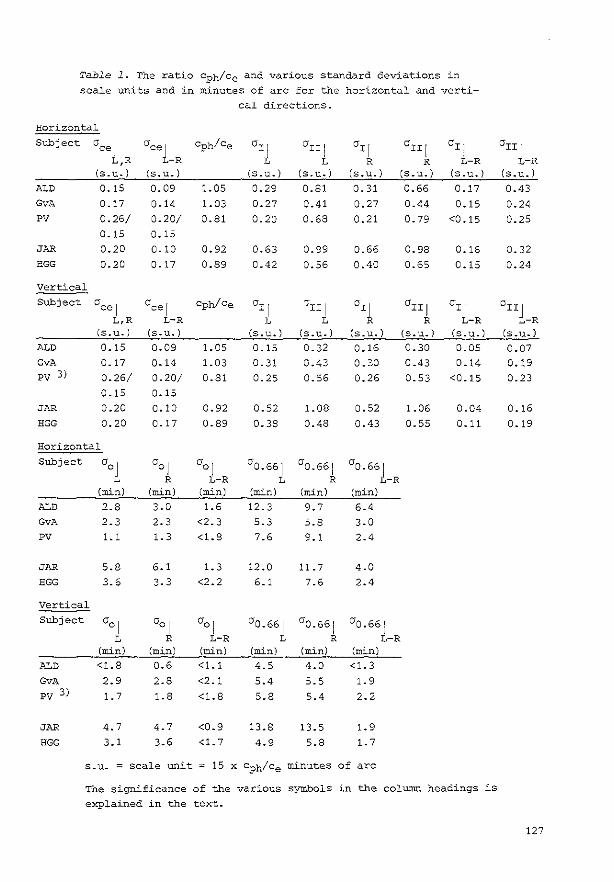
Table 1. The ratio Cph/ce and various standard deviations in
scale units and in minutes of arc for the horizontal and verti-
cal directions.
Horizontal
Subject ace I acet Cph/Ce oiL OIII Oil OIII Or I Orr I
L,R -R L R R L-R L-R (s.u. I (s.u.) (s.u.) (s.u.) (s.u.) (s.u.) (s.u.) (s.u.)
ALD 0.15 0.09 LOS 0.29 0.81 0.31 0.66 0.17 0.43
GvA 0.17 0.14 L03 0.27 0.41 0.27 0.44 0.15 0.24 PV 0.26/ 0.20/ 0.81 0.20 0.68 0.21 0.79 <0.15 0.25
0.15 0.15
JAR 0.20 0.10 0.92 0.63 0.99 0.66 0.98 0.16 0.32
EGG 0.20 0.17 0.89 0.42 0.56 0.40 0.65 0.15 0.24
Vertical
Subject 0ce1
0cel Cph/Ce Oil 7III or I OIII Oil OIIt
L,R L-R L L R R L-R -R (s.u.) (s.u.) (s.u.) (s.u.) (s.u.) (s.u.) (s.u.) (s.u. l
ALD 0.15 0.09 LOS 0.15 0.32 0.16 0.30 0.05 0.07
GvA 0.17 0.14 L03 0.31 0.43 o_ 30 0.43 0.14 0.19 PV 3) 0.26/ 0.20/ 0.81 0.25 0.56 0.26 0.53 <0.15 0.23
0.15 0.15
JAR 0.20 0.10 0.92 0.52 L08 0.52 L06 0.04 0.16
HGG 0.20 0.17 0.89 0.38 0.48 0.43 0.55 0. 11 0.19
Horizontal
Subject 00 l ool 001 0
0.661 0
0.661 00.661
R L-R L R -R (min) (min) (min) {min) (min) (min)
ALD 2.8 3.0 L6 12.3 9.7 6.4
GvA 2.3 2.3 <2.3 5.3 5.8 3.0
PV L1 L3 <1.8 7.6 9. 1 2.4
JAR 5.8 6.1 L3 12.0 11.7 4-0 HGG 3.6 3.3 <2.2 6. 1 7.6 2.4
Vertical
Subject 001 Oo I 001 0 0.661 0
0.661 00.661 L R L-R L R L-R
{min) (min) (min) {min) (min) (min)
ALD <1.8 0.6 <1.1 4.5 4.0 <1.3
GvA 2.9 2.8 <2.1 5.4 5.5 L9 PV 3) L7 1.8 <1.8 5.8 5.4 2.2
JAR 4.7 4.7 <0.9 13.8 13.5 L9
HGG 3.1 3.6 <1. 7 4.9 5.8 1.7
s.u. = scale unit 15 X Cph/Ce minutes of arc
The significance of the various symbols in the column headings is
explained in the text.
127
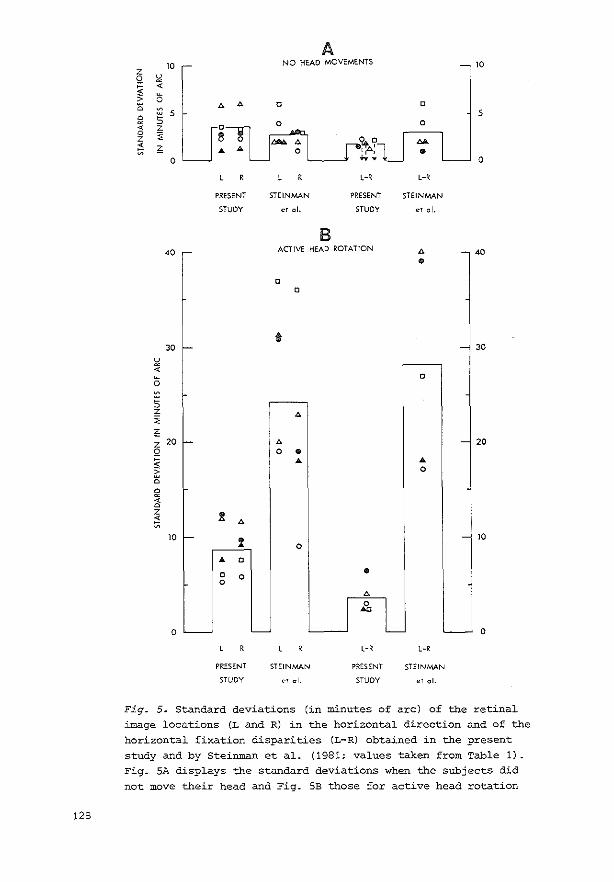
128
A 10 NO HEAD MOVEMENTS 10
z ~ 0
~ < > 0
A 0 D 0 A
2 5 5 5
< z D 0 0 0
" 8~~9 z 0: ;<; ... .... 0 •(0-,
0 .... 0
L-R L-R
PRESENT STEIN,IMN PRESENT STEINMAN
STUDY et ol. STUDY et ol.
B 40'
ACTIVE HEAD ROTATION A - 40
• D
0
30 1- - 30
~ < 0
0
5 z
" A
;,: z 20 r- A - 20 Q 0 • '$ ~
.. .. 0
0
0
~ z g < A ~
10 1- % - 10
0 .. 0
0 0 0
• A
I
~ L '-- 0
L-R L-R
PRESENT STEINMAN PRESENT STEINMAN
STUDY '"' ol. STUDY et oL
Fig. s. Standard deviatlons (in minutes of arc) of the retinal image locations (L and R) in the horizontal direction and of the horizontal fixation disparities (L-R) obtained in the present study and by Steinman et al. (1981; values taken from Table 1). Fig. SA displays the standard deviations when the subjects did
not move their head and Fig. SB those for active head rotation

of the head. The different symbols represent the data obtained from the different subjects. The height of the vertical bars
indicates the arithmetic mean of the standard deviations.
behind that of the TV screen. It should, however, be borne in mind that the
subjects had not received any feedback on their performance in this task of
estimating the coordinate from afterimages of finite width at an eccentric
retinal location. The disappointing result is that the fixation accuracy with-
out head movements may exceed the accuracy of estimating the coordinates, so
that estimation of this fixation accuracy may become comparatively inaccurate.
In order to facilitate comparison of the fixation accuracies in the hori-
zontal direction found in this study with those reported by Steinman et al.
(1981), the results of both studies are plotted in Fig. S.
It may be noted firstly that there is fairly good agreement between the
standard deviations of the retinal image locations without head movement ob-
tained by the afterimage method and by the objective method {see Fig. SA); of
course, these experimental conditions place least demands on both the subject
and the objective method of measurement.
Secondly, we finO that the afterimage data on the distributions of fixation
disparities without head movement confirm the data obtained with dichoptic no-
nius markers and a psychophysical procedure by Duwaer and Van den Brink (19Blb) ,
suggesting high alignment accuracy of the eyes.
Inspection of Fig. SB shows that the data obtained by the afterimage method
agree with those obtained by Steinman and Collewijn (1980) and Steinman et al.
{1981) in demonstrating a drop in the accuracy of fixation during active head
rotation.
However, there is less agreement concerning the extent to which the fixa-
tion accuracy falls. It can be seen from Fig. SB that during active head rota-
tion the mean standard deviations found for the distribution of retinal image
locations in the horizontal direction and for the distribution of horizontal
fixation disparities amount to 8.7' and 3.6' respectively in the present stu-
dy, but were much higher (24' and 28' respectively) according to Steinman et
al. (1981). our results thus imply that eye-movement compensation of active
129

head rotation may be much better than Steinman's data indicate, provided the
subject concentrates on keeping his eyes on a well defined fixation stimulus
and is not distracted nor hindered by the presence of suction-type contact an
nuli on his eyes. This conclusion agrees with a similar one drawn by Sheedy
(1981), who also studied the stability of fixation with and without head move
ments by a psychophysical procedure.
The afterimage method also provided data on vertical fixation accuracy;
Steinman and co-workers did not give comparable data concerning this point. In
spection of Table 1 shows that the deterioration of the vertical fixation accu
racy hardly differs from that of the horizontal fixation accuracy. This is a
remarkably finding since active head rotation about a vertical axis requires
large corrective horizontal eye-movements but little or no corrective vertical
eye-movement. The deterioration of vertical fixation accuracy may, therefore,
indicate a substantial amount of cross-talk between the horizontal and verti
cal directions, which would represent a serious limitation on oculomotor per
formance. However, an alternative explanation is that the loss of horizontal
fixation accuracy during active head rotation is not due to limitations on the
ability of the motor system to use and coordinate visual and vestibular sig
nals, but to the subject's unfamiliarity with the consciously controlled fixa
tion task, which may be expected to lower" their performance in both the hori
zontal and vertical directions.
Both Steinman and Collewijn (1980) and Steinman et al. (19811 compared their
data on horizontal retinal image displacements with visual performance data in
order to account for the test subjects' subjective observation that vision re
mained fused, stable and clear during active head rotation. They concluded
that it is necessary to assume that signals generated in the oculomotor system
activate special neuronal processes to prevent deterioration of visual percep
tion during active head rotation, as the accuracy of the induced eye-movement
compensations was found not to be sufficient for this purpose.
The data obtained in the present study permit a similar comparison and mo
reover have the advantage over the findings of the above-mentioned authors
that both eye-movement data and visual perception data were obtained using si
milar stimuli without contact annuli held on the eye by suction.
130

It can be calculated from the standard deviations for active head rotation
that the retinae were stimulated 95% of the time at horizontal eccentricities
of less than 11' - 25' (= 1. 96 0 0. 6 6 1 ), with horizontal disparities of less L,R
than 5'- 13' (= 1.96 0 0_66 [ ) and with horizontal velocities of less than L-R
(0.7- 1.7) 0 /sec. The velocities were estimated by assuming that the retinal
image moves sinusoidally across the retina with the same frequency (\! = 0. 66
Bz) as the head rotation and with the above-mentioned amplitude A of 11' - 25',
so that the velocity of retinal image movement is a cosine function
(it(Asin2TIVt) = 2TIVAcos2TIVt) the maximum value of which equals 2TIVA
(0.7- 1.7) 0/sec 4 l. Higher velocities, eccentricities and fixation dispari-
ties than the above-mentioned values can be disregarded because they will oc·-
cur for so short a time that their role in visual perception will be negligi-
ble.
Now previous studies have shown that visual acuity is hardly lowered at ec-
centricities of 11' - 25' (see e.g. Jacobs, 1979), that foveal diplopia thres-
holds for horizontal disparities in dots and line usually amounts to at least
10' (Mitchell, 1966; Duwaer and Van den Brink, 1981a) and that retinal veloci-
ties lower than 1.5°/sec do not lead to deterioration of contrast perception
(Ditchburn, Fender and Mayne, 1959; Sharpe, 1972; Drysdale, 1975; Westheimer
and McKee, 1975; King-Smith and Riggs, 1978; Murphy, 1978}. In vie;,.,• of these
findings it is not at all surprising that our subjects reported that vision
remained fused, stable and clear during active head rotation 5 l . Our data in-
dicate that the accuracy of eye-movement compensation of active head rotation
alone is sufficient to prevent deterioration of visual perception, and hence
that there is no need to assume that signals generated in the oculomotor sy-
stem activate special neuronal processes to this end.
It may be asked why our conclusions differ so fundamentally from those of
Steinman and Collewijn (1980) and Steinman et al. (1981) on this point. In our
opinion, the most likely explanation is the unnatural conditions under which
their test subjects had to work. As suggested several times during the course
of this article, the presence of suction-type contact annuli on the eyes is
likely to interfere considerably with visual performance when the experimental
test conditions place high demands. Our afterimage method places no such unna-
131
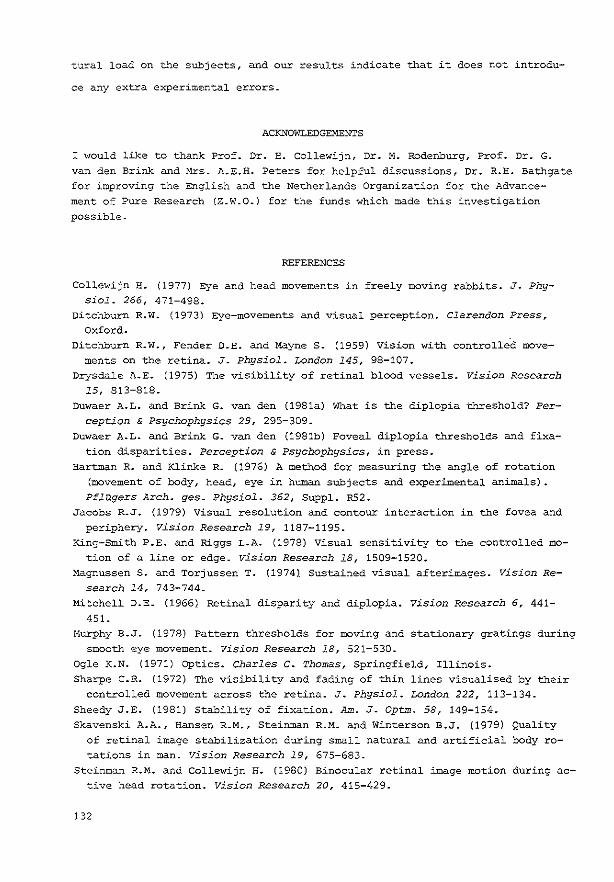
tural load on the subjects, and our results indicate that it does not introdu-
ce any extra experimental errors.
ACKNOWLEDGEMENTS
I would like to thank Prof. Dr. E. Collewijn, Dr. M. Rodenburg, Prof. Dr. G. van den Brink and Mrs. A.E.H. Peters for helpful discussions, Dr. R.H. Bathgate for improving the English and the Netherlands Organization for the Advancement of Pure Research (Z.W.O.) for the funds which made this investigation possible-
REFERENCES
Collewijn H. (1977) Eye and head movements in freely moving rabbits. J. Physiol. 266, 471-498.
Ditchburn R.W. (1973) Eye-movements and visual perception. Clarendon Press, Oxford.
Ditchburn R.W., Fender D.H. and Mayne S. (1959) Vision with controlled movements on the retina. J. Physiol. London 145, 98-107.
Drysdale A.E. (1975) The visibility of retinal blood vessels. Vision Research 15, 813-818.
Duwaer A.L. and Brink G. van den (1981a) What is the diplopia threshold? Per
ception & Psychophysics 29, 295-309. Duwaer A.L. and Brink G. van den (1981b) Foveal diplopia thresholds and fixa
tion disparities. Perception & Psychophysics, in press. Hartman R. and Klinke R. (1976) A method for measuring the angle of rotation
(movement of body, head, eye in human subjects and experimental animals). PflOgers Arch. ges. Physiol. 362, Suppl. R52.
Jacobs R.J. (1979) Visual resolution and contour interaction in the fovea and periphery. Vision Research 19, 1187-1195.
K1ng-Smith P.E. and Riggs L.A. (1978) Visual sensitivity to the controlled motion of a line or edge. vision Research 18, 1509-1520.
Magnussen S. and Torjussen T. (1974). Sustained visual afterimages. Vision Re
search 14, 743-744. Mitchell D.E. (1966) Retinal disparity and diplopia. Vision Research 6, 441-
451.
Murphy B.J. (1978) Pattern thresholds for moving and stationary gratings during smooth eye movement. Vision Research 18, 521-530.
Ogle K.N. (1971) Optics. Charles C. Thomas, Springfield, Illinois. Sharpe C.R. (1972) The visibility and fading of thin lines visualised by their
controlled movement across the retina. J. Physiol. London 222, 113-134. Sheedy J.E. (1981) Stability of fixation. Am. J. Optm. 58, 149-154. Skavenski A.A., Hansen R.M., Steinman R.M. and Winterson B.J. (1979) Quality
of retinal image stabilization during small natural and artificial body rotations in man. Vision Research 19, 675-683.
Steinman R.M. and Collewijn H. (1980) Binocular retinal image motion during active head rotation. Vision Research 20, 415-429.
132

Steinman R.M., Cushman W.B. and Martins A.J. (1981) The precision of gaze. Human Neurobiology, in press.
westheimer G. and McKee S.P. (1975) Visual acuity in the presence of retinal
image motion. J.O.S.A. 65, 847-850.
NOTES
1. In this paper, all angular dimensions will be expressed in degrees (O)
and minutes (') without the qualification 'of arc' each time. 2. If the measured values of a~ becomes so small that
o' I ; var {ce) Cph
- ~} a '
ai will assumed to be a second estimate of a~e so that a~ can be neglected. Formula (5) can then be read as
I 2 2 ' aa.66 = vaii- 0ce'
where O~e is the mean value of two estimates of a~e, viz. ai and
var {ce) Cph
- ~}. a
The value of a 0 will then be denoted by a 0 < ace in Table 1. 3. wnen subject PV did not move his head, 60% of the pairs of afterimages
fully overlapped. Due to this overlapping ace for this fixation task was found to be smaller than for the other fixation task with active head rotation, and only an upper limit could be given for ai) The values of a0 and a 0 _ 66 were calculated using equation (2) with the L-R smaller value of ace' and equation (1) with the larger value of Oce and the previously calculated value of
Oo. 4. The recordings of retinal image displacements during active head rotation
presented by Steir~ and Collewijn (1980) and Steinman et al. (1981) show that the retinal image moves on the average sinusoidally across the retina.
5. Subject. ALD, who has had a great C.eal of practice in diplopia investigations, reported seeing the fixation target double regularly during active head rotation.
133
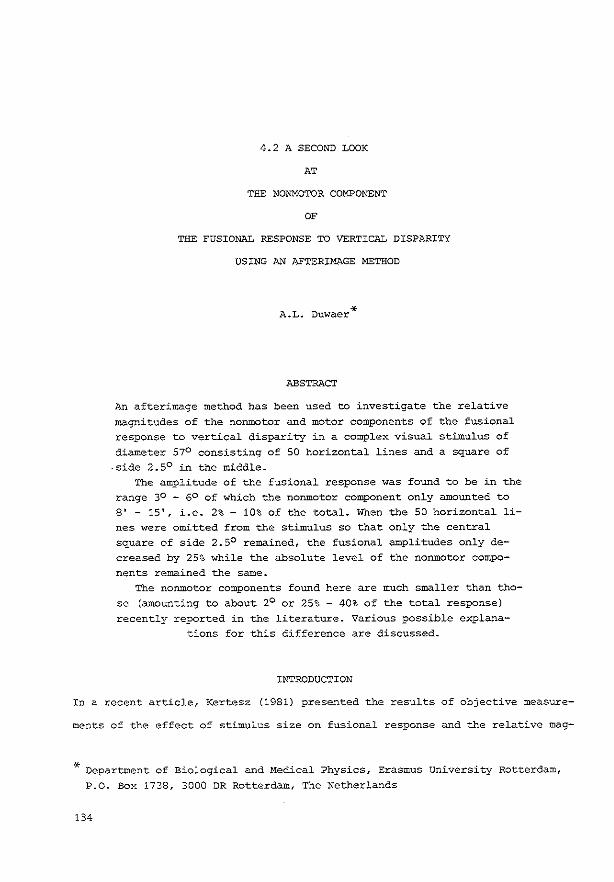
4.2 A SECOND LOOK
AT
THE NONMOTOR COMPONENT
OF
THE FUSIONAL RESPONSE TO VERTICAL DISPARITY
USING AN AFTERIMAGE METHOD
* A.L. Duwaer
ABSTRACT
An afterimage method has been used to investigate the relative
magnitudes of the nonmotor and motor components of the fusional response to vertical disparity in a complex visual stimulus of
diameter 57° consisting of SO horizontal lines and a square of .side 2.5° in the middle.
The amplitude of the fusional response was found to be in the
range 30 - 60 of which the nonmotor component only amounted to 8' - 15', i.e. 2% - 10% of the total. When the SO horizontal li
nes were omitted from the stimulus so that only the central square of side 2.5° remained, the fusional amplitudes only de
creased by 25% while the absolute level of the nonmotor compo
nents remained the same. The nonmotor components found here are much smaller than tho
se (amounting to about 2° or 25% - 40% of the total response)
recently reported in the literature. Various possible explanations for this difference are discussed.
INTRODUCTION
In a recent article, Kertesz (1981) presented the results of objective measure-
ments of the effect of stimulus size on fusional response and the relative mag-
* Department of Biological and Medical Physics, Erasmus University Rotterdam,
P.O. Box 1738, 3000 DR Rotterdam, The Netherlands
134
nitudes of the nonmotor and motor components of this response. His three major
findings were: 1) the fusional response to a vertical disparity may increase
up to 6° with increasing stimulus size, 2) during this increase, the relative
proportions of the motor (vergence) and nonmotor components remain roughly
constant, and 3) the nonmotor component typically amounts to 25% - 40%, irre
spective of the stimulus size.
At first sight, these results would appear to be in agreement with the ear
lier findings of e.g. Ellerbrock (1949) and Ogle and Prangen (1953). Ellerbrock
showed that the fusional response to vertical disparity in black disks may in
crease up to more than 4° as the size of the disk is increased. Ogle and
Prangen - who used dichoptic nonius markers to determine the relative magnitu
des of the motor and nonmotor components of the fusional response - showed
that the nonmotor component increases (typically in a linear fashion) with the
vertical disparity of the stimulus.
However, if we compare Kertesz's results with those of the other authors in
greater detail, appreciable discrepancies appear. Kertesz (1981) stressed the
importance of using a complex stimulus with as many as 50 horizontal lines and
a diameter of 57° to reach fusional responses of 3°- 6°, while Ellerbrock
(1949) only needed simple black disks subtending an angle of 2° to obtain si
milar fusional responses. The typical nonmotor component found by Ogle and
Prangen (1953) only amounted to 3% of the total fusional response (for central
squares of 1.25°), which is a factor 10 less than the typical values found by
Kertesz for central squares of similar size. The maximum fusible vertical fi
xation disparity usually remains below about 10' - 20' according to Ogle and
Prangen, while Kertesz's data would suggest that vertical fixation disparities
up to as much as 20 do not disrupt binocular single vision.
The purpose of the present study is to unravel the causes of these large
discrepancies, which were not even referred to by Kertesz.
The first discrepancy mentioned above, concerning the stimulus size needed
to obtain large fusional responses will be analysed with the aid of an experi
ment in which fusional responses to a large complex circular stimulus of outer
diameter 570, with SO horizontal lines and a black square (of side 2.5°) in
the middle and a white disk (diameter 10') at the centre of the square (this
135
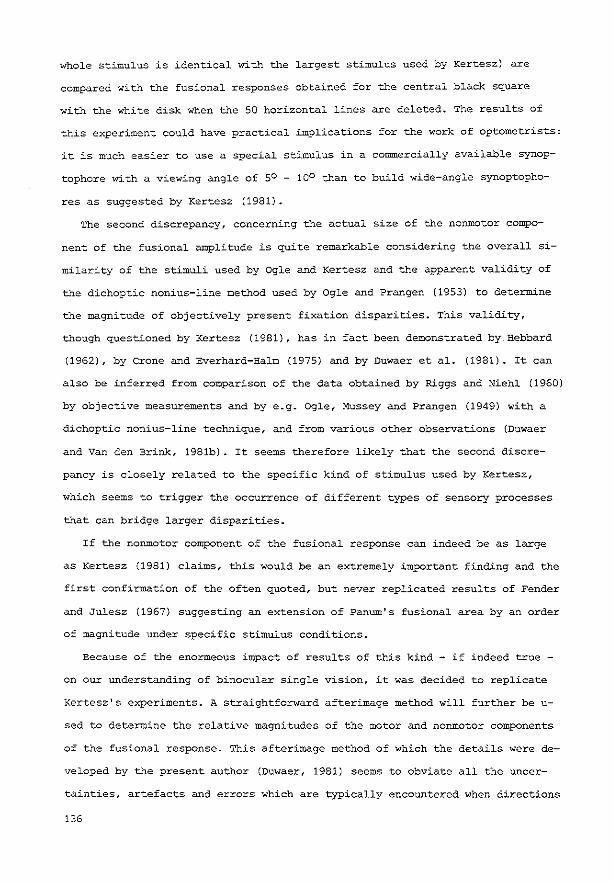
whole stimulus is identical with the largest stimulus used by Kertesz) are
compared with the fusional responses obtained for the central black square
with the white disk when the SO horizontal lines are deleted. The results of
this experiment could have practical implications for the work of optometrists:
it is much easier to use a special stimulus in a commercially available synop
tophore with a viewing angle of so - 100 than to build wide-angle synoptopho
res as suggested by Kertesz (1981).
The second discrepancy, concerning the actual size of the nonmotor compo
nent of the fusional amplitude is quite remarkable considering the overall si
milarity of the stimuli used by Ogle and Kertesz and the apparent validity of
the dichoptic nonius-line method used by Ogle and Prangen (1953) to determine
the magnitude of objectively present fixation disparities. This validity,
though questioned by Kertesz (1981), has in fact been demonstrated by Hebbard
(1962), by crone and Everhard-Halm (1975) and by Duwaer et al. (1981). It can
also be inferred from comparison of the data obtained by Riggs and Niehl (1960)
by objective measurements and by e.g. Ogle, Mussey and Prangen (1949) with a
dichoptic nonius-line technique, and from various other observations (Duwaer
and Van den Brink, 1981b). It seems therefore likely that the second discre
pancy is closely related to the specific kind of stimulus used by Kertesz,
which seems to trigger the occurrence of different types of sensory processes
that can bridge larger disparities.
If the nonmotor component of the fusional response can indeed be as large
as Kertesz (1981) claims, this would be an extremely important finding and the
first confirmation of the often quoted, but never replicated results of Fender
and Julesz (1967) suggesting an extension of Panum's fusional area by an order
of magnitude under specific stimulus conditions.
Because of the enormeous impact of results of this kind - if indeed true -
on our understanding of binocular single vision, it was decided to replicate
Kertesz's experiments. A straightforward afterimage method will further be u
sed to determine the relative magnitudes of the motor and nonmotor components
of the fusional response. This afterimage method of which the details were de
veloped by the present author (Duwaer, 1981) seems to obviate all the uncer
tainties, artefacts and errors which are typically encountered when directions
136

of the visual axis are assessed 'objectively' by measuring the angular posi-
tions of special contact lenses attached to the eyes as was done by Kertesz
(1981).
METHODS
Stimulus Diapositive copies were made of Kertesz's complex stimulus with and without
the 50 horizontal lines (see Fig. 1), and were projected in a darkened room on a homogeneous white screen (dimensions 70° x 60°; resulting mean luminance level 30 cd/m2 J at a distance of 35 em from the subject's eyes. The magnification of the projection was chosen so that the outer diameter of the stimulus subtended an angle of 57° at the subject's eyes and the side of the central square an angle of 2.5°. The white fixation disk at the centre then had an angular width of 10'. A circular hole of diameter 7' concentric with this disk was drilled in the screen. A photographic flash light (flash duration 20 msec) was mounted behind this hole, and used to imprint afterimages of the hole on the retinae. The stimulus parameter in the experiments was vertical disparity between the images seen by the two eyes, which was introduced with the aid of rotatory prisms directly in front of the subject's eyes. If required, the contribution of each eye to the percept could be checked by flashing dichoptic nonius markers on either side of the fixation disk within the black square. These markers were realized with the aid of LEDs (light-emitting diodes) placed behind pieces of polaroid and holes (diameter 10') drilled in the screen. By suitable choice of the orientation of these pieces of polaroid and those in front of the subject's eyes, the light corning from the LEDs to the left of and above the fixation disk could only be seen by the left eye and light emitted by the LEDs to the right of and below the fixation disk only by the right eye. If both eyes contribute to the percept of the stimulus around the fixation point, all four markers will be seen by the subject when flashed.
Afterimage method The afterimage method used to determine the magnitude of the fixation dis
parities, and in general of retinal image displacements between two successive fixation positions, has been described in detail elsewhere (Duwaer, 1981) • In short, this method is based on the facts that 1) an afterimage provides a temporary retinal 'landmark' so that the relative positions of successively imprinted afterimages reflect the relative directions of the visual axis (i.e. the lines from the point of fixation to the corresponding image point in the centre of the fovea) during imprinting (see e.g. Ditchburn, 1973), 2) while
an afterimage may fade within a few seconds when seen against a background of constant luminance it can be viewed for much longer against a temporally modulated background (in fact, the fluctuating background even regenerates an afterimage that has faded to invisibility when seen against a constant backgroundl and 3) closing of one eye causes the afterimage in that eye to disappear quickly so that the afterimage in the open eye can be observed without
interference. The effect of vertical test disparity on the ob~erved fixation
137
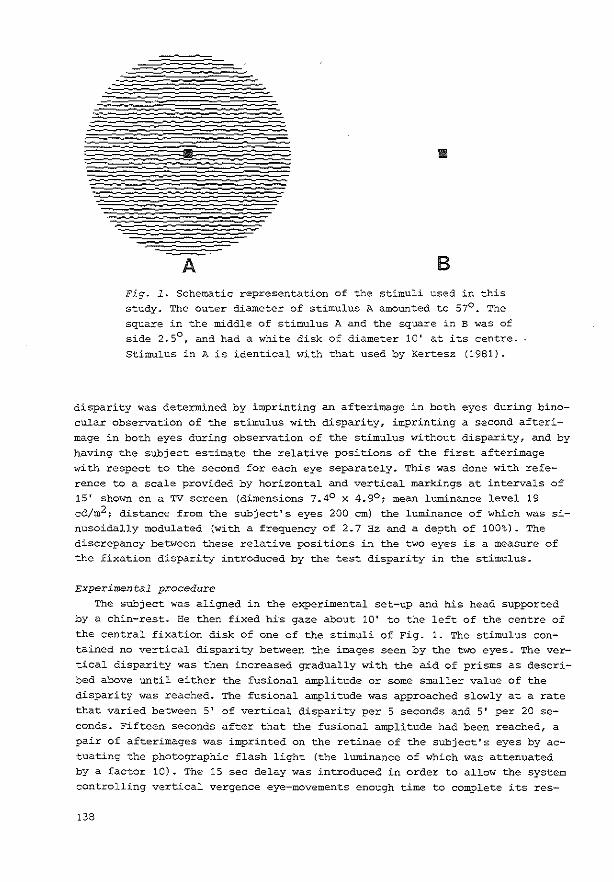
1111
A B Fig. 1. Schematic representation of the stimuli used in this study. The outer diameter of stimulus A amounted to 57°. The square in the middle of stimulus A and the square in B was of side 2.5°, and had a white disk of diameter 10' at its centre. Stimulus in A is identical with that used by Kertesz (1981).
disparity was determined by imprinting an afterimage in both eyes during binocular observation of the stimulus with disparity, imprinting a second afterimage in both eyes during observation of the stimulus without disparity, and by having the subject estimate the relative positions of the first afterimage with respect to the second for each eye separately. This was done with reference to a scale provided bY horizontal and vertical markings at intervals of 15' shown on a TV screen (dimensions 7.4° x 4.9°; mean luminance level 19
cd/m2 ; distance from the subject's eyes 200 em) the luminance of which was sinusoidally modulated (with a frequency of 2.7 Hz and a depth of 100%). The discrepancy between these relative positions in the two eyes is a measure of the fixation disparity introduced by the test disparity in the stimulus.
Experimental procedure
The subject was aligned in the experimental set-up and his head supported by a chin-rest. He then fixed hi·s gaze about 10' to the left of the centre of the central fixation disk of one of the stimuli of Fig. 1. The stimulus contained no vertical disparity between the images seen by the two eyes. The vertical disparity was then increased gradually with the aid of prisms as described above until either the fusional amplitude or some smaller value of the disparity was reached. The fusional amplitude was approached slowly at a rate that varied between 5' of vertical disparity per 5 seconds and 5' per 20 seconds. Fifteen seconds after that the fusional amplitude had been reached, a pair of afterimages was imprinted on the retinae of the subject's eyes by actuating the photographic flash light (the luminance of which was attenuated by a factor 10). The 15 sec delay was introduced in order to allow the system controlling vertical vergence eye-movements enough time to complete its res-
138
ponse to the vertical disparity and to test whether the fusional response was stable: just above the fusional amplitude, the eyes return gradually towards a more aligned position and diplopia emerges in the whole stimulus. Subsequently, the vertical disparity was removed and the subject waited at least 15 seconds until the whole test stimulus was perceived as unequivocally single; the afterimages had then already been invisible for about 10 seconds. A second pair of afterimages was then imprinted on the retinae (without atte
nuation of the luminance of the flash light) while the subject looked at the centre of the central fization disk. He then looked quickly at the TV screen with its fluctuating luminance, closed the left eye and memorized which of the two afterimages in the right eye was produced second. He then did the same for the afterimage in the left eye by closing the right eye. It may be ~entioned for the sake of clarity that the first afterimage which had been faded to invisibility is regenerated by the fluctuating luminance. The second afterimage could be recognized from its higher brightness, its larger diameter and its position: it was further to the left because of the slightly different fixation positions used. The subject then estimated the vertical coordinate of the centre of the first afterimage with reference to the centre of the second afterimage, Using the scale-with 15' graduations· shown on the TV screen. This
was done for the left eye by closing the right eye and for the right eye by closing the left eye. The subject plotted these observed coordinates on graph paper. Ee was advised to maximize the accuracy of his observations by using all the available time (about 1 minute) and by looking at the afterimages in the left eye and right eye alternately. The diameter of the second and first afterimage was about 8' and 4' respectively while the coordinates were being estimated. The discrepancy between the vertical coordinates of the first afterimage in the left and the right eye was taken as a measure of the fixation disparity introduced by the test disparity in the stimulus, i.e. the value of the nonmotor component of the fusional response but (by definition} of opposite sign. The procedure described above was carried out 10 times for each stimulus condition used. Each fixation disparity presented is the mean of the 10 experimental values obtained.
The measure of the fixation disparity under the specific stimulus conditions used was calibrated in control experiments in which the two afterimages in each eye were formed simultaneously, using masks with two holes for each eye with known physical relative vertical discrepancies between the eyes instead of by successive flashes through a mask with-one hole with unknown vertical discrepancies due to changing vertical alignment of the eyes during the experiments. The results of this control experiment are given in Fig. 2 for the two test subjects used in this study. It may be concluded from these da
ta that the vertical discrepancy in minutes of arc is equal to 92% of the estimated discrepancies in subject ALD and 81% in subject JvZ. It should be noted that the physical discrepancy tends to be overestimated.
RESULTS
The data were obtained from subject ALD (the author) who is highly practised
in initiating motor responses to disparities and in judging singleness of bi-
139

'" DPK/01'~0.7.'
1 $CAl£ UNIT=~~·
' A
o oA) 0/0
0,' 0
~,$~ 0 J'O
o,o 0 ";:'0
,fl'o"
,.o"g ooo
~
/
/'O o'g
0 •' o ~"o o o'
_, PHYSICAl DISPARITY IN SCALE UNTl$
_,
DPH /DE = 0.81 B 1 SCALE UNIT= 15'
_,
PHYSICAL DISPARITY IN SCAL£ UNITS
Fig. 2. The estimated vertical disparity as a function of the physical relative vertical disparity. in scale units (one physical scale unit amounted to 15'). The dotted line was fitted to the experimental data points by linear regression. A) Re-
sults for subject ALD, B) results for subject JvZ.
nocular vision, and in subject JvZ who was unpractised. Both subjects have
normal binocular vision with good stereopsis (threshold< 30" according to the
TNO test with random-dot patterns, distributed by Lam€ris, Utrecht, The Nether-
lands). Subject ALD was corrected for myopia with -0.75 dioptres for both eyes.
Subject JvZ was emmetropic. The monocular Landolt-C visual acuities of both
subjects were better than 5/4.
Fusional amplitudes
The largest disparity at which the fusional response remained stable was
taken as the 'fusional amplitude'. At this fusional amplitude the subjects
perceived a marked departure from singleness in the central fixation disk. The
upper and lower parts of the square and the horizontal lines (if present) near
the square exhibited restlessness, blurring and binocular rivalry. In other
words, at the fusional amplitude the singleness of the stimulus is already de-
teriorating in the central part of the visual field. It has been argued else-
where (Duwaer e>.nd Van den Brink, 1981a) that the lower limit of 'the' diplopia
threshold must already have been passed under these conditions. Activation of
the four dichoptic nonius markers confirmed that both eyes contributed to the
140

percept at the fusional amplitude. These markers were however misaligned in
the vertical direction, indicating the occurrence of a vertical fixation dispa
rity. The magnitude of the disparity estimated on this basis was found to agree
with that determined with the aid of afterimages (see next section).
Increasing the stimulus disparity to a constant level just above the fusio
nal amplitude resulted in a gradually increasing amount of diplopia: the square
was seen as elongated in the vertical direction while the separation between
the two perceived images of the central fixation disk increased. When the hori
zontal lines were present, the deterioration of the singleness of the horizon
tal lines surrounding the square became alternately better and worse. The e
longation of the square in the vertical direction and the increase in separa
tion between the two perceived central disks then tended to stop at positions
where the deterioration of the singleness of the horizontal lines was relative
ly slight. The vertical separation between the two perceived central disks un
der these conditions remained constant, sometimes at about 1° but mostly at a
bout 20 - 2.5°. In the latter case, the vertical side of the 'square' was about
twice as long as the horizontal side. What seemed to happen here was that the
eyes, unable to align on corresponding parts of the stimulus, started to align
on similar non-corresponding parts. Kertesz's stimulus contains an abundance
of these similar non-corresponding parts, because of the periodicity of the ho
rizontal lines in the vertical direction.
The observed fusional amplitudes were 5.2° (right hypo) - 6.3o (right hyper)
in subject ALD and 2.9° (right hypo and hyper) in subject JvZ for the 570 wide
complex stimulus used by Kertesz {1981). Right hypo vertical disparities are
disparities for which the stimulus presented to the right eye was displaced in
a downward direction, whereas the stimulus seen by the left eye was displaced
in an upward direction from zero disparity viewing conditions. We wish to em
phasize that it took our subjects, just like the subject tested by Ellerbrock,
several minutes to achieve this high per=ormance which necessitated looking at
the stimulus with full concentration while trying to blink as little as possi
ble. Otherwise, the fusional amplitudes found were 1° - 2° lower. The values
of the fusional amplitude found here agree with those reported by Kertesz
(1981) but are substantially higher than the typical values reported by Ogle
141

-6 -4 _, 0 ' ' ACO SOUARE ~DISK+ LINES
-20 I _, _, _,
' ' TEST DISPARITY IN DECREES OF ARC
A
-20
--20
-6 -4
J _. _,
_,
I _,
0 ' '
SQUARE+ DISK+ LINES
I 0 ' '
TEST DISPARITY IN DECREES OF ARC
B Fig. 3. Fixation disparity (in minutes of arc) as a function of
the disparity (in degrees of arc) in the stimulus of Fig. 1A for subject ALD (A) and for subject JvZ (B). The length of the vertical bars through the experimental points is equal to twice the standard deviation (n=10) _ The broken vertical bars represent the fusional amplitudes- Positive vertical disparities are disparities for which the stimulus presented to the right eye had a higher position than the stimulus presented to the left eye_
20
and Prangen (1953). This is not surprising, as the vertical disparity was in-
creased much faster in their study_ Deletion of the 50 horizontal lines to lea-
ve a simple square of side 2.5° at the centre of the homogeneous background
field (see Fig_ 1A, B) resulted in fusional amplitudes of 4.1°- 5_2° for sub
ject ALD and 2_3° for subject- JvZ. These values are in agreement with those re-
ported by Ellerbrock (1949)_ It is noteworthy that the fusional amplitudes did
fall under these conditions but only by 25%_ This implies that the advantages
gained by using wide-angle stimuli, which are much more of nuisance to work
with, are very slight and that a simple black square of side 2_5° can elicit
almost the same fusional amplitude as a much larger complex stimulus consisting
of as many as 50 horizontal lines_
142

_, _, _, 0 ,
' ' _, _, _, 0 ' 4 6
"' - 20 20 20
ACO ,_, sQUARE+ DISK T SQUARE + DISK
• t\
' " L " ~ " ' " < " ' ~ ' ~ '
' ! ' 5 5 ' 'l,, ' z z '
" ~
i ' 0 --~ 0 ' 0 > '', > ;; ',,L 0 ' ' ~ ~ ' ' 0 0
l z ' ' z
0 ',,! 0
~ -10 -W ~ -W ' -W X \i " "
-20 -20 -20 -20
-6 -4 -2 0 4 6 -6 -4 -2 4 6
TEST DISPARITY IN OCGREE$ OF ARC TEST DISPARITY IN DEGREES OF ARC
A B Fig. 4. Fixation disparity (in minutes of arc) as a function of
the disparity (in degrees of arc) in the stimulus of Fig. lB. For further details, see legend to Fig. 3.
Nonmotor component of fusional response
The nonmotor component of the fusional response as estimated by the after-
image method is plotted with opposite sign as fixation disparity as a function
of the vertical disparity in Fig. 3 for Kertesz's complex stimulus (see Fig.
lA), and in Fig. 4 for the central square remaining when the 50 horizontal li-
nes of this complex stimulus are removed (see Fig. lB).
It may be seen from the fixation disparity curves in these figures that the
nonmotor component increases more or less linearly with the vertical disparity.
For the complex stimulus with horizontal lines, the maximum vertical fixa-
tion disparity at which a stable fusional response is found amounts to 8' for
subject ALD and 15' for subject JvZ (see Fig. 3). These values are a factor
7-17 lower than the typical values reported by Kertesz (1981). Our values of
the fixation disparities indicate that the nonmotor component of the fusional
response amounts to 2% for subject ALD and 8% for subject JVZ, i.e. a factor
3-20 less than the typical values found by Kertesz (1981). It may be seen from
143

-6 ., _, ' ' 6 .6 _, _,
' 6 I
20 - 20 20
L 20
ACO M
SOUARE ~LINES SOUARE +LINES
" " \
< " k - " < "r 'l - " ~
5 z ~
' >
" ~
" z Q
" X •
~
' 5 ' ' ' '
l+--, '
' " ·- i- 0 > of- !-.; -
- '-!---!--_ " • ~ l
' " ' ' z 'l 0
.lQ-',i
·W ~ -10 \! -20
•
·20 .2()
L I -6 _,
0 6 -6 _, _,
TEST DISPARITY IN DEGREES OF ARC TEST DISPARITY IN DECREES OF ARC
A B Fig. 5. Fixation disparity (in minutes of arc) as a function of the disparity (in degrees of arc) in the stimulus of Fig. lA but the white fixation disk deleted from the centre of the square.
For further details, see legend to Fig. 3.
0
·W
·20
Fig. 4 that the relative contribution of the nonmotor component to the total
fusional response increases slightly when the 50 horizontal lines of the sti-
mulus are removed, because the maximum vertical fixation disparity remains a-
bout the same while the fusional amplitude falls slightly.
The influence of foveal cues for the presence of disparity
The results of the present study indicate that at the fusional amplitude
for the large complex stimulus as used by Kertesz, singleness of vision is
clearly disrupted in the fovea, less clearly disrupted at eccentricities of
1° - 2° and not at all disrupted at larger eccentricities. One might therefore
argue that the maximum fusible fixation disparity is relatively low in the pre-
sent study, as the subjects noticed clear departure from singleness in the fo-
vea. This is, however, not the case as may be concluded from the results of a
control experiment shown in Fig. 5. This control experiment was performed using
144

Kertesz's complex stimulus without the central fixation disk. The centrally fi
xated square was now totally black, so that the subject had no foveal cues at
all about the presence of fixation disparity. In spite of the absence of those
foveal cues, about the same maximum fusible fixation disparities were found.
DISCUSSION
The major findings of the present study may be summarized as follows;
-The fusional amplitudes for vertical disparity in a complex stimulus with a
diameter of 57° consisting of 50 horizontal lines, a central square of side
2.5° and a white fixation disk of diameter 10' at the centre of the square we
re found to amount to 3° - 6° the nonmotor component of which was only 8' -
15', i.e. 2%-10% of the total fusional response;
-Deletion of the 50 horizontal lines, leaving only the small square with the
fixation disk in its middle lowered the fusional amplitude by only 25%, while
the absolute value of the nonmotor components remained the same;
-Deletion of the central fixation disk, thus removing foveal cues for the pre
sence of a nonmotor component, did not increase the nonmotor component.
These findings agree with those reported by Ogle and Prangen (1953) and
Ellerbrock (1949), but differ fundamentally from the data recently published
by Kertesz (1981).
Possible explanations of discrepancies
One possible explanation for the above-mentioned discrepancies might be
that Kertesz did not allow the vergence system sufficient time to settle down
when measuring motor responses. However, the practice to measure stabilized
responses is well recognized in this field; indeed, this practice was expli
citly taken into account by Kertesz in a previous study (Perlmutter and
Kertesz, 1978), and it is highly unlikely that he would have overlooked it he-
re.
Alternatively, one might argue that the discrepancies could be ascribed to
the use of subjective methods to determine the nonmotor component of the fu
sional response in the present study and in that of Ogle and Prangen (1953).
The assessment of vertical fixation disparity in the presept study by the
145
(subjective) afterimage method, giving results similar to those obtained by
the (subjective) dichoptic nonius-line method used by Ogle and Prangen {1953),
must however be regarded as extremely reliable. The afterimage method may be
characterized as a direct method since it measures successive directions of
the visual axis using retinal landmarks. It is worth noting that the dichoptic
nonius line method as such is less direct than the afterimage method, as it
assumes a rigid binocular correspondence in the test subject. The latter is,
however, commonly encountered in subjects with normal binocular vision.
Objective recording of fixation disparities using special contact lenses
attached to the eyes is less direct than it seems, and moreover troublesome to
the test subject and thus less reliable. This method assumes a one-to-one cor
respondence between the angular position of the contact lens and the direction
of the visual axis. This assumption is only valid when there is no slippage
whatsoever of the contact lens and no eye-ball deformation caused by the lens,
when the measurements are properly corrected for angular magnification or mini
fication caused by any optical aids worn by the subject (Ogle, 1971}, and when
artefacts due to head translation are kept to a minimum. Moreover, the special
contact lenses place an unnatural load on the subject and are likely to inter
fere with the visual apparatus and to distract the subject from his visual
task. Thus, if the cause of the discrepancies is some artefact due to the me
thod used for measuring the motor component of the fusional response, in our
opinion this artefact is more likely to be associated with the objective mea
surement, than with the afterimage method.
If the discrepancies are not due to some artefact in the measured motor
component of the fusional response, the only other possibility would seem to
be confusion about the fusion criterion. It has been shown in a previous study
that the maximum fusible retinal disparity depends strongly on the fusion cri
terion used: the transition from unequivocal singleness to unequivocal double
ness is gradual, a whole range of intermediate percepts being observed between
the two extremes (Duwaer and Van den Brink, 198la). Of course, the maximum fu
sible retinal disparity depends even more strongly on the fusion criterion
when the stimuli cover a large part of the visual field; this is illustrated
by the fact that in the present study, at the fusional amplitude for the large
146

complex stimulus of Fig. 1A the singleness of vision was found to be clearly
disrupted in the fovea; less clearly disrupted at eccentricities of 1° - 2°;
and to be preserved at larger eccentricities. The subject's criterion for fu
sion in Kertesz's (1981) study was that the percept of the stimulus lines
should be 'simultaneously unified; single and straight in appearance'. This
criterion does not mention the appearance of the central fixation disk (which
was seen double by our subjects) nor does it specify whether or not the single
ness of the square and lines differed from the singleness of the square and li
nes without vertical disparity (which was the case in the present study).
The fusion criterion used in the present study was in fact determined by the
system controlling vertical vergence eye-movements. Up to a certain fixation
disparity a stable motor response was elicited with, as we have mentioned, a
certain disruption of singleness near the centre of the visual field, but with
the horizontal lines outside the square being seen as 'unified, single and
straight in appearance' in line with Kertesz's fusion criterion. More or less
stable motor responses involving perception of the horizontal lines as unified,
single and straight were also obtained at larger fixation disparities (up to
2.5°). However, these responses were rejected because they were found to be ba
sed on correlation of noncorresponding horizontal lines which are abundantly
present in the complex stimulus used by Kertesz. One possible reason for the
discrepancy between Kertesz's data on the one hand, and the results of the pre
sent study and e.g. Ogle and Prangen (1953) on the other, may therefore be that
Kertesz did not exclude fusional responses based on correlation of si~lar non
corresponding parts of the stimulus with a vertical disparity which is (much)
smaller than the test disparity, whereas these fusional responses were exclu
ded in the other two studies.
Fusional response to horizontal disparity
Kertesz (1981) also studied the fusional response to horizontal disparity.
Two major problems encountered when the horizontal disparity is varied are the
perception of stereoscopic depth and blurring of the image due to accomodation
convergence coupling. These problems may well bias subjects towards use of ve
ry lenient fusion criteria. Moreover, voluntary convergence on an intermediate
147
relative depth or fusion of similar noncorresponding parts of the stimul~s may
also occur even when the physical stimulus is just a single line. When analy-
sing the large maximum fusible horizontal fixation disparities that may be ob-
tained during forced convergence or divergence using only horizontal disparity
as stimulus, one must bear these complications in mind.
ACKNOWLEDGEMENTS
I would like to thank Prof. Dr. G. van den Brink, Dr. C.M.M. de Weert and Mrs. A.E.H. Peters for helpful discussions, Dr. R.H. Bathgate for improving the English, and the Netherlands Organization for the Advancement of Pure Research (Z.W.O.l for financial support.
REFERENCES
Crone R.A. and Everhard-Halm Y. (1975) Optically induced eye torsion. Albrecht v. Graefes Arch. Klin. Exp. Opthal. 195, 231-239.
Ditchburn R.W. (1973) Eye-movements and visual perception. Clarendon Press, Oxford.
Duwaer A.L. (1981) Assessment of retinal image displacements during head movement using an afterimage method. Vision Research, submitted.
Duwaer A.L. and Brink G. van den (1981a) What is the diplopia threshold? Perception & Psychophysics 29, 295-309.
Duwaer A.L. and Brink G. van den (1981b) Foveal diplopia thresholds and fixation disparities. Perception & Psychophysics, in press.
Duwaer A.L., Brink G. van den, Antwerpen G. van and Keemink C.J. (1981) Comparison of subjective and objective measurement of ocular alignment in the vertical direction. Vision Research, submitted.
Ellerbrock V.J. (1949) Experimental investigation of vertical fusional movements. Am. J. Optom. 26, 327-337.
Fender D. and Julesz B. (1967) Extension of Panum's fusional area in binocular stabilized vision. J.O.S.A. 57, 819-830.
Hebbard F.W. (1962) Comparison of subjective and objective measurements of fixation disparity. J.O.S.A. 52, 706-712.
Kertesz A.E. (1981) Effect of stimulus size on fusion and vergence. J.Q.S.A. 71, 289-293.
Ogle K.N. (1971) Optics. Charles C. Thomas, Springfield, Illinois. Ogle K.N., Mussey F. and Prangen A.deH. (1949) Fixation disparity and the fu
sional processes in binocular single vision. Am. J. Ophthal. 32, 1069-1087. Ogle K.N. and Prangen A.deH. (1953) Observations on vertical divergences and
hyperphorias. Archs Ophthal. 49, 313-334. Perlmutter A.L. and Kertesz A.E. (1978) Measurement of human vertical fusional
response. Vision Research 18, 219-223.
Riggs L.A. and Niehl E.W. (1960) Eye movements recorded during convergence and divergence. J.O.S.A. 50, 913-920.
148
v
VALIDITY OF THE
SUBJECTIVE NONIUS-LINE METHOD
TO DETERMINE OCULAR ALIGNMENT
Chapter V deals with the validity of the subjective nonius-line me
thod which is commonly used for obtaining accurate infor~tion about (motor) ocular alignment. This method has been applied in the
experiments described in Chapter III. In this nonius-line methodr the perceived misalignment of two separate, physically aligned lines - each seen by one eye only - is as
sumed to be equal to the amount of ocular misalignment.
Data obtained by this subjective method on the ocular alignment in the vertical direction have been compared with objective recordings
of this ocular alignment under the specific stimulus conditions that
the subjective method was used in the present study.
149

5. 1 COMPARISON OF SUBJECTIVE AND OBJECTIVE
MEASUREMENTS OF OCULAR ALIGNMENT
IN THE VERTICAL DIRECTION
A.L. Duwaer, G. van den Brink, G. van Antwerpen, C.J. Keemink*
ABSTRACT
Ocular alignment on a stimulus with a vertical disparity of up
to 20' has been measured by the subjective nonius-line method
and by objective recording of the position of the eyes. Both methods indicate that the vertical disparity is almost
entirely eliminated by appropriate vergence eye-movements.
The results strongly suggest that the subjective nonius-line
method is valid for determination of the vertical alignment of the eyes, just as the results of previous studies suggest it to
be valid for the determination of horizontal alignment and tor
sional alignment.
INTRODUCTION
The' subjective' nonius-line method is commonly used to obtain information a-
bout ocular alignment. In this method, the perceived misalignment of two physi-
cally aligned dichoptic lines - each seen by one eye only - is assumed to be e-
qual to the amount of ocular misalignment. This subjective method has the major
advantage of providing a way of estimating ocular misalignments down to 0.3' 1 )
without the burdensome use of special contact lenses held to the eyes by sue-
tion, with all the accompanying errors and artefacts this 'objective' method
involves. Various forms of the nonius-line method are used both in clinical
practise (Ogle, Martens and Dyer, 1967; Sheedy, 1980) and in fundamental re-
-x- Department of Biological and Medical Physics, Erasmus University Rotterdam,
P.O. Box 1738, 3000 DR Rotterdam, The Netherlands
!50

search (Kidd, Frisby and Mayhew, 1979; Frisby and Mayhew, 1980; Duwaer and Van
den Brink, 1981a, 1981bl •
The validity of the nonius-line method for determining horizontal alignment
of the eyes has been demonstrated by Hebbard (1962) by direct comparison of the
results of objective and subjective measurements, and can be inferred from a
comparison of subjective measurements by Ogle et al. (1967) on the one hand and
objective measurements by Riggs and Niehl (1960) on the other. The validity of
the nonius-line method for measurement of tor.sional alignment has also been de-
monstrated by direct comparison of the results of objective and subjective mea-
surements (Crone and Everhard-Halm, 1975). However, the validity of the nonius-
line method for determination of verLical alignment can so far only be made
plausible by comparison of subjective data (Ogle and Prang0n, 1953) with objec-
tive data of relatively low accuracy from other studies (Perlmutter and Kertesz,
1978; Houtman, 1979), or on the basis of various other observations (Duwaer and
Van den Brink, 1981a).
The purpose of the present study is to test the validity of the subjective
nonius-line method for determination of the vertical alignment of the eyes by
direct comparison of subjective data with objective recordings of ocular align-
ment obtained by the magnetic-field technique proposed by Robinson (1963) while
using the special contact annuli with sensor coils held to the eyes by suction
that were developed by Collewijn, v.d. Mark and Jansen (1975).
METHODS
Stimulator The stimulator has been described in detail elsewhere (Duwaer and Van den
Brink, 1981b). In short, it is an electronic stereoscope consisting of two HP 1321A displays (white P31 phosphor) mounted 105 em from the subject's eyes with a white background (mean luminance level 3 cd/m2; dimensions 15° x 15°). The line stimuli were generated on the displays by appropriate electronic circuitry.
Stimulus The stimulus is depicted in Fig. 1. Its luminance was adjusted to 1.8 log u
nits above the (contrast) perception threshold. The line width amounted to 1.2'.
The test stimulus consisted of a vertical line of length 10° and two parallel horizontal lines of length 2° at a separation of 2°. The nonius lines at the centre had a length of 20' and a lateral separation of 6'. The parameter in the experiments was the vertical disparity between the test stimuli presented to
151

the two eyes which was controlled with an accuracy of 0.1'. The vertical disparity is defined as positive when the stimulus presented to the right eye is higher than that presented to the left eye. The vertical disparity between the nonius lines could be varied independently.
The subject was instructed to look at the portion of the vertical line between the two nonius lines.
l
DISPARITY
' __ .,. __ --..-
'
R
Fig. 1. Schematic representation of the test stimuli presented to the left (L) and right (R) eye, consisting of a vertical line and two parallel horizontal lines for each eye. The test stimulus depicted contains a negative vertical disparity, i.e. by definition the stimulus presented to the right eye was lower than that presented to the left one. The nonius lines at the centre were used to provide a subjective estimate of ocular mis-
alignment. See text for further details.
Subjective nonius-line method for measurement of ocular alignment
The introduction of vertical disparity in the test stimulus resulted in a
perceived vertical misalignment of the physically aligned nonius lines. This
misalignment was determined by getting the subject to adjust the vertical dis-
parity between the nonius lines until optimum alignment is perceived. If the
nonius-line method is valid, this vertical disparity is equal to the disparity
eliminated by appropriate vergence eye-movements in response to the vertical
disparity in the test stimulus (see e.g. Duwaer and Van den Brink, 1981a). Ex-
periments showed that the vertical disparity between the nonius lines should
then be equal within 3% to the vertical disparity in the test stimulus in the
range between -20' and +20', so that the nonius lines remain approximately in
line when the same vertical disparity was introduced in both the test stimulus
and the nonius lines. This fact was made use of to obtain a fast subjective
152

estimate of ocular alignment during objective measurements with contact annuli
held to the eyes by suction. The subject's task was then reduced to assessing
whether the lines had remained in line during the sampling period of the objec
tive measurements, and reporting this finding.
Objective method for measurement of ocular alignment
The eye positions were recorded by the method described in detail by Robinson
(1963). Scleral contact annuli with an induction coil were attached to the eye.
A vertically oriented electromagnetic field (frequency 14.3 kHz) was generated
around the head by two square coils of side 68 em with a vertical separation of
73 em. An AC potential was induced in each ocular coil, with a magnitude and
phase related in a simple manner to the angular position of that coil in the
vertical direction. A voltage proportional to the sine of the angular position
(which is proportional to the angular position itself within 0.02~ for the ma
ximum range of -20 to +2° used) was obtained by suitable buffering (with PAR
116 transformers), amplifiCation and phase-sensitive detection (with the aid
of two PAR 124A Lock-in amplifiers). The two voltages were recorded on a UV re
corder and sampled with a frequency of 200 HZ by a 10-bit AD convertor control
led by a M6800 microprocessor. Samples taken during the time that the Lock-in
amplifiers were in overload, usually due to blinks, were deleted. The micropro
cessor determined th2 differences between corresponding samples of the two vol
tages (obtained with a 20 vsec intersample time). This difference signal- in
dicating the difference between the angular positions of the two ocular coils
as a function of time - was fed to the UV recorder, while the microprocessor
determined the mean values of the voltages measured during 10-second periods.
The standard deviation of the noise introduced in the difference signal by the
recording system amounted to 0.2'.
The objective method described above assumes a one-to-one correspondence be
tween the voltage induced in the sensor coil of the contact annulus attached to
the eye and the direction of the visual axi·s (i.e. the line from the point of
fixation to the corresponding image point in the centre of the fovea) for a
fixation stimulus at a constant position in space relative to the fixating eye.
This is only true when the contact annulus does not slip across the cornea, when
!53

its shape is precisely constant, when there is no deformation of the eye cau
sed by the suction with which the annulus is held to it and when head movements
are rigorously excluded. In our set-up, the subject's head was fixed using a
bite-board. However, small head displacements, e.g. due to breathing, are still
possible. In fact, artefacts of ±3' due to head displacements were found expe
rimentally in the difference signal when the subject was looking at the stimu
lus on the display screens at a distance of 105 em. These artefacts are due
partly to inhomogeneity of the magnetic field and partly to changes in the po
sition of the stimulus relative to the eye. It is important to realize that the
latter changes in position occur equally for both the test stimulus and the no
nius lines so that they will not affect the subjective measures of ocular align
ment obtained by the nonius-line method when the eyes are allowed ample time to
align to the test stimulus. The major problem in most experiments was, however,
that the voltages induced in the ocular coils indicated that the mean direction
of the visual axis (as determined during the 10-seconds periods) was changing
by up to 2° during a 15-minute session, even though the subject fixed his gaze
on the same position in space. Now it is known that the mean direction of gaze
should be reproducible within 5' to 10' when the subject's head is fixed with
a bite-board (see e.g. Collewijn et al., 1975; Steinman, Cushman and Martins,
1981). This was in fact found to be true for our test subjects too, on the ba
sis of data obtained by an afterimage technique (Duwaer, 1981a) and by quite a
different technique described by Drysdale (1975) 2). It was, therefore, conclu
ded that those changes in the induced voltages do not reflect changes of gaze
by up to 2°, but rather artefacts due to slippage of the contact annulus, gra
dual changes in the shape of the annulus due to stresses built up when it is
initially pressed down on the eye, and deformation of the eye itself; the last
mentioned effect could in fact often be noticed by the subject due to the resul
ting distortion of the perceived_visual field.
The above considerations led us to rely on the objective data only when the
mean angular positions of the eyes measured during the 10-second experimental
periods was reproducible to within 10' for the stimulus without disparity du
ring the course of tile experiment. Unfortunately, this occurred only rarely (in
about 20% of the experiments) •
154
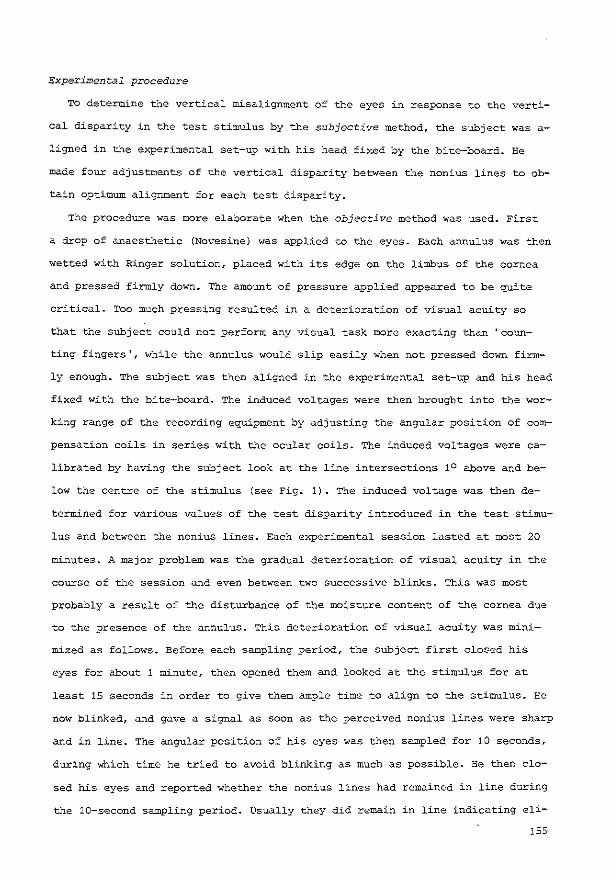
Experimental procedure
TO determine the vertical misalignment of the eyes in response to the verti
cal disparity in the test stimulus by the subjective method, the subject was a
ligned in the experimental set-up with his head fixed by the bite-board. He
made four adjustments of the vertical disparity between the nonius lines to ob
tain optimum alignment for each test disparity.
The procedure was more elaborate when the objective method was used. First
a drop of anaesthetic (Novesine) was applied to the eyes. Each annulus was then
wetted with Ringer solution, placed with its edge on the limbus of the cornea
and pressed firmly down. The amount of pressure applied appeared to be quite
critical. Too much pressing resulted in a deterioration of visual acuity so
that the subject could not perform any visual task more exacting than 'coun
ting fingers', while the annulus would slip easily when not pressed down firm
ly enough. The subject was then aligned in the experimental set-up and his head
fixed with the bite-board. The induced voltages were then brought into the wor
king range of the recording equipment by adjusting the angular position of com
pensation coils in series with the ocular coils. The induced voltages were ca
librated by having the subject look at the line intersections 1o above and be
low the centre of the stimulus (see Fig. 1). The induced voltage was then de
termined for various values of the test disparity introduced in the test stimu
lus and between the nonius lines. Each experimental session lasted at most 20
minutes. A major problem was the gradual deterioration of visual acuity in the
course of the session and even between two successive blinks. This was most
probably a result of the disturbance of the moisture content of the cornea due
to the presence of the annulus. This deterioration of visual acuity was mini
mized as follows. Before each sampling period, the subject first closed his
eyes for about 1 minute, then opened them and looked at the stimulus for at
least 15 seconds in order to give them ample time to align to the stimulus. He
now blinked, and gave a signal as soon as the perceived nonius lines were sharp
and in line. The angular position of his eyes was then sampled for 10 seconds,
during which time he tried to avoid blinking as much as possible. He then clo
sed his eyes and reported whether the nonius lines had remained in line during
the 10-second sampling period. Usually they did remain in line indicating eli-
!55
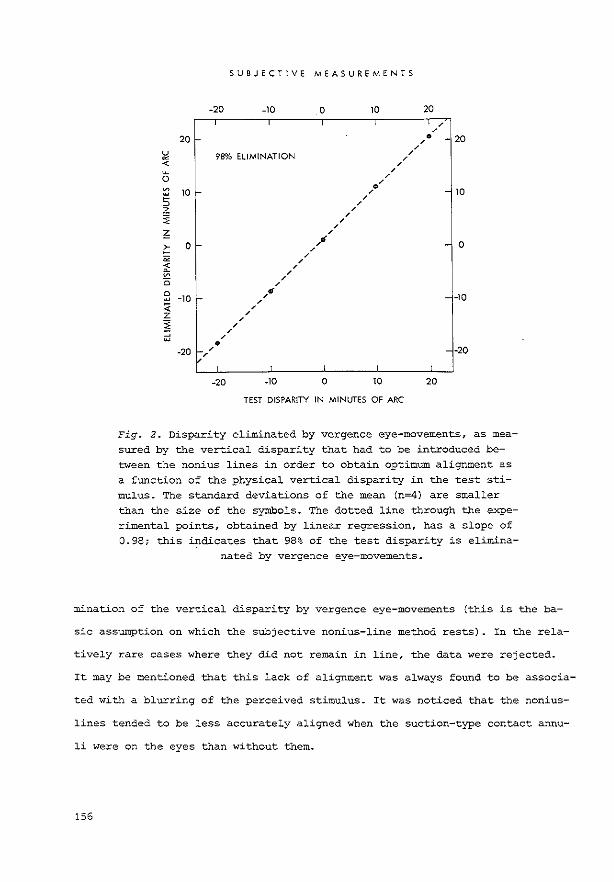
SUBJECTIVE MEASUREMENTS
-20 -10 0 10 20
20 r- 20
9SO/o ELIMINATION
- 10
- 0
--10
-20 -20
-20 -10 0 10 20
TEST DISPARITY IN MINUTES OF ARC
Fig. 2. Disparity eliminated by vergence eye-movements, as mea
sured by the vertical disparity that had to be introduced between the nonius lines in order to obtain optimum alignment as a function of the physical vertical disparity in the test stimulus. The standard deviations of the mean (n=4) are smaller than the size of the symbols. The dotted line through the experimental points, obtained by linear regression, has a slope of 0.98; this ~dicates that 98% of the test disparity is elimina-
nated by vergence eye-movements.
mination of the vertical disparity by vergence eye-movements {this is the ba-
sic assumption on which the subjective nonius-line method rests) . In the rela-
tively rare cases where they did not remain in line, the data were rejected.
It may be mentioned that this lack of alignment was always found to be associa-
ted with a blurring of the perceived stimulus. It was noticed that the nonius-
lines tended to be less accurately aligned when the suction-type contact annu-
li were on the eyes than without them.
!56

OBJECTIVE MEASUREMENTS
-20 -10
20
97"/o ELIMINATION
10 ~
0
' ' 11 • ./' ./'
-20 ./'~ 7
v '12
-20
' ' o'2 ' ' ' '
-10
' '
0
' ' 5 'blO/ 4 ~4
' ./'./' • 8
0
'
10
' 3-' ' '
10
' ' '
TEST DISPARITY JN MINUTES OF ARC
20
' ' ,. 6 ' • 9
'
20
20
- 10
0
-10
-20
Fig. 3. Vertical disparity eliminated by vergence eye-movements as measured by objective recordings, as a function of the test disparity. The position of the vertical scale relative to the experimental points was arbitrarily_ chosen in such a way that the (dotted) regression line through-."the points passed through the origin. The numbers next to th~ ex-i?erimerital points indicate the sequence in which they were obtained. The regression line has a slope of 0.97, indicating 97~ elimination of the test
disparity by vergence eye-movements.
RESL~TS AND DISCUSSION
The results obtained by the subjective method are presented in Fig. 2, and tho-
se by the objective method in Fig. 3. Some typical eye-position recordings are
plotted in Fig. 4. 3).
The subjective data indicate that, apart from an offset of 1', 98% of the
test disparity introduced is eliminated by appropriate vertical vergence eye-
movements; this finding agrees with previous reports obtained with the aid of
dichoptic nonius lines (Ogle and Prangen, 1953; Duwaer and Van den Brink, 1981a)
or bY an afterimage method (Duwaer, 1981b). The above-mentioned offset indicates
157

R
l
R-l
l-----1
1 sec
Fig. 4. Some typical recordings of the vertical position of the left eye (L), the right eye (R) and the discrepancy between the two (R-L) during the experiments leading to (experimental point
11 in) Fig. 3.
the occurrence of a small fixation disparity at all test disparities used. 4 )
The objective data indicate, in excellent agreement with the subjective da-
ta, that 97~ of the test disparity introduced is eliminated by vertical ver-
gence eye-movements. It should be emphasized that the position of the vertical
scale relative to the experimental points was arbitrarily chosen in such a way
that the regression line through these points passed through the origin. This
choice was made because the objective data do not provide information about
the possible occurrence of a fixation disparity when the stimulus contains no
physic~l disparity. The objective data differed from the subjective data in
their much larger scatter up to ± 3'. It has already been indicated in the
!58

Methods section that this scatter reflects experimental errors and artefacts
due e.g. to small head displacements and the presence of the contact annuli on
the eyes. The latter is supported by the eye-position recordings, which show
excellent short-term binocular correlation where these errors and artefacts
are likely to interfere less.
CONCLUSION
Subjective and objective measurements of ocular alignment in the vertical di-
rection to stimuli with vertical disparity give practically identical results,
within the experimental error. This strongly suggests that the subjective no-
nius-line method is valid for determination of the vertical alignment of the
eyes, just as previous reports suggest it to be valid for the determination of
the horizontal alignment (Hebbard, 1962) and torsional alignment (Crone and
Everhard-Ealm, 1975).
It is further noteworthy that the scatter of the subjective data is appre-
ciably less than that of the objective data.
ACKNOWLEDGEMENTS
We would like to thank Dr. G.J. van~er Wildt and Mrs. A.E.H. Peters for helpful discussions, Mr. J.B.P. van Deursen for his technical assistance, Dr. R.H.
Bathgate for improving the English, and the Netherlands Organization for the Advancement of Pure Research (Z.W.O.) for financial support.
REFERENCES
Collewijn H., Mark F. van der and Jansen c. (1975) Precise recording of human
eye mov~ments. Vision Research 15~ 447-450. Crone R.A. and Everhard-Halm Y. (1975) Optically induced eye torsion. A1br. v.
Graefes Archs. K1in. Exp. Ophta1. 195~ 231-239. Drysdale A.E. (1975) The visibility of retinal blood vessels. Vision Research
15, 813-818. Duwaer A.L. (1981a) Assessment of retinal image displacement during head move
ment using an afterimage method. Vision Research~ submitted. Duwaer A.L. (1981b) A second look at the nonmotor component of the fusional
response to vertical disparity using an afterimage method. J.O.S.A.~ submit
ted. Duwaer A.L. and Brink G. van den (1981a) Foveal diplopia thresholds and fixa
tion disparities. Perception ~ Psychophysics~ in press. Duwaer A.L. and Brink G. van den (1981b) Diplopia thresholds and the initiation
159

of vergence eye-movements. Vision Research, in press. Frisby J.P. and Mayhew J.E.w. (1980) The role of spatial frequency tuned chan
nels in vergence control. Vision Research 20, 727-732. Hebbard F.W. {1962) Comparison of subjective and objective measurements of fi
xation disparity. J.O.S.A. 52, 706-712. Houtman W.A. {1979) Verticale vergentie. DOctoral thesis, University of Gro
ningen. Dijkstra Niemeyer, Groningen, The Netherlands. Kidd A.L., Frisby J.P. and Mayhew J.E.W. {1979) Texture contours can facilita
te stereopsis by initiating vergence eye-movements. Nature 280, 830-832. ogle K.N. and Prangen A.deH. {1953) Observations on vertical divergences and
hyperphorias. Archs. Ophthal. 49, 313-334. Ogle K.N., Martens T.G. and Dyer J.A. (1967) Oculomotor imbalance in binocular
vision and fixation disparity. Lea and Febiger, Philadelphia. Perlmutter A.L. and Kertesz A.E. (1978) Measurements of human vertical fusio
nal response. Vision Research 18, 219-223. Riggs L.lL and Niehl E.W. (1960) Eye movements recorded during convergence and
divergence. J.O.S.A. 50, 913-920.
Robinson D.A. (1963) A method of measuring eye-movements using a scleral search coil in a magnetic field. I.E.E.E., Trans. B.M.E. 10, 137-145.
Sheedy J.E. (1980) Fixation disparity analysis of oculomotor imbalance. Am. J.
Optom. & Physiol. Optics 57, 632-639. Steinman R.M., Cushman W.B. and Martins A.J. (1981) The precision of gaze. Hu
man Neurobiology, in press.
NOTES
1. In this paper, all dimensions of stimuli are expressed in degrees of arc and minutes of arc, which for the sake of simplicity are denoted by e.g. 8° or 2' respectively.
2. This technique permitted visualization of both the position of the foveola and that of the fixation target, by getting the subject to look through a blue filter behind a mask with a small hole (Of diameter 1 mm) rotating (at a frequency of about 2 Hz) in a circle (of diameter 3.5 rom) placed at a distance
of about 1.5 em in front of his eye. Under these conditions, the position of the foveola could actually be seen as a dark spot at the centre of an area (of diameter about 1.5°) without images of retinal blood vessels. When the subject fixed his gaze on the fixation point {which was covered by a scale with 10' graduations) , the angular distance between the foveola and the fixation point - apart from small differences in the rotatory movements caused by the rotation of the hole in front of the subject's eye - did not exceed about 10'.
3. The data presented in this paper were obtained from subject ALD (one of the authors), who was corrected for myopia by -0.75 dioptres for both eyes. He had normal (Landolt-C) visual acuity, normal stereopsis (according to the TNO
test with random-dot stereograms) and normal binocular single vision. 4. When the test disparity was zero, physically aligned nonius lines were
not seen in line: the nonius line seen by the right eye had a low2r position than that seen by the left eye. This indicates that the right eye points to a higher position than the left eye.
160
SUMMARY
The present thesis deals with binocular single vision.
By closing one of the two eyes alternately (in particular in the presence of
nearby objects); one can easily see that we are confronted with two different
images of the outside world. Nevertheless, 'iJhen we look at this world with both
eyes we still perceive if for the greater part singly. This in spite of the
fact that the two images often differ so much that the world would be perceived
as clearly double if the same images did not enter the visual system through
different eyes but, projected on top of each other, through the same eye. This
singleness of binocular vision is accomplished by motor processes which use the
eye muscles to direct the eyes towards the same point in space, and by sensory
processes in the brain which avoid doubling of the binocular image.
Interpretation of certain types of differences between the images in the two
eyes results in stereopsis (depth perception) which disappears when one of the
eyes is closed. As a result, the observer can assess the occurrence of these
image differences not only by using the comparatively inconspicuous and inaccu
rate information provided by image doubling, which is the subject of the pre
sent thesis, but also indirectly by using the conspicuous and accurate depth
cue. It was decided to avoid this complication by confining the study to those
situations where these interfering depth effects did not occur.
The processes underlying binocular single vision have been studied in psy
cho-physical experiments. Subjects were asked to make judgments on the percepts
evoked by visual stimuli. The procedures and stimuli chosen were such that they
practically guarante2d that the judgments were always based on the same infer-
!61

mation. In this way the mysteriously variable nature of a person's psyche,
which is unavoidably involved in the judgments, was restricted.
The material of this thesis consists of eight articles which have been sub
mitted for publication to several international journals. In the present the
sis, the articles haven been organized according to their subjects to form
four chapters (II - V) .
In Chapter I (the Synopsis) a brief survey is given of the basic concepts and
problems associated with singleness of binocular vision (like disparity,
retinal disparity, diplopia, diplopia threshold and stereopsis}, followed by
the formulation of the two main problems dealt with in the present thesis.
These problems concern the nature of the sensory processes underlying binocu
lar single vision and the cooperation between these sensory processes and the
corresponding motor processes. A summary is given of the major results of the
se two problems and a third additional problem touched on in several studies
published when the present thesis was nearly finished. The latter problem con
cerns the way binocular single vision is accomplished under highly demanding
conditions. The overall conclusions are given, followed by some concluding re
marks on the origin of the present study and the various snags encountered du
ring its execution.
Chapter II deals with an unresolved controversy in the literature when the pre
sent study was started. This controversy concerned the nature of the sensory
processes underlying binocular single vision. A major traditional view is that
these sensory processes are a fusion m8chanism eliminating the discrepancies
between the images on the retinae of the two eyes (the 'retinal' disparities).
According to the opposing view there is no such fusion mechanism.
Three studies were performed in connection with this controversy. In the
first study the magnitude and nature of the diplopia threshold, that is, the
value of the retinal disparity at which binocular single vision ends, have
been investigated. In the second study the effect of stimulus presentation ti
me on detection and diplopia thresholds for vertical disparities has been de
termined in order to find out whether the processing is aimed at eliminating
162
or revealing these disparities. In the third study the detectability of diffe
rences between two different vertical disparities has been determined as a
function of the reference disparity in order to find out whether this detecta
bility is so much worse around zero disparity (where binocular single vision
occurs} than at comparatively large reference disparities (where diplopia oc
curs) that it has to be assumed that there is a disparity-eliminating process
operating around zero disparity.
The data obtained in these three studies support the view that there is no
sensory fusion mechanism in the visual system. Singleness of binocular vision
despite retinal disparities seems to be due to (functional} failure of a sen
sory detection process aimed at revealing the retinal disparities. This failu
re seems to be primarily due to the tendency of observers to use lenient as
sessment criteria, to the limited accuracy and reproducibility with which dis
parity information about image doubling is coded, and to loss of information
about the sign of the disparity. The latter reflects the fact that positive
and negative retinal disparities - e.g. image in right eye is displaced in an
upward direction and in left eye in a downward direction from the correspon
ding positions in the two eyes, and vice versa - result in the same amount of
doubling of the binocular image.
Chapter III describes the results of two studies of a major aspect associated
with binocular single vision which had not been really tackled before, viz.
the cooperation between vergence eye-movements aimed at minimizing retinal dis
parities by aligning the eyes on the one hand and the processes underlying sen
sory tolerance to these disparities on the other.
In the first study, the magnitude of foveal diplopia thresholds has been
compared with the magnitude of 'fixation' disparities occurring spontaneously
during continuous binocular fixation due to the limited accuracy of (motor)
ocular alignment. Furthermore, the spread of these foveal diplopia thresholds
has been compared with the spread of the fixation disparities. In the second
study, the largest vertical (retinal) disparities (at eccentricities of 0.5
to 4 degrees cf arc in the visual field) that do not cause image doubling ha
ve been compared with the corresponding smallest vertical (retinal) dispari-
163

ties that can initiate vergence eye-movements. In both studies, a subjective
nonius-line method was used to obtain data on ocular alignment (cf. Chapter
~-
A remarkable finding was that vergence eye-movements can be initiated by
vertical disparities as small as the angular distance between the centres of
neighbouring retinal receptors.
The data obtained in the two studies suggest that the key-factor in the co
operation between motor and sensory processes underlying binocular single vi
sion is that the sensorimotor system controlling vergence eye-movements in
response to retinal disparities is more sensitive and accurate than the sen
sory system controlling the psychophysical assessment of these disparities in
terms of image doubling. Retinal disparities, especially those around the fi
xation point, are thus continuously materially eliminated by vergence eye-mo
vements with a more than sufficient accuracy.
Chapter IV deals with binocular single vision under highly demanding condi
tions.
When the present thesis was nearly finished, several studies were published
claiming a quite surprising reduction of the accuracy of (motor) ocular align
ment on a visual stimulus and a rise in the sensory tolerance to retinal dis
parities by up to one order of magnitude under two highly demanding condi
tions, viz. binocular fixation during active head rotation and forced verti
cal divergence of the eyes.
These experiments were replicated in two studies using a specially designed
afterimage method to measure ocular alignment instead of the 'objective' me
thod used in the above-mentioned studies which is based on the use of special
suction-type contact lenses on the eyes.
under the highly demanding conditions, the ocular alignment on the stimulus
was found to remain an order of magnitude better than previously reported.
Chapter V deals with the validity of the subjective nonius-line method which
is commonly used for obtaining accurate information about (motor} ocular
alignment. This method has been applied in the experiments described in Chap-
164
ter III.
In this nonius-line method, the perceived misalignment of two separ~.te,
physically aligned lines - each seen by one eye only - is assumed to be equal
to the amount of ocular misalignment.
Data obtained by this subjective method on the ocular alignment in the ver
tical direction have been compared with objective recordings of this ocular
alignment under the specific stimulus conditions that the subjective method
was used in the present study.
The results strongly suggest that the subjective nonius-line method is va
lid for determination of the vertical alignment of the eyes, just as the re
sults of previous studies suggest it to be valid for the determination of ho
rizontal alignment and torsional alignment.
165

166

SAME NV ATTING
Dit proefschrift handelt over het enkelvoudig waarnemen met twee ogen.
Door afwisselend een van de twee ogen te sluiten kan (vooral in aanwezig
heid van nabije objecten) duidelijk gezien worden dat we twee verschillende
beelden van de buitenwereld "binnen" krijgen. Kijken we nu met beide ogen dan
wordt deze buitenwereld meestal tach grotendeels enkelvoudig waargenomen. Dit,
ondanks het feit dat de twee beelden vaak zoveel verschillen dat de buitenwe
reld duidelijk dubbel waargenomen zou worden als dezelfde twee beelden niet
via verschillende ogen maar op elkaar geprojekteerd via hetzelfde cog binnen
zouden komen. Dit enkelvoudig waarnemen komt tot stand door "motorische" pro
cessen die er met behulp van de oogspieren voor zorgen dat de twee ogen zo
goed mcgelijk dezelfde kant opkijken, en door "sensorische" processen in de
hersenen die verdubb~ling van het met twee ogen waargenomen beeld voorkomen.
Interpretatie van een bepaald soort beeldverschillen leidt tot stereopsis
(diepte zien) die wegvalt als een van de twee ogen gesloten wordt. De waarnemer
kan daardoor het optreden van deze beeldverschillen niet alleen vaststellen door
te !etten op relatief onopvallende en vage beeldverdubbeling, wat het onderwerp
van dit proefschrift is, maar ook indirect aan de hand van opvallende en nauw
keurig waar te nemen diepteverschillen. Besloten is om deze complicatie te ver
mijden door het onderzoek te beperken tot die situaties waarin stereoscopische
diepte percepten niet optraden.
De processen die ten gron~slag liggen aan het enkelvoudig waarnemen met
twee ogen zijn bestudeerd in psychofysische eA~erimenten. Er werd aan proef
personen gevraagd om uitspraken te doen over percepten opgewekt door visuele
167

stimuli. De procedures en stimuli werden zo gekozen dat ze praktisch garan
deerden dat de uitspraken altijd op dezelfde informatie gebaseerd waren. Op
deze manier werd de mysterieuze variabiliteit van de menselijke psyche, die
onvermijdelijk bij deze uitspraken betrokken is, aan banden gelegd.
Het proefschrift is gebaseerd op acht artikels die aangeboden zijn ter pu
blicatie in diverse internationale vaktijdschriften. Deze artikels zijn naar
hun onderwerp gebundeld tot vier hoofdstukken (II - V) .
In Hoofdstuk I (de Synopsis) worden eerst enkele basale begrippen en pro
blemen met betrekking tot het enkelvoudig waarnemen met twee ogen besproken
(zeals dispariteit, retinale dispariteit, diplopia, diplopia drempel en ste
reopsis) , waarna de onderzoeksvragen worden aangegeven. Deze onderzoeksvragen
betreffen de aard van de sensorische processen die ten grondslag liggen- aan
het enkelvoudig waarnemen met twee ogen, en de samenwerking tussen deze senso
rische processen en de bijbehorende motorische processen. Na een korte bespre
king van de hierbij verkregen experimentele resultaten wordt ingegaan op expe
rimenten die gedaan zijn om een door enkele recente publikaties ontstane derde
probleemstelling op te lassen, te weten, de wijze waarop het enkelvoudig waar
nemen met twee ogen onder veeleisende omstandigheden tot stand komt. Het ge
heel wordt afgesloten met samenvattende konklusies gevolgd door enkele slotop
merkingen over de oorsprong van het onderzoek en over de diverse probeersels
en beproevingen
In Hoofdstuk II wordt ingegaan op een onopgelost geschilpunt in de literatuur
bij de start van het onderzoek. Dit geschilpunt betrof de aard van de senso
rische processen die ten grondslag liggen aan het enkelvoudig waarnemen met
twee ogen. Een belangrijke, bijna traditionele opvatting is dat deze senso
rische processen een fusiemechanisme zijn dat de verschillen tussen de beelden
op de netvliezen van de twee ogen (de "retinale" dispariteiten) elimineert.
Volgens het hiertegen opponerende gezichtspunt bestaat er niet zoiets als een
fusiemechanisme.
In dit kader zijn drie deelonderzoeken uitgevoerd. In het eerste deelonder-
168

zoek zijn de grootte en aard onderzocht van de dubbelbeeld drempel die aan
geeft vanaf welke retinale dispariteit niet meer enkelvoudig wordt waargenomen
met twee ogen. In het tweede deelonderzoek is het effect van de presentatie
tijd van de stimulus op de detectie en dubbelbeeld drempels voor verticale
dispariteiten onderzocht teneinde na te gaan of het verwerkingsmechanisme de
dispariteiten elimineert dan wel onthult. In het derde deelonderzoek is de de
tecteerbaarheid van verschillen tussen twee verschillende verticale dispari
teiten bepaald als functie van de referentie dispariteit teneinde na te gaan
of deze detecteerbaarheid random de nuldispariteit (waar enkelvoudig wordt
waargenomen) z6 veel slechter is dan bij relatief grate referentie disparitei
ten (waarbij dubbelbeelden worden gezien) dat aangenomen meet worden dat er
random de nuldispariteit een speciaal mechanisme werkzaam is dat dispariteiten
elimineert.
De in deze drie deelonderzoeken verkregen resultaten bleken het standpunt
te staven dat het visuele systeem geen sensorisch fusie mechanisme herbergt.
Het enkelvoudig waarnemen met twee ogen ondanks de aanwezigheid van retinale
dispariteiten lijkt het gevolg te zijn van het (functionele) tekort schieten
van een sensorisch detectie proces dat erop uit is de aanwezigheid van retina
le dispariteiten te onthullen. Dit tekort schieten moet toegeschreven worden
aan de neiging die bij proefpersonen bestaat om tolerante beoordelingskriteria
te hanteren1 aan de beperkte nauwkeurigheid en reproduceerbaarheid waarmee dis
pariteitsinformatie over beeldverdubbeling verwerkt wordt en aan verlies van
informatie over het teken van dispariteit. Dit laatste geeft uitdrukking aan
het feit dat positieve en negatieve dispariteiten (bijvoorbeeld het beeld van
de stimulus in het linker oog omhoog en in het rechter oog omlaag verschoven
ten opzichte van de corresponderende lokaties in de twee ogen1 en vice-versa)
dezelfde mate van waargenomen verdubbeling geven.
In Hoofdstuk III worden twee deelonderzoeken gepresenteerd die betrekking heb
ben op een belangrijk aspect van het enkelvoudig waarnemen met twee ogen dat
nag niet echt eerder was onderzocht. Dit aspect betreft de samenwerking tussen
enerzijds de vergentie bewegingen van de ogen die retinale dispariteiten mini
maliseren door de ogen uit te richten en anderzijds de processen die ten grond-
169
slag liggen aan sensorische tolerantie voor deze dispariteiten.
In het eerste deelonderzoek is de grootte van foveale dubbelbeeld drempels
vergeleken met de grootte van de "fixatie" dispariteiten die spontaan optreden
bij continue fixatie als gevolg van onnauwkeurigheid in de (motorische) uit
richting van de ogen. Bovendien is de spreiding van deze foveale dubbelbeeld
drempels vergeleken met de spreiding van de fixatie dispariteiten. In het
tweede deelonderzoek zijn de grootste verticale (retinale) dispariteiten (op
eccentriciteiten van 0.5 tot 4 booggraden in het gezichtsveld) die nag geen
bee·ldverdubbeling geven vergeleken met de corresponderende kleinste verticale
(retinale) dispariteiten die vergentie bewegingen van de ogen kunnen initieren.
In beide deelonderzoeken is een subjectieve nonius-lijn methode gebruikt om
informatie te verkrijgen over de uitrichting van de ogen (vgl. Eoofdstuk V).
Een opmerkelijke vondst was dat vergentie bewegingen van de ogen opgewekt
kunnen worden door verticale dispariteiten die zo klein zijn als de afstand
tussen de middens van aangrenzende receptoren in het netvlies.
De verkregen resultaten suggereren dat de grondslag van de samenwerking
tussen motorische en sensorische processen die ten grondslag liggen aan het
enkelvoudig waarnemen met twee ogen is, dat het motorische systeem dat de ver
gentie bewegingen in reactie op retinale dispariteiten stuurt gevoeliger en
nauwkeuriger is dan het sensorische systeem waarmee de psychofysische beoor
deling van deze dispariteiten in termen van beeldverdubbeling tot stand komt.
Retinale dispariteiten, vooral die random het fixatiepunt, worden dus voortdu
rend motorisch weggewerkt door vergentie beweginger. van de ogen met een nauw
keurigheid die meer dan voldoende is.
In Hoofdstuk IV wordt ingegaan op enkelzien met twee ogen onder veeleisende
omstandigheden.
Teen het onderzoek voor dit proefschrift bijna beeindigd was verschenen er
enkele publikaties waarin gesuggereerd werd dat tijdens twee specifieke veel
eisende omstandigheden de (motorische) uitrichting van de twee ogen op een vi
suele stimulus verrassend veel zou verslechteren. Omdat nag steeds enkelvoudig
zou worden waargenomen met twee ogen zou de sensorische tolerantie voor retina-
170
le dispariteiten aanzienlijk grater moeten zijn geworden (ongeveer een factor
10).
In de ene situatie kreeg de proefpersoon de opdracht zo geed mogelijk met
beide ogen naar een bepaalde stimulus te blijven kijken terwijl ondertussen
het hoofd in de horizontale richting heen en weer bewogen moest worden. In de
andere situatie werd de proefpersoon geconfronteerd met een stimulus die voor
het linker oog veel boger stond (tot 6 booggraden) dan voor het rechter oog
(of vice versa) •
De bovengenoemde experimenten zijn herhaald in twee deelonderzoeken waarbij
de uitrichting van de ogen gemeten is met een speciaal ontworper- nabeeld me
thode in plaats van met de objectieve methode die in de bovengenoemde gepubli
ceerde onderzoeken gebruikt is en waarbij de richtingen van de visuele assen
van de twee ogen gemeten worden met behulp van speciale, op de ogen vastgezo
gen kontaktlenzen.
De uitrichting van de ogen op de stimulus bleek onder de veeleisende om
standigheden een factor 10 beter te blijven dan in de voorgaande studies ge
rapporteerd was.
In Hoofdstuk V wordt ingegaan op de geldigheid van de subjectieve nonius-lijn
methode, die veel gebruikt wordt om nauwkeurige informatie te verkrijgen over
de (motorische) uitrichting van de ogen. Deze nonius-lijn methode is bij de ex
perimenteD beschreven in hoofdstuk III toegepast.
Bij de subjectieve nonius-lijn methode wordt verondersteld dat de waarge
nomen relatieve verschuiving van twee onderling gescheiden maar fysisch uitge
lijnde ncnius lijnen, die ieder afzonderlijk met slechts een oog gezien kunnen
worden, gelijk is aan de mate waarin de ogen niet uitgericht zijn.
In een deelonderzoek zijn subjectief verkregen gegevens over de verticale
uitrichting van de ogen vergeleken met objectieve registratie van deze uit
richting onder de specifieke stimulus condities waarbij de subjectieve nonius
lijn methode in het onderzoek voor dit proefschrift gebruikt is.
De verkregen resultaten duiden erop dat de subjectieve nonius-lijn methode
voor de bepaling van de uitrichting van de ogen in de verticale richting gel-
171

dig is, evenals de resultaten van eerdere studies erop duiden dat deze methode
geldig is ~ocr de bepaling van de horizontale en torsionale uitrichting.
172

CURRICULUM VITAE
De schrijver van dit proefschrift werd geboren op 22 juni 1953 te Makassar in Indonesie. In 1970 behaalde hij het diploma HBS-B aan de Christelijke Scholengemeenschap te Voorburg (Z.H.). Van 1970 t/m 1975 studeerde hij technis~he natuurkunde aan de Technische Hogeschool te Delft. In de afstudecrfase werden
twee onderzoeken gedaan. In het eerste onderzoek is de bruikbaarheid van de "contrast evoked potential" voor objectieve perimetrie (gezichtsveld onderzoek) nagegaan. In het tweede onderzoek zijn in elektrofysiologische experimenten de spatiele sommatie eigenschappen van ganglioncellen in het geisoleerde netvlies van de goudvis onderzocht. Beide onderzoeken zijn uitgevoerd op bet Laboratorium voor Medische Fysica van de Universiteit van Amsterdam onder leiding van Prof. Dr. Ir. E. Spekreijse, waarbij Prof. Dr. G. van den Brink als
mentor van de TE Delft optrad. Na het behalen van het ingenieursexamen in januari 1976 heeft hij ruim twee jaar als wetenschappelijk medewerker gewerkt op zowel het Laboratorium voor Medische Fysica te Amsterdam (via de Gezondheidsorganisatie TNO) als op het Interuniversitair Oogheelkundig Instituut te Amsterdam onder leiding van Prof. Dr. L.H. van der Tweel en Prof. Dr. Ir. H. Spekreijse. In deze periode is voornamelijk toegepast visueel onderzoek bij Multiple Sclerose patienten gedaan. Bet betrof hier een evaluatie van de "visual evoked potential" als diagnose middel en het verrichten van "uitsteltijd" perimetrie. Daarnaast is de "contrast evoked potential" in een systeem-analytische benadering met behulp van temporele amplitude - en frequentiemodulatie onderzocht. Vanaf april 1978 is hij als wetenschappelijk onderzoeker via de Nederlandse Organisatie voor Zuiver Wetenschappelijk Onderzoek (Z.W.O.) en de Nederlandse Stichting voor Psychonomie onder leiding van Prof. Dr. G. van den Brink werkzaam op de afdeling Biologische en Medische Natuurkunde van de Erasmus Universiteit Rotterdam, waarbij aan het in dit proefschrift beschreven
onderzoek gewerkt is.
173

1 1 1 1 1 1 1 1 1 1 1 1 1 1 1 1 1 1 1 1 1 1 1 1 1 1 1 1 1 1 1 1 1 1 1 1 1 1 1

