binge drinking - child trends · binge drinking is a common form of alcohol consumption among...
TRANSCRIPT

Binge Drinking
Updated: August 2016

Binge Drinking
August 2016
2 | P a g e
Binge drinking among high schoolers declined during the 2000s, and is now at
record low levels; however, as of 2015, nearly one in five (17 percent) 12th-graders
reported this behavior.
Importance
Binge drinking is a common form of alcohol consumption among adolescents.1 Alcohol use among youth is
associated with a wide variety of other risky behaviors and poor outcomes, including unprotected sexual
intercourse, vulnerability to coerced sexual activity, the use of marijuana, and poor academic
performance.2,3 Binge drinking, in particular, is associated with poor school performance, and involvement in
other health risk behaviors, such as riding with a driver who has been drinking, cigarette smoking, sexual
activity, being a victim of dating violence, attempting suicide, and using illicit drugs.4 Consuming larger
quantities of alcohol is also associated, among young women, with benign breast disease, a risk factor for
cancer.5 In 2014, according to the Fatality Analysis Reporting System, 26 percent of young drivers who were
involved in fatal crashes had alcohol in their system.6
Alcohol use among adolescents is also related to an increased risk of alcohol dependence in adulthood.
Binge drinking can contribute to many health disorders, including cancer, liver, pancreatic and
cardiovascular diseases, as well as to a variety of gastrointestinal problems, neurological disorders and
reproductive system disorders.7 Contextual risk factors associated with adolescent drinking include having
alcoholic parents; a lack of parental support, monitoring, and communication; and having peers who drink.8,9

Binge Drinking
August 2016
3 | P a g e
Trends
The proportion of 12th-graders who reported binge drinking peaked in the early 1980s at 41 percent, before
falling sharply through the rest of the 1980s and early 1990s, except for a small increase between 1985 and
1987. The rate of 12th-grade binge-drinkers rose again throughout the 1990s, from a low of 28 percent in
1991 to a high of 32 percent in 1998, before resuming a downward trend throughout the last decade.
Between 2000 and 2015, the proportion of students in grades eight, ten, and twelve who reported binge
drinking declined by 58, 52, and 42 percent, respectively. (Figure 1)
Differences by Age
Twelfth-graders are nearly four times as likely to report heavy drinking as eighth-graders. In 2015, 17
percent of twelfth-graders reported binge drinking, compared with 11 percent of tenth-graders, and 5 percent
of eighth-graders.10 (Figure 1)
10.9
13.1
4.6
21.0
24.1
10.9
36.8
41.4
27.5
31.5
23.7
17.2
0
10
20
30
40
50
1974 1978 1982 1986 1990 1994 1998 2002 2006 2010 2014
Nu
mb
er
Percentage of Students Who Report Binge Drinking1, by Grade: 1976-2015
Eighth Grade
Tenth Grade
Twelfth Grade
Figure 1
Note:There is reason to believe that eighth graders overreport binge drinking. For more information please see Monitoring the Future national
survey results on drug use, 1975-2000. Volume 1: Secondary school students (NIH Publication No. 01-4924) Chapter 4 footnote 27.1 Binge drinking is defined as having five or more drinks in a row at least once in the prior two-week period.
Source: Johnston, L. D., O’Malley, P. M., Miech, R. A., Bachman, J. G., & Schulenberg, J. E. (2016).
Demographic subgroup trends among adolescents in the use of various licit and illicit drugs: 1975 -2015 (Monitoring the Future Occasional Paper No. 86). Ann Arbor, MI: Institute for Social Research. Available at:
http://monitoringthefuture.org/pubs/occpapers/mtf-occ86.pdf. Tables 93-95

Binge Drinking
August 2016
4 | P a g e
Differences by Gender
At eighth and tenth grades, roughly equal proportions of boys and girls engage in binge drinking. However,
by twelfth grade, boys are more likely than girls to have five or more drinks on one occasion (19 and 15
percent, respectively, in 2015). (Appendix 1)
Differences by Race and Hispanic Origin11
In 2015, Hispanic students were more likely than black students to engage in heavy drinking at all three
grade levels. In eighth grade, white students were equally likely to engage in heavy drinking as black
students, while in tenth and twelfth grade they were more likely to do so than black students. Moreover, in
eighth grade, white students were less likely than Hispanic students to drink heavily (four and five percent,
respectively), but in twelfth grade they were more likely to do so (21 and 19 percent, respectively). Hispanics
and whites were equally likely to drink heavily in tenth grade. (Figure 2)
4.0
13.0
21.2
5.1 6.9
9.8
5.4
13.2
18.5
0
10
20
30
40
50
8th grade 10th grade 12th grade
Pe
rce
nt
Percentage of Students in Eighth1, Tenth, and Twelfth GradesReporting Binge Drinking2, by Race and Hispanic Origin: 2015
Non-Hispanic White
Non-Hispanic Black
Hispanic
Source: Johnston, L. D., O’Malley, P. M., Miech, R. A., Bachman, J. G., & Schulenberg, J. E. (2016).
Demographic subgroup trends among adolescents in the use of various licit and illicit drugs: 1975 -2015 (Monitoring the Future Occasional Paper No. 86). Ann Arbor, MI: Institute for Social Research. Available at:
http://monitoringthefuture.org/pubs/occpapers/mtf-occ86.pdf. Tables 93-95
1 There is reason to believe that eighth graders overreport binge drinking. For more information please see Monitoring the Future national
survey results on drug use, 1975-2000. Volume 1: Secondary school students (NIH Publication No. 01-4924) Chapter 4 footnote 27.2 Binge drinking is defined as having five or more drinks in a row at least once in the prior two-week period.
Figure 2

Binge Drinking
August 2016
5 | P a g e
Differences by College Plans
Students are less likely to binge drink if they plan to complete four years or more of college than if they have
no such plans. For instance, in 2015, 10 percent of tenth-graders who planned to complete four years of
college reported binge drinking, compared with 18 percent who had no such plans. This relationship is
stronger among younger students, though it is still evident in grade twelve. (Figure 3)
10.5
18.3
21.5
4.1
10.1
16.4
0
10
20
30
40
50
Eighth Grade Tenth Grade Twelfth Grade
Pe
rce
nt
Percentage of Students in Eighth1, Tenth, and Twelfth GradesReporting Binge Drinking2, by College Plans: 2015
None or under 4 years
Complete 4 years
Figure 3
Source: Johnston, L. D., O’Malley, P. M., Miech, R. A., Bachman, J. G., & Schulenberg, J. E. (2016).
Demographic subgroup trends among adolescents in the use of various licit and illicit drugs: 1975 -2015 (Monitoring the Future Occasional Paper No. 86). Ann Arbor, MI: Institute for Social Research. Available at:
http://monitoringthefuture.org/pubs/occpapers/mtf-occ86.pdf. Tables 93-95
1 There is reason to believe that eighth graders overreport binge drinking. For more information please see Monitoring the Future national
survey results on drug use, 1975-2000. Volume 1: Secondary school students (NIH Publication No. 01-4924) Chapter 4 footnote 27.2 Binge drinking is defined as having five or more drinks in a row at least once in the prior two-week period.

Binge Drinking
August 2016
6 | P a g e
State and Local Estimates
2015 estimates for binge drinking are available for high school students (grades 9-12) for select
states and cities from the Youth Risk Behavior Survey (YRBS) at
http://www.cdc.gov/HealthyYouth/yrbs/index.htm
For 2013-2014, state estimates for binge drinking among youth ages 12-17 and 18-25 (within the
prior month) are available from the National Survey on Drug Use and Health at
http://www.samhsa.gov/data/sites/default/files/NSDUHsaePercents2014.pdf . (Table 10).
NOTE: Estimates of drug use from the National Survey on Drug Use and Health (NSDUH), used to generate
these state-level estimates, are generally lower than estimates generated by the Monitoring the Future
Survey (MTF). Since the MTF was the source of the national estimates presented in this indicator, users
should not make direct comparisons of estimates made from the two sources. For information on
methodological differences in the surveys that may be causing these differences in estimates, see:
Harrison, L.D. (2001). Understanding the differences in youth drug prevalence rates produced by the MTF,
NHSDA, and YRBS studies. Journal of Drug Issues, 31(3), pp. 665-694.
International Estimates
International estimates of lifetime and 30-day binge drinking incidences are available from the European
School Survey on Alcohol and Other Drugs (ESPAD) 2011 report, available at:
http://www.espad.org/en/Reports--Documents/ESPAD-Reports/ (Tables 23a and 23b).
National Goals
Through its Healthy People 2020 initiative, the federal government has set several national goals to reduce
binge drinking among all age groups. One goal, based on the Monitoring the Future data, is to reduce the
proportion of high school seniors who engaged in binge drinking in the last two weeks, from 25.2 percent in
2009 to 22.7 percent in 2020. A second goal, based on the National Survey on Drug Use and Health, is to
reduce the proportion of 12- to 17-year-olds who engaged in binge drinking in the last month, from 9.5
percent in 2008 to 8.6 percent in 2020.
More information is available at:
www.healthypeople.gov/2020/topicsobjectives2020/objectiveslist.aspx?topicId=40
(See goal SA-14)

Binge Drinking
August 2016
7 | P a g e
What Works to Make Progress on This Indicator
See “What Works for Preventing and Stopping Substance Abuse in Adolescents: Lessons From
Experimental Evaluations and Interventions.” Available at http://www.childtrends.org/wp-
content/uploads/2013/03/Child_Trends-2008_05_20_FS_WhatWorksSub.pdf
Also, see Child Trends’ LINKS database (“Lifecourse Interventions to Nurture Kids Successfully”), for
reviews of many rigorously evaluated programs, including the following which have been shown to be
effective at reducing risky drinking behavior:
Adolescent Alcohol Prevention Trial: www.childtrends.org/?programs=adolescent-alcohol-
prevention-trial-aapt
Adolescent Transitions Program – Comprehensive: www.childtrends.org/?programs=adolescent-
transitions-program-comprehensive
Alcohol Misuse Prevention Study (AMPS): www.childtrends.org/?programs=alcohol-misuse-
prevention-study-amps
Alcohol Skills Training Program: www.childtrends.org/?programs=alcohol-skills-training-program-2
All Stars: www.childtrends.org/?programs=all-stars
Behavioral Economic Supplement to Motivational Interventions:
www.childtrends.org/?programs=behavioral-economic-supplement-to-motivational-interventions
Bicultural Competence Skills Program (BCSP): www.childtrends.org/?programs=bicultural-
competence-skills-program-bcsp
Brief Alcohol Screening and Intervention of College Students (BASICS):
www.childtrends.org/?programs=brief-alcohol-screening-and-intervention-of-college-students-
basics
Brief Strategic Family Therapy (BSFT): www.childtrends.org/?programs=10979
CHOICE: www.childtrends.org/?programs=choice
Class Action – Project Northland Phase 2: www.childtrends.org/?programs=class-action-project-
northland-phase-2
Communities That Care: www.childtrends.org/?programs=communities-that-care

Binge Drinking
August 2016
8 | P a g e
Event-Specific Prevention: www.childtrends.org/?programs=event-specific-prevention
Family Matters: www.childtrends.org/?programs=family-matters
Focus on Youth Plus ImPACT (FOY+ImPACT): http://www.childtrends.org/?programs=9591
Friendly PEERsuasion: www.childtrends.org/?programs=friendly-peersuasion
Guiding Good Choices (GGC): www.childtrends.org/?programs=guiding-good-choices
Life Skills Training (LST): www.childtrends.org/?programs=life-skills-training-lst
LionsQuest Skills for Adolescence: www.childtrends.org/?programs=lionsquest-skills-for-
adolescence
Motivational Brief Intervention for High-Risk College Student Drinkers:
www.childtrends.org/?programs=motivational-brief-intervention-for-high-risk-college-student-
drinkers
Multidimensional Family Therapy (MDFT): www.childtrends.org/?programs=multidimensional-
family-therapy-mdft
Positive Action Program : www.childtrends.org/?programs=positive-action-program
Positive Youth Development Program: www.childtrends.org/?programs=positive-youth-
development-program
Project ALERT: www.childtrends.org/?programs=project-alert
Project Northland: www.childtrends.org/?programs=project-northland
Project STAR: www.childtrends.org/?programs=project-star-formerly-the-midwestern-prevention-
project
Project Towards No Drug Abuse: www.childtrends.org/?programs=project-towards-no-drug-abuse
Reconnecting Youth: www.childtrends.org/?programs=reconnecting-youth
Returning Educated African-American and Latino Men to Enriched Neighborhoods (REAL MEN):
www.childtrends.org/?programs=returning-educated-african-american-and-latino-men-to-enriched-
neighborhoods-real-men-2
SafeERteens: www.childtrends.org/?programs=saferteens
STARS (Start Taking Alcohol Risks Seriously) for Families: www.childtrends.org/?programs=stars-
start-taking-alcohol-risks-seriously-for-families

Binge Drinking
August 2016
9 | P a g e
Strong African American Families (SAAF): www.childtrends.org/?programs=strong-african-
american-families-saaf
Support to Reunite, Involve, and Value Each Other (STRIVE):
http://www.childtrends.org/?programs=support-to-reunite-involve-and-value-each-other-strive
Teen Intervene: www.childtrends.org/?programs=teen-intervene
The Gatehouse Project: www.childtrends.org/?programs=the-gatehouse-project
The Strengthening Families Program (10-14): www.childtrends.org/?programs=strengthening-
families-program-for-parents-and-youth-10-14
Thinking Not Drinking: www.childtrends.org/?programs=thinking-not-drinking
Utrecht Coping Power Program: www.childtrends.org/?programs=utrecht-coping-power-program
Related Indicators
Drunk Driving: http://www.childtrends.org/?indicators=drunk-driving
Heavy Drinking Among Parents: http://www.childtrends.org/?indicators=heavy-drinking-among-
parents
Substance-Free Youth: http://www.childtrends.org/?indicators=substance-free-youth

Binge Drinking
August 2016
10 | P a g e
Definition
Students were asked whether they had imbibed five or more drinks in a row at least once in the two-week
period prior to the survey. Dropouts and students who were absent on the day of the survey are not included
in the results. For detailed analysis of how those omissions may affect results, see: Miech, R. A., Johnston,
L. D., O'Malley, P. M., Bachman, J. G., & Schulenberg, J. E. (2016). Monitoring the Future national survey
results on drug use, 1975-2015. Volume I: Secondary school students. Appendix A. Ann Arbor: Institute for
Social Research, The University of Michigan. Available at
http://monitoringthefuture.org/pubs/monographs/mtf-vol1_2015.pdf
Data Source
Johnston, L. D., O’Malley, P. M., Miech, R. A., Bachman, J. G., & Schulenberg, J. E. (2016). Demographic
subgroup trends among adolescents in the use of various licit and illicit drugs: 1975-2015 (Monitoring the
Future Occasional Paper No. 86). Ann Arbor, MI: Institute for Social Research. Available at:
http://monitoringthefuture.org/pubs/occpapers/mtf-occ86.pdf. Tables 93-95
Raw Data Source
The Monitoring the Future Survey
http://www.monitoringthefuture.org

Binge Drinking
August 2016
11 | P a g e
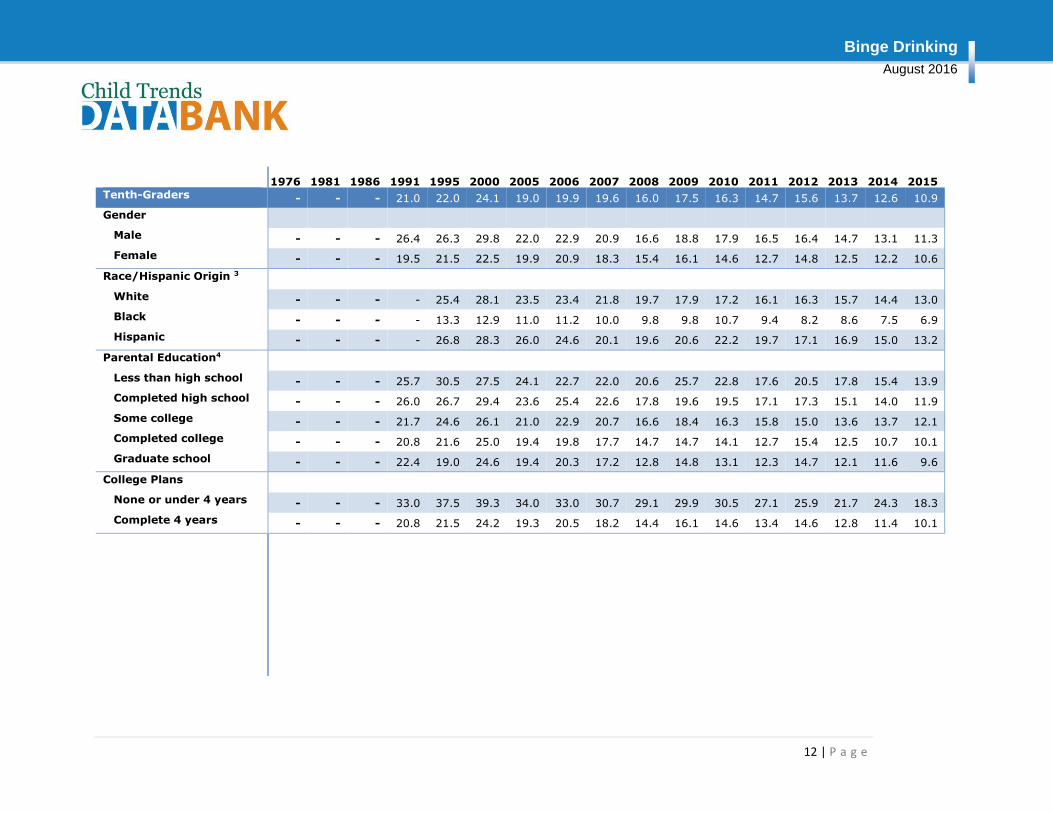
Appendix 1 - Binge Drinking1: Percentage of Students in Grades 8, 10, and 12 who Report Having Had Five or More Drinks in a Row in the Previous Two Weeks: Selected Years, 1976-2015
1976 1981 1986 1991 1995 2000 2005 2006 2007 2008 2009 2010 2011 2012 2013 2014 2015
Eighth-Graders2 - - - 10.9 12.3 11.7 8.4 8.7 8.3 8.1 7.8 7.2 6.4 5.1 5.1 4.1 4.6
Gender
Male - - - 12.1 12.5 11.7 8.2 8.6 8.2 8.1 7.8 6.5 6.1 4.6 4.5 3.5 4.6
Female - - - 9.5 12.1 11.3 8.6 8.5 8.2 8.0 7.7 7.8 6.5 5.5 5.7 4.6 4.6
Race/Hispanic Origin 3
White - - - - 12.1 13.0 9.0 8.4 8.0 7.8 7.7 7.1 6.2 4.9 4.2 4.2 4.0
Black - - - - 8.3 7.3 6.1 5.7 5.6 5.7 5.2 5.3 5.1 4.3 4.5 4.4 4.1
Hispanic - - - - 18.4 16.0 12.1 11.6 12.5 12.3 11.5 10.8 10.4 9.9 7.8 5.7 5.4
Parental Education4
Less than high school - - - 18.3 20.1 18.9 14.4 13.3 15.5 17.0 15.2 12.0 11.0 9.5 9.5 5.7 7.5
Completed high school - - - 12.6 14.8 15.3 10.7 10.6 10.5 10.5 9.5 9.3 8.8 7.6 6.7 5.4 5.8
Some college - - - 10.7 13.3 11.0 9.4 9.9 9.2 7.9 8.7 8.0 7.2 5.3 6.4 4.9 4.9
Completed college - - - 8.8 9.3 8.2 6.4 6.7 5.5 5.7 5.3 5.7 4.6 3.8 3.0 3.4 3.1
Graduate school - - - 8.8 8.7 9.5 5.0 5.9 5.0 4.7 4.7 4.3 4.1 2.0 3.9 3.0 3.6
College Plans
None or under 4 years - - - 21.1 25.0 25.0 21.0 19.3 21.5 21.3 19.1 17.6 15.6 15.3 14.2 9.9 10.5
Complete 4 years - - - 9.3 10.8 10.1 7.2 7.6 7.1 7.0 6.8 6.3 5.7 4.4 4.5 3.7 4.1
Binge Drinking
August 2016
12 | P a g e
1976 1981 1986 1991 1995 2000 2005 2006 2007 2008 2009 2010 2011 2012 2013 2014 2015 Tenth-Graders - - - 21.0 22.0 24.1 19.0 19.9 19.6 16.0 17.5 16.3 14.7 15.6 13.7 12.6 10.9
Gender
Male - - - 26.4 26.3 29.8 22.0 22.9 20.9 16.6 18.8 17.9 16.5 16.4 14.7 13.1 11.3
Female - - - 19.5 21.5 22.5 19.9 20.9 18.3 15.4 16.1 14.6 12.7 14.8 12.5 12.2 10.6
Race/Hispanic Origin 3
White - - - - 25.4 28.1 23.5 23.4 21.8 19.7 17.9 17.2 16.1 16.3 15.7 14.4 13.0
Black - - - - 13.3 12.9 11.0 11.2 10.0 9.8 9.8 10.7 9.4 8.2 8.6 7.5 6.9
Hispanic - - - - 26.8 28.3 26.0 24.6 20.1 19.6 20.6 22.2 19.7 17.1 16.9 15.0 13.2
Parental Education4
Less than high school - - - 25.7 30.5 27.5 24.1 22.7 22.0 20.6 25.7 22.8 17.6 20.5 17.8 15.4 13.9
Completed high school - - - 26.0 26.7 29.4 23.6 25.4 22.6 17.8 19.6 19.5 17.1 17.3 15.1 14.0 11.9
Some college - - - 21.7 24.6 26.1 21.0 22.9 20.7 16.6 18.4 16.3 15.8 15.0 13.6 13.7 12.1
Completed college - - - 20.8 21.6 25.0 19.4 19.8 17.7 14.7 14.7 14.1 12.7 15.4 12.5 10.7 10.1
Graduate school - - - 22.4 19.0 24.6 19.4 20.3 17.2 12.8 14.8 13.1 12.3 14.7 12.1 11.6 9.6
College Plans
None or under 4 years - - - 33.0 37.5 39.3 34.0 33.0 30.7 29.1 29.9 30.5 27.1 25.9 21.7 24.3 18.3
Complete 4 years - - - 20.8 21.5 24.2 19.3 20.5 18.2 14.4 16.1 14.6 13.4 14.6 12.8 11.4 10.1

Binge Drinking
August 2016
13 | P a g e
1976 1981 1986 1991 1995 2000 2005 2006 2007 2008 2009 2010 2011 2012 2013 2014 2015
Twelfth-Graders 37.1 41.4 36.8 29.8 29.8 30.0 27.1 25.4 25.9 24.6 25.2 23.2 21.6 23.7 22.1 19.4 17.2
Gender
Male 47.9 51.6 46.1 37.8 36.9 36.7 32.6 28.9 30.7 28.4 30.5 28.0 25.5 27.2 26.1 22.3 19.3
Female 25.9 30.8 28.1 21.2 23.0 23.5 21.6 21.5 21.5 21.3 20.2 18.4 17.6 19.7 18.1 16.6 14.9
Race/Hispanic Origin 3
White - 44.9 40.3 34.6 32.3 34.6 32.5 30.4 29.7 29.9 29.0 27.6 25.9 25.7 25.6 23.8 21.2
Black - 17.1 16.4 11.7 14.9 11.5 11.3 11.4 11.5 10.9 12.0 13.1 11.3 11.3 12.5 11.3 9.8
Hispanic - 34.8 30.8 27.9 26.6 31.0 23.9 23.3 22.5 21.5 22.6 22.1 20.8 21.8 22.4 20.4 18.5
Parental Education4
Less than high school 34.1 37.0 31.7 26.8 26.6 25.1 19.4 25.4 20.4 21.3 23.2 20.1 17.9 23.6 21.5 19.0 17.2
Completed high school 41.1 43.2 37.9 29.9 31.2 29.2 28.3 25.8 27.3 23.0 24.6 24.6 21.1 23.9 23.1 20.1 17.1
Some college 36.4 42.4 37.9 30.4 29.5 30.5 27.6 26.5 24.8 25.1 27.6 23.3 23.2 24.3 23.9 19.2 17.4
Completed college 36.9 40.8 37.1 29.9 29.9 29.9 29.4 24.0 27.5 26.2 24.4 24.2 21.4 23.6 21.4 20.7 17.9
Graduate school 34.5 39.3 36.7 30.6 30.7 32.7 25.2 26.3 27.1 26.4 25.6 21.2 22.1 22.8 20.3 19.0 17.6
College Plans
None or under 4 years 41.8 46.7 41.3 34.4 35.2 35.7 34.3 32.3 30.8 31.5 31.3 32.1 27.4 27.5 29.2 24.0 21.5
Complete 4 years 31.5 37.4 34.1 27.9 27.8 27.6 25.1 23.7 24.7 23.2 23.8 21.2 20.4 22.6 20.6 18.3 16.4
"-" Indicates data not available.
1 Binge drinking is defined as having five or more drinks in a row at least once in the prior two-week period.
2 There is reason to believe that eighth graders over-report binge drinking. For more information please see Monitoring the Future national survey results on drug use, 1975-
2000. Volume 1: Secondary school students (NIH Publication No. 01-4924) Chapter 4 footnote 27.
3 To derive percentages for each racial subgroup, data for the specified year and the previous year have been combined to increase subgroup sample sizes and thus provide the
most stable estimates.
4 Parental education is calculated by the Institute of Social Research as the average of the mother's and father's education. Averages that fall between two levels were rounded
up by Child Trends to reflect the attainment of the most educated parent.
Source: Johnston, L. D., O’Malley, P. M., Miech, R. A., Bachman, J. G., & Schulenberg, J. E. (2016). Demographic subgroup trends among adolescents in the use of various licit
and illicit drugs: 1975-2015 (Monitoring the Future Occasional Paper No. 86). Ann Arbor, MI: Institute for Social Research. Available at:
http://monitoringthefuture.org/pubs/occpapers/mtf-occ86.pdf. Tables 93-95

Binge Drinking
August 2016
14 | P a g e
Endnotes
1 Centers for Disease Control and Prevention. (2015). Underage drinking. Fact Sheet. Retrieved from
http://www.cdc.gov/Alcohol/fact-sheets/underage-drinking.htm
2 Monti, P., Tevyaw, T., and Borsari, B. (2004/2005). Drinking among young adults: Screening, brief intervention, and
outcome. National Institute on Alcohol Abuse and Alcoholism: Focus on Young Adult Drinking, 28 (4). Available at:
http://pubs.niaaa.nih.gov/publications/arh284/toc28-4.htm. Some studies do not find an association between adolescent
drinking and risky sexual behavior. For example, see Morrison, D. M., Gillmore, M. R., Hoppe, M. J., Gaylord, J, Leigh, B,
C., and Rainey, D. (2003). Adolescent drinking and sex: Findings from a daily diary study. Perspectives on Sexual
Reproductive Health, 35(4): 162-168. Available at http://www.agisa.org/journals/toc/psrh3504toc.html.
3 White, H. and Jackson, K. (2004/2005) Social and psychological influences on emerging adult drinking behavior.
National Institute of Alcohol Abuse and Alcoholism: Focus on Young Adult Drinking, 28(4). Available at:
http://pubs.niaaa.nih.gov/publications/arh284/182-190.pdf
4 Miller, J. W., Naimi, T. S., Brewer, R. D., and Jones, S. E. (2007). Binge drinking and associated health risk behaviors
among high school students. Pediatrics, 119(1), 76-85.
5 Berkey, C. S., Willett, W. C., Frazier, A. L., Rosner, B., Tamini, R. M., Rockett, H. R. H., and Colditz, G. A. (2010).
Prospective study of adolescent alcohol consumption and risk of benign breast disease in young women. Pediatrics,
125(5), e1081-e1087.
6 National Highway Traffic Safety Administration. (2015). 2014 Traffic Safety Factsheet YOUNG DRIVERS. Available at:
https://crashstats.nhtsa.dot.gov/Api/Public/ViewPublication/812278
7 U.S. Department of Health and Human Services. (2000). Healthy People 2010:Understanding and Improving Health.
Washington, DC: U.S. Government Printing Office, November 2000. Available at
http://www.healthypeople.gov/2010/document/pdf/uih/2010uih.pdf
8 Kuperman, S., Chan, G., Kramer, J.R., Bierut, L., Bucholz, K.K., Fox, L., Hesselbrock, V., Numberger, J.I., Reich, T.,
Reich, W., and Schuckit, M.A. (2005). Relationship of age of first drink to child behavioral problems and family
psychopathology. Alcoholism: Clinical and Experimental Research, 29(10), 1869–1876.
9 National Institute on Alcohol Abuse and Alcoholism. (1997). Youth drinking: Risk factors and consequences. (Alcohol
Alert NO. 37). Available at http://pubs.niaaa.nih.gov/publications/aa37.htm
Binge Drinking
August 2016
15 | P a g e
10 There is reason to believe that eighth-graders over-report binge drinking. For more information see Monitoring the
Future National Survey Results on Drug Use, 1975-2000. Volume 1: Secondary School Students (NIH Publication No. 01-
4924) Chapter 4, footnote 27.
11 Hispanics may be any race. Estimates for whites or blacks in this report do not include Hispanics.