binding of polysaccharides to human galectin-3 at a noncanonical
TRANSCRIPT
Structural Biology
Binding of polysaccharides to human galectin-3
at a noncanonical site in its carbohydrate
recognition domain
Michelle C Miller2, Hans Ippel3, Dennis Suylen3, Anatole A Klyosov4,
Peter G Traber4, Tilman Hackeng3, and Kevin H Mayo1,2
2Department of Biochemistry, Molecular Biology & Biophysics, University of Minnesota, Health Sciences Center,6-155 Jackson Hall, 321 Church Street, Minneapolis, MN 55455, USA, 3Department of Biochemistry and CARIM,University of Maastricht, 6229 ER Maastricht, The Netherlands, and 4Galectin Therapeutics, 4960 Peachtree IndustrialBlvd., Suite 240, Norcross, GA 30071, USA
1To whom correspondence should be addressed: Tel: +1-6126259968; Fax: +1-6126252163; e-mail: [email protected]
Received 16 May 2015; Revised 7 August 2015; Accepted 22 August 2015
Abstract
Galectin-3 (Gal-3) is a multifunctional lectin, unique to galectins by the presence of a long N-terminal
tail (NT) off of its carbohydrate recognition domain (CRD). Many previous studies have investigated
binding of small carbohydrates to its CRD. Here, we used nuclear magnetic resonance spectroscopy
(15N–1H heteronuclear single quantum coherence data) to assess binding of 15N-Gal-3 (and truncated
15N-Gal-3 CRD) to several, relatively large polysaccharides, including eight varieties of galactoman-
nans (GMs), as well as a β(1→ 4)-polymannan and an α-branched mannan. Overall, we found that
these polysaccharides with a larger carbohydrate footprint interact primarily with a noncanonical
carbohydrate-binding site on the F-face of the Gal-3 CRD β-sandwich, and to a less extent, if at all,
with the canonical carbohydrate-binding site on the S-face.While there is no evidence for interaction
with the NT itself, it does appear that the NT somehow mediates stronger interactions between the
Gal-3 CRD and the GMs. Significant Gal-3 resonance broadening observed during polysaccharide
titrations indicates that interactions occur in the intermediate exchange regime, and analysis of
these data allows estimation of affinities and stoichiometries that range from 4 × 10⁴ to 12 × 104 M−1
per site and multiple sites per polysaccharide, respectively. We also found that lactose can still bind
to the CRD S-face of GM-bound Gal-3, with the binding of one ligand attenuating affinity of the other.
These data are compared with previous results on Gal-1, revealing differences and similarities. They
also provide research direction to the development of these polysaccharides as galectin-targeting
therapeutics in the clinic.
Key words: galactose, glycan, lectin, NMR, protein
Introduction
Glycans can be considered biochemical platforms that store informa-tion, which is translated into cellular effects by interactions with theirlectin receptors (Gabius 2009). A number of lectin folds have beenidentified, demonstrating the structural breadth of carbohydrate–lectinrecognition patterns (Gabius et al. 2011). The galectins (named for
their affinity toward β-galactosides; Barondes 2008) are potent effec-tors of diverse physiological processes, e.g., mediating cell adhesion/attachment and glycoprotein routing or controlling growth or chemo/cytokine production (Klyosov et al. 2008; Smetana et al. 2013). Allgalectins share a β-sandwich-folded carbohydrate recognition domain(CRD) with a key Trp moiety that mediates C–H/π-interactions to
Glycobiology, 2016, vol. 26, no. 1, 88–99doi: 10.1093/glycob/cwv073
Original Article
© The Author 2015. Published by Oxford University Press. All rights reserved. For permissions, please e-mail: [email protected] 88
Downloaded from https://academic.oup.com/glycob/article-abstract/26/1/88/2355367by gueston 14 April 2018
galactose. Members of the galectin family are classified by structuralorganization into three groups: proto-type (homodimeric CRDs),tandem-repeat-type (two covalently linked CRDs) and chimera-type(CRD with a relatively long N-terminal tail (NT) containing phos-phorylation sites and collagen-like repeats) (Nesmelova, Dings, et al.2008). This diversification is phylogenetically maintained, with varia-tions in number of the first two groups (Kaltner and Gabius 2012).However, all known animal genomes harbor the sequence of chimera-type galectin-3 (Gal-3), apparently due to it being biologically indis-pensible, and thus heightening interest in their interactions with variouscarbohydrate-binding partners.
Gal-3 can accommodate various β-galactosides in its canonical-binding site, with high affinity histo-blood groups epitopes, gangliosideGM1-pentasaccharide and clustered core 1 O-glycans, as well as im-munologically (immune defense) relevant epitopes like xenoantigen,Galβ1,3Gal termini on Leishmania (and also Galβ1,4Gal) or LacdiNAcon parasites (Nesmelova, Dings, et al. 2008; Kopitz et al. 2010;Krzeminski et al. 2011; Gunning et al. 2013). In immune defense,Gal-3 is also known to interact with core components of bacterial lipo-polysaccharide in both carbohydrate-dependent and -independent ways,the latter with participation of non-CRD elements (Mey et al. 1996).Curiously, Gal-3 also interacts in an unknown fashion with β1,2-linkedoligomannosides on the surface of Candida albicans (Kohatsu et al.2006). Both the binding with mannosides and lack of structural insightinto that binding process prompted us to use nuclearmagnetic resonance(NMR) spectroscopy to explore binding ofGal-3 to a panel ofmannans,including galactomannans (GMs) with α1,6-galactose branched to aβ1,4-mannose backbone and to define their contact region with Gal-3.
To this end, our present study investigates interaction of Gal-3with GMs, a β(1→ 4)-linked polymannan (the backbone of theGMs) and an α-branched polymannan. GMs from various plantsources are reported to have a ratio of Man/Gal between about 1.1and 4.0 (Mestechkina and Shcherbukhin 1991; Shcherbukhin 1992;Daas et al. 2000; Ilyina et al. 2006). The α-galactose unit can appar-ently be active as a (ga)lectin ligand, as reported for a galactogluco-mannan and for hydroxypropyl guar galactomannan (withα1-6-linked galactose branches on a β1-4 polymannan), purportedlyinteracting with Gal-3 at the canonical site (Woodward et al. 2012).We previously reported that galectin-1 (Gal-1) can bind α-galactosidesat the canonical site (Miller et al. 2011), as well as to GMs at a rela-tively large surface area on the F-face of the CRD β-sandwich opposite
to its canonical S-face carbohydrate-binding site (Miller, Klyosov,et al. 2009). However, the GM binding region on Gal-1 crosses thislectin’s dimer interface, raising the question as to whether the dimerstructure is required for GM binding. This study with Gal-3, whichdoes not dimerize under the conditions of our experiments, also ad-dresses the question of whether GMs can still bind to its F-face inthe context of a native galectin monomer.
Overall, this work expands our understanding of how Gal-3 inter-acts with relatively large, complex polysaccharides, including cell sur-face glycans that are composed to a large extent of β-galactose (23%ofall terminal monosaccharides), as well as, e.g., α-galactose (2.3%) andmannose (18.9% in various anomeric states) (Werz et al. 2007). Inaddition, these studies may provide research direction to the develop-ment of these polysaccharides as galectin-targeting therapeutics in theclinic (Klyosov and Traber 2012).
Results
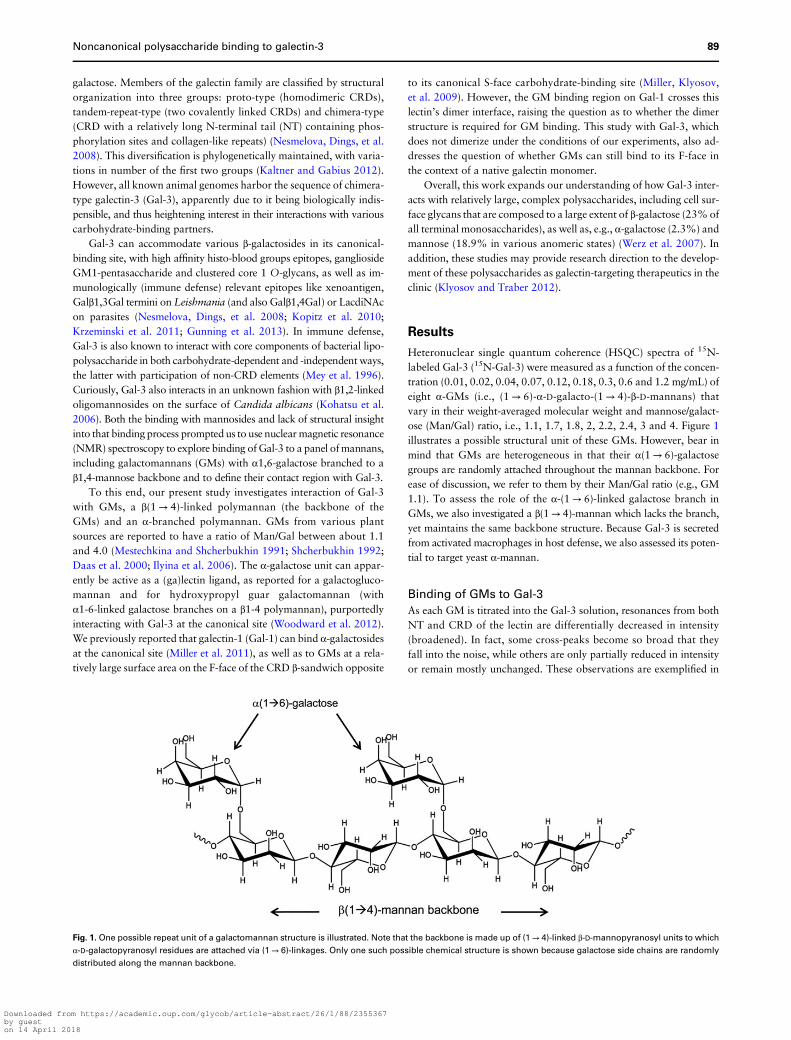
Heteronuclear single quantum coherence (HSQC) spectra of 15N-labeled Gal-3 (15N-Gal-3) were measured as a function of the concen-tration (0.01, 0.02, 0.04, 0.07, 0.12, 0.18, 0.3, 0.6 and 1.2 mg/mL) ofeight α-GMs (i.e., (1→ 6)-α-D-galacto-(1→ 4)-β-D-mannans) thatvary in their weight-averaged molecular weight and mannose/galact-ose (Man/Gal) ratio, i.e., 1.1, 1.7, 1.8, 2, 2.2, 2.4, 3 and 4. Figure 1illustrates a possible structural unit of these GMs. However, bear inmind that GMs are heterogeneous in that their α(1→ 6)-galactosegroups are randomly attached throughout the mannan backbone. Forease of discussion, we refer to them by their Man/Gal ratio (e.g., GM1.1). To assess the role of the α-(1→ 6)-linked galactose branch inGMs, we also investigated a β(1→ 4)-mannan which lacks the branch,yet maintains the same backbone structure. Because Gal-3 is secretedfrom activated macrophages in host defense, we also assessed its poten-tial to target yeast α-mannan.
Binding of GMs to Gal-3
As each GM is titrated into the Gal-3 solution, resonances from bothNT and CRD of the lectin are differentially decreased in intensity(broadened). In fact, some cross-peaks become so broad that theyfall into the noise, while others are only partially reduced in intensityor remain mostly unchanged. These observations are exemplified in
Fig. 1. One possible repeat unit of a galactomannan structure is illustrated. Note that the backbone is made up of (1→ 4)-linked β-D-mannopyranosyl units to which
α-D-galactopyranosyl residues are attached via (1→ 6)-linkages. Only one such possible chemical structure is shown because galactose side chains are randomly
distributed along the mannan backbone.
Noncanonical polysaccharide binding to galectin-3 89
Downloaded from https://academic.oup.com/glycob/article-abstract/26/1/88/2355367by gueston 14 April 2018

Figure 2, which shows 15N–1H HSQC spectra of 15N-Gal-3 in the ab-sence (cross-peaks in black) and presence (cross-peaks in red) of in-creasing concentrations of GM 2.4. Similar effects are found with allof the other GMs, as exemplified in Supplementary data, Figure S1that shows HSQC spectra of 15N-Gal-3 in the absence (cross-peaksin black) and presence (cross-peaks in red) of increasing concentra-tions of GM 1.1 (A, B and C) and GM 4 (D, E and F).
Although GM-induced broadening of Gal-3 resonances is consist-ent with exchange effects from Gal-3 binding to GMs, there are otherpossibilities. One of them is a polysaccharide-induced increase in so-lution viscosity. To address this possibility, we acquiredHSQC spectrawith Gal-3 in the presence of 25% (w/w) sucrose or 50% (w/w) gly-cerol and found that Gal-3 resonances were globally broadened (notdifferentially broadened), but not to the extreme extent as observedwith GMs. Another possibility is Gal-3 oligomerization. In solution,Gal-3 is primarily monomeric (Birdsall et al. 2001) in equilibriumwith a small fraction of oligomers (Morris et al. 2004) and can pre-sumably oligomerize via its NT segment in the presence of multivalentoligosaccharides (Hernandez and Baum 2002; Ahmad et al. 2004;Leffler et al. 2004). However, we observed minimal resonance broad-ening as a function of Gal-3 (0.02–0.4 mM) or NT peptide (0.05–1 mM) concentration, and GM- and mannan-induced changes inGal-3 chemical shifts and resonance intensities occur equally for CRDand NT resonances, suggesting that NT-mediated Gal-3 oligomeriza-tion plays no significant role in explaining GM-induced resonancebroadening. In fact, when the polysaccharide–Gal-3 molar ratio is rela-tively low at the start of the titration, resonances of many Gal-3 reso-nances (CRD and NT) are decreased, and not increased, in linewidth. Thus, we concluded that the observed resonance broadening re-sults from interactions between Gal-3 and these GMs that occur on theintermediate exchange regime on the chemical shift time scale. OurHSQC data also suggest that the overall β-sandwich/sheet fold of theCRD is not significantly perturbed by GM binding, because the disper-sion ofNH resonances that can be followed during the titration is essen-tially the same as that in the absence of the polysaccharides.
Insights into how GMs interact with Gal-3 were gained by observ-ing changes in Gal-3 resonance intensities and chemical shifts duringthe titrations. Because binding of Gal-3 to these GMs falls in the inter-mediate exchange regime, binding-induced 15N-Gal-3 chemical shiftchanges, Δδ, are small. Nevertheless, they are useful to assess whichresidues of the lectin are most affected in their chemical environments
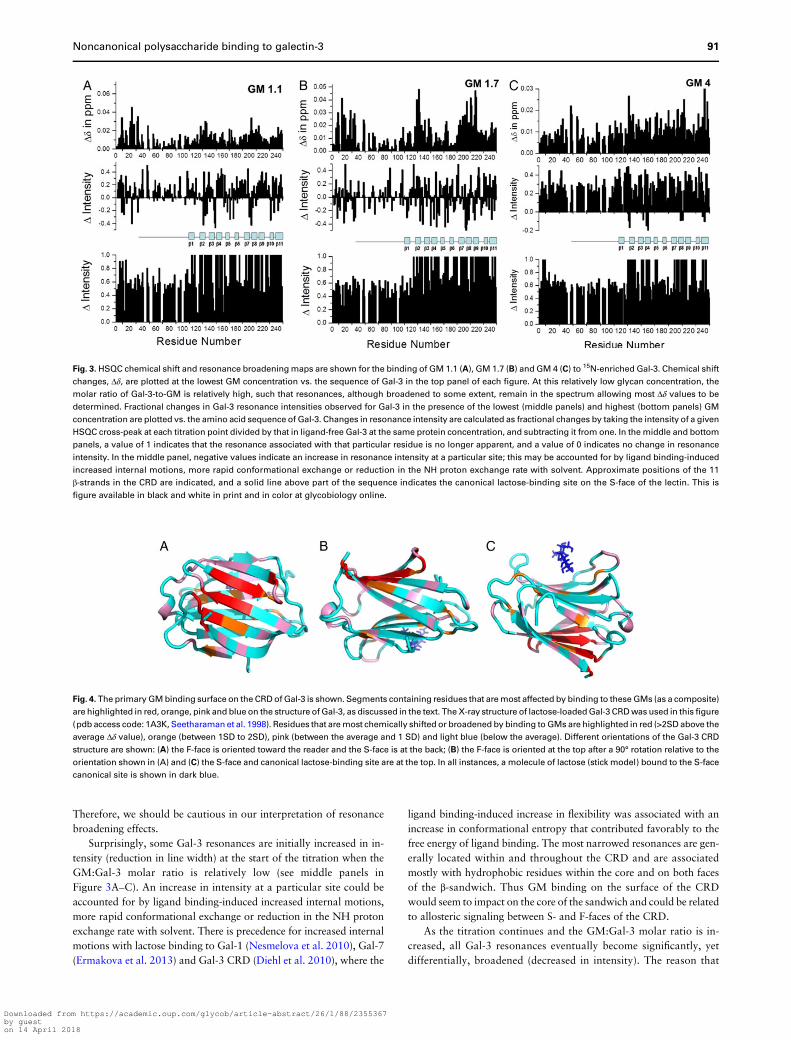
during the binding process, especially when inferred at a relatively lowpolysaccharide/Gal-3 ratio where most resonances are still observable.At relatively high polysaccharide/Gal-3 ratios, resonance broadeningincreases and many resonances become unobservable. There are sev-eral features observed in all HSQC titrations that suggest commonmodes of interaction between Gal-3 and these GMs. Because reson-ance broadening and chemical shift changes are similar (albeit notidentical) for all GMs, we only show representative results for GM1.1, GM 1.7 and GM 4 (Figure 3). For each GM, chemical shiftchanges at a relatively low GM/Gal-3 ratio are shown at the top,and changes in intensities at low and high GM/Gal-3 ratios areshown in the middle and bottom panels, respectively. In each case,parameters are plotted vs. the sequence of Gal-3.
With the binding of any GM, small yet significant chemical shiftchanges, Δδ, are noted for residues within Gal-3. In general, themost shifted resonances arise from residues within β-strands 2, 7, 8,9 and 11 that comprise the F-face β-sheet of the CRD β-sandwichthat is opposite to the canonical carbohydrate-binding site on theS-face. This is illustrated in Figure 4 which shows three views of thestructure of the Gal-3 CRD (pdb access code: 1A3K; Seetharamanet al. 1998) in which residues displaying the largest Δδ values (compos-ite of shift changes from all GMs) are highlighted. These data supportthe proposal that sites within GMs bind primarily to the F-face of theCRD. Nevertheless, we cannot exclude the possibility of some interac-tions at the canonical carbohydrate-binding site, because some Δδ va-lues of residues on the S-face of the CRD, while smaller, are stillsignificant, as indicated in Figure 3 by the line and label over the pri-mary lactose-binding sequence.
Analyzing changes in resonance intensities provides another di-mension to assess Gal-3 binding to GMs (Miller, Klyosov, et al.2009; Miller, Nesmelova, et al. 2009; Miller et al. 2012). Differentialresonance broadening indicates that not all NH sites in Gal-3 are af-fected equally by interactions with GMs. The extent of broadening at aparticular 15NH depends on a combination of factors. These includedirect interaction of that residue with the polysaccharide, lifetime ofGal-3 in the glycan-loaded state (binding kinetics), binding-inducedchanges to internal motions, conformational exchange, potentialoligomer exchange as well as Gal-3 exchange between multiple bind-ing sites within the polysaccharides. And because the extent of broad-ening at any given site depends on a combination of factors, intensitychanges are not necessarily correlated with chemical shift changes.
Fig. 2. 1H–15N HSQC spectra are shown for 15N-enriched Gal-3 alone (cross-peaks in black) and in the presence of GM 2.4 (cross-peaks in red) at 0.01 mg/mL (A),
0.07 mg/mL (B) and 0.6 mg/mL (C). Solution conditions were 20 mM potassium phosphate, pH 6.9. HSQC spectra (32 scans per transient) were acquired at 700 MHz
(proton frequency) at 30°C with a sweep width of 16 ppm in the 1H dimension (2k points) and 30 ppm in the 15N dimension (256 points).
90 M C Miller et al.
Downloaded from https://academic.oup.com/glycob/article-abstract/26/1/88/2355367by gueston 14 April 2018
Therefore, we should be cautious in our interpretation of resonancebroadening effects.
Surprisingly, some Gal-3 resonances are initially increased in in-tensity (reduction in line width) at the start of the titration when theGM:Gal-3 molar ratio is relatively low (see middle panels inFigure 3A–C). An increase in intensity at a particular site could beaccounted for by ligand binding-induced increased internal motions,more rapid conformational exchange or reduction in the NH protonexchange rate with solvent. There is precedence for increased internalmotions with lactose binding to Gal-1 (Nesmelova et al. 2010), Gal-7(Ermakova et al. 2013) and Gal-3 CRD (Diehl et al. 2010), where the
ligand binding-induced increase in flexibility was associated with anincrease in conformational entropy that contributed favorably to thefree energy of ligand binding. The most narrowed resonances are gen-erally located within and throughout the CRD and are associatedmostly with hydrophobic residues within the core and on both facesof the β-sandwich. Thus GM binding on the surface of the CRDwould seem to impact on the core of the sandwich and could be relatedto allosteric signaling between S- and F-faces of the CRD.
As the titration continues and the GM:Gal-3 molar ratio is in-creased, all Gal-3 resonances eventually become significantly, yetdifferentially, broadened (decreased in intensity). The reason that
Fig. 3. HSQC chemical shift and resonance broadeningmaps are shown for the binding of GM 1.1 (A), GM 1.7 (B) and GM 4 (C) to 15N-enriched Gal-3. Chemical shift
changes, Δδ, are plotted at the lowest GM concentration vs. the sequence of Gal-3 in the top panel of each figure. At this relatively low glycan concentration, the
molar ratio of Gal-3-to-GM is relatively high, such that resonances, although broadened to some extent, remain in the spectrum allowing most Δδ values to be
determined. Fractional changes in Gal-3 resonance intensities observed for Gal-3 in the presence of the lowest (middle panels) and highest (bottom panels) GM
concentration are plotted vs. the amino acid sequence of Gal-3. Changes in resonance intensity are calculated as fractional changes by taking the intensity of a given
HSQC cross-peak at each titration point divided by that in ligand-free Gal-3 at the same protein concentration, and subtracting it from one. In the middle and bottom
panels, a value of 1 indicates that the resonance associated with that particular residue is no longer apparent, and a value of 0 indicates no change in resonance
intensity. In the middle panel, negative values indicate an increase in resonance intensity at a particular site; this may be accounted for by ligand binding-induced
increased internal motions, more rapid conformational exchange or reduction in the NH proton exchange rate with solvent. Approximate positions of the 11
β-strands in the CRD are indicated, and a solid line above part of the sequence indicates the canonical lactose-binding site on the S-face of the lectin. This is
figure available in black and white in print and in color at glycobiology online.
Fig. 4. The primary GMbinding surface on the CRDof Gal-3 is shown. Segments containing residues that aremost affected by binding to these GMs (as a composite)
are highlighted in red, orange, pink and blue on the structure of Gal-3, as discussed in the text. The X-ray structure of lactose-loadedGal-3 CRDwas used in this figure
(pdb access code: 1A3K, Seetharaman et al. 1998). Residues that aremost chemically shifted or broadened by binding to GMs are highlighted in red (>2SD above the
average Δδ value), orange (between 1SD to 2SD), pink (between the average and 1 SD) and light blue (below the average). Different orientations of the Gal-3 CRD
structure are shown: (A) the F-face is oriented toward the reader and the S-face is at the back; (B) the F-face is oriented at the top after a 90° rotation relative to the
orientation shown in (A) and (C) the S-face and canonical lactose-binding site are at the top. In all instances, a molecule of lactose (stick model) bound to the S-face
canonical site is shown in dark blue.
Noncanonical polysaccharide binding to galectin-3 91
Downloaded from https://academic.oup.com/glycob/article-abstract/26/1/88/2355367by gueston 14 April 2018
binding of some GMs increases the intensity of only a few Gal-3 reso-nances at the start of the titration (e.g., GM 4, Figure 3C) is likely dueto greater overall ligand binding. As the concentration of any GM isincreased, so is the population of GM-loaded Gal-3, and resonancebroadening dominates even for these initially more narrowed reso-nances. At 0.6 or 1.2 mg/mL of any GM, most Gal-3 resonances with-in the CRD have reached maximal observable broadening, includingthose within the binding site on the F-face and around the canonicalcarbohydrate-binding site on the S-face. During most of the titrationand prior to the end, the most broadened resonances are generally (al-though not always for reasons noted above) the same as the mostchemically shifted ones highlighted on the folded structure of theGal-3 CRD in Figure 4.
Less can be inferred about the NT, primarily because it is reportedto be unstructured, highly flexible and engaged in transient interactionswith the CRD (Kopitz et al. 2003; Morris et al. 2004; Ippel et al. 2015;Berbís et al. 2014; Halimi et al. 2014). However, our HSQC data doindicate that GM binding to Gal-3 also perturbs residues within theNT. For example, NT residues S6, H8, D9, A10, G15, A33, S40,G47, G65 and A88 are all chemically shifted and maximally broa-dened by the end of the titration. There are several possibilities to ex-plain GM-induced effects at the NT. For one, GMs may interactindependently with the CRD and the NT, block transient interactionsbetween the NT and CRD or simultaneously interact with both whenthe NT is in its CRD “bound” state. Any of these scenarios could ex-plain the observed NT chemical shift and intensity changes. For insightinto this question, we performed titrations with twoGMs (GM1.7 andGM1.1) on the truncated 15N-labeled Gal-3 CRD and on two synthet-ic peptides derived from the Gal-3 NT (one having residues 1–50 andthe other having residues 51–107). Because the NT-derived peptideswere not isotopically enriched, we followed the titrations (up to1.2 mg/mL GM) using NOESY and TOCSY spectra.
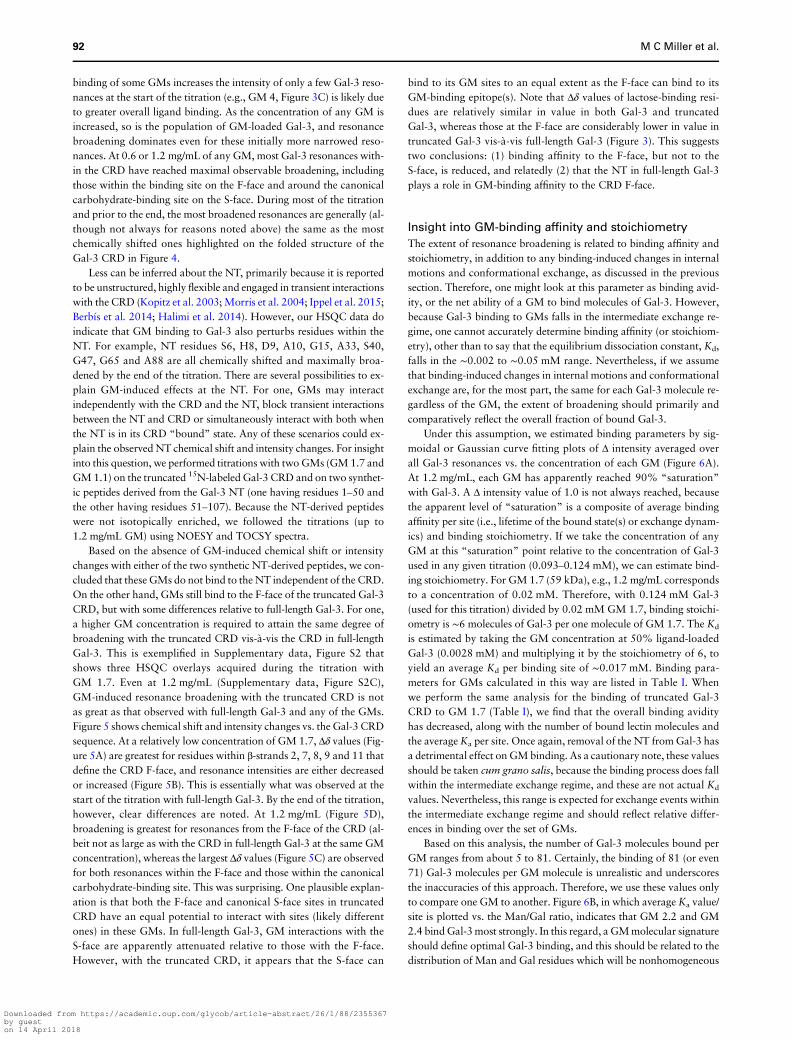
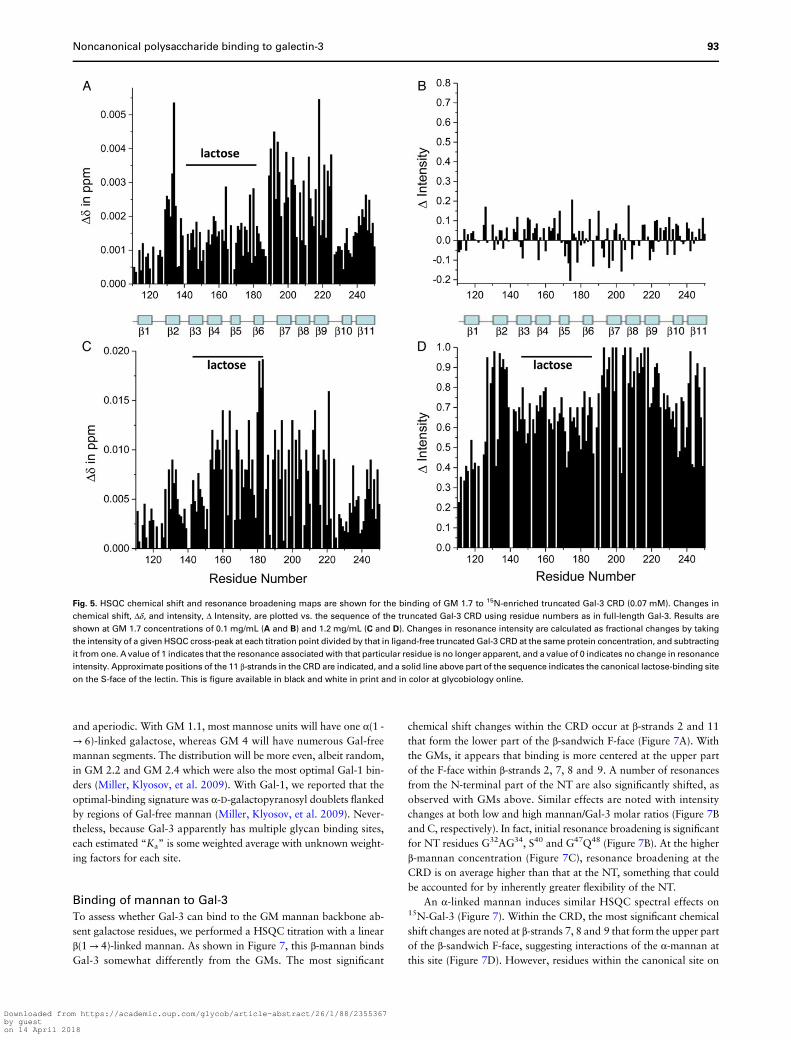
Based on the absence of GM-induced chemical shift or intensitychanges with either of the two synthetic NT-derived peptides, we con-cluded that these GMs do not bind to the NT independent of the CRD.On the other hand, GMs still bind to the F-face of the truncated Gal-3CRD, but with some differences relative to full-length Gal-3. For one,a higher GM concentration is required to attain the same degree ofbroadening with the truncated CRD vis-à-vis the CRD in full-lengthGal-3. This is exemplified in Supplementary data, Figure S2 thatshows three HSQC overlays acquired during the titration withGM 1.7. Even at 1.2 mg/mL (Supplementary data, Figure S2C),GM-induced resonance broadening with the truncated CRD is notas great as that observed with full-length Gal-3 and any of the GMs.Figure 5 shows chemical shift and intensity changes vs. the Gal-3 CRDsequence. At a relatively low concentration of GM 1.7, Δδ values (Fig-ure 5A) are greatest for residues within β-strands 2, 7, 8, 9 and 11 thatdefine the CRD F-face, and resonance intensities are either decreasedor increased (Figure 5B). This is essentially what was observed at thestart of the titration with full-length Gal-3. By the end of the titration,however, clear differences are noted. At 1.2 mg/mL (Figure 5D),broadening is greatest for resonances from the F-face of the CRD (al-beit not as large as with the CRD in full-length Gal-3 at the same GMconcentration), whereas the largest Δδ values (Figure 5C) are observedfor both resonances within the F-face and those within the canonicalcarbohydrate-binding site. This was surprising. One plausible explan-ation is that both the F-face and canonical S-face sites in truncatedCRD have an equal potential to interact with sites (likely differentones) in these GMs. In full-length Gal-3, GM interactions with theS-face are apparently attenuated relative to those with the F-face.However, with the truncated CRD, it appears that the S-face can
bind to its GM sites to an equal extent as the F-face can bind to itsGM-binding epitope(s). Note that Δδ values of lactose-binding resi-dues are relatively similar in value in both Gal-3 and truncatedGal-3, whereas those at the F-face are considerably lower in value intruncated Gal-3 vis-à-vis full-length Gal-3 (Figure 3). This suggeststwo conclusions: (1) binding affinity to the F-face, but not to theS-face, is reduced, and relatedly (2) that the NT in full-length Gal-3plays a role in GM-binding affinity to the CRD F-face.
Insight into GM-binding affinity and stoichiometry
The extent of resonance broadening is related to binding affinity andstoichiometry, in addition to any binding-induced changes in internalmotions and conformational exchange, as discussed in the previoussection. Therefore, one might look at this parameter as binding avid-ity, or the net ability of a GM to bind molecules of Gal-3. However,because Gal-3 binding to GMs falls in the intermediate exchange re-gime, one cannot accurately determine binding affinity (or stoichiom-etry), other than to say that the equilibrium dissociation constant, Kd,falls in the ∼0.002 to ∼0.05 mM range. Nevertheless, if we assumethat binding-induced changes in internal motions and conformationalexchange are, for the most part, the same for each Gal-3 molecule re-gardless of the GM, the extent of broadening should primarily andcomparatively reflect the overall fraction of bound Gal-3.
Under this assumption, we estimated binding parameters by sig-moidal or Gaussian curve fitting plots of Δ intensity averaged overall Gal-3 resonances vs. the concentration of each GM (Figure 6A).At 1.2 mg/mL, each GM has apparently reached 90% “saturation”with Gal-3. A Δ intensity value of 1.0 is not always reached, becausethe apparent level of “saturation” is a composite of average bindingaffinity per site (i.e., lifetime of the bound state(s) or exchange dynam-ics) and binding stoichiometry. If we take the concentration of anyGM at this “saturation” point relative to the concentration of Gal-3used in any given titration (0.093–0.124 mM), we can estimate bind-ing stoichiometry. For GM 1.7 (59 kDa), e.g., 1.2 mg/mL correspondsto a concentration of 0.02 mM. Therefore, with 0.124 mM Gal-3(used for this titration) divided by 0.02 mM GM 1.7, binding stoichi-ometry is ∼6 molecules of Gal-3 per one molecule of GM 1.7. The Kd
is estimated by taking the GM concentration at 50% ligand-loadedGal-3 (0.0028 mM) and multiplying it by the stoichiometry of 6, toyield an average Kd per binding site of ∼0.017 mM. Binding para-meters for GMs calculated in this way are listed in Table I. Whenwe perform the same analysis for the binding of truncated Gal-3CRD to GM 1.7 (Table I), we find that the overall binding avidityhas decreased, along with the number of bound lectin molecules andthe averageKa per site. Once again, removal of the NT fromGal-3 hasa detrimental effect on GMbinding. As a cautionary note, these valuesshould be taken cum grano salis, because the binding process does fallwithin the intermediate exchange regime, and these are not actual Kd
values. Nevertheless, this range is expected for exchange events withinthe intermediate exchange regime and should reflect relative differ-ences in binding over the set of GMs.
Based on this analysis, the number of Gal-3 molecules bound perGM ranges from about 5 to 81. Certainly, the binding of 81 (or even71) Gal-3 molecules per GM molecule is unrealistic and underscoresthe inaccuracies of this approach. Therefore, we use these values onlyto compare one GM to another. Figure 6B, in which average Ka value/site is plotted vs. the Man/Gal ratio, indicates that GM 2.2 and GM2.4 bindGal-3most strongly. In this regard, a GMmolecular signatureshould define optimal Gal-3 binding, and this should be related to thedistribution of Man and Gal residues which will be nonhomogeneous
92 M C Miller et al.
Downloaded from https://academic.oup.com/glycob/article-abstract/26/1/88/2355367by gueston 14 April 2018
and aperiodic. With GM 1.1, most mannose units will have one α(1 -→ 6)-linked galactose, whereas GM 4 will have numerous Gal-freemannan segments. The distribution will be more even, albeit random,in GM 2.2 and GM 2.4 which were also the most optimal Gal-1 bin-ders (Miller, Klyosov, et al. 2009). With Gal-1, we reported that theoptimal-binding signature was α-D-galactopyranosyl doublets flankedby regions of Gal-free mannan (Miller, Klyosov, et al. 2009). Never-theless, because Gal-3 apparently has multiple glycan binding sites,each estimated “Ka” is some weighted average with unknown weight-ing factors for each site.
Binding of mannan to Gal-3
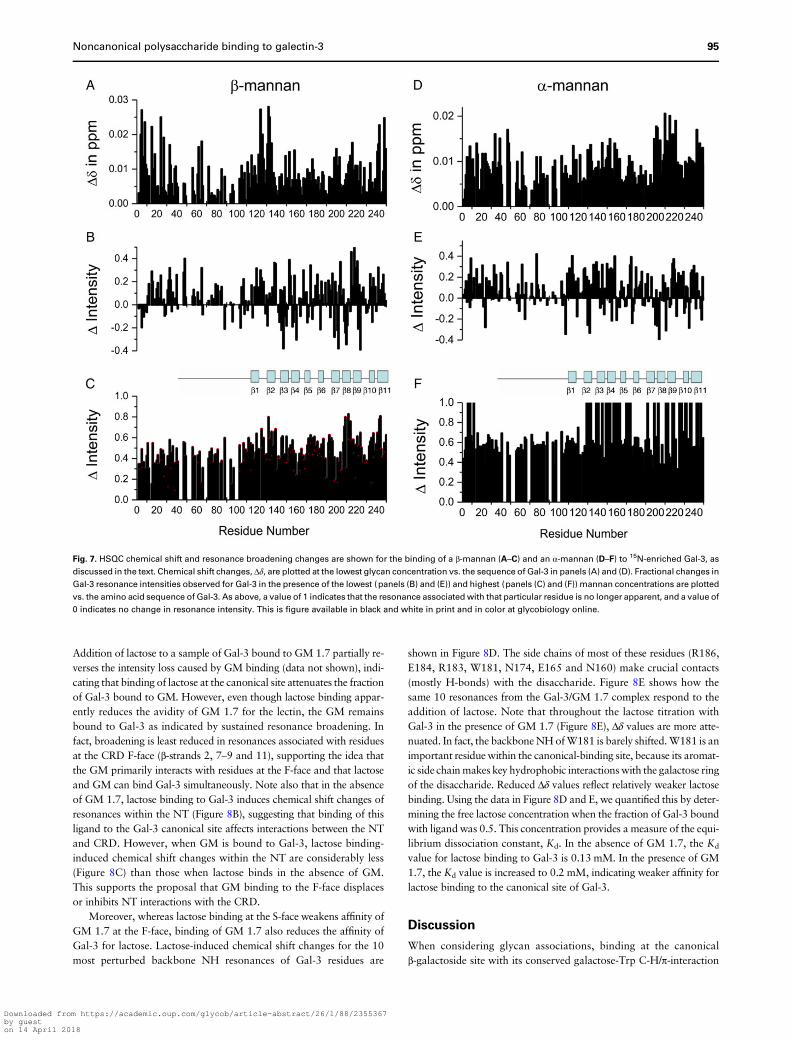
To assess whether Gal-3 can bind to the GM mannan backbone ab-sent galactose residues, we performed a HSQC titration with a linearβ(1→ 4)-linked mannan. As shown in Figure 7, this β-mannan bindsGal-3 somewhat differently from the GMs. The most significant
chemical shift changes within the CRD occur at β-strands 2 and 11that form the lower part of the β-sandwich F-face (Figure 7A). Withthe GMs, it appears that binding is more centered at the upper partof the F-face within β-strands 2, 7, 8 and 9. A number of resonancesfrom the N-terminal part of the NT are also significantly shifted, asobserved with GMs above. Similar effects are noted with intensitychanges at both low and high mannan/Gal-3 molar ratios (Figure 7Band C, respectively). In fact, initial resonance broadening is significantfor NT residues G32AG34, S40 and G47Q48 (Figure 7B). At the higherβ-mannan concentration (Figure 7C), resonance broadening at theCRD is on average higher than that at the NT, something that couldbe accounted for by inherently greater flexibility of the NT.
An α-linked mannan induces similar HSQC spectral effects on15N-Gal-3 (Figure 7). Within the CRD, the most significant chemicalshift changes are noted at β-strands 7, 8 and 9 that form the upper partof the β-sandwich F-face, suggesting interactions of the α-mannan atthis site (Figure 7D). However, residues within the canonical site on
Fig. 5. HSQC chemical shift and resonance broadening maps are shown for the binding of GM 1.7 to 15N-enriched truncated Gal-3 CRD (0.07 mM). Changes in
chemical shift, Δδ, and intensity, Δ Intensity, are plotted vs. the sequence of the truncated Gal-3 CRD using residue numbers as in full-length Gal-3. Results are
shown at GM 1.7 concentrations of 0.1 mg/mL (A and B) and 1.2 mg/mL (C and D). Changes in resonance intensity are calculated as fractional changes by taking
the intensity of a given HSQC cross-peak at each titration point divided by that in ligand-free truncated Gal-3 CRD at the same protein concentration, and subtracting
it from one. Avalue of 1 indicates that the resonance associated with that particular residue is no longer apparent, and a value of 0 indicates no change in resonance
intensity. Approximate positions of the 11 β-strands in the CRD are indicated, and a solid line above part of the sequence indicates the canonical lactose-binding site
on the S-face of the lectin. This is figure available in black and white in print and in color at glycobiology online.
Noncanonical polysaccharide binding to galectin-3 93
Downloaded from https://academic.oup.com/glycob/article-abstract/26/1/88/2355367by gueston 14 April 2018

the S-face are also perturbed, suggesting at least some interactionshere. There are also a number of significant NH shifts at sites withinthe N-terminal part of the NT. Similar effects are noted with intensity
changes at both low and high mannan/Gal-3 molar ratios. In fact, ini-tial changes in resonance broadening are highly significant for NT re-sidues L7, D9, G15, G21, G24, A33, G35, S40, Y41, A62, G65 andG77 (Figure 7E). At the higher α-mannan concentration (Figure 7F),resonance broadening at the CRD is generally greater than that ob-served at the NT; this could be due to inherently greater flexibilityof the NT and/or greater avidity of the α-mannan for Gal-3.
As with the GMs, neither of these mannans interacts with the freeNT peptides. Estimated affinities and stiochiometries for Gal-3 bind-ing to these mannans are shown in Table I. With β(1→ 4)-mannan(5 kDa), the 90% saturation point is∼0.240 mM, and binding stoichi-ometry is about 0.3 molecules of Gal-3 (0.121 mM) per one moleculeof β-mannan. At 50% Gal-3 bound (0.06 mM), the average Kd perbinding site is about 0.03 mM. With the α-mannan (50 kDa), 90%saturation is ∼0.024 mM, yielding a binding stoichiometry of aboutfive molecules Gal-3 per one of this α-mannan. At 50% Gal-3bound (0.0012 mM), the average Kd per binding site is ∼0.006 mM.Interestingly, this α-mannan does appear to bind Gal-3 better thandoes the β-mannan.
Effect of lactose on GM-bound Gal-3
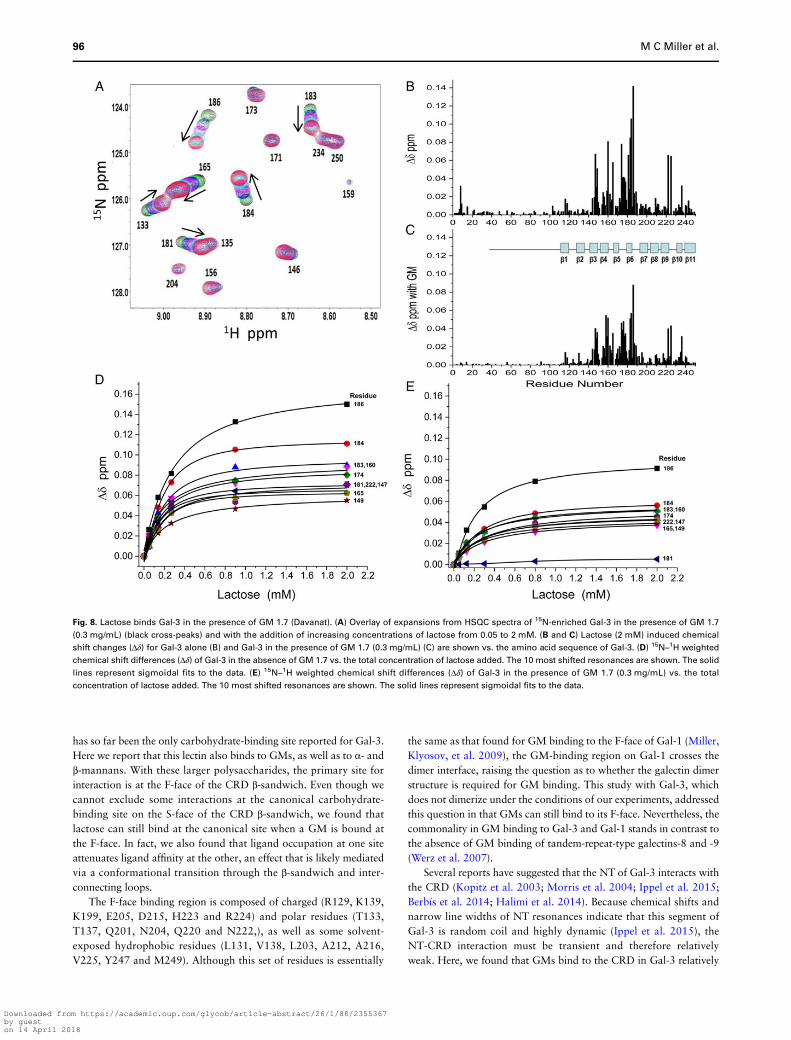
Figure 8 shows the effect that lactose has on Gal-3 bound to GM 1.7.Because GM 1.7 at 1.2 mg/mL causes many Gal-3 resonances to behighly broadened with many being unobservable, we performedthese studies with GM 1.7 at 0.3 mg/mL where most Gal-3 resonancesare still observed. 15N-Gal-3 HSQC spectral expansions are overlaidin Figure 8A for GM-bound Gal-3 alone (black cross-peaks) andGM-bound Gal-3 in the presence of increasing concentrations oflactose (0.05–2 mM; multicolored cross-peaks). Note that whereassome Gal-3 cross-peaks are highly shifted, others are not. Arrows in-dicate how some Gal-3 resonances are shifted during the titration. Re-sonances that are most shifted are associated with residues locatedwithin the canonical lactose-binding site.
Line broadening and chemical shifts of Gal-3 resonances are also af-fected by the presence of lactose. Figure 8 shows chemical shift changes(Δδ) of resonances vs. residue number for Gal-3 upon addition of 2 mMlactose in the absence (Figure 8B) or presence (Figure 8C) of GM 1.7.
Fig. 6. (A) The figure plots resonance broadening averaged over all Gal-3
resonances vs. the concentration of each GM. Resonance broadening was
calculated as the fractional change in resonance intensity as discussed in the
text. A value of 1 indicates that a resonance is no longer apparent, and a value of
0 indicates no change in resonance intensity. The average fraction of resonance
broadening from 15N-enriched Gal-3 HSQC resonance intensity changes vs. the
concentration (mg/mL) of GMs is shown. Solid lines are fits to the data using a
Gaussian/Boltzmann function. (B) Plot of the average equilibrium association
binding constants vs. theMan/Gal ratio for each GM glycan investigated.
Table I. Binding parameters from HSQC titrations
MW(kDa)
[∼90% sat.](10−6 M)
[Gal-3](10−6 M)
Number ofsites
[50% sat.](10−6 M)
Ave. Kd/site(10−6 M)
Ave. Ka/site(104 M−1)
Full-length Gal-3GM 1.1 83 14.4 93 6.5 2.4 15 6.4GM 1.7 59 20.3 124 6.1 2.8 17 5.9GM 1.8 100 12 121 10 1.4 14 7.1GM 2 690 1.7 121 71 0.2 14 7.1GM 2.2 215 5.5 121 22 0.4 8.8 11.3GM 2.4 790 1.5 121 81 0.1 8.1 12.3GM 3 685 1.7 121 71 0.4 28 3.6GM 4 ∼1000 1.2 93 78 0.2 16 6.2α-mannan 50 12 117 5 1.2 6 16.7β-mannan 5 240 121 0.5 60 30 3.3
Truncated Gal-3 CRDGM 1.1 83 26 80 3.1 8 25 4GM 1.7 59 42 80 2 10 20 5
For full-length Gal-3, 90% saturation was assumed at 1.2 mg/mL of each glycan, and the concentration given is calculated accordingly. For truncated Gal-3 CRD,90% saturation was assumed at 2.5 mg/mL of each glycan, and the concentration given is calculated accordingly. The number of glycan sites bound (# sites) wascalculated by dividing the concentration at 90% saturation into the lectin concentration used in the HSQC experiments. The 50% saturation was taken at thatpoint on binding curves with 50% lectin is bound. The average Kd/site is calculated by multiplying the 50% saturation concentration by the number of bindingsites. For each glycan, the MW listed is the weight-averaged MW.
94 M C Miller et al.
Downloaded from https://academic.oup.com/glycob/article-abstract/26/1/88/2355367by gueston 14 April 2018
Addition of lactose to a sample of Gal-3 bound to GM 1.7 partially re-verses the intensity loss caused by GM binding (data not shown), indi-cating that binding of lactose at the canonical site attenuates the fractionof Gal-3 bound to GM. However, even though lactose binding appar-ently reduces the avidity of GM 1.7 for the lectin, the GM remainsbound to Gal-3 as indicated by sustained resonance broadening. Infact, broadening is least reduced in resonances associated with residuesat the CRD F-face (β-strands 2, 7–9 and 11), supporting the idea thatthe GM primarily interacts with residues at the F-face and that lactoseand GM can bind Gal-3 simultaneously. Note also that in the absenceof GM 1.7, lactose binding to Gal-3 induces chemical shift changes ofresonances within the NT (Figure 8B), suggesting that binding of thisligand to the Gal-3 canonical site affects interactions between the NTand CRD. However, when GM is bound to Gal-3, lactose binding-induced chemical shift changes within the NT are considerably less(Figure 8C) than those when lactose binds in the absence of GM.This supports the proposal that GM binding to the F-face displacesor inhibits NT interactions with the CRD.
Moreover, whereas lactose binding at the S-face weakens affinity ofGM 1.7 at the F-face, binding of GM 1.7 also reduces the affinity ofGal-3 for lactose. Lactose-induced chemical shift changes for the 10most perturbed backbone NH resonances of Gal-3 residues are
shown in Figure 8D. The side chains of most of these residues (R186,E184, R183, W181, N174, E165 and N160) make crucial contacts(mostly H-bonds) with the disaccharide. Figure 8E shows how thesame 10 resonances from the Gal-3/GM 1.7 complex respond to theaddition of lactose. Note that throughout the lactose titration withGal-3 in the presence of GM 1.7 (Figure 8E), Δδ values are more atte-nuated. In fact, the backboneNH ofW181 is barely shifted.W181 is animportant residuewithin the canonical-binding site, because its aromat-ic side chainmakes key hydrophobic interactionswith the galactose ringof the disaccharide. Reduced Δδ values reflect relatively weaker lactosebinding. Using the data in Figure 8D and E, we quantified this by deter-mining the free lactose concentration when the fraction of Gal-3 boundwith ligand was 0.5. This concentration provides a measure of the equi-librium dissociation constant, Kd. In the absence of GM 1.7, the Kd
value for lactose binding to Gal-3 is 0.13 mM. In the presence of GM1.7, the Kd value is increased to 0.2 mM, indicating weaker affinity forlactose binding to the canonical site of Gal-3.
Discussion
When considering glycan associations, binding at the canonicalβ-galactoside site with its conserved galactose-Trp C-H/π-interaction
Fig. 7. HSQC chemical shift and resonance broadening changes are shown for the binding of a β-mannan (A–C) and an α-mannan (D–F) to 15N-enriched Gal-3, as
discussed in the text. Chemical shift changes, Δδ, are plotted at the lowest glycan concentration vs. the sequence of Gal-3 in panels (A) and (D). Fractional changes in
Gal-3 resonance intensities observed for Gal-3 in the presence of the lowest (panels (B) and (E)) and highest (panels (C) and (F)) mannan concentrations are plotted
vs. the amino acid sequence of Gal-3. As above, a value of 1 indicates that the resonance associated with that particular residue is no longer apparent, and a value of
0 indicates no change in resonance intensity. This is figure available in black and white in print and in color at glycobiology online.
Noncanonical polysaccharide binding to galectin-3 95
Downloaded from https://academic.oup.com/glycob/article-abstract/26/1/88/2355367by gueston 14 April 2018
has so far been the only carbohydrate-binding site reported for Gal-3.Here we report that this lectin also binds to GMs, as well as to α- andβ-mannans. With these larger polysaccharides, the primary site forinteraction is at the F-face of the CRD β-sandwich. Even though wecannot exclude some interactions at the canonical carbohydrate-binding site on the S-face of the CRD β-sandwich, we found thatlactose can still bind at the canonical site when a GM is bound atthe F-face. In fact, we also found that ligand occupation at one siteattenuates ligand affinity at the other, an effect that is likely mediatedvia a conformational transition through the β-sandwich and inter-connecting loops.
The F-face binding region is composed of charged (R129, K139,K199, E205, D215, H223 and R224) and polar residues (T133,T137, Q201, N204, Q220 and N222,), as well as some solvent-exposed hydrophobic residues (L131, V138, L203, A212, A216,V225, Y247 and M249). Although this set of residues is essentially
the same as that found for GM binding to the F-face of Gal-1 (Miller,Klyosov, et al. 2009), the GM-binding region on Gal-1 crosses thedimer interface, raising the question as to whether the galectin dimerstructure is required for GM binding. This study with Gal-3, whichdoes not dimerize under the conditions of our experiments, addressedthis question in that GMs can still bind to its F-face. Nevertheless, thecommonality in GM binding to Gal-3 and Gal-1 stands in contrast tothe absence of GM binding of tandem-repeat-type galectins-8 and -9(Werz et al. 2007).
Several reports have suggested that the NT of Gal-3 interacts withthe CRD (Kopitz et al. 2003; Morris et al. 2004; Ippel et al. 2015;Berbís et al. 2014; Halimi et al. 2014). Because chemical shifts andnarrow line widths of NT resonances indicate that this segment ofGal-3 is random coil and highly dynamic (Ippel et al. 2015), theNT-CRD interaction must be transient and therefore relativelyweak. Here, we found that GMs bind to the CRD in Gal-3 relatively
Fig. 8. Lactose binds Gal-3 in the presence of GM 1.7 (Davanat). (A) Overlay of expansions from HSQC spectra of 15N-enriched Gal-3 in the presence of GM 1.7
(0.3 mg/mL) (black cross-peaks) and with the addition of increasing concentrations of lactose from 0.05 to 2 mM. (B and C) Lactose (2 mM) induced chemical
shift changes (Δδ) for Gal-3 alone (B) and Gal-3 in the presence of GM 1.7 (0.3 mg/mL) (C) are shown vs. the amino acid sequence of Gal-3. (D) 15N–1H weighted
chemical shift differences (Δδ) of Gal-3 in the absence of GM 1.7 vs. the total concentration of lactose added. The 10 most shifted resonances are shown. The solid
lines represent sigmoidal fits to the data. (E) 15N–1H weighted chemical shift differences (Δδ) of Gal-3 in the presence of GM 1.7 (0.3 mg/mL) vs. the total
concentration of lactose added. The 10 most shifted resonances are shown. The solid lines represent sigmoidal fits to the data.
96 M C Miller et al.
Downloaded from https://academic.oup.com/glycob/article-abstract/26/1/88/2355367by gueston 14 April 2018
strongly, such that their binding to the CRD could inhibit interactionsbetween the NT and CRD. Nevertheless, our results also indicate thateven though GMs do not bind to the NT segment alone, the NT some-how plays a role in optimizing GM interactions with the CRD in thecontext of full-length Gal-3. We conclude this primarily because GMbinding is reduced in truncated Gal-3 CRD, even though GMs can stillinteract with the F-face of the CRD in both full-length and truncatedGal-3.
Binding affinities (or avidities) of GM and mannan for Gal-3 areconsiderably greater than those for small saccharides like lactoseand N-acetyllactosamine (Nesmelova, Dings, et al. 2008). Our crudeestimates of average Kd values range from about 0.008 to 0.025 mMper Gal-3 binding site, indicating that the carbohydrate-binding foot-print on Gal-3, and galectins in general, is larger for these polysacchar-ides than that defined by simple disaccharides. That having been said,it is important to realize that because these relatively large and com-plex polysaccharides generally have multiple binding sites (stiochio-metries greater than one) for Gal-3, it is likely that Gal-3 interactswith different sites having different binding affinities. In this regard,our average Kd values should be taken cum grano salis.
Nevertheless, we found that our Gal-3 binding affinity to GMs iscorrelated with the Man/Gal ratio, thus providing insight into struc-ture–activity relationships. GMs have a heterogeneous or aperiodicdistribution of Man and Gal residues. With GM 1.1, we have few“naked” mannan segments, whereas with GM 4 we have numerous“naked” mannan segments and fewer segments of concentrated gal-actose residues. With the Man/Gal ratio of 2.2–2.4, there is a moreeven distribution, albeit random, of segments of naked mannan andof high galactose content. Gal-3 binding to GMs is greatest forMan/Gal ratios of 2–2.4, a finding that we reported earlier withGal-1 binding to GMs (Miller et al. 2012). As with Gal-1, a statisticalanalysis using a model parameterized for the fraction of Gal/Man clus-ters, the fraction of “naked”Man residues, and the number of sequen-tial Gal/Man residues surrounded by “naked” Man residues suggeststhat the optimal GM-binding signature is an α-D-galactopyranosyldoublet flanked by regions of “naked” mannan. However, regionsof “naked”mannan by themselves do not provide a good binding epi-tope for Gal-3. We conclude this because even though β-mannan (thebackbone of these GMs) interacts with the F-face of the Gal-3 CRDlike the GMs, Gal-3 avidity to the β-mannan is significantly lower.In this regard, the α-(1→ 6)-linked galactose residues in these GMsare crucial to optimal binding. That having been said, it was surprisingto find that the α-mannan bound Gal-3 with significantly greater avid-ity for Gal-3 than the GMs. In this instance, however, binding appar-ently occurs at both the F-face and S-face of the lectin. The reason forthis is unclear and requires further investigation.
Because most of these polysaccharides are pectin derived, the ques-tion of physiological relevance in terms of binding to the Gal-3 F-facearises. Nevertheless, the larger and more relevant mannans also bindto the F-face, and we did find that lactose can bind to the canonical siteeven when a GM is bound at the F-face. Even though the highly con-served tryptophan within the canonical site is absent from the F-face,both ligand binding sites do share some compositional and structuralfeatures, as illustrated in Figure 4B and C. The sites both display over-all concave shapes and contain numerous charged and polar residuesthat would be crucial for interacting with any polysaccharide. Uncer-tainty with physiological relevance notwithstanding, it should benoted that binding of the galectin to tissue sections, e.g., of tumors,has prognostic relevance (Plzák et al. 2004; Dawson et al. 2013),prompting the interest in defining in situ binding partners. In thissense, our study broadens the view on the interactive potential.
Equally important, the comparable activity profiles of Gal-3 andGal-1 would let functional competition become possible, as seen ingrowth control (Kopitz et al. 2001; Sanchez-Ruderisch et al. 2010).Overall, this work expands our understanding of how Gal-3 interactswith polysaccharides, opening the possibility for binding to polysac-charides in host defense.
Materials and methods
Gal-3 preparation
The expression plasmid for human Gal-3 and truncated Gal-3 CRDwas constructed by inserting the appropriate cDNAs (1–250 aminoacids of human Gal-3 or 111–250 amino acids of truncated humanGal-3 CRD) into the vector pET-22b(+) between the Ndel andBamHI cut sites. This expression vectors were kindly provided byDr Tai. Uniformly 15N-labeled lectins were expressed in BL21 (DE3)competent cells (Novagen), grown in minimal media, purified over alactose affinity column and fractionated on a gel filtration column,as described previously for production of Gal-1 (Nesmelova, Pang,et al. 2008). About 8 mg of purified protein were obtained from 1 Lof cell culture. Protein purity was checked by using SDS PAGE andmass spectrometry.
Polysaccharide preparations
1,4-β-D-Galactomannan from Cyamopsis tetragonoloba (guar gum;Man/Gal = 1.7) of weight-averaged molecular weight 59 kDa (Miller,Klyosov, Platt, et al. 2009) was produced by Galectin TherapeuticsInc. (Newton, MA) under the commercial name Davanat® and de-scribed in US Pat. Nos. 6,642,205 and 7,893,252 (Platt et al. 2006;Miller, Klyosov, et al. 2009; Miller, Klyosov, Platt, et al. 2009). 1,4-β-D-Galactomannan from Ceratonia siliqua (locust bean; >1000 kDa;Man/Gal = 4.0) was obtained from Sigma (St. Louis, MO), catalogno. G-0753, Lot 109H0899. Other 1,4-β-D-galactomannans usedhere were kindly provided by Dr Vladimir D. Shcherbukhin, Instituteof Biochemistry, Russian Academy of Sciences, Moscow, Russia(Mestechkina and Shcherbukhin 1991; Shcherbukhin 1992; Ilyinaet al. 2006). These include the following, with weight-averagedmolecu-lar weights and Man/Gal ratios given in parentheses:
GM from Medicago falcata (yellow lucerne) (83 kDa; Man/Gal 1.1)GM fromCyamopsis tetragonoloba (guar gum) (100 kDa; Man/Gal 1.8)GM from Lagonychium farctum (mimosa) (690 kDa; Man/Gal 2)GM from Gleditsia triacanthos (honey locust) (215 kDa; Man/Gal 2.2)GM from Gleditsia triacanthos (honey locust) (790 kDa; Man/Gal 2.4)GM from Gleditsia capsa (locust tree) (685 kDa; Man/Gal 3)
α-Branched mannan from Saccharomyces cerevisiae (weight-averagedmolecular weight of 50 kDa) and β(1→ 4)-mannan (5 kDa) were pur-chased from Sigma Chemical (St. Louis, MO) and were used withoutfurther purification.
Heteronuclear NMR spectroscopy
Uniformly 15N-labeled Gal-3 or 15N-labeled truncated Gal-3 CRDwas dissolved at concentrations of 0.08–0.124 mM in 20 mM potas-sium phosphate buffer at pH 6.9, made up using a 95%H2O/5%D2Omixture. 1H–15N HSQC NMR experiments were used to investigatebinding of a series of polysaccharides. 1H and 15N resonance assign-ments for recombinant human Gal-3 were previously reported (Ippelet al. 2015) and were used here to analyze our HSQC data.
Noncanonical polysaccharide binding to galectin-3 97
Downloaded from https://academic.oup.com/glycob/article-abstract/26/1/88/2355367by gueston 14 April 2018
NMRexperiments were carried out at 30°C on Bruker 600, 700 or850 MHz spectrometers equipped with H/C/N triple-resonanceprobes and x/y/z triple-axis pulse field gradient units. A gradientsensitivity-enhanced version of the two-dimensional 1H–15N HSQCexperiment (32 scans per transient) was applied with 256 (t1) × 2048(t2) complex data points in 15N and 1H dimensions, respectively, and asweep width of 16 ppm in the 1H dimension and 30 ppm in the 15Ndimension. Raw data were converted and processed by usingNMRPipe (Delaglio et al. 1995) and were analyzed by usingNMRview (Johnson and Blevins 1994).
Resonance broadening of peaks in HSQC spectra was determinedby automated peak picking and/or bymanual assessment of resonanceintensities. In instances where peaks were well resolved, the automatedapproachwas as accurate as manual determination. In instances wherepeaks were in a crowded area or partially overlapped, intensities hadto be determined by manual assessment. In some cases, resonanceswere integrated, and resulting relative volumes were found to comparefavorably with determination of peak intensities. Changes in reson-ance intensities during any given titration were calculated as fractionalchanges by taking the intensity of a given HSQC cross-peak at eachtitration point divided by that in ligand-free Gal-3 at the same proteinconcentration, and subtracting it from one. Therefore, a value of 1 in-dicates that a resonance is no longer observed (i.e., highly broadened),and a value of 0 indicates no change in resonance intensity. In someinstances, resonance intensities increased during titrations, and thusfractional values became negative as per the calculation and as dis-cussed in the text.
Supplementary data
Supplementary data for this article is available online at http://glycob.oxfordjournals.org/.
Acknowledgments
We thank Prof. Tai for providing the expression vector for human Gal-3, andProf. Gabius for reading the manuscript and making helpful additions to thetext. Funding for NMR instrumentation at the University of Minnesota wasprovided by the Office of the Vice President for Research, the Medical School,the College of Biological Sciences, NIH, NSF, and the Minnesota MedicalFoundation.
Conflict of interest statement
KHM is a paid consultant for Galectin Therapeutics.
Abbreviations
CRD, carbohydrate recognition domain; Gal-3, galectin-3; Gal-7, galectin-7;GM, galactomannan; HSQC, heteronuclear single quantum coherence;NMR, nuclear magnetic resonance; NT, N-terminal tail.
References
Ahmad N, Gabius H-J, André S, Kaltner H, Sabesan S, Roy R, Liu B,Macaluso F, Brewer CF. 2004. Galectin-3 precipitates as a pentamer withsynthetic multivalent carbohydrates and forms heterogeneous cross-linkedcomplexes. J Biol Chem. 279:10841–10847.
Barondes SH. 2008. Stumbling on galectins. In: Klyosov AA, Witczak ZJ,Platt D, editors, Galectins. Hoboken: Wiley, p. 1–8.
Berbís MÁ, André S, Cañada FJ, Pipkorn R, Ippel H, Mayo KH, Kübler D,Gabius HJ, Jiménez-Barbero J. 2014. Peptides derived from humangalectin-3 N-terminal tail interact with its carbohydrate recognition domainin a phosphorylation-dependent manner. Biochem Biophys Res Commun.443:126–131.
Birdsall B, Feeney J, Burdett ID, Bawumia S, Barboni EA, Hughes RC. 2001.NMR solution studies of hamster galectin-3 and electron microscopic visu-alization of surface-adsorbed complexes: Evidence for interactions betweenthe N- and C-terminal domains. Biochemistry. 40:4859–4866.
Daas PJH, Schols HA, de Jongh HHJ. 2000. On the galactosyl distribution ofcommercial galactomannans. Carbohyd Res. 329:609–619.
DawsonH, André S, Karamitopoulou E, Zlobec I, Gabius H-J. 2013. The grow-ing galectin network in colon cancer and clinical relevance of cytoplasmicgalectin-3 reactivity. Anticancer Res. 33:3053–3059.
Delaglio F, Grzesiek S, Vuister GW, Zhu G, Pfeifer J, Bax A. 1995. NMRPipe: Amultidimensional spectral processing system based on UNIX pipes. JBiomol NMR. 6:277–293.
Diehl C, Engström O, Delaine T, Håkansson M, Genheden S, Modig K,Leffler H, Ryde U, Nilsson UJ, Akke M. 2010. Protein flexibility and con-formational entropy in ligand design targeting the carbohydrate recognitiondomain of galectin-3. J Am Chem Soc. 132:14577–14589.
Ermakova E, Miller MC, Nesmelova IV, Lopez-Merino L, Berbis MA,Nesmelov Y, Tkachev YV, Lagartera L, Daragan VA, André S, et al.2013. Lactose binding to human galectin-7 (p53-induced gene 1) induceslong-range effects through the protein resulting in increased dimer stabilityand evidence for positive cooperativity. Glycobiology. 23:508–523.
Gabius H-J, editor. 2009. The Sugar Code. Fundamentals of Glycosciences.Weinheim (Germany): Wiley-VCH.
Gabius H-J, André S, Jiménez-Barbero J, Romero A, Solís D. 2011. From lectinstructure to functional glycomics: Principles of the sugar code. TrendsBiochem Sci. 36:298–313.
Gunning AP, Pin C, Morris VJ. 2013. Galectin 3-β-galactobiose interactions.Carbohydr Polym. 92:529–533.
Halimi H, Rigato A, Byrne D, Ferracci G, Sebban-Kreuzer C, El Antak L,Guerlesquin F. 2014. Glycan dependence of Galectin-3 self-associationproperties. PLoS One. 9:e111836.
Hernandez JD, Baum LG. 2002. Ah, sweet mystery of death! Galectins and con-trol of cell fate. Glycobiology. 12:127–136.
Ilyina AV, Mestechkina NM, Shcherbukhin VD, Varlamov VP. 2006. Depoly-merization of legume seed galactomannan by Celloviridin G20x.Prikladnaya Biokhimiya I Mikrobiologiya. 42:580–586.
Ippel H, Miller MC, Berbís MA, Suylen D, André S, Hackeng TM, Cañada FJ,Weber C, Gabius H-J, Jiménez-Barbero J, Mayo KH. 2015. 1H, 13C, and15N backbone and side-chain chemical shift assignments for the 36 proline-containing, full length 29 kDa human chimera-type galectin-3. BiomolNMR Assign. 9:59–63.
Johnson BA, Blevins RA. 1994. NMR view: A computer program for the visu-alization and analysis of NMR data. J Biomol NMR. 4:603–614.
Kaltner H, Gabius H-J. 2012. A toolbox of lectins for translating the sugar code:The galectin network in phylogenesis and tumors. Histol Histopathol.27:397–416.
Klyosov AA, Traber PG. 2012. Galectins in disease and potential therapeuticapproaches. In: Klyosov AA, Traber PG, editors. Galectins and Disease:
Implications for Targeted Therapeutics. Washington, DC: AmericanChemical Society. p. 3–43.
Klyosov AA,Witczak ZJ, Platt D, editors. 2008.Galectins. Hoboken, New Jersey:John Wiley & Sons.
Kohatsu L, Hsu DK, Jegalian AG, Liu FT, Baum LG. 2006. Galectin-3 inducesdeath of Candida species expressing specific β-1,2-linked mannans. JImmunol. 177:4718–4726.
Kopitz J, André S, von Reitzenstein C, Versluis K, Kaltner H, Pieters RJ,Wasano K, Kuwabara I, Liu F-T, Cantz M, et al. 2003. Homodimericgalectin-7 (p53-induced gene 1) is a negative growth regulator for humanneuroblastoma cells. Oncogene. 22:6277–6288.
Kopitz J, Bergmann M, Gabius H-J. 2010. How adhesion/growth-regulatorygalectins-1 and -3 attain cell specificity: Case study defining their targeton neuroblastoma cells (SK-N-MC) and marked affinity regulation by
98 M C Miller et al.
Downloaded from https://academic.oup.com/glycob/article-abstract/26/1/88/2355367by gueston 14 April 2018

affecting microdomain organization of the membrane. IUBMB Life.62:624–628.
Kopitz J, von Reitzenstein C, André S, Kaltner H, Uhl J, Ehemann V, Cantz M,Gabius H-J. 2001. Negative regulation of neuroblastoma cell growth bycarbohydrate-dependent surface binding of galectin-1 and functional diver-gence from galectin-3. J Biol Chem. 276:35917–35923.
Krzeminski M, Singh T, André S, Lensch M, Wu AM, Bonvin AM, Gabius HJ.2011. Human galectin-3 (Mac-2 antigen): Defining molecular switches ofaffinity to natural glycoproteins, structural and dynamic aspects of glycanbinding by flexible ligand docking and putative regulatory sequences inthe proximal promoter region. Biochim Biophys Acta. 1810:150–161.
Leffler H, Carlsson S, Hedlund M, Qian Y, Poirier F. 2004. Introduction togalectins. Glyconj J. 19:433–440.
Mestechkina NM, Shcherbukhin VD. 1991. Galactomannan from Galegaorientalis Lam. seeds. Appl Biochem Microbiol. 26:648–651.
Mey A, Leffler H, Hmama Z, Normier G, Revillard J-P. 1996. The animal lectinGalectin-3 interacts with bacterial lipopolysaccharides via two independentsites. J Immunol. 156:1572–1577.
Miller MC, Klyosov AA, Mayo KH. 2009. The α-galactomannan Davanatbinds galectin-1 at a site different from the conventional galectin carbohy-drate binding domain. Glycobiology. 19:1034–1045.
Miller MC, Klyosov AA, Mayo KH. 2012. Structural features forα-galactomannan binding to galectin-1. Glycobiology. 22:543–551.
Miller M, Klyosov A, Platt D, Mayo KH. 2009. Using pulse field gradient NMRdiffusion measurements to define molecular weight distributions in glycanpreparations. Carbohydr Res. 344:1205–1212.
Miller MC, Nesmelova IV, Platt D, Klyosov AA, Mayo KH. 2009. Carbohy-drate binding domain on galectin-1 is more extensive for a complex glycanthan for simple saccharides: Implications for galectin–glycan interactions atthe cell surface. Biochem J. 421:211–221.
Miller MC, Ribeiro JP, Roldos V, Martín-Santamaría S, Cañada FJ,Nesmelova IA, André S, Pang M, Klyosov AA, Baum LG. 2011. Structuralaspects of binding of α-linked digalactosides to human galectin-1.Glycobiology. 21:1627–1641.
Morris S, Ahmad N, André S, Kaltner H, Gabius H-J, Brenowitz M, Brewer CF.2004. Quaternary solution structures of galectins-1, -3, and -7.Glycobiology. 14:293–300.
Nesmelova IV, Dings RPM,Mayo KH. 2008. Understanding galectin structure-function relationships to design effective antagonists. In: Klyosov A. editor.Galectins. New York: Oxford University Press.
Nesmelova IV, Ermakova E, Daragan VA, Pang M, Menendez M,Lagartera L, Solis D, Baum LG, Mayo KH. 2010. Lactose binding togalectin-1 modulates structural dynamics, increases conformational en-tropy, and occurs with apparent negative cooperativity. J Mol Biol.397:1209–1230.
Nesmelova IV, Pang M, Baum LG, Mayo KH. 2008. 1H, 13C, and 15N back-bone and side-chain chemical shift assignments for the 29 kDa humangalectin-1 protein dimer. Biomol NMR Assign. 2:203–205.
Platt D, Klyosov AA, Zomer E. 2006. In: Klyosov AA, Witczak ZJ, Platt D, edi-tors. Carbohydrate Drug Design. American Chem. Soc., ACS SymposiumSeries 932. Washington, DC: Academic Press. p. 49–66.
Plzák J, Betka J, Smetana K Jr, Chovanec M, Kaltner H, André S, Kodet R,Gabius HJ. 2004. Galectin-3 - an emerging prognostic indicator in ad-vanced head and neck carcinoma. Eur J Cancer. 40:2324–2330.
Sanchez-Ruderisch H, Fischer C, Detjen KM, Welzel M, Wimmel A,Manning JC, André S, Gabius H-J. 2010. Tumor suppressor p16INK4a:Downregulation of galectin-3, an endogenous competitor of the pro-anoikiseffector galectin-1, in a pancreatic carcinoma model. FEBS J.277:3552–3563.
Seetharaman J, Kanigsberg A, Slaaby R, Leffler H, Barondes SH, Rini JM. 1998.X-ray crystal structure of the human galectin-3 carbohydrate recognitiondomain at 2.1-A resolution. J Biol Chem. 273:13047–13052.
Shcherbukhin VD. 1992. Galactomannans from seeds of the leguminous plantsfound in the Soviet Union. Food Hydrocolloids. 6:3–7.
Smetana K Jr, André S, Kaltner H, Kopitz J, Gabius HJ. 2013. Context-dependent multifunctionality of galectin-1: A challenge for defining the lec-tin as therapeutic target. Expert Opin Ther Targets. 17:379–392.
Werz DB, Ranzinger R, Herget S, Adibekian A, von der Lieth CW,Seeberger PH. 2007. Exploring the structural diversity of mammalian car-bohydrates (“glycospace”) by statistical databank analysis.ACS Chem Biol.2:685–691.
Woodward AM, Senchyna M, Williams R, Argueso P. 2012. Characterizationof the interaction between hydroxypropyl guar galactomannan andgalectin-3. Biochem Biophys Res Commun. 424:12–17.
Noncanonical polysaccharide binding to galectin-3 99
Downloaded from https://academic.oup.com/glycob/article-abstract/26/1/88/2355367by gueston 14 April 2018