bihar technical support program (btsp) -...
TRANSCRIPT

Bihar Technical Support Program (BTSP)
10th November, 2016
2
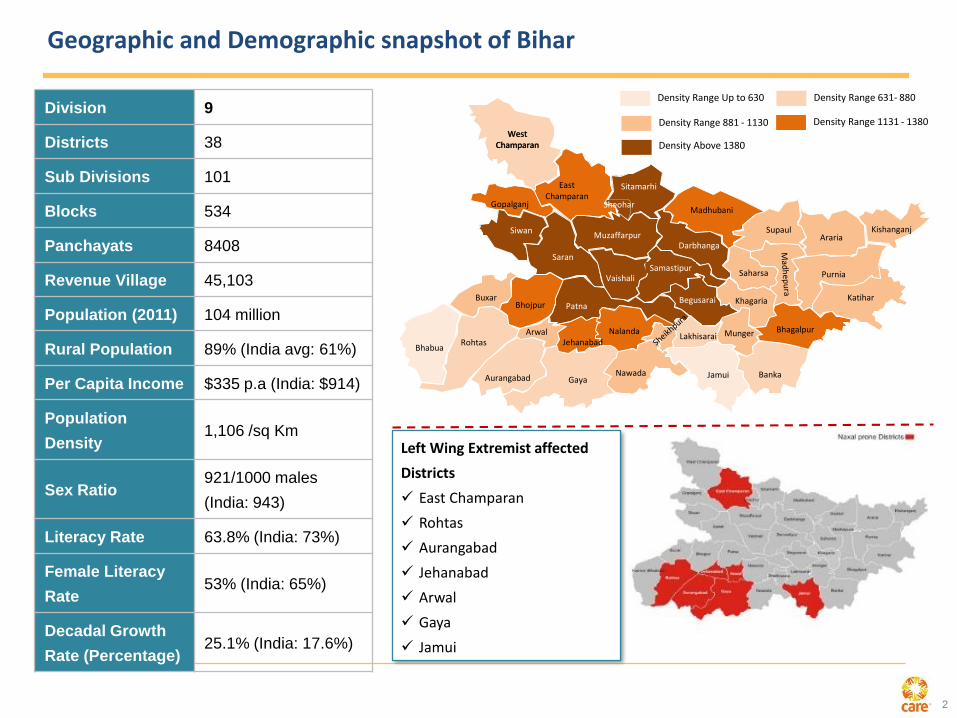
Geographic and Demographic snapshot of Bihar
SitamarhiEast Champaran
West Champaran
Darbhanga
Gopalganj
Katihar
Madhubani
Muzaffarpur
Saran
Siwan
Vaishali
Aurangabad
Bhojpur
Gaya
Nalanda
Nawada
Patna
Rohtas JehanabadBhabua
Buxar
LakhisaraiArwal
Samastipur
KhagariaBegusarai
BhagalpurMunger
BankaJamui
ArariaKishanganj
Saharsa
Supaul
Purnia
West Champaran
Muzaffarpur
Sheohar
Density Range Up to 630
Density Range 881 - 1130
Density Range 631- 880
Density Range 1131 - 1380
Density Above 1380
Division 9
Districts 38
Sub Divisions 101
Blocks 534
Panchayats 8408
Revenue Village 45,103
Population (2011) 104 million
Rural Population 89% (India avg: 61%)
Per Capita Income $335 p.a (India: $914)
Population
Density1,106 /sq Km
Sex Ratio921/1000 males
(India: 943)
Literacy Rate 63.8% (India: 73%)
Female Literacy
Rate53% (India: 65%)
Decadal Growth
Rate (Percentage)25.1% (India: 17.6%)
Left Wing Extremist affected
Districts
East Champaran
Rohtas
Aurangabad
Jehanabad
Arwal
Gaya
Jamui
3
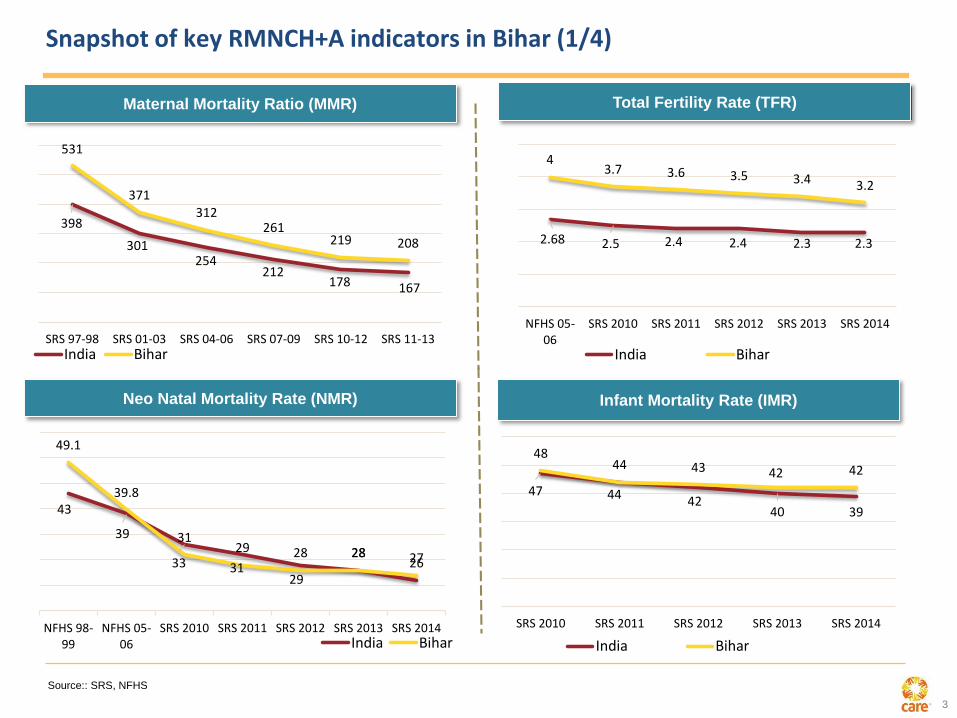
Snapshot of key RMNCH+A indicators in Bihar (1/4)
Maternal Mortality Ratio (MMR)
Source:: SRS, NFHS
Total Fertility Rate (TFR)
Neo Natal Mortality Rate (NMR) Infant Mortality Rate (IMR)
398
301254
212178 167
531
371312
261219 208
SRS 97-98 SRS 01-03 SRS 04-06 SRS 07-09 SRS 10-12 SRS 11-13India Bihar
2.68 2.5 2.4 2.4 2.3 2.3
43.7 3.6 3.5 3.4 3.2
NFHS 05-06
SRS 2010 SRS 2011 SRS 2012 SRS 2013 SRS 2014
India Bihar
43
39
33 3129
2826
49.1
39.8
3129 28 28 27
NFHS 98-99
NFHS 05-06
SRS 2010 SRS 2011 SRS 2012 SRS 2013 SRS 2014India Bihar
47 44 4240 39
4844 43 42 42
SRS 2010 SRS 2011 SRS 2012 SRS 2013 SRS 2014
India Bihar

4
Snapshot of key RMNCH+A indicators in Bihar (2/4)
Source:: SRS, NFHS, DLHS, AHS
Children aged 12-23 monthsFully Immunized (%)
64.565.6
69.9
AHS 10-11 AHS 11-12 AHS 12-13
% 0-5 yrs children underweight (weight for age)
55.9
43.9
NFHS 05-06 NFHS 15-16
Kala-Azar cases in Bihar
16036
107307615
6280
2012 2013 2014 2015

5
Health and nutritional goals and status
Indicator India Bihar
Current status Trend (Year & source) Bihar Vikash
Mission- Goal
(2021)
Maternal Mortality Ratio (MMR) (Per 1 lakh live births)
167(SRS 11-13) *
312 (SRS 04-06)
261 (SRS 07-09)
219 (SRS 10-12)
208 (SRS 11-13)
<100
Infant Mortality Rate (IMR) [0-1 year] (Per 1000 live births)
39(SRS 2014)
48 (SRS 2010)
44 (SRS 2011)
43 (SRS 2012)
42(SRS 2014)
<27
Neonatal Mortality Rate (NMR) [0-28 days] (Per 1000 live births)
26(SRS 2014)
31 (SRS 2010)
29 (SRS 2011)
28 (SRS 2012)
27(SRS 2014)
16
Early NMR
[within 7 days of Birth]
(Per 1000 live births)
20(SRS 2014)
27
(SRS 2010)
25 (SRS 2011)
23(SRS 2012)
22(SRS 2014)
Under 5 Mortality Rate(Per 1000 live births)
45(SRS 2014)
64 (SRS 2010)
59(SRS2011)
57(SRS 2012)
53(SRS 2014)
<35
Total Fertility Rate (TFR) 2.3(SRS 2014)
3.7(SRS 2010)
3.6 (SRS 11-12)
3.5(SRS 12-13)
3.2(SRS 2014)
2.4
Full Immunization 65% (RSOC 2012-13)
65.6% **(AHS 12-13)
66% ***(WHO)
81 % (WHO)
82.73%
****(HMIS)95%
5
* SRS-Sample Registration System, **AHS- Annual Health System, *** WHO- World Health Organization, **** HMIS- Health Management Information System, ‘’
RSOC- Rapid Survey on Children
6
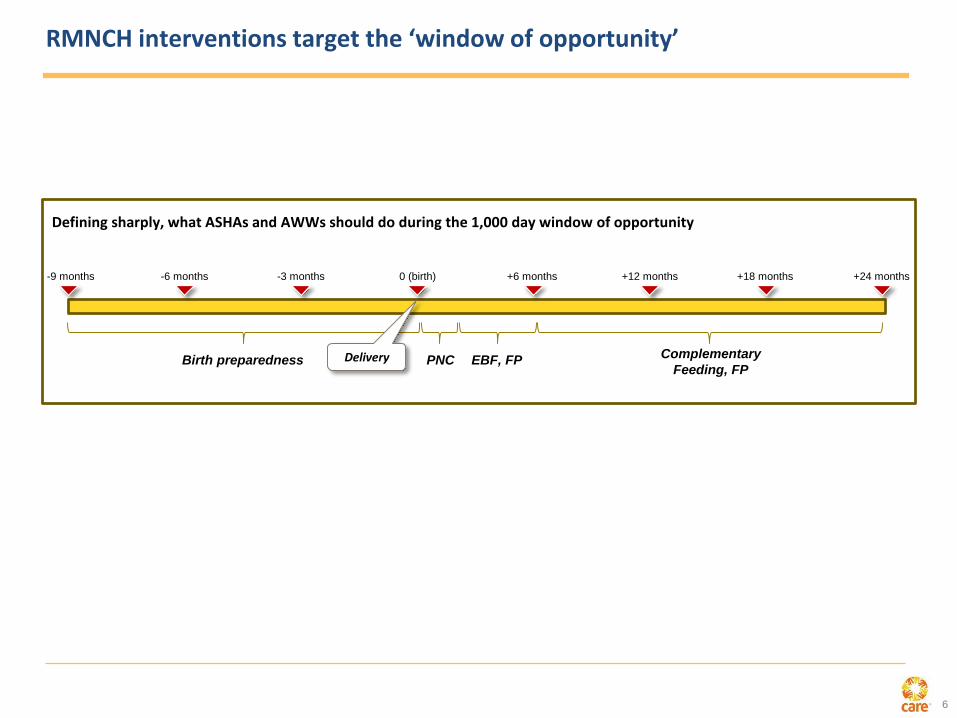
RMNCH interventions target the ‘window of opportunity’
Defining sharply, what ASHAs and AWWs should do during the 1,000 day window of opportunity
-9 months -6 months -3 months 0 (birth) +6 months +12 months +18 months +24 months
Birth preparedness Delivery PNC EBF, FPComplementary
Feeding, FP

7
CARE initiated operations in Bihar in 2011, with focused implementation in 8 districts
• Patna
• Samastipur
• Begusarai
• Saharsa
• Khagaria
• Gopalganj
• E. Champaran
• W. Champaran
8 focus districtsWith the support of BMGF, Integrated Family Health Initiative (IFHI), spearheaded by
CARE, was focussed on supporting GoB to improve family health outcomes across state.
The core objective was to test and scale-up innovative and high impact interventions /
solutions.
• 2010-11: Implementation Design
• 2011-13: Solutions implemented in 8 focus districts
• Ongoing measurement of Results and Outcomes
• 2013 onwards: Scale-up of solutions across State by goverment
1. Family planning, especially for healthy timing, spacing, and limiting of
pregnancies
2. Skilled attendance at birth, meeting guidelines for quality care, and delivery of
quality emergency obstetric care
3. Immediate newborn care, with special emphasis on care for low birth weight
infants
4. Management of asphyxia
5. Prevention and management of neonatal sepsis
6. Early and exclusive breastfeeding
7. Appropriate complementary feeding
8. Complete immunization
Focus on 8 Technical interventions Categories of solutions
Outreach
Facility
Local-level
debottlenecking
Innovation

8
There were lessons learnt from IFHI by mid-2013
Proof of concept established: the proposed solution levers had worked at a
scale of ~28m population, given the level of facilitation provided:
• Clear upstrokes in a range of desired outcomes
• Clear associations between levels of effort of FLWs and desired
outcomes
GoB appetite for solution levers was strong, wished them to be scaled up
(HSC, mentoring)
Plenty of solution-specific lessons available for fine-tuning
Initial experience with eight ‘twin’ districts suggested that scale up was likely
to be more rapid than the effort involved in the original districts
Clear system level deficiencies, which were not being significantly corrected
with current efforts of BTAST and others
9
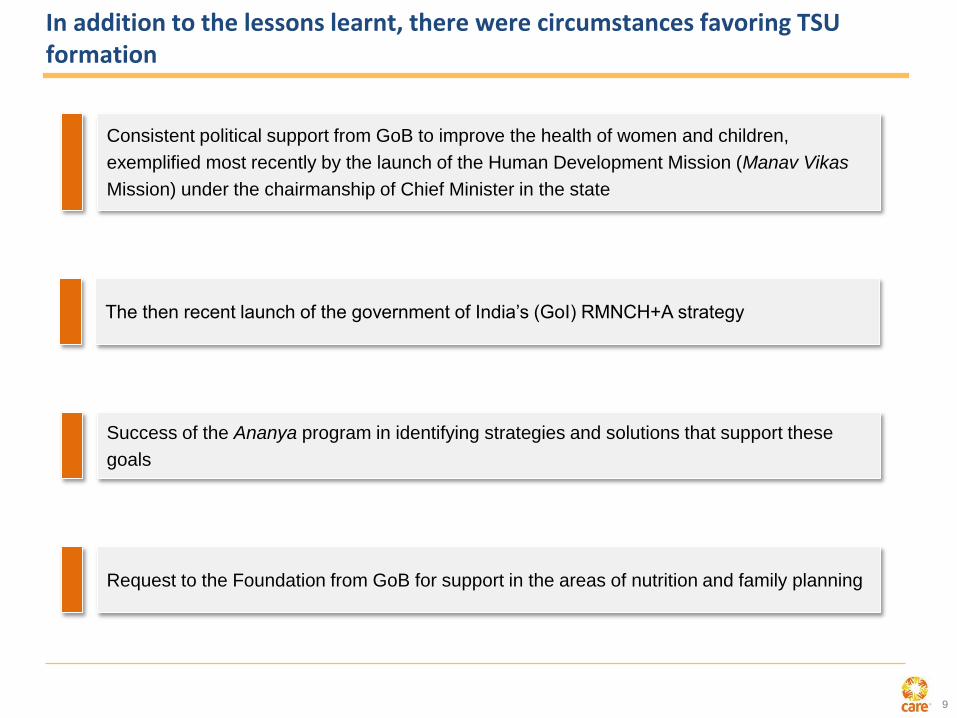
In addition to the lessons learnt, there were circumstances favoring TSU formation
Consistent political support from GoB to improve the health of women and children,
exemplified most recently by the launch of the Human Development Mission (Manav Vikas
Mission) under the chairmanship of Chief Minister in the state
The then recent launch of the government of India’s (GoI) RMNCH+A strategy
Success of the Ananya program in identifying strategies and solutions that support these
goals
Request to the Foundation from GoB for support in the areas of nutrition and family planning

10
Combination of these conditions led to evolution of TSU
• Co-owning development goals with GoB given high degree of alignment with
Maternal & child health and nutrition initiatives; sharp focus on desired results
• Create ownership and necessary environment within Health departments and
programs to implement solutions and nurture innovation
• Providing techno-managerial and operational expertise
• Creating necessary enabling environment to GoB to nurture interventions
• Working closely with other development partners in strengthening system
components for better service delivery
TSU approach
Support and
co-own
Go
BTSU
MVM* goals
Expected outcome
• Formally influence and support health department and ICDS at highest levels to shape effective policies and
complement systemic changes in areas of human resources, supply chain, IT etc.
• Create an enabling environment which will eventually drive sustainable change
*MVM- Manav Vikas Mission
11
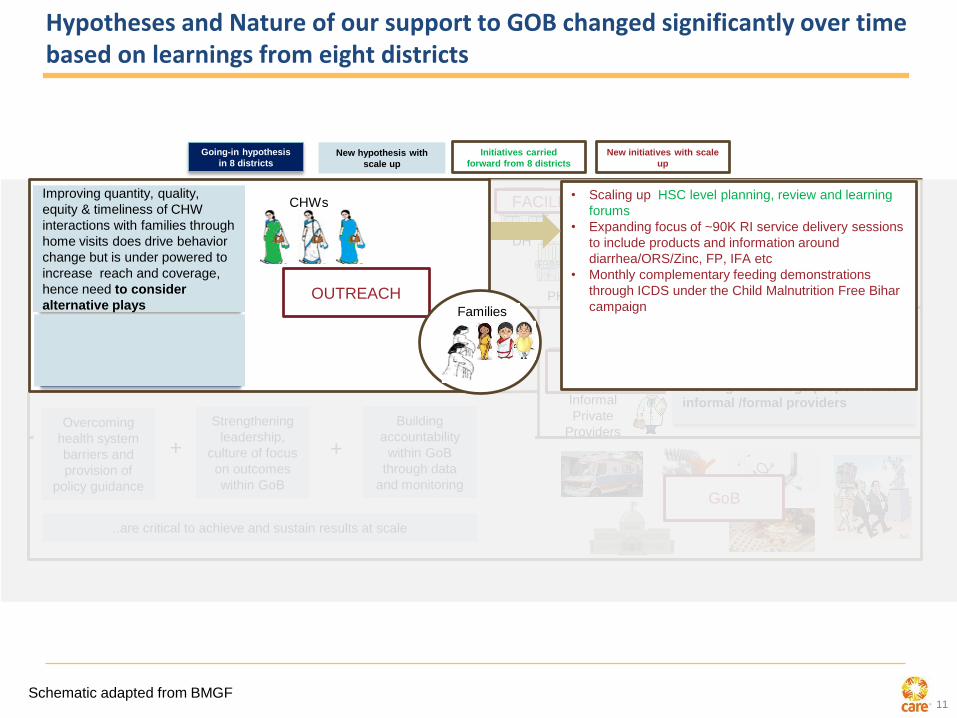
Hypotheses and Nature of our support to GOB changed significantly over time based on learnings from eight districts
PHC
RHDH
Improving quality of care at PHCs through
quality improvement and nurse mentoring
will improve intrapartum care and
provide more FP services consistently
Informal
Private
Providers
Formal
Private
Providers
Leveraging formal/informal private
providers will improve timely &
appropriate treatment of childhood
infectious diseases (diarrhea,
pneumonia)
Improving health systems (HR, critical supplies and infrastructure) is essential to
improve quality of care but will be taken care of by other DPs
Overcoming
health system
barriers and
provision of
policy guidance
+
Strengthening
leadership,
culture of focus
on outcomes
within GoB
Building
accountability
within GoB
through data
and monitoring
+
..are critical to achieve and sustain results at scale
Going-in hypothesis
in 8 districtsNew hypothesis with
scale up
Initiatives carried
forward from 8 districts
New initiatives with scale
up
Improving quality of care beyond PHCs at
DHs / RHs through QI and doctor
mentoring is crucial to improve
complications management and
provision of comprehensive FP services
Improving pneumonia-diarrhea
outcomes at population level requires
addressing barriers to care and
working with a large proportion of
informal /formal providers
FACILITIES
PRIVATE
SECTOR
GoB
• Scaling up HSC level planning, review and learning
forums
• Expanding focus of ~90K RI service delivery sessions
to include products and information around
diarrhea/ORS/Zinc, FP, IFA etc
• Monthly complementary feeding demonstrations
through ICDS under the Child Malnutrition Free Bihar
campaign
CHWsImproving skills and
performance of community
health workers to improve
quantity, quality, equity &
timeliness of interactions with
families through home visits
will drive behavior change
Integrating health into SHGs
will drive service uptake and
behavior change among
marginalized communities
OUTREACH
Improving quantity, quality,
equity & timeliness of CHW
interactions with families through
home visits does drive behavior
change but is under powered to
increase reach and coverage,
hence need to consider
alternative plays Families
Schematic adapted from BMGF

12
Hypotheses and Nature of our support to GOB changed significantly over time based on learnings from eight districts
Informal
Private
Providers
Formal
Private
Providers
Leveraging formal/informal private
providers will improve timely &
appropriate treatment of childhood
infectious diseases (diarrhea,
pneumonia)
Improving health systems (HR, critical supplies and infrastructure) is essential to
improve quality of care but will be taken care of by other DPs
Overcoming
health system
barriers and
provision of
policy guidance
+
Strengthening
leadership,
culture of focus
on outcomes
within GoB
Building
accountability
within GoB
through data
and monitoring
+
..will be critical to achieve and sustain results at scale
CHWs
SHGs
Other community
platformsImproving skills and
performance of community
health workers to improve
quantity, quality, equity &
timeliness of interactions with
families will drive service
uptake and behavior change
Integrating health into SHGs
will drive service uptake and
behavior change among
marginalized communities
Going-in hypothesis
in 8 districtsNew hypothesis with
scale up
Initiatives carried
forward from 8 districts
New initiatives with scale
up
Improving quantity, quality,
equity & timeliness of CHW
interactions with families through
home visits does drive behavior
change but is under powered to
increase reach and coverage,
hence need to consider
alternative plays
Integrating health into SHGs
works but GOB ownership
required for comprehensive
scale play
Improving pneumonia-diarrhea
outcomes at population level requires
addressing barriers to care and
working with a large proportion of
informal /formal providers
PHC
RHDH
Improving services and QoC at facilities
became more central to our work both of
MNCH, FP and other PSTs. We needed to
go beyond block PHCs for management of
complications
• Scaling up QI processes and nurse mentoring
across all PHCs and 56 DHs/RHs with refinements
(e.g., PRONTO simulations, identification and
referral of complications)
• Doctor mentoring in 56 DHs/RHs to improve
management of complications and C-sections
• Added emphasis on identification and tracking of
LBW babies following continuum of care from facility
to home
• Strengthening facility based record keeping systems
Learning collaborative in 10 DHs to improve intra-
partum care, C-sections operations, and newborn
resuscitation through IHI
• Training and demand generation of comprehensive
FP services (Minilap/PPTL, PPIUD, IUD) across 200
high volume facilities
• Improving FP service quality and informed choice
Improving quality of care beyond PHCs at
DHs / RHs through QI and doctor
mentoring is crucial to improve
complications management and
provision of comprehensive FP services
Families
FACILITIES
Schematic adapted from BMGF

13
Hypotheses and Nature of our support to GOB changed significantly over time based on learnings from eight districts
Improving health systems (HR, critical supplies and infrastructure) is essential to
improve quality of care but will be taken care of by other DPs
Overcoming
health system
barriers and
provision of
policy guidance
+
Strengthening
leadership,
culture of focus
on outcomes
within GoB
Building
accountability
within GoB
through data
and monitoring
+
..will be critical to achieve and sustain results at scale
CHWs
SHGs
Other community
platformsImproving skills and
performance of community
health workers to improve
quantity, quality, equity &
timeliness of interactions with
families will drive service
uptake and behavior change
Integrating health into SHGs
will drive service uptake and
behavior change among
marginalized communities
PHC
RHDH
Going-in hypothesis
in 8 districtsNew hypothesis with
scale up
Initiatives carried
forward from 8 districts
New initiatives with scale
up
Improving quantity, quality,
equity & timeliness of CHW
interactions with families through
home visits does drive behavior
change but is under powered to
increase reach and coverage,
hence need to consider
alternative plays
Integrating health into SHGs
works but GOB ownership
required for comprehensive
scale play
improving quality of care beyond PHCs at
DHs / RHs through QI and doctor
mentoring is crucial to improve
complications management and
provision of comprehensive FP services
Informal
Private
Providers
Formal
Private
ProvidersLeveraging formal/informal private
providers will improve timely &
appropriate treatment of childhood
infectious diseases (diarrhea,
pneumonia)
• Learning investment across 2 districts to improve
diarrhea / pneumonia outcomes across private and
public sector
Improving pneumonia-diarrhea
outcomes at population level requires
addressing barriers to care and
working with a large proportion of
informal /formal providers
Families
PRIVATE
SECTOR
Schematic adapted from BMGF

14
Our approach for RMNCHN changed significantly since inception based on learnings from 8 districts
Informal
Private
Providers
Formal
Private
Providers
Leveraging formal/informal private
providers will improve timely &
appropriate treatment of childhood
infectious diseases (diarrhea,
pneumonia)
CHWs
SHGs
Other community
platformsImproving skills and
performance of community
health workers to improve
quantity, quality, equity &
timeliness of interactions with
families will drive service
uptake and behavior change
Integrating health into SHGs
will drive service uptake and
behavior change among
marginalized communities
PHC
RHDH
Going-in hypothesis
in 8 districtsNew hypothesis with
scale up
Initiatives carried
forward from 8 districts
New initiatives with scale
up
Improving quantity, quality,
equity & timeliness of CHW
interactions with families through
home visits does drive behavior
change but is under powered to
increase reach and coverage,
hence need to consider
alternative plays
Integrating health into SHGs
works but GOB ownership
required for comprehensive
scale play
improving quality of care beyond PHCs at
DHs / RHs through QI and doctor
mentoring is crucial to improve
complications management and
provision of comprehensive FP services
Improving pneumonia-diarrhea
outcomes at population level requires
addressing barriers to care and
working with a large proportion of
informal /formal providers
Improving health systems (HR, critical supplies and infrastructure) is essential to
improve quality of care but will be taken care of by other DPs+
Strengthening
leadership,
culture of focus
on outcomes
within GoB
+
Building
accountability
within GoB
through data
and monitoring
Overcoming
health system
barriers and
provision of
policy guidance
..will be critical to achieve and sustain results at scale
• HR support – rationalization and policy changes
• Streamlining supply chain – procurement guidelines,
pharmacist trainings
• Operationalizing PPP cell and improved accreditation
policies
• Strengthening NCH services through functional pediatric
ward and SNCUs at District Hospitals
• TA to GoB for integrated information systems through ICT
• Planning and management support: PIP, budget and
expenditure tracking
• TA to strengthen procurement and distribution of supplies
Families
Health Systems
Schematic adapted from BMGF

15
Our approach for RMNCHN changed significantly since inception based on learnings from 8 districts
Informal
Private
Providers
Formal
Private
Providers
Leveraging formal/informal private
providers will improve timely &
appropriate treatment of childhood
infectious diseases (diarrhea,
pneumonia)
CHWs
SHGs
Other community
platformsImproving skills and
performance of community
health workers to improve
quantity, quality, equity &
timeliness of interactions with
families will drive service
uptake and behavior change
Integrating health into SHGs
will drive service uptake and
behavior change among
marginalized communities
PHC
RHDH
Going-in hypothesis
in 8 districtsNew hypothesis with
scale up
Initiatives carried
forward from 8 districts
New initiatives with scale
up
Improving quantity, quality,
equity & timeliness of CHW
interactions with families through
home visits does drive behavior
change but is under powered to
increase reach and coverage,
hence need to consider
alternative plays
Integrating health into SHGs
works but GOB ownership
required for comprehensive
scale play
improving quality of care beyond PHCs at
DHs / RHs through QI and doctor
mentoring is crucial to improve
complications management and
provision of comprehensive FP services
Improving pneumonia-diarrhea
outcomes at population level requires
addressing barriers to care and
working with a large proportion of
informal /formal providers
Improving health systems (HR, critical supplies and infrastructure) is essential to
improve quality of care but will be taken care of by other DPs+
Strengthening
leadership,
culture of focus
on outcomes
within GoB
+
Building
accountability
within GoB
through data
and monitoring
..will be critical to achieve and sustain results at scale
Families
Strengthening
leadership,
culture of focus
on outcomes
within GoB
• On the job support and tools to strengthen leadership of
ICDS and Health at different levels
• Peer to peer influence through TSU team presence
• Plan for leadership and management development
programs for GoB officials
• Universal, modular program management trainings for
GoB leadership
• Rewards and Recognition program (Bihar Swasth Seva
Ratan)
Schematic adapted from BMGF
16
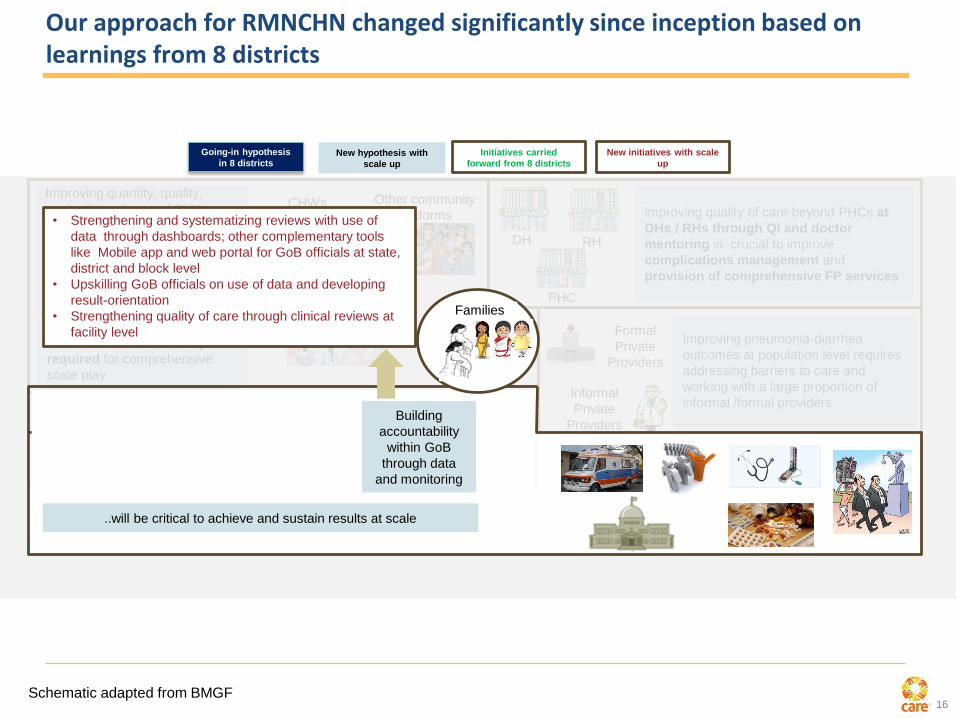
Our approach for RMNCHN changed significantly since inception based on learnings from 8 districts
Informal
Private
Providers
Formal
Private
Providers
Leveraging formal/informal private
providers will improve timely &
appropriate treatment of childhood
infectious diseases (diarrhea,
pneumonia)
CHWs
SHGs
Other community
platformsImproving skills and
performance of community
health workers to improve
quantity, quality, equity &
timeliness of interactions with
families will drive service
uptake and behavior change
Integrating health into SHGs
will drive service uptake and
behavior change among
marginalized communities
PHC
RHDH
Going-in hypothesis
in 8 districtsNew hypothesis with
scale up
Initiatives carried
forward from 8 districts
New initiatives with scale
up
Improving quantity, quality,
equity & timeliness of CHW
interactions with families through
home visits does drive behavior
change but is under powered to
increase reach and coverage,
hence need to consider
alternative plays
Integrating health into SHGs
works but GOB ownership
required for comprehensive
scale play
improving quality of care beyond PHCs at
DHs / RHs through QI and doctor
mentoring is crucial to improve
complications management and
provision of comprehensive FP services
Improving pneumonia-diarrhea
outcomes at population level requires
addressing barriers to care and
working with a large proportion of
informal /formal providers
Improving health systems (HR, critical supplies and infrastructure) is essential to
improve quality of care but will be taken care of by other DPs+
Strengthening
leadership,
culture of focus
on outcomes
within GoB
+
Building
accountability
within GoB
through data
and monitoring
..will be critical to achieve and sustain results at scale
Families
Building
accountability
within GoB
through data
and monitoring
• Strengthening and systematizing reviews with use of
data through dashboards; other complementary tools
like Mobile app and web portal for GoB officials at state,
district and block level
• Upskilling GoB officials on use of data and developing
result-orientation
• Strengthening quality of care through clinical reviews at
facility level
Schematic adapted from BMGF
17
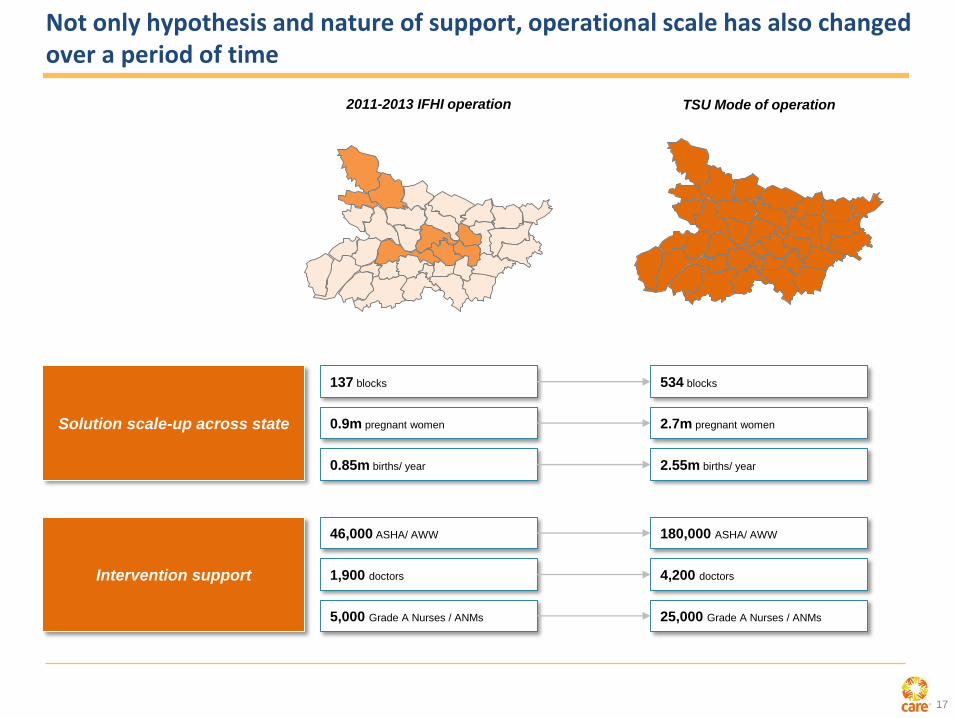
2011-2013 IFHI operation TSU Mode of operation
Solution scale-up across state
137 blocks 534 blocks
0.9m pregnant women 2.7m pregnant women
0.85m births/ year 2.55m births/ year
Intervention support
46,000 ASHA/ AWW 180,000 ASHA/ AWW
1,900 doctors 4,200 doctors
5,000 Grade A Nurses / ANMs 25,000 Grade A Nurses / ANMs
Not only hypothesis and nature of support, operational scale has also changed over a period of time
18
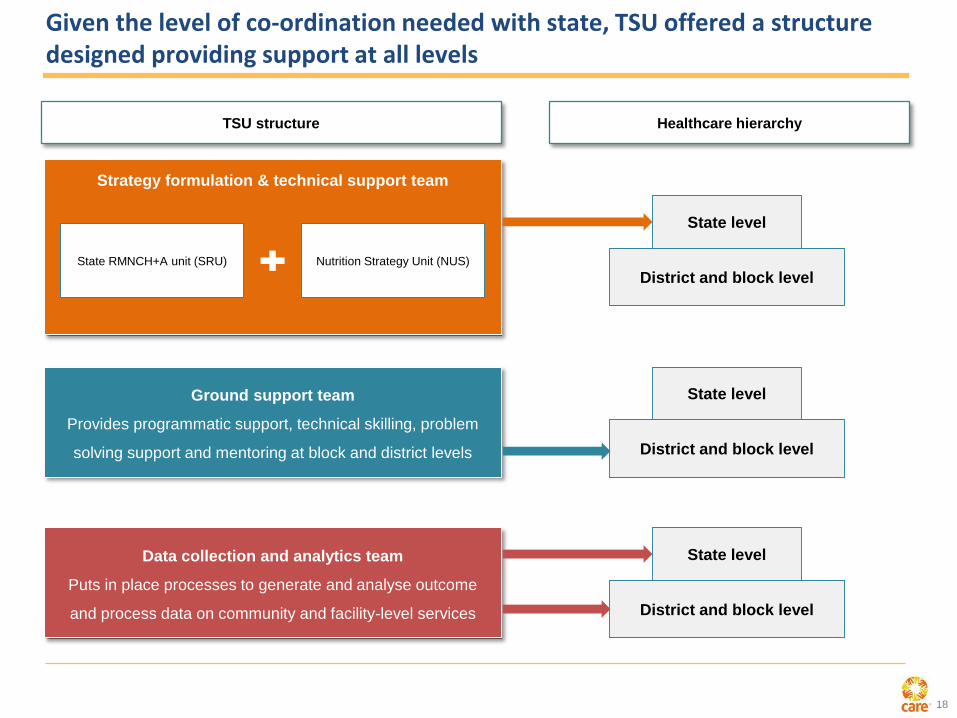
Given the level of co-ordination needed with state, TSU offered a structure designed providing support at all levels
Strategy formulation & technical support team
State RMNCH+A unit (SRU) Nutrition Strategy Unit (NUS)
District and block level
State level
Ground support team
Provides programmatic support, technical skilling, problem
solving support and mentoring at block and district levels
Data collection and analytics team
Puts in place processes to generate and analyse outcome
and process data on community and facility-level services
TSU structure Healthcare hierarchy
District and block level
State level
District and block level
State level

19
CML Framework- What are we trying to do
Domains in
which we are
working
Maternal, New
born & Child
Health
Reproductive
Health/ Family
Planning
Nutrition
Strengthening
Health System
Childhood
Pneumonia and
Diarrhoea
VL
Measurement
Framework
Tracking Progress of
intervention/solution
implemented by the system
and BTSP
Output and Outcome level
Input and Process level
Deep Dives
Exploratory studies
Assessment of Solutions
Web
Platform for
real-time
data access
Geo-tagging
and geo
spatial
analysis
Presenting
data to the
GoB at
appropriate
level

20
Co
vera
ge:
po
pu
lati
on
su
rvey:
LQ
AS
+
534 blocks across 38districts
78,435 respondents
15,687 sample
size/age group
Co
vera
ge:
Qo
CM
easu
rem
en
tsData Quality
Assurance:
15% back checks
0-2 months
3-5 months
6-8 months
9-11 months
12-23 months
Age Groups
All Districts covered:
District Estimates and the state
estimate
Coverage of some of the major measurement efforts
Frequency: Bi-
annual
All functional facilities of Bihar
Infrastructure and HR: annual
Equipment, supply, record
keeping: bi-annual
Facility Assessment
Pre and post mentoring
Independent observation through
a check-list
Covered 400 facilities
Direct Observation of Delivery
During the period of mentoring
Granular case-wise data
Covered 400 facilities
Facility Information System

21
Family Planning

22
Contraceptive method mix
Method
6-8 months age group 12-23 months age group 6-8 months age group
(VHSND pilot blocks)
R6 R7 Change R6 R7 Change R6 R7 Change
mCPR 13% 11% 18% 18% 12% 16%
IUD 0.4% 0.8% 0.6% 0.7% 0.3% 1.9%
Injectable 0.3% 0.5% 0.4% 0.7% 0.3% 1.1%
OCP 1% 1% 1.3% 0.3% 1.1% 1.1%
Condoms 1.3% 1.1% 1.3% 1% 1.4% 1.1%
TL 10.2% 7.5% 13.8% 14.1% 8.9% 11%
0.1% 0.1% 0.1% 0.1%0.0%
0.2%
0.4%0.3%
0.7%
0.2%
0.7%
0.3%
6-8 mo. 6-8 mo.(30 EH sites)
6-8 mo.(PPIUCD sites)
12-23 mo. 12-23 mo.(30 EH sites)
12-23 mo.(PPIUCD sites)
R6
R7
Uptake of
PPIUCD
across age
groups
Source: LQAS R6 (May – Sept 2014) and R7 (Sept – Nov 2015)
23
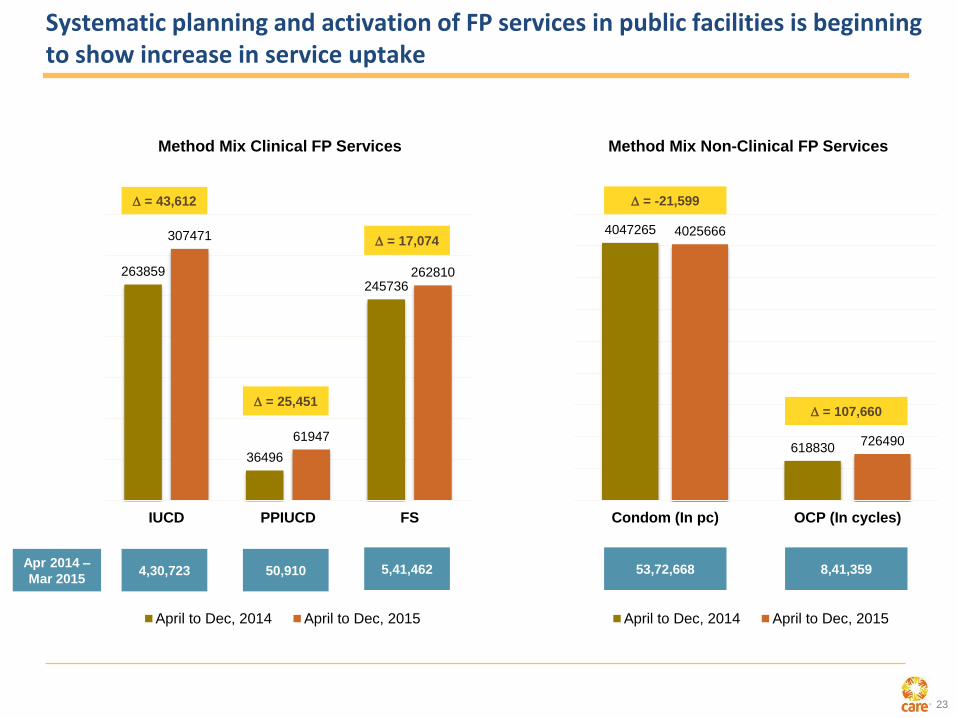
Systematic planning and activation of FP services in public facilities is beginning to show increase in service uptake
263859
36496
245736
307471
61947
262810
IUCD PPIUCD FS
Method Mix Clinical FP Services
April to Dec, 2014 April to Dec, 2015
4047265
618830
4025666
726490
Condom (In pc) OCP (In cycles)
Method Mix Non-Clinical FP Services
April to Dec, 2014 April to Dec, 2015
Apr 2014 –
Mar 20154,30,723 50,910 5,41,462
= 43,612
= 25,451
= 17,074
= -21,599
= 107,660
53,72,668 8,41,359
24
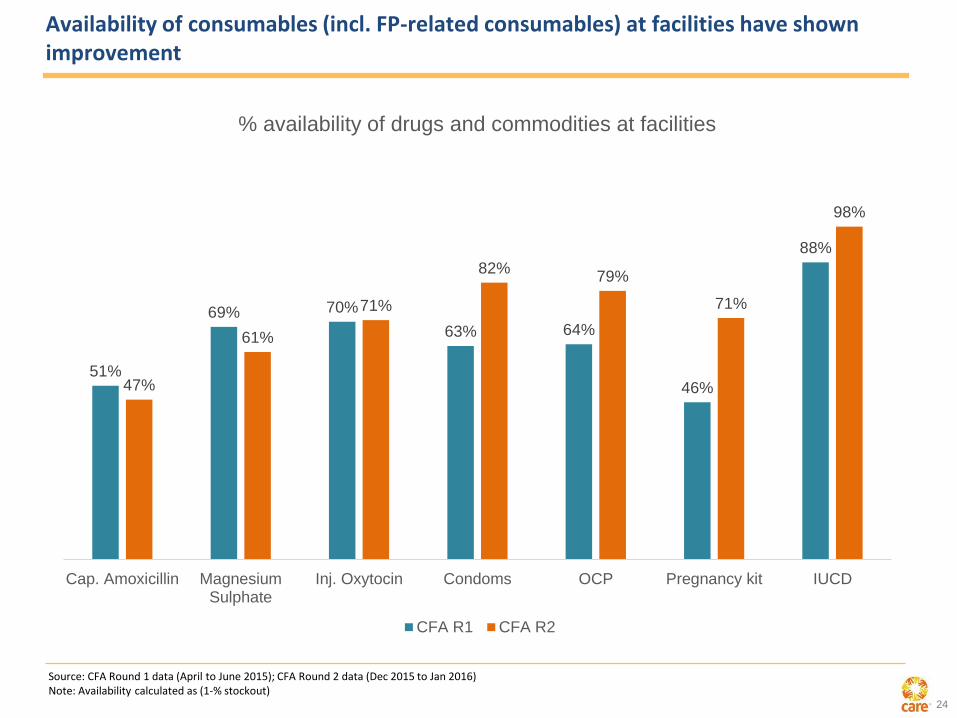
Availability of consumables (incl. FP-related consumables) at facilities have shown improvement
51%
69% 70%
63% 64%
46%
88%
47%
61%
71%
82%79%
71%
98%
Cap. Amoxicillin MagnesiumSulphate
Inj. Oxytocin Condoms OCP Pregnancy kit IUCD
% availability of drugs and commodities at facilities
CFA R1 CFA R2
Source: CFA Round 1 data (April to June 2015); CFA Round 2 data (Dec 2015 to Jan 2016)Note: Availability calculated as (1-% stockout)
25
Maternal Health

26
AMANAT trainings have significantly improved clinical practices at facilities (1/2)
Handing washing with water and soap
(before delivery) *
81%91%
Non-AMANAT facilities AMANAT facilities
10 IU Oxytocin administered
(within 1 minute of delivery) *
14%
53%
Non-AMANAT facilities AMANAT facilities
Did not apply Fundal pressure *
71%
86%
Non-AMANAT facilities AMANAT facilities
Any dose of Oxytocin administered
(after delivery) *
78%
91%
Non-AMANAT facilities AMANAT facilities
Source: 2015 DoD in Non-AMANAT facilities and AMANAT facilities
* Statistically significant (p<0.05)

27
Referral protocols have shown improvement (additional improvement in AMANAT facilities) with better supervision and referral tracking mechanism (Purnia district example)
0.7% 0.2% 0.3%
8.3%
2.3%
3.7%
8.8%
4.2%5.3%
AMANAT facilities Non-AMANAT facilities Total
% complications identified
Apr'15
Jul'15
Oct'15
Note: No. of births in April 2015 = 3969, July 2015 = 5090, October 2015 = 6299
0.0% 3.3% 2.4%
71.4%
33.3%
47.4%
75.9% 72.7% 74.2%
AMANAT facilities Non-AMANAT facilities Total
% cases that reached DH with Referral slip/ written advice vs cases that reached DH
Apr'15
Jul'15
Oct'15
0.0% 3.3% 2.4%
64.3%
8.3%
28.9%
62.0%
24.2%
37.1%
AMANAT facilities Non-AMANAT facilities Total
% cases that reached DH with initial stabilization as per SOP vs cases that reached DH
Apr'15
Jul'15
Oct'15
For Oct’15, N = 6299
For Oct’15, N = 62
For Oct’15, N = 62

28
New Born Health
29
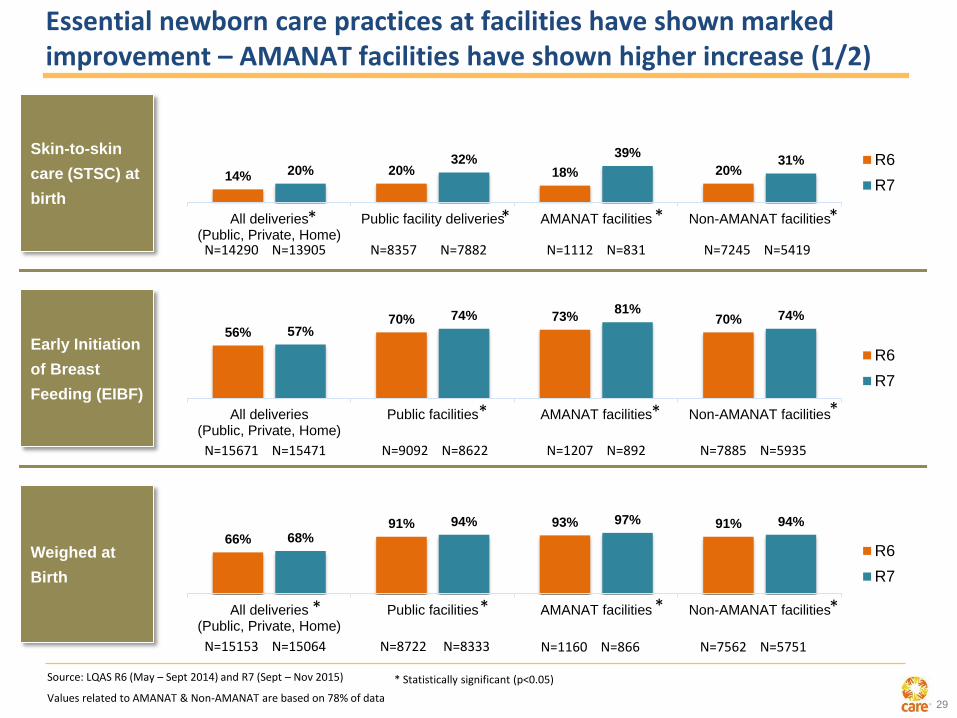
Essential newborn care practices at facilities have shown marked improvement – AMANAT facilities have shown higher increase (1/2)
Skin-to-skin
care (STSC) at
birth
Early Initiation
of Breast
Feeding (EIBF)
Weighed at
Birth
14% 20% 18% 20%20%32%
39%31%
All deliveries(Public, Private, Home)
Public facility deliveries AMANAT facilities Non-AMANAT facilities
R6
R7
56%70% 73% 70%
57%
74%81%
74%
All deliveries(Public, Private, Home)
Public facilities AMANAT facilities Non-AMANAT facilities
R6
R7
66%
91% 93% 91%68%
94% 97% 94%
All deliveries(Public, Private, Home)
Public facilities AMANAT facilities Non-AMANAT facilities
R6
R7
Source: LQAS R6 (May – Sept 2014) and R7 (Sept – Nov 2015)
N=14290 N=13905 N=8357 N=7882 N=1112 N=831 N=7245 N=5419
N=15671 N=15471 N=9092 N=8622 N=1207 N=892 N=7885 N=5935
N=15153 N=15064 N=8722 N=8333 N=7562 N=5751 N=1160 N=866
Values related to AMANAT & Non-AMANAT are based on 78% of data
* * * *
***
* * **
* Statistically significant (p<0.05)
30
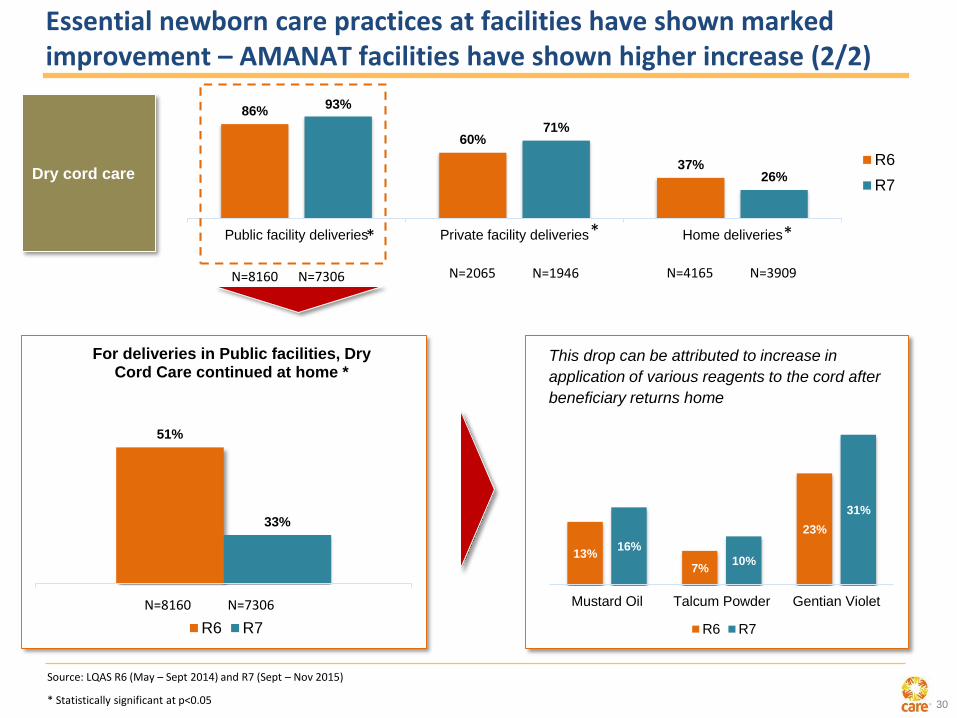
Dry cord care
86%
60%
37%
93%
71%
26%
Public facility deliveries Private facility deliveries Home deliveries
R6
R7
51%
33%
For deliveries in Public facilities, Dry Cord Care continued at home *
R6 R7
13%
7%
23%
16%
10%
31%
Mustard Oil Talcum Powder Gentian Violet
R6 R7
This drop can be attributed to increase in
application of various reagents to the cord after
beneficiary returns home
Essential newborn care practices at facilities have shown marked improvement – AMANAT facilities have shown higher increase (2/2)
Source: LQAS R6 (May – Sept 2014) and R7 (Sept – Nov 2015)
N=8160 N=7306 N=4165 N=3909 N=2065 N=1946
N=8160 N=7306
* Statistically significant at p<0.05
* **

31
vLBW tracking intervention has led to marked increase in accurate identification of vLBW babies and direct reduction in mortality of identified vLBWs
1 - vLBW implies babies with birth weight <= 2000 gms
2- Expected prevalence is from Facility Information System (FIS): this estimation is on the basis of
observation of large number of deliveries by nurse mentors working in facilities of rural Bihar
R1 - Before Intervention (Feb to Apr-15) N=1408
R2 - Post intervention (Sept to Oct-15) N= 1664
2%
4%
5.2%
Prior to structuredintervention
(Feb to Apr-15)
Post introductionof intervention(Sept to Oct-15)
ExpectedPrevalence
(Based on FIS data)
% live births identified as vLBW babies
8.3%
14.5%
R1 R2
KMC at facilities for vLBW babies
15%
34%
R1 R2
Identified vLBW babies advised for extra care at hospital
18%
46%
R1 R2
%vLBW families with at least 1 FLW visit in 1st week of delivery
41%
51%
R1 R2
%vLBW babies who were not bathed before 48 hrs of delivery
9.73%
7.84%
R1 R2
LBW babies who died within 3-27 days
(After adjustment) (After adjustment)
32
Nutrition

33
Practice of Exclusive Breast Feeding and Initiation of Complementary Feeding has shown improvement
67%
42%
46% 46%
76%
52%
61%
65%
Exclusive Breast Feeding (0-2months)
Exclusive Breast Feeding (3-5months)
Initiation of ComplementaryFeeding (6-8 months)
Initiation of ComplementaryFeeding (6-8 months) in VHSND
pilot blocksR6 R7
EBF and CF practices**
Source: LQAS R6 (May – Sept 2014) and R7 (Sept – Nov 2015)
N=15687 N=15649 N=15687 N=15649 N=15687 N=15649 N=643 N=639
** Statistically significant at p<0.05

34
38% 39%
68%
86%
6-8 months 9-11 months
Age appropriate frequency of feeding **
131150
99111
6-8 months 9-11 months
Age appropriate quantity of feeding (in ml.)
6%
15%
6%
14%
0%
5%
10%
15%
20%
6-8 months 9-11 months
Children receiving minimum dietary diversity
6%
10%
6%
13%
0%
5%
10%
15%
20%
6-8 months 9-11 months
Children receiving minimum acceptable diet
LQAS R6
LQAS R7
Frequency of complimentary feeding has improved significantly while other feeding practices (min. dietary diversity and min. acceptable diet) have remained stagnant
Source: LQAS R6 (May – Sept 2014) and R7 (Sept – Nov 2015)
N=15669 N=15648 N=15663 N=15648
N=15687 N=15649 N=15687 N=15649N=15687 N=15649N=15687 N=15649
** Statistically significant at p<0.05
Benchmark
value = 200 ml
Benchmark
value = 300 ml
35
0%
10%
20%
30%
40%
50%
60%
70%
80%
90%
100%
0th month 1st month 2nd month 3rd month 4th month 5th month
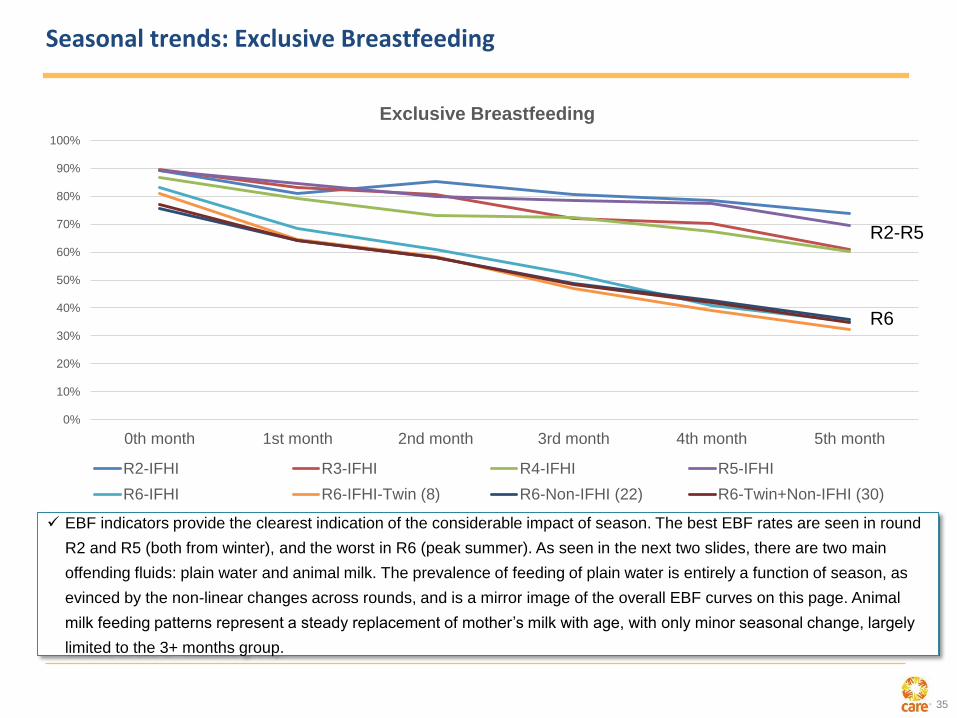
Exclusive Breastfeeding
R2-IFHI R3-IFHI R4-IFHI R5-IFHI
R6-IFHI R6-IFHI-Twin (8) R6-Non-IFHI (22) R6-Twin+Non-IFHI (30)
R2-R5
R6
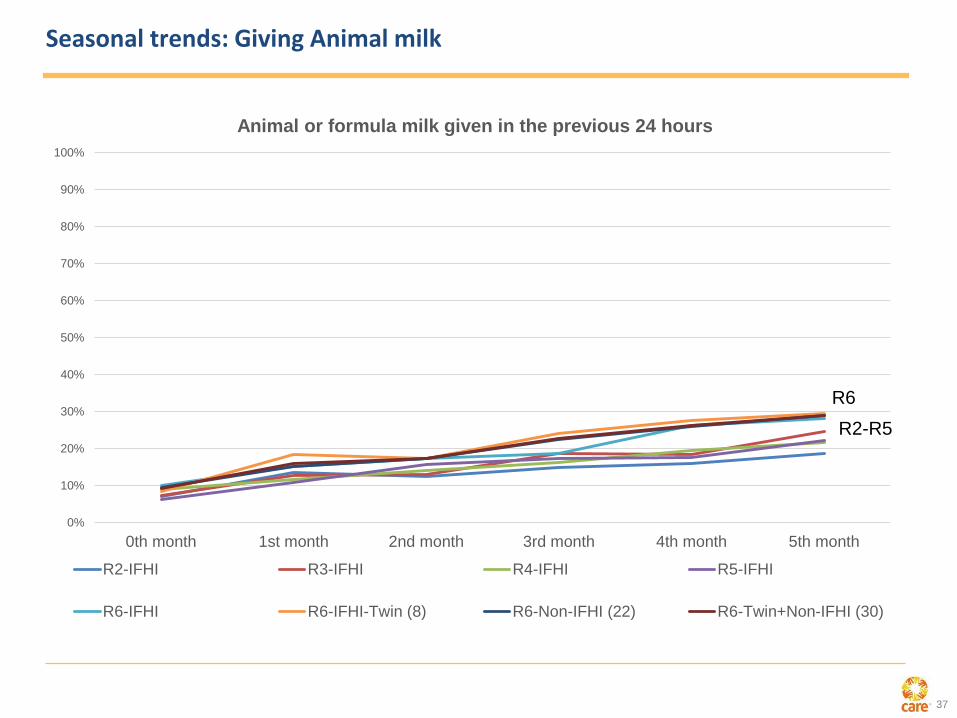
EBF indicators provide the clearest indication of the considerable impact of season. The best EBF rates are seen in round
R2 and R5 (both from winter), and the worst in R6 (peak summer). As seen in the next two slides, there are two main
offending fluids: plain water and animal milk. The prevalence of feeding of plain water is entirely a function of season, as
evinced by the non-linear changes across rounds, and is a mirror image of the overall EBF curves on this page. Animal
milk feeding patterns represent a steady replacement of mother’s milk with age, with only minor seasonal change, largely
limited to the 3+ months group.
Seasonal trends: Exclusive Breastfeeding
36
0%
10%
20%
30%
40%
50%
60%
70%
80%
90%
100%
0th month 1st month 2nd month 3rd month 4th month 5th month
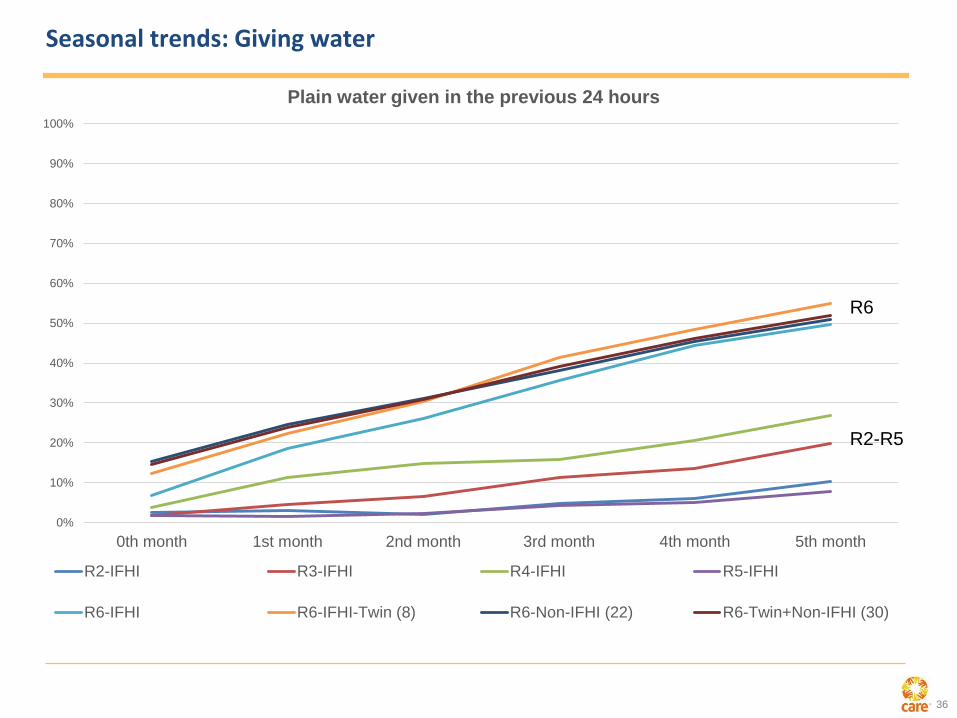
Plain water given in the previous 24 hours
R2-IFHI R3-IFHI R4-IFHI R5-IFHI
R6-IFHI R6-IFHI-Twin (8) R6-Non-IFHI (22) R6-Twin+Non-IFHI (30)
R6
R2-R5
Seasonal trends: Giving water
37
0%
10%
20%
30%
40%
50%
60%
70%
80%
90%
100%
0th month 1st month 2nd month 3rd month 4th month 5th month
Animal or formula milk given in the previous 24 hours
R2-IFHI R3-IFHI R4-IFHI R5-IFHI
R6-IFHI R6-IFHI-Twin (8) R6-Non-IFHI (22) R6-Twin+Non-IFHI (30)
R2-R5
R6
Seasonal trends: Giving Animal milk

38
Visceral Leishmaniasis

39
Historical Visceral Leishmaniasis Incidence in Bihar

40
Interventions for VL Elimination
VL Elimination
IRS Spray
Complete Treatment
Surveillance KA-MIS
Early Diagnosis

41
Effectiveness of IRS Spray
40.1% 35.1% 36.1% 36.3% 37.9% 40.3%52.9%
12.3% 27.4%33.3% 36.2% 29.5%
33.4%
28.6%52.4%
62.5%69.4% 72.5%
67.4%73.7%
81.5%
0.0%
20.0%
40.0%
60.0%
80.0%
100.0%
DDT SP DDT SP
2014 R1 2014 R2 2015 R1 2015 R2 2016 R1
Proportion of HHs covered
Completely sprayed
9.4% 9.0% 10.2%
5.6%
0%
5%
10%
15%
R II 2015 R 1 2016 R II 2015 R 1 2016
DDT SP
Less than 10% HH refuse spraying, and even this has come down with SP
85% 86% 80% 90%
0%20%40%60%80%
100%
R II 2015 R 1 2016 R II 2015 R 1 2016
DDT SP
Squads reach a high proportion of HH, similar for DDT and SP

42
IRS as main intervention for elimination
32% 32%45% 40% 35% 36% 37%
48%
12% 27%33% 35%
31%
0
0.5
1
1.5
2
2.5
0%
20%
40%
60%
80%
100%
2011 2012 2013 2014 R1 2014 R2 2015 R1 2015 R2 2016 R1
Inci
den
ce (
per
10
,00
0)
IRS
Co
vera
ge
Completely Sprayed Partially Sprayed Incidence of VL
Projections of IRS coverage for 2012 and 2013 were made based on linear regression modelling using district
level coverages of 2014 to 2016, by which point monitoring support had increased considerably It is assumed
that the 2012 coverage was typical of years since the appointment of KTS and VBDC under World Bank support.
Source – CML Survey

43
Donor
Lead Partner
Partners
Sub Grantees
Thanking all who are supporting our work in Bihar…