bihar government draft - indiaenvironmentportaladmin.indiaenvironmentportal.org.in/files/file/bihar...
TRANSCRIPT

Draft State Action Plan
For Climate Change
Valuable suggestions and feedback can be given on Email : [email protected].
Bihar Government

Draft – November 2014 For consultation Only – Not to be Quoted or Circulated
State Action Plan on Climate Change
‘Building Resilience through Development’
Government of Bihar 2014

Bihar Action Plan for Climate Change
Draft Version November 2014 XIX
Supported by United Nations Development Programme
Bihar Action Plan for Climate Change
Draft Version November 2014 XIX
Table of Contents Table of Contents ................................................................................................................... iii
List of Tables ........................................................................................................................... vi
List of Figures ........................................................................................................................ vii
Foreword .............................................................................................................................. viii
Acknowledgements ................................................................................................................ ix
Abbreviations/Acronyms ........................................................................................................ x
Introduction .................................................................................................................... 13
Background and Context ....................................................................................................... 13
The National Context ............................................................................................................ 13
The Bihar Context .................................................................................................................. 14
Bihar -- ‘Building Resilience through Development’ ............................................................. 15
BAPCC Preparation Process ................................................................................................... 16
Part A: General and Climate Profile - Introduction ........................................... 1
1 State Profile ................................................................................................................ 2
1.1 Location and Physiography ............................................................................................ 2
1.2 Demographic and Human Development Profile ........................................................... 4
1.3 Economy ........................................................................................................................ 6
1.4 Focus Sectors ................................................................................................................. 9
2 Climate Profile of the state ......................................................................................... 12
2.1 Introduction ................................................................................................................. 12
2.2 Climate Change Scenarios ........................................................................................... 12
2.3 Key Conclusions ........................................................................................................... 22
Part B: Climate Change Strategy ....................................................................... 24
3 Overarching State Framework .................................................................................... 25
3.1 State Vision and Commitment ..................................................................................... 25
3.2 Overall Approach, Principles, and Strategies .............................................................. 25
4 Sectoral Implementation Approaches ......................................................................... 33
4.1 Overall Common Implementation Framework ........................................................... 33
5 Agriculture and Allied Sectors ..................................................................................... 35
5.1 Overview, Characteristics and Status .......................................................................... 35
5.2 Key Issues..................................................................................................................... 44
5.3 Existing/On-going Initiatives ........................................................................................ 45
5.4 Priorities ......................................................................... Error! Bookmark not defined.
5.5 Perceived Climate Impacts .......................................................................................... 51
5.6 Strategies ..................................................................................................................... 58
5.7 Institutional Linkages and Stakeholders ...................................................................... 60
5.8 Linkages with the NAPCC ............................................................................................. 60
5.9 Sectoral Action Plan and Budgets under the BAPCC ................................................... 60
6 Forests and Biodiversity ..................................................... Error! Bookmark not defined.
6.1 Overview, Characteristics and Status .......................................................................... 61
6.2 Key Issues..................................................................................................................... 68
6.3 Existing/On-going Initiatives ........................................................................................ 69

Bihar Action Plan for Climate Change
Draft Version November 2014 XIX
6.4 Priorities ...................................................................................................................... 69
6.5 Perceived Climate Impacts .......................................................................................... 70
6.6 Strategies ..................................................................................................................... 71
6.7 Institutional Linkages and Stakeholders ...................................................................... 74
6.8 Linkages with the NAPCC ............................................................................................. 74
6.9 Sectoral Action Plan and Budgets under the BAPCC ................................................... 75
7 Water Resources ....................................................................................................... 76
7.1 Overview, Characteristics and Status .......................................................................... 76
7.2 Key Issues..................................................................................................................... 79
7.3 Existing/On-going Initiatives ........................................................................................ 80
7.4 Priorities ...................................................................................................................... 83
7.5 Perceived Climate Impacts .......................................................................................... 84
7.6 Strategies ..................................................................................................................... 86
7.7 Institutional Linkages and Stakeholders ...................................................................... 89
7.8 Linkages with the NAPCC ............................................................................................. 89
7.9 Sectoral Action Plan and Budgets under the BAPCC ................................................... 89
8 Disaster Management ................................................................................................ 90
8.1 Overview, Characteristics and Status .......................................................................... 90
8.2 Key Issues..................................................................................................................... 95
8.3 Existing/On-going Initiatives ........................................................................................ 96
8.4 Priorties ............................................................................................................ 97
8.5 Perceived Climate Impacts .......................................................................................... 97
8.6 Strategies ..................................................................................................................... 97
8.7 Institutional Linkages and Stakeholders .................................................................... 101
8.8 Linkages with the NAPCC ........................................................................................... 101
8.9 Sectoral Action Plan and Budgets under the BAPCC ................................................. 101
9 Urban Development .......................................................... Error! Bookmark not defined.
9.1 Overview, Characteristics and Status ........................................................................ 102
9.2 Key Issues................................................................................................................... 106
9.3 Existing/On-going Initiatives ...................................................................................... 106
9.4 Priorities .................................................................................................................... 108
9.5 Perceived Climate Impacts ........................................................................................ 111
9.6 Strategies ................................................................................................................... 112
9.7 Institutional Linkages and Stakeholders .................................................................... 114
9.8 Linkages with the NAPCC ........................................................................................... 114
9.9 Sectoral Action Plan and Budgets under the BAPCC ................................................. 115
10 Transport .............................................................................................................. 116
10.1 Overview, Characteristics and Status ...................................................................... 116
10.2 Key Issues ................................................................................................................ 118
10.3 Existing/On-going Initiatives ................................................................................... 118
10.4 Priorities .................................................................................................................. 119
10.5 Perceived Climate Impacts ...................................................................................... 120
10.6 Strategies ................................................................................................................. 121
10.7 Institutional Linkages and Stakeholders .................................................................. 121
10.8 Linkages with the NAPCC......................................................................................... 122

Bihar Action Plan for Climate Change
Draft Version November 2014 XIX
10.9 Sectoral Action Plan and Budgets under the BAPCC ............................................... 122
11 Energy .................................................................................................................. 123
11.1 Overview, Characteristics and Status ...................................................................... 123
11.2 Key Issues ................................................................................................................ 125
11.3 Existing/On-going Initiatives ................................................................................... 126
11.4 Priorities .................................................................................................................. 127
11.5 Perceived Climate Impacts ...................................................................................... 132
11.6 Strategies ................................................................................................................. 135
11.7 Institutional Linkages and Stakeholders .................................................................. 138
11.8 Linkages with the NAPCC......................................................................................... 138
11.9 Sectoral Action Plan and Budgets under the BAPCC ............................................... 138
12 Industries and Mining ............................................................................................ 139
12.1 Overview, Characteristics and Status ...................................................................... 139
12.2 Key Issues ................................................................................................................ 142
12.3 Existing/On-going Initiatives ................................................................................... 143
12.4 Priorities .................................................................................................................. 148
12.5 Perceived Climate Impacts ...................................................................................... 148
12.6 Strategies ................................................................................................................. 149
12.7 Institutional Linkages and Stakeholders .................................................................. 150
12.8 Linkages with the NAPCC......................................................................................... 150
12.9 Sectoral Action Plan and Budgets under the BAPCC ............................................... 150
13 Human Health ....................................................................................................... 151
13.1 Overview, Characteristics and Status ...................................................................... 151
13.2 Key Issues ................................................................................................................ 154
13.3 Existing/On-going Initiatives ................................................................................... 154
13.4 Priorities .................................................................................................................. 156
13.5 Perceived Climate Impacts ...................................................................................... 158
13.6 Strategies ................................................................................................................. 164
13.7 Institutional Linkages and Stakeholders .................................................................. 166
13.8 Linkages with the NAPCC......................................................................................... 166
13.9 Sectoral Action Plan and Budgets under the BAPCC ............................................... 166
Part C: Climate Change Action Plans and Budgets...................................... 167
Annexure 1: Overarching State Level Actions ................................................................... 168
Annexure 2: Agriculture ................................................................................................. 171
Annexure 2: Forests and Biodiversity .............................................................................. 178
Annexure 3: Water Resources ........................................................................................ 183
Annexure 4: Disaster Management ................................................................................. 187
Annexure 5: Urban Development ................................................................................... 192
Annexure 6: Transport ................................................................................................... 199
Annexure 8: Industries and Mining ................................................................................. 205
Annexure 9: Human Health ............................................................................................ 209

Bihar Action Plan for Climate Change
Draft Version November 2014 XIX
List of Tables Table 1 Bihar administrative divisions ____________________________________________________ 2 Table 2 Agro-climatic zones in Bihar _____________________________________________________ 3 Table 3 Economic and human development indicators _____________________________________ 4 Table 4 Compound Annual Growth Rate (CAGR) of GSDP _____________________________ 7 Table 5 Relatively prosperous and backward districts of Bihar ______________________________ 8 Table 6 Land utilization pattern in Bihar (2006-07 to 2008-09; area in '000 hectares) __________ 36 Table 7 Cropping Pattern in Bihar 2001-02 to 2009-10) ___________________________________ 37 Table 8 Productivity (Kg/ha) of major crops in Bihar ______________________________________ 37 Table 9 Strategy for Mitigation and Adaptation to meet challenges of climatic change _______ 40
Table 10 Resource enhancement: I. Through Renovation of pond. ______________________ 41
Table 11 Resource enhancement: II. Through fish seed recruitment in developed ponds ____ 41
Table 12 Requirement of fund 42 Table 13 Different level of training, their duration and destination 42 Table 14 Estimate of per unit Gober Gas Plant ___________________________________________ 43 Table 15 Simulated impact of climate change on growth parameters of wheat _____________ 53 Table 16 Simulated impact of climate change on growth parameters of maize _____________ 54 Table 17 Rainfall, climate, soil group, altitude, and zones in South Bihar ____________________ 61 Table 18: Rainfall, climate, soil group, altitude, and zones in South Bihar ____________________ 62 Table 19: Dominant tree/plant species __________________________________________________ 63 Table 20: District wise forest cover in the state (Km2) _____________________________________ 64 Table 21: Forest cover change matrix (area in Km2) ______________________________________ 65 Table 22: Altitude zone wise Forest cover (area in Km2) ___________________________________ 66 Table 23: Forest and tree cover ________________________________________________________ 66 Table 24: Growing Stock (million cum) __________________________________________________ 66 Table 25: Bamboo bearing area by density in recorded forest area (Area in km2)_____________ 66 Table 26: Protected areas in Bihar ______________________________________________________ 66 Table 27: Area estimates of wetlands in Bihar ____________________________________________ 68 Table 28: Groundwater resources in Bihar _______________________________________________ 76 Table 29: Water utilization efficiency of major and medium irrigation schemes ( in '000 ha) ____ 78 Table 30: Irrigated area through minor irrigation sources (Area in '000 hectares) _____________ 78 Table 31: District-wise data on Ahar-Pynes/irrigation ponds ________________________________ 79 Table 32: Urban agglomeration with over 100,000 population _____________________________ 102 Table 33: Level of urban service - Bihar in comparison with national standard, national average and 24 town average_________________________________________________________________ 103 Table 34: Number of registered vehicles (2005-06 to 2011-12; up to Dec. 2011) ____________ 116 Table 35: Transport and allied sectors as sectoral composition of GSDP at constant price (2004-05 to 2011-12) ______________________________________________________________________ 116 Table 36: Power supply position in Bihar _______________________________________________ 123 Table 37: Forecast of peak load and energy requirement (2011-12 to 2016-17) _____________ 123 Table 38: Renewable energy potential of Bihar __________________________________________ 125 Table 39: Potential energy sector vulnerability to climate change __________________________ 133 Table 40: : Large scale industries in Bihar (2010-11) _____________________________________ 139
Table 41: List of important impacts of climate change on health ___ ____________________161 Table 42: Average monthly value of rainfall and malaria cases in Purnia district during the period of Sept 2010 to Aug 2010 ____________________________________________________________ 163

Bihar Action Plan for Climate Change
Draft Version November 2014 XIX
List of Figures Figure 1: _____________________________________________________________________________ 2 Figure 2: _____________________________________________________________________________ 4 Figure 3: _____________________________________________________________________________ 8
Figure 4: ____________________________________________________________________________ 13
Figure 5: ____________________________________________________________________________ 13 Figure 6: ____________________________________________________________________________ 14 Figure 7: ____________________________________________________________________________ 15 Figure 8: ____________________________________________________________________________ 15 Figure 9: ____________________________________________________________________________ 16 Figure 10: ___________________________________________________________________________ 16 Figure 11: ___________________________________________________________________________ 17 Figure 12: ___________________________________________________________________________ 17 Figure 13: ___________________________________________________________________________ 18 Figure 14: ___________________________________________________________________________ 27 Figure 15: ___________________________________________________________________________ 31 Figure 16: ___________________________________________________________________________ 33 Figure 17: ___________________________________________________________________________ 54 Figure 18: ___________________________________________________________________________ 56 Figure 19: ___________________________________________________________________________ 57 Figure 20: ___________________________________________________________________________ 57 Figure 21: ___________________________________________________________________________ 63 Figure 22: ___________________________________________________________________________ 65 Figure 23: ___________________________________________________________________________ 68 Figure 24: ___________________________________________________________________________ 91 Figure 25: ___________________________________________________________________________ 91 Figure 26: ___________________________________________________________________________ 93 Figure 27: ___________________________________________________________________________ 93 Figure 28: ___________________________________________________________________________ 94 Figure 29: ___________________________________________________________________________ 94 Figure 30: ___________________________________________________________________________ 95 Figure 31: __________________________________________________________________________ 162 Figure 32: __________________________________________________________________________ 162
Figure 33: __________________________________________________________________________ 164 Figure 34: __________________________________________________________________________ 164

Bihar Action Plan for Climate Change
Draft Version November 2014 XIX
Foreword To be written

Bihar Action Plan for Climate Change
Draft Version November 2014 XIX
Acknowledgements To be written

Bihar Action Plan for Climate Change
Draft Version November 2014 XIX
Abbreviations/Acronyms
Acronym Expanded Form ADB Asian Development Bank AHS Annual Health Survey ANC Ante-Natal Care ATC Aggregate Technical and Commercial BAPCC Bihar State Action Plan for Climate Change BEE Bureau of Energy Efficiency BEE Bureau of Energy Efficiency BERC Bihar Electricity Regulatory Commission BIADA Bihar Industrial Area Development Authority BIFR Board for Industrial and Financial Reconstruction BIGWIS Bihar Groundwater Irrigation Scheme BLY Bachat Lamp Yojana BRBN Bihar Rajya Beej Nigam BREDA Bihar Renewable Energy Development Agency BRLP Bihar Rural Livelihoods Project BRLPS Bihar Rural Livelihoods Project Society BSEB Bihar State Electricity Board BSFC Bihar State Financial Corporation BSHPC Bihar State Hydroelectric Power Corporation Limited BSRTC Bihar State Road Transport Corporation BSSC Bihar State Sugar Corporation BSUP Basic Services for Urban Poor BUIDCO Bihar Urban Infrastructure Development Corporation CBR Crude Birth rate CDM Clean Development Mechanism CDR Crude Death Rate CEA Central Electricity Authority CEPT Centre for Environment Planning and Technology CETP Common Effluent Treatment Plant CFL Compact Fluorescent Lamp COMPFED Bihar State Co-operative Milk Producers’ Federation Ltd CSS Centrally Sponsored Scheme DDG Decentralized Distribution Generation DFID Department for International Development, UK DIC District Industries Centre DMWR Department of Minor Water Resources DPR Detailed Project Report EOC Emergency Operations Centre FDA French Development Agency FMIS Flood Management Information System FYP Five Year Plan GDDP Gross District Development Product GFCF Gross State Capital Formation GIS Geographical Information System GoB Government of Bihar GSDP Gross State Domestic Product HUDCO Housing and Urban Development Corporation

Bihar Action Plan for Climate Change
Draft Version November 2014 XIX
Acronym Expanded Form IAY Indira Awas Yojana ICDS Integrated Child Development Scheme IEC Information, Education, and Communication IHSDP Integrated Housing and Slum Development Programme IMR Infant Mortality Rate IPP Independent Power Producer IPT Intermediate Public Transport ISDP Integrated Disease Surveillance Programme ITI Indian Technical Institute JBSY Janani Evam Bal Suraksha Yojana JFM Joint Forest Management JNNURM Jawaharlal Nehru National Urban Renewal Mission KCC Kisan Credit Card KVIC Khadi and Village Industries Commission MDR Major District Road MFC Multi-Functional Complex MMR Maternal Mortality Rate MNREGS Mahatma Gandhi National Rural Employment Guarantee Scheme MNSY Mukhya Mantri Nari Shakti Yojana MoEF Ministry of Environment and Forests MRTS Mass Rapid Transit System MSME Medium, Small, and Micro Enterprises NABARD National Bank for Rural and Agricultural Development NAPCC National Action Plan for Climate Change NDMA National Disaster Management Agency NDRF National Disaster Response Force NGRBA National Ganga River Basin Authority NGRBA National Ganga River Basin Authority NH National Highway NHPC National Hydroelectric Power Corporation Limited NPCIL Nuclear Power Corporation of India Limited NPSGY Nayi Peedhi Swasthya Guarantee Yojna NRHM National Rural Health Mission NRLP National Rural Livelihoods Programme NSDP Net State Domestic Product NTFP Non-Timber Forest Produce NTPC National Thermal Power Corporation Limited NWDA National Water Development Agency O&M Operation and Maintenance PACS Primary Agricultural Cooperative Society PCDE Per Capita Development Expenditure PDS Public Distribution System PESU Patna Electric Supply Undertaking PFC Power Finance Corporation Limited PGCIL Power Grid Corporation of India Limited PHED Public Health Engineering Department PIM Participatory Irrigation Management PPA Power Purchase Agreement PPP Public-Private Partnership PRI Panchayati Raj Institution PURA Provision of Urban Services for Rural Areas

Bihar Action Plan for Climate Change
Draft Version November 2014 XIX
Acronym Expanded Form R-APDRP Restructured Accelerated Power Development and Reform Programme R&M Restoration and Modernisation RGGVY Rajiv Gandhi Grameen Vidyutikaran Yojana RGSEAG Rajiv Gandhi Scheme for Empowerment of Adolescent Girls RIDF Rural Infrastructure Development Fund RSVY Rashtriya Sam Vikas Yojana SAPCC State Action Plan on Climate Change SC Scheduled Caste SDMA State Disaster Management Agency SDRF State Disaster Response Force SGSY Swarnajayanti Gram Swarozgar Yojana SH State Highway SHG Self-Help Group SHP Small Hydro Power SIPB State Investment Planning Board SOP Standard Operating Procedure SPCB State Pollution Control Board SRI System of Rice Intensification SRR Seed Replacement Ratio SSC State Steering Committee ST Scheduled Tribe STF Special Task Force STP Sewerage Treatment Plant T&D Transmission and Distribution TFR Total Fertility Rate UIDSSMT Urban Infrastructure Development Scheme for Small and Medium Towns UIG Urban Infrastructure Governance ULB Urban Local Body UNDP United Nations Development Programme UNFCCC United Nations Framework Convention on Climate Change UNICEF United nations Children’s Fund VFMPC Village Forest Management and Protection Committee WALMI Water and Land Management Institute WDC Women Development Corporation WLL Wireless in Locked Loop WRD Water Resources Department WUA Water Users Association

Bihar Action Plan for Climate Change
Draft Version November 2014 XIX
Introduction Background and Context
Climate change will have wide-ranging effects on the environment, and on socio-economic and related sectors, including water resources, agriculture and food security, human health, terrestrial ecosystems and biodiversity and coastal zones. Changes in rainfall pattern are likely to lead to severe water shortages and/or flooding. Melting of glaciers can cause flooding and soil erosion. Rising temperatures will cause shifts in crop growing seasons, which affects food security, and changes in the distribution of disease vectors putting more people at risk from diseases such as malaria and dengue fever. Temperature increases will potentially severely increase rates of extinction for many habitats and species (up to 30 percent with a 2° C rise in temperature). A rise in extreme events will have effects on health and lives as well as associated environmental and economic impacts. Because of the speed at which change is happening due to global temperature rise, it is urgent that the vulnerability of developing countries to climate change is reduced and their capacity to adapt is increased and national adaptation plans are implemented. Future vulnerability depends not only on climate change but also on the type of development path that is pursued. Thus adaptation should be implemented in the context of national and global sustainable development efforts. The international community is identifying resources, tools and approaches to support this effort. Adapting to climate change entails taking the right measures to reduce the negative effects of climate change (or exploit the positive ones) by making the appropriate adjustments and changes. There are many options and opportunities to adapt. These range from technological options such as increased sea defenses or flood-proof houses on stilts, to behaviour change at the individual level, such as reducing water use in times of drought and using insecticide-sprayed mosquito nets. Other strategies include early warning systems for extreme events, better water management, improved risk management, various insurance options and biodiversity conservation. The National Context
India’s economy and a majority of its population are highly dependent on climate sensitive sectors such as agriculture, animal husbandry, fisheries, tourism, etc. Since climate change is expected to impact natural and human systems adversely by inducing changes these systems, India can be considered highly vulnerable. Climate change is only likely to exacerbate India’s already high physical exposure to climate-related disasters (65 percent of India is drought prone, 12 percent flood prone, and 8 percent susceptible to cyclones). As a consequence, climate change is highly likely to impact livelihoods by disrupting social, cultural, economic, ecological systems, physical infrastructure, and human assets, accentuating health risks, and as such, posing severe risks to the development of the country. Since climate change impacts are felt at multiple levels from the global to the local, responses to climate change too need to be at multiple levels, calling for strategic interventions at local, sub-national, national, and global levels. At the global level, India’s contribution to multilateral negotiations in the United Nations Framework Convention on Climate Change (UNFCCC) has been significant and it continues to advocate for effective, cooperative and equitable global approaches based on the principle of ‘common but differentiated responsibilities and respective capabilities’. At the national level, India has developed the National Action Plan on Climate Change (NAPCC), 2008, and comprising eight national missions (see Box 1 below) at its core, addressing various sectoral aspects of climate change. The NAPCC seeks to promote understanding of climate change, adaptation, mitigation, energy efficiency and natural resource conservation while pursuing overall economic growth – i.e., measures that promote development objectives which also result in co-benefits for addressing climate change.

Bihar Action Plan for Climate Change
Draft Version November 2014 XIX
Box 1: National Missions Under the NAPCC
At the same time, recognising that the impacts of climate change will vary across states, sectors, locations, and populations, and that different approaches will need to be adopted to fit specific sub-national contexts and conditions, all Indian States have been asked to prepare State Action Plans for Climate Change (SAPCCs) in line the NAPCC. It is in this context that the Bihar State Action plan (BAPCC) for Climate Change has been prepared. The Bihar Context
Available evidence shows that there is high probability of increase in the frequency and intensity of climate related natural hazards due to climate change and hence increase in potential threat due to climate change related natural disasters in India, and Bihar is no exception to this. It is highly vulnerable to hydro-meteorological natural disasters, with North Bihar in general being highly flood-prone, and South Bihar being highly drought prone. In the (relative) absence of state level climate models and/or vulnerability studies, as well low community awareness, Bihar is potentially more sensitive and vulnerable to the climate change and its impacts.
National Solar Mission (renamed as Jawaharlal Nehru National Solar Mission) aims to promote the development and use of solar energy for power generation and other uses with the ultimate objective of making solar energy competitive with fossil based energy options.
National Mission for Enhanced Energy Efficiency recommends mandating specific energy consumption decreases in large energy consuming industries. It also recommends financing for public-private participants to reduce energy consumption through demand side management programs
National Mission on Sustainable Habitat aims to promote energy efficiency as a core competent for urban planning. The plan calls for a greater emphasis on urban waste management and recycling including production of power from waste.
National Water Mission sets a goal of 20 percent improvement in water use efficiency through pricing and other measures
National Mission for Sustaining the Himalayan Ecosystem aims to conserve biodiversity, forest cover and other ecological values in the Himalayan region
National Mission for a Green India aims at Increased forest/tree cover on 5 m ha of forest/non-forest lands and improved quality of forest cover on another 5 m ha (a total of 10 m ha), improved ecosystem services including biodiversity, hydrological services, and carbon sequestration as a result of treatment of 10 m ha.
National Mission for Sustainable Agriculture aims to support climate adaptation in agriculture through the development of climate resilient crops and appropriate agricultural practices
National Mission on Strategic Knowledge for Climate Change is for gaining a better understanding of climate science, impacts and challenges. It envisions improved climate modelling and increased international collaboration to develop adaptation and mitigation technologies.

Bihar Action Plan for Climate Change
Draft Version November 2014 XIX
Bihar -- ‘Building Resilience through Development’ Bihar is on an accelerated growth and development pathway, and in recent years, it
has acquired considerable attention throughout the country and even abroad for its remarkable performance in the development front. For a state which had suffered stagnation for long and which had almost resigned to its perpetual backwardness, this was a turning point, leading to new hopes and aspirations. These changes were possible because of the state government's firm commitment to an agenda of development, which is both speedy and inclusive. To fulfil this agenda, the state government had not only utilised its limited resources most prudently, but had also strengthened its administrative machinery and introduced a number of institutional reforms. The results clearly show that the past growth process of the state's economy is not a short-term phenomenon, but the beginning of a long-term stable growth process. For the 12th Five Year Plan (FYP) period, the State has adopted the motto – “Growth with Justice.” The State’s Approach Paper for the 12th FYP targets a 13 percent constant growth rate. The state has constantly been emphasising on social, financial, and economic inclusion, and the Approach Paper indicates that this would continue. Additionally, all sectors have been asked to identify areas for inclusion and explore the possibilities of broad-streaming (broad-streaming as envisaged by the State Planning and Development Department, visualises the development of sub-streams by its broadening at par with mainstreams so they may be considered as one entity; broad-streaming tries to take into account the strength and weaknesses of the community and builds upon the existing avenues keeping in view the language, tradition, culture, practices of under-privileged communities into consideration). This may be one of the effective and feasible solutions for inclusive development. As such, in line with the motto “Growth with Justice” adopted for the Approach to the 12th FYP, this BAPCC adopts the motto “Building Resilience through Development” as the core theme that will guide implementation.
The State’s developmental and growth priorities are in synch with India’s national priorities. Likewise, the BAPCC and the priorities outlined herein are aligned to the imperatives of the NAPCC and the eight national sectoral Missions under it. A range of measures is already underway in the State that is complementary to the State’s climate resilience agenda elaborated under this BAPCC, and spans multiple sectors. Some examples of these on-going complementary initiatives are briefly outlined below: Bihar is taking appropriate measures to ensure that the existing tree-cover in the State is
maintained, apart from efforts to enhance it. This is evidenced from the recent stand taken by the State Government not to remove trees from the Zoological Park in the State Capital Patna despite the move by civil aviation authorities to do so on the grounds that tall trees in the Park were hindering flight operations at the Patna airport;
Bihar has opted to implement the Bachat Lamp Yojana (BLY) of the Bureau of Energy Efficiency (BEE), in a move to save an estimated 170MW by replacing around 64 lakh conventional bulbs in the state with compact fluorescent lamps (CFLs). The Bihar State Renewable Development Agency (BREDA) is the designated agency under BEE to implement the programme, in conjunction with the Bihar State Electricity Board (BSEB) and the Bihar Energy Regulatory Commission (BERC). In the first phase, the programme is expected to cover the areas under the Patna Electricity Supply Undertaking (PESU);
The State has also advocated an ‘entitlement based planning approach’ to streamline the development planning process and to have a wider impact on eradicating poverty and improve socio-economic conditions in the State;
The Integrated Food Processing Development Scheme of the State Government has made progress with attracting investments into the State, especially in the biscuits and edible oil manufacturing sectors, opening up the scope for sowing crops such as mustard and

Bihar Action Plan for Climate Change
Draft Version November 2014 XIX
sunflower. Recent investments under the scheme are to the tune of several hundred crores, by major private sector firms; JEEViKA - Bihar Rural Livelihoods Project (BRLP) has been designed to address rural poverty in Bihar through the collaboration of the poor, the Government of Bihar (GoB) and the World Bank. This initiated is implemented through a Society registered with GoB by the name of Bihar Rural Livelihoods Promotion Society (BRLPS). BRLPS through the BRLP aims to improve rural livelihood options and works towards social and economic empowerment of the rural poor and women. The BRLP intervenes with the community through the following four themes or programmes: institution and capacity building, social development, microfinance and livelihood. The BRLP objective is to enhance social and economic empowerment of the rural poor in Bihar. This objective is sought to be accomplished by: Improving rural livelihoods and enhancing social and economic empowerment of the
rural poor. Developing organizations of the rural poor and producers to enable them to access
and better negotiate services, credit, and assets from public and private sector agencies and financial institutions.
Investing in capacity building of public and private service providers. Playing a catalytic role in promoting development of microfinance and agribusiness
sectors. A US $ 100 million loan from the World Bank has been approved recently to expand
the initiative across all 102 blocks of six districts where it is currently in operation – Muzaffarpur, Gaya, Madhubani, Purnea, Nalanda, and Khagaria. At present, only 42 blocks of these districts are being covered. The project has also been adopted by the National Rural Livelihoods Mission (NRLP); and
ULBs in the State, including the Patna Municipal Corporation (PMC) are currently underequipped to deal with weather events such as flooding etc.; steps are being taken to rectify this. Additionally, a City Strategic Plan has been prepared for Patna and 19 other cities/towns of the State under the National Ganga River Basin Authority (NGRBA) to deal with the sewage situation and preventing the flow of sewage from flowing into the Ganges, at an estimated total budget of nearly ` 800 crores.
BAPCC Preparation Process Preparatory processes for formulating the BAPCC were taken up in early 2011, facilitated
by the United Nations Development Programme (UNDP), India, with the formulation of a State Steering Committee (SSC), headed by the Chief Secretary, and consisting of key senior bureaucrats from various sectors, and other eminent persons. A meeting of the SSC was held on 22 June 2011, wherein it was decided that the BAPCC would focus on the following key sectors: 1. Agriculture and Animal Husbandry; 2. Forests and Biodiversity; 3. Water Resources and Disaster Management; 4. Urban Development and Transport; 5. Industries and Mining; 6. Energy; and 7. Human Health Working Groups were then constituted for each of the focus sectors, and these were then tasked with developing initial strategy papers for the BAPCC for their respective sectors. The State Environment and Forest Department was nominated the nodal Department for coordinating inputs to and formulating the Draft BAPCC.

Bihar Action Plan for Climate Change
Draft Version November 2014 XIX
A two-day workshop on preparation of BAPCC was organized by the Environment & Forest Department, GoB and facilitated by UNDP India, on 11-12 November 2011 at Hotel Maurya, Patna. The Workshop was organised to discuss the issues associated with impact of climate change and to formulate an understanding of the Framework for preparation of the BAPCC.
The Hon’ble Deputy Chief Minister-cum-Minister, Department of Environment & Forest, Bihar, Shri Sushil Kumar Modi inaugurated the occasion. Dr. R. K. Pachauri, Director
General, The Energy and Resources Institute, New Delhi was the chief guest. Principal Secretary, Planning & Development, Sh. Vijoy Prakash; Principal Secretary, Mines & Geology, Sh. Shubh Kirti Majumdar; Principal Chief Conservator of Forests, Bihar, Sh. Basheer Ahmed Khan; Additional Principal Chief Conservator of Forests-cum-Chief Wildlife Warden, Bihar, Dr. D K Shukla and Prof. Pradhan Parth Sarthi, Central University of Bihar officers and distinguished experts of departments concerned with identified sectors were present in the workshop. Attended by over 150 representatives various departments/organizations and about 20 resource persons, the workshop centred around the following themes relevant to preparation of the BAPCC: Frame work for preparation of SAPCC, Climate Change: Projections and Scenario for Bihar, Vulnerability and adaptation to climate change in:
o Transport Sector; o Urban Sector; o Agriculture Sector; o Water resources Sector; o Energy Sector;

Bihar Action Plan for Climate Change
Draft Version November 2014 XIX
o Forestry Sector; o Industries and Mining Sector; o Health Sector; and o Disaster Management Sector. In mid-May 2012, UNDP India appointed a Consultant to work closely with the State
Environment & Forest Department to help develop this Draft BAPCC document. The Consultant undertook a series of consultative meetings with various line Departments in Patna from 9 June – 12 July 2012 to collect additional information and perspectives, and a first Draft of the BAPCC was developed by 30th July 2012. A timeline of processes undertaken in the BAPCC formulation process is given below:
Timeline of BAPCC formulation Process/Activities
Month/Dates Process/Activity
Early 2011 Formation of State Steering Committee
22 June 2011 Meeting of key State and Departmental personnel; discussion on formulation of Working Groups
11-12 November 2011 Consultative Workshop in Patna
9 June – 12 July 2012 Consultations in Patna with various line departments
30 July 2012 Draft BAPCC developed

1
Part A: General and Climate Profile- Introduction

2
1 State Profile 1.1 Location and Physiography
Bihar is located between 24°20'10" and 27°31'15"N latitude and 82°19'50” and 88°17'40"E longitude in the eastern part of the country and situated at about 52.73 m height above sea level. It is an entirely land locked state and is surrounded by West Bengal in the east, Uttar Pradesh in the West and the State of Jharkhand in the South. In the North, Bihar shares its boundary with Nepal. Humid West Bengal in the east and the sub humid Uttar Pradesh in the West provides it with a transitional position in respect of climate, economy, and culture.
Figure 1: Bihar – location and districts
Table 1: Bihar - administrative divisions
Details 2001 2011
No. of Divisions 9 9 No. of Districts 37 38
No. of Sub-Districts 101 101 No. of Towns 130 199 No. of Villages 45,098 44,875
Percentage of urban population 10.46 11.30
The Bihar plain is divided into two unequal halves by the River Ganga, which flows through the middle from West to East. Close to 88 percent of the population lives in villages. Bihar state is 12th largest in terms of geographical size (94,163 sq. km) and 3rd largest by

3
population, 10.38 crores as per Census 2011, in the country. It is also known for its abundant natural resources, perennial rivers, fertile lands, and a long glorious history. After the division the state in 2000, Bihar retained almost 75 percent of the population, while it is left with only 54 percent of the land, thus inducing a lot of strain on the available resources. Bihar lies in the tropical to sub tropical region. Rainfall here is the most significant factor in determining the nature of vegetation. Bihar has a monsoon climate with an average annual rainfall of 1200 mm. The sub-Himalayan foothills of Someshwar and Dun ranges in Champaran constitute another belt of moist deciduous forests. These also consist of scrub, grass, and reeds. Here the rainfall is above 1,600 mm and thus promotes luxuriant Sal forests in the favoured areas. The hot and dry summer gives the deciduous forests. The most important trees are Shorea
Robusta (Sal), Shisham, Cedrela Toona, Khair, and Semal. This type of forests also occurs in Saharasa and Purnia districts. The topography of Bihar can be easily described as a fertile alluvial plain occupying the Gangetic Valley. The plain extends from the foothills of the Himalayas in the north to a few miles south of the river Ganges as it flows through the State from the west to the east. Rich farmland and lush orchards extend throughout the state. The major crops are paddy, wheat, lentils, sugarcane, and jute (hemp, related to the marijuana plant, but a source of tough fibres for gunny bags). Also, cane grows wild in the marshes of West Champaran. The principal fruits are mangoes, banana, jackfruit, and litchis. The State is broadly divided into three agro-climatic zones as given below:
Table 2: Agro-climatic zones in Bihar
Agro climatic Zone
Districts Area (,000 ha)
Average rainfall Soil and Topography Crops
Zone -I North West Alluvial Plains
Bettiah, Motihari, Gopalganj, Siwan, Vaishali, Seohar, Muzaffarpur, Samastipur, Sitamarhi, Madhubani, Darbhanga, West & East Champaran
Net Cultivated – 2281; Gross Cultivated -- 3260
1234.7 Medium acidic, heavy textured, sandy loam to clayed, flood prone. (Large area remains under water called Chaur, Maun & Tal lands)
Rice, Wheat, Maize, Arhar; Horticultural crops including Litchi, Mango, Makhana, Water Chestnut.
Zone - II North East Alluvial Plains
Purnea, Katihar, Saharsa, Madhepura, Araria, Kishanganj, Supaul, Khagaria, Begusarai
Net Cultivated – 1147; Gross cultivated -- 1677
1382.2 Light to medium textured, slightly acidic, sandy to silty loam (large area comprise of Tal and Diara lands)
Maize, Mustard, Jute, Sugarcane; Horticultural crops include Mango, Bel, Banana, Papaya, Cucurbit, Chilly, Turmeric, Potato
Zone - III South Bihar Alluvial Plains
3(a) Bhagalpur, Sheikhpura, Lakhisarai, Jamui, Munger, Banka 3(b) Bhabua, Rohtas, Aurangabad, Buxar, Jahanabad, Gaya, Nalanda, Nawada, Patna
Net Cultivated – 241; Gross cultivated -- 3408
1102.1 Old alluvium to sandy loam.
Rice, Gram, Wheat; Horticultural crops include Mango, Guava, Banana, Bel, Jackfruit, Onion, Potato, Chillies, Marigold

4
Figure 2: Map depicting Bihar’s agro-climatic zones
1.2 Demographic and Human Development Profile According to the 2011 census, the population of the state of Bihar is 103,804,637
persons, consisting of 52.2 percent males and 47.8 percent females. The average population of a district of the state is 2,731,701. The population of the state is predominantly rural, with 89 percent of the population residing in rural areas. Patna (5772804) and Sheikhpura (634927) are most populated and least populated districts of the state. Some of the important economic and development indicators of Bihar are given below: Table 3: Economic and human development indicators Indicators Bihar India
Demographic Indicators 2011 2011 1 Total Population (In Millions) 104 1210
2 % Contribution to national population 8.58 100
3 Sex Ratio (females per 1000 males) 916 940
4 Under 6 sex ratio (females per 1000 males) 933 914
Economic Indicators 2009-10 2009-10
5 Net domestic Product (at factor cost) (Rs crores) (For state) 110778 4493743
Gross Domestic Product (at factor cost) (Rs crores) (For India)
6 Contribution of Agriculture to NSDP/GDP (%) 21.30 14.62
7 Contribution of Industry to NSDP/GDP (%) 4.63 20.16
8 Contribution of Services to NSDP/GDP (%) 74.07 65.22
9 Per Capita Net State Domestic Product (factor cost) (Rs) (for State) 11558 33731
Per Capita Net National Product (factor cost) (Rs) (For India)
10 NDP Growth rate (%) (for State) 9.56 8
GDP Growth Rate (%) (For India)
Human Development Indicators 2007-08 2007-08
11 Human Development Index Value (HDI) 0.367 0.467
12 HDI Rank (out of 23) 21
2006 2006
13 Gender Related Development Index (GDI) 0.479 0.590

5
Indicators Bihar India
14 GDI Rank (out of 35) 35 122
15 Gender Empowerment Measure (GEM) 0.379 0.497
16 GEM Rank (out of 35) 31
Human Development Indicators 2011 2011*
17 Inequality Adjusted Human Development Index Value (IHDI) 0.303 0.343
18 Inequality Adjusted Human Development Index Rank (out of 19) 16
19 Loss in HDI due to Inequalities (%) 32.06 32
20 Literacy Rate (%) 63.82 74.04
21 Male Literacy Rate (%) 73.39 82.14
22 Female Literacy Rate (%) 53.33 65.46
Poverty and Hunger Indicators 2009-10 2009-10
23 Poverty Headcount Ratio (%) 53.5 29.8
24 Total number of poor (in millions) 54.35 354.68
2005 2005
25 Multidimensional Poverty Index (MPI) 0.479 0.283
26 Multidimensional Poverty Headcount (%) 79.3 53.7
27 Number of Multidimensional Poor (in millions) 72.3 612
2007 2007
28 Global Hunger Index (GHI) 27.3 23.3
29 GHI Rank (out of 17) 15
2005-06 2005-06
30 Prevalence of calorie undernourishment (%) 17.3 20
31 Prevalence of Underweight Children under 5 years of age (%) 56.1 42.5
* Values differ from India IHDI in Global HDR 2011 due to different data sources.
Source for indicators 1-4, 20-22 -- Census of India 2011, Provisional Tables, Registrar General of India (http://www.censusindia.gov.in/2011-prov-results/prov_results_paper1_india.html); for 5-10 -- RBI Handbook of Statistics on Indian Economy and Economic Survey of India 2010-11 (http://www.rbi.org.in/scripts/AnnualPublications.aspx?head=Handbook%20of%20Statistics%20 on%20Indian%20Economy); for 11-12 -- India Human Development Report 2011, IAMR and Planning Commission; for 13-16 -- Gendering Human Development Indices: Gendering Human Development Indices: Recasting the Gender Development Index and Gender Empowerment Measure for India, Ministry of Women and Child Development, GOI (http://undp.org.in/sites/default/files/GDI_and_GEM_Report.pdf); for 17-19 -- Inequality Adjusted Human Development Index for India’s States 2011, UNDP (www.undp.org.in/sites/default/files/reports_publication/IHDI_India.pdf0 ; for 23-24 -- Tendulkar Committee Report 2009, Planning Commission (http://planningcommission.gov.in/reports/genrep/rep_pov.pdf); for 25-27 -- MPI data and updates for 2011, OPHI (http://www.ophi.org.uk/policy/multidimensional-poverty-index/mpi-data-methodology); for 28-31 -- India State Hunger Index 2009, IFPRI (http://www.ifpri.org/publication/comparisons-hunger-across-states-india-state-hunger-index)
According to Census 2011 Bihar has recorded 25.07 percent decadal population growth. The district with highest decadal growth is Madhepura (30.65) and the district with lowest decadal growth is Gopalganj (18.83). The urban decadal growth rate (35.11) is higher when compared to rural growth rate (23.9). From the data, it could be seen that decadal growth rate of urban females (37.07) is more than urban males (33.4), whereas the decadal growth rate of rural females (23.43) is lower than rural males (24.33). This could be a pointer towards increased acceptance of girl child (reduced female foeticide/infanticide) and women empowerment in urban areas. The household size in the state of Bihar roughly stands at six members per household. The number of members per household in rural areas is about six, whereas in urban areas it is about 6.5. As per 2011 Census, the number of literates in Bihar is 54,390,254 taking the state’s literacy rate to 63.82 percent. Out of these male literates are 73.4 percent and female literates are 53.3 percent. The urban literacy rate stands at 78.75 percent (male 84.42 percent and female 72.36 percent) compared to rural literacy rate of 61.83 percent (male 71.9 percent and female 50.82 percent).

6
1.3 Economy The recent data on state income shows that the economy of Bihar has been showing a
steady growth trend for the last 6 years. During the first 5 years after separation of Jharkhand in 2000, the economy had grown at an annual rate of 4.42 percent at constant prices. The already stagnating economy of Bihar had become even more crippled after the bifurcation, thanks to the asymmetric distribution of resources between Jharkhand and present Bihar. However, the economy witnessed a turnaround due to policies pursued by the present state government and, as a result, the economy grew at an annual rate of 11.36 percent during the period 2004-05 to 2010-11. This has been made possible by the fact that the investment pattern showed a massive upsurge. From a small average annual plan size of around ` 1200 crores during the 10th Plan (2002-2007), the annual plan size climbed to more than ` 15,000 crores during the 11th Plan period (2007-2012). The investment portfolio also changed and there was a massive stress on infrastructural development and social delivery system. Bihar faces complex economic development challenges. With an estimated population of 103.8 million in 2011, Bihar is a densely populated region, with no less than 1102 persons living per sq. km. of its area. As per the Planning Commission figures, in 2004-05, 41.4 percent of the population lived below poverty line in Bihar. As nine out of ten people on the average live in the villages, poverty is more visible in rural areas. With the bifurcation of the state in November 2000, the newly created Jharkhand state inherited the mineral rich and forest rich parts of the state and present Bihar was left with its largely agro-based economy. However, Bihar is a part of the Gangetic plains and hence has rich soil and possesses abundant water resources, and with optimal use of its abundant agricultural resources, it is possible to enhance growth of the economy and the pace of growth of Bihar's economy in last 6 years is a vindication of such a possibility. The share of the primary sector in the gross state domestic product (GSDP) has been declining on a continuous basis. The government is trying to stress investment in the manufacturing and infrastructure sector so that the decline in the primary sector's contribution is accompanied by productivity gains in the secondary and tertiary sector. Nevertheless, the state cannot progress without a satisfactory growth of its agricultural sector. Agriculture would continue to play an integral part of the development process, as around 90 percent of the population still live in villages and they would continue to depend on agriculture as a prime source of their livelihood. The growth rate of Bihar's economy has not been uniform over the last decade. During the first five years since 1999-00, the economy had grown at an anneal rate of only 4.42 (see Table 5 below). The economy then witnessed a turnaround and it grew at an annual rate of 11.36 percent during the period 2004-05 to 2010-11. It can be noted that the growth rate achieved during 2004-05 to 2010-11 has been one of the highest among all the Indian states. The table also shows that during the period 2004-05 to 2010-11, the sectors reporting a growth rate of more than 15 percent are — registered manufacturing (23.30 percent), construction (19.61 percent), communications (27.23 percent) and trade, hotels and restaurant (20.22 percent). During the period 1999-00 to 2004-05, the major contributors to the growth process were — construction (12.17 percent), communication (11.02 percent) and trade, hotel and restaurant (12.25 percent). In other words, the registered manufacturing has emerged as a new leading sector of growth during 2004-05 to 2010-11. It can also be noted from the table that, except for forestry and fishing both of which are rather small in size, all the sectors of Bihar economy had registered a higher growth rate during the later five years.

7
Table 4: Compound Annual Growth Rate (CAGR) of GSDP1
No. Sector
Annual Growth Rate
1999-00 to 2004-05 2004-05 to 2010-11
Current Prices Constant 1999-00 Prices
Current Prices
Constant 2004-05 Prices
1 Agriculture/Animal Husbandry 4.00 2.40 13.95 3.73
2 Forestry / Logging 7.91 3.96 4.36 -2.00
3 Fishing 10.92 10.18 16.46 1.79
4 Mining/Quarrying -20.53 -19.13 16.12 13.80
Sub-Total (Primary) 4.42 2.71 13.17 3.08
5 Manufacturing 3.31 -0.41 16.19 9.74
5.1 Registered -0.91 -6.53 31.30 23.30
5.2 Un-registered 4.89 1.80 11.76 5.71
6 Construction 14.75 12.17 27.95 19.61
7 Electricity/Water Supply/Gas 5.12 -3.01 5.60 7.57
Sub-Total (Secondary) 7.42 3.82 22.09 15.04
8 Transport/Storage/Communication 2.56 2.63 15.39 14.68
8.1 Railways -1.50 -2.69 12.79 7.86
8.2 Other Transport 5.90 3.10
17.88 9.30
8.3 Storage 14.50 7.11
8.4 Communication 4.11 11.02 13.90 27.23
9 Trade/Hotel/Restaurant 15.93 12.25 29.68 20.22
Sub-Total (8 and 9) 12.16 9.41 27.02 19.03
10 Banking/Insurance 10.08 5.23 16.42 16.00
11 Real Estate/Ownership of Dwelling/Business Services 12.44 4.59 18.15 9.68
Sub-Total (10 and 11) 11.35 4.88 17.52 12.38
12 Public Administration 6.36 2.80 17.27 9.14
13 Other Services 4.22 1.47 13.89 5.38
Sub-Total (Tertiary) 9.11 5.70 21.81 14.17
Total GSDP 7.32 4.42 19.45 11.36
Per Capita GSDP 5.08 2.24 17.63 9.67
In 2009-10, the Net State Domestic Product (NSDP) of Bihar was US$ 32.5 billion.
The average NSDP growth rate between 2004-05 and 2009-10 was about 16.2 percent. Bihar’s per capita NSDP increased from US$ 172.6 in 2004-05 to US$ 340 in 2009-10. A robust secondary and tertiary sector has helped Bihar to increase its average per capita NSDP by around 14.5 percent between 2004-05 and 2009-10. 1 Source: Bihar Economic Survey 2011-12, Finance Department, GoB, February 2012

8
Figure 3: Bihar’s NSDP and per capita NSDP
While Bihar’s per capita income at current prices remains relatively low, the impact of the strong growth process in the state is reflected when one compares it with the all-India average. In 2006-07, the Per Capita Income in Bihar (` 10,055) was 32.2 percent of the all-India average (` 31,198); but in 2009-10, this ratio had increased to 34.7 percent (` 16,119 for Bihar and ` 46,492 for India) compared to the all India average of 46492 in 2009-102. However, as is the case with most states in India, these figures mask regional disparities within the State. The latest available estimates for Per Capita GDDP (Gross District Domestic Product) relate to 2007-08 and those estimates show that Patna (` 47,293), Munger (` 13,689), and Begusarai (` 11,959) are the most prosperous districts of Bihar. On the other end of the ranking, the most economically backward districts are Seohar (` 5021), Sitamarhi (` 5479), and East Champaran (` 5575). Even if Patna is excluded since it has the State capital, the per capita income of Munger is about 3 times that of Seohar. Analyses of consumption levels of petroleum products (petrol, diesel, coal and cooking gas) show that Patna happens to be most prosperous one according to all the four indicators. Other districts, which fall among the top 3 districts with respect to at least one indicator, are — Munger, Rohtas and Bhojpur in south Bihar, and Begusarai, Muzaffarpur, Vaishali in north Bihar. The most backward districts in terms of at least on of the above four indicators are — East Champaran, Sitamarhi, Seohar, Madhubani, Nawada, Supaul, Vaishali, Darbhanga, Samastipur and Araria. It may be noted here that, except Nawada, all of these 10 districts are in north Bihar.
Table 5: Relatively prosperous and backward districts of Bihar3
Criteria Top 3 Districts Bottom 3 Districts
Per Capita NDDP Patna, Munger, Begusarai E. Champaran, Sitamarhi, Seohar Consumption of Petrol Patna, Muzaffarpur, Vaishali Madhubani, Sitamarhi, Nawada
Consumption of Diesel Patna, Begusarai, Rohtas Madhubani, Sitamarhi, Supaul
Consumption of BIT Patna, Muzaffarpur, Rohtas Vaishali, Darbhanga, Samastipur
Consumption of LPG Patna, Munger, Bhojpur Supaul, E. Champaran, Araria
2 Source: Central Statistical organization, New Delhi 3 Source: Bihar Economic Survey 2011-12, Finance Department, GoB, February 2012

9
The State targets under the 12th FYP are to achieve annual growth rates of 7 percent in the primary sectors, 16.30 percent in the secondary sectors, and 13.89 percent in the tertiary sectors, with an overall aggregated constant growth rate of 13 percent for the State’s economy4. 1.4 Focus Sectors
Detailed descriptions of the Focus Sectors under the BAPCC are given in Section B. 1.4.1 Agriculture and Allied Sectors
Bihar state is located in the Indo-Gangetic plains in central-north India, and its naturally fertile soil is one of the key assets of the State, and conducive to agriculture However, agriculture and its allied sectors in Bihar are beset by many challenges, and climate change and its impacts are only likely to deepen these challenges. The overall strategy of therefore under the BAPCC is therefore to transform agriculture and its allied sectors into climate resilient and vibrant production system, while developing their full potential and ensuring sustained food and nutritional security in the State. 1.4.2 Forests and Biodiversity
Forests have a critical role to play as carbon sinks, and are thus vital to climate mitigation. It also recognises that forests are essential for maintaining favourable and stable conditions needed for sustained agricultural productivity by playing roles in maintaining soil fertility, structure, and water holding capacity. Forests are also vital for maintaining the hydrological cycle and regulating water flows and sub-soil water regimes, recharging the aquifers and maintaining the flow of water in rivers and rivulets and that forested watersheds have better availability as well as quality of water than watersheds under alternative land uses. Forests also provide a range of provisioning services, particularly fuel wood, fodder, small timber, NTFP and medicinal plants, and artisanal raw material like cane and bamboo, that are crucial to livelihood security of forest dependant communities. As such, the emphasis of the forests and biodiversity sectors under the BAPCC will be to improve forest and biodiversity management practices through multiple strategies and initiatives in the State to minimise the impacts of climate change and for the overall well being of the State and its people. It aims to address climate change though enhancing carbon sinks in sustainably managed forests and other ecosystems, enhancing the resilience and ability of vulnerable species/ecosystems to adapt to the changing climate; and enabling adaptation of forest dependant local communities in the face of climatic variability. 1.4.3 Water Resources
Water is critical for all aspects of life on earth, and all human activity is dependant on this critical resource. While Bihar has abundant water resources, the spatially and temporal distribution of this valuable resource is uneven across the state; the water resources sector poses challenges and complexities at multiple levels for the State. Increased water use by all categories of water users and increased demand due to economic and population growth are compounded by further stress by the increased pollution of existing water resources, which not only restricts potential uses of available water but also threatens future use. There is also a high degree of dependence on groundwater in the State, and this can have serious consequences in the future. The BAPCC recognises the critical importance of water resources to the State and need to safeguard these through a comprehensive multi-pronged response process. 1.4.4 Disaster Management
Bihar is prone to multiple and frequent disasters of various categories, predominantly floods and droughts. The Department of Disaster management is committed for the cause of 4 Presentation on 12th FYP and Annual Plan 2012-13, GoB, 27 June 2012. Available on the Planning Commission of India’s
website.

10
disaster resilient state. Climate change is making extreme climate events more frequent and the incidences of landslide, flash flood, and drought are on the rise. In the long run this is sure to adversely affect virtually all sectors of the State’s economy. As a response, the State has already prepared a comprehensive Draft State Disaster Management Plan, and the strategies outlined in the BAPCC will be complementary to those in the Plan. 1.4.5 Urban Development
Although Bihar is relatively less urbanised than most other states in India, its percentage decadal growth of urban population at 35.11 is higher than the 31.80 for the country as a whole (and higher than as many as eighteen states/UTs). Bihar’s urban infrastructure faces a serious deficit, and the rapid urban growth is putting immense pressure on the urban infrastructure and services resulting in degradation of the urban environment and of natural resources. The State recognises that climate change and related extreme weather vents can critically impact Bihar’s urban agglomerations, and as such, is committed to taking all necessary measures to mitigate this, through actions outlined herein under the BAPCC. 1.4.7 Transport
The rapid growth of vehicles numbers in the State has been accompanied by concomitant problems including congestion and traffic snarls, lack of adequate parking spaces, high accident rates, environmental vehicular pollution rise, and inadequacy of road space for efficient public transportation. The Transport Department has to not only cater to the public transportation needs of the State’s population in general and also especially but also the growing demands of urban agglomerations. 1.4.8 Energy
Bihar has adopted a blend of thermal and hydel sources. Bihar currently has only 493 MW of installed capacity for power, with thermal plants accounting for nearly 89 percent of the total installed power generation capacity, with the remaining 11 percent being contributed by the hydel plants. Of late, emphasis is also being laid on the development of non-conventional energy sources, i.e., solar, wind and biomass energy. Even though Bihar has a very lowest annual per capita consumption of electricity, considering the limited generation in the State, there is an acute shortage of power not only for peak demand, but even the base demand in the state. The CEA has anticipated nearly 65 percent deficit in peak demand in 2012. This scenario, while dismal from the standpoint of energy availability, also represents significant opportunities for holistic and planned approaches to the energy sector, including integration of various climate concerns. 1.4.9 Industries and Mining
Bihar today (after the separation of Jharkhand) has virtually no large industries, and most industrial activity is in the medium, small, and cottage sectors. Nevertheless, Bihar is proactively promoting the state as an attractive investment destination, and with initiatives such as the Industrial Incentive Policy 2011, industrial growth is likely mushroom across a range of sectors in the coming years. This represents an opportunity for the State to take cognisance of climate change and its impacts on industry, as well plan a range of adaptation and mitigation interventions. 1.4.10 Human Health
While the status of health services in Bihar is still inadequate, substantial improvements have been recorded in this sector in recent years owing to increase in expenditure for health services on one hand and better monitoring of the health services on the other. Health indicators for the state have also shown significant improvement more recently. The State has developed a Health Sector roadmap, and has planned substantial investments in

11
the sector under the 12th FYP. However, climate change and its impacts pose a set of additional risks, and could potentially impact the State’s well-laid plans.

12
2 Climate Profile of the State 2.1 Introduction
Bihar is situated at the eastern part of the country which lies midway between the humid West Bengal, in the east and the sub humid Uttar Pradesh, in the west. It is bounded by country Nepal in the north and by the state of Jharkhand in the South. The Bihar plain is divided into two unequal halves by the river Ganga which flows through almost in the middle from west to east. Bihar occupies geographical area of 94,163 sq. km and is extended for 483 km from east to west and 345 km from north to south. Geologically, Bihar represents the northern front of Indian sub- continent. The geographical and geological feature of Bihar includes the belt of Himalayan foothills in the northern fringe of Paschim Champaran, the vast Ganga Plains, the Vindhyan (Kaimur) Plateau extending into Rohtas region and the small Gondwana basin outliers in Banka district. Nearly two third of Bihar is under cover of the Ganga basin composed of alluvium and masks the nature of basement rocks. The state has a tropical monsoon climate with three distinct seasons-winters, summer and rainy. The state can be divided into two climate zones; the Sub-Himalayan and the Ganga plain. The winter season exists from December to February, January being the coldest month when temperature falls below 10°C. The winter season is characterized by fog, cold wave and western disturbances. Winter rainfall is received by western disturbances in the state. The summer season covers the period from April to June, May is the hottest month in the greater part of the area and the maximum temperature some time reaches above 45°C and causes the heat waves of the state. The monsoon season normally starts in the third week of June and lasts up to end of September and downpour accumulated seasonal rainfall of 120-150 cm throughout the state. The rainfall is also triggered by monsoon depression which formed in Bay of Bengal, entered in Bihar and produced wide spread rainfall. During monsoon season, the state experienced flood and drought in almost every year and affect the water resources and agriculture of Bihar.
Rainfall and temperature are two main climatic variables which affect agriculture, water, forest, health and other sectors; therefore it is necessary to understand its observed and future projected scenarios in Bihar. 2.2. Climate Change Scenarios
The observed rainfall and surface temperature (resolution of 10x10) for the period of 1961-2000 of India Meteorological Department (IMD) is used. High resolution (0.5 x 0.5) station observation-based National Centre for Environmental Prediction (NCEP) data of global land surface temperatures is also been used during period of 1948 to near present. For future climate projection, Climate Model Intercomparision Project Phase 5 (CMIP5) data is used. The Representative Concentration Pathways (RCPs) 2.6 4.5, 6.0 and 8.5 experiments (Fujino et al., 2006; Smith and Wigley, 2006; Clarke et al., 2007; Riahi et al., 2007; van Vuuren et al., 2007; Hijioka et al., 2008; Wise et al., 2009; Masui et al., 2011; Riahi et al., 2011; Thomson et al., 2011; van Vuuren et al., 2011b). ) is considered for future time periods while the Historical experiment is for past time periods. In the Historical experiment in CMIP5, models are integrated from 1850 to 2012 with external forcing changing with time. The external forcing includes GHGs, the solar constant, volcanic activity, ozone and aerosols. The forcing data for 1850-2005 is taken from observation. The details of RCPs experiments are discussed by many researchers (The RCP experiment of 4.5 represents radiative forcing of 4.5Watt /m2 by 2100 respectively. In RCPs simulation, no volcanic forcing is included. The GHGs, solar constant, ozone and aerosol are all changing with time. The simulated ISMR in RCPs experiment is considered for the period of 2006-2050. Here, Future change in annual surface temperature (0C) and percentage change in JJA rainfall (mm/day) in Representative

13
Concentration Pathways (RCP) 4.5 experiment are analysed for the period of 2006-2050 with respect to Historical experiment for the period of 1961-2005 in CESM1(CAM5) model. 2.2.2.1 Observed temperature
Figure.4a-b Decadal change in minimum surface temperature in December-January during (a) 1981 to 1990 minus 1971 to 1980 (1981/90-1971/80) and (b) 1991 to 2000 minus 1981 to 1990 (1991/00-1981/90) (Source: Centre for Environmental Sciences, Central University of Bihar, Patna)
(a) (b)
Figgure. 5a-b Decadal change in maximum surface temperature in April-May during (a) 1981 to 1990 minus 1971 to 1980 (1981/90-1971/80) and (b) 1991 to 2000 minus 1981 to 1990 (1991/00-1981/90) (Source: Centre for Environmental Sciences, Central University of Bihar, Patna)
(b) (a)

14
In decades of 1981/90-1971/80 and 1991/2000-1981/90, the change in minimum surface temperature in December and January is found of 0.60C to 1.50C. In the same decades, change in maximum surface temperature in April and May is found -20C to -10C. The annual temperature shows changes of -1.10C to -0.40C. Therefore, minimum surface temperature shows warming and maximum surface temperature and annual temperature show cooling over Bihar.
Figgure.6a-b Decadal change in annual surface temperature in April-May during (a) 1981 to 1990 minus 1971 to 1980 (1981/90-1971/80) and (b) 1991 to 2000 minus 1981 to 1990 (1991/00-1981/90) (Source: Centre for Environmental Sciences, Central University of Bihar, Patna)
(a) (b)
(a)
(b)

15
There is not significant change in annual mean temperature and surface maximum temperature in April and May during 1971-2000. The change of 0.10C in minimum surface temperature is observed in the month of December during 1971-2000. 2.2.2.2 Observed Rainfall
T (0
C)
(c)
Figure.7a-c Yearly variation of (a) Tmax (0C) April (blue) and May (red)), (b) Tmin (0C) Dec (blue) and Jan (red)), and (c) T (0C) for the period of 1971-2000 (Source: Centre for Environmental Sciences,Central University of Bihar, Patna)
Figure.8 Yearly departure of JJAS rainfall (cm) over Bihar (Source: Centre for Environmental Sciences, Central University of Bihar, Patna)

16
The yearly departure of JJAS rainfall (cm) for the period of 1871-2012 does not show remarkable change in rainfall. During 2001-2012, the JJAS rainfall is below average in number of times except is two three years. In decades of 1971/80-1961/70 and 1981/90-1971/80, the positive change of 0.5 to 3 cm in JJA rainfall is observed in Bihar, but significant decrease of 0.5 to 3 cm is seen during decades of 1991/2000-1981/90. 2.2.2.3 Projected temperature
Figure.9a-c Decadal change in JJA rainfall (cm) during (a) 1971 to 1980 minus 1961-1970 (1971/80-1961/70), (b) 1981 to 1990 minus 1971 to 1980 (1981/90-1971/80) and (c) 1991 to 2000 minus 1981 to 1990 (1991/00-1981/90) (Source: Centre for Environmental Sciences, Central University of Bihar, Patna)
(a) (b)
(c)
(b) (a)
Figure . 10a-b Future projected change in annual temperature (0C) during 2011-2040 with respect to 1961-1990 in simulation of (a) CESM1-CAM5-RCP8.5, (b) BCCSM1.1M-RCP8.5 (Source: Centre for Environmental Sciences, Central University of Bihar, Patna)

17
Figure. 11a-b Future projected change in maximum surface temperature (0C) during 2011-2040 with respect to 1961-1990 in simulation of (a) GISS-E2-H-rcp4.5, (b) GISS-E2-H-CC-RCP8.5 (Source: Centre for Environmental Sciences, Central University of Bihar, Patna)
(a) (b)
(a) (b)
(c) (d)
Figure. 12a-d Future projected change in minimum surface temperature (0C) during 2011-2040 with respect to 1961-1990 in simulation of (a) GFDL-CM3-RCP4.5 (b) GFDL-CM3-8.5, (c) MRI-CGCM3-RCP8.5, (d) MRI-esm1-RCP8.5 (Source: Centre for Environmental Sciences, Central University of Bihar, Patna)

18
The 5-10% change (surplus or deficit) in mean JJA rainfall (cm) is noticed over different pockets Bihar in RCPs of 4.5 and 8.5 scenarios. It seems that South bihar shows deficient while North Bihar shows surplus of rainfall.
Figure. 18a-d Future projected change in JJA rainfall (cm) during 2011-2040 with respect to 1961-1990 in simulation of (a) CCSM-RCP4.5, (b) CCSM-recp8.5, (c) CESM1-CAM5-rcp4.5 and (d) CESM1-CAM5-rcp8.5 (Source: Centre for Environmental Sciences, Central University of Bihar, Patna)
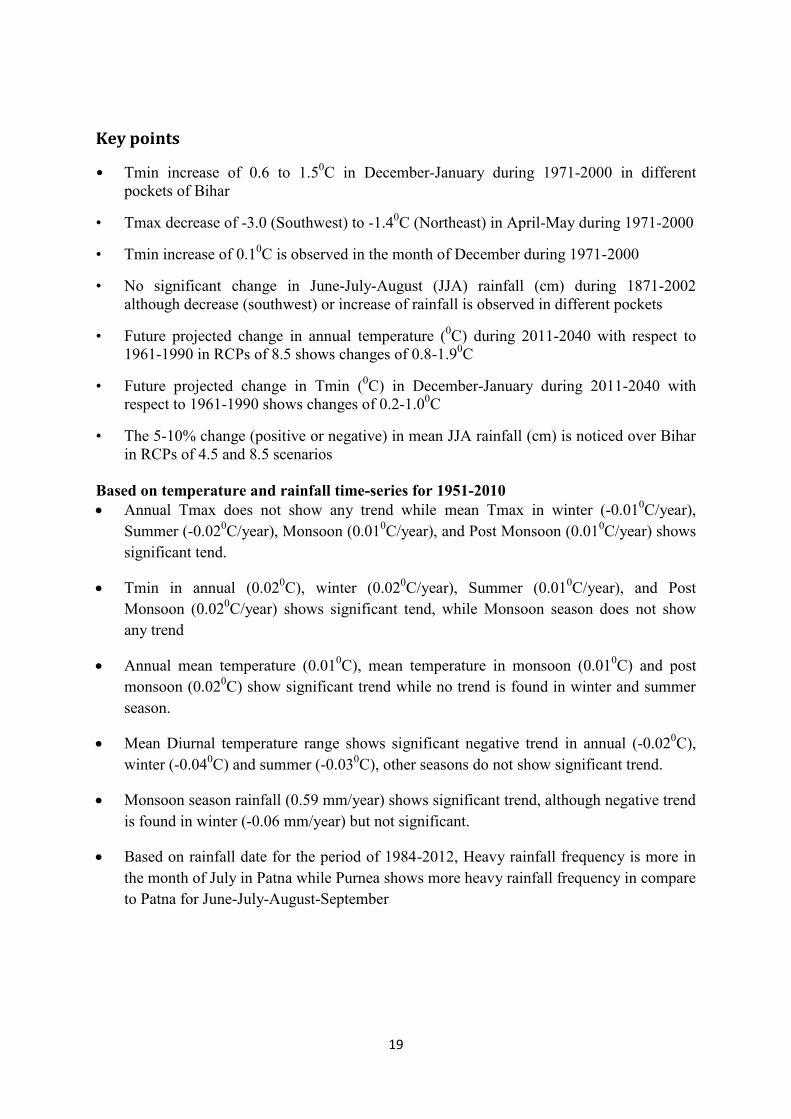
19
Key points
• Tmin increase of 0.6 to 1.50C in December-January during 1971-2000 in different pockets of Bihar
• Tmax decrease of -3.0 (Southwest) to -1.40C (Northeast) in April-May during 1971-2000
• Tmin increase of 0.10C is observed in the month of December during 1971-2000
• No significant change in June-July-August (JJA) rainfall (cm) during 1871-2002 although decrease (southwest) or increase of rainfall is observed in different pockets
• Future projected change in annual temperature (0C) during 2011-2040 with respect to 1961-1990 in RCPs of 8.5 shows changes of 0.8-1.90C
• Future projected change in Tmin (0C) in December-January during 2011-2040 with respect to 1961-1990 shows changes of 0.2-1.00C
• The 5-10% change (positive or negative) in mean JJA rainfall (cm) is noticed over Bihar in RCPs of 4.5 and 8.5 scenarios
Based on temperature and rainfall time-series for 1951-2010 Annual Tmax does not show any trend while mean Tmax in winter (-0.010C/year),
Summer (-0.020C/year), Monsoon (0.010C/year), and Post Monsoon (0.010C/year) shows significant tend.
Tmin in annual (0.020C), winter (0.020C/year), Summer (0.010C/year), and Post Monsoon (0.020C/year) shows significant tend, while Monsoon season does not show any trend
Annual mean temperature (0.010C), mean temperature in monsoon (0.010C) and post monsoon (0.020C) show significant trend while no trend is found in winter and summer season.
Mean Diurnal temperature range shows significant negative trend in annual (-0.020C), winter (-0.040C) and summer (-0.030C), other seasons do not show significant trend.
Monsoon season rainfall (0.59 mm/year) shows significant trend, although negative trend is found in winter (-0.06 mm/year) but not significant.
Based on rainfall date for the period of 1984-2012, Heavy rainfall frequency is more in the month of July in Patna while Purnea shows more heavy rainfall frequency in compare to Patna for June-July-August-September

20
2.3 Other Findings
District-level mapping of climate sensitivity index (CSI) for India (a) based on observed climate data (1961–1990) and (b) based on results from the HadRM2 model. The districts are ranked and presented as quintiles. The same quintile breaks used in (a) were used in (b) to demonstrate absolute changes in climate sensitivity. (Source: TERI, New Delhi)
The above figures show analyses based on a Climate Sensitivity Index that measures dryness and monsoon dependence. The figures above clearly show medium to high observed sensitivity to climate change in southern Bihar, while northern Bihar show low to medium sensitivity. Likewise, the resulting climate vulnerability map represents current vulnerability to future climate change across districts. The map depicts the range of relative climate vulnerability at the district level in India. It is important to note that the districts with the highest (or lowest) climate sensitivity under the scenario of climate change used here are not necessarily the most (or least) vulnerable. For example, most districts in southern Bihar have only medium sensitivity to climate change, yet are still highly vulnerable to climate change as the result of low adaptive capacity.

21
District-level mapping of climate change vulnerability, measured as a composite of adaptive capacity and climate sensitivity under exposure to climate change. Districts are ranked and presented as quintiles. (Source: TERI,
New Delhi)
To measure adaptive capacity, the paper identified significant biophysical, socioeconomic, and technological factors that influence agricultural production. Biophysical indicators used in the profile consisted of soil conditions (quality and depth) and ground water availability; socioeconomic factors consisted of levels of human and social capital, and the presence or lack of alternative economic activities; and technological factors consisted of the availability of irrigation and quality of infrastructure. The results of the analyses are shown in figure 7 below, which show that the districts of southern Bihar have a higher adaptive capacity than the districts of northern Bihar.
District-level mapping of adaptive capacity in India in which aAdaptive capacity is measured here as a composite of biophysical, social, and technological indicators. Districts are ranked and presented as quintiles. (Source: TERI, New Delhi)

22
2.3 Key Conclusions While the above sub-sections give some indication of future climate conditions and
impacts on some sectors, there is a need for detailed climate modelling studies at the State level, covering possible impacts on each sector. Centre for Environmental Sciences, Central University of Bihar, Patna may be proposed for in depth climate modelling studies including impact analysis. There is need of comprehensive analysis for Bihar for the various focus sectors under this BAPCC. These will need to be carried out, as part of the detailed state level climate modelling exercises, and will also need to include systematic documented community perceptions on climate change and its impacts across the state and across various sectors.
Key points
• Tmin increase of 0.6 to 1.50C in December-January during 1971-2000 in different pockets of Bihar
• Tmax decrease of -3.0 (Southwest) to -1.40C (Northeast) in April-May during 1971-2000
• Tmin increase of 0.10C is observed in the month of December during 1971-2000
• No significant change in June-July-August (JJA) rainfall (cm) during 1871-2002 although decrease (southwest) or increase of rainfall is observed in different pockets
• Future projected change in annual temperature (0C) during 2011-2040 with respect to 1961-1990 in RCPs of 8.5 shows changes of 0.8-1.90C
• Future projected change in Tmin (0C) in December-January during 2011-2040 with respect to 1961-1990 shows changes of 0.2-1.00C
• The 5-10% change (positive or negative) in mean JJA rainfall (cm) is noticed over Bihar in RCPs of 4.5 and 8.5 scenarios
Based on temperature and rainfall time-series for 1951-2010 Annual Tmax does not show any trend while mean Tmax in winter (-0.010C/year),
Summer (-0.020C/year), Monsoon (0.010C/year), and Post Monsoon (0.010C/year) shows significant tend.
Tmin in annual (0.020C), winter (0.020C/year), Summer (0.010C/year), and Post Monsoon (0.020C/year) shows significant tend, while Monsoon season does not show any trend
Annual mean temperature (0.010C), mean temperature in monsoon (0.010C) and post monsoon (0.020C) show significant trend while no trend is found in winter and summer season.
Mean Diurnal temperature range shows significant negative trend in annual (-0.020C), winter (-0.040C) and summer (-0.030C), other seasons do not show significant trend.
Monsoon season rainfall (0.59 mm/year) shows significant trend, although negative trend is found in winter (-0.06 mm/year) but not significant.

23
Based on rainfall date for the period of 1984-2012, Heavy rainfall frequency is more in the month of July in Patna while Purnea shows more heavy rainfall frequency in compare to Patna for June-July-August-September

24
Part B: Climate Change Strategy

25
3 Overarching State Framework 3.1 State Vision and Commitment
The State has articulated climate concerns in its Approach Paper for the 12th FYP, and as such, is committed to fostering an integrated approach to inclusive, sustainable, and climate resilient growth and development. The GoB’s vision will be achieved through pursuing (a) broad streaming of climate concerns into all aspects of development policy and implementation, (b) integrating low carbon and climate resilient development models into its growth strategy, and (c) ensuring complementarity with and contributing to the national agenda on climate change. Keeping in mind the overall motto of Bihar Action Plan of Climate Change (BAPCC) – ‘Building Resilience through Development’, these approaches will be supported by the strategies and actions outlined in this report, and by all other necessary actions by the State Government for the achievement of the Vision. 3.2 Overall Approach, Principles, and Strategies
The approach of the BAPCC is to create and define a overarching climate response framework at the State Government level to reduce vulnerability; reduce hazards and exposure; pool, transfer, and share risks; prepare and respond effectively; and increase capacity to cope with unforeseen events, while articulating flexible sector specific response strategies and actions keeping in mind the overall Vision. The State recognises that it has several existing vulnerabilities (ecological, economic, social and cultural), and that climate change is likely exacerbate these further if not addressed adequately and holistically. Therefore the climate response strategy of Bihar has key elements such as accelerating inclusive economic growth, promoting sustainable development, securing and diversifying livelihoods, and safeguarding ecosystems. Further, the strategy is not to be viewed as a standalone action; instead it will be integrated into the regular developmental planning process, keeping with the convergence principles articulated in the State’s 12th FYP Approach Paper. Adaptation’ will be the predominant philosophy and component of the climate response strategy of Bihar, while at the same time leveraging opportunities for mitigation co-benefits. The state lays equal emphasis on both ‘hard’ and ‘soft’ adaptation approaches – where ‘hard adaptation options’ include options that have physical attributes (e.g. infrastructure and engineering structures) and ‘soft adaptation options’ include the development of skills, processes, institutions, social systems, policies and programmes. Flexibility (within livelihoods, economic, social, cultural, ecological and institutional systems), diversification (involving multiple independent flows to livelihood and natural systems), learning and education (from events at both individual and institutional levels and knowledge base required to develop new systems when existing ones are disrupted), mobility (an attribute of flexibility), operational techniques (for risk reduction before and following disruptions), convertible asset and innovation (designing new systems and options) will be the key elements of the climate response strategy for Bihar. Specific elements of the overarching climate response framework at the State Government level are articulated below (additional elements will be added as and when necessary). The state will develop action oriented operational plans and budgetary frameworks for these by end 2012. It has also been ensured that all actions to be undertaken as part of the BAPCC have broad conformity to the NAPCC and the eight National Missions under it. 3.2.1 Scientific Knowledge, Evidence Base, and Understanding of Climate Change
The previous section has already outlined the fact that the currently available knowledge base vis-à-vis climate change vulnerability and its impacts on the State, its economy, and its various sectors and communities is limited or virtually non-existent. As such, the BAPCC

26
seeks to fulfil the following outcomes (which are linked to the overall knowledge management Strategy under the BAPCC) Development of detailed climate vulnerability and risk analyses covering all districts, as
well as specific analyses pertaining each of the sectors addressed in the BAPCC; Improved scientific evidence base and coordination mechanisms between scientific
research and academic institutions (including both national and state level agencies) for build scientific data and evidence base for the State; and collation of available scientific information and data on climate change pertaining to the State
Review of the sectoral strategies under the BAPCC based on the vulnerability and risk assessments; and
Documentation (on an on-going basis) of people’s perceptions on community change and its impacts, and where appropriate, establish if these have scientific bases and validity. To fulfil the above outcomes, the State will take all necessary steps including initiating
(as one of the highest priority agendas) processes for carrying out detailed climate vulnerability analyses and developing a climate vulnerability atlas, which will be updated on an on-going basis. Centre for Environmental Science, Central University of Bihar, Patna may be proposed for climate modelling activities. Centre for Environmental Sciences arrange dialogue among academic institutions and coordinate climate change research. These will then be used to foster processes for specific basic and applied research initiatives that may be required to support the implementation of BAPCC. Central University of Bihar will also foster dialogue and collaboration between scientific and academic research organisations elsewhere as part of the above processes.
Climate modelling activities have been started at Centre for Environmental Sciences (CES), Central University of Bihar (Founded by GoI under Central Universities Act, 2009) at Patna. The Regional Climate Model, PRECIS (UK Met Office) is being used to conduct the experiment for base line (1961-1990) and A1B scenario (2011-2040) at surface horizontal resolution of 50x50km2 over India, apart from various other studies using IPCC climate model data and in the next phase, CES is expanded climate modelling activities on a high speed computing facility by government funded research projects on Monsoon Rainfall, Droughts, Floods, Western Disturbances and Climate Change Impacts on Agriculture and Water Resources. Considering that Centre for Environmental Sciences, Central University of Bihar is the only academic institution who is working on modelling of climate change, the State proposes to mandate CES with the role of Centre for Climate Change, and to task it with the role of anchoring all climate change and impact related research activity specific to the State and also build State capacities for understanding and tackling climate change through appropriate adaptation and mitigation actions.
3.2.2 Governance Mechanisms, Institutional Decision Making, and Convergence
As indicated in an earlier section, Bihar is already implementing a range of steps/programmes that are climate-friendly/neutral (there are described in Section 4 below under each sectoral subsection). While continuing to foster such initiatives, the State will seek to fulfil a range of outcomes including: Developing and putting into place overarching institutional and governance mechanisms
at the State level to oversee and implement the BAPCC; Review of all state policies and revise these as necessary to articulate and integrate
climate concerns; Articulation and integration of climate change considerations into development strategies,
plans and programmes;

27
Strengthening of institutional decision-making mechanisms and processes (including monitoring & evaluation) to ensure cross-sectoral coordination related to climate change;
Development and adoption of appropriate management approaches including regulatory, incentive, and innovation based approaches to encourage appropriate adaptation and mitigation measures; and
Development and strengthening of institutional capacity for climate related disaster risk reduction and management.
The overarching State level institutional architecture is given in Figure 14 below.
Figure 14: State level architecture for BAPCC implementation
In order to provide an overarching governance framework and guidance to the State’s climate agenda, the State has already constituted the State Steering Committee under the Chair of the Chief Secretary and consisting of key senior bureaucrats from various sectors, and other eminent persons. The SSC, which was mandated the apex role of overseeing all aspects of the State’s preparations and initiatives to address climate change and its impacts, will be activated, and a specific terms of reference will be developed for it, including periodic mandatory meetings, and outlining other key responsibilities including review of all State policies and programmes and identify gaps, risks, opportunities, and possible corrective actions towards achieving the above outcomes. The Department of Environment and Forest will act as the Nodal Agency for coordinating and overseeing all operational aspects of the BAPCC implementation and coordination at the State level, with oversight support from the Chief Secretary, the Development Commissioner, and the Principal Secretary, Planning and Development. All sectoral line departments and other key agencies in the state will set up Climate Change Cells in their respective departments/agencies. These Cells will coordinate and oversee all aspects of BAPCC implementation in their respective sectors, as well as liaise/coordinate with the State Planning Board and other line departments as required. The State will also put together and co-opt an Advisory Panel comprising of academic and practitioner experts to advise and work with the State SSC and the State Planning Board in carrying out their respective mandates. It is anticipated that the Advisory panel would co-opt new members as and when required or a case-by-case basis. While this BAPCC focuses on sectoral interventions across a selected set of government line departments/agencies, this will
State Steering Committee (SSC)
Nodal/Coordinating Agency State Planning Board
Climate Change Cells of Line Departments/Agencies
District Administration, Line Departments/Agencies
Village Level Institutions -- Panchayats, JFMCs, etc.
Advisory Panel
Climate Change Leaders, Civil Society, and other Stakeholder
Groups
Bihar State Centre for
Climate Change

28
by no means exclude the role of other line departments/agencies, and these will be co-opted to support BAPCC implementation processes from time to time. 3.2.3 Capacity Development, Education, and Awareness
The State recognises that overall awareness of climate change and its impacts in Bihar is limited. Therefore, the BAPCC seeks the fulfilment of the following outcomes: Capacities of government line departments and agencies at all levels to analyse, plan,
converge, implement and monitor programmes addressing climate change and its impacts; and
Significantly improved awareness of climate change and its impacts in government at all levels as well as in communities, civil society, and the private sector in the State.
The State will initiate and foster a range of on-going awareness and capacity building measures aimed at targeting government departments and agencies at various levels, to improve overall awareness levels. It is proposed that Centre for Environmental Sciences, Central University of Bihar will develop climate modelling centre and deploy capacity building modules to train personnel from the Climate Change Cells of various line departments, who in turn can train and build capacities of their respective departmental personnel to actively engage the climate agenda. The State will also put into motion a process of building awareness on climate change and its impacts among the population and communities in general and also develop and widely disseminate sets of actions that the citizens of the State can take to support the BAPCC. In addition, the State will examine the possibility of incorporating climate change related modules into the educational curriculum across various levels, including the development of specific academic programmes on climate change at University levels. Appropriate external agencies in coordination with Centre for Environmental Sciences, Central University of Bihar will be co-opted as necessary to support the awareness and capacity building processes. The State will additionally seek to build and support a network of Climate Leaders – who can come from either government or elsewhere – to help foster and champion the climate agenda in the State. 3.2.4 Connecting Science, Policy, and Practice
As an extension of the overarching principles actions on improving scientific knowledge and evidence base articulated above, the State is committed to supporting processes that connect science to policy and practice. The following outcomes are envisaged towards this end: Data/research needs to support BAPCC implementation and related policymaking
identified (on an on-going basis, as needs evolve); Mechanisms to foster dialogue with and between scientific research and academic
agencies; and Specific mechanisms to adopt and implement practical approaches and solutions based on
basic and applied research to support BAPCC implementation. As such, under the BAPCC, the State seeks to actively consult and dialogue with relevant scientific organisations and academia in the formulation of state policies, to develop a culture of evidence-based policymaking. It also similarly will support similar consultation and dialogue in the formulation of developmental and sectoral programmes by the various line departments and agencies, through their Climate Change Cells as has been proposed in the BAPCC. On an immediate basis, specific emphasis will be given to practical approaches and solutions (technological and otherwise) that have already been developed by universities/research organizations in the state. 3.2.5 Integrating Poverty, Livelihoods, and Equity Issues
The State already places emphasis on inclusive development, as has been articulated in its Approach Paper to the 12th FYP. By extension, the State also recognises that since

29
climate change can disproportionately impact the poor, women, children and the aged, and can also impact livelihoods, sectoral planning under the BAPCC needs to explicitly integrate poverty, livelihoods and equity concerns. The State also recognizes the different roles that men and women play in society and because of the unequal power relations between them. While a large number of poor, rural women depend on climate-sensitive resources for survival and their livelihoods, they are also less likely to have the education, opportunities, authority, decision-making power and access to resources they need to adapt to climate change. Women’s vulnerability to climate change differs from men and climate change interventions that are not gender-responsive often result in deepening the existing gender divide5.
As such, the state will take the necessary steps towards fulfilling the following (but not be limited to) outcomes: (a) Reduced intra-state inequity between the various regions of Bihar as also reduced inter-
district inequality, especially in infrastructure and service provision as these have a bearing on livelihoods and thus adaptive capacity as well;
(b) Mainstreamed use of explicit gender-responsive language, data, and analysis in the detailed implementation plans to be developed under the BAPCC and integration of gender and equity elements components in programming such as setting gender-specific indicators in programmes and schemes, carrying out gender-focused monitoring and evaluation, including gender-sensitive audits of adaptation programme and schemes, building capacities of women and men to implement participatory schemes at the village-level; building capacities on gender and adaptation within all governance institutions at all levels from Panchayati Raj Institutions (PRIs) to the State6;
(c) Partnerships and collaborative arrangements with relevant agencies (to be identified) to help build capacities within the Departments to work with gender and climate change adaptation; and
(d) Partnerships and collaborative arrangements with the Panchayati Raj Department to help Gram Panchayats develop participatory and gender-just local action plans on adaptation (LAPAs) at the Panchayat level, in addition to their mandate of developing and implementing the Village-level Development Plans
It is expected that these actions will significantly enhance and contribute to equitous adaptive climate resilience in the State. 3.2.6 Private Sector and Financial Institutions
The private sector already plays a role in contributing to the State’s economy in the secondary and tertiary sectors. A range of PPP initiatives and projects are already underway in the State in various sectors. Such PPP models can be useful for pooling resources and expertise and for up-scaling climate change adaptation (especially in terms of climate resilient infrastructure and low carbon goods and services) and mitigation initiatives by way of explicit incorporation of climate concerns into project frameworks. Private Sector has great potential and competency for bringing innovative solutions and scale to the various models for climate change adaptation shaped by the civil society and/or government institutions however their primary thrust thus far has been limited to clean development mechanism (CDM) and related projects. Increasingly, there is a huge potential and need private sector to play critical roles sectoral initiatives in the primary sectors as well – brining in new management practices, technologies
5 Fourth Assessment Report (2007) of the Inter-governmental Panel on Climate Change (IPCC), Chapter 17, especially
pages 729-730 6 Aditi Kapoor, Engendering The Climate For Change: Policies and practices for gender-just adaptation. Alternative Futures
and Heinrich Boll Foundation (HBF), 2011

30
and technology transfer, innovation, capital and investments, capacity building, etc. In this direction, the BAPCC will seek to fulfil the following outcomes: A roadmap for exploring the potential role of private sector across the various focus
sectors of the BAPCC especially in the primary sectors such as agriculture (with special emphasis on rain-fed mountain agriculture and extension), forestry, etc.;
Review of existing initiatives by the private sector including CSR to examine possibility of incorporating climate agendas;
Review of existing policy frameworks governing the private sector including the draft State PPP Policy with the objective of exploring the incorporation of climate change concerns into PPP projects in the state;
Outlining of necessary enabling frameworks and regulatory mechanisms for involvement of the private sector.
As in the case of the private sector, increasingly, the financial sector and financial institutions will have critical roles to play in sectoral initiatives – brining in new financial practices, products, and innovation, capital, investments, climate risk transfer mechanism, etc. As such, the BAPCC envisages the following outcomes: Developing a roadmap for exploring the potential role of the financial sector and financial
institutions across the various focus sectors identified in the BAPCC (and in other sectors as appropriate/necessary); and
Outlining the necessary enabling frameworks and regulatory mechanisms for involvement of the financial sector.
3.2.7 Role of Civil Society Civil society and voluntary organizations have played critical roles in shaping the
development landscape of not only Bihar, but also across the nation. These will continue to have vital roles in the context of climate change, and have the potential to deliver programmes and services to communities and to bridge the roles of not only the government and community but also bridge the roles of scientific research institutions and the private sector with government and the community. As such, the BAPCC envisages the following outcomes relating to the role of civil society: Developing a roadmap for exploring and articulating the potential role of civil society
organisations (including non governmental organisations [NGOs] and NGO Networks, community based organisations [CBOs] and CBO networks, etc.) in BAPCC implementation including capacity building at various levels especially at district and sub-district levels, inputs to the BAPCC on poverty, equity and livelihood concerns, outreach and extension and bridging roles, documentation of community perceptions and best practices, participatory research, knowledge networking, and contributing to expanding the available evidence base on climate change, etc. and
Identifying appropriate civil society organisations and their networks at various levels who can who can partner BAPCC implementation at various levels including state, district, block and at the grassroots.
3.2.8 Role of International/External Support Agencies Likewise, international/external agencies play significant roles in supporting
developmental initiatives and bringing in technical assistance to the State. A range of international organisations, including multilateral, bilateral and other agencies have supported and continue to support significant development projects across government departments as well as civil society. As such, the it is envisaged that international organisations will also play a significant role in supporting various aspects of BAPCC implementation; the State will therefore proactively seek opportunities for collaborative partnerships with such organisations especially in the context of external support for financial support, technical

31
assistance and advisory services, bringing in international best practices, knowledge management and networking, inter-state and regional dialogues on climate change, etc. 3.2.9 Monitoring Framework
A tentative and indicative outline of a monitoring and reporting framework is given in Figure 15 below. Figure 15: Tentative and indicative monitoring framework for the BAPCC
The state is committed to ensuring that BAPCC implementation is complemented by a robust framework and mechanisms for monitoring and evaluation not only as a means of ensuring that the detailed operational plans that will be developed under the BAPCC are implemented as planned, but more importantly, as a tool for systematic review and programme improvement as the needs of the State evolve with implementation. It is tentatively expected that reporting will take place on a quarterly basis at all levels, internal reviews of implementation progress and performance on a half-yearly basis. Likewise, considering that this BAPCC broadly covers implementation plans over a five year period, implementation of the, an external third-party evaluation during mid-2014 to critically examine implementation and recommend course corrections, and another similar external evaluation will be carried out during end 2017. A detailed and robust monitoring framework will be developed including specific methodologies, protocols, and templates for monitoring and reporting as part of the process of developing detailed work plans under the BAPCC. 3.2.10 Knowledge Management, Sharing, Learning, and Dialogue The BAPCC recognises that knowledge creation, management, and dissemination/ exchange will be critical and central to the successful implementation of the SAPCC. The BAPCC also recognises that Bihar does not exist in an independent developmental vacuum; it exists in the developmental context of the central-north Indian region and also in the larger context of India. Therefore the BAPCC will seek to fulfil the following outcomes in this regard: Develop protocols for new knowledge creation and documenting emerging best practice
across sectors and at all levels, as well as documenting and sharing people’s perceptions on climate change and its impacts on an on-going basis;
Develop mechanisms and partnerships for sharing knowledge base and emerging experiences including best practice not only within the State at all levels but also with other states in the region and across India and elsewhere.
State Steering Committee (SSC)
Nodal/Coordinating Agency State Planning Board
Climate Change Cells of Line Departments/Agencies
District Administration, Line Departments/Agencies
Village Level Institutions Panchayats, JFMCs, etc.
External monitoring and evaluation agencies/teams
Bihar State Centre for
Climate Change

32
As such, it is envisaged that the BAPCC outcomes knowledge management will be crosscutting and also closely connected to the envisaged outcomes on capacity building. Additional elements of Knowledge Management may be taken up from time to time during BAPCC implementation as required.
Linkages with the NAPCC and the National Mission on Strategic Knowledge for Climate Change
The above sub-sections, and in particular, those on -- Scientific Knowledge, Evidence Base, and Understanding of Climate Change; Capacity Development, Education, and Awareness; Connecting Science, Policy, and Practice; and Knowledge Management, Sharing, Learning, and Dialogue – are consistent with and complement imperatives outlined in the NAPCC in general and in particular, those under the National Mission on Strategic Knowledge for Climate Change.

33
4 Sectorial Implementation Approaches 4.1 Overall Common Implementation Framework
It is envisaged the BAPCC implementation under the various sectors of the State will be governed by a common implementation framework7 as in Figure 10 below: Figure 16: Common framework elements for sectoral implementation under the BAPCC
The common elements will include: Sector policy reviews: Each sector will undergo a policy review, and where appropriate,
explicit articulation of climate change concerns and sectoral responses will be articulated; Sector climate vulnerability assessments: Sectoral climate vulnerability and risk
assessments will be carried out as part of a larger vulnerability and risk assessment for the State, and where appropriate, sectoral programme elements will be re-framed based on the findings;
7 Since these will be common across sectors, in order to avoid repetitiveness, will not appear in the descriptions of each
sectoral programme
Sector policy reviews
Sector climate vulnerability
assessments
Sector climate change impacts
evidence base strengthening
Sector public/ community perceptions
documentation
Periodic consultations
with civil society and communities
Incorporation of poverty, equity, and livelihood concerns
Monitoring and evaluation protocols
Knowledge management
activities
Sector programmes under BAPCC

34
Sector climate change impacts evidence base strengthening: Each sector will put into motion a process of building the evidence base on climate change and impacts to the sector;
Forecasting and early warning systems: Each sector will put into motion systems for adoption forecasting and early warning systems for adverse climate impact installation for improved resilience and adaptation;
Participatory qualitative methods and quantitative models: Each sector will seek to adopt and foster quantification of cost and benefit analysis of adaptation options for sector performance improvements and outcome optimisation;
Locally specific adaptation plans: To increase resilience, locally specific adaptation plans will be made; enabling the exchange of case studies and good practices will facilitate the development of robust solutions;
Leveraging Co-benefits: Each sector will proactively seek to identify and leverage opportunities for co-benefits arising out of BAPCC implementation;
Sector public/community perceptions documentation: Each sector will carry out periodic documentation of public/community perceptions on climate change and its impacts relevant to the sector;
Periodic consultations with civil society and communities: Each sector will carry out periodic consultations with civil society and communities to gauge adaptive resilience needs;
Incorporation of poverty, equity and livelihood concerns: Each sector will, where appropriate, incorporate and explicitly articulate poverty, equity and livelihood concerns in their policies, plans and budgetary processes;
Monitoring and evaluation protocols: Each sector will, in line with the overarching State level framework, develop and deploy monitoring and evaluation processes and protocols to guide effective programme implementation; and
Knowledge management activities: Each sector will, in line with the overarching State level framework, carry out KM activities, and contribute to the State level processes on an on-going basis. Under the BAPCC, an appropriate organisation will be identified to carry out the role of a knowledge aggregator, and become a clearinghouse of all data/information on existing and planned research projects and initiatives relating to climate change in the Bihar context. Towards this, the identified organisation will provide the following inputs: Hosting of geo-portal on climate change; Host-hub for knowledge/information sharing related to climate change; Knowledge repository; Identification of potential research and development domains concerned with climate
change issues in the state; and Technical demonstration, research and development, extension and transfer of
technology protocols, relating to climate change. Additionally, efforts will be made to explore the options for participation of and leveraging the private sector and financial institutions in each sectoral programme. Likewise, where appropriate, suitable external support agencies will be leveraged/sought to bring in additional implementation support or technical assistance.

35
5 Agriculture and Allied Sectors 5.1 Overview, Characteristics and Status
Traditionally, Bihar's Economy is dominated by the agricultural sector. Around 90 percent of the population still live in rural areas where agriculture, along with animal husbandry, has been the mainstay of their livelihood. This has become even truer with the bifurcation of the state, which took place in November 2000. Bifurcation took away the mineral rich part from Bihar and the state was left with its fertile land and abundant water resources. Agriculture, therefore, is sure to play the most important role for the development of the state. Bihar is rich with fertile land resources. The area under cultivation as a proportion of the total reporting area is as high as 60 percent, as compared to only 47 percent for the country as a whole. Agriculture is the single largest private sector occupation in the state, with nearly 81 percent of the State’s population employed in agriculture production system, which is much higher than the national average. In Bihar, based on soil characteristics, rainfall, temperature, and terrain, there are three main agro-climatic zones, which have been briefly described in earlier section. Each zone has its own unique characteristics in terms of the crop production. Agro climatic zone I and II is located south of the river Ganges whereas the Zone III (A and B) is located south of the river Ganges. Zone I is situated in the northwestern part of the state whereas zone II is located in the northeastern part. Zones I and II are flood prone whereas zone III is drought prone. The soil texture in the state varies from sandy loam to heavy clay and majority type belongs to loam category, which is good for crop cultivation. Soil PH varies from 6.5 to 8.4. The annual precipitation varies from 990 to 1200 mm although major precipitation is received during the month of July to September. The changing temporal and spatial pattern of rainfall and temperature will adversely affect these agro climate zones. There are three crop seasons - Kharif, Rabi and Zaid. Kharif crops are sown in May-June and harvested in September– October. The important Kharif crops are cotton, rice, sugarcane, maize, jowar, and bajra. Rabi crops are sown in October–November and harvested in February–March. The important Rabi crops are wheat, grams, barley, rapeseed, and mustard. Zaid crops are produced in the short duration between Rabi and Kharif crop season, mainly from March to June, are called Zaid crops e.g. Muskmelon, Watermelon, gourd and etc. Rice, wheat, and pulses are grown in all the districts however the choice of the crop and crop rotation varies across the agro climatic zone. In Bihar, the gross and net sown area in the state is estimated at 80.26 lakh ha and 56.38 lakh ha, respectively. The principal crops are rice, wheat, pulses, maize, potato, sugarcane, oil seeds, tobacco, and jute. Rice, wheat, and maize are the major crops. Although the state has attained self-sufficiency in food grains production, barring maize and pulses, productivity of other farm produce in Bihar is much below the national average. In addition to the agricultural sectors, dairying is emerging as one of the important sectors in Bihar. During the period 2001-2002 to 2006-2007, milk production has been remarkably in Bihar because it has larger number of buffaloes as compared to the country as a whole, a larger proportion of dairy cattle in milk, ownership of the bulk of cattle by marginal and small farmers, sufficient market for marketing milk and milk products. This sector needs improvement in technology. Bihar is rich in water resources, which can be utilized for inland fishery. Approximately, 4.6 million households in the state are involved in fishing and this sector has been growing rapidly. 5.1.1 Land Use Pattern
Bihar falls in the riverine plane of the Ganga basin area. Because of the topographical nature, the proportion of total land put to agricultural use here is high as compared to other states of India. Table 11 presents the land use pattern of the state from 2006-07 to 2008-09, which shows that the pattern has remained largely unaltered.

36
Table 6: Land utilization pattern in Bihar (2006-07 to 2008-09; area in '000 hectares)1 Land use 2006-07 2007-08 2008-09
Geographical area 9359.57 (100.0) 9359.57 (100.0) 9359.57 (100.0) (1) Forests 621.64 (6.6) 621.24 (6.6) 621.64 (6.6) (2) Barren and Unculturable Land 436.06 (4.7) 432.09 (4.6) 431.77 (4.6) (3) Land put to Non-agricultural use 1646.89 (17.6) 1652.66 (17.7) 1670.45 (17.8)
Land Area 1285.98 (13.7) 1292.11 (13.8) 1312.94 (14.0) Water Area 360.91 (3.9) 360.55 (3.9) 357.51 (3.8)
(4) Culturable Waste 45.65 (0.5) 45.59 (0.5) 45.43 (0.5) (5) Permanent Pastures 17.33 (0.2) 16.47 (0.2) 15.87 (0.2) (6) Land Under Tree Crops 240.52 (2.6) 240.96 (2.6) 242.86 (2.6) (7) Fallow Land (excluding current fallow) 119.97 (1.3) 119.35 (1.3) 122.30 (1.3) (8) Current Fallow 566.39 (6.1) 568.61 (6.1) 655.17 (7.0)
Total Unculturable Land (1 to 8) 3694.45 (39.5) 3697.36 (39.5) 3805.48 (40.6) Net Sown Area 5665.12 (60.5) 5662.20 (60.5) 5554.08 (59.4) Gross Sown Area 7718.95 7764.65 7670.95
Cropping Intensity 1.36 1.37 1.38
The area under net sown area has shown a marginal decline. In 2006-07, net sown
area, which was 60.5 percent, came down to 59.4 percent in 2008-09. However, the cropping intensity has shown a marginal increase from 1.36 in 2006-07 to 1.38 in 2008-09. The pattern of land use exhibits substantial variation across districts. This is due to the fact that different district belong to different agro-climate zones. If one takes into account the net sown area, it is found that there exist seven districts where more than 70 percent of the area are under cultivation, compared to about 60 percent for the entire state. These districts are Nalanda (77.0 percent) Bhojpur (79.3 percent), Buxar (77.4 percent), Siwan (74.4 percent), Sheikhpura (72.6 percent), Gopalganj (72.6 percent), and East Champaran (70.6 percent). On the other hand, there are five districts that have less than 50 percent of net sown area, viz., Banka (42.3 percent), Jamui (16.9 percent), Munger (37.1 percent), Gaya (34.5 percent) and Nawada (42.1 percent). In the districts where irrigation facilities are at a minimal, the cropping intensity remained low despite effort by the farmers to increase it. The cropping intensity is the lowest at 1.16 in Jamui and Patna. 5.1.2 Cropping Pattern
Table 12 below shows the cropping pattern of various crops. The data shows that the agricultural economy is still very much oriented towards subsistence production, as the area under food grains production is as high as 94 percent. Within the food grains, the percentage share of cereals in the total area (86 percent) has shown a marginal increase at the cost of area under pulses. The oilseeds, fibres and sugarcane account for only 5 percent of the total cropped area and their individual shares in the total cropped area show only marginal changes. The average cropping area under sugarcane has increased marginally at the cost of oilseeds and fibres. For fibre crops (jute and mesta), the cropping area diminished from 2.1 percent in 2001-02 to 1.9 percent in 2009-10.
1 Source: Directorate of Economics and Statistics, GOB

37
Table 7: Cropping Pattern in Bihar 2001-02 to 2009-10)2
Crops Percentage of Area
2001-02
2002-03 2003-04 2004-05 2005-06 2006-07 2007-08 2008-09 2009-10
Food grains 94.3 94.4 94.4 94.2 94.4 94.3 94.4 94.7 94.3
Cereals -- -- 85.2 84.8 85.8 85.9 86.5 86.7 86.3 Pulses -- -- 9.2 9.4 8.6 8.4 7.9 8.0 8.0 Oilseeds 1.9 1.8 1.9 1.9 1.9 1.9 1.9 1.8 1.9 Fibre Crops 2.1 2.3 2.4 2.2 2.1 2.1 2.1 2.0 1.9
Sugarcane 1.5 1.4 1.4 1.4 1.5 1.6 1.4 1.5 1.6
Total Area 100.0 100.0 100.0 100.0 100.0 100.0 100.0 100.0 100.0
5.1.3 Production and Productivity The fertility of soil and the endowment of abundant ground water resources enable the
farmers of Bihar to produce a variety of crops, both food and non-food. Apart from cereals and pulses, farmers in Bihar also produce oilseeds, fibre, fruits, and vegetables. Of late, the farmers have taken to floriculture, in view of growing demand of flowers both from within and outside the state. Table 13 below shows the productivity of major crops in the State. Table 8: Productivity (Kg/ha) of major crops in Bihar3
Crops Triennium Average
(2000- 03) 2007-08 2008-09 2009-10
Triennium Average
(2007-10)
% Change between
trienniums
Total Cereals 1732 1799 1941 1595 1778 3 Total Rice 1457 1288 1651 1120 1353 -7 Autumn Rice 1247 1396 1324 947 1222 -2 Aghani Rice 1488 613 1712 1132 1152 -23 Summer Rice 1758 1729 1643 1736 1703 -3 Wheat 2036 2334 2205 2084 2208 8 Total Maize 2384 2823 2724 2341 2629 10 Kharif maize 1765 1221 1478 1772 1490 -16 Rabi Maize 2934 4001 3845
2660 - -
Summer Maize 2765 3762 3096 - - Total Coarse Cereals 979 924 2642 2277 1948 99 Barley 1186 1202 1245 1118 1189 0 Jowar 923 1096 1044 1040 1060 15 Bajra 861 1103 1208 1108 1140 32 Ragi 879 605 687 812 702 -20 Small Millets 681 739 786 760 761 12 Total Kharif Pulses 901 1024 1034 1125 1061 18 Arhar 1215 1383 1357 1513 1417 17 Urad 682 782 845 892 840 23
2 Source: Department of Agriculture, GoB 3 ibid

38
Crops Triennium Average
(2000- 03) 2007-08 2008-09 2009-10
Triennium Average
(2007-10)
% Change between
trienniums
Bhadai Moong 529 607 598 656 620 17 Kulthi 788 929 940 962 944 20 Other Kharif Pulses 544 657 671 810 713 31 Ghaghra (Cow Pea) 564 899 737 938 858 52 Total Rabi Pulses 806 781 902 796 826 3 Gram 1001 990 1157 1014 1054 5 Lentil 886 796 931 880 869 -2 Pea 947 1077 1027 1009 1038 10 Khesari 847 839 1062 944 949 12 Summer Moong 596 600 656 510 588 -1 Other Rabi Pulses 662 742 743 744 743 12 Total Oilseeds 818 1015 938 1034 996 22 Castor seed 944 950 957 963 957 1 Safflower (Kusum) 802 750 802 769 774 -4 Sesamum 629 795 806 766 789 26 Sunflower 1401 1390 1506 1405 1434 2 Mustard & Rapeseed 799 992 861 996 950 19 Linseed 712 825 848 846 840 18 Ground Nut 716 719 557 1650 975 36 Total Fibre Crops 7131 9416 8162 9148 8909 25 Jute 7317 9442 1361 1637 4147 -43 Mesta 6858 9260 1669 1701 4210 -39 Sunhemp 727 - - - - -
Sugarcane 43586 37624 37624 43430 39559 -9
In 2009-10, Bihar produced 35.99 lakh tonnes of rice, 45.71 lakh tonnes of wheat, 14.78 lakh tonnes of maize, 1.43 lakh tonnes of oilseeds and 50.32 lakh tonnes of sugarcane. If one compares it with the triennium average ending 2002-03, acreage under rice fell from 35.97 lakh hectares to 32.14 lakh hectares in 2009-10, whereas its production decreased from 52.44 lakh tonnes to 36 lakh tonnes due to severe drought in about 28 districts of Bihar. The area under wheat increased from 21.08 lakh hectares in the triennium 2000-03 to 21.93 lakh hectares in 2009-10 and its production of increased to 45.71 lakh tonnes in 2009-10 from an average level of 42.90 lakh tonnes in the triennium 2000-03. This also indicates a higher increase in yield rate of wheat over the years. The level of production in maize in 2009-10 was 14.79 lakh tonnes as compared to average production of 14.26 lakh tonnes in the triennium 2000-03. In case of maize, one again observed a steady positive trend in production. The production of pulses showed a decline from 5.75 lakh tonnes in 2000-03 to 4.72 lakh tonnes in 2009-10, with a corresponding fall in acreage from 7.02 lakh hectares in 2000-03 to 5.65 lakh hectares in 2009-10. The trend of rice production over the years has not been consistent. There exists much variation in the production of rice over the years. This is due to fact that around 50 percent of net sown area is bereft of irrigation and dependant on rain. The average production figures are around 50 lakh tonnes each year. On the other hand, wheat and maize show a growing trend. Pulses show a declining rate of growth, while

39
oilseeds during 2000-01 to 2009-10 grew at the rate of 1.8 percent, and fibres grew at the rate of 0.8 percent during the same period. 5.1.4 Production and Productivity of Vegetables and Fruit
Apart from major cereals and pulses, Bihar also produces a variety of vegetables and fruits. In terms of vegetable production, the state is proud to be holding the topmost position in the country in recent times. Although, Horticulture (Fruits, vegetables, spices, honey, medicinal and aromatic plants) occupies 15 percent of land area but income generated from horticulture is much higher. The state has a monopoly in production of litchi and makhana and continues to grow various fruits, vegetables, spices and floriculture is catching the imagination of people, reflected in their growing interest, across the state, ion diversification of horticulture. Taking into account the figures for 2009-10, the important vegetable crops include potato (57.84 lakh tonnes), onion (10.82 lakh tonnes), tomatoes (10.56 lakh tonnes), cauliflower (11.18 lakh tonnes), and brinjal (12.16 lakh tonnes). In 2009-10, the total area under vegetable production was 8.45 lakh hectares, which is about 11.02 percent of the gross sown area. It can be noted that area under vegetable production is showing an upward trend. The area under vegetable, which was 8.24 lakh hectares in 2006-07, rose to 8.45 lakh hectares in 2009-10. Alongside production, the crop wise productivity is also increasing. The productivity of potato increased from 17,180 kgs/ha in 2008-09 to 18,410 kgs/ha in 2009-10. The productivity of onion, which was 19,270 kgs/ha in 2008-09, went up to 20,317 kgs/ha in 2009-10 and, for cauliflower, the rise was from 17,360 kgs/ha to 17,861 kgs/ha in 2009-10. 5.1.5 Area and Production of Flowers
The farmers of Bihar are also taking interest in floriculture in recent years. The commercial production of flowers is taking place in the state in view of its rising demand. In 2010-11, the production levels of important flower crops were – rose (86.52 tonnes), marigold (5120 tonnes), Jasmine (307.46 tonnes), and tuberose (522 tonnes). Considering the share in area and production of various flowers in 2010-11, one finds that Patna, Muzaffarpur, Vaishali, Samastipur, and Gaya are major flower producing districts in the state. 5.1.6 Animal Husbandry
Besides agriculture, livestock and dairy is one of the key sectors for creation of livelihood and employment opportunities in the rural sector. This sector also plays an important role for womenfolk belonging to the marginal sector and contributes about one-fifth of the total rural income. Further, since 90 percent of state's population is rural, animal husbandry is extremely important for providing gainful employment to population living in rural areas, where many households are either landless and have landholdings of less than one hectare. According to livestock census of 2007, the total livestock population of Bihar is 416.13 lakh. Of this, 39.8 percent are milch animals with a cow population of 124.01 lakh and a buffalo population of 66.98 lakhs. The state also has a substantial number of goats (101.69 lakh). The size of poultry is also quite large at 114.14 lakhs. With such a large livestock sector, the growth potential is abundant. As most of the rural households are landless or marginal farmers, this sector functions more or less as a subsistence basis. For bovine population (cows and buffaloes), the districts with larger proportions are — Patna, Bhojpur, Rohtas, Gaya, Banka, Muzaffarpur, West Champaran, Madhubani, and Purnea. For goats and poultry animals, the north- eastern part of the state is particularly suitable. For these animals, concentration is significant in the districts of Purnea, Araria, Kishanganj, and Katihar. Milk continues to be the most important output of the sector. The production of milk has increased from 26.32 lakh tonnes in 2001-02 to 65.00 lakh tonnes in 2010-11. This implied an annual growth rate of 11.16 percent. During the same period, the production of eggs has increased to 110.10 crores in 2009-10 from a production level of 74.00 crore in

40
2001-02. But, in 2010-11, the production level fell to 74.40 crores leading to an annual growth rate of 3.25 percent. The production of wool now stands stagnated at a level of 2.50 – 2.60 lakh kgs. 5.1.7 Fisheries
Bihar is one of the developing state in our country where more than 76% population are toiling their livelihood on agriculture and allied activities like fisheries, dairy, poultry etc. Bihar has bountiful natural aquatic resources in the forms of ponds & tanks (93,296 ha.), Floodplain wetlands including chaurs (9,41,000 ha.), ox-bow lakes (9000 ha), reservoirs (25,000 ha.) and rivers (3200 km). There has been substantial growth in fish production in Bihar. In 2010-11, 2011-12, 20012-13 and 2013-14 the production of fish in Bihar was 2,88 LMT, 3.44 LMT, 4.0 LMT and 4.32 LMT respectively. Although, the gap existing between current production and current demand of fish is 2.07 LMT. Fisheries sector of this state is an important, most promising and fast growing food farming sub-sector of Bihar accounting 7.97% annual growth rate. The availability of immense aquatic resources of the state not only satisfies the demand of fish but also plays an important role in gainful employment generation, food and nutritional security, poverty alleviation, state income growth and finally socio-economic up-gradation of the rural community. Climate Change has various effects on Physico-chemical characteristics of water. Increase in harmful algal bloom, decrease in dissolved oxygen, Increase in disease due to Parasitic infection in growing season are some of the negative impact of global warming. 5.1.7.1 STRATEGY
To meet the challenge of the global climatic change and its impact on fisheries of Bihar, the Department of Fisheries, State govt. will strategically ensure end-to-end holistic approach covering production, input and resource enhancement, renovation of existing resources, post harvest management to assure sustainable returns to the producers. i. Promote capacity building and Human Resource Development at production and marketing level. ii. Promote R&D technologies for conservation, production, processing and marketing. iii. Enhance productivity through — adequate input supply (i.e. seed), resource renovation & enhancement, intensification, diversification of aquatic crops. iv. Enhance coverage through extension of appropriate technology to the fish farmers for high tech aquaculture cultivation. v. Adopt coordinated approach and promotion of public private partnership (PPP) approach for setting up marketing infra structure, processing plants and feed units at regional and state level. vi. Where ever appropriate and feasible, p romote SHGs, NGOs and fisherman Cooperatives to ensure support and sustainable returns to farmers. vii. Generate computerize data base regarding resource availability, existing production, potential production, demand of fish as well as mitigate socio-economic problems of fisher folk. Table 9 Strategy for Mitigation and Adaptation to meet challenges of climatic change Sl.no Impact Adaptation / mitigation Responsibility
i Warming Modification of culture system Public /Private
ii flood Short duration crop/fast growing species selection
Public /Private

41
iii Drought Rehabilitation/change of infrastructure to assure availability of water
Public /Private
iv Increase seasonal variability
Insurance scheme Public
v Cold wave Shifting targeted species Public /Private Response : To meet Draught challenge Scheme : A. Renovation of Infrastructure (i.e Renovation of ponds and tanks developments) The major resources of aquaculture production in our state are ponds/Tanks. The rapid global climatic change (i.e draught and flood), pollution), manifestation of macrophytes and heavy load of dissolve organic matter (i.e. siltation) leads to create a situation of eutrophication or dereliction or dilapidated condition of ponds. Therefore, management of such resources in an integrated manner is urgentneed for sustainable aquaculture development. Table 10 Resource enhancement: I. Through Renovation of pond. Year Physical targets
(In ha.) Livelihood generated Total costs [email protected]
lakh/ha(in crores) 2015-2016 1000 10000 15.00 2016-2017 1000 10000 15.00 2017-2018 1000 10000 15.00 2018-2019 1000 10000 15.00 2019-2020 1000 10000 15.00 Total 5000 50,000.no of people 75.00 Table 11 Resource enhancement: II. Through fish seed recruitment in developed ponds. Year Physical targets
(In ha.) Fingerling requirements (@ 5000/ha)
Costs Rs.@2000/thousand (in crores.)
2015-2016 1000 50,00000 1.00 2016-2017 1000 50,00000 1.00 2017-2018 1000 50,00000 1.00 2018-2019 1000 50,00000 1.00 2019-2020 1000 50,00000 1.00 Total 5000 2,50,00000.00 5.00
Total available pond area in Bihar : 93,296 ha. (Area proposed to develope in this scheme : 5000 ha.) Area proposed to developed : 1000 ha/year. Estimated cost Rs.=15 crore/year @ 1.5 lakh/ha. Fish production =4000 MT @4000 kg/ha. Sale price Rs. @100/kg. Livelihood generate @ 10 fisherman/ha=10x1000=10,000/Year. Livelihood to be generated in 5 year= 50,000. No. of family benefited in 5 year=10,000(family size 5 members) Per capita income generated =Rs.40,000.00 Total revenue generated in 5 year=200 crores

42
5.1.7.2 Capacity building of Fishermen/Fisherwomen/Officers Generating trained manpower, who can efficiently handle the activities in context with global climatic change, would be the key for successful development in any sector, including fisheries. There is an acute shortage of trained manpower in Bihar because of adequate facilities. In order to increase the production and productivity of water bodies, capacity building of extension personals, farmers and officers are urgently needed. Therefore, a strong strategy, is needed to maximize the number of trained manpower for effective utilization of fisheries sector Table 12 Requirement of fund Year Fishermen
/Fisherwomen targets (no)
Unit cost/ person (in Lakh)
Officers (no) Unit cost/person (in Lakh)
Total cost (in Lakh)
2015-2016 300 0.10 15 0.30 34.5 2016-2017 300 0.10 15 0.30 34.5 2017-2018 300 0.10 15 0.30 34.5 2018-2019 300 0.10 15 0.30 34.5 2019-2020 300 0.10 15 0.30 34.5 Total 1500 75 172.5 Table 13 Different level of training, their duration and destination
Sl No.
Parameters District level Division level State level Country/ Abroad level
1 Duration 10 days 10 days 10 days 7 days, 21 days, 1 month
2 Target group and there No.
fish farmer @ 100 no/ year
fish farmer @ 100 no/ year
fish farmer @ 100 no/ year
Departmental office @ 15 no/year
3 Mode of training Learning by doing seeing is believing
Learning by doing seeing is believing
Learning by doing seeing is believing
Learning by doing seeing is believing
4 Inter institutional involvement
SAUs, ICAR, KVKs
SAUs, ICAR, KVKs
SAUs, ICAR, KVKs
ICAR, MANAGE, IIM, NIRD
Estimated expenditure. Components Costs ( Rs.in crores) A. Resource enhancement: 1. Through Renovation of pond : 75.00 2. Through fish seed recruitment in developed resource 5.00 B. Capacity building of Fishermen/Fisherwomen/Officers: 1.725 Total Rs: 81.725 Crores 5.1.8 Plan of establishment of Gober Gas Plant
There is a great importance of Gober based Bio-gas in the State. For cooking, different form of gober as "UPLA & GOETHA" are being used in the rural areas. Gober is used in form of Bio-gas for energy and waste material (slurry) is used to getting fertilizer by Vermi Compost. Bio-gas have play a major place in non traditional energy. For production of Bio-gas there is domestic and farming waste materials are used. The production of Bio-gas by

43
using these waste materials in special machine by natural process. Through this process produced gas is basically `Methane' Gas which is inflammable and used easily in domestic works as cooking, Lighting & in operation of farming machines. This scheme can be added in work plan for changing the climate. For production of Bio-gas various types of animals Gober are used in plant. By products of various crops like husk of wheat & rice and leaf of various plants are also used. At least 1 cubic meter to 3 cubic meter capacity machines should be used in the rural area depending upon the no. of animals. Everyday fresh Gober is essential for the production of Bio-gas. The no. of animals and the capacity of Gober gas plant is mentioned in the chart below: - Benefit of Plan :- • Using 1 Cubic meter plant, produce Bio-gas equal to one gas cylinder. This gas can be used in cooking for five people. • Using 2 Cubic meter plant, produce Bio-gas equal to 2-3 gas cylinder. This gas can be used in cooking for 10 to 15 people two times. • Using 3 Cubic meter plant, produce Bio-gas equal to 3-4 gas cylinder. This gas can be used in cooking for 15 to 20 people two times. • There is direct benefit of 2500/- in form of gas, lighting & fertilizers.
Table 14 Estimate of per unit Gober Gas Plant
(Financial year 2014-15 to 2018-19)
Year Units Per unit cost
Target Total estimated cost (Z in crore)
Total fresh gober (in Kg.)
No of animals (Approx)
2014-15 1 Cubic Meter 2000 1000 Unit 2.00 25000 2000 2 Cubic Meter 4000 500 Unit 2.00 25000 2500 3 Cubic Meter 6000
Maximum 500 Unit 3.00 37500 3500
Total 2000 unit 7.00 2015-16 1 Cubic Meter 2000 1250 Unit 2.50 31250 2500
2 Cubic Meter 4000 750 Unit 3.00 37500 3750 3 Cubic Meter 6000
Maximum 750 Unit 4.50 56250 5250
Total 2750 Unit 10.00 2016-17 1 Cubic Meter 2000 1500 Unit 3.00 37500 3000
2 Cubic Meter 4000 1000 Unit 4.00 50000 5000 3 Cubic Meter 6000
Maximum 1000 Unit 6.00 75000 5250
Total 3500 Unit 13.00 2017-18 1 Cubic Meter 2000 3500 Unit 3.50 43750 3500
2 Cubic Meter 4000 1750 Unit 5.00 62500 6250 3 Cubic Meter 6000
Maximum 1500 Unit 7.50 93750 8750
Total 4250 Unit 16.00 2018-19 1 Cubic Meter 2000 2000 Unit 4.00 50000 4000
2 Cubic Meter 4000 1500 Unit 6.00 75000 7500

44
3 Cubic Meter 6000 Maximum
1500 Unit 9.00 112500 10500
Total 5000 Unit 19.00 Grand total 17500 Unit 65.00
5.2 Key Issues
Though endowed with good soil, adequate rainfall, and good ground water availability Bihar has not yet realized its full agricultural potential. Its agricultural productivity is one of the lowest in the country, leading to rural poverty, low nutrition, and migration of labour. Traditionally major constraints of agriculture in the state have been the supply of quality inputs particularly in areas of fertilizer, mechanization, and credits. Access to assured and economical irrigation is low. Small and fragmented land holdings hinder adoption of modern technology and disfavours economies of scale. Vagaries of rainfall influence agriculture productions; recurrent floods and droughts severely affect the outputs. Weak agriculture extension systems have led to poor transfer and adoption of modern efficient technologies. Poor marketing and distribution chain with inadequate procurement, storage, and processing capacities have affected incomes and incentives. The situation in allied sectors is equally unsatisfactory. Vast potential in animal husbandry, dairy and fisheries sector has remained unutilized due to low productivity, lack of physical infrastructure, and inadequate skilled human resources at the field level. Growth of fisheries is constrained by inadequate availability of quality inputs (fish seed, fish feed, etc.) and weak fisheries extension system. Poor support from financial institutions and inadequate coverage of insurance has also restricted the growth. The yield gaps in fruits and vegetables are more than 300 percent. As regards livestock, COMPFED, modelled after Amul is functioning well in certain areas, but overall livestock productivity is very low. There are gaps in production and supply chain of meat and other by-products of the livestock industry. As regards poultry, apart from backyard poultry production by the small farmer, commercial poultry has not yet taken off in the State. In spite of the abundance of water bodies, fisheries sector in Bihar does not fully meet the state’s demand and meets part of its fish requirement by importing fish from far away Andhra Pradesh.
Fluctuations of Bihar’s agricultural production and its impact on GSDP remain an area of concern. Problems of flood and drought severely affect the agricultural income on an annual basis, and intra-state disparities are significant in many sub-sectors. While efforts are being carried out to improve credit flow to the sector, this has been largely inadequate, as can seen from data pertaining to the sector. Beginning with 2005-06, the achievement level of total credit targets has been around 80 percent till 2009-10. The achievement level came down to around 70 percent in 2010-11. In absolute terms, total credit flow in agriculture has increased enormously from a very small level of ` 2174 crore in 2005-06 to ` 10667 crore in 2010-11, or about 5 times. However, taking into account the price rise and high demand of credit from the agricultural sector, the supply of credit is still found to be inadequate. The share of three principal sources in 2010-11 stood at – Commercial Banks (77.0 percent) RRB's (61.0 percent) and CCB (28.0 percent). In other words, the commercial banks are still the major source of agricultural credit in Bihar. Since the commercial banks and RRB's are reluctant to advance money to the agricultural sector, as they are used to seek collaterals for advances, it would have been ideal if the cooperative banks could play the lead role in agricultural sector. But even in 2010-11, their presence is limited to only 3-4 districts. Again, the level of achievements of cooperative banks against targets, are the lowest among three

45
sources of agricultural credit over the years and in 2010-11, targets were achieved for only for three districts. The estimated green fodder production from forests, permanent pastures, grazing lands and cultivated areas has declined from 13.77 lakh tonnes in 2000-2001 to 13.46 lakh tonnes in 2002-03. Dry fodder production (crop residue of cereals, pulses and oil seeds) over the same period declined from 195.23 lakh tonnes to 156.12 lakh tones. The area under pastures and grazing lands is extremely scarce (0.18 percent of the total geographic area). Gaya has the maximum area under pastures and grazing lands at 2192 ha. Of all rural households owning cattle and/or buffalo in Bihar, more than three-quarters are either landless or have less than 1 hectare of land. Sheep and goats tend to be even more concentrated among landless and marginal rural households. 5.3 Existing/On-going Initiatives
The objective of the agriculture policy in the state is to increase productivity of major crops so as to bring it close to national average. The Two strategies adopted for increasing agriculture production and productivity are research and extension i.e. from labs to farms. A range of initiatives is being taken up by the State to strengthen the agriculture and allied sectors. 5.3.1 Agriculture Road Map
With launch of Agriculture Road Map in 2008, Bihar embarked on an innovative approach for agriculture planning and implementation. The state government has constituted a Cabinet Committee on Agriculture with the Chief Minister as its Chairman. This is a landmark initiative. The Agriculture Cabinet comprises 18 Departments. The Agricultural Cabinet has constituted 14 expert committees for preparation of a road map for 2022. The draft report has been thoroughly deliberated by the Agricultural Cabinet and the farmers' suggestions have been gathered in a Kisan Samagam in February 2012. 5.3.2 Irrigation
From 2000-01 to 2008-09, the total irrigated area in Bihar has increased from 44.6 lakh hectares to 49.20 hectares. This is only a 10 percent increase in total irrigated area over a period of eight years, which is relatively low considering the fact that water resources are abundant in the State. There is also a large potential for exploration of ground water resources through extensive use of pump sets. However, recurring power shortage in the state has meant that pump sets depend largely on the use of diesel, which is much costlier, and cost effectiveness of agriculture operations gets reduced. The present state government has been taking several initiatives to enhance the total irrigated area in the state, and the major thrust areas in the 11th FYP undertaken to enhance irrigation facilities in the state include the following: 1. The state government is trying to evolve a new mix of irrigation techniques. The mix
comprises pump sets, and normal and other micro-irrigation sources. 2. The ground water resources in the state have remained largely underutilized. To tap
the high potential existing in the ground water front for irrigation purposes, a new programme of Bihar Groundwater Irrigation Scheme (BIGWIS) has been introduced.
3. Under the watershed development programme, initiatives are being undertaken to improve water generating ponds and other devices of ground water regeneration to develop and utilize water utilization capacity in the state.
4. Bihar Shatabti Niji Nalkoop Yojana has been piloted in Samastipur and Nalanda districts. The subsidy is administered in a unique way where field functionaries of Department of Agriculture assure sinking of tube wells and, upon completion of work the subsidy is disbursed instantly in the village itself. This is proving a major success as the shackles of bank financing has been removed from the scheme.

46
5. There is a scheme of plantation of five lakh trees in eight districts of Bihar under agro-forestry schemes, which will potentially develop water utilization capacity.
6. For pulses, oil seeds and maize, Isopam plan is being carried out. For this, sprinkler sets and improved pipes are being distributed.
7. During the 10th FYP, outlay for the irrigation sector was only ` 3273.19 crore; however, in the Eleventh plan, there was around threefold increase in the outlay for irrigation sector. The figure went up to ` 8594.81 crore.
5.3.3 Agricultural Inputs Since there exists dearth of firms for the supply of certified seeds, the seed
replacement ratio (SRR) is often low in Bihar. The road map of agricultural development drawn by the Department of Agriculture puts special emphasis on the use of certified seeds. The major initiatives like Chief Ministers' Crash Seed Programme, 'seed village' programme (Beej Gram Yojana), provision of subsidy for the use of 'certified seed' by farmers, revival of hitherto dormant Bihar Rajya Beej Nigam (BRBN), strengthening of Bihar seed certification agency, multiplication of seeds by state farms have together immensely helped to raise agricultural productivity in Bihar. Recently, the technique of hybrid paddy cultivation has been disseminated under a new scheme of 'Mukhyamantri Tivra Beej Vistar Karyakram'. This has benefitted the farmers in the paddy zone. The SRR for major crops like rice, wheat, and maize have increased manifold in the state during the last 5 years. More importantly, the SRR has touched the scientific recommendation of 33 percent for self-pollinated crops. Alongside the use of improved seeds in agricultural operations, fertilizer in proper quantity is also very important for enhancement of agricultural productivity. The consumption of fertilizer is steadily increasing in the recent years. The total consumption of fertilizer, which was 32.25 lakh tonnes in 2006-07 has increased to 39.08 lakh tonnes in 2009-10, registering an increase of 21.1 percent over three years. In 2010-11, the consumption rose to 40.36 lakh tonnes, again a 3.2 percent increase over 2009-10. This rising trend emphasises that the farmers are willing to adopt new technology in agriculture. Per hectare consumption went up to 183.4 kgs/hectares in 2010-11 from a level of 181.1 kgs/hectare in 2009-10. There have been efforts on the part of the farmers to rationalise the use of fertilizer so that the bias towards the use of nitrogenous fertilizer is reduced. In the last 3-4 years, the use of phosphatic and potassic fertilizer has shown higher increase, compared to the growth in the use of nitrogenous fertilizers. It is to be noted that the wider availability of soil test services at local points and massive contact programme associated with extension services has led to the awareness of balanced use of chemical fertilizer. Besides NPK, the state government has made conscious efforts to promote use of micronutrients, which can enhance the productivity level of different crops at much greater pace. Besides providing subsidy available for centrally sponsored schemes, the state government is also providing additional subsidy for the use of micronutrients from its own resources. This has evoked positive response from the farmers and would have a long-term impact on the sustainability of soil fertility for crop production. 5.3.4 Extension Services
With induction of subject matter specialists at sub-block level and 'Kisan Salahakar' at the Panchayat level, the outreach of hitherto dormant extension services have tremendously increased in recent years. The extension service in the state, prior to the beginning of the 11th FYP, had reached a very low level. The state government has taken several initiatives in recent years to make farming more economically productive and rewarding to farmers. It has taken pains to transfer knowledge of agricultural institutions to farmer's doorstep so that they can optimally use that knowledge. A massive training programme of farmers through 'Kisan Pathshala' has gained prominence in recent years. A series of 'Kisan Vikash Shibir', a programme for interaction between agricultural scientists and farmers is providing a platform

47
for technology transfer. The camps are organised at each Panchayat all over the state. Kharif and Rabi Mahotsavs are being organised at block level before onset of the crop season. Further, 'Kisan Melas' are organised every month at the district level. This is attracting a large number of farmers and public representatives towards agricultural development schemes. The major innovations involve distribution of all inputs and provision of subsidy in these camps. The farmers may purchase inputs like seed, biofertiliser, or farm implements of their choice. This has assured timeliness of supply of inputs to the farmers. One of the major initiatives in extension services is to arrange for Minikit demonstrations at the Panchayat or village level. The Minikit Programme covers a number of crops grown in kharif, Rabi, and garma seasons. For rabi crops, demonstrations are made for wheat, maize and pulses (masoor, pea, gram) and rai/tori, rajmah. Like kharif, the number of demonstrations for rabi crops also showed an increase. 5.3.5 Farm Mechanization
Productivity in agriculture and the consequent rate of return of agricultural operations are influenced by labour use and capital intensity in the field operations. The optimum level of mechanisation, without major displacement of family labour, in farm activity helps in the timely completion of farming operation. There is, therefore, a high degree of productivity enhancement through proper farm mechanisation. Through mechanisation, drudgery associated with traditional farming operations also get lessened. It reduces per hectare cost of cultivation and promotes quality of agricultural production. Under the agricultural 'Road Map' of the present state government, farm mechanization stands apart as a major thrust programme, as a part of modernization of agriculture in Bihar. The state government provides subsidy to farmers over and above the subsidy admissible under the centrally sponsored scheme. Harvesters, threshers, spraying modules, winnowing machines are very common in rural areas which were not so in earlier years. The availability of subsidy has promoted the acquisition of new equipment by farmers. There is also an effort by the state government to help the farmers to procure pump-sets through provision of subsidy. 5.3.6 Organic Farming
The state has started a new programme for promotion of sustainable farming practices. The total project cost envisaged for 5 years is ` 255 crore. Vermi compost production by farmers has been made demand-based with 50 percent subsidy for vermi compost units. Commercial units of vermi compost with annual production of 3000 tonnes are also subsidized. The subsidy on vermi compost purchase is allowed for the first time in the state. Besides vermi compost, bio-fertilizers, viz., Rhizobium, Azotobacter, Phosphate Solubilising Bacteria, Blue Green Algae and Mycorrhiza are promoted on a large scale. The seed producers are given free kits of the appropriate bio-fertilizers. More than three lakh farmers have benefited in the programme during rabi season. 5.3.7 Horticultural Development
Bihar is one of the largest producers of fruit and vegetable in the country. It has been enunciated that about a crore of quality planting material of fruit crop will be produced and distributed by the state agriculture university in the next 5 years. One horticulture crop has been identified for each district, depending on the climate and suitability of the crop in the district. A cluster of crop fields is likely to be developed in the district. This, in turn, will act as a backdrop of an agro-based industry for the district. The state government also provides subsidy for cultivation and rejuvenation of horticulture crops. The cultivation of tissue culture banana has been widely promoted. The establishment of 'papaya gaon', 'flower gaon', etc. would have substantial impact on income for a large number of farmers. With recent efforts on the part of the state government to develop road and marketing infrastructure, the vegetable producers gained much in Bihar. During 2010-11, the WDC has started retail

48
vending of packaged vegetables throughout the state. This would enable the farmers to obtain good procurement price, offered by the Corporation. Simultaneously, the programme would also create job opportunities for retail vendors throughout the state. 5.3.8 Interest Subsidy
The state government has sanctioned interest subsidy on crop loan. This will help farmers to get crop loan on 4 percent interest. The scheme will be implemented through the National Bank for Rural and Agricultural Development (NABARD). This will lead to increased flow of institutional credit to the farmers. 5.3.9 Initiatives in Kharif and Rabi
Several new initiatives have been launched during kharif 2011, which has given a new dimension to state agriculture. The cultivation of green manure crop (Dhaincha) was promoted on a large scale. Farmers were given dhaincha seed free of cost, and an area of 9.25 lakh acres was covered by the crop. This will have a tremendous impact on the soil fertility in the state, reducing dependence on chemical fertilizers. Two major initiatives were initiated for increasing rice productivity in the state — first, promotion of system of rice intensification (SRI) technique which covered 8.36 lakh acres and, secondly, introduction of hybrid varieties of rice in 10.13 lakh acre. These interventions have resulted into record rice production in the state. As per the second advance estimate, the state is poised for record kharif production this year, with substantial increase over the previous best. At the state level, the rice production is estimated this kharif season to be 67.55 lakh tonnes, which is 9.85 lakh tonnes more than the previous best in 2008-09 at 56.00 lakh tonnes. 5.3.10 Agricultural Credit
The Kisan Credit Card (KCC) has been one of the most important instrument through which credit is being provided to farmers for agricultural operations. The scheme was introduced in 1999 and it allowed for a maximum credit of to ` 50,000 to farmers to procure agricultural inputs. In 2009 - 10, an estimated number of 13.40 lakh farmers got benefits through the facility of KCC. Up to 2008-09, the achievement level of KCC has been around 60 percent of the targets. However, since then, there has been improvement and the achievement level was as high as 89.30 percent in 2009-10. In 2010-11, the achievement level was 70.14 percent. 5.3.11 Initiatives in Animal Husbandry and Fisheries
The state government has taken a number of initiatives for the development of livestock and dairy sector of the economy is recent times. These initiatives include breed upgradation, health and nutrition, insurance scheme for milch animals, as well as marketing of animal husbandry and dairy products. The state government has several schemes like treatment of animals, sterilization, artificial insemination, immunization and free distribution of fodder seeds for the promotion of the animal husbandry sector. For Bihar as a whole, 35.73 lakh animals were treated in 2010-11. In addition, 221.73 lakh animals were immunized. The free distribution of fodder seeds was substantial at 4410.69 quintals in 2010-11. These services, however, are not uniform among the districts. The state government has recently sanctioned 20 ambulatory vans equipped with latest technology and veterinary medicines and tools, for 20 mobile veterinary hospitals. The state government has established silos at places at Patna, Munger, Bhagalpur, Saharsa, Purnea, Muzaffarpur, Darbhanga, Chhapra, and Banka for storage of liquid nitrogen for artificial insemination. It has also taken steps to revive all the defunct Artificial Insemination centres. Presently, a total numbers of 950 centres are working for artificial insemination. The progress of artificial insemination programme has been very substantial in Bihar. In 2009-10, only 9.90 lakh animals were artificially inseminated. In 2010-11, the achievement level significantly increased and around 19.48 lakh animals were covered. The state government has developed resources for upgradation of

49
species so as to enhance the production of milk and milk products at a faster rate. The state government has taken positive initiative for the development of fisheries sector in general and for the betterment of fish farmers in particular. A provision of easy credit facilities through Primary Agricultural Cooperative Societies (PACS) and extension services in the form of education and training to fish farmers have been important landmarks in the development of the sector. Recently, a fisheries insurance scheme has been introduced for fish farmers. For this scheme, a premium of ` 3200 per hectare have been fixed. The beneficiary has to pay ` 1600 per hectare and the rest Rs 1600 will be borne by the state government. A memorandum of understanding has been signed with Oriental Insurance Company, a public sector unit, to launch this scheme. The schemes like distribution of fingerlings to fish farmers, distribution of loans for maintenance and renovation of private ponds for fish rearing and free housing for fisher folk have immensely benefited the fisher folk of the state. In 2010-11, a record number of 2762.3 lakh fish seeds were produced and distributed in the state. New schemes for stocking of reservoirs have been taken up in the state. Five reservoirs have been stocked with fingerlings financed by the National Fisheries Development Board. The required credit has been provided to the farmers for constructions of fish hatchery, having capacity of 8-10 million fry. Its unit cost is Rs. 15.00 lakh, on which there is a provision of 20 percent subsidy with a ceiling of Rs. 3.00 lakh. 5.4 Priorities
Bihar’s priorities have been identified in the State Agriculture Roadmap, which aims to trigger processes of development in agriculture and allied sector. Given the substantial yield gaps of most agricultural commodities on the one hand and low farmers’ income and widespread rural poverty on the other, and also taking into account the richness of natural resources and high level of peoples’ aspirations, a gradual approach for liberating the people of Bihar from twin traps of hunger and poverty will neither be economically sound not socially expedient. As such, the Agriculture Roadmap and the programmes/initiatives therein are meant to address these concerns; the focus of this road map is on farmers rather than farms. The proposed road map of agriculture, with defined goals and time frame gives a humanitarian dimension to agriculture apart from addressing the important question of food security. These programmes cover all aspects of agriculture, from inputs to marketing of final products. They fall into four major groups: Inputs, access, supply and quality; Transfer of technology and extension; Income generation schemes; and Marketing. The Roadmap will have six point objectives: Food security; Nutritional security; Rise in income levels of farmers; Generation of employment and reduction of migration of labourers; Inclusive base of agriculture development and comprehensive participation of women;
and Conservation of natural resources and sustainable development Under these will be detailed plans for seeds, horticulture planting materials, soil health management, crop protection (including for example, integrated pest management), farm mechanisation, integrated farming models, soil and water conservation in rain fed areas, networks of mini weather stations, micro-irrigation, strategies for risk management, and many other programmes and activities. Likewise, similar sub-sector roadmaps have been

50
developed for the animal husbandry, dairy, cooperatives, institutional finance, and fisheries sectors as part of the Agriculture Roadmap. In addition this, another key priority will be capacity building and institutional development. The proposed programme of action calls for rejuvenation of extension machinery also. Therefore, revamping of the Agriculture Department and capacity building of its personnel form an important part of the road map. Similarly ambitious market infrastructure programme also calls for an institutional mechanism to oversee developmental activities and for asset management. By repealing the Agriculture Produce Market Committee Act, Bihar has ushered in a new era of market reforms, which has no similar model elsewhere in the country. The road map recognizes that such a situation calls for a major programme of capacity building of both the farmers and governmental staff. The State’s agriculture development in the 12th FYP will emphasize on: (i) Broad based agriculture growth – benefits of raising productions and productivity will
be ensured to diverse crops, i.e., food grains (rice, wheat, durum wheat, maize, Madua), pulses, oilseeds, horticulture crops, cash crops like sugarcane, Jute, Paan and others through specific strategies;
(ii) Making agriculture gainful and raising incomes of farmers; stress will be on: a. Removing constraints in procurement and market linkages; b. Promoting cost effectiveness, reducing insecurities and expansion of processing
capacities; c. Encouraging sustainable agriculture development in the state by reducing
fluctuations and uncertainty in productions due to floods, droughts and water logging, and by promotion of environment friendly techniques like organic farming, improvement of soil health, reuse of wastes and by- products;
(iii) Rapid expansion in supply of inputs (seeds, mechanization, fertilizers, credit and others) and quality assurance will play a major role. Impetus to agriculture credit will be a major thrust area to meet essential requirements of farmers;
(iv) Substantial augmentation of warehousing and storage facility will be carried out for agriculture growth and food security. Marketing of agriculture produces will be promoted through involvement of multiple agencies and innovations in institutional structures. Rapid expansion in infrastructure will be ensured through increased investments;
(v) Triggering rapid growth in traditional agriculture systems will require institutional changes and realignments. Vastly expanded, strengthened, and modernized extension network would ensure benefits of broad based development to farmers of the entire state. To realize the goals the agriculture development plan must accompany establishment of strong information/data base systems and growth of education and research;
For Animal Husbandry and Dairy, the major thrust points will be the following: (i) Production and productivity will be raised through improved breed management.
Impetus will be given to augmentation of processing facilities (milk and milk products);
(ii) Rapid expansion of extension network up to the Panchayat level will be carried out. Government aims to act as facilitator for livestock entrepreneurship development in rural areas. Development plan will involve strengthening of veterinary and dairy services network; and
(iii) Establishment and strengthening of institutions for human resource development and promotion of education, training, and research will play a major role in the growth of the sector.

51
Development and management of fisheries will aim for a major jump in fish production and productivity by the end of the 12th FYP. The major thrust will be as follows: (iv) Infrastructure facilities will be expanded for availability of quality inputs. Institutional
strengthening will be carried out for improved extension services, training and skill development and infusing professional management practices.
5.5 Perceived Climate Impacts4 Rainfall during the monsoon season (June-September) is the key element of Bihar’s
climate and continues to be the primary source of water for the large rain fed agricultural regions in the State. Variability in monsoon related weather and climatic conditions is, therefore, regarded as the primary cause of spatial and temporal fluctuations in agricultural yields. The departure in minimum and maximum temperatures above or below the optimum value influences plant physiological conditions viz., respiration, water requirement, and growth, thereby affecting yields. Extreme weather conditions such as floods, droughts, heat and cold waves, flash floods, cyclones, hail storms, etc. are constant hazards for agricultural production. Even subtle fluctuations in weather conditions during critical phases of crop development have substantial impact on yields. Since large tracts of the cultivated land in Bihar is rain fed and agricultural production is heavily dependent on the monsoons, agriculture productivity is sensitive to climatic variability. Potential risks to the agricultural system from changing climatic conditions can be identified at multiple levels. Climatic variability directly impacts yields at crop level and also affects soil quality; water resources; brings in pests, diseases and weeds, etc. further aggravating the impact on the cropping system, thereby reducing the yield per hectare of land or per unit of livestock at the farm level. The adverse impact of climatic variability on agriculture production at farm level gets aggregated to the level of the food system in terms of food shortages and rising prices, which can also endanger food and livelihood security. At the crop level, in the short term, increase in carbon dioxide (CO2) concentration is likely to compensate the negative effect on yields due to increase in temperature, but as temperature increases further, it would result in yield losses. Most crop simulation studies have predicted a decrease in the yield of crops with an increase in temperature. Further, adverse temperature and moisture conditions affect the quality of food grains. Climate change is also likely to have significant effect on the quality of plantation and cash crops such as fruits, vegetables, tea, coffee, aromatic & medicinal plants, etc. Change in climate is likely to bring about a change in the population dynamics, growth and distribution of insects and pests thereby, upsetting crop-pest balance. Drought conditions would increase pathogen and insect survival rate due to change in plant nutrient level and decrease in plant defence system. These changes could lead to enormous crop losses in altered environment.
The impact of climate change resulting in warming, changes in precipitation patterns, increased frequency of extreme events, rise in sea level etc. would affect the water balance and water quality in different parts of the country. Changes in rainfall patterns can cause water shortages in some regions which, combined with thermal stress due to higher mean temperature, can adversely affect crops. Moreover, change in precipitation patterns and amounts, and variation in temperature may degrade soil quality, reduce soil moisture content, and affect microbial diversity, which in turn affect crop growth. An increase in temperature also leads to increased evapotranspiration, thereby lowering groundwater table and adversely affecting irrigation potential. At some places, increased surface temperature coupled with reduced rainfall may lead to accumulation of salts in upper soil layers. Impacts of climate
4 Adapted from the National Mission For Sustainable Agriculture: Strategies for Meeting the Challenges of Climate Change.
Department of Agriculture and Cooperation, Ministry Of Agriculture, New Delhi, August 2010.

52
change on livestock will be felt in the form of elevated body temperatures, increased respiration rates, decrease in feed intake, etc. Indirect impacts will be observed in the form of reduction in grazing land and water availability, decline in available cattle feed, emergence of new diseases, etc. Thermal or heat stress would impact animal production and profitability in dairying due to lower feed intake, milk production, and reproduction. Besides being susceptible to increased heat stress from climate change, livestock is also exposed to the risks associated with extreme events. Severe drought conditions are likely to affect livestock due to decline in feed and fodder availability and serious water shortages. The impact of climate change induced decline in pastoral land would further aggravate the severe constraints on livestock farming. Changes in the climate would also affect the fisheries sector in many ways. Climate change would induce changes in the abundance and distribution of exploited species. These changes would increase further with the degree of severity of extreme events, such as floods and storms, which in turn affect fishing operations and infrastructure. Climate change would also indirectly affect aquatic habitats (quantity and quality), ecosystem productivity and the distribution and abundance of aquatic competitors and predators/disease thereby affecting the livelihood and food security of fishing communities. It has already been observed that the breeding of Indian major carps as well as the distribution of important fish species and plankton has been affected due to changes in temperature and rainfall patterns over the catchments of the Ganga. 5.5.1 Wheat, Rice, Maize
Production of crop is greatly influenced by weather phenomena and therefore any change in climate will have major effect on crop yield and productivity. The temperature, air movement, solar radiation, humidity and soil moisture are major climatic factors influencing the crop phenology. The concentration of CO2 may be increased up to 607-755 ppm by 2070 in compare to the current level of 390 ppm (approximately). There is considerable change in spatial and temporal change in temperature and rainfall. The projected increase in temperature is less in Kharif season that that of in the Rabi.
Indian Summer Monsoon Rainfall (ISMR) during the monsoon season (June-September) is the key element of Bihar’s climate and continues to be the primary source of water for the large rain fed agricultural regions in the State. The variability of ISMR on spatial and temporal scale is the primary cause of agricultural yields. The departure of minimum and maximum temperatures from the normal influences plant physiological conditions viz., respiration, water requirement, and growth and finally affecting yields. Extreme weather conditions such as floods, droughts, heat and cold waves, flash floods, cyclones, hail storms, etc. in the state are continuously affecting agricultural production. Spatial and temporal changes in rainfall patterns can cause water shortages in some regions which, combined with thermal stress due to higher mean temperature, can adversely affect crops through degrading soil quality, reduce soil moisture content, and affect microbial diversity, which in turn affect crop growth. An increase in temperature also leads to increased evapotranspiration, thereby lowering groundwater table and adversely affecting irrigation potential. At some places, increased surface temperature coupled with reduced rainfall may lead to accumulation of salts in upper soil layers. In general, increase in Carbon Dioxide (CO2) concentration is likely to compensate the negative effect on yields due to increase in temperature, but as temperature increases further, it would result in yield losses. Most crop simulation studies have predicted a decrease in the yield of crops with an increase in temperature. Further, adverse temperature and moisture conditions affect the quality of food grains. Climate change is also likely to have significant effect on the quality of plantation and cash crops such as fruits, vegetables, tea, coffee, aromatic & medicinal plants, etc. Change in climate is likely to bring about a change in the population dynamics, growth and distribution

53
of insects and pests thereby, upsetting crop-pest balance. Drought conditions would increase pathogen and insect survival rate due to change in plant nutrient level and decrease in plant defence system. These changes could lead to enormous crop losses in altered environment.
In Bihar, under scenarios of increase in atmospheric CO2 concentration, the climate change impact on wheat and winter maize shows that simulated yield of wheat is possible to decrease in 2050s and 2080s by 3.6% and 14.1% respectively, for Pusa. At Madhepura, decline in yield is possible by 5%, 13% and 21% for during 2020s, 2050s and 2080s respectively. Patna and Sabour shows decrease in simulated yield around 40% for 2080s. Crop duration shows maximum decline at Madhepura by 26 days. Number of grains increased marginally for Pusa and Patna during 2020s; otherwise a decrease is noticed for other time periods from the baseline. The agroclimatic zones I and II showed lesser decline in the number of grains and more or less constant weight of grains than zone III. However, zone III shows decrease in both number and weight of grains during different time-periods, thus indicating suitability of North Bihar (zones I and II) for wheat cultivation. Simulated yield of winter maize showed an increase in the range of 8.4–18.2%, 14.1–25.4% and 23.6–76.7% during 2020s, 2050s and 2080s respectively. Maximum increase is observed in Sabour for all the three time-periods Maize with increased CO2 and consequent rise in temperature shows a decrease in duration and days to anthesis from the baseline. TDM, grain weight and grain number shows an increase from the baseline to 2080s. The decrease in duration is probably well compensated by increased growth rate with better temperature regimes resulting in increased number of grains and grain weight leading to overall increase in biomass. Increase in grain number and TDM is an indicator of increased net photosynthesis, as the net rate of photosynthesis is more in full sunlight and also photo-respiratory losses are almost negligible in case of C4 plants compared to C3 plants (Abdul Haris et. al. 2012). Table 15 Simulated impact of climate change on growth parameters of wheat Duration
(days) Maximum CGR (kg/ha/day)
Maximum LAI (kg/ha/day)
TDM (kg/ha)
No. of grains/ha
Weight of grains (g/1000 grains)
Pusa Baseline 123 257 3.66 13,796 114,699,833 37.306 2020s 117 249 3.54 13,197 116,578,283 37.471 2050s 108 246 3.34 12,106 107,897,132 37.7 2080s 100 273 3.05 11,238 96,575,358 37.7 Madhepura Baseline 111 284 3.58 13,510 136,776,467 35 2020s 100 293 3.49 12,394 120,584,333 38 2050s 91 290 3.39 11,178 107,761,030 38 2080s 85 272 3.16 10,455 98,064,733 38 Patna Baseline 97 134 2.88 5,399 37,508,229 36 2020s 92 130 2.93 5,186 42,182,533 38 2050s 87 128 2.71 4,526 37,961,153 34 2080s 79 122 2.26 3,893 29,137,213 30 Sabour Baseline 107 229 3.41 10,883 108,409,826 33 2020s 100 209 3.30 9,742 92,359,979 34.6 2050s 92 197 3.08 8,570 84,163,695 31.2

54
2080s 86 188 2.83 7,642 71,424,974 29.8 Based on the Tmax, Tmin, drought and flood severity, available water capacity, population density, average yield, net shown area, cropping intensity, percentage area irrigated, livestock density and many others, a vulnerability index map is prepared which shows Kishanganj of Bihar is most vulnerable with vulnerability index of 4.687.
Fig.17 Indo-Gangetic Plaan vulnerability Map Based on the modelling study, it is found that wheat yield may decrease by 5-6 % in Bihar state due to change in maximum temperature alone by 2080s (Arvind Kumar et al. 2011). It is found Sarjoo-52 Rajshree, MTU-7029, Satyam, Rajendra Mahsuri-I and others are most suitable rice for direct dry seeding of rice with subsequent aerobic soil conditions avoiding water requirement during land preparation and reduces overall water demand Table 16 Simulated impact of climate change on growth parameters of maize Duration
(days) Post-anthesis duration
Maximum CGR (kg/ha/day)
Maximum LAI (kg/ha/day)
TDM (kg/ha)
Grain weight (g/100 grains)
No. of grains (grains/ha)
Pusa Baseline 157 26 216 2.58 13,544 114.3 34,108,353 2020s 152 26 223 2.62 13,582 115.6 36,404,873 2050s 143 25 244 2.58 13,475 114.3 38,772,077 2080s 135 26 284 2.52 14,262 122.8 39,685,550 Madhepura Baseline 159 28 238 2.77 15,555 120.1 39,556,007 2020s 154 27 249 2.80 15,639 121.7 41,386,080 2050s 145 27 291 2.81 15,608 121.2 43,266,460 2080s 135 27 340 2.53 16,392 124.3 44,248,780 Patna Baseline 150 22 351 4.79 16,556 90.8 43,590,337
Indo-Gangetic Plain Vulnerability Map (-7.35) – (-2.00) (-1.99) – (0.00½ 0.01 – 2.00 2-01 – 4.69

55
2020s 146 22 347 4.75 16,785 94.7 45,289,700 2050s 138 22 411 4.65 16,383 93.9 46,697,863 2080s 128 23 524 4.54 17,365 100.2 49,212,777 Sabour Baseline 150 21 195 2.56 11,468 82.34 29,869,011 2020s 145 21 201 2.66 11,720 84.63 31,253,789 2050s 137 22 237 265 11,604 86.25 35,699,926 2080s 130 23 246 2.56 12,597 101.5 37,796,805 5.5.2 Livestock and animal husbandry
Bihar is rich in livestock resources. The State has a livestock population of 42.90 million of which 25.47 million are Bovine, 1.06 million are Sheep, 1.78 million are Pigs and 14.52 million are Goat. There is an increase in the crossbred cattle in the state between 16th and 17th livestock census by 512.1% but there is a decrease of 30.4% in the indigenous cattle population during the same period. The overall cattle population has decreased by 25.3%. The buffaloes have increased by 20.5 %, sheep and goat has decreased by 45.7 % and 28.2 % respectively. Sheep, goat and pigs are being reared by farmers in the State in view of the low investment, reduced risk, capacity to use local feeds and easy management by family members. The total livestock in the state has decreased from 53.742 million to 42.990 million between 1997 and 2003 showing a decrease of 20%. Impacts of climate change on livestock will be felt in the form of elevated body temperatures, increased respiration rates, decrease in feed intake, etc. Indirect impacts will be observed in the form of reduction in grazing land and water availability, decline in available cattle feed, emergence of new diseases, etc. Thermal or heat stress would impact animal production and profitability in dairying due to lower feed intake, milk production, and reproduction. Besides being susceptible to increased heat stress from climate change, livestock is also exposed to the risks associated with extreme events. Severe drought conditions are likely to affect livestock due to decline in feed and fodder availability and serious water shortages. The impact of climate change induced decline in pastoral land would further aggravate the severe constraints on livestock farming. A rise of 2-6 °C due to global warming (time slices 2040-2069 and 2070-2099) projected to negatively impact growth, puberty and maturity of crossbreds and buffaloes and time to attain puberty of crossbreds and buffaloes will increase by one to two weeks due to their higher sensitivity to temperature than indigenous cattle. 5.5.3 Fisheries and aquaculture
Bihar is blessed with vast and varied fisheries and aquaculture resources. These resources are in the form of rivers, reservoirs, lakes, mauns, chaurs, irrigation canals, ponds and community tanks. However, despite such natural resources and fish as highly preferred food item, aquaculture and open water fisheries resource remain highly underutilized. It is high time for the state to make use of these resources for providing sustainable livelihoods to millions of poor rural communities. The major schemes taken up include production and supply of fish seed, development of Maun/Chaur besides centrally sponsored schemes for development of aquaculture and welfare of fishers. The total fish production in the state is about 2.66 lakh tones with average productivity of about 2.2 tones per ha per annum. However, the annual consumption of fish within the state is about 4.5 lakh tones. Bihar occupies third position in inland fish production (2.66 lakh tones) after West Bengal(9.88 lakh tones) and Andhra Pradesh (6.80 lakh tones) as in 2003-04. It contributes about 1.6 % of Bihar GDP. The state of Bihar is producing approximately 3.69 lakh tone of fish (during 2012-13) at a growth rate of 5.58% and contributing 4.5 % to the total fish production and 7.52% of Inland production of India ( 2000- 01 to 2010-11). With 60-65 % of the population

56
of Bihar eating fish (Bansil, 2011), the present fish production from the region provides 4.81 kg/capita of fish. To bridge the gap between requirement and availability of fishes, additional 3.85 lakh tonnes of fishes will be required. The State is endowed with rich aquatic and fisheries resources in the form of rivers, flood plains, wetlands (chaurs), ox-bow lakes (mauns), reservoirs, tanks and ponds (Anon 2008). Changes in the climate would also affect the fisheries sector in many ways. Climate change would also indirectly affect aquatic habitats (quantity and quality), ecosystem productivity, distribution and abundance of aquatic competitors and predators/disease thereby affecting the livelihood and food security of fishing communities. It has already been observed that the distribution of important fish species and plankton has been affected due to changes in temperature and rainfall patterns over the catchments of the Ganga. The fishes cannot maintain a constant body temperature like mammals and their body maintain the same temperature where they are living in. Fishes can live in very cold or very hot water and prefer to stay in the preferred range of temperature. In very cold water, their metabolism slows down and they become lethargic. In other side, if the surrounding water is relatively warm, their metabolism speeds up and they digest food more rapidly, grow more quickly, and eventually have more energy for reproduction. At the same time, fishes need more food and more oxygen to support this higher metabolism.
The average annual rainfall in Bihar for the last decade (2000-09) was estimated to be 1091.08 mms. In 2005 and 2009, the rainfall was 897.40 and 868.61 mm and severe drought situation was experienced. The vast water bodies in the state are experiencing drastic change in rainfall patters, rise in temperature, habitat destruction, overfishing, pollution etc. and thereby natural water bodies are increasingly threatened by climate change scenario. This will have direct implications on natural stock of fish populations as well as will have direct implication to livelihood option of fisher folk. The Gangetic River system (Uttar Pradesh, Bihar and West Bengal) contains about 265 species of freshwater fish. The water problems due to climate change in the Ganga River basin will increase and may be critical in terms of the ecosystem goods and services derived from the inland water bodies via fisheries. The breeding period of majority of fishes of the Ganga River system is June-August due to their dependency on seasonal floods. The monthly data of rainfall from the middle stretch of the river at Allahabad from 1979–2009 revealed that the percentage of total rainfall in the peak breeding period (May–August) declined by 7% whereas it increased by 4% in the post- breeding period when resorption of eggs of IMC sets in (M. K. Das et al., 2014)
Fig.18 Indices of spawn quality in middle stretch of the River Gagna from 1965-2009

57
5.5.4 Dairy The Present milk production of the state is 6516 thousand MT per year. It has been
targeted to take this production level up to 10035 Thousand MT per year by 2017 and to 14867 Thousand MT per year by 2022. The state has made significant strides in milk production between the periods from 2001-02 to 2005-06. Within this 5 year period milk production has increased by 92 per cent from 2632 thousand tonnes in 2001-02 to 5060 thousand tonnes in 2005-06. However, milk productivity level in the State is still very low. The increased milk production is needed to generate additional income to the marginal and landless households. Needless to say, dairy farming provides additional employment to the rural women workforce. Global warming is likely to lead to a loss of 1.6 million tones in milk production by 2020 and 15 million tons by 2050 in business as usual scenario. Based on temperature-humidity index (THI), the estimated annual loss in milk production at the all-India level by 2020 is valued at about Rs. 2661 crores at current prices. The economic losses may be highest in UP followed by Tamil Nadu, Rajasthan and West Bengal. Stressful THI with 20th or more daily THI-hrs (THI >84) for several weeks affects animal responses.
The economic losses may be significant in Bihar producing crossbred cows and buffaloes will be affected more by climate change. Under climate change scenario, increased number of stressful days with a change in temperatures and probable decline in availability of water may further impact animal productivity and health.
Fig.19 Annual THI load on livestock

58
5.5.5 Horticulture Fruits, vegetables, spices, honey, medicinal and aromatic plants occupy 15% of land
area but income generated from horticulture is much higher in Bihar. The state has a monopoly in production of litchi and makhana and continues to grow various fruits, vegetables, spices. Floriculture is getting more importance in the state. The summer monsoon rainfall distribution and a reasonably long and moderate winter allows for a variety of horticultural crops to be grown. The agro-climatic conditions are eminently suitable for whole range of vegetables; a variety of roots and tubers crops; perennial fruit crops like mango, litchi, guava, and limes; annual fruit crops like banana, pineapple and papaya and spices like ginger, turmeric and chilly, of late, floriculture is also showing excellent prospects. The state thus has possibilities for growing a diversified basket of vegetables, fruits, spices, tubers and flowers and medicinal and aromatic plants. Fruits Major fruits grown in the state are Mango, Litchi, Guava, Pineapple, Citrus, Banana, Papaya and Ber. Mango is grown all over the state, main growing areas are Muzaffarpur, Vaishali, Bhagalpur, Darbhanga, Madhubani, Sitamarhi, Patna and West Champaran. Litchi is mainly grown in Muzaffarpur, Vaishali, Sitamarhi, East and West Champaran and Darbhanga of North Bihar region. Pineapple is grown in north- eastern part of the state particularly in Kishanganj, Purnea, Araria, Katihar and Saharsa districts. Vegetables Bihar ranks 3rd in vegetable production in the country and produces a variety of traditional and non-traditional vegetables. Climatic and soil conditions of the state are congenial for production of different types of vegetables in the state. However, it lacks the basic infrastructure for storage, packaging, transportation, organized marketing system and post harvest handling facilities. Seed is the most important input which influences the output of vegetables crops. Vegetable production programme could be strengthened only if its seed production programme is strengthened. Thus, seed production programme should be strengthened to give a boost to vegetable production.
In future climate scenarios warming may ease the chilling conditions in these regions to favour potato productivity, while in other regions with cooler winter season the warming from current levels may prove detrimental. Based on INFOCROP-POTATO model (Singh et.al. 2005), It is found that potato production in 2020s and 2050s, will be decrease by 3% and 11% over Bihar. Spices A variety of spices are produced in Bihar. At present Bihar produces about 20 thousand tonnes of spices annually from an area of nearly 15, 081 ha. The important spices are Ginger, Turmeric, Chilly, Coriander, and Garlic. Chilli accounts for 47.6 percent of the area under spices and 39.5 per cent of the production followed by turmeric, which occupies 26.3 per cent of the area under spices and accounts for 36.4 per cent of the production in the state. 5.6 Strategies
The State has already developed a comprehensive Road Map covering agriculture and its allied sectors, and this has already been described in Section A in this report. The strategies
Fig20. THI load in baseline (left) and in 2030s scenario (right) during March

59
therein are well positioned to build substantive climate resilience, and as such, will form the core of the strategies under the BAPCC. Additionally, the State will undertake the several measures that will be complementary to Agriculture Road Map (or place additional/special emphasis on) and are specifically designed to enhance resilience. These will indicatively include (but not be restricted to): 1. Building institutional linkages under the BAPCC with and leveraging the National
Initiative on Climate Resilient Agriculture (NICRA) of the Indian Council on Agricultural Research (ICAR) and its participating organisations including Central Research Institute for Dry land Agriculture (CRIDA), Indian Agricultural Research Institute (IARI), Indian Institute of Horticultural Research (IIHR), Central Institute of Agricultural Engineering (CIAE), National Dairy Research Institute (NDRI), Central Marine Fisheries Research Institute (CMFRI), and other collaborating centres for technical advice, capacity building, and research support including State and sector specific vulnerability analyses, etc.;
2. Developing strategic plans at the agro-climatic zone level so that action plans are contextualized to regional scales in the areas of research and development, technology and practices, infrastructure and capacity building;
3. Collating, disseminating and follow best management practices including those for conserving resources and increase input use efficiency, bridging the yield gaps, and through customized interventions such as use of bio-technology to develop improved and diversified varieties of crops (including flood and drought tolerant varieties) and livestock, promoting efficient irrigation systems, demonstration of appropriate technology, capacity building and skill development;
4. Facilitating access to information and institutional support by expanding Automatic Weather Stations (AWS) networks to the Panchayat level and linking them to existing insurance mechanisms including Weather Based Crop Insurance Scheme (WBCIS) and National Agriculture Insurance Scheme (NAIS), scaling the returns at that level;
5. Implementing measures to minimize soil and water losses through resource conservation technologies such as agroforestry, integrated watershed management (by collaborating Directorate of Soil Conservation to implement the State’s Strategic Plan on Watershed Development 2011-2027), and water harvesting through check dams, renovation of existing ponds, etc. and building new ones;
6. Improving irrigation efficiency including developing processes for adopting/ promoting improved energy pricing and water pump efficiency;
7. Promoting adoption of solar and wind power systems for irrigation and other uses; 8. Strengthening weather services and early warning systems through enhanced agro-met
systems; 9. Integrated nutrient and pest management and promotion of conservation agriculture; and 10. Capacity building of stakeholders by synergizing traditional knowledge, agricultural
heritage and modern technology and research. Specific and additional emphasis will also be placed on the role of women in agriculture and its allied sectors – which is high in the State and likely to be most adversely affected by the impacts of climate change. In these contexts, responsibility for adaptation is likely to fall on their shoulders – including finding alternative ways to feed their family. However, statutory and/or customary laws often restrict women’s property and land rights and make it difficult for them to access credit and agricultural extension services, while also reducing their incentive to engage in environmentally sustainable farming practices and make long-term investments in land rehabilitation and soil quality. Despite these obstacles, recent evidence demonstrates that women who are already experiencing the effects of weather-related hazards

60
–such as erratic monsoon patterns, flooding and extended periods of drought – are developing effective coping strategies, which include adapting their farming practices. Therefore, efforts will be made to further recognize and support women’s role in adaptation, including promoting women’s involvement in decision-making processes and implementation. Also, given women's key role in agriculture, efforts will be especially made so that gender disaggregated data becomes available to enable gender specific planning and interventions. 5.7 Institutional Linkages and Stakeholders
A range of institutional linkages, convergence potential, and partnerships is envisaged under the BAPCC5. While these have largely been identified in the State Agriculture Roadmap, these will indicatively include State institutions such as the National Food Security Mission, Bihar; Bihar Rajya Beej Nigam Limited; Bihar Agricultural Management & Extension Training Institute (BAMETI); Bihar State Seed Certification Agency (BSSCA); the Bihar State Horticultural Mission; Animal & Fisheries Resources Department (and related institutions); State Water resources Department; State Directorate of Rice Development; State Energy Department; BREDA; State Forest Department; State Food and Consumer Protection Department, etc. Additional linkages with be built with National and State agricultural research institutes/centres and universities; Bihar Watershed Development Society; various international development agencies, private sector and financial institutions, civil society, community based organisations, and agriculture and allied sector dependant communities in general, are the primary stakeholders. 5.8 Linkages with the NAPCC
While the strategies outlined in the State Agricultural Roadmap and herein are consistent with the sectoral imperatives of the NAPCC and the National Mission For Sustainable Agriculture under it, the State will also take specific care to ensure that specific action plans developed under the BAPCC are also consistent with the same. The strategies under the agriculture and allied sectors under the BAPCC also additionally have linkages with the National Mission on Water, National Mission for a Green India, National Mission for Enhanced Energy Efficiency, National Solar Mission, and the National Mission on Strategic Knowledge on Climate. 5.9 Sectoral Action Plan and Budgets under the BAPCC
See Part C, Action Plans and Budgets
5 This is not meant to be an exhaustive list; rather, it gives some examples of possible linkages under the BAPCC.
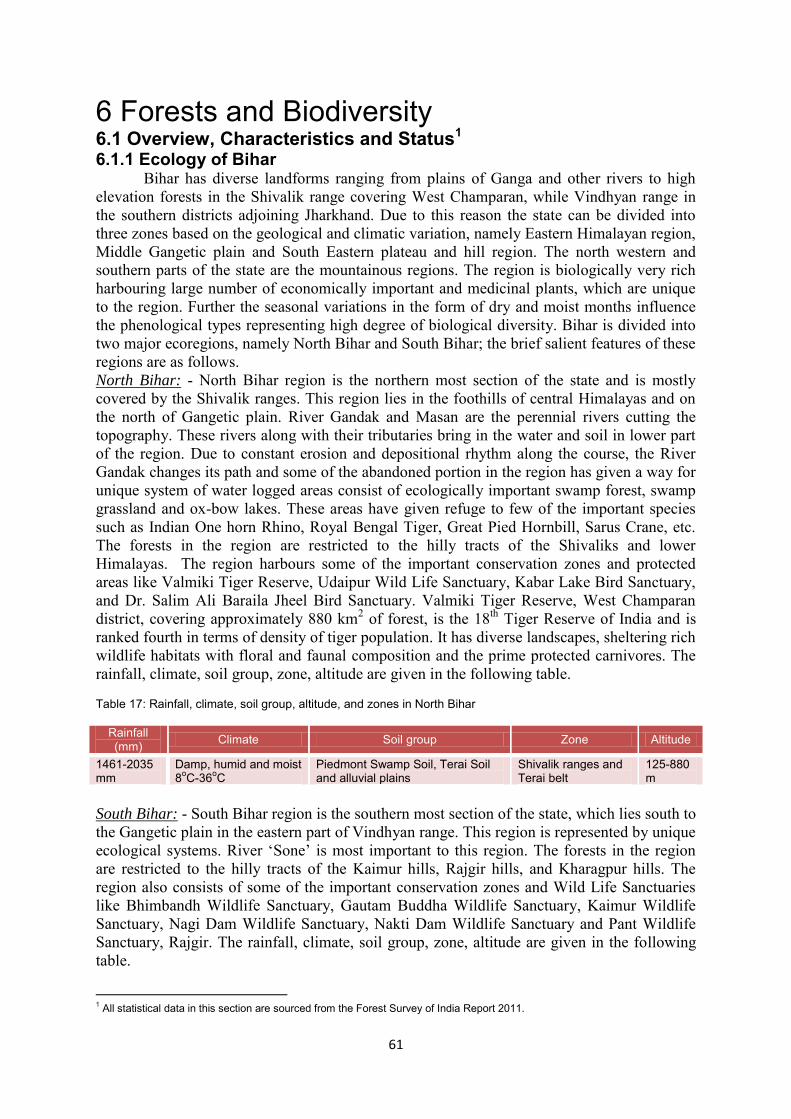
61
6 Forests and Biodiversity 6.1 Overview, Characteristics and Status1 6.1.1 Ecology of Bihar
Bihar has diverse landforms ranging from plains of Ganga and other rivers to high elevation forests in the Shivalik range covering West Champaran, while Vindhyan range in the southern districts adjoining Jharkhand. Due to this reason the state can be divided into three zones based on the geological and climatic variation, namely Eastern Himalayan region, Middle Gangetic plain and South Eastern plateau and hill region. The north western and southern parts of the state are the mountainous regions. The region is biologically very rich harbouring large number of economically important and medicinal plants, which are unique to the region. Further the seasonal variations in the form of dry and moist months influence the phenological types representing high degree of biological diversity. Bihar is divided into two major ecoregions, namely North Bihar and South Bihar; the brief salient features of these regions are as follows. North Bihar: - North Bihar region is the northern most section of the state and is mostly covered by the Shivalik ranges. This region lies in the foothills of central Himalayas and on the north of Gangetic plain. River Gandak and Masan are the perennial rivers cutting the topography. These rivers along with their tributaries bring in the water and soil in lower part of the region. Due to constant erosion and depositional rhythm along the course, the River Gandak changes its path and some of the abandoned portion in the region has given a way for unique system of water logged areas consist of ecologically important swamp forest, swamp grassland and ox-bow lakes. These areas have given refuge to few of the important species such as Indian One horn Rhino, Royal Bengal Tiger, Great Pied Hornbill, Sarus Crane, etc. The forests in the region are restricted to the hilly tracts of the Shivaliks and lower Himalayas. The region harbours some of the important conservation zones and protected areas like Valmiki Tiger Reserve, Udaipur Wild Life Sanctuary, Kabar Lake Bird Sanctuary, and Dr. Salim Ali Baraila Jheel Bird Sanctuary. Valmiki Tiger Reserve, West Champaran district, covering approximately 880 km2 of forest, is the 18th Tiger Reserve of India and is ranked fourth in terms of density of tiger population. It has diverse landscapes, sheltering rich wildlife habitats with floral and faunal composition and the prime protected carnivores. The rainfall, climate, soil group, zone, altitude are given in the following table. Table 17: Rainfall, climate, soil group, altitude, and zones in North Bihar
Rainfall (mm) Climate Soil group Zone Altitude
1461-2035 mm
Damp, humid and moist 8oC-36oC
Piedmont Swamp Soil, Terai Soil and alluvial plains
Shivalik ranges and Terai belt
125-880 m
South Bihar: - South Bihar region is the southern most section of the state, which lies south to the Gangetic plain in the eastern part of Vindhyan range. This region is represented by unique ecological systems. River ‘Sone’ is most important to this region. The forests in the region are restricted to the hilly tracts of the Kaimur hills, Rajgir hills, and Kharagpur hills. The region also consists of some of the important conservation zones and Wild Life Sanctuaries like Bhimbandh Wildlife Sanctuary, Gautam Buddha Wildlife Sanctuary, Kaimur Wildlife Sanctuary, Nagi Dam Wildlife Sanctuary, Nakti Dam Wildlife Sanctuary and Pant Wildlife Sanctuary, Rajgir. The rainfall, climate, soil group, zone, altitude are given in the following table.
1 All statistical data in this section are sourced from the Forest Survey of India Report 2011.

62
Table 1: Rainfall, climate, soil group, altitude, and zones in South Bihar
Rainfall (mm) Climate Soil group Zone Altitude
1000-1100 mm
Hot and dry with Average Temperature 40oC
Gangetic Alluvium, sandy loam
Gangetic plain and Eastern Vindhyan range
300-500 m
6.1.2 General Description of Vegetation of Bihar Vegetation of the state is classified under climatic, serial and edaphic types. The
climatic forest types are broadly classified into dry deciduous and moist deciduous types. Besides the deciduous forest, the vegetation types also include Sal, gregarious forests, bamboo forests, canebrakes, and grasslands, covering relatively less area. Sal mixed dry deciduous forests (northern dry mixed deciduous forests) occupy major proportion under natural vegetation cover and predominantly found in Kaimur, Rohtas, Aurangabad, Gaya, Nalanda, Nawada, Jamui, Banka and Munger districts. Dry deciduous forests are found in both, the plains and the peninsular region in the southern districts. Sal mixed moist deciduous forests (northern moist Sal bearing forest) are distributed mainly in West Champaran and partly in the valleys of Kaimur, Rohtas, Aurangabad, Gaya, Nalanda, Nawada, Jamui, Banka and Munger. Dry Siwalik Sal forests are mainly distributed in the Shivaliks range in the West Champaran district. Moist mixed deciduous forests (West Gangetic moist mixed deciduous forest) occur mostly in West Champaran district, also in the valleys in the valleys of south Bihar hills. Canebrakes (tropical seasonal swamp forests) are predominantly found in the West Champaran district.

63
Table 19: Dominant tree/plant species
Forest Type Dominant Species Moist deciduous Shorea robusta Gaertn.f; Mallotus philippensis (Lam.) Muell. -Arg.; Terminalia
elliptica Willd; Syzygium cumini (L.) Skeels; Haldina cordifolia (Roxb.) Ridsd; Buchanania lanzan Sprengs; Lannea coromandelica (Houtt.) Merrill; Acacia catechu (L.f.) Wild; Terminalia bellirica (Gaertn.) Roxb; and Litsea monopetala (Roxb.) Pers.
Dry Siwalik Sal Shorea robusta Gaertn. f.; Terminalia crenulata Roth; Litsea monopetala (Roxb.) Pers.; Lannea coromandelica (Houtt.) Merrill; Holarrhena antidysenterica (Heyne ex Roth) Wall .ex DC; Lagerstroemia parviflora Roxb; Grewia tillifolia Wahl; Garuga pinnata Roxb; Acacia catechu (L.f.) Willd; and Terminalia bellirica (Gaertn.) Roxb
Sal mixed dry deciduous Shorea robusta Gaertn.f; Madhuca indica Gmelin; Buchanania latifolia Roxb; Lannea coromandelica (Houtt.) Merrill; Terminalia crenulata Roth; Diospyros melanoxylon Roxb; Aegle marmelos (L.) Corr.; Anogeissus latifolia (Roxb. Ex DC.) Guillemin & Perottet; Acacia catechu (L.f.) Wild; and Lagerstroemia parviflora Roxb.
Sal mixed moist deciduous
Shorea robusta Gaertn. f.; Terminalia crenulata Roth; Lannea coromandelica (Houtt.) Merrill; Syzygium cumini (L.) Skeels; Mallotus philippensis (Lam.) Mull. -Arg.; Litsea monopetala (Roxb.) Pers.; Bambusa arundinacea (Retz.) Wild; Lagerstroemia parviflora Roxb; Un identified-60; and Holarrhena antidysenterica (Heyne ex Roth) Wall .ex DC.
Dry Deciduous Madhuca indica Gmelin; Lennea coromandelica (Houtt.) Merrill; Diospyros melanoxylon Roxb; Shorea robusta Gaertn. f.; Anogeissus latifolia (Roxb. Ex DC.) Guillemin & Wall. Ex DC; Lagerstroemia parviflora Roxb; Buchanania latifolia Roxb; Holarrhena antidysenterica (Heyne ex Roth) Wall .ex DC; Aegle marmelos (L.) Corr.; and Cassia fistula L.
Tropical seasonal swamp Syzygium cumini (L.) Skeels; Mallotus philippensis (Lam.) Mull. -Arg.; Trewia nudiflora L.; Ficus hispida L.f.; Drypetes roxburghii (Wall. Hurusawa); Dalbergia sissoo Roxb. Ex DC; Grewia tillifolia Wahl; Lennea coromandelica (Houtt.) Merrill; Streblus asper Lour; and Ficus racemosa L.
The highest number of species in Bihar State has been recorded for dry deciduous forests with 305 species including two parasites, followed by moist deciduous type having 184 species. Whereas the Sal mixed dry deciduous, Sal mixed moist deciduous, Dry Siwalik Sal forest and tropical seasonal swamp forest types have 138, 68, 180 and 80 species, respectively. 6.1.3 Recorded Forest Area, Classification, and Forest Cover
The recorded forest area of the state is 6,473 km2, which is 6.87 percent of its geographical area. Reserved Forests constitute 10.70 percent, Protected Forests 89.28 percent and Unclassed Forests 0.02 percent of the total forest area. The forest cover in the state, based on interpretation of satellite data of November 2008 - January 2009, is 6845 km2, which is
Figure 21: Bihar’s forest cover

64
7.27 percent of the state’s geographical area. In terms of forest canopy density classes, the state has 231 km2 very dense forests, 3280 km2 moderately dense forest, and 3334 km2 open forest. The forest cover of the state is shown in Figure 11 below.
District-wise forest cover in different canopy density classes along with the changes compared to 2009 assessment and scrub are given in Table 17.
Table 20: District-wise forest cover in the state (Km2)
S. No. District Geographical
area Very dense
forest Mod. Dense
forest Open forest Scrub Total
1 Araria 2830 0 16 74 0 90
2 Aurangabad 3305 0 54 97 13 164
3 Banka 3022 0 111 110 12 233
4 Begusarai 1918 0 20 23 0 43
5 Bhabhua 3381 0 555 507 20 1082
6 Bhagalpur 2567 0 29 13 0 42
7 Bhoipur 2390 0 16 3 0 19
8 Buxar 1708 0 2 1 0 3
9 Darbhanga 2279 0 41 144 0 185
10 Gaya 4976 0 124 506 46 676
11 Gopalganj 2033 0 2 2 0 4
12 Jamui 3107 0 383 249 2 634
13 Jahanabad (including Arwal district)
1569 0 2 1 5 8
14 Katihar 3057 0 18 44 0 62
15 Khagaria 1486 0 2 6 0 8
16 Kishanganj 1884 0 26 49 0 75
17 Lakhisarai 1356 0 180 14 2 196
18 Madhepura 1788 0 6 20 0 26
19 Madhubani 3501 0 18 118 0 136
20 Munger 1347 0 251 14 7 272
21 Muzaffarpur 3172 0 82 74 0 156
22 Nalanda 2367 0 5 23 6 34
23 Nawada 2494 0 187 323 10 520
24 Pashchimi Champaran
5228 231 520 162 0 913
25 Patna 3202 0 13 3 0 16
26 Purbi Champaran 3968 0 76 88 0 164
27 Purnea 3229 0 6 41 0 47
28 Rohtas 3832 0 321 385 11 717
29 Saharsa 1680 0 2 9 0 11
30 Samastipur 2904 0 39 18 0 57
31 Saran 2641 0 38 17 0 55
32 Sheikhpura 612 0 0 0 0 0
33 Seohar 572 0 2 17 0 19

65
S. No. District Geographical
area Very dense
forest Mod. Dense
forest Open forest Scrub Total
34 Sitamarhi 2071 0 18 64 0 82
35 Siwan 2219 0 1 1 0 2
36 Supaul 2432 0 8 93 0 101
37 Vaishali 2036 0 74 12 0 86
Total 94163 231 3248 3325 134 6938
As is evident from Table 18 below, there is a marginal increase of 41 km2 in forest cover of the state, which can be mainly attributed to enhanced plantation activities in and outside forests.
Table 21: Forest cover change matrix (area in Km2)
2009 Assessment 2011 Assessment
Total 2009 VDF MDF OF Scrub NF
Very Dense Forest 231 0 0 0 0 231 Moderately Dense Forest 0 3,239 5 0 4 3,248 Open Forest 0 6 3,312 4 3 3,325 Scrub 0 2 2 130 0 134 Non-Forest 0 33 15 0 87,177 87,225 Total2011 231 3,280 3,334 134 87,184 94,163
Net Change 0 32 9 0 -41
The change matrix given in Table 19 reveals that there has been no change in very dense forest whereas there is an increase of 32 km2 in the moderately dense forest and nine km2 in
open forest. Forest cover of the state in different altitude zones is given in Table
Fig.22 Forest type groups Table 22: Altitude zone-wise forest cover (area in Km2)
Altitude Very Dense Forest Moderately Dense Open Forest Total

66
viz. tropical wet evergreen, tropical moist deciduous, littoral & swamp forest and tropical dry deciduous forests. Percentage-wise distribution of forest cover in different forest type groups found in the state is given in the pie diagram above. Tree cover in the state has been estimated using TOF inventory data collected over a period of six years, i.e. 2004-10.The estimated tree cover in the state is 2,369 km2 which is 2.52 percent of the geographical area of the state. Seven districts of the state (Banka, Gaya, Gopalganj, Madhepura, Munger, Nalanda and Nawada) have been inventoried during this period. The forest and tree cover of the state is presented in Table 20. Table 23: Forest and tree cover Category Area % of Geographical Area Tree Cover 2,369 2.52 Forest Cover 6,845 7.27 Forest & Tree Cover 9,214 9.79 The growing stock in the recorded forest area has been estimated on the basis of the current forest cover map, forest type map and forest inventory data. For TOF, the same has been estimated using TOFinventorydata. It is presented in the Table 21 below. Table 24: Growing Stock (million cum) Forest TOF Total 35.186 47.195 82.381 The extent of bamboo bearing area in the forests of the state is 739 km2. Density-wise details, number of culms by soundness and equivalent green weight are given in following table. Table 25: Bamboo bearing area by density in recorded forest area (Area in km2) Recorded Forest Area
Pure Bamboo
Dense bamboo
Scattered bamboo
Clumps hacked
Bamboo regeneration
No bamboo
6,473 1 239 393 75 31 5,734 6.1.4 Protected Areas There is 1 National Park and 12 Wildlife Sanctuaries covering an area of 0.32 million ha, which constitutes 3.38 percent of the total geographical area of the state. The lone tiger reserve of the state, viz. Valmiki Tiger Reserve covers an area of 84,000 ha. Kabar, situated in Begusarai district with an area of 6,738 ha, is a wetland of national importance. Table 26 Protected areas in Bihar
Sr. No. Name District Legal
Status Date of
Notification Area (in Km2)
1 Valmiki National Park W. Champaran N.P. 2.8.89 335.6
2 Valmiki Vanya Prani Sanctuary W. Champaran S 4.5.76 880.78
3 Bhimbandh Sanctuary Monger S 27.5.76 681.99
4 Pant Vany Prani Sanctuary Nalanda S 20.5.78 36.84 5 Kaimur Sanctuary Rohtas S 25.7.79 1342
0·500m 228 3,140 3,203 6,571 500·1000m 3 140 131 274
Total 231 3,280 3,334 6,845

67
Sr. No. Name District Legal
Status Date of
Notification Area (in Km2)
6 Gautam Budha Bird Sanctuary Gaya S 14.9.71 259.5
7 Udaypur Vany Prani Sanctuary W. Champaran S 29.4.78 8.87
8 Nagi Dam Bird Sanctuary Jamui S 14.7.87 7.91
9 Nakti Dam Bird Sanctuary Jamui S 15.7.87 3.32 10 Vikaramshila Gangetic Dolphin Sanctuary Bhagalpur S 28.8.90 0.5 Km in length
11 Kanwar Jheel Bird Sanctuary Begusarai S 20.6.89 63.11 12 Baraila Jheel Salim ali Jhbba Sahni Bird
Sanctuary Vaishali
13 Kusheshwar Sthan Bird Sanctuary Darbhanga 6.1.5 Salient Features of Bihar’s Forests
The hill ranges at Rhotas, Kaimur, and Bhabhua have good quality Sal gregarious forest, whereas the deep valleys provide habitat for dense moist deciduous forests. The forest along the periphery of the hill range are mostly open to degradation due to constant and anthropogenic pressure, however, the hill tops are relatively in better condition in the places with steep slope and rocky terrain. The forests in Gaya, Aurangabad, and Nawada owing to their small areas are most into poor state of tree density. The Sal mixed dry deciduous forest range at Munger-Lakhisarai-Jamui is one such forest which is in better condition for both diversity and density, comprising of well grown trees mainly of Shorea robusta and Terminalia elliptica. The ground vegetation is also quite diverse. In North Champaran the high Shivaliks range provides a good habitat for the wide range of flora and fauna. The old bamboo plantation in the Govardhana range is very well established and provides ideal habitat for the Tiger in the region. The condition of the dry Siwalik Sal forest is such that tree trunks with huge diameter are quite frequent. The loss of forest every year due to change in the path of river Gandak is considered as one of the most crucial threats to the forest in the region. This change in the path has been attributed to the manoeuvring to the banks of river Gandak along the Indo-Nepal border. The construction of railway line near the river Gandak has lead to the formation of vast area of wetlands at Madanpur. These wetlands have lead to replacement of tree species by tall grasses like Saccharum bengalense Retz. Saccharum spontaneum L. and Phragmites karka (Retz.) Trin ex Steudel. Due to formation of this new habitat, variety of migratory and resident avifauna, Indian one-horned Rhinos have started inhabiting the area formed. The swamp forest is dense and is difficult to access as they are flourished with prickly Beint (Salamus tennuis Roxb.). The oxbow lake at Udaipur provides a habitat for Syzygium Swamp forest along its periphery, which is very fragile as they are dependent on the hydrological regimes of this lake. 6.1.6 Wetlands
The State of Bihar is very rich in natural and man – made wetlands. Area estimates of various wetland categories for Bihar have been carried out using GIS layers of wetland boundary, water-spread, aquatic vegetation and turbidity and many other analyses have been carried out; these have been published in the National Wetlands Atlas of India, Bihar Section, by the Space Applications Centre, Indian Space Research Organisation. Total 4416 wetlands have been mapped at 1:50,000 scale in the state. In addition, 17582 wetlands (smaller than 2.25 ha) have also been identified. Total wetland area estimated is 403209 ha that is around 4.4 percent of the geographic area. The major wetland types are river/stream accounting for about 74 percent of the wetlands (298408 ha), natural waterlogged (34878 ha) lakes/ponds (20281 ha), and ox-bow lakes/cut-off meanders (16172 ha). The inland natural dominate the wetlands in Bihar, which comprise about 92 percent of the total wetland extent while the man-made accounts for about 3.5 percent. However, the small wetlands (< 2.5 ha) accounts for about 4.5 percent assuming that each is of one ha. Analysis of wetland status in terms of open water shows that out of the total wetland area the extent of open water is 58 percent in post-monsoon and 38 percent in pre-monsoon. There is a significant reduction in the extent of open water

68
(about 34 percent) from post-monsoon (224655 ha) to 148382 ha in pre-monsoon. It is reflected in all the wetland types except reservoir/barrage (Table 24). Turbidity is observed to be dominantly low in turbidity in post-monsoon (132318 ha) out of 224655 ha of open water followed by moderate (75292 ha) and high turbidity (17045 ha). In case of pre-monsoon the scenario has drastically altered and the moderate turbidity (146269 ha) which accounted for about 98 percent and dominated the open water (148382 ha). The other turbidity levels like high (1797 ha) and low (317 ha) remained insignificant together accounting for about 2 percent of pre-monsoon open water extent. The aquatic vegetation in Bihar accounts for about 7 and 5 percent of total wetland area in post-monsoon (25179 ha) and pre-monsoon (17360 ha) respectively. Table 27: Area estimates of wetlands in Bihar
Sr. No. Wetland Category Number of
Wetlands
Total Wetland
area
% of wetland
area
Open Water
Post- monsoon
area
Pre- monsoon
area
Inland Wetlands - Natural
1 Lakes/Ponds 514 20281 5.03 11506 6345
2 Ox-bow lakes/ Cut-off meanders 989 16172 4.01 10130 5264
3 High altitude wetlands - - - - -
4 Riverine wetlands 200 2118 0.53 1664 777
5 Waterlogged 1300 34878 8.65 21185 9507
6 River/Stream 238 298408 74.01 168984 118481
Inland Wetlands -Man-made
7 Reservoirs/Barrages 90 8612 2.14 7587 6005
8 Tanks/Ponds 1067 4822 1.20 3363 1870
9 Waterlogged 18 336 0.08 236 133
10 Salt pans - - - - -
Sub-Total 4416 385627 95.64 224655 148382
Wetlands (<2.25 ha) 17582 17582 4.36 - -
Total 21998 403209 100.00 224655 148382
Wetlands in Bihar are also important economic resources, and the economy of many areas are dependent on these, in addition to being critically important ecosystems and habitats for a wide range of floral and faunal species, including large numbers of residential and migratory birds. Fig. 23: Wetlands areas of Bihar 6.2 Key Issues
The State has a meagre natural forest resource base, and little tree cover, and these are under very heavy biotic pressure. The key threats to forests in Bihar include extreme poverty and

69
overdependence of local population on depleted forest resources, uncontrolled livestock grazing, and recurrent droughts in South Bihar, and floods (and water logging) in North Bihar districts. Many of Bihar’s wetland areas too are in urgent need of conservation and protection, as these are important habit areas for a range of species, especially avifauna.All aquatic plants are good sources of organic fertilizer hence they will be well utilized as such in and around wetland. As it has been stated before, some aquatic plants are good sources of livestock feed or fish feed; some are valued as human food. Some of these plants may be employed for purifying water, polluted by agricultural, domestic or, industrial waste. Only a few aquatic plants are actually used and appreciated by man. Thus a huge amount of natural resources is wasted every year. 6.3 Existing/On-going Initiatives
Existing/on-going initiatives include work on rehabilitation of degraded forests, pollution control measures, development/improvement of infrastructure in forest areas such as roads, bridges, etc., wildlife conservation activities, development of the Valmiki Tiger Reserve and other wildlife sanctuaries, the Sanjay Gandhi Biological Park, and activities under the integrated forest protection scheme. Efforts are also underway to increase the tree cover in the State. 6.4 Priorities
Considering the limited forest resources in the State and the threats to these, there are several key priority areas. Proposed initiatives during the 12th FYP period are briefly outlined below:
As the area under forests cannot be increased it is proposed to increase tree cover in the state by plantation in non-forestlands. A robust social forestry program is being proposed to encourage farmers to plant trees on their lands. A pilot project for introducing Poplar in Vaishali district has yielded encouraging results and it will be replicated in 24 other districts of the state at an estimated cost of 260 crores during the 12th FYP period. To achieve 15 percent forest/tree cover Social Forestry and Agro Forestry as well as schemes under MNREGA need to be intensively and extensively implemented. Farm nurseries in the private sector need to be promoted and encouraged as the Environment and Forest Department cannot by itself fulfil the needs of the State.
The State has taken a very important decision to free 10 species of trees from transit rules, which will act as an incentive for the farmers to grow trees, as they will be freed from procedural hassles for disposing off their produce.
The rehabilitation and enrichment of these forests will be done with the cooperation of the local people through Joint Forest Management (JFM). JFM will be strengthened by doubling the number of Village Forest Management and Protection Committee (VFMPC) in the state.
Intensification of Forest Management Schemes during the 11th Plan has given a fillip to strengthening of infrastructure like communication, roads, free surveillance etc. in the forests. However, there is a need to change the mode of funding under the scheme. Currently the scheme is constrained by the guidelines of Ministry of Environment and Forests (MoEF) and each of the items of work needs the sanction of MoEF.
50 percent of forest area of the State is notified as Protected Areas (Sanctuaries and National Parks); management of these areas needs special emphasis and specialized approach. The State has taken up preparation of the management plans for these areas. These management plans will provide the necessary baseline date for finalizing the management practices to be adopted for wildlife and biodiversity conservation.
Protection mechanism of protected areas is being upgraded by providing more vehicles and communication systems. The firepower of staff engaged in protection, needs enhancement through provision of arms and requisite training to use them effectively. Protection of wildlife and its habitat will be done with the active participation of people through eco-development committees.
Man-animal conflict issues need redressal. The State has enhanced the compensation packages for damage by wild animals and for the first time has introduced a compensation package for crop damage. Relocation of habitations of Valmiki Tiger Project on lines of the recommendations of the Tiger task Force is desirable. Where this is not possible, an effective co-existence plan will be put in place.
Other priority areas will include:

70
6.4.1 Intensification of Forest Conservation Enhance soil moisture/water conservation efforts; Integrate watershed management/catchment area treatment schemes; Total ban on mining in and around natural forest areas/protected areas including ecologically
fragile areas; Livestock management in villages near the natural forests - phasing out unproductive cattle
folk by providing productive (better quality) cattle - incentivizing stall feeding to reduce/minimize grazing pressure on forests;
Undertaking studies on dependence of local communities on forests, especially for fuel wood and non-timber forest produce (NTFPs);
Provide alternative fuel resources to villagers near forests (LPG/fuel wood production incentives etc.) to reduce fuel wood dependence on forests, promoting the use of non-conventional energy resources;
Water harvesting and ground water recharging tanks and other rural development schemes in and around the villages near forests with focus on forest conservation objectives - involving the forest officials and Panchayat Raj institutions. (PRIs);
Including all above in forest Working Plans and making them legally binding on all; The sustainable development of wetlands depends on proper utilization, management and
conservation of diverse natural resources to ensure the fulfilment of human needs, that continue to do so far for the future generation without hampering the natural resources; and
Providing occupational rehabilitation to people around the protected areas by promoting eco-tourism and also utilizing their services in wildlife and biodiversity conservation efforts.
6.4.2 Greening in Other Areas (Outside Forests) Institutionalized plantation efforts - Road side, canal side, flood protection, embankments and
community lands to be strengthened; More nurseries for production of quality planting materials for agroforestry and farm forestry; Incentivize agro-forestry propagation and promotion through aggressive campaigning and
extension services; Linking isolated wetlands for effective drainage through rivers/ rivulets after proper research/
study of their habitat potentials (of aquatic and avian flora/ fauna); creation of green shelterbelts around wetlands with focus on avian habitat management; and scientific water & fisheries management through PRIs;
Survey and appraisal of flora and fauna in areas out of forests and wildlife management outside forest areas in active collaboration with PR institutions;
Evolving a "green code" with Urban/Rural Development/Industries Department providing for and regulating:
Development and Management of Parks, greening of roads in urban and semi urban areas; Industries, commercial establishments and housing schemes to have mandatory greening
tasks/ components; and Shelterbelt/green cover around drainage/sewer and treatment facilities (oxidation ponds etc.)
6.4.3 Strengthen Infrastructure for Implementation, Research Training, Monitoring and Enforcement
Forest Department and the State Pollution Control Board (SPCB) to be strengthened sufficiently to carryout the required tasks; and
Create a separate multi disciplinary facility/wing in the Environment and Forest Department for research and monitoring of climate change action plan and inter departmental co-ordination
6.5 Perceived Climate Impacts Existing pressures on the forest resources of Bihar have already been identified in Section A.
Climate change and its impacts are only likely to make the State’s meagre forest resources more vulnerable on account of possible shift of the species of forest ecosystems and also on account of increased occurrences of fire, pest /diseases, invasive species, change in species assemblage/forest

71
type, forest die-back and loss of biodiversity. It is also almost certain that forest dependant livelihoods may get severely affected, increasing the vulnerability of local communities in and around forests in the State. 6.6 Strategies
The overarching approach to the forests and biodiversity sector under the BAPCC will be to foster an integrated approach that treats forests and non-forest public lands as well as private lands simultaneously, while identifying and leveraging opportunities for mitigation and adaptation measures that enhance ecosystem goods and services, particularly carbon stocks, water, and meet biodiversity conservation and livelihood security needs at the unit/landscape or sub-landscape/watershed or sub-watershed levels. The BAPCC will focus on restoration of native bio-diverse species mix while at the same time enhancing carbon sink in forests and other ecosystems, while being informed by sensitivity to the ecological nature and value of resources, for instance avoiding dense plantations in grasslands which have other values like fodder, watershed etc. Habitats of animals and plants will be preserved, especially the mosaic of different vegetation types that maximize niches for diverse life forms. Research studies will be undertaken to categorise vulnerability and potential as criteria for intervention, and intervention priorities and selection of project areas/sub-landscapes/sub-watersheds will be formed formulated based on the analyses from these studies. While undertaking greening, its scope of greening will not be limited to just trees and plantations; rather, emphasis will be placed on restoration of ecosystems and habitat diversity e.g. grassland and pastures, wetlands and other critical ecosystems. It will not only strive to restore degraded forests, but would also contribute in protection/enhancement of forests with relatively dense forest cover. Drivers of degradation, such as firewood needs and livestock grazing will be addressed using inter sectoral convergence (e.g. livestock, forest, agriculture, rural development, energy etc.). The BAPCC will ensure a key role for local communities in project governance and implementation. Gram Sabha and its various committees/groups including JFMCs, etc. will be strengthened as institutions of decentralized forest governance, and capacity building for adaptive forest management and livelihood support activities e.g. community based NTFP enterprises will be accorded high priority. Key Interventions in different forest classes will include the following. Interventions in very dense forests: The entire 231 km2 of very dense forests are situated in the West Champaran district, and is part of the Valmiki Tiger Project. Forests of all ages and types of this class have remarkable capacity to sequester and store carbon. As such, interventions will focus on enhancing storage and reducing emissions by ensuring full stocking, maintaining health, reducing losses due to tree mortality, natural calamities, wildfires, insects and diseases, and stand density management by prudent tree removal. It is envisaged that this will provide a renewable source of products including timber, engineered composites, paper, and energy even as the stand continues to sequester carbon. These forests will continue to be protected rigorously against all threats.
Moderately dense forests: The 3248 Km2 of moderately dense forests which are situated mainly in Bhabhua, Banka, Gaya, Jamui, Lakhisarai, Munger, Nawada, West Champaran, Rohtas districts face a number of threats including recurring forest fire, invasive species, unregulated heavy grazing, local fuel wood cutting and head loading, and the condition of forest is degrading. It is proposed to improve the condition of these forest areas through:
• Better protection by increased strength of frontline staff and improved/enhanced infrastructure;
• Improved/enhanced fire management through prevention, detection and control measures as well as improvement of infrastructure;
• Regulated grazing; • Eradication of invasive species; • Soil and moisture conservation through watershed management; and • Gap plantation adopting indigenous species.
It is envisaged that sustainable management of these forests would lead to increase in stocking density, enhanced biomass and carbon sinks. Open forests: The open forests covering 3325 Km2 which are mainly in Araria, Arwal, Banka, Bhabhua, Gaya, Jamui, Nawada, West Champaran, East Champaran and Rohtas districts have a crown density between 10-40 percent. Most of these forestlands are on the fringe of villages and have

72
immense potential for meeting the fodder, fuel wood, water, small timber, and many other minor forest produce but are degrading due to immense biotic pressure. The Forest Department proposes to improve these forests through:
Large-scale gap plantation of indigenous species; Regeneration of rootstock; Soil, and moisture conservation, run off reduction, and integrated watershed
management; Consultation with communities and plantation of multi-purpose and fast growing
small timber yielding and other tree species to fulfil the requirement of local people such as fuel wood, fodder, NTFPs, agricultural implements, etc.;
Constitution/re-vitalisation of forest protection committees/JFMCs and capacity building of these to develop community conserved areas and similar local protection regimes;
Provision/promotion of efficient cook-stoves among local village households; and Development and deployment of other innovative incentive based conservation
measures involving local communities. Scrub Forests: At present the area of scrub forest in Bihar is 134 Km2, with canopy density of less than 10 percent. These forests are highly degraded due to heavy grazing and biotic pressure. People from nearby villages come to the forest areas and cut saplings for fuel wood and lop green tops of leafy bushes and saplings for fodder to fulfil their requirement. The Forest Department aims to improve the condition and productivity of these forests through:
Planting small timber producing plants/trees; Fodder, fuel wood producing plants; Developing grass land and pasture land for local people within the carrying capacity
of the scrub forest areas; Constitution/re-vitalisation of forest protection committees/JFMCs and capacity
building of these to develop community conserved areas and similar local protection regimes to encourage re-generation of trees;
Provision/promotion of efficient cook-stoves among local village households; and Development and deployment of other innovative incentive based conservation
measures involving local communities. Since the Valmiki Tiger Reserve and National Park support high value species and forms an important and contiguous forest corridor with the Royal Chitwan National Park in Nepal along its northern boundary, these are very high priority areas for protection and conservation work. Key interventions in the Valmiki Tiger Reserve and National Park will include (but not be limited to):
Improved protection through capacity building of relevant personnel, increased strength of frontline staff and improved/enhanced infrastructure including those for enhanced mobility, rapid response, and anti-poaching units;
Fencing of strategic areas to protect wildlife and control encroachments; Appropriate zonation of the National Park into multiple use categories including core,
buffer, tourism zones, etc.; Development/improvement/augmentation of visitor facilities and nature/wildlife
interpretation and promotion of the National Park and Tiger Reserve as a favoured wildlife and eco-tourism destination;
Control of invasive species including weeds; Treatment of catchment areas where required; and Exploring opportunities for transboundary conservation and cooperation with the
Royal Chitwan National Park in Nepal Since Bihar is exceptionally rich in wetlands and aquatic resources many of these areas are rich ecosystems with exceptionally high biodiversity, the Forest Department aims to intensify efforts to protect, maintain, and improve these wetland areas. Key interventions wetland areas to be taken up for interventions in the immediate short term would include the notified wetland areas including Kabar Lake Bird Sanctuary, Barailla Lake Bird Sanctuary, Kusheshwara Asthan Bird Sanctuary, Udaipur

73
Sanctuary, Nagi/Nakti, and Vikramshila Gangetic Dolphin Sanctuary. Interventions in these would include (but not be limited to):
Protection measures on a priority basis including fencing, training/capacity building of relevant personnel, increased strength of frontline staff and improved/enhanced infrastructure;
Treatment of catchment areas, support to compatible land use practices, water quality monitoring, and other measures infrastructure and equipment needed to ensure sustained water balance, optimal wetland hydrology, and all-season water availability;
Extensive community education/awareness building on the importance of these wetland areas and the need to protect/conserve them and formation of community conserved zones around these wetlands for enhanced protection; and
Capacity building for, promotion of, and supporting infrastructure provision/ enhancements for enterprise linked community conservation efforts such as eco-tourism, birding, and bird photography, especially during migratory bird seasons.
Over the medium to long-term, the Forest Department will identify and take up other non-notified areas for similar protection and conservation using community based approaches. Just over two million ha of lands -- 22.25 percent of the total geographical area in the State are not available for cultivation. A part from this, 129000 ha are fallow lands that can be treated and brought under plantation. Presently the percentage of forest and tree cover is 9.21 percent, implying that for increasing the forest and tree cover to 15 percent, 542000 ha of additional land has to be brought under tree cover or alternatively about 338 million trees/plants have to be raised outside forest area. The Forest Department aims to achieve this by undertaking a range of interventions including the following. Urban and peri-Urban areas (including institutional lands): Urban forests are an exciting opportunity to (a) mitigate climate change; (b) ameliorate air and dust pollution; (c) help in improving overall water regime; and (d) nurture bio-diversity in urban environments. As such, the Forest Department will leverage all opportunities for urban greening by various interventions categorizing urban forest in following broad categories:
Recorded or notified forest patches: In urban areas where large or medium forest patches are available, it will be notified as protected forest and fenced;
Open spaces/green spaces like parks/wood lots: Open Spaces/Green spaces such as parks/wood lots should be raised on municipal lands to enhance the vegetative cover;
Avenue plantations: In urban areas road side avenue plantations will be raised at least in two rows on both sides of the road where land is available; and
Plantation on institutional lands: In urban areas, many government institutions have large open campuses. Sufficient land is available in these -- where suitable species of trees/plants can be raised.
Agro-forestry and Social Forestry: Social forestry and agroforestry have immense potential in Bihar, which is pre-eminently an agricultural State. Farmers are eager to raise plants on the bunds of the farmland. Poplar and Eucalyptus trees are suitable for farmers for agroforestry plantations. Farmers are eager to raise fruit-bearing trees on their raiyati lands. As such, the Forest Department, in coordination with the Agriculture Department and other appropriate agencies will plan and undertake agroforestry initiatives including development of large-scale nurseries of high quality tree/plant material; distribution of plants free of cost to farmers, making available extension and support services through research and other initiatives such as training for post plantation care, visits by forest department staff, agroforestry specialists/scientists from institutions such as the National Research Centre for Agroforestry (NRCAF) and other centres/universities; support for planting trees on non-agricultural rural lands such as homesteads, school yards, compounds of various offices, public spaces, roadsides, canal sides, private/public bunds etc. Plantations along canals and river embankments: The State has about 3430 Kms of river embankments. The Forest Department will examine the possibility of raising plantations on these embankments by using suitable species especially bamboo, which is a strong soil binder. In addition to these river embankments there are 10000 Kms of canal embankments that can be brought under plantation.
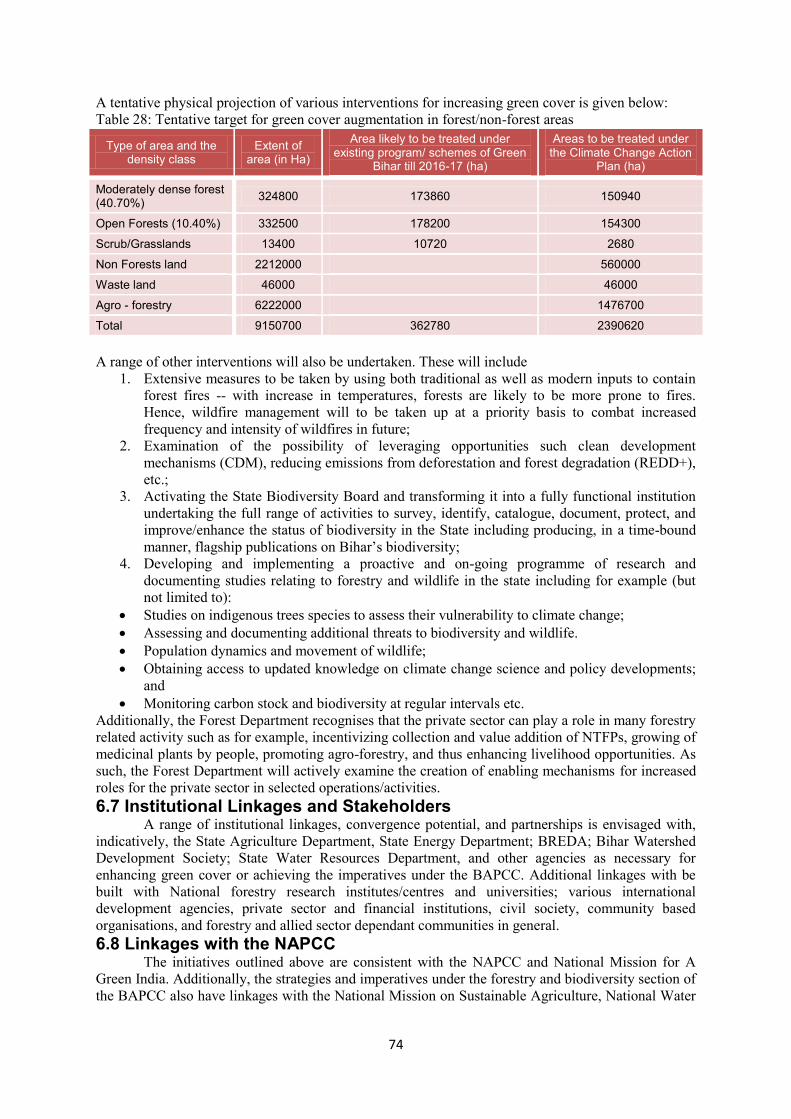
74
A tentative physical projection of various interventions for increasing green cover is given below: Table 28: Tentative target for green cover augmentation in forest/non-forest areas
Type of area and the density class
Extent of area (in Ha)
Area likely to be treated under existing program/ schemes of Green
Bihar till 2016-17 (ha)
Areas to be treated under the Climate Change Action
Plan (ha)
Moderately dense forest (40.70%) 324800 173860 150940
Open Forests (10.40%) 332500 178200 154300
Scrub/Grasslands 13400 10720 2680
Non Forests land 2212000 560000
Waste land 46000 46000
Agro - forestry 6222000 1476700
Total 9150700 362780 2390620
A range of other interventions will also be undertaken. These will include
1. Extensive measures to be taken by using both traditional as well as modern inputs to contain forest fires -- with increase in temperatures, forests are likely to be more prone to fires. Hence, wildfire management will to be taken up at a priority basis to combat increased frequency and intensity of wildfires in future;
2. Examination of the possibility of leveraging opportunities such clean development mechanisms (CDM), reducing emissions from deforestation and forest degradation (REDD+), etc.;
3. Activating the State Biodiversity Board and transforming it into a fully functional institution undertaking the full range of activities to survey, identify, catalogue, document, protect, and improve/enhance the status of biodiversity in the State including producing, in a time-bound manner, flagship publications on Bihar’s biodiversity;
4. Developing and implementing a proactive and on-going programme of research and documenting studies relating to forestry and wildlife in the state including for example (but not limited to):
Studies on indigenous trees species to assess their vulnerability to climate change; Assessing and documenting additional threats to biodiversity and wildlife. Population dynamics and movement of wildlife; Obtaining access to updated knowledge on climate change science and policy developments;
and Monitoring carbon stock and biodiversity at regular intervals etc.
Additionally, the Forest Department recognises that the private sector can play a role in many forestry related activity such as for example, incentivizing collection and value addition of NTFPs, growing of medicinal plants by people, promoting agro-forestry, and thus enhancing livelihood opportunities. As such, the Forest Department will actively examine the creation of enabling mechanisms for increased roles for the private sector in selected operations/activities. 6.7 Institutional Linkages and Stakeholders
A range of institutional linkages, convergence potential, and partnerships is envisaged with, indicatively, the State Agriculture Department, State Energy Department; BREDA; Bihar Watershed Development Society; State Water Resources Department, and other agencies as necessary for enhancing green cover or achieving the imperatives under the BAPCC. Additional linkages with be built with National forestry research institutes/centres and universities; various international development agencies, private sector and financial institutions, civil society, community based organisations, and forestry and allied sector dependant communities in general. 6.8 Linkages with the NAPCC
The initiatives outlined above are consistent with the NAPCC and National Mission for A Green India. Additionally, the strategies and imperatives under the forestry and biodiversity section of the BAPCC also have linkages with the National Mission on Sustainable Agriculture, National Water

75
Mission, National Mission for Enhanced Energy Efficiency, National Solar Mission, and the National Mission on Strategic Knowledge on Climate, and the National Mission on Sustainable Habitat. 6.9 Sectoral Action Plan and Budgets under the BAPCC See Part C, Action Plans and Budgets

76
7 Water Resources 7.1 Overview, Characteristics and Status 7.1.1 River Basins and Rivers
Bihar is a landlocked state, yet it is rich with ample natural water resources. The most important river Ganga, flowing from west to east, divides the state into north and south Bihar. The state is almost fully covered under the lower Ganga basin, with a small part in the west of the State under the upper Ganga basin. The Lower Ganga basin is further divided into several sub-basins. Broadly divided into the eight major rivers – the Ghagra, Gandak, Budhi Gandak, Bagmati, the Adhwara group of rivers, Kamla, Kosi, and Mahananda spread are across North Bihar. The major rivers of South Bihar are Karamnasha, Sone, Punpun, Kiul-Harohar, Badua, Falgu, Morhar, Chandan, and Bilasi, having their origins in Jharkhand, Madhya Pradesh, and Uttar Pradesh. Most of the rivers in north Bihar originate in Nepal flowing through the plains of Bihar before draining into the river Ganga. Figure 1: River basins and sub-basins in Bihar
The abundance of water resources is both a blessing and a curse for the state. In fact,
Bihar is one of the worst flood-affected states in India. About 68.8 lakh hectares of its total geographical area of 94.16 lakh hectares are flood prone. In addition, nearly 9.41 lakh hectares (8.32 lakh ha in north Bihar and 1.09 lakh ha in south Bihar), i.e., 10 percent of the total geographical area of the state is water logged. There are multiple reasons behind waterlogging which include: spilling of silted small rivers, encroachment of drainage channels, embankment induced waterlogging and the prevalence of saucer type depressions in the topography of the land. 7.1.2 Hydrogeology and Groundwater
Hydrogeologically, the various litho-units of the State can be grouped as unconsolidated/ alluvial formation, semi-consolidated formations, and consolidated/fissured formations. The main alluvial tract covers entire north Bihar and a sizeable area south of the Ganga River. These alluvial formations constitute prolific aquifers where the tube well can yield between 120-247 m3/hr. The potentiality of these aquifer decreases due south in the marginal tracts. Auto flow conditions occur in the sub-Tarai region of Madhubani, Sitamarhi, and West Champaran districts. In the hard rock areas of South Bihar, bore wells located near lineaments/fractures can yield between 10-50 m3/hr. Figure 2: Catchments and sub-catchments in Bihar Table 28: Groundwater resources in Bihar Dynamic Ground Water Resources
Annual Replenishable Ground water Resource
29.19 BCM

77
Net Annual Ground Water Availability
27.42 BCM
Annual Ground Water Draft 10.77 BCM
Stage of Ground Water Development
39 %
Ground Water Development & Management
Over Exploited NIL
Critical NIL
Semi- critical NIL
Ground Water User Maps 38 districts
Artificial Recharge to Ground Water (AR)
• Area identified for AR: 1650 sq. km. • Quantity of Surface Water to be Recharged: 574 MCM • Feasible AR structures: 891 Percolation Tanks, 2260 Check Dams, 1630
Recharge Shaft, 1303 Contour Bunding, RWH in Urban Areas
Despite the fact that Bihar has ample ground water resources, these are also beset with several quality problems, including arsenic, fluoride, iron, and nitrate concentrations in many districts. Fluoride concentrations of above >1.5 mg/l have been found in Aurangabad, Banka, Buxar, Bhabua (Kaimur), Jamui, Munger, Nawada, Rohtas, Supaul. Iron above 1.0 mg/l is found in Aurangabad, Begusarai, Bhojpur, Buxar, Bhabhar (Kaimur), East Champaran, Gopalganj, Katihar, Khagaria, Kishanganj, Lakhiserai, Madhepura, Muzaffarpur, Nawada, Rohtas, Saharsa, Samastipur, Siwan, Supaul, West Champaran, while nitrate concentrations above 45 mg/l are found in Aurangabad, Banka, Bhagalpur, Bhojpur, Bhabua, Patna, Rohtas, Saran, and Siwan. Arsenic content in ground water above 0.05 mg/l are found in parts of Begusarai, Bhagalpur, Bhojpur, Buxar, Darbhanga, Katihar, Khagaria, Kishanganj, Lakhiserai, Munger, Patna, Purnea, Samastipur, Saran, Vaishali.
Figure 3: Areas affected by arsenic and fluoride contamination in groundwater
7.1.3 Irrigation There are six major sources of irrigation — surface canals (major), surface canals
(minor), tanks (including ahars and pynes), tube wells, other wells, and other sources. Tanks and other sources are becoming less important over time, leaving the other four sources for providing irrigation facilities. In 2009-10, canals (major, medium and minor) provided 27.5 percent and tube wells provided 61.4 percent of total irrigation. In 2011-12, the percentage of irrigation provided by major, medium and minor canals has increased to 41.1 percent. Meanwhile, irrigation from tube wells saw a minor jump in 2010-11 to 66.5 percent; however, the data for 2011-12 indicates that the percentage of total irrigation by tube wells has fallen below even 2009-10 figures to 58.0 percent. Tube wells continue to be an extremely important source of irrigation, providing more than 50 percent of the total irrigation in 30 districts. However, irrigation from surface canals (major, medium and minor) continues to play an important role in 7 districts – Rohtas, Kaimur, Bhojpur, Buxar, Aurangabad, Banka, and Lakhisarai, all of which are notable rice producing districts of Bihar. The ultimate irrigation potential to be created by the major and medium irrigation projects of the state is 53.33 lakh hectares, against which a total of 28.86 lakh ha irrigation potential has been created till March 2011. At present, schemes like Western Kosi Canal Project, Durgawati Reservoir Scheme, Kund Ghat, Barnar Reservoir Scheme, Bateshwarsthan Ganga Pump Canal, North Koel Reservoir Scheme, Tilaiya Diversion Scheme, Punpun Barrage Scheme, Batane Reservoir Scheme, Mandai Weir Scheme, Uderasthan Barrage Scheme, Lower Morhar and Lower Kiul irrigation schemes are under execution. The year-wise

78
irrigation potential created until 2010-11 under major and medium schemes, actual areas irrigated, along with the utilization efficiency are presented in Table 23. The total potential created was 28.82 lakh hectares in 2001-02; it increased to 28.80 lakh hectares in 2009-10, and further to 28.86 lakh hectares in 2011-12. Against the potential thus created, the total area irrigated, taking kharif, rabi, and summer crops together, was 16.56 lakh hectares in 2001-02, showing utilization efficiency to be 67 percent. However, the utilisation efficiency declined to 42.50 in 2010-11. Table 1: Water utilization efficiency of major and medium irrigation schemes (Figures in '000 ha)1
Year Irrigation Potential created Total Irrigation Efficiency (%)
2001-02 2482.43 1656.21 66.72 2002-03 2509.43 1598.36 63.69 2003-04 2574.00 1721.24 66.87 2004-05 2619.00 1528.23 58.35 2005-06 2637.00 1660.91 62.98 2006-07 2833.00 1684.73 59.47 2007-08 2863.00 1679.82 58.67 2008-09 2873.00 1666.04 57.99 2009-10 2880.00 1202.45 41.75
2010-11 2886.00 1226.45 42.50
The sources of water that fall under Department of Minor Water Resources (DMWR) are surface canal (minor), tanks, Ahars and Pynes, tube wells, other irrigation wells and lift irrigation. Surface water and ground water irrigation schemes with a command area up to 2000 hectares fall under the minor irrigation sector. The main objective of DMWR is to create irrigation capacity in less time and at less cost, utilizing both ground water and surface water, as well as appropriate utilization of the created irrigation capacity. The total irrigated area through minor irrigation in the state is around 32.50 lakh hectares; however, private and state tube wells account for more than 80 percent of the area under minor irrigation. The source-wise area irrigated through minor irrigation during 2008-09, 2009-10, 2010-11, and 2011-12 (up to September 2011) is shown in Table 28. Table 30: Irrigated area through minor irrigation sources (Area in '000 hectares)2
Source 2008-09 2009-10 2010-11 2011-12, up to Sept.2011
Surface Canal (Minor) 29.21 17.59 23.00 48.84 Tanks (including Ahars and Pynes) 332.56 332.56 NA 22.20 Tube wells (Private and State) 2722.39 2726.6 2803.45 1715.00 Other Wells (Irrigation Wells) 145.79 145.79 145.79 NA Other Sources (Lift Irrigation) and Barge Lift Irrigation
24.36 16.74 15.50 4.98
Total 3254.31 3239.28 2987.74 1791.02
Around 20,938 traditional irrigation systems of Ahar-Pynes/irrigation ponds exist in the state (Table 28). Out of these, around 3,255 are now defunct. These schemes are situated across 17 districts in south Bihar and they have existed for centuries. In a way, this is a self-developed traditional system, based on water harvesting, with the purpose of storage and distribution of the rainwater with wide potential of irrigation flood management and ground water recharge.
1 Source: Water Resources Department, GoB 2 Source: Department of Minor Water Resources, GoB

79
Table 31: District-wise data on Ahar-Pynes/irrigation ponds3
Sl. No. District
Number of Systems
Total Sl. No. District Number of Systems
Total Functional Defunct
Functional Defunct
1 Patna 212 86 298 10 Jahanabad 501 2 Nalanda 238 82 320 11 Arwal 91 11 102 3 Bhojpur 93 31 124 12 Bhagalpur 472 50 522 4 Buxar 69 00 69 13 Banka 2146 117 2263 5 Kaimur 1330 71 1401 14 Munger 162 04 166 6 Rohtas 398 19 417 15 Jamui 2449 73 2522 7 Aurangabad 1251 442 1693 16 Lakhisarai 251 15 266 8 Gaya 6502 762 7264 17 Sheikhpura 125 26 151
9 Nawada 1488 1371 2859 Total 17683 3255 20938
7.2 Key Issues Most of north Bihar’s rivers originate outside India, in Nepal and the Tibetan region
of China. Bihar’s physical vulnerability to floods is impacted by its flat topography, high rainfall levels (more than 1200 mm annually), concentration (about 80 percent) of annual rainfall in only three monsoon months (July-September) and high sediment loads. The total flood affected area of the state is 68.80 lakh ha which is nearly 74 percent of the total geographical area of Bihar (94.16 lakh ha) and this is about one-sixth (17.2 percent) of the total flood prone area of India. Within the state, North Bihar is by far the worst affected by floods. This is largely due to the fact that, upstream of the Indo-Nepal border, the bed slope of all the rivers in north Bihar is very steep, but when they enter into Bihar, the land is very flat. On account of the sudden decrease in bed slope, the silt carried by these rivers along with water flow is deposited into the beds of the respective rivers within the territory of North Bihar. Besides the creation of new irrigation potential, the optimum utilization of previously created irrigation potential is also necessary. On account of sedimentation and damaged canal systems, full utilization of the created irrigation potential is not possible in many areas. On account of excessive quantity of silt in the rivers emerging from the Himalayas, the irrigation capacities of the irrigation systems, originating from these rivers, has witnessed more losses. Restoration of lost irrigation potential created before is not only economically more beneficial than creation of new irrigation potential, but it is less time intensive as well. The reduction in irrigation efficiency in Bihar’s medium and large irrigation systems is a cause for concern. In the Planning Commission’s recent report, several challenges were identified with respect to Participatory Irrigation Management (PIM) throughout India. Despite various initiatives, PIM has not been overly successful in India, save for a few states such as Maharashtra, Andhra Pradesh, and Madhya Pradesh. Though over 50,000 water users associations (WUAs) have been formed on paper throughout the country, the vast majority of them are not functioning effectively, including many in Bihar. A number of causes for the current situation have been identified including inability to devolve sufficient responsibility to water users, inability to allow WUAs to prepare their own Charter, setting out the operational rules for the WUA, dependence of WUAs on the WRD for operation and maintenance (O&M) funds as they are unable to collect and utilize their own O&M funds,
3 ibid

80
lack of training, lack of land holding and support in the early stages of formation, failure to separate governance from day-to-day management of the WUA, and lack of paid WUA staff responsible for operation and maintenance of the irrigation system. Further, while WUA Acts have been passed, insufficient resources have been allocated to explain the principles, purpose, and practices of PIM to both water users and officials of the Water Resources Department (WRD). Therefore, it may be highly beneficial for the state government to allocate additional resources for building the capacity of both farmer members of WUAs as well as officials of the WRD, either utilizing existing Water and Land Management Institutes (WALMIs) or other institutions of training. Many of the traditional micro-irrigation systems are becoming defunct and are in urgent need of maintenance and rehabilitation, in addition to creation of new systems. 7.3 Existing/On-going Initiatives
Through various measures, the state government is addressing these challenges. One of the major institutions that govern the sphere of water resources management in the state is the WRD. The field of operations of the WRD includes construction, maintenance, and regulation of major and medium irrigation projects, flood control, and drainage works. The Department also protects the right of the state in sharing of water among Inter State Rivers/Basins. As the management of water resources is essential to the economic development, the state government has taken steps to address the multi-dimensional challenges of water resources. There are centrally sponsored and state investments in specific schemes to address the challenges identified within the areas of major and medium irrigation, minor irrigation, flood management and ground water development. Progress in this sector will not only facilitate irrigation, generate power, promote agricultural growth, but will also enable Bihar’s economy to maintain the high growth trajectory that it is on today. The State Government is in the process of formulating its Water Policy as well as a water sector road map, in line with the Agriculture roadmap. Bihar has 88.7 percent of its population in rural areas dependent on agriculture, which is much higher compared to the national average of 72 percent. The entire state falls in a humid zone with an annual rainfall of around 1200 mm, which is sufficient for kharif crops. However, with the rainfall being highly erratic, the adequacy of irrigation facilities becomes vital for development of the state economy. The provision of assured irrigation facilities contributes to higher agricultural production, leading to enhancement in per capita income and reduction in the poverty ratio of the state. Under the good governance programme of the state government, the irrigation sector has been accorded top priority to achieve the objective of increase in productivity in agriculture through the optimum utilization of water and land resources. Serious efforts are being made by the WRD to achieve this objective so that the irrigated land is increased and the entire area of the state is freed from the problems of floods and waterlogging. In order to control unfettered extraction and use of groundwater reserves, the State has enacted the Bihar Ground Water (Regulation & Control of Development and Management) Act, 2006 enacted and notified on 29.01.2007. The Act also has mandatory provision of rainwater harvesting structures in the building plan in an area of 1000 sq. m. or more. Likewise, various measures are underway in the State to provide alternative sources of drinking water to populations in arsenic and fluoride affected areas. Funds from different sources were received for implementation of various major and medium projects in the state. In the plan budget of 2010-11, an expenditure of ` 91.44 crore was provided for the establishment head of major irrigation schemes, and an expenditure of ` 607.39 crore for the work head of major irrigation schemes, implying a total expenditure of ` 698.83 crore. In the plan budget of 2010-11, an expenditure of ` 4.43 crore was provided under the establishment head of medium irrigation schemes, and an expenditure of ` 63.42 crore under the work head of medium irrigation schemes, implying a total expenditure of ` 67.85 crore. For the plan budget of 2011-12, there is a provision of ` 85.28
81
crore under the establishment head of the major irrigation schemes, a provision of Rs 868.23 crore under the works head of the major irrigation schemes, implying a total budget of ` 953.51 crore. In the plan budget 2011-12, a provision of ` 4.72 crore has been made for the establishment head of the medium irrigation schemes, a provision of ` 122.65 crore for the work head of the medium irrigation schemes, implying a total budget provision of ` 127.37 crore. Due to Kushaha breach, entire Eastern Kosi Canal System (7.00 lakh ha.) was severely damaged. Its restoration work is in progress. Eastern Gandak Canal System (3.50 lakh ha.) is also under restoration work. On completion of these schemes, 10.50 lakh ha will be restored. Irrigation efficiency will substantially increase from 2012-13.
In order to fulfil the irrigation needs of the state, several programmes under the purview of minor irrigation have been prepared by the DMWR within the planned heads during the Eleventh Five Yea Plan (2007-12). Accelerated development of minor irrigation capacity (including the traditional systems of Ahar-Pynes and irrigation ponds), improvement in the utilization of the developed capacity, extension of irrigation benefits to the unirrigated areas, increase in the amount of subsidy to the private tube wells and pump sets, and enhancement of strength and sustainability of the Water User Associations are the main objectives of the Eleventh Five Year Plan. The surface water schemes of the DMWR are implemented with the storage and diversion of the surface water of small rivers, streams, and Ahar-Pynes. The state government is implementing these schemes with loans from NABARD under the Rural Infrastructure Development Fund (RIDF) during the Eleventh Plan period. The RIDF financed schemes are to be implemented within three years. In the first two years of the Plan (2007-08 and 2008-09), the DMWR proposed to create 80,000 ha additional irrigation capacity through the surface water schemes under the RIDF, and the repair, renovation and restoration of the catchment areas (Ahar-Pynes) under the Bharat Nirman Programme. The above process of creating additional irrigation capacity will be continued in the last years of the Plan (2009-10 to 2011-12). Along with the above, the schemes related to repair, renovation and restoration of Ahar- Pynes has also been planned, since the responsibility of maintenance of Ahar-Pynes was transferred to the DMWR in 2006-07. Under the Eleventh Five Year Plan period, 1000 schemes of restoration of Ahar-Pynes will be implemented by the Department. It is expected that around 1 lakh ha lost irrigation capacity of the traditional irrigation systems will be restored through these schemes during the plan period. During the Eleventh Five Year Plan period, the schemes related to the construction of weirs, sluice gates, and check dams, etc. across small streams and rivers will also be forwarded for financing under RIDF. In 2006, the schemes for extensive renovation of Ahar-Pynes were transferred from the Department of Revenue and Land Reform to the DMWR, after which 215 schemes are being implemented with the budget provision under the state plan, out of which 104 schemes have been completed. With the budget provision for 2010-11, 47 schemes have been completed this year, through which an irrigation capacity of 14,100 ha has been developed in the command areas. In 2010-11, 29 schemes with a cost of ` 31.49 crore has been approved up to February 2011, the implementation of which has already been initiated. In addition, 50 existing and 50 new surface water Ahar-Pyne schemes have been planned to be implemented with the cost of Rs 100.00 crore which will create irrigation capacity in around 25,000 ha. The survey for such type of schemes, situated in Jamui and Nawada districts, is also being conducted. The extensive renovation of some schemes, out of the above, is being implemented with the resources available under the state plan or under the Chief Minister Ahar-Pyne Irrigation Scheme during 2010-11. A proposal for the restructuring of the DMWR is being prepared under which a minimum of one minor water resources division in every district is being proposed by merging the tube well sub- division and the minor irrigation sub-division. Under the extensive renovation of the traditional systems of Ahar-Pynes and irrigation ponds, quality control will be required during the planning,

82
investigation, design, monitoring and implementation of more than 50 thousand structures for around 1637 integrated schemes. In the light of the above, the planning, investigation, monitoring and quality sections would require extension and upgradation. Considering the priorities of the state government with respect to the issue of drought in South Bihar, mitigation of the flood devastation in North Bihar, improvement in the drainage of water, providing canal irrigation for attaining a cropping intensity of 250 percent and optimization of the use of available water resources, action is being taken by the respective Departments to implement the schemes related to interlinking of the intra-state rivers, first by identifying the rivers to be interlinked and, then, preparing DPRs for them accordingly. These schemes have been formulated in such a way that they do not cross state or international boundaries. In future, however, these could be extended to or coordinated with inter-state or international schemes as per requirements of the state.
In North Bihar, schemes of water transfer were recognized through interlinking of rivers lying between Kamla basin and Baghmati-Adwara basin, west to the Kosi basin; interlinking of rivers lying east to Kosi basin and west to Mahananda (Mechi) basin; and transfer of water of Baya and Budhi Gandak rivers with the purpose of stabilizing the availability of water in the Gandak Project. Similarly, in South Bihar, schemes are planned such as the construction of Sone-Punpun- Harohar- Kiul link and transfer of water from all the crossing rivers; transfer of water in South Bihar by pumping from the Ganga (Barh-Nawada Pump Canal and Buxar Pump Canal); transfer of water from Dhanarjay Reservoir to Phulwaria Reservoir by constructing Reservoir on Dhanarjay river in Nawada district and connectivity of traditional irrigation systems like Ahars and Pynes with basin irrigation networks (Sakari-Nata Link). In addition, in North Bihar, in order to mitigate the flood devastation, the schemes of transfer of floodwater from the proposed river to the rivers of nearby basins were recognised. The four river basins in North Bihar are — Kohira (Budhi Gandak)-Chandrawat (Gandak) link, Budhi Gandak- None- Baya- Ganga link, Baghmati- Budhi Gandak link (through Belwa Dhar) and Kosi-Ganga link. Additionally, out of the total 15 recognized schemes, DPRs for six schemes are being prepared through different consultation agencies and DPRs for rest 9 schemes are being prepared by National Water Development Agency (NWDA). In order to overcome the problem of floods in Bihar, 3629 Kms of embankments have been constructed out of which 3179 Kms of embankments lie in North Bihar and 450 Kms of embankments in South Bihar. It includes 50 Kms and 10 Kms of embankments constructed along the Baghmati and the Gandak respectively, which have provided flood protection to large areas of Sitamarhi, Muzaffarpur, and West Champaran. In 2010-11, the left embankment of the Bhutahi Balan river was extended by 1.72 km, which aims to provide flood protection to the villages like Naunpatti and Ramnagar, etc. The WRD recognizes that construction of embankments for providing flood protection is a relatively short-term solution. In the long-term, other structural and non-structural solutions are essential. In 2011, all vulnerable places of all the river embankments were mapped and the respective officials were given responsibility for their surveillance and protection. Daily bulletins related with flood, status of embankments, flood forecast and water level of rivers were issued from the Central Flood Control Room. In addition, these daily bulletins were sent to the press/Akashwani/Doordarshan for information of the citizens. Seven special inspection teams for state plan scheme and five for FMP (75 percent CS) were set up to supervise flood protection works whose expertise and suggestions facilitated the construction works. Almost every year, flood-fighting works have to be done along several rivers in addition to implementation of the planned flood protection works. With the assistance from the World Bank, the Department has set up a Flood Management Information Centre with a comprehensive Flood Mitigation Information System (FMIS), which could provide 72 hours early flood forecast to the people. As mandated by the National Water Policy 2002, the

83
management of all canal systems is to be transferred to WUA under the PIM programme. This is to be transferred to the beneficiary committees, which are committees set up within the purview of the WUA, in a phased manner. There will be a WUA for each of the irrigation systems within every village. The WUA will be registered under Societies Registration Act, 1860, and maintenance and operation of the canals as well as assessment and collection of the irrigation tax will be the responsibility of the Association. The WUA will extend 30 percent of the irrigation revenue, generated from different crops, to the state government, and spend the remaining 70 percent on the maintenance and management of the canal system. Till March 2011, there were 52 registered WUAs to which management of local irrigation system has been transferred, and there were 15 Associations, which were registered, but the management functions are yet to be transferred to them. In addition, there were 45 Associations, which have been formed, but yet to be registered. Finally, there are 510 villages where the process of formation of WUAs is on going. 7.4 Priorities
Under the 12th FYP, the State proposes the several priority measures. Some of these are outlined below:
Creation and restoration of irrigation potential of 30.362 Lakh hectares through surface and ground water schemes;
Extensive renovation of surface irrigation schemes including Ahar/Pynes and irrigation tanks;
Execution of surface irrigation schemes on priority basis in drought prone districts of the state. Execution of community based/owned electric power operated medium duty deep Tube wells in South Bihar and Sugar Cane areas;
Incentivize execution of private shallow tube-wells under BIGWIS especially in north Bihar and non- hilly areas of south Bihar;
Restoration of old State Tube-well and lift irrigation schemes, which have lost their useful lives;
Promote conjunctive use of surface and ground water to ensure drought proofing and strengthening the mechanism of ground water monitoring;
Execution of artificial recharges schemes/water conservation schemes such as check dams in ground water stressed areas;
Capacity building of engineers, officials, operational staff, beneficiaries, contractors and WUAs by Organizing training programs, refresher courses and workshops and hiring of technical personnel and services of experts for preparation of DPR; and
Infrastructure development: construction of new field office premises, establishment of quality control labs at headquarter as well as field levels, strengthening of monitoring and evaluation wing, provision of third party inspection facility, man power empowerment by upgrading them with latest technology; and
During extensive renovation of traditional irrigation system such Ahar-Pyne and irrigation tanks, the main conductor channels will be taken up first and the minor conductors with command and less than 40 hectares will be renovated with MGNREGA. As far drinking water supply is concerned, following goals will be set for
achieving the objective of providing safe, adequate, and sustainable drinking water supply to all habitations
Cover all the partially covered habitations (NQA) with sustainable and stipulated supply of drinking water;

84
Quality issues continue to be major concern. In the XII Plan, it will be taken up as urgent priorities to cover habitations (QA) facing a severe water quality problem with safe drinking water facilities on a sustainable basis;
Cover newly emerged habitations (NQA and QA) and those which have slipped back to ‘partially covered’’ or not covered status due to a variety of reasons;
Cover schools in rural areas with safe and sustainable drinking water on priority basis;
Ensure social equity in distribution of assets for drinking water so that SC/ST population and other poor and weaker sections including minority communities are covered fully;
Tackle problems of seasonal shortage and natural calamities and taking appropriate measures for flood prone areas; and
Ensure water sustainability and security. 7.5 Perceived Climate Impacts
No in-depth climate vulnerability and risk analyses currently exist for the State. Nevertheless, a range of studies has examined various aspects of vulnerability of water resources to climate change and its impacts. Climate change can affect the hydrological regime changing water flows, precipitation levels, evaporation, and snow cover/melt. Rising temperatures can also cause rapid glacial melt consequently impacting freshwater supply and quality. These changes would in turn impact the communities adversely as the pressure on natural resources and environment would compound; water availability in the rivers will be affected; crop yields could decrease, therefore jeopardizing food security; and leading to health concerns due to occurrence of extreme events such as floods and droughts. While some regions would receive excess precipitation, there might be reduction in other regions (adversely affecting arid and semi-arid areas); increased evaporation; changes in runoff and available surface flow also causing changes in the groundwater recharge. Patterns of seasonal distribution of rainfall can shift, and these can cause significant problems, especially for agriculture. The rivers of northern Bihar, all of which, except the Burhi-Gandak originate in Nepal are an important resource for the Ganga basin with many rivers contributing to the irrigation potential the State. Yet, these Himalayan rivers have steep slopes in their upper reaches and enter Bihar’s plains with high velocity and carry enormous silt loads. As such, extreme precipitation events have geomorphological significance to Bihar. The response of hydrological systems, erosion processes and sedimentation in this region could alter significantly due to climate change. Increase in rainfall is likely to causes fresh floods land slides and damages to the landmass. This has a very severe implication for the existing infrastructure such as dams, bridges, roads, etc., for the areas and shall require appropriate adaptation measures to be taken up. Other possible future projections of climate impacts on the water resources of Bihar have already been outlined in Section A. The hydrological cycle is likely to be altered in significant ways due to climate change as early as by 2020s. The increase in rainfall due to climate change does not necessarily means an increase in surface runoff as may be generally predicted. It may be observed that even though an increase in precipitation is projected for the Ganga basins for the climate change scenario, the corresponding total runoff for has not necessarily increased. Integrated water policies will help to cope with variability in rainfall· and river flows at the basin level such as in river basins in Bihar, few of which lies south of the Ganga are Karmnasa, Sone, Punpun, Halohar, Kiul, Badua and Chandan and few basin lies to the north of the Ganga are Gandak, Bagmati, Kamla, Balan, Kosi, Mahanand. Hydrological Treatment should be done for basins to the north and south of Ganga separately.
Observational records and climate projections provide abundant evidence that freshwater resources are vulnerable and have the potential to be strongly impacted by climate

85
change, with many consequences for human societies and ecosystems. Observed global warming has been linked to changes in the large-scale hydrological cycle such as: increasing atmospheric water vapour content; changing precipitation patterns, intensity and extremes; reduced snow cover and widespread melting of ice; and changes in soil moisture and runoff. Precipitation changes show substantial spatial and inter-decadal variability. By the 2050s, the land area will be increasing to water stress due to climate change. Increased precipitation intensity and variability are projected to increase the risks of flooding and drought in many areas and will affect water quality and exacerbate many forms of water pollution and finally will affect food availability, stability, access and utilisation. Areas in which runoff is projected to decline face a clear reduction in the value of the services provided by water resources. Increased annual runoff in some areas is projected to lead to increased total water supply. However, in many regions, this benefit is likely to be counterbalanced by the negative effects of increased precipitation variability and seasonal runoff shifts in water supply, water quality and flood risks (high confidence). Changes in water quantity and quality due to climate change are expected to affect food availability, stability, access and utilisation. Climate change affects the function and operation of existing water infrastructure– including hydropower, structural flood defences, drainage and irrigation systems– as well as water
No in-depth climate vulnerability and risk analyses currently exist for the State. Nevertheless, a range of studies has examined various aspects of vulnerability of water resources to climate change and its impacts. The Centre for Environmental Sciences, Central University of Bihar is conducting climate modelling studies. The Climate Model Intercomparision Phase 5 (CMIP5) simulated % change in soil moisture, evaporation and runoff for the period of 2006-2050 with respect to 1961-2005 udder experiment of Representative Concentration Pathway (RCP) 4.5 is shown in Figs.7.7a-c. The region of Bihar is showing significant decrease in soil moisture, increased evaporation and decreased runoff in future time period of 2006-2050 with respect to 1961-2005.

86
Fig.7.7 Soil moisture, Evaporation and Runoff for the period of 2006-2050 with respect to 1961-2005 under experiment of Representative Concentration Pathway (RCP) 4.5 in CMIP5 simulation (Source: Central University of Bihar, Patna) Water availability
The gross per capita water availability in Bihar will decline from about 1,950 m3/yr in 2001 to as low as about 1,170 m3/yr in 2050
Bihar will reach a state of water stress before 2020 when the availability of clean water falls below 1000 m3 per capita
Probable impact of cumulative change on water resources include: Increased drought like situation; Increased flood events; Effect on ground water quality; Influence on ground water recharge; The atmospheric hydrological cycle is very likely [>90%] to be altered in significant
ways due to climate change as early a by 2020s also due to warmer climate; There is a general reduction in the quantity of available runoff under some scenarios; River basins such as Ganga are likely to experience seasonal or regular water stressed
conditions; By 2050s fresh water availability in South Asia is projected to decrease; and The rise of population will increase the demand for water leading to faster withdrawal of
water in turn would reduce the recharging time of the water table. 7.6 Strategies
The BAPCC recognises that scientific knowledge and evidence base on impacts of climate change to the water sector is limited. As such, a comprehensive climate vulnerability analysis will be taken up. As an complementary activity, a comprehensive water data base in public domain and assessment of the impact of climate change on water resource through the various agencies responsible for different aspects of water resources management in the State will be developed, and updated and analysed on an on-going basis. Strategies towards this will include: Review of network of hydrological observation stations Review of the network of automatic weather stations and automated rain gauge stations Collection of necessary additional hydro-meteorological and hydrological data for proper
assessment of impact of climate change in the state including other improvements required in hydrometric networks to appropriately address the issues related to the climate change. Such data will include: o Hydrological and hydro-meteorological data in low rainfall areas
Improved network for collection of evaporation and rain gauge data using automated sensors
Establishment/strengthening of ground water monitoring and geohydrology networks Collection of data about river morphology for monitoring erosion and carrying capacity,
and Surface and ground water quality data collection, etc. Other initiatives will include adoption/development of modern technology for measurement of flow in rivers areas, developing inventory of wetlands, development of water resources information system, and reassessment of basin wise water situation, apart from projection of water resources availability as a result of impact of climate change which would inter-alia include the likely changes in the characteristics of water availability in time and space. Other

87
necessary studies to improve understanding of climate impacts to the sector will also be carried out from time to time, and robust data mechanisms will be established. A State Water Policy framework will be developed on a priority basis, as well a comprehensive water sector roadmap. Both of these will take explicit cognisance of climate concerns and will include priority actions to be taken up by the State in this regard. In line with the priorities outlined in the State’s Approach Paper to the 12th FYP, expeditious implementation of water resources projects particularly the multipurpose projects with carry over storages will be taken up. Significant emphasis and priority will be given to revival and repair of Ahar-Pynes and traditional systems of water storage, conservation, and micro-irrigation, and development of new systems will be promoted. Also, conservation and preservation of wetlands and maintenance of optimal wetland hydrology will be taken up on a priority basis in convergence with the Forest Department. Specific emphasis will be given to empowerment and involvement of Panchayati Raj Institutions, urban water bodies and primary stakeholders in management of water facilities, and practices of participatory irrigation management will be revitalised/promoted. Systematic approaches to community level coping mechanisms and adaptation responses for coping with floods will also be developed. Physical sustainability of groundwater resources will be accorded high importance, and intensive programmes for ground water recharge in over-exploited areas will be taken up. The State will also take other necessary steps for increasing water use efficiency, including incentivising water harvesting and encouraging non-agricultural type developments of the type where not much water is required, incentivising or encouraging leakage control programmes, developing regulations/frameworks for in-house water withdrawals of industries, through royalties and licenses, extending subsidies and incentives for recycling and recovery, revision of water tariff based on cost recovery principle, promotion of water efficient fixtures, incentivisation for recycling waste water, etc. Options for taking up water conservation measures under the NREGA will also be examined. The State will take up steps for addressing the quality aspects of drinking water especially in rural areas, while also seeking to improve water efficiencies in urban water supply systems through promotion of water efficient techniques, technologies, and management, including effective and timely operation and maintenance of water resources projects and infrastructure assets across all water sub-sectors in the State. Steps will also be taken to foster integrated water resources development and management planning, and seeking convergence among the various water resources programmes and organisations such as Watershed Management Society, Agriculture Department, Forest Department, Industries Department, Urban Development Department, etc. Capacity development, education, and awareness are high priority agendas for the sector, and as such, initiatives for this will be taken up including (but not limited to): Interactive sessions with policy makers for sensitization. Development and deployment of capacity building for professionals from various
departments/organizations associated with water resources development and management including Panchayati Raj functionaries.
Promotion of do-it-yourself action by citizens through intensive social communication, and
Mass awareness programme including through school/college/university curriculum development and deployment.
In view of above, appropriate measures for mitigation of the impact of climate change on water resources, as also the adaptive measures are to be undertaken by various state departments and agencies. A water resources and climate change “Secretariat” will be explored for the necessary coordination and monitoring mechanisms. Certain issues are essentially required to be addressed adequately to make conducive environment for state of the art R&D work for accurately predicting the climate change scenarios and its implications

88
in order to fix up the indicators for designing the effective strategies to mitigate the climate change effectively on regional scales. For this, policy and institutional framework and institutional strengthening of government stakeholder/organizations concerning water resources need to be necessarily developed at State and Central Level. Issues which have to be addressed mentioned here in under as: Availability of historical and pre sent climate as well as hydrological data thereof. Policy
framework need to be designed/adopted at Central level to develop necessary infrastructure;
Development of the infrastructure for smooth data sharing amongst water resources stakeholders;
Long periodical database on drought and flood need to be procured and for that capacity building need to be done;
Customization of climate change models/ Regional Climate Models (RC!'1s) for regional water basins for future predictions with especial emphasis on water stress zones;
Procurement and development of digital elevation models especially for flood prone areas;
Network development of automatic weather stations; Extensive application and promotion of remote sensing and satellite data based
technology for hydrological study purposes; Comprehensive water data base accessibility in public domain; Development of suitable techniques for efficient utilization of water including state wise
implementation of rain water harvesting, roof top harvesting, desalination, checking over exploitation of ground water storage, canal networking, recycling, basin-wise intra-linking of rivers on regional scale;
Inventory of wetlands especially those with unique features; Study of change behaviour regarding the usage of water and addressing land use pattern
and improvement of catchment characteristics; Promotion of the restoration and integration management of small scale hydraulic
infrastructure such as multiple use small scale dams, artificial lakes and improved wells; and
Mapping of catchments, surveying, and assessing land use pattern with emphasis on drainage, vegetation cover, silting, encroachment, conversion of mangrove areas, human settlement, and human activities and their impact on catchment and water bodies.
Documenting sectoral responses, learning what worked and what did not, dialogue and sharing of data and information, etc. will be carried out as essential functions either by the individual agencies involved or collectively by a nominated agency. Such lessons can be valuable to other States, as will be learning from similar experiences in other States. As such, such learning-sharing mechanisms will be developed and put into place. The gender dimensions of water use and management are fairly well documented. It has long been noted in the gender and environment literature, for example, that women and girls generally assume primary responsibility for collecting water for drinking, cooking, washing, hygiene and raising small livestock, while men use water for irrigation or livestock farming and for industries. These distinct roles mean that women and men often have different needs and priorities in terms of water use. Climate change may also lead to increasing frequency and intensity of floods and deteriorating water quality. This is likely to have a particularly harsh effect on women and girls because of their distinct roles in relation to water use and their specific vulnerabilities in the context of disasters. In the context of climate change, the imperative will be to ensure that that policies and programmes draw on the existing body of knowledge on gender and water to inform interventions – and scale these up. To support the

89
integration of gender knowledge into policy and planning, it is proposed to train planners and raise their awareness of gender issues. Toolkits available from women’s or gender networks will be used as a starting point, and gender networking between experts will be strengthened. Coping with water scarcity as an important issue will be taken into account in adaptation planning, and the equal participation of women and men will be made advocated for in planning. Additionally, gender experts will be consulted during the detailed planning process. The private sector has considerable experience, expertise, technologies, and innovation capabilities as has been demonstrated in many other States in terms of increasing private sector involvement in water sector, especially by way of PPPs and other projects. As such, it is expected that the role of the private sector will be actively examined in the Bihar water resources context, and where appropriate, co-opted to bring in incremental gains for the sector. 7.7 Institutional Linkages and Stakeholders
A range of institutional linkages, convergence potential, and partnerships is envisaged with, indicatively, the State Agriculture Department, State Energy Department; BREDA; Bihar Watershed Development Society; and other agencies as necessary for enhancing green cover or achieving the imperatives under the BAPCC. Additional linkages with be built with National water research institutes/centres and universities; various international development agencies, private sector and financial institutions, civil society, community based organisations, and forestry and allied sector dependant communities in general. 7.8 Linkages with the NAPCC
The initiatives outlined above are consistent with the NAPCC and National Water Mission. Additionally, the strategies and imperatives under the forestry and biodiversity section of the BAPCC also have linkages with the National Mission on Sustainable Agriculture, National Mission for A Green India, National Mission for Enhanced Energy Efficiency, and the National Mission on Strategic Knowledge on Climate; and the National Mission on Sustainable Habitat. 7.9 Sectoral Action Plan and Budgets under the BAPCC See Part C, Action Plans and Budgets

90

1
Disaster Management Department Action Plan for Climate Change

2
Disaster Management Department
Action Plan for Climate Change
Overview, Characteristics and Status Due to its topographic and climatic conditions, Bihar is vulnerable to numerous hazards on an almost on-going basis. The state faces flood, earthquake, drought, cyclones, heat waves, and cold wave as well as recurrent fires in the villages during summer. Thirty three percent of the State receives less than 750 mm rainfall, making Bihar chronically drought-prone. Bihar accounts for 16.5 percent of the flood-prone area and 22 percent of the flood-affected population in India (which can be analysed as more than a fifth of India’s population, who are affected by floods, live in Bihar). Further aggravating is the fact that more than half the population of Bihar lives under potential risk of flooding during the annual monsoon. This adds to their existing vulnerability and pushes them deeper into poverty. The 2008 Bihar flood was one of the most disastrous floods in the history of Bihar. The flood killed 250 people and forced nearly 3 million people from their homes. More than 300,000 houses were destroyed and at least 340,000 hectares (840,000 acres) of crops were damaged. Bihar is not only prone to floods and droughts but also is highly vulnerable to earthquakes being situated in the seismic zone IV and V. The recent destructive seismic jolts (of magnitude of 6.8) in Bihar exposed the socio-economically, politically, ecologically and culturally vulnerable groups and bring fears to the fore about similar or a higher magnitude catastrophic earthquake. Floods Bihar is endowed with rich water bodies consisting of glacial rivers, rain-fed rivulets and tals and ground water. The whole of North Bihar is a courtyard of Himalayan Rivers and the whole of South Bihar the backyard of rivers flowing from south. Together they divide the State in seven river zones as if, bracketed between two major rivers, the rich land falling in-between is held in ransom by them. Most of these rivers namely Ghaghra, Gandak, Burhi Gandak, Bagmati, Kamla, Adhwara group of rivers, Kosi and Mahanada have Himalayan origin and have considerable portion of their catchment in the glacial region falling in Nepal and Tibet. They are, therefore, positioned to receive very copious rainfall during monsoon when discharge of these rivers is 50 to 90 times larger than fair weather flow. This causes frequent and large scale flooding of North Bihar. As such, 73.63 percent of the geographical area of North Bihar is considered to be prone to floods. The southern part of Bihar, on the other hand, is drained by rivers that are largely rain fed, having their origins either in the Vindhyachal Hills or in the Hills of Chotanagpur and Rajmahal. These rivers are either dry or have scanty discharges in non-monsoon months. Karmanasa, Sone, Punpun, Kiul, Badua, Chandan are the important rivers of this region. Falling between the Ganga and Indo-Nepal border, North Bihar having a geographical area of around 50,000 sq.km has a general slope from northwest to southeast. The geographical area of South Bihar is around 44000 sq.km and has a general slope of south to north. If the rivers of North Bihar, due to their large catchment area in the Himalayas, cause floods in around 74 percent of its geographical area, then the rivers of South Bihar drain
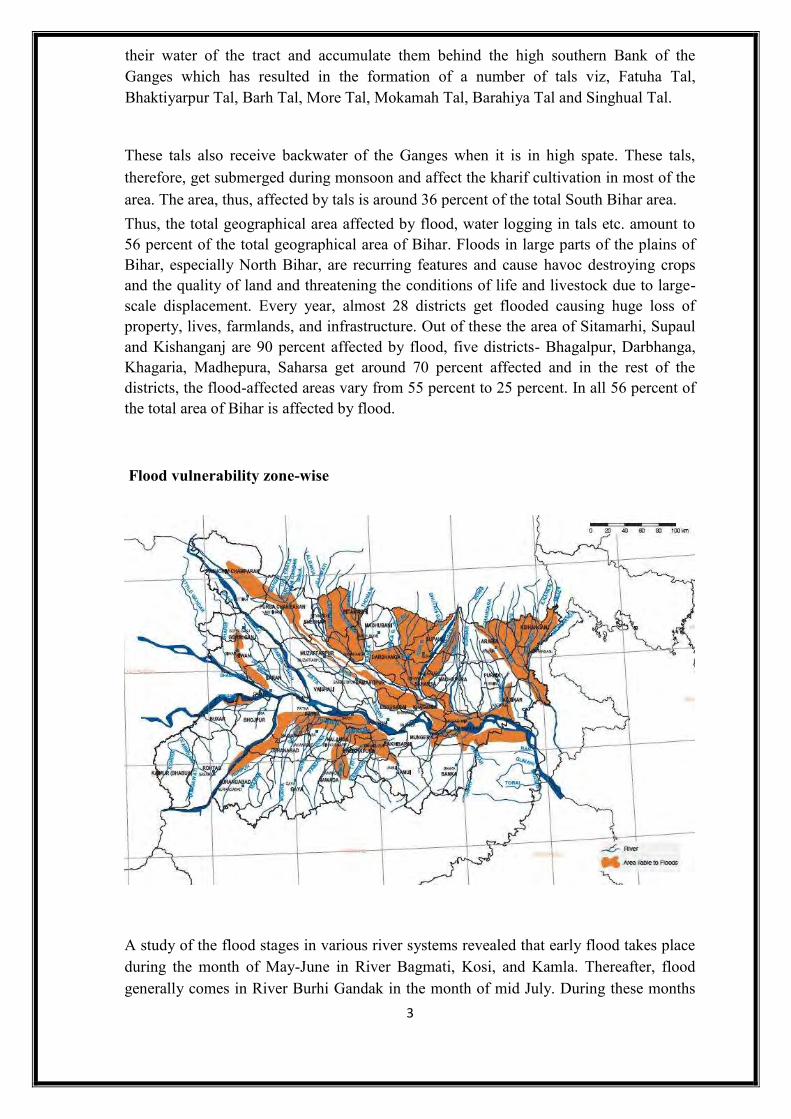
3
their water of the tract and accumulate them behind the high southern Bank of the Ganges which has resulted in the formation of a number of tals viz, Fatuha Tal, Bhaktiyarpur Tal, Barh Tal, More Tal, Mokamah Tal, Barahiya Tal and Singhual Tal. These tals also receive backwater of the Ganges when it is in high spate. These tals, therefore, get submerged during monsoon and affect the kharif cultivation in most of the area. The area, thus, affected by tals is around 36 percent of the total South Bihar area. Thus, the total geographical area affected by flood, water logging in tals etc. amount to 56 percent of the total geographical area of Bihar. Floods in large parts of the plains of Bihar, especially North Bihar, are recurring features and cause havoc destroying crops and the quality of land and threatening the conditions of life and livestock due to large-scale displacement. Every year, almost 28 districts get flooded causing huge loss of property, lives, farmlands, and infrastructure. Out of these the area of Sitamarhi, Supaul and Kishanganj are 90 percent affected by flood, five districts- Bhagalpur, Darbhanga, Khagaria, Madhepura, Saharsa get around 70 percent affected and in the rest of the districts, the flood-affected areas vary from 55 percent to 25 percent. In all 56 percent of the total area of Bihar is affected by flood. Flood vulnerability zone-wise A study of the flood stages in various river systems revealed that early flood takes place during the month of May-June in River Bagmati, Kosi, and Kamla. Thereafter, flood generally comes in River Burhi Gandak in the month of mid July. During these months

4
River Ganga generally remains low but by September, the master drain, the Ganges, also rises making the flood -problem very acute. Thus, from the month of May to September, for five months, Bihar has to suffer through the ravages of floods of one kind or another, the impact of which was perhaps not felt to the same extent in the past as is felt now. It is so because of the ever-increasing encroachments on the flood plains by the growing population to meet its requirements of food and fibre. The destruction of forests for reclaiming areas for occupation and for obtaining fuel for domestic requirements have also contributed in intensifying floods. From 2001 to 2010, the number of districts affected ranged from 9 to 25, number of blocks affected, from 6 to 269, number of panchayat fully affected, from 10 to 2235, number of panchayats partially affected from 237 to 1581 and the number of villages affected ranged from 679 to 18,832. The number of human life affected ranged from 7.18 lac to 244.42 lakh, livestock affected ranged from 0.1 lac to 86.86 lakh. The total area affected ranged from 1.81 lakh ha to 19.69 lakh ha out of which agriculture land ranged from 1.6 lakh ha to 14.4 lakh ha, and non-agricultural land ranged from 0.39 lakh ha to 9.3 lakh ha. The total crop loss ranged from those sown in 0.1 lakh ha to 10.6 lakh ha. The recorded impact of flood reveals that it is not the number of districts or blocks or panchayats affected by flood that matter. It is the area covered that determines the loss of life and property -- in the year 2004, a death toll of 885 human lives and 3272 animals were reported. Crop damage was worth ` 522.06 crore and loss of public property to the tune of ` 1030.49 crore were reported, in addition to 9.3 lakh houses that were damaged. In the year 2007, 650 people and 615 animals were reported to be dead, 59610 houses were damaged, and 11.9 lakh hectare areas covering 10215 villages were adversely affected. Damages of crop and public property were estimated as ` 781 crore and ` 643 crore respectively. In the year 2008 in the Eastern Afflux Embankment near Kusaha Village in Nepal at nearly 12 km upstream of Kosi Barrage a breach happened which increased to nearly two km. Through this long breach, the Kosi took a new course nearest to where the river flowed in 1926 and caused widespread destruction -- around 806 villages were washed away and about 23.13 lakh people lost their property. Around seven lakh persons had to be evacuated. In all, 16 districts, 86 blocks, 1678 village, 18.36 lakh of population, and 1.139 lakh of animals were affected by flood in 2008. Crops worth ` 1704.09 lakh, houses worth ` 379 lakh and public property worth ` 321.9 lakh were either lost or damaged. Drought It is a paradoxical situation that a state so rich in water bodies, also suffers from severe droughts. Bihar often faces drought situation of different scales/levels that intrinsically lead to famine situations. This situation necessarily occurs when the summer monsoon gets weak and which causes percentage departure of seasonal rainfall from the normal. Climatically, the state of Bihar lies on the crossroads of the wet eastern coastal regions and the relatively dry continental region of the western plains. Being on the threshold of transition zone there happens regional variations in rainfall distribution as well as rainfall variability. Although, the average rainfall in Bihar is 1120 mm, but considerable variations occur with 2000 mm in the extreme eastern and northern part and less than 1000mm in the western and south-western part of the state. As a result 33 percent of the

5
State receives less than 750 mm rainfall, making the southern part of Bihar vulnerable to drought. Even the 35 percent of northeastern part of Bihar that receives around 1120 mm rainfall suffers drought once in four to five years due to scanty rains. Although the North Bihar plain receives plenty of rainfall, but when the annual rainfall is even 25 percent less than the normal, drought situations prevail. Quite often the problem of drought and floods prevails simultaneously. Apart from deficiency in rainfall prime reasons of recurring drought in Bihar is the nature of soil with low mineral and humus-contents besides extremely poor water holding capacity. Recurrent rainfall variability and sustained departure from the normal rainfall vis-a-vis low reliability, fluctuating both surface and underground water resources and extremely poor water holding capacity of the major soil group appear to have clubbed together to cause frequent droughts in Bihar. Beside, there is a relationship between reducing forestland and the increasing rainfall variability and the phenomenon is well manifested in Bihar scenario of recurrent droughts. Drought affected areas Earthquake Being located in the high seismic zone perched on the boundary of the tectonic plate joining the Himalayan tectonic plate near the Bihar -Nepal Border and having six sub-surface fault lines penetrating through its Gangetic planes in four directions, Bihar is vulnerable to the worst kind of disaster caused by earthquake of near maximum

6
intensity. Out of eleven districts in Zone V two districts—Madhubani and Supaul are 100 percent covered; two districts—Araria and Sitamarhi, more than 85 percent; Darbhanga, Madhepura and Saharsa, above 45 percent and the rest four—Kishanganj, Muzaffarpur, Purnea and Seohar, less than 10 percent. In all 15.2 percent of the total area of Bihar is covered in Zone V. Out of 30 districts in Zone IV, 13 districts are 100 percent in zone IV; 8 districts are above and around 90 percent; and the rest of the 16 districts are below 80 percent in Zone IV. In all, 63.7 percent of the total area of Bihar falls in Zone IV. Out of 13 districts in Zone III, five districts are 100 percent; two districts around 80 percent and the rest below 70 percent. In all 21.1 percent of the total area of Bihar falls in Zone III Thus, Bihar has suffered ten earthquakes in a span of 247 years. Earthquakes ranging from 5.5 to 8.3 on the Richter scale has rocked and wrecked Bihar. The latest earthquake was reported on 18th Sept. 2011 at 6.12 pm on 6.8 Richter scale with epicentre being in Sikkim – Nepal region. Only 10 deaths were reported in the state. The worst of these was in 1934, one in which more than 25,000 persons lost their lives. Bhatgaon in Nepal and Munger in Bihar were completely ruined. Large part of Patna and Kathmandu in Nepal and Motihari, Muzaffarpur and Darbhanga in Bihar were also destroyed along with innumerable villages in between. Earthquake vulnerability zone-wise Cyclonic Storms (High Speed Winds) Among the natural hazards of the surface cyclones (High Speed Winds) are by far the

7
most devastating both by causing loss of life as well as loss in terms of socio-economic development. Severe tropical high-speed winds are responsible for large casualties and damage to life, property, and agriculture. Its three constituents: wind speed, whirling, and water, leave behind three-dimensional impacts in the area. The only saving grace is that its formation can be watched right from the depression development to landfall stage. As detailed in the Vulnerability Atlas of India, 27 districts in Bihar are fully affected by high-speed winds of 47 m/s intensity. The area of districts—Banka, Jahanabad, Arwal, and Nalanda is nearly 90 percent affected. Other districts of South Bihar except Nawada are partly affected by high-speed winds of 44 m/s. Nawada is, however, 100 percent affected by high-speed winds of this intensity. In all 86 percent of the total area of Bihar is prone to high-speed winds of 47 m/s intensity and only 14 percent of the area prone to high-speed winds of lesser intensity. Cyclonic storm vulnerability zone-wise

8
Key Issues Key issues relating to disasters in the State include the recurring nature of the main event categories – floods and droughts. The Kosi River is the main cause of recurrent floods in north Bihar. The river runs through a steep gradient in Nepal. Rainfall in the Kosi catchment in Nepal overloads the barrage compelling release from the Barrage, which causes floods and waterlogging in north Bihar. The heavy discharge from the Barrage causes downstream Bagmati, Burhi Gandak, and Ganga rivers to inundate. In addition, the discharge carries enormous amounts of sandy silt that gets deposited over arable land and renders it fallow. Additionally, disasters, as and when they occur, are exacerbated by a number of factors; some of these include:
High population decadal growth rate; Illiteracy in general and Female illiteracy in particular, and therefore, low
awareness levels; Low per capita income; Rural roads in poor condition; Scarce health infrastructure; Sand casting and changes in land use due to sand casting; Lack of adequate tree/green cover and resultant soil erosion; Debris disposal; Damage to water management resources; Damage to plantations; Increasing salinity due to poor drainage; Pressure on environmental resources in areas receiving the out-migration; and Environmental degradation due to pollution caused by reconstruction
Existing/On-going Initiatives Considering the frequency and magnitude of disasters, an independent Department of Disaster Management has been established. The basic objective of this initiative is to ensure preparedness before a crisis sets, management of crisis during the disasters and, finally it has to oversee the relief and rehabilitation operations after the crisis. The state government has taken steps to strengthen the State Disaster Management Authority (SDMA) on the guidelines of National Disaster Management Act, 2005. The National Disaster Management Agency (NDMA) has set up a battalion of the National Disaster Response Force (NDRF) at Bihta near Patna. The state government has procured 74.47 acres of land for setting up this battalion. The state government has also sanctioned and created a battalion of its own State Disaster Response Force (SDRF), comprising retired army and naval personnel. Persons of central police forces are also eligible to be engaged. Various new initiatives have been taken or are being taken up in the year 2011-12. These include: 1. To combat flood disaster, Standard Operating Procedure (SOP) has been
formulated by the Department of Disaster Management for preparedness, early response, relief and rehabilitation during flood and other kind of disasters;

9
2. The Department has constituted a scheme 'Shatabdi Anna Kalash Yojana' to provide a helping hand to poor, old, inactive people due to some reasons, widows and underprivileged people to prevent 'starvation deaths' in the state. Under this scheme, the state government guarantees disbursement of 10 kgs of food grains per adult and seven kgs of food grains per child up to one month until they are covered by other such schemes of the state government. A sum of ` 10 crore has been already provided for this scheme;
3. Appointments are being made on various categories of posts falling under SDRF which has been constituted earlier;
4. A SOP has also been formulated to combat drinking water crisis, caused by irregular monsoon and receding of ground water level in some areas of the state; and
5. A state Emergency Operation Centre (EOC) building has been constructed and is being equipped with state of the art technology. Such EOCs have been sanctioned in all the 38 districts of the state, at a cost of ` 10.00 lakh per centre.
Bihar faced a serious draught arising out of scanty rainfall in 2009. The state faced a successive drought in 2010, though it was not so severe like that of 2009. The arrival of the monsoon was delayed by two weeks, and the rainfall deficit was modest at 20 percent in 2010. An amount of ` 27.20 crore was spent on schemes of drinking water, implemented by Public Health and Engineering Department (PHED) due to occurrence of irregular monsoon and receding of the ground water level in some areas of the state. Keeping in view the constant threat of floods, affected/risk prone districts are provided with modern flood rescue operation instruments. In addition, flood shelters and flood platforms are being constructed in all flood prone districts of the state. The Department of Disaster Management has issued new guidelines to Divisional Commissioners and District Magistrates for rehabilitation and reconstruction during the post-flood operations. To combat flood, cyclone and fire disasters, the state government incurred an expenditure of ` 207 crore during 2010-11. Apart from all this, the state government is alert on all fronts. It has established organisations and workforce right from village level to avert disasters and combat the casualties caused by sudden disasters like drought, flood, cyclones, and earthquakes. The Disaster Management Department has also developed a comprehensive Draft State Disaster Management Plan, including detailed sections on perspective, disaster prevention, and mitigation, preparedness and capacity Building, crisis management, roles and responsibilities and guidelines for various government departments, and details the role of other stakeholders. The Plan has been prepared by the Prof. G. P. Sinha Centre for Disaster Management & Rural Development, Patna.
Priorities Key priorities for the State will include:
Continuous on-going efforts at tracking and disaster risk indicators and developing improved early warning systems;
Developing and putting in place strategies and action programmes for disaster vulnerability reduction;

10
Extensive information, education and communication campaigns for the public in general, and specific communications in high risk zones;
Improving inter-departmental coordination and communications for improved risk management and disaster response;
Seamless integration of state disaster management machinery with other key stakeholders such as other developmental agencies and civil society for extended capability in all aspects of risk management and disaster response;
Provision of all necessary equipment and infrastructure for speedy and efficient responses to disasters including search and rescue, relief measures, and rehabilitation/reconstruction;
Upgradation and retrofitting of key infrastructure assets in risk-prone zones/areas; and
Systematic implementation of the State Disaster Management Plan in all its aspects.
Perceived Climate Impacts No in-depth climate related vulnerability and risk analyses currently exist for the State, apart from the detailing already done in the Draft State Disaster Management. It is anticipated that such an in-depth vulnerability and risk analyses will be carried out as part of the larger overarching State strategies under the BAPCC. Nevertheless, However, it is expected that even without taking climate change into account, disaster risk will continue to increase, as more vulnerable people and assets are exposed to weather extremes. Available evidence seems to suggest that that climate change has changed the magnitude and frequency of some extreme weather and climate events. In the next two or three decades, the expected increase in climate extremes will probably be relatively small compared to the normal year-to-year variations in such extremes. However, as climate change impacts become more dramatic, its effect on a range of climate extremes will become increasingly important and will play a more significant role in disaster impacts. However, it is also expected that even minor variations in existing climate extremes can exacerbate the challenges that the State, its different sectors, and its people face. Strategies The overall approach to disaster management in the face of climate change under the BAPCC will be to seek closer integration of disaster risk management and climate change adaptation, along with the incorporation of both into state, district, and local planning and practices. It is anticipated that a multi-hazards approach will be used to planning and action for disasters and will address social welfare, quality of life, infrastructure, and livelihoods, and other aspects for managing disaster risk in the short term, and facilitating adaptation to climate extremes in the longer term. Towards improving governance mechanisms, institutional decision making and convergence, specific mechanisms seamless coordination on an on-going basis will be established between the State Disaster Management Department, State Disaster Management Authority, and various sectoral line departments. The following initiatives will be undertaken for improving scientific knowledge and evidence base and understanding of climate change and its impacts:

11
Studies of recent changes in climate parameters and associated disaster
related impacts: These studies will be undertaken in collaboration with one or more centres/ of excellence/universities/institutes for climate research in India; on-going programmes of collaboration will be established with such centres for continued scientific analyses and evidence base inputs to the State’s disaster management planning and practice;
Documentation of adaptation strategies of the masses: Various adaptation strategies and traditional being used by the masses to ward off or minimise the climate change related impacts will be documented. This would ensure intellectual property rights protection to the same where applicable;
Land use/land cover change in the previous decade: Temporal satellite data will be utilized to assess the changes in the land use/land cover pattern; and
Monitoring of various climate parameters: A series of automatic weather stations will be installed at critical location in the high reaches of the state so as to monitor the changes in various climate parameters.
Development priorities of the state are often derailed by disasters and therefore it is important to dovetail various risks reduction strategies with developmental planning. Moreover based upon their resilience, communities are differently affected by disasters. The most vulnerable sections include poor, women, elderly, children, and differentially abled persons. This is a serious concern as it threatens livelihood, well-being, and food security of the masses in the region. It therefore becomes important to quantify this problem in discrete terms and solutions to the problems have then to be devised accordingly. The following activities would therefore be undertaken:
i. Assessment of the socio-economic vulnerability masses in various remote locations of the state with particular emphasis upon gender, class, caste, ethnicity, physical ability, community structure, existing decision-making processes and the other local factors;
ii. In the absence of any authentic study, as on date both the magnitude of the problem related to migration and its impact is ill quantified. Data collection and compilation work on population movements (migration) across the region; primary and secondary data is proposed to be compiled at the regional level; and the impact of migration on poverty alleviation;
iii. Documentation of best practices for livelihood and adaptation strategies and promotion of the same through various modes including policy interventions;
iv. A study on migration and its possible impacts (considering that there is significant migration within the State);
v. Gender based studies to identify the role of women as first and most responsible responder in disasters and train the women leaders. Study would also understand the impact of the increase in predominantly women-headed households in the mountains;
vi. Gender mainstreaming and gender-sensitive approaches in regions affected by food shortages and decreased agricultural production based on approaches and methods developed by traditional knowledge; and
vii. Trainings on livelihood options including small scale business, animal husbandry and agriculture with focus on adaptation and coping mechanism.
The following activities are planned for education and awareness on this important issue.

12
i. School curriculum: Disaster management has already been included in the
school curriculum. Appropriate material would subsequently be developed for on various climate change related issues and the same will be introduced in the school curriculum.
ii. School awareness program: Awareness programs will be organized by the
Department for school children. Climate change will be included in these programs and these will be made a regular feature in all the schools of the state.
iii. Awareness program for officials: It is urgently necessary to sensitize the
government officials on this important issue. The Department will regularly organize sensitization programs for government officials at state, district and tehsil / block level. Various key issues related to climate change will be included in these training programs.
iv. Training program for vulnerability assessment and risk reduction: For better
appreciation of vulnerability and risk assessment reports as also for
undertaking
these exercises on their own special training programs will be organized for the representatives of various sectors.
The following initiatives will be taken up to build adaptive resilience and reduce vulnerability across communities and sectors:
i. Capacity building for effective planning: Planning is the key to mitigating effects of various climate induced contingencies. Various stakeholders from amongst the community as also from various sectors will be trained in assessing their vulnerabilities and to prepare plans in the light of the various contingencies that they might face;
ii. Planning for government infrastructure: The entire public infrastructure will be mapped under GIS environment and the climate vulnerability of the same will be assessed. This would help in developing adaptive climate disaster resilience plans, including retrofitting where required;
iii. Preparation of disaster management plan for all major reservoirs in the state:
In the case of extreme precipitation events in the catchment of major reservoirs the possibility of flash floods in the downstream areas cannot be ruled out. Various possibilities have therefore to be simulated and based upon these appropriate plans have to be developed for tackling these situations.
iv. Raising quick response teams at grassroots level: In case of any disaster situations the people at the grassroots level are the first responders and in most events response activities are over before the arrival of formal responders on the scene. It is therefore critically important to raise quick response teams at the grassroots level. These will be raised in every village so as to effectively manage any contingency. Certified training in search and rescue and first aid will be imparted to selected volunteers.
v. Vulnerability assessment of all lifeline structures in the state: Vulnerability of all the lifeline structures will be assessed out and this would help the respective

13
sectors to undertake appropriate measures for vulnerability reduction. vi. Retrofitting of lifeline infrastructure: After assessing vulnerability of the
infrastructure the beneficiaries will be asked to undertake retrofitting of their infrastructure.
vii. Relocation of critical infrastructure: The infrastructure and critical facilities
falling in identified high-risk zone will be advised to relocate their infrastructure. This would at the same time act as a disincentive for infrastructure development in the high-risk zone.
viii. Promoting green and disaster resilient construction technologies: Certified
training programs will be organized for the engineers of the various engineering departments for promoting green and disaster resilient construction technologies.
ix. Assessment of urban vulnerability particularly in case of extreme
precipitation events: Major urban agglomerations of the state having population of more than one lakh will be undertaken under this program.
x. Vulnerability assessment of all industrial units in the state: Vulnerability of all the industrial units will be carried out and this would help the individual agencies in undertaking appropriate measures for vulnerability reduction.
xi. Simulation of extreme precipitation scenario in major river basins of the
state and planning for the same: Extreme precipitation in the downstream areas. It is therefore important to simulate various scenarios and accordingly plan for effectively managing these contingencies.
xii. Review of various techno-legal regimes: The techno-legal regime has an
important bearing in reducing risk of disasters. Various techno-legal provisions would therefore be reviewed and appropriate amendments in the same will be suggested.
xiii. Promotion of risk transfer mechanisms: Risk transfer is increasingly being seen as an important tool for reducing the burden of disasters upon public exchequer. Various risk transfer instruments would therefore be developed and the same will be promoted through various modes.
A robust monitoring framework will be put into place, and both financial and physical monitoring of the various activities will be resorted to. Besides in house monitoring independent third party monitoring will be undertaken. Possibilities will be explored for collaboration with private and cooperate sectors. Special emphasis will be laid for collaboration in the following sectors:
a. Housing and infrastructure, health, and education -- safe housing is the most important aspect as far as disaster management and housing is concerned. Promotion of earthquake safe construction technology will be targeted through training of engineers, architects and masons working in private housing projects;
b. Advocate and convince the private sector in disaster prevention in reconstruction and rehabilitation;
c. Mobilizing private sector resources for investment in various disaster prevention measures;

14
d. Explore the opportunities for risk reduction in the design and construction of new systems and those available for risk reduction in the retrofitting of existing life line structures like hospitals, schools and other important buildings;
e. Study on the social and economic consequences of critical infrastructure failure from various disasters and approaches to estimation of direct and indirect losses from infrastructure service failure with emphasis on the comparison of expected scale and distribution of losses related to infrastructure failure with the costs of strengthening and other strategies for risk reduction; and
f. Many infrastructure systems are owned and managed by private sector therefore opportunities will be explored for promoting standards of design, construction, maintenance and operation as routine practice.
Civil society has an important role to play in bringing forth awareness amongst the masses and in propagating green technologies. The Department will work in close collaboration of various civil society organisations. Initiatives under the BAPCC will include:
Civil society organisations will be approached as bridge between the centre and the people;
Information and data of the civil society will be used and further research will be done through or with the help of these organizations;
Advocacy programmes will be conducted through local NGOs; and For Knowledge sharing
International agencies will be approached for technical assistance for various activities, on going as well as planned. They would also be approached for capacity building of people working in various projects in the State/Districts or associated with various activities and for initiatives on knowledge sharing.
Institutional Linkages and Stakeholders Considering the nature of climate change and disasters, a wide range of institutional linkages, convergence potential, and partnerships is envisaged between the State Disaster Management Department, State Disaster Management Authority, all sectoral line departments, and sub-state administrative/sectoral units, apart from linkages with academia, civil society, international development agencies, private sector and financial institutions, and communities in general.
Linkages with the NAPCC As is the case with institutional linkages and stakeholders, considering that climate change and disasters as well as their impacts cut across virtually all sectors, the initiatives outlined above are consistent with the NAPCC and all the National Missions under it.

Bihar Action Plan for Climate Change
102
9 Urban Developments 9.1 Overview, Characteristics and Status Although Bihar continues to be the second lowest urbanized state for three successive decades (separating out Jharkhand from 1991 census), Its percentage decadal growth of urban population at 35.11 against 31.80 for the country as a whole (It is also higher than as many as eighteen states/ UUTS) speaks of its urban growth. The State offers a unique case of nearly constant urbanization with significant urban growth. From a population of less than a million residing in urban areas in 1911, urban Bihar now is the home to n early twelve million people. The absolute urban population of the State at 1.17 Crores is more than the urban population of all the eight North Eastern States together.
9.1.1 Urban Agglomerations and Population Growth In 2001, the urban population in Bihar was only 10.5 percent. With the rate of urbanization being very slow, even after a decade, the urban population of the state, constituted only 11.3 percent of its population in 2011. Thus, in absolute terms, the state has a population of around 1.17 crore living in the urban areas . There are in all 141 urban institutions — Corporations (11) Municipal Councils (43) and Municipal Panchayats (86) in the state. These correspond to the number and size of urban agglomerations in Bihar. A list of urban agglomerations and cities, with a population above 100,000 as per 2011 census in Bihar is given below.
Table 32: Urban agglomeration with over 100,000 population
Rank Name District Population 2011
Male Female Literacy Rate
1 Patna Patna 2,046,652 1,087,864 958,788 84.05 2 Gaya Gaya 470,839 249,797 221,042 85.45 3 Bhagalpur Bhagalpur 410,210 218,284 191,926 80.76 4 Muzaffarpur Muzaffarpur 393,724 208,509 185,215 85.07 5 Purnea Purnea 310,817 163,892 146,925 74.04 6 Darbhanga Darbhanga 306,089 161,346 144,743 80.74 7 Bihar Sharif Nalanda 296,889 154,915 141,974 80.32 8 Arrah Bhojpur 261,099 139,319 121,780 83.41 9 Begusarai Begusarai 251,136 133,931 117,205 79.35 10 Katihar Katihar 240,565 126,834 113,731 80.09 11 Munger Munger 213,101 113,173 99,928 81.83 12 Chhapra Saran 212,955 112,280 100,675 81.01 13 Bettiah West
Champaran 156,200 82,663 73,537 80.89
14 Saharsa Saharsa 155,175 82,589 72,586 77.66 15 Sasaram Rohtas 147,396 77,687 69,709 82.31 16 Hajipur Vaishali 147,126 78,561 68,565 79.26 17 Dehri Rohtas 137,068 72,311 64,757 83.38 18 Siwan Siwan 134,458 70,670 63,788 84.65 19 Motihari East
Champaran 125,183 67,438 57,745 87.20
20 Nawada Nawada 118,820 62,361 56,459 81.80 21 Bagaha West
Champaran 113,012 59,946 53,066 60.67
9.1.2 Urban Infrastructure and Services Despite having a solid urban base, the urban affairs in the State are yet to be streamlined on a sound footing .Not only did the State have an poor deprivation as evident from its deprivation index at 19.71 (as against the national average at 16.79),its urban governments are also at a nascent stage resulting in huge governance deficit and confusion as to who governs the urban settlement. Inadequate urban services undermine the performance of urban societies,not only as essential inputs to create physical conditions that are optimal for the efficient and effective operations of the various economically productive sectors,but also as fundamental inputs to
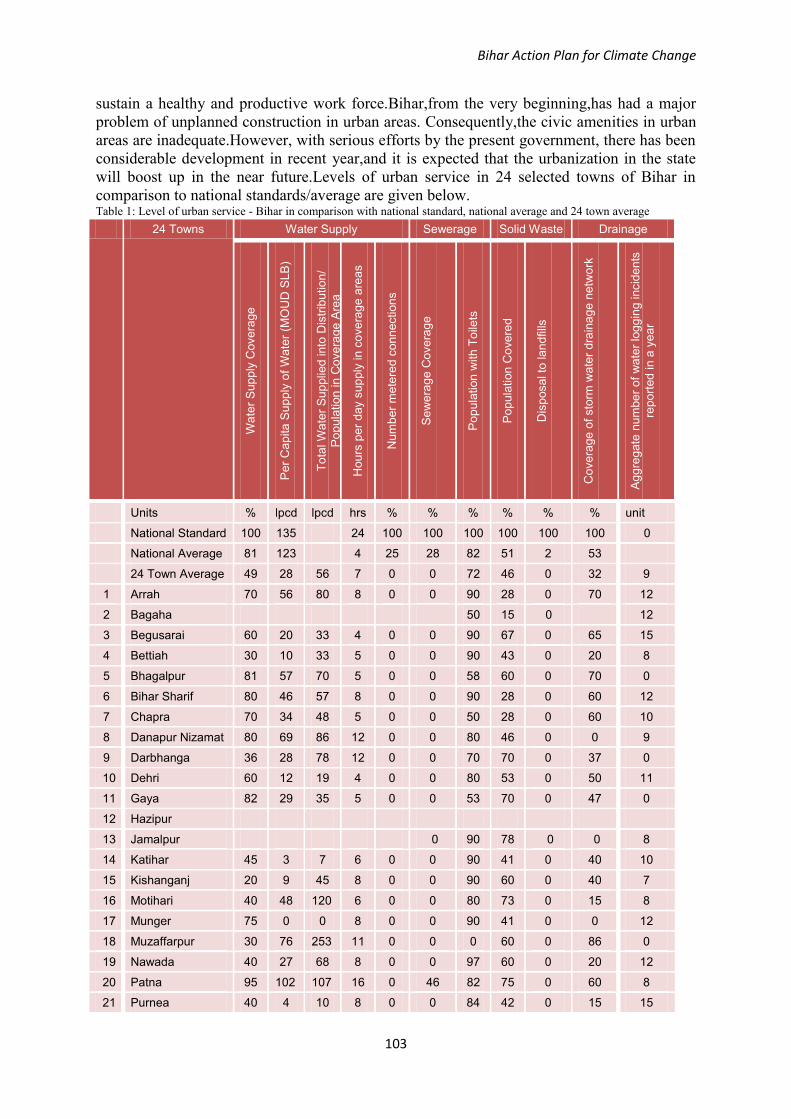
Bihar Action Plan for Climate Change
103
sustain a healthy and productive work force.Bihar,from the very beginning,has had a major problem of unplanned construction in urban areas. Consequently,the civic amenities in urban areas are inadequate.However, with serious efforts by the present government, there has been considerable development in recent year,and it is expected that the urbanization in the state will boost up in the near future.Levels of urban service in 24 selected towns of Bihar in comparison to national standards/average are given below. Table 1: Level of urban service - Bihar in comparison with national standard, national average and 24 town average
24 Towns Water Supply Sewerage Solid Waste Drainage W
ater
Sup
ply
Cov
erag
e
Per
Cap
ita S
uppl
y of
Wat
er (M
OU
D S
LB)
Tota
l Wat
er S
uppl
ied
into
Dis
tribu
tion/
P
opul
atio
n in
Cov
erag
e A
rea
Hou
rs p
er d
ay s
uppl
y in
cov
erag
e ar
eas
Num
ber m
eter
ed c
onne
ctio
ns
Sew
erag
e C
over
age
Pop
ulat
ion
with
Toi
lets
Pop
ulat
ion
Cov
ered
Dis
posa
l to
land
fills
Cov
erag
e of
sto
rm w
ater
dra
inag
e ne
twor
k
Agg
rega
te n
umbe
r of w
ater
logg
ing
inci
dent
s re
porte
d in
a y
ear
Units % lpcd lpcd hrs % % % % % % unit
National Standard 100 135 24 100 100 100 100 100 100 0
National Average 81 123 4 25 28 82 51 2 53
24 Town Average 49 28 56 7 0 0 72 46 0 32 9
1 Arrah 70 56 80 8 0 0 90 28 0 70 12
2 Bagaha 50 15 0 12
3 Begusarai 60 20 33 4 0 0 90 67 0 65 15
4 Bettiah 30 10 33 5 0 0 90 43 0 20 8
5 Bhagalpur 81 57 70 5 0 0 58 60 0 70 0
6 Bihar Sharif 80 46 57 8 0 0 90 28 0 60 12
7 Chapra 70 34 48 5 0 0 50 28 0 60 10
8 Danapur Nizamat 80 69 86 12 0 0 80 46 0 0 9
9 Darbhanga 36 28 78 12 0 0 70 70 0 37 0
10 Dehri 60 12 19 4 0 0 80 53 0 50 11
11 Gaya 82 29 35 5 0 0 53 70 0 47 0
12 Hazipur
13 Jamalpur 0 90 78 0 0 8
14 Katihar 45 3 7 6 0 0 90 41 0 40 10
15 Kishanganj 20 9 45 8 0 0 90 60 0 40 7
16 Motihari 40 48 120 6 0 0 80 73 0 15 8
17 Munger 75 0 0 8 0 0 90 41 0 0 12
18 Muzaffarpur 30 76 253 11 0 0 0 60 0 86 0
19 Nawada 40 27 68 8 0 0 97 60 0 20 12
20 Patna 95 102 107 16 0 46 82 75 0 60 8
21 Purnea 40 4 10 8 0 0 84 42 0 15 15

Bihar Action Plan for Climate Change
104
24 Towns Water Supply Sewerage Solid Waste Drainage
Wat
er S
uppl
y C
over
age
Per
Cap
ita S
uppl
y of
Wat
er (M
OU
D S
LB)
Tota
l Wat
er S
uppl
ied
into
Dis
tribu
tion/
P
opul
atio
n in
Cov
erag
e A
rea
Hou
rs p
er d
ay s
uppl
y in
cov
erag
e ar
eas
Num
ber m
eter
ed c
onne
ctio
ns
Sew
erag
e C
over
age
Pop
ulat
ion
with
Toi
lets
Pop
ulat
ion
Cov
ered
Dis
posa
l to
land
fills
Cov
erag
e of
sto
rm w
ater
dra
inag
e ne
twor
k
Agg
rega
te n
umbe
r of w
ater
logg
ing
inci
dent
s re
porte
d in
a y
ear
22 Saharsa 24 6 25 6 0 0 93 28 0 15 8
23 Sasaram 40 6 0 0 67 10 0 0 12
24 Siwan 80 29 36 6 0 0 74 31 0 0 15
(A) Water Supply:The water supply situation in Bihar is highly critical for per capita supply of water and hours of supply of water for most towns with the exception of Patna, Muzaffarpur, and Danapur Nizamat. For water supply coverage-the situation is highly critical for about half the towns-mainly the towns with smaller populations further from the capital Patna. Town suffering particularly badly from a lack of water supply are lack of water supply are Bettiah, Darbhanga, Katihar, Kishanganj, Motihari, Muzaffarpur, Nawada, Purnea, Saharsa and Sasaram. In particular, Bettiah , Darbhanga, Kishanganj, and Saharsa show very poor water supply service for all three parameters. In many town of Bihar the groundwater resources, which have been the most common water supply source in the past, are generally insufficient to meet the Ministry of Urban Development standard of per capita requirement of 135 lpcd. Meeting this target often requires additional abstraction from surface water sources. The adequacy of surface water supplies near where it is required represents an issue- in the case of some towns such as Gaya surface water abstraction requires very expensive long pipelines to the Ganga River. Another issue is that some of the groundwater sources are contaminated with arsenic and fluoride, which means that the groundwater resource cannot be used in the future to augment supply. This is the situation in Bhagalpur and some other towns.
There has been a lack of investment for new Water Treatment Plants and water supply pipelines-but the fact that many surface water sources are further away from the town adds to the cost of improving the water supply network. Perhaps the most serious issue concerning water supply service delivery is a serious shortage of power supply, which limits the time during which borehole pumps or surface water abstraction or treated water delivery pumps can run. The typical hours of water supply delivery range from 4 to 16 hours with the 24-town average being 7 hours per day. The intermittent water supply service delivery is due to interruption of the power supply.
There is inadequate O&M budget to run water treatment plants, lack of staff both at managerial and technical level to manage the water supply system and staff need training in modern water utility management and operational techniques. Insufficient revenue is generated from water sales to assist with O&M costs. There is a lack of water meters so it is difficult to charge commercial and high users of water, and also no incentive to stop people wasting water. An improvement in accounting practices in urban local bodies (ULBs) is

Bihar Action Plan for Climate Change
105
required so that water consumers can be identified, and the introduction of billing to ensure that revenue is obtained for the water service delivered. (B) Sewerage:The Bihar sewerage subsector is lagging substantially behind the national standard and national average.The national average standard for sewerage coverage is 28 percent but in Bihar there are very few towns with modern sewerage systems with the exception of town along the GangaRiver like Patna and Bhagalpur. These towns have benefited from specific investments in sewerage infrastructure provided under the National Ganga Action Plan 1985-2000.The initiation of improved sewage disposal and sanitation facilities throughout Bihar has a very high priority.Whilst most town are low to moderate critical for toilet coverage, the disposal of toilet wastes to septic tanks are directly to drains and ditches needs to be addressed.
The issues affecting sewerage are similar to those affecting water supply but the sewerage system issues are more serious that water supply issues. Implementation of sewerage systems in Bihar lags far behind the National Standard and even the National average 28 percent-which itself is low for India by comparison with international standards. The issues are lack of Town Sewerage Master Plan, inadequate water supply, intermittent and unreliable power supply for sewage pump stations and powering sewage treatment plants (STPs), lack of investment in sewerage infrastructure, inadequate capital & O&M budget for sewerage systems, lack of specially trained sewerage management and O&M staff. Need for training in of sewerage utility management, inadequate revenue, lack of understanding of wastewater treatment chemistry and lack of wastewater laboratory facilities. Non availability of land for Sewage Treatment Plants is the major issue.
In Patna there are four STPs with a capacity of 109 mld and 46 percent of the city is connected to a sewerage system. In Bhagalpur wastewater from drains is trapped before discharge to Ganga River and conveyed in a 12 km long trunk sewer for treatment in an 11 mld capacity STP. There is no underground sewerage network in Bhagalpur. In Chhapra there is small STP, which is not functional. In Munger there is an incomplete STP. This represents the extent of secondary sewage treatment systems in Bihar. (C) Solid Waste Management: An average of only 2 percent of cities in India have modern sanitary engineered landfills and so Bihar is not lagging behind the national solid waste average for landfill disposal. About half of the towns in Bihar are highly critical for solid waste collection. Nevertheless the widespread practice of disposing of garbage along the roadside or just beyond town limits represents a serious health risk to communities from vermin and flies as well as being unsightly and offensive. The completion of Master Plans and the construction engineered landfills in towns greater than 100,000 population therefore have very highly priority. The issues affecting solid waste management are lack of Solid Waste Master Plans, no landfill site identified, lack of investment in solid waste management, inadequate capital and O&M budget for garbage disposal, garbage which is collected is disposed of indiscriminately at the side of the road or at town boundaries (e.g. Gaya), effect on the environment and public health effects of indiscriminate garbage disposal and lack of trained staff. Non availability of land for processing & disposal of waste is the major issue. (D) Drainage:For drainage the situation in Bihar is highly critical for storm water drainage coverage for 75 percent of towns with the exception of Patna, Muzaffarpur, Bhagalpur, Arrah and Begusarai. The coverage of 86 percent is misleading for Muzaffarpur as the capacity of the storm water system in Muzaffarpur is inadequate and Muzaffarpur frequently floods in the wet season due to lack of storm water pumping capacity (Muzaffarpur lies in a basin) Darbhanga is another town that urgently needs drainage and flooding problems addressed. The issues affecting drainage are lack of Drainage Master Plans, limited capacity of city storm water drainage channels ,periodic and serious town flooding due to monsoon, use of
Bihar Action Plan for Climate Change
106
open drains for disposal of sewerage and toilet wastes, lack of storm water pump stations to clear flooding from monsoon rains, lack of investment in drainage infrastructure,inadequate capital & O&M budget for drainage management, effect on the environment and public health effects of flooding and use of drains and ditches for sanitation and lack of trained staff. An important issue is also lack of and intermittent power supply for drainage pump station, narrow crowded streets and insufficient space for storm water drains, pipes, and box culvertsparticularly in crowded city centres, lack of management, lack of staff and inadequate revenue. For example-in both Muzaffarpur and Darbhanga there is a problem with the limited capacity of city storm water drainage channels and a lack of storm water pumping stations. Darbhanga is affected by frequent floods,especially during the monsoon. In both towns the topography is saucer shaped with low elevation in the centre of the town. Two major flooding events, occurred in Darbhanga in 1987 & 2004, when river water entered the town. 9.2Keys Issues
The State’s urban development sector faces a number of key challenges. With growing urban populations across all the cities and towns, the existing infrastructure and services deficit is only likely to widen further increasing the risk to these agglomerations unless urgent steps are taken. The institutions responsible for providing the civic amenities are themselves starved of resources; while reform measures are underway, the financial health of urban local bodies in the state is a cause of concern. Further, urban roads congestion and traffic management are major problems in most cities and towns. Urban Local Bodies (ULBs) lack skilled manpower for O&M of infrastructure. 9.3 Existing/On-going Initiatives
For development of basic infrastructure in the urban areas, the central government launched Jawaharlal Nehru National Urban Renewal Mission(JNNURM) in 2005-06. This Mission is for period of seven years and the cities covered are encouraged to take steps to bring improvements in the existing civic service levels in a sustained manner. Only two cities of Patna and Bodhgaya from Bihar are selected under the Mission. However, in the remaining towns, the schemes like Urban Infrastructure Development Scheme for Small and Medium Towns(UIDSSMT) and Integrated Housing and Slum Development Programme (IHSDP) have been taken up.
The JNNURM for the two cities broadly consisted of two components of (i) Urban Infrastructure and Governance (UIG); and (ii) Basic Services for Urban Poor (BSUP). The components under UIG include urban renewal, water supply (including desalination plants), sanitation and sewerage, solid waste management, urban transport, development of heritage areas and preservation of water bodies. Under the head of Urban Infrastructure and Governance, the schemes worth Rs. 758 crore have been sanctioned by the central government till dateof which the share of central government was Rs. 420.10 crore and that of state government Rs. 338.31 crore. However, the funds released against the shares were Rs. 111.26 crore by the central government and Rs. 103.67 crore by the state government. In Patna, the approved works on solid waste management is under progress. The tenders for the works relating to solid waste management and water supply scheme in Patna Agglomeration Area, and water supply and sewerage scheme in Bodhgaya have been floated. The plan to improve the water supply in these bodies has been approved.
Under the component of BSUP, there is a provision of housing scheme for urban poor, primarily the slum dwellers. Under this scheme, the work in Patna and Bodh Gaya are going on at four sites, and the work on 368 housing units is in progress. The work under this scheme is implemented by the Housing and Urban Development Corporation(HUDCO), and undertaking of the central government. Under this scheme a total sum of Rs. 709.98 crore has been approved, of which state’s share is Rs. 391.40 crore.Of the total sanctioned amount till date,the central share is Rs. 78.19 crore and state’s Rs. 70.93 crore. The main objective of

Bihar Action Plan for Climate Change
107
IHSDP programme is to provide housing and other basic infrastructure like roads,drainage, community buildings, community toilets, and bathrooms to the poor residing in the slum areas.The construction work on housing units is going on in 14 towns and 1616 units are completed. The central government has released the instalment for the work in four other towns. Under UIDSSMT, a project of Rs. 152.57 crore has been sanctioned for the construction of road-cum- drainage in nine towns. Besides this, a sum of Rs. 98.72 crore has been sanctioned for water supply in Muzaffarpur and Rs. 9.84 crore for solid water management in Ara town. A sum of Rs. 9.74 crore has been spent till date.The National Ganga River Basin Authority (NGRBA) has been established for effecting improvements in facilities like sewerage, solid waste management etc. in 20 towns along the river Ganga; however, the central government has sanctioned projects only for construction of sewerage in four towns in the state. The State has also set up the Bihar Urban Infrastructure Development Corporation Ltd. (BUIDCo) with a view to accelerate infrastructure development activities across all ULBs. BUIDCo has been mandated the role of management of urban infrastructure projects in the State. Samvardhan—the Support Programme for Urban Reform (SPUR) has been initiated for capacity building of urban bodies in the state. “Samvardhan” is a six-year partnership programme (2010-2016) between the Government of Bihar and United Kingdom’s Department for International Development (DFID,UK). The Government of Bihar has initiated the urban reforms programme to enable holistic development of urban areas, that continue to present myriad development challenges including the lack of basic urban services, issues in local functionaries for improved urban services,a number of institutional and management aspects, impede urban economic growth and quality of life. The felt need to strengthen institutional and technical capacities of the State for urban development, guides the design of the “Samvardhan”.
The goal of Samvardhan is “ Economic growth and poverty reduction significantly accelerated in Bihar by 2016.” The programme aims to significantly enhance the ability of identified ULBs to provide urban services and attract private investment in the state. It is based on the premise that effective urban centres play a significant role in economic growth and poverty reduction by providing the nuclei for greater economic activity and services. The programme will cover 28 urban centres that are expected to becomes hubs for economic activities and thereby benefit the wider state. The outcome of this programme will directly improve the quality of services received by 6.36 million urban citizens, of which 2.83 million are urban poor. The programme also expects to benefit a large number of people from nearby rural areas with a strong economic linkage to these towns. Areas of programme focus are as follows:
Urban Governance and Planning: Strengthen urban policy,institutions and governance
Municipal Finance and Procurement: Enhance capabilities of ULBs to mobilize resources and to manage them more effectively
Municipal Infrastructure: Plan, implement and manage city-level infrastructure and services
Local Economic Development: Increase municipal capacity to attract private investment in urban areas for inclusive growth
Social Development, Poverty and Livelihood: Facilitate development of poor community through sustainable mechanisms for empowerment and livelihoods.
There are 1835 slums in the jurisdiction of 28 urban local bodies and the state government is committed to develop all these slums under the State Slum Policy, 2011.DFID has made plans for up-gradation of these slums by providing basic amenities, including proper roads,community centres and drainage networks. The state government has developed

Bihar Action Plan for Climate Change
108
infrastructure development works in 56 slums of 28 towns which include construction of 5170 individual toilets. It has been decided to develop another 1402 urban slums settled on own private land in next two years.Rs. 400 Crores for infrastructure development works in 1402 slums has already been approved by the State Government. About 90,235 individual toilets will be constructed in 1402 slums. Plans for 360 slums have already been prepared. The Asian Development Bank(ADB) has also agreed to provide technical suppot to prepare Bihar Urban Development Project. The ADB would provide a loan of $200 million under Multi Tranche Financing Facility and the work is expected to begin from the next fiscal. There is currently no Town Planning Act in Bihar. The Act is essential for earmarking the metropolitan area and drawing of any scheme, since town planning can only be done in a given legal context. The Ahmedabad based Centre for Environment Planning and Technology (CEPT) is formulating a MasterPlan for Patna city. Services of HUDCO have also been obtained for preparation of Master Plan of other corporation towns. Bihar’s first Town and Country Planning Act has also been prepared and is under approval from state Government. On approval, the legislation will guide planned urban development in Bihar. The proposed Act will also include norms for conservation of important historical structures in the state. Other key achievements in 2011-12 include:
Bihar Municipal Act 2007 amended City Development Plans prepared for 28 project towns Bihar State Slum Policy 2011 approved by Government Double Entry Accounting, Listing & Valuation of Assets initiated in 23 ULBs Digital GIS Base Maps prepared for 18 towns. Digital GIS Base Maps for another 11
towns are also under preparation. Computers & software provided to all ULBs Computerized Births & Deaths registration operational in 22 ULBs 10 City Business Plans prepared Guidelines of Siting of Sewage Treatment Plant prepared Guidelines of Siting Landfill sites Generic Environmental Management Plan City Sanitation Plans of 40 towns prepared Stamp Duties Reduced from 18 percent to 6 percent DPRs for SWM in 35 towns Prepared DPRS for Sewerage and Drainage for 42 towns prepared of which 10 towns approved
by Govt. of India under NGRBA, JNNURM and UIDSSMT Energy Audit & Water Production Assessment has been conducted for 250 tube well
pumps and 100 sewerage & drainage pumps. Environmental Profile and Fixing of Environmental Bench Marks for 28 towns has
been done including Climate Change Vulnerability Mapping. The recommended measures to mitigate the adverse impact on Air, Water, Noise & Soil environment due to ou of limit parameters are elaborated in the enclosed Annexure-A.
9.4 Priorities Given the urban scenario in the State, the following strategies will be adopted in 5thFYP of the State:
Building up of a comprehensive and consistent municipal database- a well – structured uniform needs to be prepared to compile urban datum and update it periodicall across all the ULBs. Mapping of municipal areas will be digitized in a geographical information system (GIS) enabled framework. It need not necessarily be done with aerial imageries (CARTOSAT II) given the huge cost implication. The most cost effective way will be to digitize the cadastral maps and attribute the spatial

Bihar Action Plan for Climate Change
109
features (through GIS-MIS integration) in it including the contouring with total station survey as done by many ULBs across the States of the country.
Pending the preparation of master plans, a uniform set back, height, and coverage regulation may be enforced across the urban settlements where the master plans have not yet been prepared. No building plan is sanctioned unless the same conforms to the coverage, height, and set back regulations.
Effective Public Transportation System including BRTS and Patna Metro Rail will be implemented. Conducting feasibility study of Patna Metro Rail Corporation is underway.
Land being a principal constraint in project implementation, securing land availability free from any encumbrances will be ensured before formulating any project.
Community participation (Area Sabhas for UIDSSMT and IHSDP and neighborhood groups, neighborhood committees,CDS for SJSRY) will be ensured.
For disaster preparedness and mitigation, an extensive screening of buildings will be done across the urban settlements; retrofitting or reconstruction will be carried out by modifying the Building Byelaws.
ULBs would plan for the convergence of all government programs being / to be implemented within their jurisdiction in consultation with the District Collector by synergizing the efforts of all stake holder till the activation of DPC. The respective priorities, agenda, and strategy of different departments/ institutions involved in urban development will be consolidated through coordination and cooperation amongst the concerned institutions/ organizations.
Ward index will be prepared to prioritize the schemes across a municipal area. Dumping ground will be delineated for all the 141 ULBs where such a dumping
ground is not yet available. Vermi-composting or bio composting will be popularized by each ULB at ward levels so far as practicable. Local clubs/ NGOs will engaged to popularize and implement door-to-door garbage collection and garbage segregation at source.Disposal of rejects from processing Municipal Solid Waste from cluster of towns on Regional Landfill will be encouraged. 14 Regional Landfill sites have already been identified to cover 104 towns.
Projects like construction of wholesale market, cold storage, godowns, truck terminal will be prepared in view of their high demand and sustainable remunerative aspects.
At least one planned vending zone in each town will be developed in 28 towns so as to rehabilitate footpath street vendors and thus avoiding road congestion enabling smooth traffic in the towns.
Piped water supply to households through metering will be planned.Given the experience of low recovery of water charges from individual connections, water charge may be imposed on the neighborhood overhead tank, the payment of which will be collected from the respective neighborhood committees (Area Sabhas).Adequacy of water will be weighed against the cost implication and the willingness to pay of the consumer to reduce the quantum of non- revenue water. Care will be taken to reduce the unaccounted flow of water (transit loss of water). The soft path water demand management in residential cluster may include three water demand management in techniques- economic, structural, and operational, and socio political. Although a minimum/ subsidized domestic tariff for lifeline consumption up to a modest quantity will be levied, telescopic tariff will be followed for consumption beyond lifeline supply and up to a limit. Linking of tariff with variations in cost of energy and raw water quality should guide the fixation of tariff.

Bihar Action Plan for Climate Change
110
PPP approach will be adopted wherever feasible from water treatment down to water billing and collection.
Better coordination between national and state level organizations dealing with water will be ensured to avoid duplication and ambiguity of functions that discourages unitary analysis of this scarce resource and pre-empt vague decisions taken tin isolation.
Sewage treatment by growing non-edible crops such as trees (Eucalyptus, Poplar and Subabul) on raw sewage will be popularized. Sewerage will be planned for only those towns where urban water supply and electricity could sustain the system since it requires enough electricity to pump voluminous water for flushing.
Natural water bodies/ wetlands and natural waterways (other than rivers) will be protected through a detailed rehabilitation plan for discharging treated sewage water into them. Detailed Project Report for, renovation, rehabilitation and redevelopment of MotiJheel&Kerari Lake in Motihari has been prepared and submitted to NLCP, Govt. of India for approval.
Planned Dhobi Ghats & Community Toilets/ Public Toilets in 20 towns settled along the river Ganga will be constructed. Detailed Project Reports are under preparation. DPRs for River Front Development in 8 towns are under preparation.
Behavioural changes towards scientific sanitation habits will be inculated through information, education, and communication( IEC) .
Well-integrated multimodel public transport system will be planned for seamless travel across modes by designing a sound interchange infrastructure and introducing a single ticket over all such systems.
Urban transportation will be incorporated as an important parameter at the urban planning stage rather than being a consequential requirement. Different types of public transport for different segments of commuters will be planned for .Smaller buses alson arterial roads may be a good substitute for private vehicles.
Municipal e- governance is concurrently under implementation with intense e- participation.
As regards to situating the urban street vendors in a planned manner, mono functional use of urban space has to be discarded by accepting its multi functional use. The spatio-temporal attributes of urban attributes of urban land use needs to be acknowledged. It will be recognized that urban land has got secondary and tertiary functions.
Urban planning (especially traffic management) has to be resorted to for re- solving livelihood- congestion trade-off. The natural propensity of the street vendors to hawk in certain places at certain times in response to the demand for their goods/ services would also be ensured. There is a need to acknowledge the importance of pedestrian traffic in urban transport system.
In addition to the above strategies, the state also aims to prepare a comprehensive framework of urban policy and planning in view of recommendations of the Report of Indian Urban Infrastructure and Service. The key elements of this framework are:
Increasing investment in urban infrastructures from 0.7 percent of GDP in 2011-12 to 1.1 percent by 2031-32
In association, increasing spending on maintaining assets- old and new Engineering in renewal and redevelopment of urban areas including slums. Improving regional and metropolitan planning with integration of land of land use and
transportation Ensuring access to services for all including the poor to meet the recommended norms Reforming system for service delivery

Bihar Action Plan for Climate Change
111
Improving governance of cities and towns by unified command under a Mayor Strengthening and securing the financial base of ULBs State Government providing an enabling environment for ULBs to discharges their
enhanced responsibilities Central Government launching a New Improved JNNURM (NUNNURM) that
focuses on capacity Building and support urban reforms within a program approach Transport and communication sector will be given a much higher priority than in the
Eleventh Plan. 9.5 Perceived Climate Impacts
No in depth climate related vulnerability and risk analyses currently exist for the State. However, it is known from available evidence from across the world that climate change causes vulnerability of human settlements, which is related to extreme weather events, and such gradual changes in the climate exceed the adaptive capacity of human systems. Climate change adds to the existing stress on the sustainability of human settlements and society. Non- climate sources of change like rapidurbanization are often the main source of stress. The concentration of urban population in a few large cities has led to tremendous pressure on civic infrastructure systems like water supply, sewerage and drainage, solid waste management, parks and open spaces, transport, etc. It has also led to deterioration in the quality of city environment. In several cities, the problems of traffic congestion, pollution, poverty, slums, crime and social unrest are assuming alarming proportions. Climate change is likely to exacerbate the existing stresses that these settlements already face. It may also impact measures that are being undertaken for sustainable development of these areas. Human settlements are accustomed to variability in environmental conditions and are resilient to normal variations. Vulnerabilities arise out of experiences that are beyond the normal experience and due to limited adaptive capacity.Climate change is likely to affect infrastructure related to water, sanitation, energy, transportation, health- care, fire services, and other forms of emergency measures. Climate change could affect water supply systems in any number of ways .It can affect the water demand for drinking and cooling systems. Where climate change leads to failure of small local water sources such as wells, it could lead to greater demand for regional water supplies. Changes in precipitation patterns could lead to greater demand for regional water supplies. Changes in precipitation patterns could lead to reduction in water availability and fall in water tables. In coastal areas it could lead to saline intrusions in rivers and ground water. Loss of melt water could reduce river flows during critical times. A change in water availability and supply also affects sewered sanitation and drainage systems. When watersupplies reduce,sewerage system also become vulnerable. Further, sewage treatment plants are vulnerable to floods, as these are often located near rivers or water bodies. Storm water drainage systems could become frequently overloaded and cause flooding if heavy storms become more frequent due to climate change. The impact of inadequate drainage system in cities like Mumbai is already being felt leading to flooding and huge economic losses. More frequent floods could also present a significant threat if these lead to contamination of floodwaters with faecal material. Climate change may impact upon transport and other infrastructure due to extreme focal climatic experiences, leading to significant economic losses. The urban-heat island effects could get exacerbated due to increase in baseline temperatures, affecting climate comfort of the urban populations and may consequently lead to additional costs in climate control.
The vulnerability of human populations varies with economic, social, and institutional conditions. The poor and the marginalized have little capacity to adapt to changes in climate by adopting such mechanisms as air-conditioning or heating . The traditional coping mechanisms of these vulnerable communities may be over stretched due to additional stresses

Bihar Action Plan for Climate Change
112
related to climate change. Climate change threatens the homes, livelihoods, and health of the urban poor. When disasters strike, their homes may be damaged or destroyed and they may be unable to travel to work causing them to lose money for food and other basic needs. Poor people often live in informal settlements on land, which is susceptible to climate change- flood plains, lowlands, or unstable hillsides. Drains and culverts are frequently blocked with rubbish .Slum dwellers often lack secure tenure, proper shelter, water, sanitation, electricity and other services. Most have no insurance. Climate change may add to their problems. 9.6 Strategies
The Urban Development Department recognizes that while cities are exposed to considerable challenges and risks from climate change and its impacts, cities have the potential to build resilience by a range of measures aimed at addressing multiple stressors and risks. As such, the Department is committed to taking all necessary steps towards this under the BAPCC . It would, adopt a set of broad guiding principles the objectives that are articulated in the National Mission for Sustainable Habitat.
To exploit the potential for mitigating climate change through reduction in demand for energy in the residential and commercial sectors by adopting various energy efficiency and conservation measures. Energy efficient street lights with LED lamps will be installed in 11 corporation towns.Rs. 24 Crore for energy efficient LED street lights has already been allotted to BUIDCo for implementation.With respect to adaptation, the aim would be to promote greater use of renewable sources and to reduce dependence on a single source. In formulating climate change strategies, mitigation efforts need to be balanced with those aimed at adaptation;
To adopt a comprehensive approach in the management of water, municipal solid waste and waste water with view to realize their full potential for energy generation, recycling and reuse, and composting. Bio-methanation plants will installed in each town to generate power from treatment & disposal of vegetable market waste.
To address the issue of mitigating climate change by taking appropriate action with respect to the transport sector such as evolving land use and transportation plans, achieving a modal shift from private to public mode of transportation, encouraging the use of non- motorized transport, improving fuel efficiency, and encouraging use of alternate fuels ,etc. To evolve strategies for adaptation in terms of realignment and relocation, design standards and planning for roads, rail and other infrastructure to cope with warming and climate change;
To reorient urban planning with a view to address climate change with respect to mitigation as well as adaptation and improve the responsiveness to disasters by strengthening community based disaster management and to provide better warming systems for extreme weather events;
To facilitate adoption of technologies and research and development which lead to energy efficiency and reduction in emissions;
To promote patterns of urban growth and sustainable urban development that help secure the fullest possible use of sustainable transport for moving freight, public transport, and encourage cycling and walking; thereby reducing the need to travel, especially by car;
To promote measures that improve resilience of infrastructure and human systems to cope with vulnerability consistent with social cohesion and inclusion;
To conserve the natural resources that are the key to sustainability of human habitats like water vulnerability consistent with social cohesion and inclusion;
To conserve the natural resources that are the key to sustainability of human habits like water , clean air, flora and fauna, recognizing the integrated nature of human and other systems;

Bihar Action Plan for Climate Change
113
To reflect the development needs and interests of communities that are especially vulnerable to climate change;
To encourage competitiveness and technological innovation in mitigating and adapting to climate change;
To develop a transparent, flexible, predictable, efficient , and effective planning system that will produce the quality development needed to deliver sustainable development and secure sustainable communities. National policies and regional and local development plans provide the framework for planning for sustainable development and for that development to be managed effectively;
To encourage community involvement in ensuring more sustainable patterns of development;
To bring together key stakeholders at the central, state, district and local levels for a coordinated and comprehensive response to vulnerabilities arising out of climate change; and
To promote and strengthen efforts aimedat generating awareness related to climate change
Towards improving scientific knowledge and evidence base and understanding of climate change and its impacts, the Department will take necessary steps towards collating available data/ information of impacts of climate change on cities, their systems, infrastructure, and people. It will begin the process of developing the necessary systems, databases, and protocols for collecting and collating the necessary evidence base on an on –going basis.
Towards improving governance mechanisms, institutional decision- making, and convergence, a Climate Cell will be formed within the Department, which will also notify climate resilience focal points in all ULBs. Likewise, a climate cell will also be established within BUIDCO, to incorporate climate concerns into all aspects of urban infrastructure planning and implementation in Bihar. Coordination/ convergence opportunities with other sectoral line departments will be analysed, and leveraged as required. Towards building adaptive resilience and contribute to reduction in green house gas emissions, in addition to strengthening urban infrastructure systems under the various projects of the JNNURM and UUDSIP, the Department will proactivity seek to develop plans for developing interventions aimed at improving traffic conditions, reducing journey times, and improving safety of all users and particularly the most vulnerable (pedestrians, cyclists, and motorcyclists) through a combination investments. These will generally focus on major roads and include(i) road widening and strengthening to create greater road capacity,thus relieving congestion and easing traffic flows; car parking restrictions and provision of multistory car parks; and bus and truck terminals, where possible, through PSP to improve passenger convenience and increase road space;(iii) providing traffic management improvement; and (v) street lighting for improved traffic and pedestrian safety and security. These initiatives towards ‘green transportation’ will be encouraged with the help of Transport Department both in the government as well as in private sector.The concept of ‘Green Building’ will be promoted in both the public and private sectors to save energy, water and reduce/ recycle waste. Instructions will be given to the ULBs to enforce water and energy saving in housing sector ‘Rain water harvesting’ will be promoted especially in housing sector.
The Urban development Directorate also plans to promote energy efficiency and appropriate use of solar energy is going to be promoted in street lighting. Adequate use of compact fluorescent lamps(CFLs)/ light emitting diodes (LEDs) will be encouraged to save energy. Solar water heating will be encouraged through Bihar Renewable Energy Development Agency (BREDA).
Emphasis will be given to ‘greening ‘ the towns, and plans will be developed and implemented for increasing the available green cover in the cities and towns in the State.

Bihar Action Plan for Climate Change
114
Cooperation of Forest Department will be sought in the ’greening’ campaign. Appropriate awareness campaigns will be launched for ‘clean environment’.
Provision of rainwater harvesting tanks in all ULB buildings and new constructions in municipal limits will be taken up. Cleaning/ conservation/ beautification of water bodies’ situated within energy efficiency and renewable energy measures that significantly reduce energy use, create jobs, and serve as local demonstration projects; establishment of official or informal energy building codes that reflect the “ state of the art” in energy efficiency; investments in district heating and cooling systems where higher densities that provide or facilitate the provision of a full range of energy efficiency measures to the local community will be other programmes to be developed under BAPCC.
The Department will develop and deploy a range of awareness and capacity building programmes for municipal officials for promoting appropriate measures towards climate resilience in their respective ULBs, as also similar programmes for building awareness on climate change and its impacts for the urban populations. The Department will also seek to converge such efforts with other sectoral initiatives such as health, education, housing,water etc.) and foster inter and intra departmental coordination.
Under JNNURM sub mission namely Basic Services for the Urban Poor and Integrated Housing and Slum DevelopmentProgramme; climate resilient housing models would be advocated for and adopted. Additionally, climate concerns will also be planned and integrated into urban poverty alleviation progammes, such as those under the SwaranJayantiShahriRogarYojna.
The ever-increasing urban population has put tremendous pressure on the budgetary resources of States/ ULBs underscoring the necessary of private sector participation in urban development.The unbundling of services and technological innovations has opened up areas to private sector participation. As such, the Department will proactively explore private sector participation options in various fronts including (but not limited to);
Energy efficient housing; Water supply augmentation and efficiency improvements; Door –to- door collection of municipal and household solid waste, secondary storage,
development of transfer station & transportation, treatment and processing; and disposal, including development of sanitary landfill; integrated municipal solid waste management systems ( with combination of above)
Waste water collection, handling, treatment, and disposal including storm water drainage, sewerage systems including treatment plants, decentralized waste water treatment units, sewerage gas based power generation etc.;
Beautifications and advocacy including awareness campaigns for clean city concepts; Hoarding policy (including energy efficient installations, operation and maintenance
of street lights); and Partnerships for green transportation.
The State will also examine the possibilities and potential for promoting and fostering the use of alternative fuels for vehicles such as CNG and bio-fuels. 9.7 Institutional Linkages and Stakeholders
A range of institutional linkages and partnership is envisaged, including with the Water Resource Department, the Energy Department, BREDA, Disaster Management Department, BUIDCO, the Transport Department, ULBs as well as apart from linkages with academia, civil society, international development agencies, private sector and financial institutions and urban communities in general. 9.8 Linkages with the NAPCC The strategies and actions proposed in the BAPCC under the Urban Development section are consistent with the NAPCC and the National Mission for sustainable habitat. In addition, it

Bihar Action Plan for Climate Change
115
has also linkages with the National Mission for a Green India, National Water Mission, National Mission for Energy Efficiency and the National Solar Mission. 9.9 Sectorial Action Plan and Budget under the BPACC
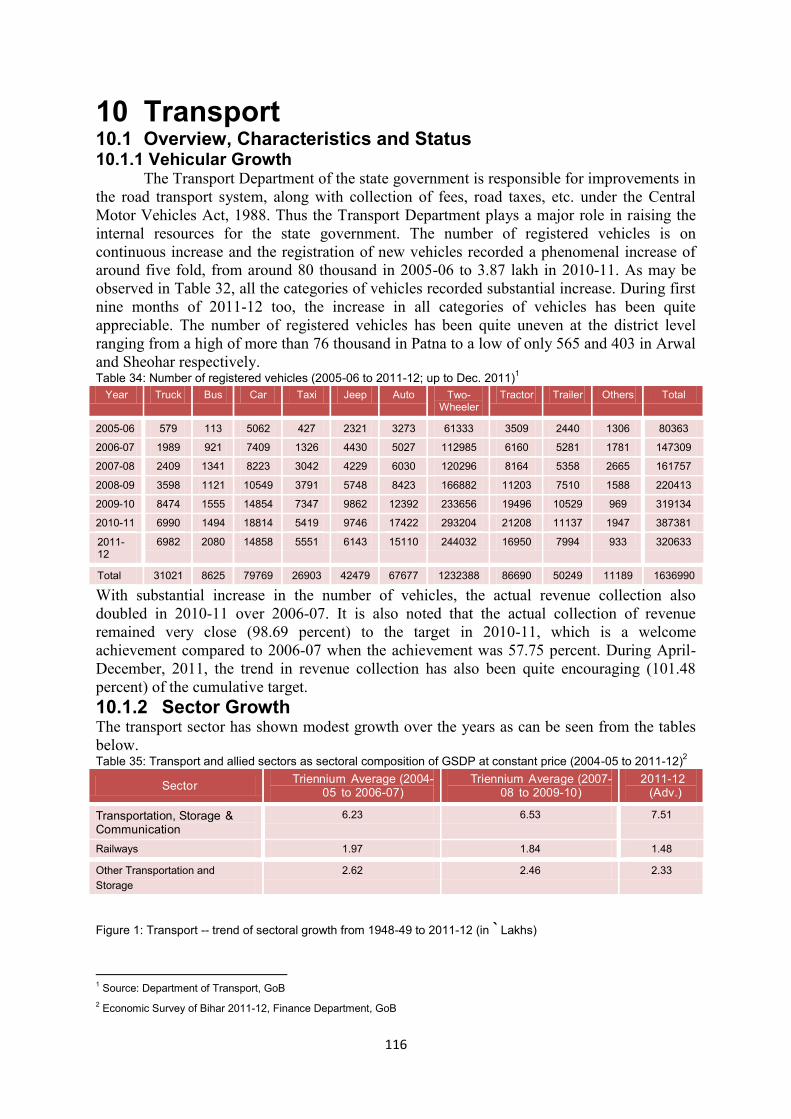
116
10 Transport 10.1 Overview, Characteristics and Status 10.1.1 Vehicular Growth
The Transport Department of the state government is responsible for improvements in the road transport system, along with collection of fees, road taxes, etc. under the Central Motor Vehicles Act, 1988. Thus the Transport Department plays a major role in raising the internal resources for the state government. The number of registered vehicles is on continuous increase and the registration of new vehicles recorded a phenomenal increase of around five fold, from around 80 thousand in 2005-06 to 3.87 lakh in 2010-11. As may be observed in Table 32, all the categories of vehicles recorded substantial increase. During first nine months of 2011-12 too, the increase in all categories of vehicles has been quite appreciable. The number of registered vehicles has been quite uneven at the district level ranging from a high of more than 76 thousand in Patna to a low of only 565 and 403 in Arwal and Sheohar respectively. Table 34: Number of registered vehicles (2005-06 to 2011-12; up to Dec. 2011)1
Year Truck Bus Car Taxi Jeep Auto Two-Wheeler
Tractor Trailer Others Total
2005-06 579 113 5062 427 2321 3273 61333 3509 2440 1306 80363
2006-07 1989 921 7409 1326 4430 5027 112985 6160 5281 1781 147309
2007-08 2409 1341 8223 3042 4229 6030 120296 8164 5358 2665 161757
2008-09 3598 1121 10549 3791 5748 8423 166882 11203 7510 1588 220413
2009-10 8474 1555 14854 7347 9862 12392 233656 19496 10529 969 319134
2010-11 6990 1494 18814 5419 9746 17422 293204 21208 11137 1947 387381
2011-12
6982 2080 14858 5551 6143 15110 244032 16950 7994 933 320633
Total 31021 8625 79769 26903 42479 67677 1232388 86690 50249 11189 1636990
With substantial increase in the number of vehicles, the actual revenue collection also doubled in 2010-11 over 2006-07. It is also noted that the actual collection of revenue remained very close (98.69 percent) to the target in 2010-11, which is a welcome achievement compared to 2006-07 when the achievement was 57.75 percent. During April-December, 2011, the trend in revenue collection has also been quite encouraging (101.48 percent) of the cumulative target. 10.1.2 Sector Growth The transport sector has shown modest growth over the years as can be seen from the tables below. Table 35: Transport and allied sectors as sectoral composition of GSDP at constant price (2004-05 to 2011-12)2
Sector Triennium Average (2004-05 to 2006-07)
Triennium Average (2007-08 to 2009-10)
2011-12 (Adv.)
Transportation, Storage & Communication
6.23 6.53 7.51
Railways 1.97 1.84 1.48
Other Transportation and Storage
2.62 2.46 2.33
Figure 1: Transport -- trend of sectoral growth from 1948-49 to 2011-12 (in ` Lakhs)
1 Source: Department of Transport, GoB 2 Economic Survey of Bihar 2011-12, Finance Department, GoB

117
10.1.3 Bihar State Road Transport Corporation (BSRTC) For proper development of transport machinery, the central government had notified
Road Transport Act, 1950, under which bus services were started by the Transport Department in 1953. Under this Act, the Bihar State Road Transport Corporation was established in May 1959 with primary objective of making safe, adequate, economical and systematic bus services available to the passengers. Till 1999-00, ` 74.75 crore was granted as share capital to the Corporation by the Bihar government, and ` 26.52 crore by the central government. For revival of the Corporation and make it self-reliant, a Tripartite Committee was constituted by the Hon'ble Supreme Court, which recommended a package of ` 113 crore. Out of this, a sum of ` 107.34 crore was given as loan by the state government to the Corporation, and Government of Jharkhand also gave a sum of ` 8.62 crore. Under the economic package, the Corporation purchased 637 new buses during 1998 to 2010. In the light of Hon'ble Supreme Court's order, the Corporation also received a total of ` 555.42 crore — ` 458.77 crore from Bihar government and ` 96.65 crore from Jharkhand Government for payment of arrear salaries, retirement benefits, etc. The Corporation has undertaken various following steps to improve its performance during the last two years. 10.1.4 State Waterways and Inland Navigation As of now, there is virtually no organised inland navigation in the waterways of the state, and there is ample scope for development in this sector in Bihar. With promotion of waterways and navigation in the state, the rural economy can be substantially transformed. 10.1.5 Railways
The state has an extensive railway network providing vital connectivity within the state, as also with other areas in the country. The total rail length exceeds 5400 Kms. in the state. Remote places like Darbhanga, Madhubani, etc. have been connected by broad gauge railway lines with important cities like Delhi, Mumbai, Chennai, etc. The East Central Region, one of the biggest railway zones in the country with five divisions of Danapur, Mughal Sarai, Dhanbad, Sonepur, and Samastipur, has its headquarters at Hajipur. It has more than 3000 passenger coach holding capacity, which requires periodical overhauling on a regular basis in order to maintain full safety measures. Earlier, the railways have been sending coaches to Lilluah in West Bengal and Gorakhpur in Uttar Pradesh for their immediate overhauling. But in near future, this work will be done by the Coach Maintenance Workshop at Harnaut in Nalanda district, an ambitious project of the railways. The Harnaut Workshop is second of its kind in the country, after Perambur in Tamil Nadu and is spread in an area of about 113 acres of land. The railways have completed work on wheel bogies shop, wheel axle shop, heavy repair shop, carriage store shop, plant care shop, and light repair shop. It will become fully operational in the next financial year. Of the 975 employees required, about 200 have already joined the workshop. Another railways factory is the wheel factory at Belapur in Chhapra. The work on this factory is going on in full swing and production in the factory is likely to start shortly. This will be the first major factory to be made functional in Bihar with an estimated cost of ` 1417.23 crore. The factory has a sanctioned strength of 900 staff, including the officials. It is likely to generate about ` 180 crore worth business every year, providing a boost to the socio-economic condition of the area. The wheels are presently being manufactured at Bangalore and Durgapur and the railways have also been importing wheels from other countries. This wheel factory at Chhapra would save huge foreign exchange being spent on importing wheels. The railways are to start work on multi-functional complexes (MFCs) on the stations with religious and tourist importance and 160 places in the country have been identified for this purpose. In Bihar, as many as five MFCs are proposed to be built at Gaya, Hajipur, Sasaram, Islampur and Bhagalpur. The railways intend to complete these projects within two years. The plot size for building each MFC will vary from 1000-3000 square meters, depending upon the

118
availability of vacant land near railway station. Each MFC is likely to involve huge expenditure and will have shopping centres, food stalls, restaurants, bookstalls, telephone booths, medicine shops, budget hotels, and underground parking for vehicles. 10.1.6 Airways
The civil aviation sector in the country has resumed growth in 2010, after it emerged from the global financial crisis. Bihar too felt the impact of economic slowdown, but thereafter resumed growth in domestic traffic. Indeed, Patna's airport emerged as number one among 46 airports in the country in terms of growth of domestic passengers as well as domestic aircraft movement for the second consecutive year in 2010-11. In terms of total number of passengers, Patna airport has overtaken the airports in Port Blair, Varanasi, Vadodra, Jammu, Raipur, Agartala, Chandigarh, and Madurai. There is virtually no international aircraft movement in the state, since the state does not have an international airport. Although Gaya airport is declared as an International airport, it is only nominal, because the big aircrafts do not operate on regular basis from here. While international aircraft movements are almost absent, the number of domestic flights took a leap from 3814 in 2004-05 to 9547 in 2010-11. Similarly, number of domestic passengers jumped from 1.76 lakh to 8.38 lakh during the same period. As in discerned, while the aircraft movements registered an increase of about two and a half times, the number of passengers recorded a jump of nearly five times. This goes to establish that the aircraft coming to Patna operate with substantial capacity utilisation. A few international carriers are also trying to get permission for operating from here. The airport authorities recently received requests from a reputed carrier to launch air services from Patna to Nepal. Such unprecedented growth in air traffic at the Patna airport could be achieved despite the fact that the Airport Authority of India declared it as dangerous on the ground of its short runway and advised the state government to shift it out of the city. The process of setting up a new airport has finally been initiated by the state civil aviation department. In order to promote civil aviation, a proposal to set up a Civil Aviation Corporation to work as an independent body is under active consideration of the state government. The Airports Authority of India has recently introduced many new passenger facilities at the Patna airport for the comfort of passengers like new cyber cafe, additional visitors chairs, money exchange counter, mini snack counter and pharmacy counters. For safety and security of passengers, there is a provision of new fire and rescue vehicles, perimeter lighting, runway re- carpeting, new ambulances, increased boundary wall height and additional ramp for parking of airline equipment. Besides, the closed circuit television systems have also been installed. 10.2 Key Issues Some of the key issues in the sector include:
Increasing congestion, especially in urban agglomerations; increasing air pollution from vehicular emissions Very little public transport facilities especially in urban areas; what exists is largely out-dated vehicle fleets; Virtually no organised inland waterways transport networks/systems.
10.3 Existing/On-going Initiatives The Transport Department of the state government has adopted several measures to improve its functioning.
(i) Presently, the district transport offices in all the 38 districts in the state have been fully computerised under which smart card based registration certificates of vehicles and driving licenses are being issued. This facility in the remaining district of Arwal will be started soon.

119
(ii) Under Motor Vehicles Act, the total carrying weight for each vehicle is predetermined and penalties on overloading are imposed by the Transport Department under Motor Vehicle Act, 1988.
(iii) Enforcement machinery has also been constituted to check the movements of unauthorised and irregular vehicles in the state. Special campaigns have been initiated in this direction by the centralised force of the enforcement machinery in collaboration with the district administration. In 2010-11, a sum of ` 64.06 crore was collected as fine from the defaulters.
(iv) The entrepreneurs from the private sector have been invited to open fitness centres to test the fitness of vehicles and pollution testing centres to check the pollution level of the vehicles and issue fitness certificates and pollution under control certificates to them. There are 144 such licensed centres in the state of which 113 are in public sector and 31 in private sector.
(v) In order to maintain the cleanliness of environment and balance its pollution level, the pollution under control certificates have been made mandatory to be obtained by all types of vehicles on payment of fees.
(vi) The registration system at dealer point has been introduced under which all the vehicles are allotted registration number at the time of purchase itself and the vehicles come out of the show room with number plates. The system is applicable to private non-commercial vehicles.
Some of the key initiatives undertaken by BRSTC include: (i) Around 100 unused and old buses have been repaired and made operational. (vii) Out of 762 dilapidated buses lying unused for the last 15 years, 713 were auctioned as
scrap, which earned a revenue of ` 10.49 crore to the Corporation. (ii) The Corporation is operating 91 buses under PPP mode, and another 280 new buses
are to ply between the district headquarters. (iii) For providing convenient city transport services at Patna, buses have been introduced
on PPP basis. With improvement in services, the number of passengers increased from 3.58 lakh in September 2009 to 6.53 lakh in February 2011, registering an increase of 82 percent. Similarly, the total distance covered increased by 114 percent from 8.90 lakh Kms to 19.10 lakh Kms during the same period. The central government has approved a sum of 115 lakh for preparation of DPR for
development of waterways, after conducting the survey of the Gandak, Kosi and Sone rivers. The project also includes development of tourism through navigation in the Ganga at Patna. The state government has also approved 10 percent of its share and M/s RITES Ltd., an undertaking of the central government, has been appointed as consultants. The agency has submitted a draft report, which includes the feasibilities in the navigation sector in the coming 15 years. This interim report is being examined in the department. 10.4 Priorities The State’s priorities for the 12th FYP period include:
Well integrated multimodal public transport system will be planned for seamless travel across modes by designing a sound interchange infrastructure and introducing a single ticket over all such systems;
Urban transportation will be incorporated as an important parameter at the urban planning stage;

120
Rather than being a consequential requirement, different types of public transport for different segments of commuters will be planned for. Smaller buses along arterial roads may be a good substitute for private vehicles;
Intermediate public transport (IPT) will be promoted to cater intra urban mobility mostly along;
Arterial/low density principal roads. Fare structure of IPT modes will be properly framed and strictly enforced;
Working hours of offices, educational institutions, and commercial establishments will be staggered to avoid the conflict of traffic movement dedicated to these activities; and
Development of waterways navigation system on river Ganga to reduce the cost of transportation.
10.5 Perceived Climate Impacts While there have been no Bihar specific detailed studies on climate change and its relationship to transportation and vice versa, available trends from across the world, show that: Overall demand for transport activity (for both passenger and freight) is growing rapidly; Transport activity is increasingly motorised (private cars for passenger transport and
lorries for freight, almost all of which are propelled by internal combustion engines); and Technological improvements such as fuel-efficient vehicles and alternative power sources
have not been rapid enough to offset the impacts of this growth. These trends translate directly into various costs for the environment, society, and
economy. The transport sector’s consumption of fossil fuels translates into energy-related carbon dioxide (CO2) emissions, which is projected to increase as transportation needs grow, with a direct impact on climate. Additionally, transport-related pollution, noise, and vibration can pose serious threats to human health and wellbeing. Local air pollution is caused by exhaust emissions produced by traffic, mostly in the form of Sulphur Oxides (SOx), Nitrogen Oxides (NOx), Carbon Monoxide (CO), Hydro Carbon (HC), Volatile Organic Compounds (VOC), toxic metals, Lead Particles and Particulate Matter (PM) – including Black Carbon. These emissions represent a large proportion of pollutants, especially in developing cities. Such air pollutants are a cause of cardiovascular/ pulmonary and respiratory disease. For example, exposure to lead can cause increased blood pressure, liver and kidney damage, impaired fertility, comas, convulsions, and even death. Children are particularly vulnerable; they can suffer from reductions in IQ and attention span, learning disabilities, hyperactivity, impaired growth and hearing loss. Road accidents remain a serious public health issue, and many victims tend to be pedestrians, cyclists and motorcyclists, for whom infrastructure provision is often neglected. Climate change is only likely to exacerbate this by impacting available infrastructure assets. Likewise, congestion is caused when the volume of traffic reaches the capacity of infrastructure. It is particularly common in urban areas, where it can severely limit the positive effects of agglomeration. Travel times for public-transport users, as well as pedestrians and cyclists, frequently increase if dedicated infrastructure is not provided. Congestion also increases fuel consumption and the level of pollution, as fuel is still consumed whilst cars are stationary. Again, climate change can exacerbate these impacts, leading to traffic-filled roads that can become physical and psychological barriers that can sever communities and divide entire cities. Roads, railways, and other transport infrastructure can also have a severe impact on the natural environment, from the removal of vegetation during construction or the subsequent fragmentation of habitats and disturbance of animals; such fragmentation, without proper ecological infrastructure planning can severely disturb wildlife and reduce biodiversity.

121
10.6 Strategies The Transport Department recognises that a phased approach will be need to address the issues related to transport and climate change – and this would involve a complete overall revamping of the existing transportation scenario. As such, in the short to medium term, the transport department will seek to: Improve access to bus services and service quality; Improve the poor image of bus and public transport; Put into place mechanisms for proper planning and provisioning of infrastructure
facilities; Improve route and traffic planning, and regulate issue of permits through surveys and
scientific data; Provide/improve passenger information systems, and remove institutional and regulatory
hurdles; Undertake capacity building of personnel in the Transport Department and other agencies
as required; Promote initiatives such as vehicle pooling, etc., especially in cities and towns; Rigorously implement measures for vehicular pollution control; Promote the use of ensure availability of cleaner fuels such as CNG and bio-fuels; and Systematise and ensure uniformity in institutional arrangements for providing public
transport services. In the long term, the Department will undertake necessary feasibility studies for and implement a three-pronged investment strategy to transform the transport sector. This will involve key strategies and steps to (indicatively, but not limited to): Promote access instead of mobility; shift to less harmful modes of transportation; and
improve vehicles towards lower carbon intensity and pollution. A fundamental shift in investment patterns will be sought, based on the principles of avoiding or reducing trips through integrating land-use and transport planning and enabling more localised production and consumption.
Shift to more environmentally efficient modes such as public and non-motorised transport (for passenger transport) and to rail and water transport (for freight)
Invest in public transport and infrastructure that promotes walking and cycling generates jobs, improves wellbeing and add considerable value to the state economy, as well as reduce greenhouse gas emissions;
Improve vehicles, vehicle maintenance, and fuels as a priority to reduce urban air pollution and greenhouse gas emissions;
Adopt green transport policies will also reduce road accidents and alleviate poverty by improving access to markets and other essential facilities.
The Transport Department will undertake to develop a comprehensive Sector Roadmap including strategies for the short, medium, and long-term, with explicit incorporation of climate concerns. 10.7 Institutional Linkages and Stakeholders
Institutional linkages are envisaged with the State Transport Corporation, the Urban Development Department, BUIDCO, Tourism Department, and the State Tourism development Corporation, Indian Railways, other State Road Construction Department, as well as linkages with academia, civil society, international development agencies, private sector and financial institutions, and communities in general.

122
10.8 Linkages with the NAPCC The outlined strategies herein are consistent with the NAPCC in general; they also have linkages with the National Mission on Sustainable Habitat and the National Mission on Energy Efficiency. 10.9 Sectoral Action Plan and Budgets under the BAPCC See Part C, Action Plans and Budgets

123
11 Energy 11.1 Overview, Characteristics and Status 11.1.1 Power Situation in Bihar
Power is a crucial sector of any economy for its overall development, as it is a universal input for nearly all the sectors. Even though the Indian power sector has made substantial progress in making power available to remote areas of the country, the demand for electricity has always outstripped supply. Bihar is no different in this aspect from other parts of the country. In its quest for increasing the availability of electricity, Bihar has adopted a blend of thermal and hydel sources. Bihar has only 493 MW of installed capacity for power. Thermal plants at present account for close to 89 percent of the total installed power generation capacity, with the remaining 11 percent being contributed by the hydel plants. Of late, emphasis is also being laid on the development of non-conventional energy sources, i.e., solar, wind and biomass energy. Bihar has the lowest annual per capita consumption of electricity at 122.11 KWH in the country, against the national average of 778.71 KWH. There is an acute shortage of power not only for peak demand, but even the base demand in the state. It can be seen from Table 34 that the deficit at peak load has been increasing over the years, from 30.9 percent in 2007-08 to 44.5 percent in 2010-11. Similar to peak deficit, energy deficit in 2010-11 was also very high at 6099.18 MU (35.4 percent).
Table 36: Power supply position in Bihar1 Year Peak Demand (MW) Peak Availability (MW) Deficit (MW) Deficit (%)
2007-08 1800 1244 556 30.88 2008-09 1900 1348 552 29.05 2009-10 2500 1508 992 39.68
2010-11 3000 1664 1336 44.53
Given this trend of increasing deficit in power supply, the Central Electricity Authority (CEA) has anticipated nearly 65 percent deficit in peak demand in 2012. Figure 1: Energy deficit forecast2 This expectation may not be wrong, given the forecasted increase in peak load and energy requirement over the next few years. The forecasts are presented in Table 35. Table 37: Forecast of peak load and energy requirement (2011-12 to 2016-17)3
Year Peak Load (MW) Energy Requirement (MU)
2011-12 3607 18125 2012-13 4203 22623 2013-14 4799 26361 2014-15 5395 29472 2015-16 5991 32866
2016-17 6587 36316
There are three key agencies in the energy sector in Bihar – BSEB, Bihar State Hydroelectric Power Corporation Limited (BSHPC) and BREDA.
11.1.2 Bihar State Electricity Board BSEB is a vertically integrated agency and is responsible for generation, transmission, and distribution of electricity in Bihar. In Annual Plan 2011-12, the approved outlay for the BSEB is 1795.95 crore. While some of the deficit in power generating capacity in present
1 Source: Bihar State Electricity Board, GoB 2 ibid; As per figures submitted to CEA for 18th Electric Power Survey 3 ibid

124
Bihar can be attributed to the separation of Jharkhand, the fact remains that there has been no major addition in generation capacity in the state in the last 25 years. At present, there are only two thermal power stations in the state sector – Barauni Thermal Power Station (2x50 MW and 2x110 MW) and the Kanti Thermal Power Station (2x110 MW). The latter is a joint venture of the BSEB and National Thermal Power Corporation (NTPC). However, due to various technical reasons and financial crunch, the present generation capacity of these plants is 50-60 MW and 80-90 MW respectively. Given the present quantum of power generation, Bihar is mainly dependent on the central sector allocation to meet its energy demand, which is close to 2000 MW. At present, central sector has allocated a maximum of 1772.00 MW for Bihar, but the actual availability varies between 900-1000 MW. The financial viability of BSEB is dependent on the improvement in the distribution sector. At present, more that 10 lakh consumers in the state under various categories are unmetered and are, therefore, billed at a flat tariff rate, leading to huge revenue losses. However, the transmission and distribution (T&D) losses declined during 2008 to 2010. The T&D loss during 2011 remained at 35.26 percent on the basis of previous norms of consumption in case of un-metered categories of consumers adopted for calculation of T&D loss during the years prior to 2011. However, BERC had changed consumption norms for un-metered categories of consumers in its tariff order for 2011 and as a result of which the T&D loss for the year 2011 came to 43.59 percent as against 35.26 percent as per old norms. The BERC, whose major function is the determination of tariffs, approved an average tariff hike of 19 percent during 2011-12, keeping in view the increased cost of service. Even after this tariff hike, it is expected that the revenue gap for 2011-12 will be close to ` 245 crore. Average realization exceeds the cost of service only for non-domestic users. For all types of consumers, only close to about 68 percent of the cost is recovered. 11.1.3 Bihar State Hydroelectric Power Corporation Limited (BSHPC)
BSHPC was established to harness the hydroelectric potential in the state. The BSHPC conducts survey for this purpose and prepares the schemes on hydroelectric power generation. During the Tenth Five Year Plan, BSHPC started exploring possibilities for major hydel projects, besides its earlier mandate for minor hydel projects. There are 11 minor hydel projects that are currently operational in the state with installed capacity of 53 MW. 11.1.4 Bihar Renewable Energy Development Agency (BREDA)
The Bihar Renewable Energy Development Agency (BREDA) is responsible for development of projects using non-conventional energy sources in the state. Wind measurement studies at Simultala (Jamui), Adhora (Kaimur) and Lalganj (Vaishali) are near completion and those at Bodhgaya, Raxual and Munger are currently on-going to ascertain the potential of tapping wind energy in the state. Keeping in mind the huge potential for biomass energy in the state, biomass gassifiers with generation capacity of about six MW have been installed in cold storage and rolling mills for private use. Husk Power Private Limited has installed 20 biomass gassifiers with generation capacity of about 576 KW in the districts of East Champaran and West Champaran. The installations have been made in clusters of 2-3 villages and this is benefitting the rural population. Similarly, Desi Power Private Limited (Araria) is installing gassifiers with generation capacity of 400 KW. A proposal to generate 20 MW under the Jawaharlal Nehru Solar Mission has been sent to the Ministry of Power, Government of India for approval. A report on 'Renewable Energy Potential Assessment and Renewable Energy Action Plan' for Bihar has been prepared by the World Institute of Sustainable Energy (WISE) (Pune), supported by DFID. The overall picture of the renewable energy potential of the state is given in the Table 36.

125
Table 18: Renewable energy potential of Bihar4
Renewable Energy Sector Potential (MW)
Large Wind Marginal, to be explored further Small Wind Marginal, to be explored further Small Hydro 195.25 Bio Energy 1950 to 2150 Solar Grid Connected 2850 to 8549 Solar Off-Grid 7300
Total Range 12295 to 18194
11.1.5 Rajiv Gandhi Grameen Vidyutikaran Yojana (RGGVY)
The rural electrification work is being carried out in all 38 districts of the state under RGGVY. This work is carried out by the Power Grid Corporation of India Limited (24 districts), National Hydroelectric Power Corporation (NHPC) (six districts) and by BSEB (eight districts). 11.1.6 Restructured Accelerated Power Development and Reforms
Programme (R-APDRP) The R-APDRP was launched by the Ministry of Power, GoI in July 2008 as a central sector scheme under the 11th FYP. The scheme comprises two parts. Part A of the scheme is dedicated to establishment of IT enabled system for achieving reliable and verifiable baseline data in all towns with a population greater than 30,000 as per 2001 census. Part B of the scheme deals with strengthening and upgradation of regular sub-transmission and distribution system. The focus for Part B is on ATC (Aggregate Technical and Commercial) loss reduction on a sustainable basis. Part A of R-APDRP covers 71 towns of the state. The approved projects include establishment of baseline data and IT applications for energy accounting and auditing, and IT based consumer service centres. The implementation of these projects will not only minimise ATC losses and improve customer satisfaction, but also improve the financial position of BSEB. Additionally, a robust management information system can provide accurate data, which can be used for effective decision-making. 11.2 Key Issues
After bifurcation of Bihar, the major power generating stations were transferred to Jharkhand and Bihar was left with a meagre generation capacity of only 493 MW (2x110 MW at Barauni in State sector, 2x110 MW at Kanti in Joint Venture with NTPC and 53 MW from Hydel projects). The generating capacity of Bihar is the lowest in the country. The state is predominantly dependent on allocation of power from the central sector generating stations to meet its demand. The peak availability is about 1000 MW against the peak demand of 2500 MW, causing a peak shortfall of about 1500 MW, which results in widespread Power Shortage in Bihar. The per capita consumption in Bihar is 122.21 units as against the present National average of 778.71 units. Bihar has targeted to achieve per capita consumption of electricity at least 731.66 units by the end of the 12th plan. This per capita consumption translates to a staggering 11,650 MW of power generating capacity for Bihar. The financial performance of the BSEB has declined steadily over the years mainly due to substantial increase in cost of power (on account of use of imported coal by NTPC and increase in price of indigenous coal) and establishment cost (because of implementation of the 6th Pay Commission report) with negligible increase in tariff. Also, annual subsidies supporting BSEB have become unsustainable financially for the State Government and for which 4 Source: Renewable Energy Potential Assessment and Renewable Energy Action Plan for Bihar

126
reforms in distribution are in progress both in structure and governance, with emphasis on augmenting revenue and bringing about operational efficiency. 11.3 Existing/On-going Initiatives
To restore full generation capacity of the Barauni Thermal Power Station and the Kanti Thermal Power Station through restoration and modernisation (R&M), work is on-going under the Rashtriya Sam Vikas Yojana (RSVY). It is expected that the R&M work in a phased manner will be completed by March 2013. Besides the R&M work at the Barauni and Kanti Thermal Power Stations, the state government has also sanctioned expansion of these stations. The proposal for expansion of these thermal power stations include 2 additional units of 250 MW each at Barauni and another 2 additional units at Kanti of 195 MW each. The estimated costs of this expansion programmes are ` 3060.00 crore (Barauni) and ` 3154.22 crore (Kanti). Given the dependence of Bihar on the central sector, a rapid expansion of installed generation capacity is a priority for the state government. A number of new projects have been sanctioned and are to be completed during the Twelfth Five Year Plan. The Nabinagar Power Generating Company Private Limited has been set up as a joint venture of the BSEB and NTPC to construct 3x660 MW capacity at an approximate cost of Rs 12964.58 crore. As per the allocation arrangement, BSEB will get 69.37 percent of the electricity generated in Nabinagar plant. Further, Nabinagar Stage 2 has also been planned for 2x660 MW capacity. As per the power purchase agreement (PPA), 75 percent of the electricity generated by these units will be allocated to BSEB. For augmenting the availability of power, Bihar Power Infrastructure Company Limited has also been constituted as a joint venture by the BSEB and a private sector firm. The organisation is responsible for identifying sites for electricity generation, and then select implementing agencies through a competitive bidding process. Till date, three sites have been selected – Kajra in Lakhisarai (2x660 MW), Pirpainti in Bhagalpur (2x660 MW), and Chausa in Buxar (2x660 MW). Bihar would get 85 percent share of the total electricity generated at these sites. At present, land is being acquired to set up these units. Further, investors from the private sector have also been given approval to set up generation facilities in the state. In this respect, 12 companies have already signed MoUs. It is expected that these units will be in operation during the 12th FYP. All these projects are coal-based and getting coal linkages for these projects is a prime concern. Without adequate domestic coal supplies, there is a definite possibility of the units getting stranded. While use of imported coal is a theoretical option to tide over domestic supply shortages, it is not a practical solution. Therefore, coal based plants should not be viewed as the only dependable option for energy security in the future. The state government has, thus, requested the Nuclear Power Corporation of India Limited (NPCIL) to explore the possibility of a nuclear power plant at Rajauli. Improvement and expansion work of the transmission system in the state is being carried out in two phases by the Power Grid Corporation of India Limited (PGCIL). This programme is supported by RSVY. In Phase 1 of the programme, construction of 17 grid sub-stations, 1 power station and 876 Kms. of transmission line have been completed, using a sum of Rs 486.40 crore. Under Part 1 of Phase 2, 9 new grid centres, 751 Kms. of transmission line, replacement of 438.63 Kms of old transmission lines, capacity expansion by 1090 MVA had to be accomplished, along with completing some backlog work of Phase 1. This backlog included the construction of 220/132/33 KV of the Begusarai grid and 220 KV of Begusarai-Purnea double circuit line. Of these tasks, everything has been completed except construction of one grid centre and the double circuit line. Part 2 of Phase 2 involves setting up 16 new grid sub-centres, construction of transmission lines, replacement of old wires, and capacity expansion by 540 MVA at old grids. BSEB has made concerted efforts to reduce distribution losses by metering of unmetered consumers, undertaking works for upgradation and improvement of its network, and undertaking R-APDRP projects in selected towns. However, the losses have not come down as expansion of the network has

127
mainly been in rural areas under RGGVY, where the increased exposure is more open to pilferage. Given the possibility of non-availability of coal linkages and adequate water, it is essential to work towards tapping the renewable energy potential of the state to ensure energy security in the future. The state government recognises this and the ‘Bihar Policy for Promotion of New and Renewable Energy Sources 2011’ is a right step in that direction. This policy was passed by the state government early this year and promotes private investment in setting up power plants using renewable energy sources. Under RGGVY, the total outlay approved for electrifying 22,484 villages and expanding electrification in 6454 electrified villages is Rs 4478.25 crore. Up to January 2012, a total of 17,363 villages and 1967000 BPL households have been connected to the grid under RGGVY. Under this scheme, construction of 171 power sub-stations of 33/11 KV capacity has also been approved. Of these, 90 have already been charged. A total of 3429 villages and 230.8 thousand BPL households were connected to the grid in 2011-12. The Bihar Power Sector Development Programme aims at targeted investments for strengthening of the electric distribution systems of seven towns and upgradation of the transmission system. The detailed project reports for this programme, involving a sum of ` 838 crore, was submitted by the Energy Department, GoB to the Ministry of Power, GoI for funding by the ADB. This has already been approved by the ADB. In the first year of the Eleventh Five Year Plan, the BSHPC had already identified potential for major hydel projects. As a result, a framework for commissioning six schemes has been prepared. This will help generate additional 3145 MW of power. The preparatory work for all the schemes for major hydel projects has started. For commissioning of the Dagmara Hydroelectric Power Project, a loan is being sought from the French Development Agency (FDA). The Indrapuri Reservoir Project has been pending since 1987. After co-ordinating with the Water Resources Department, BSHPC has reached an agreement to continue work on this project. After getting preliminary surveys conducted by the Survey of India, the detailed project report (DPR) is being reviewed. After examining the feasibility survey for remaining four projects, the NHPC has proposed to commission these projects as a joint venture with BSHPC. For both the Sinafdar PSS and the Hathiahdah-Durgawati PSS, the process of forest clearance has been initiated and no-objection certificate from the Pollution Control Board has been obtained. 11.4 Priorities
During the 12th FYP, peak demand for electricity is expected to surge in Bihar owing to electrification of villages and setting up of many industries. Industrial demand for power is also expected to pick up substantially in the wake of new incentives for investment provided by the Bihar Single Window Clearance Act, 2006; the Bihar Infrastructure Development Enabling Act, 2006 and the State Government’s Industrial Policy, 2011. A target of per capita consumption of about 731.66 units by 2016-17 has been set. The State plans to achieve this target in the phased manner. The State Government considers the involvement of the private sector in the development of thermal power projects in the state, as an important aspect of the Power Policy. As an initial measure towards meeting this objective, the State Government has identified three sites at Kajra (2x660 MW) at Lakhisarai, Pirpainti (2x660 MW) at Bhagalpur, and Chausa (2x660 MW) at Buxar where necessary groundwork is being completed. All three Case - II projects at Buxar, Kajra and Pirpainti will be developed through tariff- based competitive bidding under Case - II. In this regard, NIT has already been issued for call of RFQ/RFP for all the three Case- II projects coming up in Bihar. Land acquisition is under process through IDA. Section 4 and 6 Notification under the Land Acquisition Act has been issued for the above three projects, and government land transfer is under process. The Central Electricity Authority (CEA) has recommended for allocation of coal linkage for Barauni, Stage-II (2x250 MW) project and 2x660 MW Case–II projects at Chausa, District-Buxar under the early 12th Plan. Additionally, some Independent Power

128
Producers (IPPs) projects are expected to be added in the 12th Plan and for which the State Government and BSEB is committed to extend the following support to IPPs: Off take of power at 400 kV Provides construction power at 33 kV Various clearances including recommendation of Coal and Water linkage for project in
Bihar Various benefits under the State Industrial Policy The State Government encourages captive power generation by industries using any of their waste, by- product or similar substances like bagasse-based co- generation in the Sugarcane industry, provided that for continuity of generation in the off-season, any other substance could be used for generation. The State Government shall provide all such co- generation plants similar incentives as available to Captive Power Plants outlined in the Policy. The State has planned to procure 1500 MW Power through Case - I bidding. The Power purchase agreement (PPA) for 450 MW has already been made and the power will be available from July 2014. For the remaining 1050 MW +20 percent Power, bids have been invited and procurement process is likely to be finalized by September 2011. The availability of power is expected from September 2015. In addition, Restoration of Unit No. 6 of BTPS, the only generating plant owned by BSEB, was done in the year 2007 and Renovation and Modernization of 2x110 MW units each at BTPS and MTPS was approved by Planning Commission with limited scope of work. To derive full benefit and ensure sustenance of desired PLF, certain essential infrastructural requirements are needed, which have not been included in the scope of repair and maintenance work awarded to BHEL under RSVY. So, under BRGF scheme for the 12th Plan remaining works have been proposed. Bihar State Electricity Board is availing 300 MW Power under Short Term from September 2011 to November 2011. BSEB has initiated bidding process for procurement of 450 MW+20 percent under Medium Term for 3 years 10 months with effect from March 2012. Phase-1 of investment projects to strengthen the transmission system under the Rashtriya Sam Vikas Yojna has been completed. The augmentation of transmission system in the remaining part of the State is under progress in phase - II of the same scheme. Major works will be completed by March 2012. Out of sanctioned amount of Rs2246.58Crores, Rs1886 Crores has been spent so far for strengthening of transmission works of Phase I and II. During the 12th plan period, the State Government will provide active support to ensure the financial viability of developing new transmission capacity in the State, and the SIPB will give priority to the clearance of new transmission systems. Wherever required, the State Government will also provide counterpart funding and guarantees for obtaining loans from central financial institutions and international funding agencies like ADB, World Bank, JBIC, etc. Existing transformation capacity with expected upcoming addition by March 2012 is 220/132 KV- 4650 MVA and 132/33 KV-5423 MVA. The transmission capacity would therefore require massive strengthening to support the projected growth. ADB have prepared a Master Plan for transmission through its consultant SNC LAVLIN. They have recommended year-wise enhancement of capacity of existing G.S.S. and installation of reactors, etc. at voltage level 400 KV to 132 KV level. The total capacity after aforesaid addition shall be 3320 MVA at the level of 400/220 KV and at level of 220/132 and 132/33 KV will be 9800 MVA and 13023 MVA, respectively. The above works have been proposed under BRGF. In order to create the new infrastructure in the State transmission system and to augment the existing capacity of the transmission system, Bihar will follow the model of Public Private Partnership developed by the Planning Commission, GoI. This would help in improving efficiency, and reducing tariff. The above mechanism will also attract private investments in the development of State transmission system. The real challenge of reforms in Bihar’s power sector lies in improving the efficiency of distribution. The current power distribution system

129
is characterized by huge ATC losses of approximately 45 percent, which calls for a radical change in the way electricity distribution is managed. Fundamental restructuring and institutional development of distribution operations is crucial to the reforms planned for the power sector as a whole. Distribution Reforms will contain the following elements:
New distribution licensees for med as successor entities of BSEB will begin operations afresh, and without the burden of past losses, unserviceable liabilities and unrecoverable arrears.
Feasibility of adoption of PPP Model for distribution management of Patna is being studied in collaboration with the Planning Commission. After feasibility study, PPP Model will be tried for four major cities viz., Patna, Gaya, Muzaffarpur, and Bhagalpur.
Under Distribution reforms, NIT has been floated for awarding input based franchisee for rural and urban feeders. Hundred and seventeen bidders have participated for Rural Feeders and 11 for Urban
Feeders. The tender is in the stage of finalization for the award. DPR for full-scale electrification of villages and Tolas of all districts in Bihar is under preparation. The project is aimed at electrification of balance BPL Households left uncovered under RGGVY scheme as well as creation of robust and adequate electrical infrastructure to provide electricity to APL households on demand and other productive rural loads including agriculture. Out of 38 districts, DPR of nine districts have been submitted to REC for approval and balance DPRs are under preparation. As most of the small capacity DTs (16 and 25 KVA) have failed within a short span of installation under the present RGGVY scheme, large capacity DTs (63 KVA and 100 KVA) along with proper strengthening of distribution network have been proposed in the scheme considering the population density of villages in Bihar and requirements of rural loads. A restructured RGGVY Plan with an estimated cost of Rs 11,181.00 Crores has been prepared and submitted to the GoI for inclusion in the 12th Plan, whose salient features are as follows: -
Tolas/habitations to be treated as units for rural electrification. 100 percent electrification of BPL households and connection on demand to APL
households. 63 KV and 100 KVA transformers to be used along with robust HT/LT network to meet
domestic and productive loads of the village. Provision of at least one PSS in each block. Special financial package and incentive for Bihar under Restructured RGGVY. Strengthening of distribution network of 49 towns (not covered under R-APDRP) whose population is more than 5000, has been proposed under BRGF for the 12th Plan. A total of Rs 245.47 Crores has been proposed for strengthening of 49 non-R-APDRP towns. Presently there is only one rural feeder supplying power to rural areas, which cater to agricultural requirements, lighting load, and other rural loads, etc. resulting in frequent tripping, low voltage profile, and overloading. So, segregation of rural domestic and agricultural feeder has been proposed under BRGF to improve quality of supply and better load management in rural areas. In the context of Bihar, where there is shortage of power, this arrangement will have incidental advantage of rotating the same quantum of power for different durations exclusively for rural supply as well as agricultural proposes. Segregation of feeders supplying to agricultural loads and other rural loads has been planned. An estimated cost of Rs 1990.37 crores has been proposed under BRGF for the 12th Plan for the purpose."Special Task Force" (STF) has been constituted by the BSEB for intensive checking and raid against pilferage of energy under Anti Theft Act. Electricity dues from the consumers are being recovered and certificate cases are also being filed against the defaulters.

130
Special Courts have been set up at Patna, Gaya, and Muzaffarpur to deal with theft cases on fast track. Presently there is huge deficiency of both system as well as consumer meters. Fifty five thousand seven hundred and twenty six system meters and 3,361,967 consumer meters are to be provided. In addition, 1222 system meters and 127,763 consumer meters are defective which need replacement. Annual growth of consumers is expected to be 10 percent. A time bound metering plan has been prepared. After the short closure of APDRP, R-APDRP was launched during 11th FYP as a Central Sector Scheme. The focus of the program is on actual demonstrable performance in terms of sustained ATC loss reduction, establishment of reliable and automated systems for sustained collection of accurate base line data, and the adoption of Information Technology. It will enable objective evaluation of the performance of utilities before and after implementation of the program and will enforce internal accountability leading to better performances. The project covers towns and cities with a population of more than 30,000. Seventy-one such towns have been selected. R-APDRP was launched in September 2008 by the GoI to achieve 15 percent ATC loss in the Distribution System. It is to be implemented in two parts. (i) IT Application for energy accounting/auditing, establishment of baseline data and IT
based Consumer Service Centre. GoI approved Rs 194.58 Crores as loan for Part-A projects and IT Implementing Agency has been appointed. The works of Part-A is in progress and to be completed by December 2012.
(ii) Projects have been taken up for strengthening of distribution system network in 64 selected towns of Bihar having a population above 30,000. Total cost involved is ` 1500.00 crores to be arranged by PFC as a loan, which will be converted into a grant after achieving a target of ATC losses up to 15 percent. DPRs of Part-B have been submitted to the Power Finance Corporation (PFC), the work will be started after approval of DPRs by MoP, Gol.
The lack of any medium or large hydropower plants in Bihar restricts its ability to meet peaking requirements or to have the flexibility to meet intra-day changes in system demand. Bihar has a current installed capacity of about 53.30 MW from small hydro power (SHP) and 27.00 MW is under construction with the potential for 250 MW more. SHP for 3.70 MW is likely to be added by March 2012. The State also has large hydro power generation potential in Dagmara 125 MW (Kosi) and Indrapuri 450 MW besides five pumped storage projects, pre-feasibility for which have been established by the BHPC. The DPR of Dagmara HEP (125 MW) has been prepared an independent consulting firm and the same is being modified to address international issues before its submission to CEA for approval. The GoB intends to complete Dagmara HEP during the 12th FYP. The installed capacity of Bihar is likely to be around 209 MW by the end of the 12th FYP. The GoB intends to develop large hydropower projects and the pumped storage schemes either through loans from bilateral and multilateral funding agencies or as joint ventures with Central Government generating companies like the NHPC, and the private sector. BHPC has been also allotted village electrification work in 820 villages out of which 624 villages are un- electrified and 196 villages are Left Wing Extremist affected under the Decentralized Distribution Generation (DDG) scheme. Bihar has high potential of generation of renewable energy especially in the field of solar as well as biomass. The renewable energy production in the field of wind energy however is limited to some riverine and hilly regions only. The energy production through solar photovoltaic as well as solar thermal has immense potential in the state for power generation. It is expected that the plateau and hilly areas as well as the riverine belts in Bihar have sufficient wind speeds suitable for wind power generation. Wind energy potential in Bihar is being assessed by C-WET, a GoI undertaking which has so far established 3 high mast stations at Adhaura (District Kaimur), Lalganj (District Vaishali) and Simultala (District Jamui). Three more
131
places have been identified and are being assessed for their potential at Bodhgaya (District Gaya), Pirpahari (District Munger), and Ruxaul (District Motihari). Rural electrification plays a vital role in all economic activities; it provides for a better quality of life and may be considered as an instrument the socio-economic development of remote areas. The State has good opportunity to cover these villages under RGGVY for DDG in the 12th FYP in a big way. For these, a large-scale survey of concerned villages is required and other preparatory works are also to be undertaken. This will facilitate the action plan and estimate of the costs. Primary work for preparing action plan has started. The New and Renewable Energy policy, 2011 has come into being which has several incentives, some of which are as follows:
Single window clearance of the renewable projects through the State Investment Planning Board (SIPB).
State Government would facilitate land availability through State Land Bank whenever necessary.
The Bihar Electricity Regulatory Commission has fixed the purchase rate of the energy produced through renewable as well as the procurement quota year wise.
The State government will facilitate loan from banks and other financial institutions to the project developers. Moreover wheeling facilities have been adequately defined and explained for all grid-connected sources of Renewable Energy electricity generation projects up to 25 MW.
Provision for waiver of entry tax on equipment and electricity duty apart from other incentives available under the industrial incentive policies of the State.
BREDA as a nodal Agency for the implementation of the Renewable Energy projects will co-ordinate with the provide project developers.
The renewable energy production through biomass is another potential area for the state and to encourage investment in these projects special concessions are envisaged.
The State government shall encourage project developers to install mechanisms such as Clean Development Mechanism (CDM) for leveraging funds for renewable energy-based power projects. BREDA is a nodal agency for helping private developers to apply for CDM benefits. Bundling of projects shall be encouraged for CDM application to make the initiative viable.
Bihar State Energy Conservation Fund has been constituted for the promotion of efficient use of energy and conservation. The state has three types of projects for consideration:
Grid connected renewable energy projects based on biomass. Co-generation of renewable energy through bagasse in sugar mills and rice husk in rice
mills. Off-Grid renewable energy distributing projects based on biomass. The investment of the
private sector and cooperative sector is very important in the field. Given the significance of energy conservation, the State government shall prioritize it. There is an urgent need to have a system that encourages energy conservation and provides disincentives for inefficient use of energy. The State government shall promote measures for economy and efficiency in energy consumption. The State government also proposes to implement the provisions of the Energy Conservation Act, 2001 and to set up the State Resource Fund to promote activities for energy conservation. In co-ordination with the Bureau of Energy Efficiency (BEE), PESU has planned to facilitate 'Bachat Lamp Yojna' in Patna on experimental measure. Demand side management will also be given emphasis. There is a compelling need for second green revolution for Bihar, which has a three-crop land and whose crop intensity is only 1.52. Ninety percent of the total energy required for irrigation purposes is to be met through conventional sources. To meet requirements of Green Revolution, there will be an additional requirement of electrical energy to the tune of 3000

132
MW to be met through conventional sources, which is primarily to meet large scale requirements (almost 10 Lakh pump sets of individual farmers) of electrical energy for irrigation pump sets operated by electric motors. In the present electricity scenario we are almost completely dependent on central sector. After meeting the emergent requirement and minimum requirement of urban sector, meagre power is available for rural sector. Hence, it will not be possible to energize all the estimated 10 Lakh private tube wells in one go. It will take considerable time for creating the necessary infrastructure to cover all the private tube wells through electrical networks from dedicated/ independent agriculture feeder through our existing and proposed 33/11 KV Power sub stations. As such with increase in power availability along with increase in electrical network to provide connectivity, the large number of private tube wells will be shifted in phases from diesel operating pump sets to electrically operated pump sets in the 12th and 13th FYPs (ten years) i.e., on an average, one lakh tube-wells will be electrified per year.
11.5 Perceived Climate Impacts While there have been no Bihar specific detailed studies on climate change available
evidence shows several pointers on the impact the energy sector has ON climate, as also the impact climate change is likely to have on the energy sector. Energy services are a necessary input for development and growth. At the same time, fossil energy conversion, and end use, is recognized as a major contributor to global warming. Today 70 percent of greenhouse gas emissions come from fossil fuel combustion for electricity generation, in industry, buildings, and transport – and these emissions are projected to rise. By 2050, the global population will grow to 9 billion, with growth mostly concentrated in developing countries with improved living standards. If we continue as we are today, delivering energy services and sustaining economic growth will result in a tripling of annual GHG emissions. Efforts are under way, in developed and developing countries, to arrest and reverse the growth in GHG emissions and lower the carbon footprint of development. The energy sector is a primary target of these efforts. Consequently, capacity is being built to integrate lower carbon development objectives into long-term (20 to 30 year) energy planning processes. Experience and knowledge of new technologies and measures to lessen carbon footprints are being exchanged. There is significant focus on the major scale-up of renewable energy sources, efficiency measures (supply and demand side), loss reduction, and cleaner fossil fuel combustion technologies. Energy services and resources will be increasingly affected by climate change—changing trends, increasing variability, greater extremes, and large inter-annual variations in climate parameters in some regions. Though potential climate impacts have been recognized strongly within the energy sector, is the focus has mainly been on the responsibility for greenhouse gas mitigation rather than on the management of energy services. Climate impacts cross the entire energy supply chain. Impacts on energy supply and demand are the most intuitive but there are also direct effects on energy resource endowment, infrastructure, and transportation, and indirect effects through other economic sectors (e.g., water, agriculture). This exposure is driven in part by the current state of the sector (e.g., inefficiencies in energy and water use mean energy services are vulnerable and have less capacity to deal with change). Increasing temperatures are almost certain to reduce heating demands but increase cooling demands overall, but inter-annual variability will remain and cold periods will not disappear. Seasonal demand profiles will alter responding to user needs for energy for heating and cooling in buildings, for industrial processes, and for agriculture (e.g., irrigation). Flooding and droughts will continue, with likely impacts on infrastructure (including silting of reservoirs), and on demand. Climate change may impact the generation cycle efficiency and cooling water operations of fossil fuel fired, nuclear, and biomass fired

133
power plants. The generation potential of renewables may change but is impossible to assess without additional locally specific study:
Hydro‐generation may benefit or suffer, or both at different times, from changes in rainfall;
Solar generation may not be affected in a substantial manner, although some regions may see future decreased generation;
Wind generation may be impacted either positively or negatively by local adjustments to the wind regime; and
Biomass/biofuel generation could be affected by changes in cultivation regimes. Energy transportation infrastructure (for power, oil, and gas) are also variously exposed to wind gusts, storms, storm-related landslides and rock falls, land movements, siltation and erosion processes, as well as changes in water basins. The table below summarizes potential impacts on the energy sector.
Table 39: Potential energy sector vulnerability to climate change
Item Relevant Climate Impacts Impacts on the
Energy Sector General Specific Additional
Climate Change Impacts on Resource Endowment Hydropower Runoff Quantity (+/‐)
Seasonal flows high & low flows, Extreme events
Erosion Siltation
Reduced firm energy Increased variability Increased uncertainty
Wind power Wind field characteristics, changes in wind resource
Changes in density, wind speed increased wind variability
Changes in vegetation (might change roughness and available wind)
Increased uncertainty
Biofuels Crop response to climate change
Crop yield Agro‐ecological zones shift
Pests Water demand Drought, frost, fires, storms
Increased uncertainty Increased frequency of extreme events
Solar power Atmospheric transmissivity
Water content Cloudiness Cloud characteristics
Positive or negative impacts
Wave and tidal energy
Ocean climate Wind field characteristics No effect on tides
Strong non-linearity between wind speed and wave power
Increased uncertainty Increased frequency of extreme events
Climate Change Impacts on Energy Supply Hydropower Water availability
and seasonality Water resource variability Increased uncertainty of expected energy output
Impact on the grid Wasting excessive generation Extreme events
Increased uncertainty Revision of system reliability Revision of transmission needs
Wind power Alteration in wind speed frequency distribution
Increased uncertainty of Energy output.
Short life span reduces risk associated with Climate change Extreme events
Increased uncertainty on energy output
Biofuels Reduced High temperatures Extreme events Reduced energy

134
Item Relevant Climate Impacts Impacts on the
Energy Sector General Specific Additional transformation efficiency
reduce thermal generation efficiency
generated Increased uncertainty
Solar power Reduced solar cell efficiency
Solar cell efficiency reduced by higher temperatures
Extreme events Reduced energy generated Increased uncertainty
Thermal power plants
Generation cycle efficiency Cooling water availability
Reduced efficiency Increased water needs, e.g., during heat waves
Extreme events Reduced energy generated Increased uncertainty
Oil and gas Vulnerable to extreme events
Floods, erosion and siltation (coastal areas, on land)
Extreme events Reduced energy generated Increased uncertainty
Impacts on Transmission, Distribution, and Transfers Transmission, distribution, and transfers
Increased frequency of extreme events Sea level rise
Wind and ice Landslides and flooding Coastal erosion, sea level rise
Erosion and siltation Weather conditions that prevent transport
Increased vulnerability of existing assets
Impacts on Design and Operations Siting infrastructure
Sea level rise Increased extreme events
Flooding from sea level rising, coastal erosion Increased frequency of extreme events
Water availability Geomorphodynamic equilibrium
Increased vulnerability of existing assets Increased demand for new good siting locations
Downtime and system bottlenecks
Extreme weather events
Impacts on isolated infrastructure Compound impacts on multiple assets in the energy system
Energy system not fully operational when community requires it the most
Increased vulnerability Reduced reliability Increased social pressure for better performance
Energy trade Increased vulnerability to extreme events
Cold spells and heat waves
Increased stress on transmission, distribution, and transfer infrastructure
Increased uncertainty Increased peak demand on energy system
Impacts on Energy Demand Energy use Increased demand
for indoor cooling Reduced growth in demand for heating Increased energy use for indoor cooling
Associated efficiency reduction with increased temperature
Increased demand and peak demand, taxing transmission and distribution systems
Other impacts
Cross-sector impacts
Competition for water resources Competition for adequate siting locations
Conflicts in water allocation during stressed weather conditions Competition for good siting
Potential competition between energy and non-energy crops for land and water resources
Increased vulnerability and uncertainty Increased costs

135
Item Relevant Climate Impacts Impacts on the
Energy Sector General Specific Additional locations
11.6 Strategies The energy sector vision is to strive for improved energy security in Bihar through multiple strategies including improving generation, transmission, distribution, scaling up use of renewables, promoting energy efficiency across all sectors, as well as fostering mechanisms for demand side management. A range of initiatives is already underway in the State as described in Section A and also new initiatives are planned under the 12th FYP Approach Paper; additionally, the State has now developed a Hydropower Policy as well as a Bihar Policy for promotion of New and Renewable Energy Sources 2011. The State recognises that while energy systems already take account of some climate risks in their operation and planning, adaptation measures can further reduce their vulnerability to environmental change, by building capacity and improving information for decision making, and integrating climate risks into management and operational decisions, and as such, is committed to taking all necessary measures to build in climate concerns into energy sector policy, planning, and implementation. The Energy Department has already planned a set of measures in the context of climate change, and these are given below:
11.6.1 Generation Since coal based thermal power plants are the highest contributors in CO2 emissions, the following actions are being taken to improve the overall efficiency of such thermal power stations: Renovation and modernisation of existing units to restore original efficiency along with
reduced auxiliary power consumption and reduced chimney emissions. Modernisation work on the BTPS units 6 and 7 are expected to be completed by February 2013, and for the MTPS units 1 and 2, by December 2012;
Adoption of super critical technology for all upcoming coal based power stations to have better efficiency and reduced emissions;
Fly ash utilisation is part of each plant’s environment plan. While some quantity of fly ash is used in land development, expressions of interest has been sought from cement manufacturers for use of fly ash for their current needs and future expansion projects;
Sufficient green lands have been identified around future projects; and Feasibility of gas based and nuclear (including thorium-based) power plants are being
explored. 11.6.2 Transmission The following measures have been planned to reduce transmission losses: Expansion of high voltage transmission network with latest and state of the art
technologies and adequate coverage network to prevent loading beyond limits; Use of sufficient reactors and capacitors in the network; Replacement of old and jointed conductors; Better load management, efficient scheduling and use of information systems to achieve
optimum network utilisation; and Proper upkeep of GSS transformers. 11.6.3 Distribution The following measures are being taken and planned to reduce AT&C losses:
Replacement of old and jointed conductors; Procurement of start rated distribution transformers and load balancing of existing ones;

136
Tariff structure to be such as to levy lower tariff for lesser energy consumption and ToD tariff, etc. to promote lower energy withdrawal and promote conservation;
Underground cabling in green areas; Addition of adequate capacitors and upkeep of PSS transformers and distribution
transformers; Expansion of network with high HT/LT ratio; Adoption of HVDS systems where feasible and putting into place effective anti-power
theft measures; and To facilitate power supply for monorail and metro-rail schemes envisaged for Patna as
part of improving public transportation systems, which will also be expected to considerably reduce emissions.
11.6.4 Demand Side Management The following demand side management measures have been planned: Promoting the use of energy efficient pumps and motors in the State; Implementing promotion of CFLs under the Bachat Lamp Yojana (BLY) in identified
areas of the PESU and expanding the scheme to other parts of the state in a phased manner; and
Investing in building consumer awareness about energy efficient equipment and energy conservation measures.
11.6.5 Small Hydropower Projects The lack of any medium or large hydropower plants in Bihar restricts its ability to
meet peaking requirements or to have flexibility to meet intra-day changes in system demand. Bihar has a current installed capacity of about 53.30 MW from small hydropower (SHP) and united to generate an additional 27 MW are under construction, with the potential for an additional 250 MW. SHP capacity for 3.70 MW is likely to be added in the immediate near future. The State also has large hydropower generation potential in Dagmara by way of 125 MW in the Kosi, and 450 MW at Indrapuri, besides five pumped storage projects, pre-feasibility for which has been established by the BSHPC. The DPR of the Dagmara HEP has been prepared, and is currently being modified before submission to the CEA. The State intends to complete both the large projects by the end of the 12th Plan period, and as such, the installed capacity in Bihar is likely to be around 209 MW by the end of the 12th Plan period. The State intends to develop large hydropower projects and pumped storage schemes either through loan from bilateral/multilateral funding agencies or as joint ventures with government companies such as the National Hydro Power Corporation (NHPC) or even through private sector participation. 11.6.6 Renewable Energy Projects
Renewable energy based generation has a significant role to play in Bihar especially in the biomass and small hydro subsectors. Given the predominantly agrarian nature of the economy, such sources are likely to be self-sustaining and economically viable. In addition, it is expected that the plateau and hilly areas as well as the riverine belts in Bihar have sufficient wind speeds suitable for wind power generation. As such wind energy potential development is to be shortly taken up in the State for assessment under the sanction of the Ministry of New and Renewable Energy. BREDA has been nominated as the nodal agency to take up rural electrification work in those villages which are inaccessible or where conventional grid connectivity is not commercially viable. The State has decided to sign MoUs with the GoI to take up rural electrification work in such villages. The preparatory work for the survey of these villages is being taken up and accordingly, plans will be prepared and submitted in due course. To encourage local private sector participation in renewable energy power generation projects including solid waste and sewerage gas based

137
projects or decentralised distributed generation (DDG), the policy will include renewable energy projects, and adequate budgetary allocations in plan funds to augment Central support. The State will also work closely with the Electricity Regulatory Commission to fix the renewable energy procurement quotas and tariffs for renewable energy based power over the next six months or so. The State will also provide banking and wheeling facilities for all grid connected renewable energy electricity generation projects up to 25 MW. Entry tax will be waived on capital costs for equipment for DDG based renewable energy plants of less than five MW. The State will also encourage project developers to install or adopt mechanisms such as Clean Development Mechanisms (CDM) for leveraging funds for renewable energy based projects, and BREDA is the nodal agency for coordinating this. Bundling of projects or initiatives will also be considered. As part of the State’s commitment to renewables, the BERC has made provision of renewable power purchase obligation by distribution licensees from 2.5 percent in 2011-12 to 5 percent in 2014-15. Such obligation also includes a minimum 0.5 percent of solar power in 2011-12. 11.6.7 Other Initiatives In addition to the above, a range of other strategies/actions will be taken up: Research, Climate Impacts Needs Assessment: Necessary research will be undertaken to develop comprehensive Bihar specific energy sector vulnerability analyses, and options for developing in-house skills for data analyses, modelling, and forecasting will be considered; Awareness and knowledge exchange: Specific efforts will be made to document and disseminate experience and learn from the increasing data and knowledge of climate impacts on the energy sector, and their management; Development of project screening tools: Templates to screen individual energy projects for climate vulnerability and risks, either retrospectively or during project planning and implementation will be developed; Development of adaptation standards for the energy sector: Based on climate vulnerability assessments, adaptation standards for the energy sector will be defined, codified and adopted into standard operating procedures in all aspects of energy sector planning and implementation; Retrofitting existing infrastructure: where required, based on climate vulnerability analyses, retrofitting of existing energy infrastructure will be taken up; Promotion of energy efficiency: A range of initiatives to promote energy efficiency across all sectors of the economy and the public will be designed, and launched, to supplement/complement the initiatives already being undertaken or planned. These will indicatively include initiatives for taking up actions under Market Transformation for Energy Efficiency as prescribed in the National Mission for Energy Efficiency and will include measures for CDM, demand side management across all sectors, standards and labelling, public procurement, technology upgradation and replacement of inefficient equipment/appliances etc., energy conservation building codes, energy audits, etc.; Capacity building: Steps will be taken up to increase the capacity of key stakeholders including energy sector policy makers, regulators, operators, and consumers for climate risk management. Addressing poverty and equity concerns: Several studies clearly show gender differences in energy production, energy use, and access to energy and the participation of women in energy-related planning and decision-making. Especially in rural areas of developing countries, a lack of energy services is evident. Lack of access to energy mainly affects women in their role as household managers because they are usually responsible for providing energy for the household. Without access to convenient, affordable fuels for cooking and heating as well as efficient cooking devices, women have to spend large amounts of time and physical energy obtaining traditional fuels (such as wood, charcoal, dung and agricultural waste) to heat water and cook meals. Furthermore, energy is often a precondition for income-generating activities. Energy poverty is also a growing problem

138
affecting poor households in particular. The share of female-headed (single mothers or elderly) poor households is notably high. Indoor air pollution, a result of extensive use of fuel wood and other biomass burning or household energy, is a major problem affecting the health of women. The participation of women in energy planning and decision-making is extremely low. Therefore, the State will need to develop a separate equity focussed strategy to address rural energy security including substitution efforts for reducing fuel wood consumption. Such a strategy should involve incorporating gender analysis at each step of policy, programme, and project planning and implementation will help to identify gender-related impacts, develop the right questions for further research and data collection, and make gender a standard consideration for planners and decision-makers. The power sector in its turn can support the strategy by livelihood enhancement by up-gradation of traditional watermills, poverty reduction, and livelihood enhancement by providing electricity facility through micro-hydro Projects and other such initiatives. 11.7 Institutional Linkages and Stakeholders Institutional linkages are envisaged with virtually all state government departments and other institutions, since efforts will be required across sectors, especially in the promotion of energy efficiency measures. Linkages are also envisaged with academia, civil society, international development agencies, private sector and financial institutions, and communities in general. 11.8 Linkages with the NAPCC The outlined strategies herein are consistent with the NAPCC in general and with the national Mission on Energy Efficiency as well as the national Solar Mission. Additionally, they also have linkages with the all the other National Missions under the NAPCC. 11.9 Sectorial Action Plan and Budgets under the BAPCC See Part C, Action Plans and Budgets

139
12 Industries and Mining 12.1 Overview, Characteristics and Status 12.1.1 Industrial Situation
Before bifurcation the erstwhile state of Bihar was far behind other states in terms of industrialization even though it was a mineral rich state. One of the reasons of this inadequate industrialization was freight equalization policy. After the bifurcation, industrialization of the residual state was pushed still to a lower level as compared to Jharkhand and rest of India. After bifurcation, Bihar became a pure agricultural state with some minor minerals like sand, pyrites, etc. Due to this situation, Bihar becomes an importer of consumer goods and exporter of workers. The small industries in the state are dominated by tiny enterprises and artisan based industries and its share is as high as 99.9 percent among all the Medium, Small, and Micro Enterprises (MSME) units. According to Economic Census 2005, out of a total of 12.25 lakh enterprises, only 7 percent were financed by banks, 80 percent enterprises did not have power linkage, and 11 percent functioned without premises. Though Bihar's enterprises sector is the smallest in India, it too felt the pinch of global downturn and registered a marginal decline of (–) 3.7 percent in the growth rate of manufacturing sector in 2009-10. In 2010-11, however, it grew by 8.9 percent and is projected to increase further to 9.2 percent in the current year 2011-12. The registered manufacturing sector recorded a drop of (-) 13.6 percent in 2009-10 and registered a growth of 18.3 percent in 2010-11 and is projected to maintain this rate in 2011-12 too. The unregistered portion of the sector recorded a modest increase of less than 2 percent in growth rate in 2009-10 and is expected to increase by more than 4 percent in 2010-11 and 2011-12. The growth rate of construction sector is also expected to increase significantly in 2010-11 and 2011-12, along with a modest increase of a little over 3 percent in electricity sector. Besides its extremely small size, the enterprises sector in Bihar is also characterised by a relatively larger share of the unregistered units. There are around 1675 exporting units in the enterprises sector, of which only 80 units are registered. In India, while the unregistered units account for about one-third of the total industrial income, in Bihar, its share is more than half. It is pertinent to note that the small industries in the state are dominated by tiny enterprises and artisan based industries and its share is as high as 99.9 percent among all the MSME units. Despite decline in the annual growth rate, the share of manufacturing and construction sectors in GSDP is likely to show some improvement in 2011-12 at the cost of agriculture. In terms of capital base, employment and net value added of the industrial units, Bihar lagged much behind the all-India average in 2008-09. Nearly all the large industrial units went to Jharkhand after the bifurcation of erstwhile Bihar. On account of the absence of developed infrastructural network, large-scale flight of capital to developed places, adoption of freight equalisation policy, and lackadaisical approach by the central government, large-scale units could not be established in the state in the past. However, with the creation of the SIPB in 2010-11, there were in all 36 large-scale units in the state, besides six large-scale units under the central sector. Table 40: Large scale industries in Bihar (2010-11)1
Sl. No. Type of Unit Number Location
1 Rural Agriculture Business Centre – Fruit Processing
7 East Champaran, Vaishali, Ara, Purnea, Muzaffarpur, Samastipur
2 Food & Vegetable Processing 2 Muzaffarpur, Nalanda 3 Rice Mill 9 Rohtas, Gaya, Banka, Kaimur 4 Roller Flour Mill 6 Patna City, Patna, Darbhanga, Ara 5 Biscuit Production 3 Hajipur, Muzaffarpur
1 Source: Department of Industry, GoB

140
6 Edible Oil/ Refined Vegetable Oil 3 Ara, Rohtas 7 Others 6 Araria, Muzaffarpur, Munger, Banka, Bhojpur Total 36 -
12.1.2 Processing Industries
There are only 45 licensed fruits and vegetables processing units in the state and most of these are engaged in manufacturing fruit juices, pulps, squashes, pickles, tomato ketchup/juice/puree, and jam/jelly, etc. There are also units under unorganised sector producing similar items. However, as per an estimate, only about 2-3 percent of the total produce is processed and a large quantity of fruits and vegetables suffer harvest losses, ranging from 30-50 percent. The fruits and vegetables processing segment is marked by a complete absence of cold chain, resulting into quality deterioration of raw materials. Further, even after processing, the products are kept under either minimum refrigeration or no refrigeration. A large number of processing units operate on work-order basis for longer chain and, therefore, the operative margins are very thin, leaving no scope for technology upgradation or expansion. During the last year, 36 new rice mills have started in Bihar and some more are in the process. Presently, there are around 5000 rice mills in the state of which over 95 percent are hullers. Only 5 percent of these mills may be considered as modern. These rice mills are mostly concentrated in the erstwhile district or Shahabad (presently comprising of Rohtas, Buxar, Kaimur, and Bhojpur), besides Purnea, Araria, East Champaran, and West Champaran. There is a tremendous potential in maize processing, which needs to be exploited on commercial basis. The potential of maize-based products are corn oil, poultry, and animal feed, and high value products like ethanol and extra neutral alcohols, given the high protein content of Bihar maize. There are only a limited number of medium sized registered maize-processing units in the state, with no estimate available for unregistered units. Some large private players have recently shown interest in maize processing in the state. M/S India Gasohol Ltd., Tamilnadu, has already planned to install four maize processing plants with an investment of ` 2500 crore in Begusarai, Muzaffarpur, Bhagalpur and Vaishali districts for production of ethanol and alcohol. The sugar industry is another important agro-based industry in Bihar. It generates considerable employment in the farm sector, both directly and through ancillarisation and related activities. The livelihood of around five lakh farmers’ families and 50 thousand labourers depend on sugar industry in the state. The sugar industry was started in the beginning of twentieth century and between 1904-1940, a total of 33 sugar mills were established in the state to produce 40 percent of total sugar production in the country. However, the number of mills at present remains limited to 28 only, of which 18 are sick and closed. The remaining 10 working mills are in private sector. Of the 18 sick sugar mills, 15 are under Bihar State Sugar Corporation Ltd. Out of the remaining 3 under the central government, 2 mills have gone into liquidation, and the third one has been transferred to M/S JHV Sugar & Industries Ltd. by the Board for Industrial and Financial Reconstruction (BIFR) for rehabilitation, through extended capacity with cogeneration of power. Among the agro-based industries in the state, tea industry is growing very fast and has started assuming a place of importance involving 1000 small and medium planters employing about 30,000 people. Bihar grows annually over 4 million kgs of tea. More than 25 thousand acres of land in around five blocks of Pothia, Kisanganj, Bahadurganj, Thakurganj, and Dighalbank in Kishanganj district are covered under the plantation. The tea plantation has also been extended to three other adjoining districts of Araria, Katihar, and Purnea. There are five tea-processing plants in the district with an output of more than 2300 tonnes of tea, whose quality is at par with Assam variety. Bihar produces around 3 million tonnes of milk, which accounts for 3.28 percent of the total milk production in the country. Only about 10 percent of the milk production is processed by COMFED

141
(Sudha Dairy) at 11 places in Barauni, Muzaffarpur, Samastipur, Patna, Gaya, Ara, Bhagalpur and Kaimur and another 2-3 percent in the private sector. Compared to the annual growth rate of 4 percent in India, milk processing in Bihar has recorded a much lower rate. The technology used is relatively old with no cooling or primary processing facility at the village level. Bihar is one of the leading honey producing states in India, accounting for almost half of the country's total production of 8400 tonnes. The main districts in which beekeeping is done are — Muzaffarpur, Vaishali, Sitamarhi, East Champaran, West Champaran, Madhepura, Katihar and Begusarai. The litchi honey is produced on commercial scale, sold at prices at par with some of the premium honey in the world market, because of its uniqueness. The yield of honey with the Italian honeybee species is the highest in Bihar compared to other states, with a production rate of 40 and 60 kgs honey/hive/year, for stationary and migratory beekeeping respectively. There is no large processing unit of honey within the state. However, there are a handful of medium and small processing units in the organised sector, with most remaining in the unorganised sector. Bihar has a tremendous potential of beekeeping. Considering that the area under litchi is about 24,000 hectares, Bihar is in a position to support 2,40,000 bee colonies on litchi alone. Similarly, the rapeseed acreage of over one lakh hectares can support around 10 lakh bee colonies. In view of substantial area under various crops, each suitable for bee keeping, Bihar has the potential of producing about 40,000 tonnes of honey with an estimated value of ` 200 crore annually with generation of over six lakh employments.
12.1.3 Non Agro-Based Industries There are a large number of handloom units in Bihar, of which 10,850 are under
cooperative sector and 25,503 units are outside. Besides, there are 11,361 power looms in the state. There are in all 1090 primary weavers cooperative societies, of which 417 are functional. The number of weavers in the cooperative fold is 34,367 and around 98,000 are outside. There exists a vast potential of handloom/power loom sector, which may be exploited with proper training of weavers, financing of units, and developing design. There are a large number of cattle in Bihar and their hides are of good quality. Thus, the state has a great potential of leather-based industries. Bihar annually produces nearly 2.64 million bovine hides and 5.09 million bovine skins. It produces best quality of goatskins, cowhides, and buff calfskins. Goatskins are smaller in size and are best suited material for the production of glazed kid leathers, mostly used for women’s shoes meant for export. All the units under the Bihar Leather Development Corporation are sick and closed since 1993, and there are only artisan units located in the urban areas. There are around 50,000 footwear artisans in the state. The state also has tanneries in both the public and private sectors. Under public sector, 7 tanneries, one each at Bihta, Betiah, Muzaffarpur, Barauni, Sakri, Siwan and Jahanabad were established during seventies, but all these units are closed since 1993 due primarily to financial constraints. However, out of nine private tanneries established in Muzaffarpur, five are in working condition. The major problem faced by the tanneries is the disposal of industrial waste. This necessitates establishment of the Common Effluent Treatment Plan (CETP), and unless this is established, the existing tanneries may also face environmental problems and ultimately will be forced to close down production. The four tanneries in Muzaffarpur are closed primarily on account of this problem. The Bata tannery at Mokamaghat is reportedly working with low capacity due to effluent and labour problems. It is also reported that the power supply to the tanneries is inadequate and restricted to only some hours each day. The major minerals in the state include pyrite, limestone, and mica, whereas minor minerals primarily consist of sand and stones. The decorating stones like granite, magnate, and quartz are also available in large quantity. A fair proportion of major mines fall under forest areas rendering it almost difficult to approve mining lease for the mining work. However, the revenue collection from the mining and minerals sector in 2009-

142
10 registered more than two fold increase over 2005-06. In 2009-10, the collection of ` 263.77 crore exceeded the target of ` 200 crore fixed for the year by about 32 percent. In 2010-11 the revenue collection was ` 314.13 crore, as against the target of ` 294 crore. For increasing the revenue and making the collection easier, the state government has changed the processes adopted earlier when the lease for sand was only for a year; presently, the lease period is three years. Besides augmenting the revenue, the process has also helped in substantial reduction in illegal mining of sand. The exploration survey work for minerals is on-going in the state. After bifurcation in 2000, the State Geological Programming Board has been revived under which five surveys by Geological Survey of India were decided to be conducted during 2010-11, including exploration of gold and silver in Nalanda district. Similarly, the exploration work for oil and natural gas in 2537 sq. kms area in Purnea basin by Oil and Natural Gas Corporation Ltd. is under progress and the data collected so far for some areas are being analysed. Positive indications have been found during the exploration. The permission for investigation of natural gas and petroleum in 2227 sq. Kms area in Betiah district has been accorded to Oil and Natural Gas Corporation and Petrodine. 12.1.4 Support Institutions Various support institutions were established with a view to develop industries in the state. But ironically, most of them became sick and non-functional. However, endeavours are being made to revive and make them viable and functional. Bihar State Financial Corporation (BSFC), which was established to finance the industrial units, is itself sick, primarily due to poor recovery. With new policy formulation, the recovery rate is improving. Presently, the Corporation is primarily engaged in recovery from the units financed earlier. Udyog Mitra was set up to provide guidance to the entrepreneurs to establish their enterprises through providing required data to them, helping them prepare project profile and also in sorting their other problems. Besides, it is responsible for monitoring of the departmental schemes and maintains latest information relating to on-going projects. It also organises seminars and discussions, and participate in the international and the state level fairs. During 2010-11, as many as 630 entrepreneurs have been provided with the project profiles, necessary data, information, guidance, etc. The Udyog Mitra was approved a sum of ` 66 lakh for the financial year 2010-11. Bihar Industrial Area Development Authority (BIADA) was set up to promote industries and develop related infrastructure in the industrial areas, such as roads, drainage, water, and power. BIADA acquired land and allotted to 232 units for establishment of industrial units in 2010-11, out of which 73 have started production. Till 2011-12 (up to September), a total of 5524.29 acres of land has been acquired and 4039.15 acres allotted after development, leaving aside 579.45 acres of land for infrastructure, administrative block, roads, etc. The remaining 905.69 acres of land remained vacant. From 2006-07 till date, a total of 1007 units were running of which 46 percent were only in Patna region. In four BIADA regions, there were in all 2387 units established up to September 2011, of which 1007 were in production, 336 under construction and 651 units are yet to start construction. Of the remaining units, 383 were closed and 10 are sick. Other support organisations include the District Industries Centre (DIC). 12.2 Key Issues
The industries in Bihar remained plagued by a plethora of problems. According to Economic Census 2005, out of a total of 12.25 lakh enterprises, only 7 percent were financed by banks, 80 percent enterprises did not have power linkage, 11 percent functioned without premises and 4 percent were seasonal. Only 63 percent enterprises were registered and 82 percent had only five or less employees. At all-India level, a total of 1.55 lakh factories were covered in 2008-09 as against 1777 in Bihar, of which 96.76 percent and 87.17 percent respectively were in operation. A comparison with the corresponding figures for 2007-08 reveals that while the percentage of operational units for all- India showed a moderate

143
increase, the same for Bihar recorded a decline. A detailed analysis of the data further reveals that while at all-India, the proportion of agro-based factories in operation remained almost the same in both the years, the same for the non-agro based industries showed a modest increase. However, in Bihar, the proportion of units in both the categories registered a drop in 2008-09, more so for the non-agro based industries. The industrial group-wise analysis of net value added shows that, except for food products/beverages/tobacco, all other groups under agro-based industries performed poorly in terms of the state's share to all-India in 2008-09, compared to 2007-08. The major agricultural products of Bihar are cereals, pulses, and oilseeds, along with varieties of fruits and vegetables like mango, litchi, makhana, potato, tomato, cauliflowers, etc. However, the farmers have been unable to harness the full benefits of these important agricultural products in the absence of processing industries, which have also high potential for employment generation. It is all because of poor pre-and post-harvest management, as well as inadequate infrastructure for food processing. Bihar is pioneer in production of rabi maize of quality variety with high protein content. The farmers are shifting from wheat to rabi maize in the state for quite sometime. However, there are no processing facilities worth the name to complete the supply chain of maize and, as such, bulk of maize goes out of the state for milling and maize-based products. Similarly, all the groups under non-agro based category registered a major set back, primarily on account of poor post- recession recovery, accentuated by poor infrastructure in the state. Bihar has witnessed complete turnaround during the last 6 years, and the state has moved ahead on the trajectory of development with justice. However, the revival of sick industries is yet to take place. With the creation of SIPB in the state, a total of 42,941 investment proposals have been received since 2007-08. But, there remains a vast gap between the investment proposals received, proposals approved and actual investments made. Though all efforts are made by the state government, yet the slowing of the Indian economy in recent years has affected the growth of the state's enterprises sector. The country's industrial sector has been under stress and the decline in industrial production between June 2009 and October 2011 has been around 5 percent. The drop is largely caused by contraction in manufacturing and mining output. The capital goods sector also shrunk, as companies put investment plans on hold because of lack of demand. The central government is also grappling with declining exports and sliding capital flows. Despite the adverse situation prevailing all over, the state government has been keen on promoting investment climate in the state. However, as revealed by a Federation of Indian Chambers of Commerce and Industry report, the major roadblocks to an immediate leap in Bihar's industrial scenario are related to non-availability of land, relative lack of skilled labour, and poor banking services to small, medium, and tiny industries. Besides, modernization of states' existing power plants and development of new power units have been very tardy. The absence of well-developed infrastructure including national and state highways, mid-level airports, and lack of air cargo handling facility at existing airports are other hindering factors. The industrial sector in Bihar is plagued with sickness, which results in blockage of capital, loss of employment opportunities and state revenues. The current industrial down trend has aggravated industrial sickness in Bihar leading to closure of many units. As per an estimate, around 40 percent of the sick units are in rural areas and 60 percent in urban areas. According to the Department of Industries, out of 1.9 lakh micro, small and tiny units, particularly of artisans and weavers, around 1 lakh units were functional and the remaining were either sick or closed, primarily due to non-financing or under-financing by banks. The pace of rehabilitation was very tardy. Out of 126 sick small industrial units, only three were recommended for revival by the apex committee.
12.3 Existing/On-going Initiatives The state government has taken up the promotion of large, medium, small and micro enterprises under the Department of Industries and a sum of ` 462.22 crore was earmarked by

144
the Planning Department for 2009-10. Again, for the financial year 2010-11, a sum of ` 472.45 crore was allotted which was later revised to ` 279.46 crore by the Planning Department.For intensive development of MSME, different programmes are being implemented by the District Industries Centres in the state. As per the data provided by the Department of Industries, a total of 1.89 lakh medium, small and micro registered units were set up in Bihar till December, 2011, indicating an overall increase of around 60 percent over the year 2000. The highest increase of about 62 percent was noticeable in tiny/micro sector, followed by artisan-based units (58 percent) during the period. The small-scale sector registered the least increase of 28.2 percent over the period. However, there were only 17 medium scale units, as per the revised definition of such units, which specifies the limit of ` 5-10 crore for production and ` 2-5 crore for service units. The total investment in MSME sector up to December 2011, worked out to ` 1482, crore registering an increase of more than 200 percent over the year 2000. The total employment generation was 6.19 lakh persons, recording an increase of 43 percent over the same period. Only one medium industrial unit has been added in 2011-12. In 2011-12 (Up to September), 1245 units have been registered, of which over 98 percent are micro/tiny units. Of the total units registered, 25 percent were in Patna division, followed by Tirhut (17 percent), Magadh (13 percent), Munger (12 percent), and Purnea (12 percent). However, Kosi (1.0 percent), Bhagalpur (5.2 percent), and Saran (6.2 percent) divisions showed almost a dismal performance in this regard. In order to increase the sale volume of MSME sector and make them viable, the state government is soon bringing an effective procurement preference policy for purchase of manufactured goods from micro, small and medium enterprises. This may ensure the growth of MSMEs in the sate and thereby create additional employment. The state has enormous potential of agriculture production including the production of various kinds of fruits and vegetables. For development of basic infrastructure for the promotion of food processing, the state government has formed a Directorate of Food Processing Industries. The state government has also adopted Food Processing Policy since December 2008 for its proper development. For the projects under the food processing sector, a Project Approval and Monitoring Committee has also been formed. As discussed earlier, the food products, beverages, tobacco, etc. cover a range of products accounting for around 80 percent of total industrial income, and holds high promises in terms of net value added and employment. However, there still remains substantial unutilised potential of agro-based industries. It may be mentioned that during the last decade, the agro-based industries, particularly the tea and dairy products, have shown some positive growth trend. Under the programme of Integrated Development of Food Processing, the Directorate of Food Processing has approved 66 projects during 2009-10 and 2010-11, with a total project outlay of ` 1001.17 crore and an admissible subsidy of `. 162.19 crore. Till date, a sum of ` 87.53 crore has been approved for 34 projects, against which an amount of ` 35.13 crore has been released. The establishment of one food zone each in Muzaffarpur-Vaishali and Bhagalpur-Katihar zone is in the process of approval. For this project, a total sum of ` 100 crore has been approved, of which the outlay for 2010-11 is ` 16 crore. A total of 10 Mega Food Parks have been approved for the country as a whole, of which Bihar has been approved only one at a cost of ` 154 crore at Kahalgaon. The Keventer Agro Ltd., Future Group and Shakti Sudha Industry have taken it up jointly. During the Eleventh Plan period, the state government is committed to build an appropriate atmosphere for development of sugar industries in the state. For this, necessary development of basic infrastructure like irrigation, drainage, road connectivity, etc. has been initiated. Presently, nine sugar mills are in running condition, and the state government is working on 20 proposals for establishment of new sugar complexes, of which 19 have been approved. The state government is trying to find ways and means to rehabilitate 15 closed sugar mills under Bihar State Sugar Corporation (BSSC) through privatisation. Under the rehabilitation

145
programme, a total of six sugar mills have started functioning. First, 2 sugar mills at Lauria and Sugauli, both units of BSSC, have been transferred to HPCL Biofules Ltd. on long term lease for ` 45 crore and ` 50 crore respectively. A distillery unit for ethanol of 60 KLPD (Kilo litre per day) and a cogeneration unit of 20MW capacity each have been established and commercial production is likely to commence soon. Similarly, Motipur unit of BSSC is handed over to Indian Potash Ltd. for ` 56.20 crore for establishment of a sugar mill of 3500 TCD (Tonnes Crushed per Day), a distillery of 60 KLPD, and cogeneration unit of 20MW. The Bihta unit of BSSC is handed over to M/S Pristine Logistic & Infra Projects Pvt. Ltd. for ` 23.16 crore. The investor would establish a Logistic-cum- Industrial Park with rail connectivity and dry port. Similarly Sakari and Rayyam sugar mills have been given on lease to M/S Tirhut Industries and Motihari to Indian Potash Ltd. The shortage of tea processing units forces the tea traders to ferry their produce to West Bengal. There is a scope for about 20 new units in Kishanganj, where a vast potential exists for tea cultivation. The state government is working on new initiatives to rope in investments to the tune of ` 100 crore in order to take the tea industry in Bihar to new heights. The subsidy rate on tea industry has also been increased from 15 to 25 percent. A tea auction centre is also being opened at Kishanganj. The state government has also reduced VAT on tea from 12.5 percent to just 4 percent. The state government is also contemplating to formulate a Tea Promotion Policy for promotion of tea industry. The state government has announced a series of measures to improve the existing situation of handloom industries. There are 6 Weavers Training Centres in the state and the state government has made a provision for one year's training at all the Centres with a scholarship of ` 300 per month to each of the trainees. In 2010-11, a sum of ` 5.18 lakh was approved and, as against a target of 144 weaver trainees, 124 were imparted training and the cost incurred was about ` 4.00 lakh. Similarly, a scholarship of ` 300 per month to 53 power loom trainees is paid at Power loom Service Centre at Bhagalpur. Under the centrally sponsored Integrated Handloom Development Programme for nine handloom clusters, a sum of ` 178.30 lakh was released in 2010-11. Accordingly, the state government has released ` 22.30 lakh as its share for the implementation of the programme. Presently, the Handloom Cluster Programme is being implemented in 14 places in the districts of Nalanda, Banka, Madhubani, Bhagalpur, Patna, Gaya, Rohtas, Siwan and Aurangabad, benefiting around 4500 weavers. The proposed project has an estimated outlay of ` 68.65 crore in which the state government's contribution will be ` 24 crore and the remaining amount will come from contribution of beneficiaries. Under this business plan, the work on rehabilitation of spinning mills and processing plants and upgradation of training centres are in progress. Under revised 20 Point Programme, there is a state run scheme to modernize the looms of weavers under the cooperative sector. During 2010-11, under this scheme, there was a target to distribute 280 modern looms in 20 districts, based on 100 percent subsidy. Similarly, the state government has fixed a target to distribute subsidy for purchase of bi- cycles to 2000 weavers under the cooperative sector at the rate of ` 2000 per bicycle and the remaining amount will be borne by the weavers themselves. In 15 weaver intensive districts, 100 cycles per district, and in five districts with less number of weavers, 50 cycles per district are proposed to be distributed. One Apparel Training and Design Centre was established at Patna in collaboration with Apparel Export Promotion Council of the central government. The state government approved ` 97 lakh for machines and equipment and also for recurring expenses. The payment of house rent of the Centre for the first three years is to be borne by the state government, for which an amount of ` 14.22 lakh has been approved in 2010-11. There were in all 25 persons undergoing training in the year. Under the Industrial Infrastructure Upgradation Scheme, sponsored by the union Ministry of Commerce and Industry, a Common Production Facility Centre is being established at Kahalgaon in Bhagalpur district with a total outlay of ` 22.44 crore. The Centre will have 750 pit looms, 600 frame looms, 50
146
Dobby looms and 50 Jacquard looms with pre-loom and post-loom facilities like dying, bleaching, printing, finishing, packaging, processing and storage. The state government is equally keen to develop the power loom sector for which training facility with stipend is being extended to the weavers. A sum of ` 2.40 crore has been allotted under the centrally sponsored scheme for implementation of Mulberry Development Project at Purnea, Tusser Development at Nawada and Banka, and Castor Silk Development Project at Begusarai. The proportionate state share was ` 1.40 crore. In 2010-11, a Mulberry farm at Rosana (Katihar), a Mulberry Extension-cum-Training Centre at Raghopur (Sitamarhi) and a Mulberry Reeling Centre at Kishanganj were to be established. A detailed project report has been prepared for establishment of Textile Testing Laboratory and CAD (Computer Aided Design) unit at Bihar Silk and Textile Institute, Nathnagar, Bhagalpur. For 2011-12, an outlay of ` 8.48 crore is proposed for development of the sericulture sector in the state. The state government is also in the process of promoting the jute sector and a business plan highlighting all the relevant issues has been prepared after a diagnostic survey. The business plan has recommended certain interventions which include establishment of jute park, modernisation of looms, establishment of processing / design centre, nodal centre for design and product development and jute raw material bank, etc. The establishment of Jute Park in Maranga, Purnea is under progress. There is a proposal to establish Processing / Dyeing Centre and Raw Material Bank in 2011-12. Presently, village industries, coming within the purview of Khadi and Village Industries Commission (KVIC), are engaged in producing a number of products, particularly processing of cereals, pulses, and fruits. KVIC is entrusted with the task of providing financial assistance to institutions/persons engaged in the development and operation of Khadi and Village Industries and guiding them through designs and technical information. The funds for implementation of programmes under to KVIC are received from the central government and routed through the Commission. The Khadi and Village Industries sector in Bihar is being revived and modernized. The young men and women are being imparted training in various trades under this sector. In 2009-10, 250 trainees were imparted training in different trades; of these trainees, 144 were male and 106 female. For 2010-11, a sum of ` 50 lakh was approved under the training programme. Various steps are being taken by the state government for revival of the sick units. The state government has approved the rehabilitation package circulated by BIFR in the light of reliefs and concessions provisioned in the industrial policy, 2006. In order to promote industrial development in the state, which could contribute to its overall social and economic development, a new Industrial Incentive Policy, 2011 has been adopted by the state government. Within this policy, to revive the sick industries, a corpus fund is to be created in collaboration with the commercial banks. The corpus fund will be utilised for providing financial assistance in least possible time to sick small and medium units for which rehabilitation package has been approved. For rehabilitation of MSME, a state level committee under the chair of Director of industries has been empowered with statutory power to take decisions in respect of sick units. A committee would also be constituted under the chairmanship of Principal Secretary of Department of Industries to explore and determine remedies for revival of potential large scale industries and public sector undertakings which are sick and not referred to BIFR. The recommendation will be placed for final approval before the State Level High Powered Committee under the leadership of the Chief Secretary. The rapid growth in IT sector and its impact has mostly been confined to a handful of IT hubs, located only in a few states of the country. Bihar has been largely bypassed by this growth process. To provide good governance through IT and encourage development of IT in the state by investment in the IT/ITES industries, ICT Policy 2011 has been introduced by the Department of Information Technology of the state government. The state government's vision to develop Bihar is as follows: Endeavour for rapid expansion and growth of knowledge based economy in the state;

147
To bridge the digital divide which separates the citizens in urban areas from those in rural areas by creating an adequate IT infrastructure and deliver online services to every citizen in the state;
To make Bihar the next destination of investments in the IT/ITES/EHM industries and further accelerate the development of the state; and
To make Bihar the frontrunner state in good governance through ICT (Information and communication Technology) enablement.
Bihar's economic performance has been improving for the last 6 years, driven primarily by improved law and order situation, the new Industrial Incentive Policy, and improved infrastructure. Attempts are also being made for adequate resource availability, particularly through rainbow revolution in agriculture. Since 2006-07, the Gross Fixed Capital Formation (GFCF), both in central and state sectors, has also increased manifold in Bihar. The investment pattern in Bihar shows that around 77 percent investment is being accounted for by the power sector. Out of the share of only 11 percent in manufacturing sector, the share of food and beverages was very large. The service sector accounts for around 11 percent of the total investment. With improved investment climate and introduction of new Industrial Policy, 2006 and Industrial Incentive Policy, 2011, Bihar is becoming a favoured destination for the investors. In the last 5 years, besides MSMEs, big companies have shown interest in investing in Bihar. In view of the rapid changes in the global industrial scenario, Bihar Industrial Incentive Policy- 2011 has been prepared with an objective to attract domestic and foreign investment as well as revival and expansion of business operations of the existing industrial units by providing the right industrial ambience. Under this proposed policy, there are provisions for granting incentives such as, 100 percent exemption from stamp duty and registration fees during the pre-production phase, capital subsidy for industrial units, inclusion of entry- tax in the re-imbursement of 80 percent of VAT, incentive to existing units for Captive Power Generation/Diesel Generating sets and subsidy on non- conventional sources of energy production, re-imbursement of expenses incurred on project reports and technical know-how fees, Quality Certification, Electricity Duty, etc. With the implementation of Industrial Incentive Policy - 2011, it is expected that the industrial development of the state will get a boost and it will result in rapid industrial development with enhanced employment generation. The industries of Bihar will be able to play a positive role in the overall development of all the state. The state government has received various investment proposals under PPP mode in the field of food processing and has provided 80 acres of land at Kahalgaon in Bhagalpur to establish a food park. The efforts are on to develop north Bihar industrially, where the industrial development is minimal. Bihar is well known for its historical and cultural heritage, and the state, full of tourism potential, has accorded tourism the status of industry. The state government is making an all out effort to develop nationally and internationally important tourists destinations and circuits through various tourism projects. These projects are, by and large, judicious mix of cultural, spiritual, heritage and eco-tourism with a view to provide the tourists a holistic experience of the state. The tourist destinations are also connected by the facilities of road, rail, and air routes. For the comforts of tourists, the Department of Tourism provides luxury buses and taxies. The state government has decided to form Tourism Security Force for providing security and friendly services to the tourists. A 48-seater air-conditioned floating restaurant on the river Ganga is in regular operation for attracting tourists. Besides, on the pattern of Haridwar and Varanasi, the Ganga 'Aarati' has been started on its bank in Patna. In 'diara' area close to the Ganga river, a food hub, swings for children and water games have been started for tourists. At a natural spot at Ghora Katora in Rajgir, the facilities like boating, cycling, etc. have been provided. For a new ropeway at Rajgir, a sum of ` 10.84 crore has been approved. The state government has established also the Bihar State Tourism Development Corporation with the prime objective of

148
developing hotels, transports, railways, swimming pools, health tourism, etc. and run them on commercial basis for the benefit of tourists. Major minerals are regulated by the Mines and Minerals(Development and Regulation) Act, 1957, Mineral Concession Rules, 1960 and Mineral Conservation & Development Rules, 1988. However, minor minerals are regulated by the Bihar Minor Mineral Concession Rules, 1972 and Bihar Minerals (Prevention of Illegal Mining, Transportation and Storage) Rules, 2003. In case of minor minerals, a need was felt for formulation of policy regarding sustainable and scientific mining of minor minerals taking environmental aspects into consideration. The Hon’ble Supreme Court of India, vide its order dated 27.02.2012, has given a detailed judgement giving direction regarding regulation & conservation of major as well as minor minerals. The process of making necessary amendments in the Bihar Minor Mineral Concession Rules has been initiated, in compliance to the order passed by the Hon'ble Supreme Court. The said amendment will help to address climate change, promote sustainable development and ensure a balanced eco-system. 12.4 Priorities
In the 12th FYP, focus will be on intensive efforts to promote industrial growth in areas where the state has comparative advantage such as agro and food processing, tourism, healthcare industry, higher and technical industrial education, FMCG and other consumer goods, secondary steel sector, textiles, power and renewable energy generation. Growth of the manufacturing sector in the 11th Plan is likely to remain at 8.2 percent. There is need to raise this growth to 11-12 percent per year in the 12th Plan period to create more jobs for the growing labour force. This has become an urgent need, since it is now clear that agriculture will no longer absorb more workers. The manufacturing sector (industry) performance is weak at the present scenario. Hence it has to perform better in investment, production, and creation of jobs. The overall strategy under the 12th FYP will include: Promoting MSMEs 'cluster'; Thrust on skill upgradation/Skill development Institutions. To adopt and encourage PPP
mode of investment; Revival of PSUs of the state; Rehabilitation of Sick Units; and To promote value added production (food Processing) diversified products- milk, fish,
meat, and poultry, agro based wealth- consumer products. The State government and private sector will collaborate for development of tourism infrastructure. The state government will prepare an area-based Master Plan for developing infrastructure as necessary for the respective areas and regions. Efforts will be made to dovetail external assistance, central assistance, and the State plan resources with private investments to attain the set goals as under the Master Plan. 12.5 Perceived Climate Impacts
While there have been no Bihar specific detailed studies on climate change available evidence shows several pointers, as in the case of the energy sector. Industry is likely to be vulnerable to a variety of climate risks, including extreme weather events that can adversely impact industrial infrastructure. Agro-based and food processing industries that rely on agricultural resources can be particularly vulnerable. Likewise, industries that are either water or energy intensive could also be similarly vulnerable to climate change and its impacts. Because of their financial and technical resources, large industrial organizations typically have a significant adaptive capacity for addressing vulnerability to weather extremes. SMEs typically have fewer financial and technical resources and therefore less adaptive capacity. As such, climate change is likely to disproportionately impacts smaller industrial establishments, in particular those in high risk or highly dependent on climate vulnerable resources such as agriculture. On the other hand, industries could also contribute to climate

149
change. The industrial sector emissions of greenhouse gases (GHGs) include carbon dioxide (CO2) from energy use, from non- energy uses of fossil fuels and from non-fossil fuel sources (e.g., cement manufacture); as well as non-CO2 gases. Many industrial segments also emit a range of non-CO2 GHGs including N2O from the chemical and food industries. Industries can also contribute to climate change by a variety of other means, including energy inefficiency.
12.6 Strategies Towards improving scientific knowledge and evidence base and understanding of
climate change and its impacts, the Department will commission cluster-wise or district-wise studies to estimate the carbon footprint of industrial clusters in the State. This would include a baseline study, as well as periodic studies.In line with the overarching State objectives of improving governance mechanisms, institutional decision-making and convergence, the Industries Department, together with various industries associations will initiate the following: Carry out a review of the current industrial policy and strengthening it with reference to
climate change including explicit incorporation of climate concerns and the institutional and governance framework for climate change initiatives vis-à-vis industry will be enshrined in a proposed new Industrial policy;
Constitute a state-level Task Force, comprising representatives of the state government, industry, and technical experts to drive the climate initiatives of the BAPCC. The possibility/viability of establishing cluster-wise or district wise Sub-Task Forces will also be examined.
The Industries Department recognises that many options exist for mitigating GHG emissions from the industrial sector, in three broad categories: Sector-wide options, for example more efficient electric motors and motor-driven
systems; high efficiency boilers and process heaters; fuel switching, including the use of waste materials; and recycling;
Process-specific options, for example the use of the bio - energy contained in food and pulp and paper industry wastes, and various heat/energy recovery technologies as well those to reduce process specific emissions; and
Operating procedures, for example control of steam and compressed air leaks, reduction of air leaks into furnaces, optimum use of insulation, and optimization of equipment size to ensure high capacity utilization.
As such, the Department will identify and put into motion processes for leveraging these options in existing industrial units, as well examine ways to build these into plans for the development of new industrial units. While it is clear that industries will not invest in GHG mitigation if other factors provide a return on their investment, the Department will examine ways of incentivising such investments and linking it to initiatives such as energy efficiency projects, through which economic gains can accrue. Where industries lack of the financial and technical resources needed to implement mitigation options, and have limitations in the ability to access and absorb technological information about available options, the Department will seek to build adequate linkages with financial institutions as also to build capacities of industrial establishments (potentially in partnership with other relevant agencies/institutions/industries associations). The Department will also seek to develop appropriate policy and regulatory instruments that encourages the implementation of existing and new mitigation technologies that could lead to lower GHG emissions, and seek to develop policy portfolios that reduce the barriers to the adoption of cost-effective, low-GHG-emission technologies, including CDM. The Department will also examine the possibility of promoting voluntary agreements between industry and government to reduce energy use and GHG emissions as part of its policy package. The Department will promote and build awareness, and develop and deploy measures to incentivise industries to adopt a range of

150
management practices including energy audits, adoption of energy efficiency measures and technologies, benchmarking, etc. Likewise, the Department will also build awareness on options, opportunities and benefits of fuel switching, including the use of waste materials, energy (especially heat and power recovery), cogeneration (which could, for example, be readily adopted in Bihar’s sugar industry), use of renewable energy including biomass and by-product wastes based generation, and materials efficiency and recycling. Efforts will also be initiated to undertake infrastructural improvements in industrial areas in the State. The Department will also examine the options for developing and deploying a range of financial instruments such as taxes, subsidies and measures to improve access to capital as these could potentially lead to energy savings and corresponding emission reductions and can create a larger market for energy efficient technologies. At the same time, the Department will also examine options for budget allocations for research and development on innovative technologies, subsidy, or legislation to stimulate specific environmental technologies, or regulation/disincentives to reduce/eliminate use of unsustainable technologies. The Department will also take proactive steps to build partnerships with industry associations, and through them, initiate sustained process to stimulate technological innovation and change to reduce dependency on imported fuels, to improve resources use efficiency, waste management, water and air pollution reduction, and enhance use of renewables, while providing health benefits and improved services to communities. Sector specific studies will also be undertaken, to examine options for improvement – these will include, for example, the brick making sector, which generates significant emissions from a large number of brick kilns in the state. Mining activities are negligible in the State after the separation of Jharkhand, and as such, will not need focus on in the BAPCC. However, the Department will undertake a study of the mining sector, its status, and prospects from the standpoint of climate change and its impacts in association with the Department of Mines and Geology. Appropriate strategies and actions for the mining sector, if required, will be developed on the basis of the findings of the study. 12.7 Institutional Linkages and Stakeholders
Institutional linkages are envisaged various agencies/departments including BIADA, the Energy Department, Water Resources Department, Environment and Forest Department in addition to linkages with various industries associations, industrial groups and entrepreneurs, as well as with academia, civil society, international development agencies, private sector and financial institutions, and communities in general. 12.8 Linkages with the NAPCC
The outlined strategies herein are consistent with the NAPCC in general, as well as with the National Mission on Energy Efficiency, the National Solar Mission, the National Mission for Sustainable Agriculture, and the National Water Mission. 12.9 Sectoral Action Plan and Budgets under the BAPCC See Part C, Action Plans and Budgets

151
13 Human Health 13.1 Overview, Characteristics and Status 13.1.1 Key Health Indicators and Performance
Climate Change may be described 1st as “global” and 2nd as “nature”. Global - Change includes environment disturbance arising from localized source, but having widely dispersed effects. Global climate changes occur because of perturbation in systems operating on a global level, and this makes stand out from other wide-ranging, human induced environmental problems. Nature – Nature of Phenomenon and not by the distribution of its impacts. The average Temperature is a convenient metric for describing climate, but there are
other aspect of climate change that are more closely related to the incidence of disease
and injury.
Besides education, the status of health is also an important component of the human development of a state. The status of public health services in India, even after six decades of independence, is not satisfactory and Bihar is no exception to this overall trend. Although health services from the private sector are also available to the population, public health services still play the major role in providing health services to the people, particularly to its poor section. The status of health services in Bihar is still inadequate, but substantial improvements have been recorded in this sector in recent years. This is because of increase in expenditure for health services on one hand and better monitoring of the health services on the other. This section will present the relevant information on the various initiatives taken by the state government to improve the health services in the state. These improved services have indeed resulted in improved overall health situation in the state, as indicated by some crucial health indicators. One of the key indicators of status of health in the state is the Infant Mortality Rate (IMR). In spite of being the poorest state in the terms of per capita income and having the least literacy rate, the IMR in Bihar is 48 per thousand live births in 2010, nearly equal to national average of 47 per thousand live births. Between 2005 and 2010, the IMR in India has been reduced from 58 to 47. This pace of decline was even higher for Bihar, as the IMR for Bihar has decreased from 61 in 2005 to 48 in 2010. One can also note the improved health situation in Bihar through the data on Crude Death Rate (CDR). In 2010, the CDR in Bihar was 6.8, compared to a higher national average of 7.2. This is a major achievement, since 6 years earlier the CDR in Bihar was higher than the national average. Along with a drop in IMR, Bihar has also recorded a sharp drop in Maternal Mortality Ratio from 312 in 2004-06 to 261 in 2007-09. It was noted before that the decadal growth rate in population in Bihar between 2001 and 2011 has been the highest among all states of India. This is obviously due to high fertility rate in Bihar, which depends both on demographic behaviour patterns and health services for limiting the size of the family. The changes on both these parameters have caused the Total Fertility Rate (TFR) in Bihar to come down from 4.3 in 2004 to 3.9 in 2009. The present level of TFR is higher than the all-India figure of 2.6, but the pace of decline in TFR is nearly same in Bihar and India. As regards Crude Birth Rate (CBR), the same pattern is observed. In 2010, the CBR in Bihar was 28.1, compared to 22.1 in India, but the pace of decline in birth rate was same for Bihar and India. For the period 2005 to 2010, the rate of decline in birth rate in Bihar is higher than the national average; but there is a still a long way to go to attain the replacement level fertility rate.The District Level Household Survey (2002-04 and 2007-08) and Coverage Evaluation Survey (2009) conducted by Ministry of Health and Family Welfare of the central government show that there has been considerable

152
improvement in Bihar as regards Ante-Natal Care (ANC) for mothers, institutional delivery, and immunisation of children. For example, the percentage of mothers who had three or more ANC check-ups was 33.8 percent in 2009, which was much higher than 16.0 percent in 2002-04. Similarly, the percentage of institutional delivery has also increased from 18.8 percent in 2002-04 to 48.3 percent in 2009. The improvements under immunisation was even more substantial; compared to a mere 20.7 percent who were fully immunised in 2002-04, it was much higher at 49.0 percent in 2009. An external evaluation of full immunisation in Bihar in 2010-11 found that 66.8 percent of children are fully immunised. 13.1.2 Health Infrastructure
Due to resource constraints, the large infrastructure gap and the absorptive capacity for large-scale civil construction, it has not been possible for state government to create a health infrastructure, which is adequate to provide required health services to the population as per national norms. However, the approach in Bihar has been a pragmatic one with the thrust on ensuring functionality of facilities rather than mere creation of civil infrastructure. The 533 Block level Primary Health Centres are all being developed into 30 bed Hospitals like Community Health Centres. The state government has already approved such upgradation of Block PHCs into 30 bed hospitals. Already 496 Block PHCs work round the clock, with provision for drugs, diagnostics, and doctors. The state government is not converting 477 Additional PHCs into round the clock facilities for labour room services. Apart from this overall inadequacy, there is also considerable inter-district variation in terms of availability of health institutions. In terms of average population served by a health institution as on September 2011, the best three districts are – Sheikhpura (6286), Banka (7601), and Bhojpur (7891). On the other end, the three most disadvantaged districts are – Madhepura (13037), Rohtas (13109), and Seohar (13406). 13.1.3 Health Case System Functionality
The recent improvements in the functioning of health care system in Bihar is indicated by the monthly average number of patients visiting government hospitals -- presently, the number of patients visiting hospitals is 7950, compared to 1819 in 2006. This more than four fold increase in patient footfalls in hospitals is the result of better monitoring of the system and provision of free medicines for a large number of patients. The state government is also organising a large number of health camps to increase awareness about health among the population. The availability of health services varies considerably across districts. Two indicators have been computed to indicate the intra-state variation in availability of health care services. These indices are average number of outpatient visits per hospitals and average number of outpatient visits per day. The average number of outpatient visit per hospital in 2011 varies from 35 thousand in East Champaran to 117 thousand in Araria. For the state as a whole, the average number of outpatient visit per hospital is 66 thousand. Apart from providing health services to outpatients, the hospitals and health centres also admit patients for indoor services. For the state as a whole, the occupancy rate has increased from 22.6 percent in 2009-10 to as high as 94.1 percent in 2011-12. The demand for health services is so high that, in no less than 14 districts, the bed occupancy rates exceed 100 percent. This is a clear pointer to the need for major expansion of beds in different health institutions in Bihar. Between 2001-02 and 2006-07, the number of institutional deliveries has increased only marginally, but in 2007-08, there was a huge increase of nearly 7 times in the number of institutional deliveries. Thereafter, it has registered an annual growth rate of about 18 percent. One of the principal reasons for substantial increase in institutional deliveries is successful implementation of Janani Evam Bal Suraksha Yojana (JBSY). Under this programme,

153
there is a provision of cash transfer to the mothers who come to health institutions for the delivery of their children. In 2009-10, there were 12.5 lakh institutional deliveries in the state and it has increased to 13.8 lakh in the next year. In 2011-12, during the first 6 months, there were already 6.8 lakh institutional deliveries under JBSY. The coverage of immunisation of children is another component of health services. The immunisation programme covers BCG, polio vaccination, DPT, and measles. Taking 2010-11 into account, it is observed that the coverage of BCG is as high as 85.5 percent. For pulse polio, DPT, and measles the respective ratios are 70.8 percent, 75.4 percent, and 69.2 percent. These coverages are much higher than what it was a few years ago. According to an evaluation by an external agency, the overall immunization coverage was 66.8 percent in Bihar in 2010. 13.1.4 Health Budgets
The provision of budgets for the health sector has continuously increased since 2005-06. During the period 2005-06 to 2010-11, the annual growth rate of budgeted expenditure for health services has been 21.0 percent (Table 5.25). In the earlier years, the funds finally received for health expenditure used to be lower than the funds budgeted. But the position has improved in recent years and now the actual funds received are very close to the budgeted amount. Consequently, the annual rate of growth of funds actually received has been more than 40 percent. The health department has also shown its improved efficiency, resulting in higher utilisation of received funds. This utilisation ratio was 31.1 percent in 2005-06 and had steadily gone up to 89.8 percent in 2009-10. In 2010-11, even after a drop in utilisation ratio, it stood at 71.4 percent. 13.1.5 Integrated Child Development Scheme (ICDS) As on September 2011, 544 ICDS projects are operational in Bihar covering all development blocks in 38 districts. A total of 86,237 Anganwadi Centres (AWCs) and 5540 mini-AWCs are functioning under those 544 projects. 13.1.6 Rajiv Gandhi Scheme for Empowerment of Adolescent Girls
(RGSEAG) (SABLA) The SABLA scheme aims at empowering adolescent girls of the age group 11-18
years by improving their nutritional and health status, upgradation of home skills, life skills and vocational skills. The girls are equipped with information on health and family welfare, hygiene, and existing public services. The scheme is being implemented using the platform of ICDS and AWCs are the agents for the delivery of services. However, wherever the infrastructure and other facilities under AWCs are inadequate, then alternative arrangements are made in schools/panchayat community buildings. The SABLA scheme has been approved on a pilot basis by the central government initially in 200 districts in the country. The scheme was launched on International Women’s Day in 2011, and 12 districts of Bihar are included in the same. These districts are Patna, Buxar, Gaya, Aurangabad, Sitamarhi, West Champaran, Vaishali, Saharsa, Kishanganj, Banka, Katihar, and Munger. The SABLA is a 100 percent Centrally Sponsored Scheme (CSS) for all inputs, except nutrition component, which will be shared between the central and state government on a 50:50 basis. In 2011-12, a budget allocation of Rs 6.69 crore has been made for training and other purposes, while ` 162.47 crore has been allotted under nutrition component by the central government. The state government has allotted an amount of ` 10 crore as budgetary provision. As many as 21,66,269 adolescent girls have been identified so far under the scheme. 13.1.7 Indira Gandhi Matritva Sahyog Yojana (IGMSY)
In Bihar, IGMSY is being implemented in two districts of Vaishali and Saharsa. For 2011-12, the state government has approved an amount of ` 45.02 crore for the

154
implementation of the programme, while the allocation by the central government is ` 22.91. So far, 1.04 lakh pregnant women have been enrolled by the scheme. 13.2 Key Issues
Key issues in the health sector primarily centre on the availability of health infrastructure, which is lower than national standards/averages. Drinking water supply and sanitation coverage and infrastructure is also relatively low, leading to frequent outbreaks water-borne diseases. This is further compounded by frequent floods, heat and cold waves that the State experiences. Shortage of skilled frontline health personnel (ANM, LHV) to provide timely and quality ANC and PNC services is another problem confronting the state. Besides, public health facilities providing obstetric and gynaecological care at district and sub-district levels are inadequate. Morbidity and mortality due to vaccine-preventable diseases still continues to be significantly high. Similarly, child health care seeking practices in the case of common childhood diseases such as ARI and Diarrhoea are not satisfactory. The child health scenario is worse for specific groups of children, such as those who live in rural areas, whose mothers are illiterate, who belong to SCs, and who are from poor households. High levels of maternal malnutrition leading to increased risk of low birth weight and sub-optimal breastfeeding, are both key causes of neonatal mortality, which today constitutes the main cause of child mortality is an issue of concern. Although the total fertility rate had declined by about half in the six-year period between NFHS-1 and NFHS-2, it has increased in NFHS-3. Furthermore, certain groups such as rural, illiterate, poor, and Muslim women within the population have even higher fertility than the average. The major issues affecting the implementation of the Family Planning program in Bihar are – the lack of integration of the Family Planning programs resulting in dilution of roles, responsibilities and accountability, inability of the program to alter fertility preferences of eligible couples through effective Behaviour Change Communication, overemphasis on permanent family planning methods such as, sterilization compared to other reversible birth spacing methods that may be more acceptable to certain communities and age groups, weak public-private partnerships and social marketing to promote and deliver family planning services, high gender disparity leading to weakening of women views and their consequent non-involvement in decisions about family size and planning. Bihar also has a high burden of diseases, which arises from natural calamities (such as floods), poor environmental conditions (such as water and vector borne diseases), poor nutrition status, and acute poverty in which a day’s wage is a significant incentive to skip treatment. 13.3 Existing/On-going Initiatives
Bihar has a population of 10.38 million. The population growth rate is 28.43 percent as compared to the national growth rate of 21.34 percent. There has been an increase in health sector allocation by 87 percent from ` 1, 066 crores in 2005-06 to ` 1, 991 crores in 2008-09 including untied funds, to facilities at all levels. Several new initiatives such as JBSY that has resulted in a tremendous increase in institutional deliveries, Muskaan - Ek Abhiyaan that increased the rate of immunization, 1911 Helpline and 102 and 108 Ambulance network services to name a few have been successfully implemented. An increase in the free availability of drugs and diagnostics has resulted in an increase in OPD attendance by three to 10 times over the past 2-3 years. Working with development partners such as the United Nations Children’s Fund (UNICEF), DFID etc., to address health related issues in a concert and integrated manner has been a priority of the health department in the recent times. For monitoring of health services, the central government has started Annual Health Survey (AHS), which provides information on important health indicators at district level. It has been made an

155
integral part of National Rural Health Mission (NRHM) and this survey was conducted in eight states — Bihar, Jharkhand, Uttar Pradesh, Bihar, Madhaya Pradesh, Chhattisgarh, Orissa, and Rajasthan. The first survey was done in 2009. Taking into account IMR, the three districts with the highest IMR are Madhepura (71), Sitamarhi (67), and Khagaria (66). The three districts having the lowest IMR are Patna (39), Begusarai (46), and Bhojpur (48). Following are some of the notable developments that have taken place in the health sector in the last few years: Mothers having at least one antenatal check-up have increased to 59.3 percent (up
from 31.4 percent in DLHS2) and mothers having three or more ANCs are up from 16 percent (DLHS 2) to 26.4 percent at present. Institutional delivery rate is 27.7 percent as compared to 18.8 percent in DLHS2. The proportion of children breastfed within the first hour of birth has increased from 5.7 percent in DLHS2 to 16.2 percent at present. Forty one point four percent of children (between 12-23 months) are fully immunized compared to 20.7 percent in DLHS2.
In comparison to 39 patients visiting Primary Health Centres for treatment in the year 2006, 2010-11 saw an average of 3500 to 5000 patients registering at the health centres per month. In year 2010-11 around four crore people got treatment at the Government Health facilities whereas in 2011-12 approximately 2.45 crores people got treatment till August 2011. About 7.98 Lakh patients were admitted in Government Hospitals for treatment in year 2007-08. In the year 2010-11 this number increased to 24 Lakh.
After four decades a medical college with a capacity of 100 students has been opened in the state at the Indira Gandhi Institute for Medical Sciences. Besides, enrolment capacity at Nalanda Medical College, Patna has also been increased from 50 to 100.
Two nursing colleges have been established for BSc nursing study. India’s first nursing skill lab has been set up at Guru Govind Singh Hospital, Patna City.
In order to establish new medical colleges, Vardhaman Mahavir Medical College, Pawapuri, Nalanda is being constructed at the cost of 630 crores. The construction of Medical Colleges and Hospitals are also proposed at Bettiah and Madhepura.
With the purpose of strengthening health system of the state, basic infrastructure and human resource are being developed. The construction of new health sub centre, additional PHC, Block level PHC, SDH and District hospital are being carried out. ICUs have been set up for new born at DMCH and NMCH. Similarly, Nutrition Rehabilitation Centres is being set up in all 38 districts. As a sequel to healthy Bihar, Nayi Peedhi Swasthya Guarantee Yojna (NPSGY) has been initiated on 22nd March 2011. This program is an integrated program mainly for all boys and girls studying at government school between the age group of 0-14 and 14-18 respectively. The basic objective of this program is to make the children aware of the importance of safe drinking water, personal and community hygiene. For providing first aid to the common people of the state and making medicines available at the community level all the ASHAs have been provided drugs kits. Replenishing medicines in their kits is to be done by concerned PHCs from time to time. With the objective of making doctors and health services available to rural inhabitants, Healthy Bihar Campaign initiated through Swasthya Chetna Yatra was successfully implemented within defined timeline. Social marketing of contraceptive program by ASHAs has been initiated wherein contraceptives have to be made available to beneficiaries at their homes.With the aim of reducing MMR, Yukti Yojana scheme is initiated by accrediting private institutions for providing quality abortion care services to the willing women. Ultra Modern life saving ambulance service has been made available at each of the district headquarters for providing better services to the common people.

156
Dhanvantari Rath (Mobile Medical Unit) is being run in all 38 districts under Public-Private Partnership mode to provide health services to people living in far-flung and remote rural areas. Free health services like check up and counselling, medicines, X-ray, pathological services, ante natal test and immunization services are being provided to dalits through this mobile medical unit. Post natal family planning strategy has been initiated which aims at providing family planning counselling and services to all eligible couples after delivery of the child. As a sequel to "Healthy Bihar Campaign" grievance redressal system has been started by health departments with a view to making health services more transparent. By using this service any one can register his/her complaints and access information related to health department and medical advice. Construction of special newborn care unit in 11 Sadar hospitals in 2011-12 has been sanctioned. Village Health and nutrition day is being observed once a month at each Anganwadi Centre where services like health, nutrition and safe drinking water are being provided. Health facilities and medicines are being made available under Allopathic along with AYUSH to common people at all hospitals of the State. Approximately 1384 AYUSH Doctors have been appointed on contractual basis for Additional Primary Health Centres. AYUSH Medicines have also been made available to AYUSH doctors. Family planning efforts have gained momentum and the fertility rate is expected to decline in the state shortly. Family planning has been given priority in year 2010-11. In the year 2004-05 total number of APHC was 1243. Based on the population, a decision was taken to create and construct 1544 new APHC. There are 534 community development blocks in the state. Till 2004-05 total number of functional Primary Health Centres (PHC) was 399. The construction of another 135 Primary health centres was sanctioned so that every block should have one PHC. In year 2004-05 there were 25 districts (Sadar) hospitals. The Government has sanctioned construction of 11 new District Hospitals out of which nine have been completed. However, construction is in progress at Khagaria district. Renovation work had been sanctioned for 25 district hospitals against which 22 have been completed till date. There were 23 sub divisional hospitals in the state in 2004-05. The building construction for 21 new sub divisional hospitals was sanctioned in 2005-06. In addition to this, 14 referral hospitals were upgraded to sub divisional hospitals. The 22 sub divisional hospitals are also being renovated. In nine subdivisions building construction for sub divisional hospitals have been created and sanctioned for which construction work is in progress. This will take the total number of SDHs to 67. Different pathological services are being made available at the government approved rates at all PHCs FRUs and SDHs through setting up of sample collection centres at SDHs and testing centres at DH under PPP mode. With the help of Integrated Disease Surveillance program timely identification and remedy of infectious diseases is being done in coordination with the concern departments. In addition to this, data is regularly collected related to certain diseases, which indicate the level of intervention that is needed to control these diseases. Under this program Department of Microbiology, PMCH, Patna is being strengthened to work as IDSP and as a nodal lab. At present facility for Dengue and Chikungunya testing is also available here. A large number of doctors have been appointed and the process for recruiting additional doctors has been initiated. In the last year different types of contractual appointments have been made. 13.4 Priorities
Under the 12th FYP, expansion of the State’s health infrastructure will be accorded high priority. Two bills namely – (1) Bihar Clinical Establishment (Registration and Regulation) Act and (2) Bihar Medical Service Institution and Individual Protection Act have been passed by the State government. With the enactment of Bihar Clinical

157
Establishment Act, qualitative health services will be made available at government and private health hospitals. At the same time registration will also be essential. Bihar Medical Service Institution and Individual Protection Act ensure security to doctors and health personnel at one end and on the other hand also ensure that the poor and the common people are experiencing excellent services at the health facility. By making Bihar Medical Services and Infrastructure Corporation limited functional steps are being taken for purchasing of equipment and construction of buildings. Setting up of Advance Trauma Centre is being taken care of by State Health Society, Bihar. ANM and GNM Training Schools will be strengthened after increasing the number of seats as well as setting up new nursing colleges. Private players will be especially encouraged to establish such schools and colleges. The state plans to move ahead with five primary objectives that are going to define its guiding principles in the sector in the coming years: Reduce Maternal Deaths Reduce infant deaths Reduce Total Fertility Rate Increase availability of medical professionals Reduce barriers to access health services For Kalazar Elimination program, the year 2017 is set as the target for complete eradication (1 case in < 10,000 population). The other targets in this program are making available New Tools i.e. rK39 - diagnostic kit and oral drug miltefosine in epidemic districts, management and planning strategies significantly strengthened by positioning of Consultants and KA Technical Supervisors in all epidemic districts, free diet to patient and one attendant, incentive to patient at ` 50/-per day towards loss of wages during treatment, incentive to ASHA for referring a case and ensuring complete treatment. In order to achieve these objectives, the state will have the following guiding principles: Health as a matter of right Health as a sector-wide issue System approach to health improvement; and Partnerships and community involvement Strategy Coordination with other departments will be a key strategy towards seeking a comprehensive health plan within the state. Towards establishing this a state level coordination committee comprising of members from ICDS, Panchayati Raj, Education, Water and PHED under the chairmanship of Development Commissioner would jointly work to seek support from other development departments in improving the quality of service delivery is proposed. A hub at the Panchayat level is proposed that could provide various entitlement based facilities to people. For achieving efficiency, accountability and providing transparent services focus will be on developing the capacity of the departments; improve the direction, utilization and effectiveness of budget spending, enhance the availability of skilled medical, nursing and support professionals, strengthen information, monitoring and evaluation systems, enhance the capacity for strategic planning and evidence based decision making, improve governance, social accountability and transparency. Muskan Ek Abhiyan program will be run as a mission in Bihar to ensure better immunization percentage as compared to national average. Preparation of Special program for School Children to encourage health check up, distribution of child wise health card, to provide facilities like vitamin A, De-worm medicines will be distributed once in every three months. All Health Centres in the State will be made to work for 24 hours in order to provide primary health care. There were 8858 health sub

158
centres in the year 2004-05. Based on population, decision has been taken to construct additional 7765 new health sub centres. Fund has been made available to the district health societies for the construction of 758 health sub centres. Installation of solar water heater has been sanctioned for 148 health institutions. Keeping in view the dearth of Super Specialist Hospitals in the state, at least one Super Specialist Hospital will be established for each main disease in next five years. In order to reduce the number of patients going outside for treatment, quality changes are being made in health facilities located within the State. Efforts are being made to enhance facilities provided by Mahavir Cancer Sansathan so that number of patients moving out of state for treatment can be reduced. The proposals to build three medical colleges in the state and its proper functioning will be ensured. Besides, investors will be encouraged to invest for private medical colleges. With the vision to strengthen the present medical colleges of the state, facilities like building, specialized equipment, trained doctors and para-medical doctors will be provided. In order to bring better health facilities to the present medical colleges, efforts for improvement are being made by contacting Public Service Engineering Department for building and electricity. Steps to improve all the medical colleges will be planned. 13.5 Perceived Climate Impacts
Our personal health may seem to relate mostly to prudent behavior, heredity, occupation, local environmental exposures, and health-care access, but sustained population health requires the life supporting "services" of the biosphere. Populations of all animal species depend on supplies of food and water, freedom from excess infectious disease, and the physical safety and comfort conferred by climatic stability. Climate change threats to human health: The three main categories of health risks include: (i) Direct-acting effects (e.g. due to heat waves, amplified air pollution, and physical weather disasters), (ii) Impacts mediated via climate-related changes in ecological systems and relationships (e.g. crop yields, mosquito ecology, marine productivity), and (iii) The more diffuse (indirect) consequences relating to impoverishment, displacement, resource conflicts (e.g. water), and post-disaster mental health problems. Public health, to a large extent, depends on safe drinking water, sufficient food, secure shelter, and good social conditions. A changing climate is likely to affect all these conditions. Some of the current and future health effects include: A. Health effects of extreme temperatures Extremes of temperature can kill. Most of the excess deaths during times of thermal extreme are in persons with pre-existing disease, especially cardiovascular and respiratory disease. The very old, the very young, and the frail are the most susceptible. Extremes in maximum and minimum temperatures are also expected to increase. Therefore, it is anticipated that there will be an increase in the number of deaths due to greater frequency and severity of heat waves. B. Health effects of extreme weather events Extreme weather events such as severe storms, floods, and drought have claimed thousands of lives during the last few years and have adversely affected the lives of millions and cost significantly in terms of economic losses and damage to property. These climate extremes, apart from health, also damage the public health infrastructure. India, like other developing countries, is poorly equipped to deal with weather extremes.

159
Hence, the number of people killed, injured, or made homeless by natural disasters has been increasing rapidly. C. Health affects of more variable precipitation patterns Variable precipitation patterns may lead to floods in some areas and drought in other areas and thus endangering food security and also affecting the quantity and quality of water. More variable rainfall patterns are likely to compromise the supply of fresh water. This Leads to – i. Increase in waterborne diseases. ii. Skin problems due to water shortages. iii. Hygiene and health- increases the risk of diarrhea, trachoma (an eye infection that can lead to blindness) and other illnesses. iv. Any increase in frequency and severity of these extreme climate events can cause population displacement. These displaced people are likely to face diverse health consequences - traumatic, infectious, nutritional, psychological, and others. D. Health effects of retracting glaciers Glaciers are the source of drinking and irrigation water in the mountainous and Indo-Gangetic regions in India. These changes could affect the availability of freshwater for natural systems and human use. Excessive melt water could cause flash floods. E. Health effects due to food insecurity Increasing temperatures and more variable rainfalls and loss of agricultural land due to flash floods are expected to reduce crop yields in many tropical developing regions, where food security is already a problem. This is likely to threaten the food security in the country where malnutrition is already an important public health problem. Malnutrition: causes vulnerability to infectious diseases such as malaria, diarrhea, and respiratory illnesses. In Bihar, more than two out of five women are undernourished. Anemia: is another major nutritional health problem in India, especially among women and children. Among children between the ages of 6 and 59 months, the great majority (70%) are anemic. Anemia can result in - maternal mortality, weakness, diminished physical and mental capacity, increased morbidity from infectious diseases, prenatal mortality, premature delivery, low birth weight, and (in children) impaired cognitive performance, motor development, and scholastic achievement. F. Vector-borne diseases Changes in climate are likely to change frequency, lengthen the transmission seasons, and alter the geographic range of important vector-borne diseases, malaria and dengue being the most important. Warmer temperatures enhance vector breeding and reduce the pathogen's maturation period within the vector organism. Dengue is another important arboviral disease of humans, occurring in tropical and subtropical regions, particularly in urban settings. Rodents, which proliferate in temperate regions following mild wet winters, act as reservoirs for various diseases. Rodent-borne diseases are associated with flooding, including leptospirosis, tularemia, and viral hemorrhagic diseases. Other diseases associated with rodents and ticks, and which show associations with climatic variability, include Lyme disease, tick-borne encephalitis, and Hantavirus pulmonary syndrome. G. Impacts from Climate-Sensitive Diseases Changes in climate may enhance the spread of some diseases. Disease-causing agents, called pathogens, can be transmitted through food, water, and animals such as deer, birds, mice, and insects. Climate change could affect all of these transmitters.

160
H. Food-borne Diseases: • Higher air temperatures can increase cases of salmonella and other bacteria-related food poisoning because bacteria grow more rapidly in warm environments. These diseases can cause gastrointestinal distress and, in severe cases, death. • Flooding and heavy rainfall can cause overflows from sewage treatment plants into fresh water sources. Overflows could contaminate certain food crops with pathogen-containing feces. F. Other health effects Increasing global temperatures affect levels and seasonal patterns of both man-made and natural air-borne particles, such as plant pollen, which can trigger asthma. Exposure to ultra violet radiation has been implicated as a cause of skin cancer (melanoma and other types) in fair-skinned human populations living at mid to high latitudes and also to induce immunosuppression that could influence patterns of infectious disease.
No detailed studies are currently available documenting climate vulnerability and risk to the health sector in Bihar. However, a range of other studies has shown that climate Change is bound to affect the basic requirements for maintaining health. It leads to extremes and violent weather events; resurgence of disease organisms and vectors; affects the quantity of air, agriculture and water; and the stability of the ecosystems. The current burden of disease due to climate sensitive health outcomes is considerable. Direct impacts of climate change on human health could include exposure to thermal extremes – leading to morbidity and mortality due to thermal extreme such as cardiovascular and respiratory diseases; and altered frequency and/or intensity of other weather events – leading to injuries, psychological stress; damage to public health infrastructure, by floods and other natural calamities.Indirect impacts of climate change on human health could include effects on range and activity of infective vectors and parasites – leading to changes in geographic areas and incidence of vector borne diseases e.g. malaria, dengue fever and several types of encephalitis; altered local ecology of water borne and food borne ineffective agents because of higher temperatures – leading to changed incidence of diarrhoeal and other infectious diseases. Cholera and higher ambient temperatures foster the growth of pathogens that thrive in or on food e.g. Salmonella infection. Other impacts could include altered food (especially crop) productivity due to changes in climate and extreme weather events, and associated pests and diseases – leading to malnutrition and hunger, and consequent impairment of child growth and development. Climate change can also potentially impact the levels and biological impacts of air pollution, including pollen and spores – leading to asthma and allergic disorders; other chronic respiratory disorders and deaths. Likewise, climate change could impacts freshwater availability fresh water, in turn leading to lack of hygiene and thus increase water born diseases. They can also compound the ever-increasing traffic and exhaust as well as industrial emissions are raising concentrations of SO2, NOx, O3 – leading to health hazards. Thermal stress – heat and cold waves are also another potential impact of climate change in human health, as are indirect impacts arising out of other climate related disasters such as floods and droughts.
Climate change has enormous and diverse effects on human and other livings health. For instance the rises in temperature and sea level and extreme weather events such as floods cause water logging and contamination, which in turn infectious and communicable diseases. According to the Intergovernmental Panel on Climate Change, parts of India are expected to experience serious adverse effects owing to climate change because most states economies rely on agriculture and natural resources. The spatial and

161
temporal distribution of vector-borne diseases like malaria and dengue has been projected to increase due to favourable temperatures, with resulting alterations of communicable disease dynamics. Climate change is a global issue and its adverse impact can affect the entire world too. Increased average temperatures could prolong peak periods for vector-borne diseases, and extreme weather events, including cyclones and floods, can create ideal conditions for the spread of vector-borne and diarrhoeal diseases such as cholera. Climate change is affecting the spread of infectious diseases worldwide posing serious threats to not only humans, but also animals and plants. A drastic change in any climatic parameters will lead to a major concern of society concern to the living health. Vulnerability and adaptation to climate change in health sector. As a result, there is a growing concern about the changing pattern of some of the diseases.
Table 41 List of important impacts of climate change on health
The factors through which climate change affects health are grouped into six
categories of stressors. In turn their impact is articulated into health outcomes. However, rather than acting separately, at least some of them are likely to have mutual interaction and reinforcing effects. For instance, poor air quality (especially high ozone concentration) exacerbates the impacts of heat. However, the poor and the most vulnerable populations are likely to be disproportionately affected, with poorer nations bearing the brunt of the impact due to deficient health systems and resources. The World Health Organization (WHO) estimates that every year about 150 000 deaths occur worldwide in low-income countries owing primarily to the adverse effects of climate change, primarily crop failure and malnutrition, floods, diarrhoeal diseases and malaria. Bihar fit for this statement. Because of Bihar’s large and dense population, the consequences of climate change could be disastrous for the region, which already has a disproportionately high burden of communicable diseases that is expected to increase in the foreseeable future as a result of climate change.
The effects of climate change on health include direct impacts, such as temperature-related illness and death, and the impacts of extreme weather events. They also include more indirect impacts as those that cause water- and food-borne diseases; vector-borne diseases; or food and water shortages.
The key facts of climate change and health released by WHO, November 2013 reveals the following:
a) Climate change affects the social and environmental determinants of health – clean air, safe drinking water, sufficient food and secure shelter.
b) Climate change affects the social and environmental determinants of health – clean air, safe drinking water, sufficient food and secure shelter.
Stressors Health Effects Heat stress
Heat related illnesses and deaths during heat waves. Temperature related mortality and morbidity
Air pollution Respiratory diseases; allergies Food- and water-borne diseases Salmonellosis; Campylobacteriosis Vector-borne diseases Malaria; dengue; Lyme disease Natural disasters
Unintentional deaths and non-fatal injuries; depression; effects on diseases diffusion (e.g. malaria; salmonellosis; E.coli, etc.) , asthma
Under nutrition Decrease food supply – increase risk of diseases

162
c) Global warming that has occurred since the 1970s caused over 140 000 excess deaths annually by the year 2004.
d) The direct damage costs to health (i.e. excluding costs in health-determining sectors such as agriculture and water and sanitation), is estimated to be between US$ 2-4 billion/year by 2030.
e) Many of the major killers such as diarrhoeal diseases, malnutrition, malaria and dengue are highly climate-sensitive and are expected to worsen as the climate changes.
f) Areas with weak health infrastructure – mostly in developing countries – will be the least able to cope without assistance to prepare and respond.
g) Reducing emissions of greenhouse gases through better transport, food and energy-use choices can result in improved health.
Climatic conditions strongly affect water-borne diseases and diseases transmitted through insects, snails or other cold blooded animals. Changes in climate are likely to lengthen the transmission seasons of important vector-borne diseases and to alter their geographic range. For example, Malaria is strongly influenced by climate and transmitted by Anopheles mosquitoes, malaria kills almost 1 million people every across the globe.
Figgure 31 World wide deaths from Malaria
13.5.1 Climate Change and Malaria
Figgure 32 Correlation between malaria incidence and El-Nino Southern Oscillation

163
Malaria is one of the oldest and major public health problems of the world and is number one killer of children, pregnant women and elderly persons. It has now been identified as the disease most likely affected by climate change. Climate, local ecology, and active control affect the ability of malaria parasites and their anopheline mosquito vectors to coexist long enough to enable transmission. The frequency of transmission, or endemicity, depends on the density and infectivity of anopheline vectors. These features depend on a range of climatic, physical, and population characteristics, for example, rainfall, location of human settlements near or at rivers or other mosquito larval breeding sites, and the density of human populations in a village. The most significant determinant of the intensity of parasite transmission is climate. Meteorological factors are important drivers of malaria transmission by affecting both malaria parasites and vectors directly or indirectly. The three main factors that affect malaria are temperature, rainfall and relative humidity and, therefore, with spread of the disease. Changes in temperature, rainfall, and relative humidity due to climate change are expected to influence malaria directly by modifying the behaviour and geographical distribution of malaria vectors and by changing the length of the life cycle of the parasite. Climate change is also expected to affect malaria indirectly by changing ecological relationships that are important to the organisms involved in malaria transmission (the vector, parasite, and host). The ambient temperature plays a major role in life cycle of the malaria vector. Temperatures within the range of 20°C–30°C affect malaria transmissions in several ways 13.5.1.1 Observed
A study was carried out to find out co-relation between rainfall and instances of malaria infection in different villages of Purnia district, Bihar. The study clearly indicates that there occurs a high positive co-relation between rainfall and instances of malaria in the studied villages of the district.Data of monthly rainfall (mm) and instances of malaria in purnia district are shown in table 1 and fig. 1. The result of the study show that except for colder months of the year (Nov to Feb), infection of malaria was in rise during rest of the eight months .The study revealed a trained of rise from the month of May to August (Table -1 and Fig -1), When peak value of patients were found in the district. The instance of malaria started falling from September (Table 1 and Fig. 1).The instances of malaria increases as the amount of rainfall increased. Table 42: Average monthly value of rainfall and malaria cases in Purnia district during the period of Sept 2010 to Aug 2010 (source: Ranjana Kumari and B. N. Pandey, Egypt. Acad. J. Biolog. Sci., 5(1): 193-195 (2012))

164
Figgure 33 Average monthly value of rainfall and malaria cases in Purnia district during the period of September 2010 to August 2010 (source: Ranjana Kumari and B. N. Pandey, Egypt. Acad. J. Biolog. Sci., 5(1): 193-195 (2012)) The maximum cases of malaria where observed in rainy season, when rainfall by maximum (Table -1) followed by summer and winter. The incidence of malaria was maximum in the month of August followed by June and July. This clearly indicates that there is positive co-relation between incidence of malaria and pattern of rainfall. The malaria shows its appearance in the month of February, when ambinent temperature is quite congenial for the parasite, vector as well as host. 13.5.1.2 Future Projected
No significant changes in Malaria transmission is seen over Bihar for future time periods as in Fig.13.2 Figgure 34 Projected risk of malaria transmission in the year 2020, compared with the average risk in the years 1961 to 1990 (Source: IPCC 2007) 13.6 Strategies
The State Health Department is committed to the health and well being of all citizens and visitors to the State, and as such, the Department will stake the necessary steps to gear up for the potential health impacts from climate change, while continuing to contribute to the achievement of the State’s health targets as well as the national health targets plan for 2012 – 2017. As the highest priority agenda, a Climate Change Cell will
165
be constituted in the Health Department, as well as district level sub-cells, and these will be mandated the task of coordinating all climate related activities of the Department under the BAPCC as well as liaising with the State institutional and coordination mechanisms outlined in an earlier section of this report. The Department will undertake collation and review of all available material and evidence related to climate change impacts on human health, and also undertake a review of health policies, plans, and nstitutional frameworks in the State with a view to incorporating climate concerns. In line with the overarching principle of improving scientific knowledge, evidence base and understanding of climate change and its impacts on human health, the Health Department will begin building a strong evidence base including collecting, compiling, and analysing relevant data and information in terms of perceptions of affected people and communities. Based on the results of the comprehensive vulnerability analyses to be undertaken by the State, will review the adequateness of its current plans and institutional frameworks to respond to climate concerns in the health sector at all levels. Plans at all levels including the District health Plans will be suitably amended. Based on current evidence, it is anticipated that the Department will initiate action relating to: Undertaking measures to manage increased vector borne and water borne disease
burden; Design and deploy improved approaches to deal with heat and wave conditions; Dealing with the physical and psychological impacts post-extreme weather events. Addressing drought, malnutrition, and food security issues; and Addressing food safety arising due to increased ambient temperature and extreme
events. Towards building adaptive resilience and reducing vulnerability across communities and sectors, the Department will initiate mechanisms to build adaptive capacities both within the Department and potentially, among the citizens by: Undertaking reviews of the State’s health infrastructure and potential climate change
related vulnerabilities and risks (and where such infrastructure is found to be at high risk, retrofit to make these more climate resilient);
The Department will initiate a range of capacity building measures including: Awareness of people about health hazard from climatic change, covering all areas
like rain water harvesting, energy efficiency, health hazards, water conservation, protection from extreme climate etc.;
Information, education and communication efforts; Behavioural change communications interventions in relation to the impacts of
climate change; Trainings and Sensitizations for Department personnel; Capacity Building of the all medical personnel of in districts including frontline
functionaries and personnel associated with various programmes such as the Integrated Disease Surveillance Programme, Auxiliary Nurse Midwife, Aanganwadi Worker, ASHA & all the medical NGO’s in the district to identify the early signs of extreme climatic effects on the population; and
Developing and strengthening of disaster management teams in every district hospital specifically to respond to the effect of extreme climate changes.
The Department also recognises the need to mount an extensive health surveillance and analyses exercise integrated with monitoring of climate and other environmental conditions that facilitate outbreak of diseases and will work towards developing such a

166
framework. In addition, the Department will initiate mechanisms to carry out the necessary research and other activities necessary to integrate climate concerns into public health emergency response strategies of the State. Where appropriate, the Department will coordinate research efforts with various universities and other academic centres for excellence and collate lessons and pointers to inform policy and practice. The Department also recognises that climate change can have especially disproportionate adverse health impacts on the poor, women, and children, and can therefore also adversely impact livelihoods. As such, it will examine various options for planning investments in information and education programmes, designing them with a gender perspective, including gender-disaggregated data, etc. The private sector already plays a significant role in the health sector of the State, in terms of bringing in healthcare financing, management, and service provision. The Department, in close coordination with the PPP Cell of the Bihar Government, will begin exploring the possibilities of incorporating climate related health concerns into such projects and also the possibilities of private sector involvement in new initiatives to address the emerging challenge of climate change and its impacts on human health. 13.7 Institutional Linkages and Stakeholders
Institutional linkages are envisaged various agencies/departments including the Agriculture Department and the Water Resources Department, in addition to linkages with various industries associations, industrial groups and entrepreneurs, as well as with academia, civil society, international development agencies, private sector and financial institutions, and communities in general. 13.8 Linkages with the NAPCC The outlined strategies herein are consistent with the NAPCC in general. 13.9 Sectoral Action Plan and Budgets under the BAPCC See Part C, Action Plans and Budgets

167
Part C: Climate Change Action Plans and Budgets

168
Annexure 1: Overarching State Level Actions
Interventions Intervention Type Activities Duration Total Cost (in
lakh) Possibility of convergence Expected Outcome
Short-term actions
Coordination and networking Coordination/management
Setting up of State Climate Change Action Plan Coordination Cell
1 year Multi-sector coordination across all departments
Streamlined mechanisms for coordination of all activities under the BAPCC
Climate risk assessments Risk management
Detailed vulnerability assessments across all focus sectors
1 year Multi-sector approach
Improved understanding of climate change vulnerabilities and risks across sectors and districts
State Centre for Climate Change
Scientific research, cooperation and capacity building
Setting up of State Centre for Climate Change
1 year
Coordination across scientific community in state and elsewhere; coordination with Bihar Space Applications Centre and other remote sensing centres/agencies
Coordination mechanisms for scientific research and capacity building on Climate change
Roadmap for Sector climate change impacts evidence base strengthening and documentation
1 year Coordination across scientific community in state and elsewhere; convergence with focus sectors
Detailed strategy for collation and strengthening of evidence base towards improving scientific understanding of climate change and impacts
Capacity Building
Human resource development
Capacity needs assessment and roadmap for capacity building at State level
1 year Convergence with focus sectors Clear understanding of capacity needs at State level vis-à-vis climate change and its impacts
Monitoring and Evaluation Monitoring Development of detailed
reporting and M&E plan 1 year Convergence with all line departments
Comprehensive framework for M&E for the BAPCC
Knowledge management Knowledge management Development of detailed
KM strategy 1 year Convergence with all focus sectors Detailed multi-year strategy for KM under BAPCC

169
Interventions Intervention Type Activities Duration Total Cost (in
lakh) Possibility of convergence Expected Outcome
Medium-term actions Climate Change Coordination Cell
Coordination/management To be detailed by GoB 5 years (12th FYP period)
Convergence with all focus sectors Fully functional Climate Change coordination cell
State Centre for Climate Change
Scientific research, cooperation and capacity building
To be detailed by GoB 5 years (12th FYP period)
Convergence with all focus sectors Fully functional State Centre for Climate Change
Capacity building
Human resource development To be detailed by GoB
5 years (12th FYP period)
Convergence with all focus sectors Improved state capacities to understand and address climate change issues
Monitoring and evaluation M&E
Quarterly BAPCC monitoring reports
5 years (12th FYP period)
Convergence with all focus sectors
Results for programme implementation improvements and mid-course corrections; lessons learnt on what worked and what didn’t; input for improved annual plans for 13th FYP.
Internal Annual Review of BAPCC implementation
5 years (12th FYP period)
Convergence with all focus sectors
External mid-term review of BAPCC Implementation
5 years (12th FYP period)
Convergence with all focus sectors
Evaluation of BAPCC implementation
5 years (12th FYP period)
Convergence with all focus sectors
Knowledge Management Knowledge Management
Hosting of geo-portal on climate change
5 years (12th FYP period)
Convergence with all focus sectors
Significantly improved awareness of and understanding of climate change in the State, and among its citizens/communities
Host-hub for knowledge/information sharing related to climate change; detailed dissemination planning and dissemination
5 years (12th FYP period)

170
Interventions Intervention Type Activities Duration Total Cost (in
lakh) Possibility of convergence Expected Outcome
Identification of potential research and development domains concerned with climate change issues in the state
5 years (12th FYP period)
Knowledge repository 5 years (12th FYP period)
Technical demonstration, research and development, extension and transfer of technology protocols, relating to climate change
5 years (12th FYP period)

171
Annexure 2: Agriculture
Interventions Intervention Type Activities Duration Total Cost (in
lakh)
Possibility of convergence Expected Outcome
Short-term actions
Policy reviews Policy
Review of state agriculture and allied sector policies; incorporation of climate concerns (based on sector vulnerability assessment)
1-1.5 years 15 Convergence with linked sectors such as water resources, energy, etc.
Sector policies explicitly reflect climate concerns
Coordination and networking Coordination/management Setting up of Climate Change Cell 1 year 25
Convergence with districts and linked sectors such as water resources, energy, etc.
Streamlined mechanisms for coordination of all sector activities under the BAPCC
Capacity Building
Human resource development Sector capacity needs assessment 1 year 25 Convergence with districts
Clear understanding of sector capacity needs at State and sub-state levels vis-à-vis climate change and its impacts
Planning Planning
Development of agro-climatic zone-wise adaptation plans, incorporation into Agriculture Roadmap
1-1.5 years
76 Convergence with districts Zone-specific climate response plans in place
Poverty, equity and livelihoods study and strategy formulation 15 Convergence with districts
Enhanced understanding of poverty and equity issues in the sector; integrated into policy and planning
Monitoring and Evaluation Monitoring Contribution to BAPCC Monitoring
Plan 1 year 50 Convergence with districts Sector M&E framework in place
Knowledge management Knowledge management Contribution to BAPCC KM
Strategy and roadmap 1 year 25 Convergence with districts and linked sectors such as water resources, energy, etc.
Sector KM strategy in place
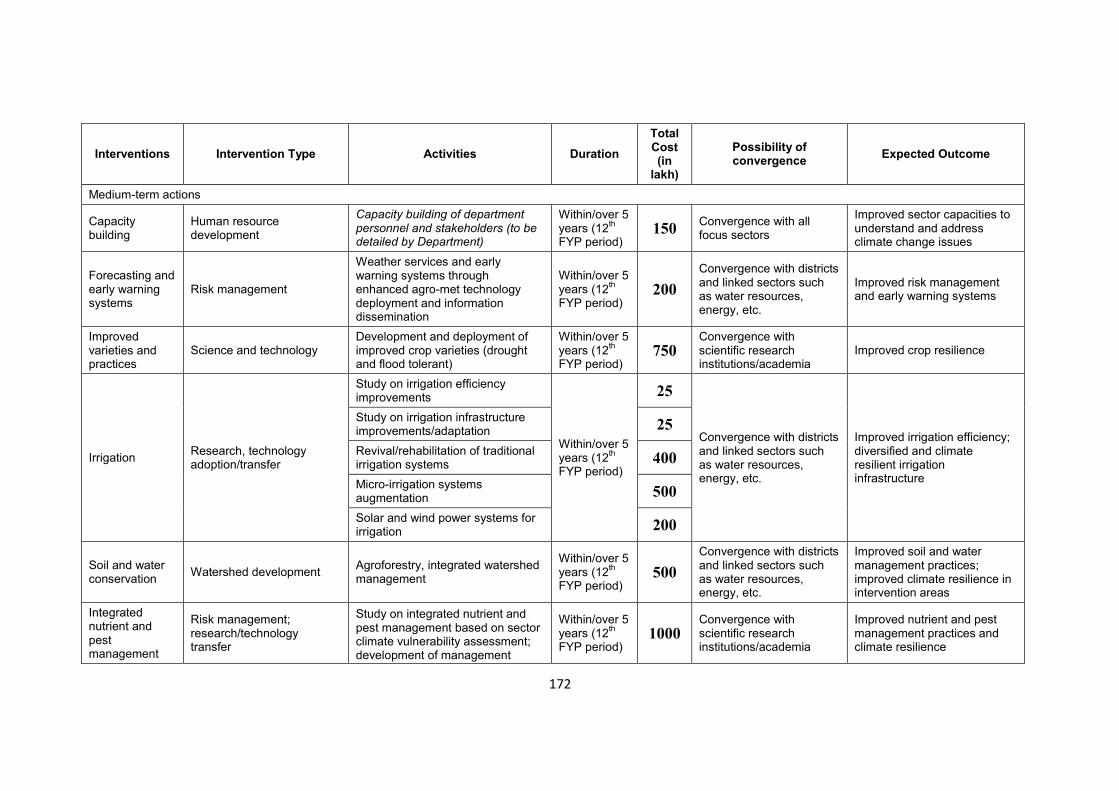
172
Interventions Intervention Type Activities Duration Total Cost (in
lakh)
Possibility of convergence Expected Outcome
Medium-term actions
Capacity building
Human resource development
Capacity building of department personnel and stakeholders (to be detailed by Department)
Within/over 5 years (12th FYP period)
150 Convergence with all focus sectors
Improved sector capacities to understand and address climate change issues
Forecasting and early warning systems
Risk management
Weather services and early warning systems through enhanced agro-met technology deployment and information dissemination
Within/over 5 years (12th FYP period)
200 Convergence with districts and linked sectors such as water resources, energy, etc.
Improved risk management and early warning systems
Improved varieties and practices
Science and technology Development and deployment of improved crop varieties (drought and flood tolerant)
Within/over 5 years (12th FYP period)
750 Convergence with scientific research institutions/academia
Improved crop resilience
Irrigation Research, technology adoption/transfer
Study on irrigation efficiency improvements
Within/over 5 years (12th FYP period)
25
Convergence with districts and linked sectors such as water resources, energy, etc.
Improved irrigation efficiency; diversified and climate resilient irrigation infrastructure
Study on irrigation infrastructure improvements/adaptation 25 Revival/rehabilitation of traditional irrigation systems 400 Micro-irrigation systems augmentation 500 Solar and wind power systems for irrigation 200
Soil and water conservation Watershed development Agroforestry, integrated watershed
management
Within/over 5 years (12th FYP period)
500 Convergence with districts and linked sectors such as water resources, energy, etc.
Improved soil and water management practices; improved climate resilience in intervention areas
Integrated nutrient and pest management
Risk management; research/technology transfer
Study on integrated nutrient and pest management based on sector climate vulnerability assessment; development of management
Within/over 5 years (12th FYP period)
1000 Convergence with scientific research institutions/academia
Improved nutrient and pest management practices and climate resilience

173
Interventions Intervention Type Activities Duration Total Cost (in
lakh)
Possibility of convergence Expected Outcome
options
Monitoring and evaluation M&E
Quarterly sector monitoring reports
Within/over 5 years (12th FYP period)
100 Convergence with districts and linked sectors such as water resources, energy, etc.
Results for programme implementation improvements and mid-course corrections; lessons learnt on what worked and what didn’t; input for improved annual plans for 13th FYP.
Internal Annual Review of sector implementation under BAPCC 100
Knowledge Management Knowledge Management
Identification of potential research and development domains concerned with climate change issues in the sector; initiating studies
5 years (12th FYP period)
500
Convergence with districts and linked sectors such as water resources, energy, etc.
Significantly improved awareness of and understanding of climate change in the sector and its stakeholders
Knowledge repository, strengthening evidence base 100 Technical demonstration, research and development, extension and transfer of technology protocols, relating to climate change
10000
Sector co-benefits identification study 25 Documentation on community perceptions of climate change and impacts
25
Networking and linkages
Networking and coordination
Institutional linkages with research/academic institutions Within/over 5
years (12th FYP period)
50 Linkages with academia, civil society and communities
Improved networking and communications with academia, participatory sector processes
Consultations with civil society 50 Consultations with communities 50
Total Budget for 5 years (12th FYP period) 14981*

174
Budget for Department of Animal and Fisheries Resources, Bihar, Patna
SI. No.
Interventions Intervention Type
Activities Total Cost On Lakh)
Possibility of convergence
Expected outcome
1 Policy Formulation
Policy Formulation of State Livestock Policy incorporation of climate concerns (based on sector vulnerability assessment).
10.0 Convergence with linked sectors such as Agriculture, Forestry, Water Resources, Energy and Rural Development etc.
Sector policies would try and address the climate change concerns and the modus operandi to tackle it.
2 Co-ordination and Networking
Co-ordination/ Management
Setting up of Climate Change Cell is proposed for Policy Formulation in the changing scenario.
20.00 Convergence with linked sectors such as Agriculture, Forestry, Water Resources, Energy and Rural Development etc.
Streamline mechanism for coordination of all sector activities.
3 Capacity Building
Human Resource Development
Sector capacity need assessment/Training/ Extension.
250.0 Convergence with linked sectors such as Agriculture, Forestry, Water Resources, Energy and Rural Development etc.
Clear understanding of sector capacity need at State, District and Panchayat levels vis-a-vis climate change and its impact.
4 Infrastructure Management
Infrastructure Development
Strengthening of Artificial Insemination (AI) centers
26370.48 Convergence with linked sectors such as Building Construction
Breed improvement of milch animals with a view to enhance milk production to counter production loss due to

175
Department etc. adverse climatic condition. 5 Resource
Management. Conservation of native breeds of cattle and buffalo
In-Situ conservation of Cattle and Buffalo Native to Bihar through Establishment of Nucleus Herds
759.03 Convergence with linked sectors such as Agriculture University etc.
Conservation of disease resistant and stress resistant native breeds of cattle and buffalo to adjust with climatic changes and production.
6. Infrastructure/ Resource Management.
Livestock Health Management
Strengthening of Veterinary Hospitals/ Dispensaries/ Mobile Veterinary Clinics.
14326.00 Convergence with linked sectors such as Building Construction Department etc.
Treatment of livestock through well equipped hospitals and dispensaries as well as through Mobile Veterinary Clinics in remote areas in case of emerging diseases.
7. Infrastructure/ Resource Management.
Coservation of local disease resistant native breeds of cattle and Bio-gas utilization.
Strengthening of Goshalas
860.00 Convergence with linked sectors such as Building Construction Department, Agriculture, BREDA etc.
Coservation of local disease resistant native breeds of animals as well as setting up of Bio-gas plants so as to capture and utilize methane gas.
8. Health Care Management.
Livestock Health Management
Mass deworming programme.
33810.00 Mass deworming of livestock to combat endo and ectoparasitic infestation in adverse climatic condition to sustain. stress.

176
9. Nutritional Management.
Nutritional Management of Livestock.
Distribution of Seeds of Green fodder.
2450.00 Convergence with linked sectors such as Agriculture, Forestry, Water Resources etc.
Seeds of green fodder suitable for changing climate will be distributed to combat fodder crisis.
10. Health Care Management.
Livestock Health Management.
Livestock Disease Early Warning System
58.40 Development of disease forecasting system in changing climatic scenario through NADRS.
Total budget for 5 years 78913.91
This is a tentative budget. The amount may be finalized as per discussion/decision taken by competent authority.

177
Annexure 2: Forests and Biodiversity Interventions Intervention type Activities Duration Total
Cost (in lakh)
Possibility of convergence Expected Outcome
Short-term actions
Policy reviews Policy Review of state forest sector policies; incorporation of climate concerns (based on sector vulnerability assessment)
1.15 years 25 Convergence with linked sectors such as water resources, energy, etc.
Sector policies explicitly reflect climate concerns
Coordination and networking
Coordination/management Setting up of Climate Change Cell
1 year 100 Convergence with districts and linked sectors such as water resources, energy, etc.
Streamlined mechanisms for coordination of all sector activities under the BAPCC
Capacity Building
Human resource development
Sector capacity needs assessment
1 year 50 Convergence with districts and linked sectors such as water resources, energy, etc.
Clear understanding of sector capacity needs at State and sub-state levels vis-à-vis climate change and its impacts
Planning Planning
Review of forest working plans and incorporation of climate concerns
1 year 25 Convergence with districts and linked sectors such as water resources, energy,etc.
Revised working plans explicitly incorporate climate concerns
Institutional arrangements
Activation of State Biodiversity Board; development of multiannual action plans covering 12th FYP
1 year 50 Convergence with districts and linked sectors such as water resources, energy,etc.
Functional State Biodiversity Board in place, with action plans
Sub-total – Policy-Planning, HRD, Climate Change Cell Institutional Arrangement
250
Interventions in forest and non-forest areas
Forest/biodiversity protection, conservation, and green cover augmentation
Interventions in very dense forests initiated
1-1.5 year 100 Convergence with districts and linked sectors such as water resources, energy, etc.
Initial Interventions on-stream
Interventions in moderately dense forests initiated
1-1.5 year 400 Interventions in open forests initiated
1.15 years 1000 Interventions in scrub forests initiated
1.15 years 500
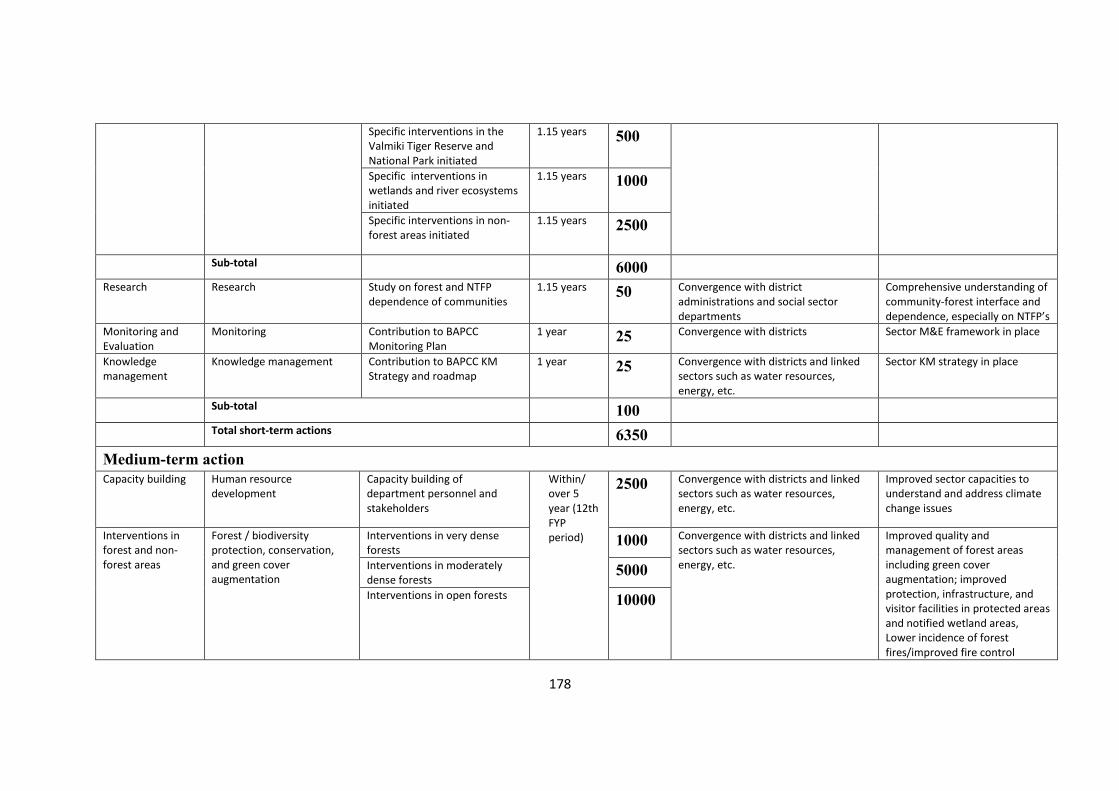
178
Specific interventions in the Valmiki Tiger Reserve and National Park initiated
1.15 years 500
Specific interventions in wetlands and river ecosystems initiated
1.15 years 1000
Specific interventions in non-forest areas initiated
1.15 years 2500
Sub-total 6000
Research Research Study on forest and NTFP dependence of communities
1.15 years 50 Convergence with district administrations and social sector departments
Comprehensive understanding of community-forest interface and dependence, especially on NTFP’s
Monitoring and Evaluation
Monitoring Contribution to BAPCC Monitoring Plan
1 year 25 Convergence with districts Sector M&E framework in place
Knowledge management
Knowledge management Contribution to BAPCC KM Strategy and roadmap
1 year 25 Convergence with districts and linked sectors such as water resources, energy, etc.
Sector KM strategy in place
Sub-total 100
Total short-term actions 6350
Medium-term action Capacity building Human resource
development Capacity building of department personnel and stakeholders
Within/ over 5 year (12th FYP period)
2500 Convergence with districts and linked sectors such as water resources, energy, etc.
Improved sector capacities to understand and address climate change issues
Interventions in forest and non-forest areas
Forest / biodiversity protection, conservation, and green cover augmentation
Interventions in very dense forests
1000 Convergence with districts and linked sectors such as water resources, energy, etc.
Improved quality and management of forest areas including green cover augmentation; improved protection, infrastructure, and visitor facilities in protected areas and notified wetland areas, Lower incidence of forest fires/improved fire control
Interventions in moderately dense forests
5000 Interventions in open forests 10000

179
Interventions Intervention type Activities Duration Total Cost (in lakh)
Possibility of convergence Expected Outcome
9 Interventions in scrub forests 5000
Specific interventions in the Valmiki Tiger Reserve and National Park
1000
Fire management - Measures for fire management in all forest types
5000
Specific interventions in wetlands and river eco-systems
10000 Specific interventions in non-forest areas
15000 Survey, identify, catalogue, document , protect; and improve/ enhance the status of biodiversity rich areas in the State
1000 Biodiversity registers in place/progress; publication/s on state’s biodiversity resources; enhanced biodiversity conservation/management practices in places
Sub-total – Interventions in forests and non-forest areas 53000
Planning Research; Planning Study on and development of plans for interventions in wetlands areas
100 Convergence with districts and linked sectors such as water resources, energy, etc.
Detailed strategy and management plans for interventions in wetland areas in place
Research Research; Planning Study on potential for REDD + Within/over 5 year (12
th
FYP period)
100 Linkages with academia, consulting organisations/individuals
Enhanced strategies and action for forest and biodiversity conservation Studies on indigenous trees
species to assess their vulnerability to climate change
200
Assessing and documenting additional threats to
100

180
biodiversity and wildlife
Population dynamics and movement of key indicator wildlife species,
100
Population dynamics and movement of key indicator wildlife species
100
Monitoring and evaluation
M&E Quarterly sector monitoring reports
Within/over 5 year (12
th FYP
period)
500 Convergence with districts and linked sectors such as water resources, energy, etc.
Results for programme implementation improvements and mid-course corrections; lessons learnt on what worked and what didn’t, input for improved annual plans for 13
th
FYP
Internal Annual Review of sector implementation under BAPCC
100
Knowledge management
Knowledge management Identification of potential research and development domains concerned with climate change issues in the sector, initiating studies
5 year (12
th FYP
period)
50 Convergence with districts and linked sectors such as water resources, energy, etc.
Significantly improved awareness of and understanding of climate change in the sector and its stakeholders
Knowledge repository, strengthening evidence base
50 Technical demonstration research and development, extension and transfer of technology protocols, relating to climate change
1000
Documentation on community perceptions of climate change and impacts
50
Networking and linkages
Networking and coordination
Institutional linkages with research/academic institutions
Within/over 5 year (12
th FYP
period)
50 Linkages with academia civil society and communities
Improved networking and communications with academia participatory sector processes
Consultations with civil society 50
Consultations with communities

181
Sub-total – Planning, Research, M & E , Knowledge management, Networking
2550
Total – Medium-term Actions/Interventions
58050
Total Budget for 5 years (12
th FYP period)
64400

182
Annexure 3: Water Resources To be done by GoB
Interventions Intervention Type Activities Duration Total
Cost (in lakh)
Possibility of convergence Expected Outcome
Short-term actions
Policy Formulation Policy
Formulation of State Water Policy; incorporation of climate concerns (based on sector vulnerability assessment)
1-1.5 years 10
Convergence with linked sectors such as agriculture, forestry, energy, etc.
Sector policies explicitly reflect climate concerns
Coordination and networking Coordination/management Setting up of Climate Change
Cell 1 year 20
Convergence with linked sectors such as agriculture, forestry, energy, etc.
Streamlined mechanisms for coordination of all sector activities under the BAPCC
Capacity Building Human resource development Sector capacity needs assessment 1 year 10
Convergence with linked sectors such as agriculture, forestry, energy, etc.
Clear understanding of sector capacity needs at State and sub-state levels vis-à-vis climate change and its impacts
Planning Planning Formulation of State Water Sector Roadmap
1 – 1.5 years 10
Convergence with linked sectors such as agriculture, forestry, energy, etc.
Comprehensive water sector plan in place
Research Research Study on projection of water resources availability in time and space
1 – 1.5 years 50
Convergence with linked sectors such as
Enhanced understanding of key sector issues;

183
Interventions Intervention Type Activities Duration Total
Cost (in lakh)
Possibility of convergence Expected Outcome
Study on poverty and equity issues in the water sector; incorporation of findings into Water Sector Roadmap
1 – 1.5 years
agriculture, forestry, energy, etc.
improved management practices
Monitoring and Evaluation Monitoring Contribution to BAPCC
Monitoring Plan 1 year 50 Convergence with districts
Sector M&E framework in place
Knowledge management Knowledge management
Contribution to BAPCC KM Strategy and roadmap 1 year 20 Convergence
with districts and linked sectors such as water resources, energy, etc.
Sector KM strategy in place
Comprehensive water data base in public domain and water resources information system initiated
1 year 50
Total Budget for Short Term Actions 220 Medium-term actions
Capacity building Human resource development
Capacity building of department personnel and stakeholders (to be detailed by Department) including Panchayati Raj Institutions, urban local bodies and primary stakeholders such as WUAs in participatory management of water facilities
Within/over 5 years (12th FYP period)
50
Convergence with districts and linked sectors such as water resources, energy, etc.
Improved sector capacities to understand and address climate change issues
Planning Research; Planning Study on and development of plans for interventions in non-notified wetland areas
Within/over 5 years (12th FYP period)
400
Convergence with districts and linked sectors such as water resources, energy, etc.
Detailed strategy and management plans for interventions in non-notified wetland areas in place
Infrastructure/resource management
Water infrastructure/resource augmentation/conservation/management
Inventory of and revival/ repair of Ahar-Pynes and traditional systems of water initiated
Within/over 5 years (12th FYP period)
1000 Convergence with districts and linked sectors such as water
Enhanced water sector infrastructure assets and management

184
Interventions Intervention Type Activities Duration Total
Cost (in lakh)
Possibility of convergence Expected Outcome
Conservation and preservation of wetlands and maintenance of optimal wetland hydrology
Within/over 5 years (12th FYP period)
10000 resources, energy, etc.
practices; improved sector resilience
Groundwater resources regulation and recharge/replenishment
Within/over 5 years (12th FYP period)
5000
Actions for water use efficiency across sub-sectors
Within/over 5 years (12th FYP period)
5000
Actions for improving water quality
Within/over 5 years (12th FYP period)
1000
Actions for adaptive retrofitting of infrastructure assets and O&M improvements
Within/over 5 years (12th FYP period)
10000
Monitoring and evaluation M&E
Quarterly sector monitoring reports
Within/over 5 years (12th FYP period)
1000 Convergence with districts and linked sectors such as water resources, energy, etc.
Results for programme implementation improvements and mid-course corrections; lessons learnt on what worked and what didn’t; input for improved annual plans for 13th FYP.
Internal Annual Review of sector implementation under BAPCC
1000
Knowledge Management Knowledge Management
Identification of potential research and development domains concerned with climate
5 years (12th FYP 200
Convergence with districts and linked sectors
Significantly improved awareness of and understanding of

185
Interventions Intervention Type Activities Duration Total
Cost (in lakh)
Possibility of convergence Expected Outcome
change issues in the sector; initiating studies (may be with Central University of Bihar, Patna)
period) such as water resources, energy, etc.
climate change in the sector and its stakeholders
Knowledge repository, strengthening evidence base 50 Technical demonstration, research and development, extension and transfer of technology protocols, relating to climate change
10
Sector co-benefits identification study 20 Documentation on community perceptions of climate change and impacts
20
Networking and linkages Networking and coordination
Institutional linkages with research/academic institutions Within/over
5 years (12th FYP period)
50 Linkages with academia, civil society and communities
Improved networking and communications with academia, participatory sector processes
Consultations with civil society 50 Consultations with communities 50
Total Budget for 5 years (12th FYP period) 43900*
This is a tentative budget. The amount may be finalised as per the discussion in the meeting of Nodal Officers to be held on 4th
September, 2014

186
Annexure 4: Disaster Management
Interventions Intervention Type Activities Duration Total Cost (in
lakh)
Possibility of convergence Expected Outcome
Short-term actions
Coordination and networking Coordination/management Setting up of Climate
Change Cell 1 year 5 Convergence with linked sectors such as agriculture, forestry, energy, etc.
Streamlined mechanisms for coordination of all sector activities under the BAPCC
Capacity Building Human resource development
Sector capacity needs assessment 1 year 10
Convergence with linked sectors such as agriculture, forestry, energy, etc.
Clear understanding of sector capacity needs at State and sub-state levels vis-à-vis climate change and its impacts
Planning Planning
Incorporation of climate change concerns into State Disaster Management Plan (based on climate vulnerability and risk assessment)
1 – 1.5 years 5 Convergence with linked sectors such as agriculture, forestry, energy, etc.
Comprehensive water sector plan in place
Monitoring and Evaluation Monitoring Contribution to BAPCC
Monitoring Plan 1 year 5 Convergence with districts Sector M&E framework in place
Knowledge management Knowledge management Contribution to BAPCC KM
Strategy and roadmap 1 year 5 Convergence with districts and linked sectors such as water resources, energy, etc.
Sector KM strategy in place
Medium-term actions
Capacity building Human resource development
Capacity building of personnel at Department, SDMA, and other stakeholders
Within/over 5 years (12th FYP period)
50 Convergence with districts and linked sectors such as water resources, energy, etc.
Improved sector capacities to understand and address climate change issues
Monitoring and evaluation M&E Quarterly sector monitoring
reports Within/over 5 years (12th 25 Convergence with districts
and linked sectors such as Results for programme implementation improvements

187
Interventions Intervention Type Activities Duration Total Cost (in
lakh)
Possibility of convergence Expected Outcome
Internal Annual Review of sector implementation under BAPCC
FYP period)
water resources, energy, etc.
and mid-course corrections; lessons learnt on what worked and what didn’t; input for improved annual plans for 13th FYP.
Improving scientific knowledge and evidence base and understanding of climate change and its impacts; capacity building
Research Training & Capacity Building
Study of recent changes in climate parameters Monitoring of various climate parameters
Within/over 5 years (12th FYP period)
10 In collaboration with IISc Bangalore and PRL Ahmedabad Forest & agriculture For community level training: PRIs, District Administration
Data on changes in various climate related parameters Monitoring the changes in various climate parameters. Land use /land change scenario Promotion of Safe construction technology More trained persons
Land use / land cover change studies for various towns of the state using high resolution satellite imageries (IKONOS and WV 2)
10
Community based risk assessment Preparation of disaster management plan Training of community members on search and rescue.
10
Training of: Departmental officials in
vulnerability assessment. Departmental officials in
the use of GIS and RS tools for effective resource management.
Engineers in retrofitting of existing structures and safer construction practices.
25
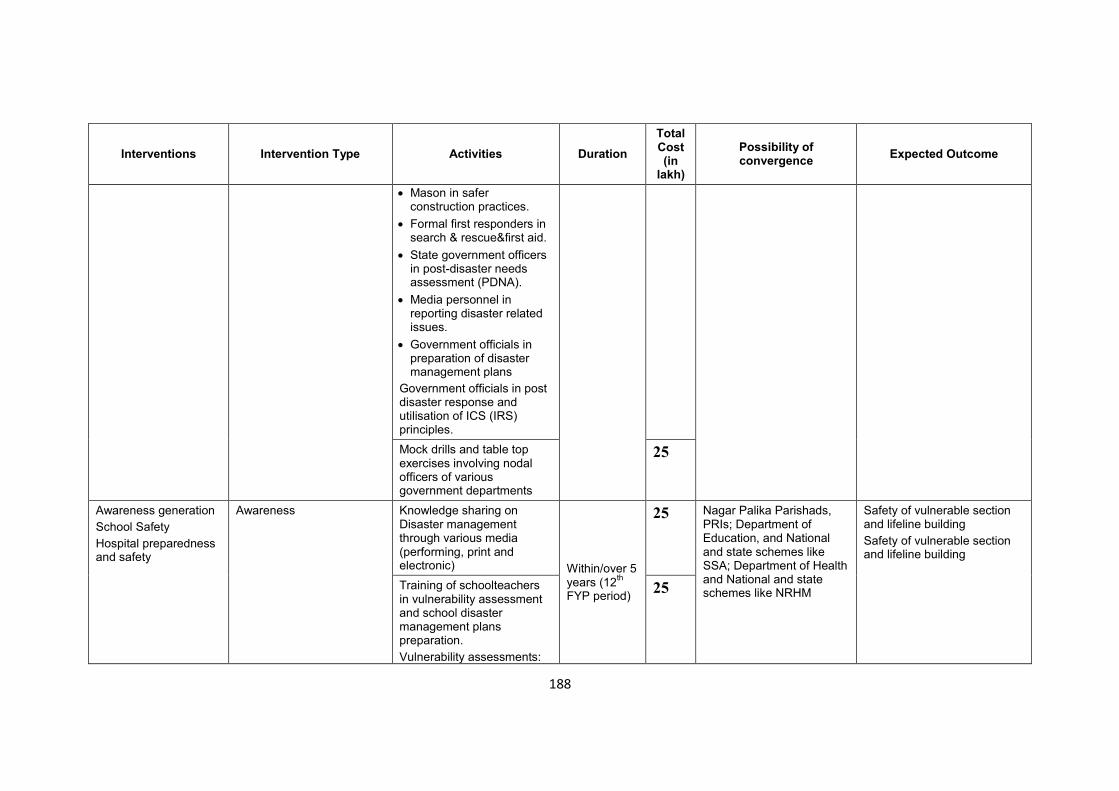
188
Interventions Intervention Type Activities Duration Total Cost (in
lakh)
Possibility of convergence Expected Outcome
Mason in safer construction practices.
Formal first responders in search & rescue&first aid.
State government officers in post-disaster needs assessment (PDNA).
Media personnel in reporting disaster related issues.
Government officials in preparation of disaster management plans
Government officials in post disaster response and utilisation of ICS (IRS) principles. Mock drills and table top exercises involving nodal officers of various government departments
25
Awareness generation School Safety Hospital preparedness and safety
Awareness Knowledge sharing on Disaster management through various media (performing, print and electronic) Within/over 5
years (12th FYP period)
25 Nagar Palika Parishads, PRIs; Department of Education, and National and state schemes like SSA; Department of Health and National and state schemes like NRHM
Safety of vulnerable section and lifeline building Safety of vulnerable section and lifeline building
Training of schoolteachers in vulnerability assessment and school disaster management plans preparation. Vulnerability assessments:
25

189
Interventions Intervention Type Activities Duration Total Cost (in
lakh)
Possibility of convergence Expected Outcome
Structural and Non-structural Training and Mock Drills Competitions School curriculum Online education and competitions Awareness program for officials
Training of doctors in mass casualty management and hospital disaster management plan preparation. Vulnerability assessments: Structural and Non-structural
25
Vulnerability and risk management
Risk management; infrastructure adaptation
Vulnerability assessment of lifeline structure and demonstrative retrofitting
Relocation of critical infrastructure
Relocation of a few threatened habitations
Assessment of urban vulnerability particularly in case of extreme precipitation events
Vulnerability assessment of all industrial units in the state
50

190
Interventions Intervention Type Activities Duration Total Cost (in
lakh)
Possibility of convergence Expected Outcome
Knowledge Management Knowledge Management
Identification of potential research and development domains concerned with climate change issues in the sector; initiating studies
5 years (12th FYP period)
10
Convergence with districts and linked sectors such as water resources, energy, etc.
Significantly improved awareness of and understanding of climate change in the sector and its stakeholders
Knowledge repository, strengthening evidence base
10
Technical demonstration, research and development, extension and transfer of technology protocols, relating to climate change
10
Sector co-benefits identification study 10
Documentation on community perceptions of climate change and impacts
20
Networking and linkages
Networking and coordination
Institutional linkages with research/academic institutions Within/over 5
years (12th FYP period)
10 Linkages with academia, civil society and communities
Improved networking and communications with academia, participatory sector processes
Consultations with civil society 10
Consultations with communities 10
Total Budget for 5 years (12th FYP period) 425

191
Annexure 5: Urban Development Interventions Intervention Type Activities Duration
Total Cost (in
lakh)
Possibility of convergence Expected Outcome
Short-term actions
Policy review Policy
Review of urban development policy; incorporation of climate concerns (based on sector vulnerability assessment)
1-1.5 years 100 Convergence with linked sectors such as agriculture, forestry, water, etc.
Sector policies explicitly reflect climate concerns
Coordination and networking Coordination/management Setting up of Climate Change Cell 1 year 200
Convergence with linked sectors such as agriculture, forestry, water, etc.
Streamlined mechanisms for coordination of all sector activities under the BAPCC
Capacity Building Human resource development Sector capacity needs assessment 1 year 50
Convergence with linked sectors such as agriculture, forestry, water, etc.
Clear understanding of sector capacity needs at State and sub-state levels vis-à-vis climate change and its impacts
Planning Planning Formulation of Urban Sector Roadmap incorporating climate concerns 1 – 1.5 years 100
Convergence with linked sectors such as agriculture, forestry, water, etc.
Comprehensive water sector plan in place
Monitoring and Evaluation Monitoring Contribution to BAPCC Monitoring Plan 1 year 100
Convergence with linked sectors such as agriculture, forestry, water, etc.
Sector M&E framework in place
Knowledge management Knowledge management Contribution to BAPCC KM Strategy
and roadmap 1 year 100 Convergence with linked sectors such as agriculture, forestry, water, etc.
Sector KM strategy in place
Medium-term actions
Capacity building Human resource development
Capacity building of department personnel and stakeholders (to be detailed by Department) including ULBs
Within/over 5 years (12th FYP period)
100 Convergence with linked sectors such as agriculture,
Improved sector capacities to understand and address climate change issues

192
Interventions Intervention Type Activities Duration Total Cost (in
lakh)
Possibility of convergence Expected Outcome
forestry, water, etc.
Energy demand reduction and efficiency
Energy efficiency
Energy efficiency and conservation measures
Within/over 5 years (12th FYP period)
100
Enhanced energy efficiency and reduced demand
Promotion of and codes for green/energy efficient buildings, including in urban housing projects under various programmes
100
Adoption of renewables Alternative energy sources Promotion of renewable energy sources
and technologies
Within/over 5 years (12th FYP period)
100 Convergence with linked sectors such as agriculture, forestry, water, etc.
Enhanced energy source mix
Management of water, municipal solid waste and waste water
Urban utility management
Comprehensive approach in the management of water, municipal solid waste and waste water with a view to realize their full potential for energy generation, recycling and reuse, and composting, rainwater harvesting, etc.
Within/over 5 years (12th FYP period)
100 Convergence with linked sectors such Water Resources Department, etc.
Improved utility performance, services delivery, and infrastructure resilience
Retrofitting of urban infrastructure for climate resilience based on vulnerability and risk assessment
100
Urban transportation Transportation
Evolving integrated land use and transportation plans, achieving a modal shift from private to public mode of transportation, encouraging the use of non-motorised transport, improving fuel efficiency, and encouraging use of alternate fuels
Within/over 5 years (12th FYP period)
100 Convergence with Transportation Department
Improved urban transportation systems
Adaptation in terms of realignment and relocation, design standards and planning for roads, rail and other infrastructure to cope with risks from climate change
100

193
Interventions Intervention Type Activities Duration Total Cost (in
lakh)
Possibility of convergence Expected Outcome
Promote and foster alternative fuels such as CNG, bio-fuels 100
Monitoring and evaluation M&E
Quarterly sector monitoring reports
Within/over 5 years (12th FYP period)
50 Convergence with linked sectors such as agriculture, forestry, water, etc.
Results for programme implementation improvements and mid-course corrections; lessons learnt on what worked and what didn’t; input for improved annual plans for 13th FYP.
Internal Annual Review of sector implementation under BAPCC 50
Knowledge Management Knowledge Management
Identification of potential research and development domains concerned with climate change issues in the sector; initiating studies
5 years (12th FYP period)
50
Convergence with linked sectors such as agriculture, forestry, water, etc.
Significantly improved awareness of and understanding of climate change in the sector and its stakeholders
Knowledge repository, strengthening evidence base 50 Technical demonstration, research and development, extension and transfer of technology protocols, relating to climate change
100
Sector co-benefits identification study 50 Documentation on community perceptions of climate change and impacts
Networking and linkages
Networking and coordination
Institutional linkages with research/academic institutions Within/over 5
years (12th FYP period)
100 Linkages with academia, civil society and communities
Improved networking and communications with academia, participatory sector processes
Consultations with civil society 50 Consultations with communities 50
Total Budget for 5 years (12th FYP period) 2190

194
Annexure 6: Transport
Interventions Intervention Type Activities Duration Total Cost (in
lakh)
Possibility of convergence Expected Outcome
Short-term actions
Policy review Policy
Review of transport policy; incorporation of climate concerns (based on sector vulnerability assessment)
1-1.5 years 50 Convergence with linked sectors such as agriculture, forestry, water, etc.
Sector policies explicitly reflect climate concerns
Coordination and networking Coordination/management Setting up of Climate Change Cell 1 year 50
Convergence with linked sectors such as agriculture, forestry, water, etc.
Streamlined mechanisms for coordination of all sector activities under the BAPCC
Capacity Building Human resource development Sector capacity needs assessment 1 year 50
Convergence with linked sectors such as agriculture, forestry, water, etc.
Clear understanding of sector capacity needs at State and sub-state levels vis-à-vis climate change and its impacts
Planning Planning Formulation of Transport Sector Roadmap incorporating climate concerns
1 – 1.5 years 50 Convergence with linked sectors such as agriculture, forestry, water, etc.
Comprehensive water sector plan in place
Monitoring and Evaluation Monitoring Contribution to BAPCC Monitoring
Plan 1 year 50 Convergence with linked sectors such as agriculture, forestry, water, etc.
Sector M&E framework in place
Knowledge management Knowledge management Contribution to BAPCC KM
Strategy and roadmap 1 year 50 Convergence with linked sectors such as agriculture, forestry, water, etc.
Sector KM strategy in place
Medium-term actions
Capacity building Human resource development
Capacity building of department personnel and stakeholders (to be
Within/over 5 years (12th 100 Convergence with
linked sectors such as Improved sector capacities to understand and address climate

195
Interventions Intervention Type Activities Duration Total Cost (in
lakh)
Possibility of convergence Expected Outcome
detailed by Department) FYP period) agriculture, forestry, water, etc.
change issues
Transport Infrastructure, planning, and management
Infrastructure, planning, management
Improve access to bus services and service quality
Within/over 5 years (12th FYP period)
500
Linkages with Urban Development Department, Roads Department, Energy Department, etc.
Enhanced and resilient transportation infrastructure and systems in place
Improve the poor image of bus and public transport
Within/over 5 years (12th FYP period)
500
Mechanisms for proper planning and provisioning of infrastructure facilities
Within/over 5 years (12th FYP period)
100
Improve route and traffic planning, and regulate issue of permits through surveys and scientific data
Within/over 5 years (12th FYP period)
50
Provide/improve passenger information systems, and remove institutional and regulatory hurdles
Within/over 5 years (12th FYP period)
100
Promote initiatives such as vehicle pooling, etc., especially in cities and towns
Within/over 5 years (12th FYP period)
50
Rigorously implement measures for vehicular pollution control
Within/over 5 years (12th FYP period)
50
Promote the use of ensure availability of cleaner fuels such as CNG and bio-fuels
Within/over 5 years (12th FYP period)
100
Systematise and ensure uniformity in institutional arrangements for providing public transport services
Within/over 5 years (12th FYP period)
50
Promote access instead of mobility; shift to less harmful
Within/over 5 years (12th 50

196
Interventions Intervention Type Activities Duration Total Cost (in
lakh)
Possibility of convergence Expected Outcome
modes of transportation; and improve vehicles towards lower carbon intensity and pollution
FYP period)
Enable and promote environmentally efficient modes such as public and non-motorised transport (for passenger transport) and to rail and water transport (for freight)
Within/over 5 years (12th FYP period)
200
Invest in public transport and infrastructure that promotes walking and cycling
Within/over 5 years (12th FYP period)
200
Improve vehicles, vehicle maintenance, and fuels as a priority to reduce urban air pollution and greenhouse gas emissions
Within/over 5 years (12th FYP period)
300
Adopt green transport policies will also reduce road accidents and alleviate poverty by improving access to markets and other essential facilities
Within/over 5 years (12th FYP period)
300
Monitoring and evaluation M&E
Quarterly sector monitoring reports
Within/over 5 years (12th FYP period)
100 Convergence with linked sectors such as agriculture, forestry, water, etc.
Results for programme implementation improvements and mid-course corrections; lessons learnt on what worked and what didn’t; input for improved annual plans for 13th FYP.
Internal Annual Review of sector implementation under BAPCC 50
Knowledge Management Knowledge Management
Identification of potential research and development domains concerned with climate change
5 years (12th FYP period) 100
Convergence with linked sectors such as agriculture, forestry,
Significantly improved awareness of and understanding of climate change in the sector and its
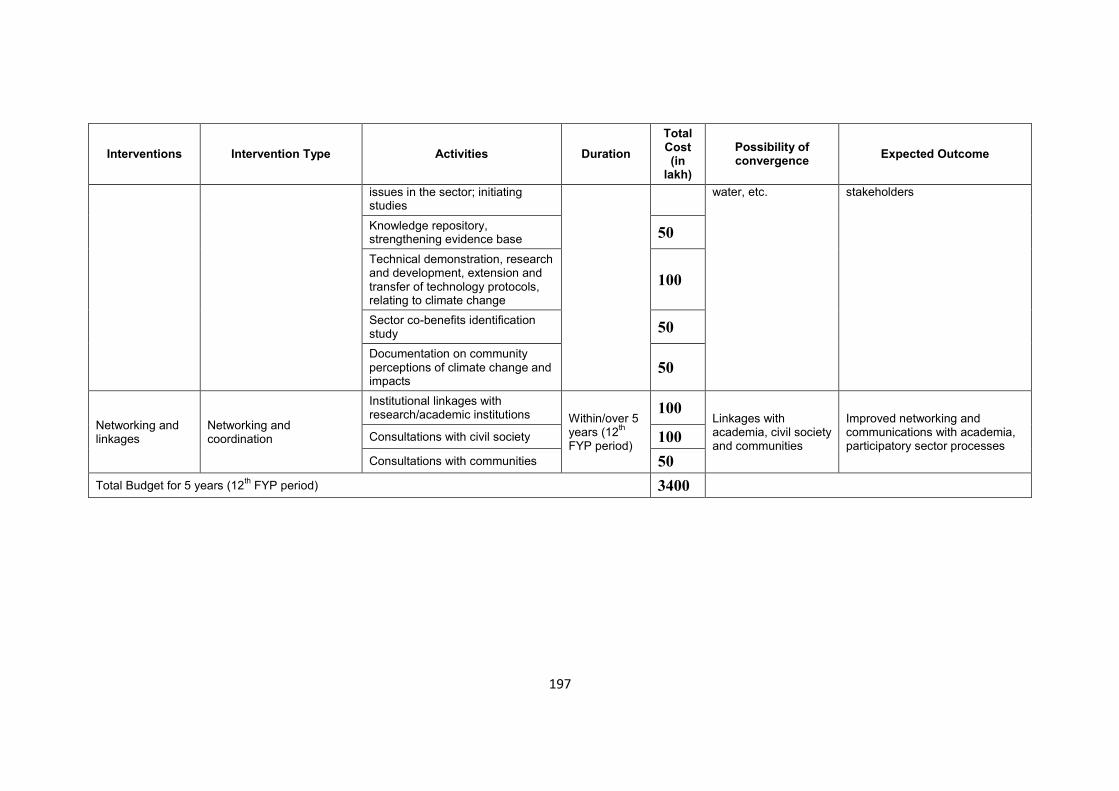
197
Interventions Intervention Type Activities Duration Total Cost (in
lakh)
Possibility of convergence Expected Outcome
issues in the sector; initiating studies
water, etc. stakeholders
Knowledge repository, strengthening evidence base 50 Technical demonstration, research and development, extension and transfer of technology protocols, relating to climate change
100
Sector co-benefits identification study 50 Documentation on community perceptions of climate change and impacts
50
Networking and linkages
Networking and coordination
Institutional linkages with research/academic institutions Within/over 5
years (12th FYP period)
100 Linkages with academia, civil society and communities
Improved networking and communications with academia, participatory sector processes
Consultations with civil society 100 Consultations with communities 50
Total Budget for 5 years (12th FYP period) 3400

198
Annexure 7: Energy
Interventions Intervention Type Activities Duration Total Cost (in
lakh)
Possibility of convergence Expected Outcome
Short-term actions
Policy review Policy Review of energy sector policies; incorporation of climate concerns (based on sector vulnerability assessment)
1-1.5 years 50
Convergence with linked sectors such as agriculture, forestry, water, etc.
Sector policies explicitly reflect climate concerns
Coordination and networking Coordination/management Setting up of Climate Change Cell 1 year 100
Convergence with linked sectors such as agriculture, forestry, water, etc.
Streamlined mechanisms for coordination of all sector activities under the BAPCC
Research, Climate Impacts Needs Assessment
Research
Develop comprehensive Bihar specific energy sector vulnerability analyses, and options for developing in-house skills for data analyses, modelling, and forecasting will be considered
1-1.5 years 50
Risk Management Risk Management
Templates to screen individual energy projects for climate vulnerability and risks, either retrospectively or during project planning and implementation will be developed
1-1.5 years 50
Standards Development Management
Develop adaptation standards for the energy sector -- defined, codified and adopted into standard operating procedures in all aspects of energy sector planning and implementation
1-1.5 years 50

199
Interventions Intervention Type Activities Duration Total Cost (in
lakh)
Possibility of convergence Expected Outcome
Capacity Building Human resource development Sector capacity needs assessment 1 year 50
Convergence with linked sectors such as agriculture, forestry, water, etc.
Clear understanding of sector capacity needs at State and sub-state levels vis-à-vis climate change and its impacts
Research Research Study on poverty and equity issues in energy sector; incorporation of findings into energy sector planning
1-1.5 years 50
Planning Planning
Formulation of Energy Sector Roadmap incorporating climate concerns/Revision of existing Roadmap to incorporate climate concerns
1 – 1.5 years 50
Convergence with linked sectors such as agriculture, forestry, water, etc.
Comprehensive water sector plan in place
Monitoring and Evaluation Monitoring Contribution to BAPCC Monitoring Plan 1 year 50
Convergence with linked sectors such as agriculture, forestry, water, etc.
Sector M&E framework in place
Knowledge management Knowledge management Contribution to BAPCC KM Strategy and
roadmap 1 year 50
Convergence with linked sectors such as agriculture, forestry, water, etc.
Sector KM strategy in place
Medium-term actions
Capacity building Human resource development
Capacity building of department personnel and stakeholders (to be detailed by Department)
Within/over 5 years (12th FYP period)
100 Convergence with linked sectors such as agriculture,
Improved sector capacities to understand and address climate change issues

200
Interventions Intervention Type Activities Duration Total Cost (in
lakh)
Possibility of convergence Expected Outcome
forestry, water, etc.
Generation Improvements
Power generation infrastructure enhancement/adaptation and management
Renovation and modernisation of existing units to restore original efficiency along with reduced auxiliary power consumption and reduced chimney emissions. Modernisation work on the BTPS units 6 and 7 are expected to be completed by February 2013, and for the MTPS units 1 and 2 Within/over 5
years (12th FYP period)
100
Enhanced generation systems Adoption of super critical technology for
all upcoming coal based power stations to have better efficiency and reduced emissions
100
Fly ash utilisation management 50 SHP capacity addition for 3.70 MW 50
Transmission Improvements
Power transmission infrastructure enhancement/adaptation and management
Expansion of high voltage transmission network with latest and state of the art technologies and adequate coverage network to prevent loading beyond limits
Within/over 5 years (12th FYP period)
200
Enhanced transmission systems
Use of sufficient reactors and capacitors in the network 50 Replacement of old and jointed conductors 50 Better load management, efficient scheduling and use of information systems to achieve optimum network utilisation
100
Proper upkeep of GSS transformers 100
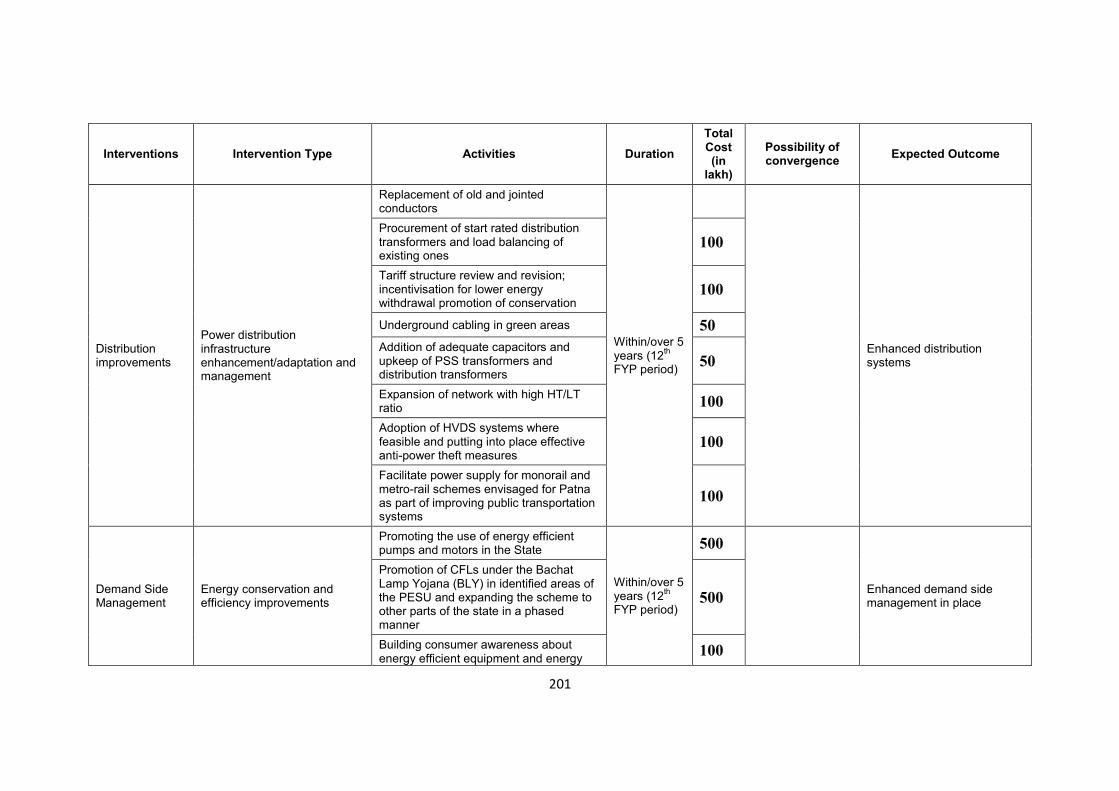
201
Interventions Intervention Type Activities Duration Total Cost (in
lakh)
Possibility of convergence Expected Outcome
Distribution improvements
Power distribution infrastructure enhancement/adaptation and management
Replacement of old and jointed conductors
Within/over 5 years (12th FYP period)
Enhanced distribution systems
Procurement of start rated distribution transformers and load balancing of existing ones
100
Tariff structure review and revision; incentivisation for lower energy withdrawal promotion of conservation
100
Underground cabling in green areas 50 Addition of adequate capacitors and upkeep of PSS transformers and distribution transformers
50
Expansion of network with high HT/LT ratio 100 Adoption of HVDS systems where feasible and putting into place effective anti-power theft measures
100
Facilitate power supply for monorail and metro-rail schemes envisaged for Patna as part of improving public transportation systems
100
Demand Side Management
Energy conservation and efficiency improvements
Promoting the use of energy efficient pumps and motors in the State
Within/over 5 years (12th FYP period)
500
Enhanced demand side management in place
Promotion of CFLs under the Bachat Lamp Yojana (BLY) in identified areas of the PESU and expanding the scheme to other parts of the state in a phased manner
500
Building consumer awareness about energy efficient equipment and energy 100

202
Interventions Intervention Type Activities Duration Total Cost (in
lakh)
Possibility of convergence Expected Outcome
conservation measures
Renewable energy
Renewable energy promotion and adoption
Electrification of rural villages through renewables based DDGs
Within/over 5 years (12th FYP period)
Increase in the share of renewables in stake energy mix; cleaner sector
Encourage local private sector participation in renewable energy power generation projects including solid waste and sewerage gas based projects or decentralised distributed generation (DDG)
100
Fix the renewable energy procurement quotas and tariffs for renewable energy based power
100
Provide banking and wheeling facilities for all grid connected renewable energy electricity generation projects up to 25 MW
100
Waive entry tax capital costs for equipment for DDG based renewable energy plants of less than five MW
100
Encourage project developers to install or adopt mechanisms such as Clean Development Mechanisms (CDM) for leveraging funds for renewable energy based projects
200
Infrastructure adaptation Infrastructure adaptation
Based on climate vulnerability analyses, retrofitting of existing energy infrastructure
Within/over 5 years (12th FYP period)
100 Improved infrastructure resilience
Monitoring and evaluation M&E
Quarterly sector monitoring reports Within/over 5 years (12th FYP period)
50 Convergence with linked sectors such as agriculture, forestry, water,
Results for programme implementation improvements and mid-course corrections; lessons learnt on what worked and
Internal Annual Review of sector implementation under BAPCC 50

203
Interventions Intervention Type Activities Duration Total Cost (in
lakh)
Possibility of convergence Expected Outcome
etc. what didn’t; input for improved annual plans for 13th FYP.
Knowledge Management Knowledge Management
Identification of potential research and development domains concerned with climate change issues in the sector; initiating studies
5 years (12th FYP period)
100
Convergence with linked sectors such as agriculture, forestry, water, etc.
Significantly improved awareness of and understanding of climate change in the sector and its stakeholders
Knowledge repository, strengthening evidence base 50 Technical demonstration, research and development, extension and transfer of technology protocols, relating to climate change
50
Sector co-benefits identification study 50 Documentation on community perceptions of climate change and impacts
50
Networking and linkages Networking and coordination
Institutional linkages with research/academic institutions Within/over 5
years (12th FYP period)
100 Linkages with academia, civil society and communities
Improved networking and communications with academia, participatory sector processes
Consultations with civil society 50 Consultations with communities 50
Total Budget for 5 years (12th FYP period) 4450
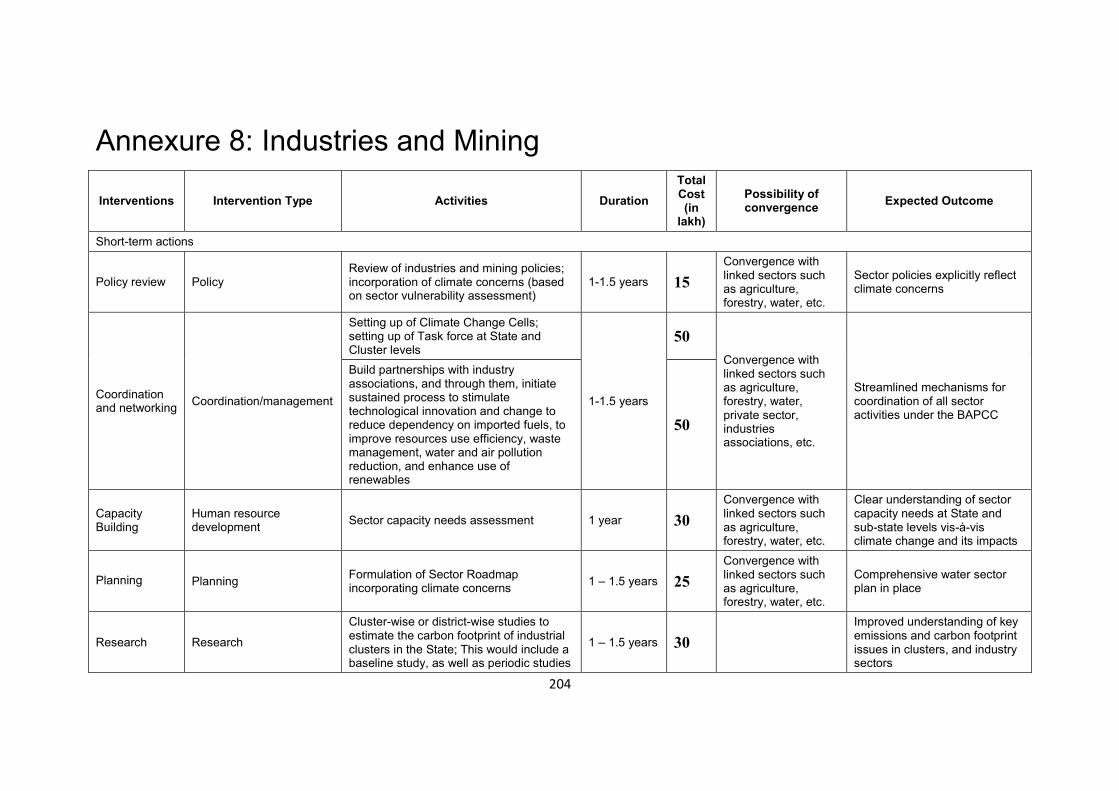
204
Annexure 8: Industries and Mining
Interventions Intervention Type Activities Duration Total Cost (in
lakh)
Possibility of convergence Expected Outcome
Short-term actions
Policy review Policy Review of industries and mining policies; incorporation of climate concerns (based on sector vulnerability assessment)
1-1.5 years 15 Convergence with linked sectors such as agriculture, forestry, water, etc.
Sector policies explicitly reflect climate concerns
Coordination and networking Coordination/management
Setting up of Climate Change Cells; setting up of Task force at State and Cluster levels
1-1.5 years
50 Convergence with linked sectors such as agriculture, forestry, water, private sector, industries associations, etc.
Streamlined mechanisms for coordination of all sector activities under the BAPCC
Build partnerships with industry associations, and through them, initiate sustained process to stimulate technological innovation and change to reduce dependency on imported fuels, to improve resources use efficiency, waste management, water and air pollution reduction, and enhance use of renewables
50
Capacity Building
Human resource development Sector capacity needs assessment 1 year 30
Convergence with linked sectors such as agriculture, forestry, water, etc.
Clear understanding of sector capacity needs at State and sub-state levels vis-à-vis climate change and its impacts
Planning Planning Formulation of Sector Roadmap incorporating climate concerns 1 – 1.5 years 25
Convergence with linked sectors such as agriculture, forestry, water, etc.
Comprehensive water sector plan in place
Research Research
Cluster-wise or district-wise studies to estimate the carbon footprint of industrial clusters in the State; This would include a baseline study, as well as periodic studies
1 – 1.5 years 30
Improved understanding of key emissions and carbon footprint issues in clusters, and industry sectors

205
Interventions Intervention Type Activities Duration Total Cost (in
lakh)
Possibility of convergence Expected Outcome
Studies on brick making industry (and associated mining issues) and on mining industry
25
Monitoring and Evaluation Monitoring Contribution to BAPCC Monitoring Plan 1 year 50
Convergence with linked sectors such as agriculture, forestry, water, etc.
Sector M&E framework in place
Knowledge management Knowledge management Contribution to BAPCC KM Strategy and
roadmap 1 year 25 Convergence with linked sectors such as agriculture, forestry, water, etc.
Sector KM strategy in place
Medium-term actions
Capacity building
Human resource development
Capacity building of department personnel and stakeholders (to be detailed by Department)
Within/over 5 years (12th FYP period)
20 Convergence with linked sectors such as agriculture, forestry, water, etc.
Improved sector capacities to understand and address climate change issues
Promoting GHG Mitigation
Mitigation
Build awareness of and promote sector-wide, process-specific, and operating procedure based mitigation options for industries
Within/over 5 years (12th FYP period)
10 Linkages with academia, financial institutions, industry associations, media, private sector, etc.
Increased adoption of GHG mitigation options
Actions for incentivising adoption of GHG mitigation options 15 Build capacities of financial institutions to finance GHG mitigation options 10 Develop regulatory instruments and promote CDM 20
Promoting Energy efficiency
Energy efficiency
Promote and build awareness, and develop and deploy measures to incentivise industries to adopt a range of management practices including energy audits, adoption of energy efficiency
Within/over 5 years (12th FYP period)
20 Linkages with academia, financial institutions, industry associations, media,
Enhanced energy efficiency in industries/industrial clusters

206
Interventions Intervention Type Activities Duration Total Cost (in
lakh)
Possibility of convergence Expected Outcome
measures and technologies, benchmarking, etc.
private sector, etc.
Build awareness on options, opportunities and benefits of fuel switching, including the use of waste materials, energy (especially heat and power recovery), cogeneration, use of renewable energy including biomass and by-product wastes based generation, and materials efficiency and recycling
50
Developing and deploying a range of financial instruments such as taxes, subsidies and measures to improve access to capital to adopt energy efficiency technologies and processes
25
Monitoring and evaluation M&E
Quarterly sector monitoring reports
Within/over 5 years (12th FYP period)
10 Convergence with linked sectors such as agriculture, forestry, water, etc.
Results for programme implementation improvements and mid-course corrections; lessons learnt on what worked and what didn’t; input for improved annual plans for 13th FYP.
Internal Annual Review of sector implementation under BAPCC 25
Knowledge Management Knowledge Management
Identification of potential research and development domains concerned with climate change issues in the sector; initiating studies
5 years (12th FYP period)
15 Convergence with linked sectors such as agriculture, forestry, water, etc.
Significantly improved awareness of and understanding of climate change in the sector and its stakeholders
Knowledge repository, strengthening evidence base 10 Technical demonstration, research and development, extension and transfer of technology protocols, relating to climate change
25

207
Interventions Intervention Type Activities Duration Total Cost (in
lakh)
Possibility of convergence Expected Outcome
Sector co-benefits identification study 20 Documentation on community perceptions of climate change and impacts 20
Networking and linkages
Networking and coordination
Institutional linkages with research/academic institutions Within/over 5
years (12th FYP period)
20 Linkages with academia, civil society and communities
Improved networking and communications with academia, participatory sector processes
Consultations with civil society 10 Consultations with communities 15
Total Budget for 5 years (12th FYP period) 340

208
Annexure 9: Human Health
Interventions Intervention Type Activities Duration Total Cost (in
lakh)
Possibility of convergence Expected Outcome
Short-term actions
Policy review Policy
Review of health policies; incorporation of climate concerns (based on sector vulnerability assessment)
1-1.5 years Convergence with linked sectors such as agriculture, forestry, water, etc.
Sector policies explicitly reflect climate concerns
Coordination and networking Coordination/management
Setting up of Climate Change Cell at State level, and sub-cells at district levels
1-1.5 years
Convergence with linked sectors such as agriculture, forestry, water, private sector, industries associations, etc.
Streamlined mechanisms for coordination of all sector activities under the BAPCC
Capacity Building
Human resource development Sector capacity needs assessment 1 year
Convergence with linked sectors such as agriculture, forestry, water, etc.
Clear understanding of sector capacity needs at State and sub-state levels vis-à-vis climate change and its impacts
Planning Planning Formulation of Sector Roadmap incorporating climate concerns 1 – 1.5 years
Convergence with linked sectors such as agriculture, forestry, water, etc.
Comprehensive water sector plan in place
Building programme based resilience
Programme enhancements
Design and deploy to manage increased vector borne and water borne disease burden
Within 2 years
Convergence with State Health Society, programme such as VBDCP, IDSP, NRHM, etc.; also with linked sectors such as agriculture, forestry, water, etc.
Improved health sector programmes, geared to address increased climate change induced morbidity/health burden
Design and deploy improved approaches to deal with heat and wave conditions
Design and deploy measures for dealing with the physical and

209
Interventions Intervention Type Activities Duration Total Cost (in
lakh)
Possibility of convergence Expected Outcome
psychological impacts post-extreme weather events
Design and deploy measures to address drought induced malnutrition, and food security issues
Design and deploy measures for addressing food safety arising due to increased ambient temperature and extreme events.
Monitoring and Evaluation Monitoring Contribution to BAPCC Monitoring
Plan 1 year Convergence with linked sectors such as agriculture, forestry, water, etc.
Sector M&E framework in place
Knowledge management Knowledge management Contribution to BAPCC KM
Strategy and roadmap 1 year Convergence with linked sectors such as agriculture, forestry, water, etc.
Sector KM strategy in place
Medium-term actions
Capacity building
Human resource development/awareness
Capacity building of department personnel and stakeholders (to be detailed by Department)
Within/over 5 years (12th FYP period)
Convergence with linked sectors such as agriculture, forestry, water, etc.
Improved sector capacities to understand and address climate change issues
Build people’s awareness of health hazards from climatic change through IEC
Behavioural change communications interventions in relation to the impacts of climate change
Developing and strengthening of disaster management teams in

210
Interventions Intervention Type Activities Duration Total Cost (in
lakh)
Possibility of convergence Expected Outcome
every district hospital specifically to respond to the effect of extreme climate change
Research Research
Study on poverty and equity dimensions of health, disease burden and morbidity as a result of climate change; design of appropriate measures to incorporate findings into health policy and programming
Within/over 5 years (12th FYP period)
Convergence with linked sectors such as agriculture, forestry, water, etc.
Enhanced understanding of poverty and equity issues in health sector in relation to climate change and its impacts
Health Infrastructure resilience
Infrastructure improvements; asset management
Reviews of the State’s health infrastructure and potential climate change related vulnerabilities and risks (and where such infrastructure is found to be at high risk, retrofit to make these more climate resilient)
Within/over 5 years (12th FYP period)
Increased resilience of health infrastructure assets
Monitoring and evaluation M&E
Quarterly sector monitoring reports
Within/over 5 years (12th FYP period)
Convergence with linked sectors such as agriculture, forestry, water, etc.
Results for programme implementation improvements and mid-course corrections; lessons learnt on what worked and what didn’t; input for improved annual plans for 13th FYP.
Internal Annual Review of sector implementation under BAPCC
Knowledge Management Knowledge Management
Identification of potential research and development domains concerned with climate change issues in the sector; initiating studies 5 years (12th
FYP period)
Convergence with linked sectors such as agriculture, forestry, water, etc.
Significantly improved awareness of and understanding of climate change in the sector and its stakeholders
Knowledge repository, strengthening evidence base Technical demonstration, research and development, extension and

211
Interventions Intervention Type Activities Duration Total Cost (in
lakh)
Possibility of convergence Expected Outcome
transfer of technology protocols, relating to climate change
Sector co-benefits identification study Documentation on community perceptions of climate change and impacts
Networking and linkages Networking and coordination
Institutional linkages with research/academic institutions Within/over 5
years (12th FYP period)
Linkages with academia, civil society and communities
Improved networking and communications with academia, participatory sector processes
Consultations with civil society Consultations with communities
Total Budget for 5 years (12th FYP period)
Sl. no no Area of Issues on Climate Change by Health sector
Actions proposed to be expected Time line years
Remarks (INR Crore)
1 Addressing enhanced diseases burden
With reference to Climate Change An assessment needs to be carried out to understand
the extent of disease burden that may occur due to climate change and population projections,
Identification of vulnerable areas for each disease, and
Identification of vulnerable communities along with identification of windows of opportunity of new diseases that might occur due to change in climate determinants,
An assessment of number of additional health centres and health personnel required.
IDSP to continue to monitor disease prevalence and
5
4.0

212
outbreak IDSP to include private, public as well as all village
level health care centres for surveillance Putting in place additional health care centres and
medical personnel
10 10
10
Funding to continue from present source Do To be funded from existing programmes if they continue
2 Reduction targets for Vector Borne diseases
Reduction in Malaria incidence by at least 50%. To bring API below 1 in all the Districts of the State. Enhanced use of ITBNs (especially in High Risk Areas) by 50% among Below Poverty Line (BPL) Population. Enhanced use of larvivorous fish in 75% villages of high‐risk areas 50% villages of all areas. 50% reduction in use of Indoor Residual Spraying by spraying only high‐risk areas. Entomological study on prevalence and vector densities for Malaria, JE, Dengue, CCHF (Chimean‐Congo Haemorrhagic Fever) in the state.
@ Rs.0.05 Cr per districts and Rs.0.2 Cr for State Hq. Includes also training cost, monitoring, field work and lab. Test etc.
To be funded from current NVBDCP
‐do
‐do
1.25
3 Control of TB Under RNTCP the aim is in terms of Universal Access is 100% case detection. Requires Expansion of DOTS Plus services.
5
To be funded from the RNTCP

213
Extend services in private hospitals with OPD patient intake of 100‐150 per hospital
5
‐do‐
4. To control NCD To control NCDs main emphasis will be given on IEC activities to reach out target communities, continuous monitoring and independent evaluation of the program and research, Promotion of public private partnerships, Mainstreaming AYUSH – revitalizing local health traditions
10
To be funded from NPCDCS and NRHM
5. Ecological study on air pollutants‐ from industry, transport and domestic cooking, pollen and molds (as triggers of Asthma and Resp. diseases) and how they are affected by CC
Pilot study is proposed for all districts Hospitals, *To screen and study patients suffering from Bronchial Asthma and other Resp. Diseases
5
@ 0.1 Cr rupees per district *Required Med. Specialist and Chest Specialist are available.
2.1
6. Enhanced provision of Primary, Secondary and Tertiary health care facilities and implementation of public health measures, including vector control, sanitation and clean drinking water supply
i) Primary level:‐ Awareness and sensitization to all sectors on Climate change. ii) Secondary level:‐ Early diagnosis and treatment i.e. Testing kits and drugs. iii) Tertiary level:‐ Testing kits and treatment with drugs
Primary level: Rs.0.05 Cr per districts and Rs.1.8 Cr for State Hq Secondary and tertiary level each: Rs.1 Cr @ of Rs.0.05 Cr per districts and Rs.2 Cr for State Hq.
2.5
7. Providing high resolution weather and climate data to study the regional pattern of diseases. Development of a high resolution health impact model at the state level
i Through IDSP (Integrated Disease Surveillance Project) which is a project by GOI on Disease Surveillance and is engaged in Outbreak/ Epidemic forecasting and investigation/management. Assistance of department. Of Science and Technology, Remote Sensing section will be taken for real time high resolution weather and climate data.
Fund will be needed for engaging Remote Sensing department for high resolution data transfer.
1.0
8. GIS mapping of access routes to health facilities
Both State Remote Sensing Health departments under NVBDCP will be utilized for GIS mapping. / Centre for Environmental Sciences Central University of Bihar, Patna
1.0
9. Development of a disaster Risk reduction
In association with the National Disaster Management Authority / Bihar State Disaster Management
1.0

214
Plan Authority/Centre for Environmental Sciences, Central University of Bihar, Patna. Develop plans for risk reduction of diseases escalation and outbreaks due to climate change
10. Climate change coordination committee
A committee needs to be formulated with members from all disease control programmes who will ensure integration of climate change concerns in planning and implementing diseases control measures for existing and new and emerging diseases
0.5
Total budget proposed