bigdebug: debugging primitives for interactive big data
TRANSCRIPT

BigDebug: Debugging Primitives for Interactive Big DataProcessing in Spark
Muhammad Ali Gulzar, Matteo Interlandi, Seunghyun Yoo, Sai Deep TetaliTyson Condie, Todd Millstein, Miryung Kim
University of California, Los Angeles
ABSTRACTDevelopers use cloud computing platforms to process a large quan-tity of data in parallel when developing big data analytics. De-bugging the massive parallel computations that run in today’s data-centers is time consuming and error-prone. To address this chal-lenge, we design a set of interactive, real-time debugging primi-tives for big data processing in Apache Spark, the next generationdata-intensive scalable cloud computing platform. This requires re-thinking the notion of step-through debugging in a traditional de-bugger such as gdb, because pausing the entire computation acrossdistributed worker nodes causes significant delay and naively in-specting millions of records using a watchpoint is too time con-suming for an end user.
First, BIGDEBUG’s simulated breakpoints and on-demandwatchpoints allow users to selectively examine distributed, inter-mediate data on the cloud with little overhead. Second, a usercan also pinpoint a crash-inducing record and selectively resumerelevant sub-computations after a quick fix. Third, a user can de-termine the root causes of errors (or delays) at the level of indi-vidual records through a fine-grained data provenance capability.Our evaluation shows that BIGDEBUG scales to terabytes and itsrecord-level tracing incurs less than 25% overhead on average. Itdetermines crash culprits orders of magnitude more accurately andprovides up to 100% time saving compared to the baseline replaydebugger. The results show that BIGDEBUG supports debugging atinteractive speeds with minimal performance impact.
Categories and Subject DescriptorsD.2.5 [Software Engineering]: Testing and Debugging—debug-ging aids, distributed debugging, error handling and recovery
KeywordsDebugging, big data analytics, interactive tools, data-intensive scal-able computing (DISC), fault localization and recovery
1. INTRODUCTIONAn abundance of data in many disciplines of science, engineer-
ing, national security, health care, and business has led to thePermission to make digital or hard copies of all or part of this work for personal orclassroom use is granted without fee provided that copies are not made or distributedfor profit or commercial advantage and that copies bear this notice and the full citationon the first page. Copyrights for components of this work owned by others than theauthor(s) must be honored. Abstracting with credit is permitted. To copy otherwise, orrepublish, to post on servers or to redistribute to lists, requires prior specific permissionand/or a fee. Request permissions from [email protected].
ICSE ’16, May 14 - 22, 2016, Austin, TX, USAc© 2016 Copyright held by the owner/author(s). Publication rights licensed to ACM.
ISBN 978-1-4503-3900-1/16/05. . . $15.00
DOI: http://dx.doi.org/10.1145/2884781.2884813
emerging field of Big Data Analytics that run in a cloud computingenvironment. To process massive quantities of data in the cloud, de-velopers leverage Data-Intensive Scalable Computing (DISC) sys-tems such as Google’s MapReduce [14], Hadoop [3], and Spark[38]. These DISC systems expose a programming model for au-thoring data processing logic, which is compiled into a DirectedAcyclic Graph (DAG) of data-parallel operators. The root DAGoperators consume data from some input source (e.g., GFS [18] orHDFS [33]), while downstream operators process the intermediateoutputs from DAG predecessors. Scaling to large datasets is han-dled by partitioning the data and assigning tasks that execute theoperator on each partition.
Currently, developers do not have easy means to debug DISCapplications. The use of cloud computing makes application de-velopment feel more like batch jobs and the nature of debuggingis therefore post-mortem. Developers are notified of runtime fail-ures or incorrect outputs after many hours of wasted computingcycles on the cloud. DISC systems such as Spark do provide exe-cution logs of submitted jobs. However, these logs present only thephysical view of Big Data processing, as they report the numberof worker nodes, the job status at individual nodes, the overall jobprogress rate, the messages passed between nodes, etc. These logsdo not provide the logical view of program execution e.g., systemlogs do not convey which intermediate outputs are produced fromwhich inputs, nor do they indicate what inputs are causing incor-rect results or delays, etc. Alternatively, a developer may test theirprogram by downloading a small subset of Big Data from the cloudonto their local disk, and then run the DISC application in a localmode. However, using a local mode, she may not encounter thesame failure, because the faulty data may not be included in thegiven data sample.
The vision of BIGDEBUG is to provide interactive, real-time de-bugging primitives for Big Data processing. Designing BIGDEBUGrequires re-thinking the traditional step-through debugging primi-tives as provided by tools such as gdb. Pausing the entire compu-tation across distributed worker nodes causes significant delay andreduces overall throughput. Naively inspecting millions of recordsflowing through a data-parallel pipeline is too time-consuming andinfeasible for an end user. BIGDEBUG must tag how individualrecords are flowing through individual worker nodes and transferthe requested debug information from the distributed worker nodesto the driver in an efficient manner. In other words, BIGDEBUGmust meet the requirements of low overhead, scalability, and fine-granularity, while providing expressive debugging primitives.
To solve these technical challenges, BIGDEBUG provides simu-lated breakpoints, which create the illusion of a breakpoint withthe ability to inspect program state in distributed worker nodesand to resume relevant sub-computations, even though the pro-
After all is said and done more is said than done
than done
done more is said
After all is said and
After allis said and
donemore is said
than done
(After,1) (all,1)(is,1)(said,1) (and,1)
(done,1) (more,1) (is,1)(said,1)
(than,1)(done,1)
(After,1) (all,1)(is,2)(and,1)
(more,1)(said,2)
(than,1)(done,2)
After,1 all, 1is, 2and, 1more, 1said, 2done, 2than, 1
FlatMap Map ReduceByKey CollectTextFile
Task 1
Task 3
Task 1
Task 3
Task 2Task 2
Stage 1 Stage 2
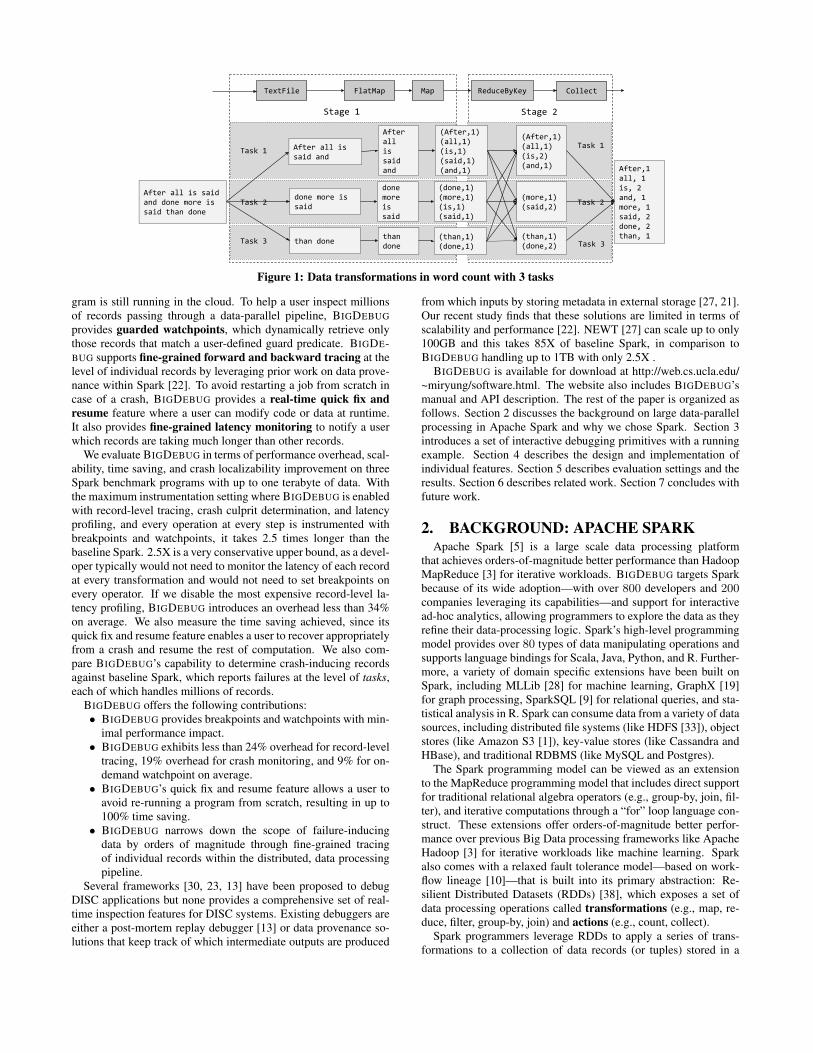
Figure 1: Data transformations in word count with 3 tasks
gram is still running in the cloud. To help a user inspect millionsof records passing through a data-parallel pipeline, BIGDEBUGprovides guarded watchpoints, which dynamically retrieve onlythose records that match a user-defined guard predicate. BIGDE-BUG supports fine-grained forward and backward tracing at thelevel of individual records by leveraging prior work on data prove-nance within Spark [22]. To avoid restarting a job from scratch incase of a crash, BIGDEBUG provides a real-time quick fix andresume feature where a user can modify code or data at runtime.It also provides fine-grained latency monitoring to notify a userwhich records are taking much longer than other records.
We evaluate BIGDEBUG in terms of performance overhead, scal-ability, time saving, and crash localizability improvement on threeSpark benchmark programs with up to one terabyte of data. Withthe maximum instrumentation setting where BIGDEBUG is enabledwith record-level tracing, crash culprit determination, and latencyprofiling, and every operation at every step is instrumented withbreakpoints and watchpoints, it takes 2.5 times longer than thebaseline Spark. 2.5X is a very conservative upper bound, as a devel-oper typically would not need to monitor the latency of each recordat every transformation and would not need to set breakpoints onevery operator. If we disable the most expensive record-level la-tency profiling, BIGDEBUG introduces an overhead less than 34%on average. We also measure the time saving achieved, since itsquick fix and resume feature enables a user to recover appropriatelyfrom a crash and resume the rest of computation. We also com-pare BIGDEBUG’s capability to determine crash-inducing recordsagainst baseline Spark, which reports failures at the level of tasks,each of which handles millions of records.
BIGDEBUG offers the following contributions:• BIGDEBUG provides breakpoints and watchpoints with min-
imal performance impact.• BIGDEBUG exhibits less than 24% overhead for record-level
tracing, 19% overhead for crash monitoring, and 9% for on-demand watchpoint on average.
• BIGDEBUG’s quick fix and resume feature allows a user toavoid re-running a program from scratch, resulting in up to100% time saving.
• BIGDEBUG narrows down the scope of failure-inducingdata by orders of magnitude through fine-grained tracingof individual records within the distributed, data processingpipeline.
Several frameworks [30, 23, 13] have been proposed to debugDISC applications but none provides a comprehensive set of real-time inspection features for DISC systems. Existing debuggers areeither a post-mortem replay debugger [13] or data provenance so-lutions that keep track of which intermediate outputs are produced
from which inputs by storing metadata in external storage [27, 21].Our recent study finds that these solutions are limited in terms ofscalability and performance [22]. NEWT [27] can scale up to only100GB and this takes 85X of baseline Spark, in comparison toBIGDEBUG handling up to 1TB with only 2.5X .
BIGDEBUG is available for download at http://web.cs.ucla.edu/~miryung/software.html. The website also includes BIGDEBUG’smanual and API description. The rest of the paper is organized asfollows. Section 2 discusses the background on large data-parallelprocessing in Apache Spark and why we chose Spark. Section 3introduces a set of interactive debugging primitives with a runningexample. Section 4 describes the design and implementation ofindividual features. Section 5 describes evaluation settings and theresults. Section 6 describes related work. Section 7 concludes withfuture work.
2. BACKGROUND: APACHE SPARKApache Spark [5] is a large scale data processing platform
that achieves orders-of-magnitude better performance than HadoopMapReduce [3] for iterative workloads. BIGDEBUG targets Sparkbecause of its wide adoption—with over 800 developers and 200companies leveraging its capabilities—and support for interactivead-hoc analytics, allowing programmers to explore the data as theyrefine their data-processing logic. Spark’s high-level programmingmodel provides over 80 types of data manipulating operations andsupports language bindings for Scala, Java, Python, and R. Further-more, a variety of domain specific extensions have been built onSpark, including MLLib [28] for machine learning, GraphX [19]for graph processing, SparkSQL [9] for relational queries, and sta-tistical analysis in R. Spark can consume data from a variety of datasources, including distributed file systems (like HDFS [33]), objectstores (like Amazon S3 [1]), key-value stores (like Cassandra andHBase), and traditional RDBMS (like MySQL and Postgres).
The Spark programming model can be viewed as an extensionto the MapReduce programming model that includes direct supportfor traditional relational algebra operators (e.g., group-by, join, fil-ter), and iterative computations through a “for” loop language con-struct. These extensions offer orders-of-magnitude better perfor-mance over previous Big Data processing frameworks like ApacheHadoop [3] for iterative workloads like machine learning. Sparkalso comes with a relaxed fault tolerance model—based on work-flow lineage [10]—that is built into its primary abstraction: Re-silient Distributed Datasets (RDDs) [38], which exposes a set ofdata processing operations called transformations (e.g., map, re-duce, filter, group-by, join) and actions (e.g., count, collect).
Spark programmers leverage RDDs to apply a series of trans-formations to a collection of data records (or tuples) stored in a
distributed fashion e.g., in HDFS [33]. Calling a transformation onan RDD produces a new RDD that represents the result of apply-ing the given transformation to the input RDD. Transformations arelazily evaluated. The actual evaluation of an RDD occurs when anaction is called. At that point the Spark runtime executes all trans-formations leading up to the RDD, on which it then evaluates theaction e.g., the count action counts the number of records in theRDD. A complete list of transformations and actions can be foundin the Spark documentation [6].
1 val textFile = spark.textFile("hdfs://...")2 val counts = textFile3 .flatMap(line => line.split(" "))4 .map(word => (word, 1))5 .reduceByKey(_ + _).collect()
Figure 2: Scala word count application in Apache Spark
Figure 2 shows a word count program written in Spark usingScala. The frequency of each unique word in the input text file iscalculated. It splits each word using a space as a separator, andmaps each word to a tuple containing the word text and 1 (the ini-tial count). The reduceByKey transformation groups the tuplesbased on the word (i.e., the key) and sums up the word counts inthe group. Finally, the collect action triggers the evaluation ofthe RDD referencing the output of the reduceByKey transfor-mation. The collect action returns a list of tuples to the driverprogram—containing each unique word and its frequency.
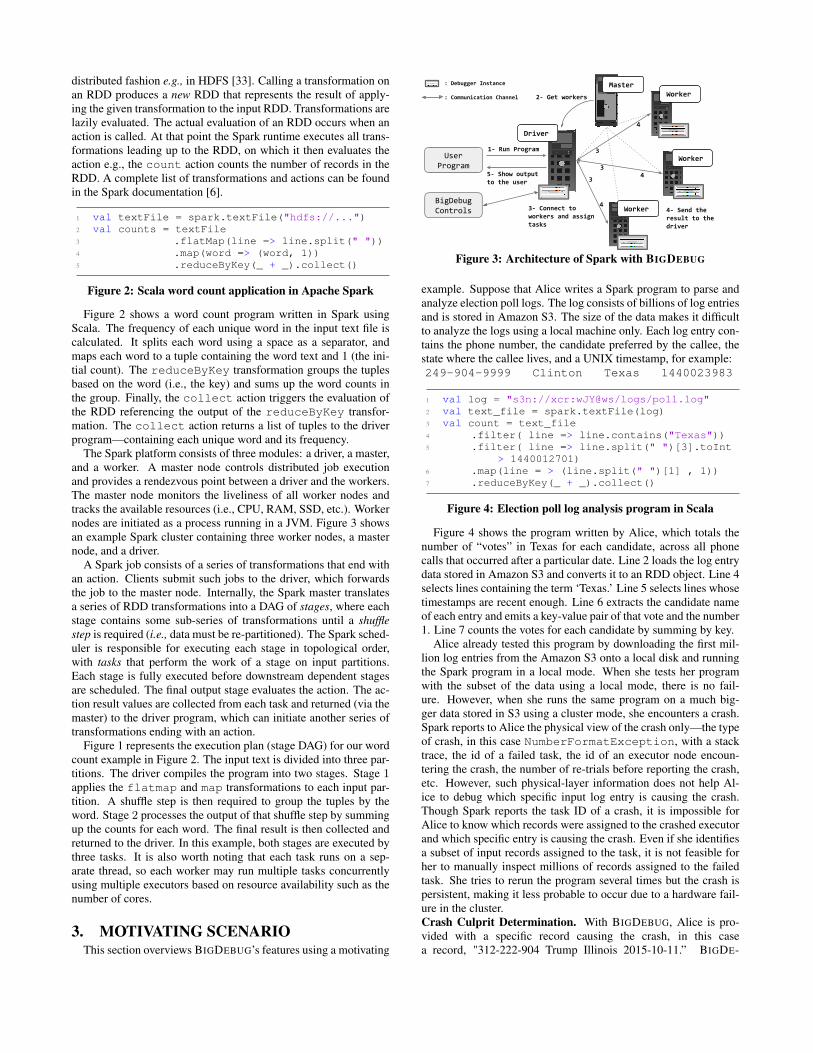
The Spark platform consists of three modules: a driver, a master,and a worker. A master node controls distributed job executionand provides a rendezvous point between a driver and the workers.The master node monitors the liveliness of all worker nodes andtracks the available resources (i.e., CPU, RAM, SSD, etc.). Workernodes are initiated as a process running in a JVM. Figure 3 showsan example Spark cluster containing three worker nodes, a masternode, and a driver.
A Spark job consists of a series of transformations that end withan action. Clients submit such jobs to the driver, which forwardsthe job to the master node. Internally, the Spark master translatesa series of RDD transformations into a DAG of stages, where eachstage contains some sub-series of transformations until a shufflestep is required (i.e., data must be re-partitioned). The Spark sched-uler is responsible for executing each stage in topological order,with tasks that perform the work of a stage on input partitions.Each stage is fully executed before downstream dependent stagesare scheduled. The final output stage evaluates the action. The ac-tion result values are collected from each task and returned (via themaster) to the driver program, which can initiate another series oftransformations ending with an action.
Figure 1 represents the execution plan (stage DAG) for our wordcount example in Figure 2. The input text is divided into three par-titions. The driver compiles the program into two stages. Stage 1applies the flatmap and map transformations to each input par-tition. A shuffle step is then required to group the tuples by theword. Stage 2 processes the output of that shuffle step by summingup the counts for each word. The final result is then collected andreturned to the driver. In this example, both stages are executed bythree tasks. It is also worth noting that each task runs on a sep-arate thread, so each worker may run multiple tasks concurrentlyusing multiple executors based on resource availability such as thenumber of cores.
3. MOTIVATING SCENARIOThis section overviews BIGDEBUG’s features using a motivating
Master
Worker
Worker
Driver
Worker
2- Get workers
User Program
1- Run Program
3- Connect to workers and assign tasks
3
3
3
4
4
44- Send the result to the driver
5- Show output to the user
BigDebug Controls
: Debugger Instance
: Communication Channel
Figure 3: Architecture of Spark with BIGDEBUG
example. Suppose that Alice writes a Spark program to parse andanalyze election poll logs. The log consists of billions of log entriesand is stored in Amazon S3. The size of the data makes it difficultto analyze the logs using a local machine only. Each log entry con-tains the phone number, the candidate preferred by the callee, thestate where the callee lives, and a UNIX timestamp, for example:249-904-9999 Clinton Texas 1440023983
1 val log = "s3n://xcr:wJY@ws/logs/poll.log"2 val text_file = spark.textFile(log)3 val count = text_file4 .filter( line => line.contains("Texas"))5 .filter( line => line.split(" ")[3].toInt
> 1440012701)6 .map(line = > (line.split(" ")[1] , 1))7 .reduceByKey(_ + _).collect()
Figure 4: Election poll log analysis program in Scala
Figure 4 shows the program written by Alice, which totals thenumber of “votes” in Texas for each candidate, across all phonecalls that occurred after a particular date. Line 2 loads the log entrydata stored in Amazon S3 and converts it to an RDD object. Line 4selects lines containing the term ‘Texas.’ Line 5 selects lines whosetimestamps are recent enough. Line 6 extracts the candidate nameof each entry and emits a key-value pair of that vote and the number1. Line 7 counts the votes for each candidate by summing by key.
Alice already tested this program by downloading the first mil-lion log entries from the Amazon S3 onto a local disk and runningthe Spark program in a local mode. When she tests her programwith the subset of the data using a local mode, there is no fail-ure. However, when she runs the same program on a much big-ger data stored in S3 using a cluster mode, she encounters a crash.Spark reports to Alice the physical view of the crash only—the typeof crash, in this case NumberFormatException, with a stacktrace, the id of a failed task, the id of an executor node encoun-tering the crash, the number of re-trials before reporting the crash,etc. However, such physical-layer information does not help Al-ice to debug which specific input log entry is causing the crash.Though Spark reports the task ID of a crash, it is impossible forAlice to know which records were assigned to the crashed executorand which specific entry is causing the crash. Even if she identifiesa subset of input records assigned to the task, it is not feasible forher to manually inspect millions of records assigned to the failedtask. She tries to rerun the program several times but the crash ispersistent, making it less probable to occur due to a hardware fail-ure in the cluster.Crash Culprit Determination. With BIGDEBUG, Alice is pro-vided with a specific record causing the crash, in this casea record, "312-222-904 Trump Illinois 2015-10-11.” BIGDE-

BUG first reports a specific transformation responsible for thecrash as well—line 5 in Figure 4 at time.toInt, whichtries to change the timestamp from String to Integer, causing aNumberFormatException. Using BIGDEBUG’s backwardtracing feature, Alice then locates the specific log entry in the S3input causing the crash. She then sees that this log entry uses atimestamp in Date format rather than UNIX format.RealTime Code Fix and Resume. Without BIGDEBUG, Alice canonly modify the input data and restart the job from scratch, incur-ring wasted computation in running Amazon EC2 services. UsingBIGDEBUG, Alice can fix the code on the fly by replacing the orig-inal filter at line number 5 with the following one and resuming thefailed computation.
1 filter{ line =>2 var time = line.split(" ")[3]3 val date = new Date("YYYY-MM-DD")4 if( date.checkFormat( time ) )5 time = date.getTimeInUnix( time )6 time.toInt > 1440012701 }
Guarded Watchpoint. Even after fixing the crash, Alice sees thatthe total number of votes found by the program is greater than whatshe expected to find. Using BIGDEBUG’s breakpoint, Alice inves-tigates the intermediate result right after the second transformationat line number 5 in Figure 4. Without BIGDEBUG, investigat-ing such intermediate result is not possible, because Spark com-bines all transformations within a single stage and evaluates themall at once. BIGDEBUG allows a user to set a breakpoint at anytransformation step and investigate the intercepted intermediate re-sults. She suspects that some UNIX timestamps may be in the 13-digit millisecond format, while the code assumes timestamps arein the 10-digit second format. She therefore installs a watchpointguarded by the following predicate (an ordinary function): (line=> line.split(" ")[3].length > 10. BIGDEBUG dy-namically retrieves the data matching this guard, and she can con-tinue to modify the guard iteratively in order to investigate further.
4. DEBUGGING PRIMITIVESTo provide interactive step-wise debugging primitives in Spark,
BIGDEBUG must address three technical challenges. First, it mustbe scalable to handle large data sets on the order of terabytes. Sec-ond, since the debugger process on the driver must monitor andcommunicate with a large number of worker nodes performingtasks on the cloud, BIGDEBUG must have a low overhead, min-imizing unnecessary communication and data transfer. Third, tohelp localize the cause of errors, BIGDEBUG must support fine-grained data inspection and monitoring capabilities at the level ofindividual records rather than tasks. Currently, Spark reports fail-ures at the level of tasks only. Since a single task processes millionsof records, locating a failed task is inadequate, as it is impossiblefor a user to manually inspect millions of records.
BIGDEBUG tackles these challenges by adopting a tight integra-tion approach with Spark’s runtime. Instead of creating a wrapperof existing Spark modules to track the input and output of eachstage, BIGDEBUG directly extends Spark to monitor pipelined,intra-stage transformations. To maximize the throughput of bigdata processing, BIGDEBUG provides simulated breakpoints thatenable a user to inspect a program state in a remote executor nodewithout actually pausing the entire computation. To reduce de-velopers’ burden in inspecting a large amount of data, on-demandwatchpoints retrieve intermediate data using a guard and transferthe selected data on demand. These primitives are motivated byprior user studies in Inspector Gadget [30], where they interviewed
1 abstract class RDD[T: ClassTag]( ....2 def watchpoint(f: T => Boolean): RDD[T]3 def breakpoint4 def breakpoint(f:T => Boolean)5 def enableLatencyAlert(set : Boolean)6 def setCrashConfiguration(set :
CrashConfiguration)7 def setFunction(f : T => U)8 def goBackAll: LineageRDD9 def goNextAll: LineageRDD
10 def goBack: LineageRDD11 def goNext: LineageRDD12 ....
Figure 5: BIGDEBUG’s API
DISC developers in Yahoo and found that DISC developers wantstep-through debugging, crash culprit determination, and tracingfeatures. Inspector Gadget proposes desired primitives but doesnot implement them.
+
+
11 .... 12 val textFile =spark 13 .textFile("hdfs://...") 14 val counts = textFile 15 .flatMap(l => l.split(" ")) 16 .map(word => (word, 1)) 17 .reduceByKey(_ + _) 18 counts.collect 19 ....
Enable Watchpoint $> a=>a.contains(“12”)
.... val counts = textFile .flatMap(l => l.split(" ")) .map(word => (word, 1)) .reduceByKey(_ + _) ....
.... val word = textFile .flatMap(l => l.split(" ")) word.enableLatencyAlert() val counts = word .watchpoint(a=>a.contains(“12”)) .map(word => (word, 1)) .reduceByKey(_ + _) ....
Instrument
Enable Latency Alert
Figure 6: BIGDEBUG instruments a program automaticallybased on debugger control commands entered by a user.
The API for BIGDEBUG is shown in Figure 5 and targets Scala.A user may also use a web-based debugger UI to automaticallyinsert corresponding API calls in the code. For example, the in-strumented code on the bottom-right of Figure 6 is automaticallygenerated from the debugger commands at the top of the figure.
4.1 Simulated BreakpointDoing a step by step execution to inspect intermediate outputs is
a common debugging strategy. There are two technical challengesin implementing breakpoints in Spark. First, traditional breakpointswill pause the entire execution at the breakpoint, while a user in-vestigates an intermediate program state. If we naively implementa normal breakpoint, a driver will communicate with all executornodes so that each executor will process data until the breakpoint inthe DAG and pause its computation until further debug commandsare provided. This naive approach causes all the computing re-sources on the cloud to be temporarily wasted, decreasing through-put. Second, Spark optimizes its performance through pipeliningtransformations in a single stage. Therefore there is a mismatchbetween the logical view of data transformation and the physicalview of data processing during debugging. For example, whentwo transformations t1 and t2 are applied to x, these are com-bined to t2(t1(x)) in a single stage and the intermediate resultof t1(x) is not viewable, as it is not materialized or stored.Simulated Breakpoint. A simulated breakpoint enables a user toinspect intermediate results at a given breakpoint and resume theexecution to create an illusion of a breakpoint, even though theprogram is still running on the cloud in the background. When

Stage 1 Stage 2
Map
Stage 3
ReduceByKey CollectFlatMapReduceByKey
Breakpoint
S1 S2 S3 S4
Figure 7: Illustration of Simulated Breakpointa simulated breakpoint is hit, BIGDEBUG spawns a new process torecord the transformation lineage of the breakpoint, while lettingthe executors continue processing the task. For example, in Fig-ure 7, when a user sets a breakpoint after flatmap, programstate S2 is captured from the original workflow without affectingits execution. Therefore, setting a simulated breakpoint has almostzero overhead, as it only retains information to re-generate the pro-gram state from the latest materialization point, i.e., the last stageboundary before the simulated breakpoint, in this case S1.
When a user requests intermediate results from the simulatedbreakpoint, BIGDEBUG then recomputes the intermediate resultsand caches the results. If a user queries data between transforma-tions such as flatmap and map in Figure 7 within the same stage,BIGDEBUG forces materialization of intermediate results by insert-ing a breakpoint and watchpoint (described in Section 4.2)API call on the RDD object to collect the intermediate results.Resume and Step Over. When a user enters a resume commandusing BIGDEBUG’s user interface, BIGDEBUG will automaticallyjump to the original workflow running in the background. Thisprocedure improves the overall throughput of the distributed pro-cessing. When a user enters a step over command to investi-gate the state after the next transformation in the UI, BIGDEBUGreplays the execution to the next instruction only from the latestmaterialization point. This feature differentiates BIGDEBUG froman existing replay debugger such as Arthur [13], which restarts ajob from the beginning. In Figure 7, when a user selects stepover, a new workflow will start from the nearest possible materi-alization point, in this case, S1. BIGDEBUG uses the materializedstate S1 and executes later operations while capturing S3 on thego.Realtime Code Fix. When a user finds anomalies in intermediatedata, currently the only option is to terminate the job and rewrite theprogram to handle the outliers. Terminating a job at a later stagewill waste all computations before. Because running tasks on cloudcosts lots of money and even days to process billions of records, wehypothesize that developers are less likely to terminate the programafter inspecting it at the breakpoint.
To save the cost of re-run, BIGDEBUG allows a user to re-place any code in the succeeding RDDs after the breakpoint.If a user wants to modify code, BIGDEBUG applies the fixfrom the last materialization point rather than the beginningof the program to reuse previously computed results. Assum-ing that a breakpoint is in place, a user submits a new func-tion (i.e., a data transformation operator) at the driver. Thefunction is then compiled using Scala’s NSC [4] library andshipped to each worker to override the call to the original func-tion, when the respective RDD is executed. Suppose a usersets a breakpoint after flatmap and the program is paused inFigure 7. A user can replace the function in the map trans-formation from ((word => (word,1)) to {word => if(word!=null) (word,1); else (word,0);}. When auser resumes after the fix at S2, a new workflow will start fromS1 and later RDDs including modified ones will be computed untilthe end of the workflow is reached and the background job of theoriginal workflow is terminated.
BIGDEBUG checks whether the supplied function has the sametype as the original function through static type checking. There-
fore, a user cannot provide a code fix that breaks the integrity ofthe used data type. When a user replaces function f with a newfunction g, BIGDEBUG applies g to all records from the last mate-rialization point to ensure consistency.
4.2 On-Demand Watchpoint with GuardSimilar to watching a variable in a traditional debugger like
gdb, BIGDEBUG provides a watchpoint to inspect intermediatedata. Because millions of records are passing through a data-parallel pipeline, it is infeasible for a user to inspect all intermediaterecords. Such data transfer would also incur high communicationoverhead, as all worker nodes must transfer the intermediate resultsback to the driver node. To overcome these challenges, BIGDEBUGprovides an on-demand watchpoint with a guard closure func-tion. A user can provide a guard to query a subset of data matchingthe guard. For example, (r=>r>4) is an anonymous functionthat takes r as input and returns true, if r is greater than 4, andrdd.watchpoint(r=>r>4) sets a watchpoint to retrieve allrecords greater than 4. BIGDEBUG automatically compiles suchuser-provided guard and distributes it to worker nodes to retrievethe matching data.On-Demand Batch Transfer. To reduce communication over-head, BIGDEBUG batches intermediate data and sends them to thedriver when needed. If no request is made for the watchpointeddata from the user, it will be kept at the workers until the end ofthe stage or the next breakpoint in the same stage, if there is any.When the computation passes the end of the stage, the remainingfiltered data are flushed, so that there are enough memory availablefor other Spark operations.Dynamic Guard Modification. A user can modify a guard func-tion to narrow down the scope of captured data. This feature iscalled a dynamic guard, as the function can be refined iterativelywhile the Spark job is executing. A watchpoint guard is builton top of Scala and Java and is written like a normal Spark pro-gram. For example, an expression (value._1.length > 50&& value._2 == 1) filters values where the length of first el-ement in tuple is greater than 50 and the value of second elementin tuple is 1. When a user updates a guard during a Spark job,BIGDEBUG uses Scala’s NSC library [4] to compile the guard atthe driver node and ships it to all workers. Individual workers thenload the new guard at each executor. Using a dynamic guard, a usercan tune the amount of data being transferred and presented.
4.3 Crash Culprit and RemediationDISC systems are limited in their ability to handle failures at run-
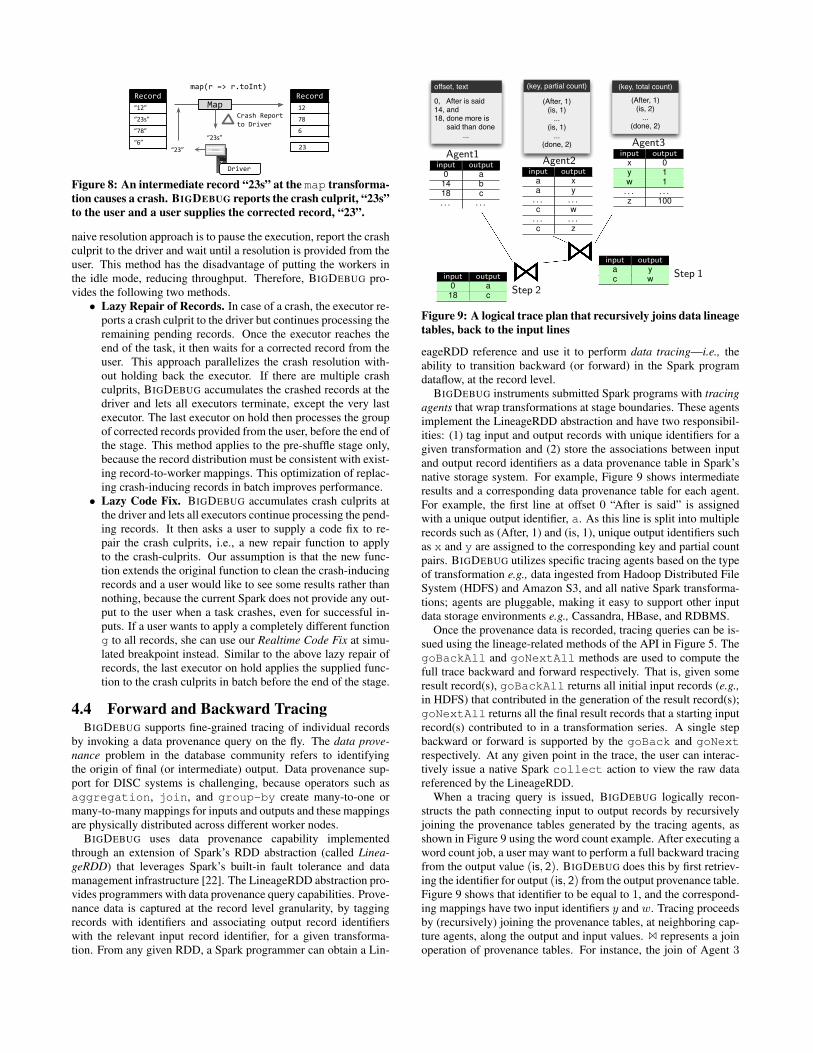
time. In Spark, crashes cause the correctly computed stages to sim-ply be thrown away. Remediating a crash at runtime can save timeand resources by avoiding a program re-run from scratch. BIGDE-BUG leverages fine-grained tracing to be discussed in Section 4.4 toidentify a crash-inducing input, not just a crash culprit record in theintermediate stage. While waiting for a user intervention, BIGDE-BUG runs pending tasks continuously to utilize idle resources andto achieve high throughput.Crash Culprit Determination. When a crash occurs at an execu-tor, BIGDEBUG sends all the required information to the driver, sothat the user can examine crash culprits and take actions as depictedin Figure 8. When a crash occurs, BIGDEBUG reports (1) a crashculprit—an intermediate record causing a crash (2) a stack trace,(3) a crashed RDD, and (4) the original input record inducing acrash by leveraging backward tracing in Section 4.4.Remediation. BIGDEBUG avoids the re-generation of prior stagesby allowing a user to either correct the crashed record, skip thecrash culprit, or supply a code fix to repair the crash culprit. A
Record
“12”
“23s”
“78”
“6”
Record
12
78
6
map(r => r.toInt)
MapCrash Report to Driver
“23”
Driver
“23s”
23
Figure 8: An intermediate record “23s” at the map transforma-tion causes a crash. BIGDEBUG reports the crash culprit, “23s”to the user and a user supplies the corrected record, “23”.
naive resolution approach is to pause the execution, report the crashculprit to the driver and wait until a resolution is provided from theuser. This method has the disadvantage of putting the workers inthe idle mode, reducing throughput. Therefore, BIGDEBUG pro-vides the following two methods.
• Lazy Repair of Records. In case of a crash, the executor re-ports a crash culprit to the driver but continues processing theremaining pending records. Once the executor reaches theend of the task, it then waits for a corrected record from theuser. This approach parallelizes the crash resolution with-out holding back the executor. If there are multiple crashculprits, BIGDEBUG accumulates the crashed records at thedriver and lets all executors terminate, except the very lastexecutor. The last executor on hold then processes the groupof corrected records provided from the user, before the end ofthe stage. This method applies to the pre-shuffle stage only,because the record distribution must be consistent with exist-ing record-to-worker mappings. This optimization of replac-ing crash-inducing records in batch improves performance.
• Lazy Code Fix. BIGDEBUG accumulates crash culprits atthe driver and lets all executors continue processing the pend-ing records. It then asks a user to supply a code fix to re-pair the crash culprits, i.e., a new repair function to applyto the crash-culprits. Our assumption is that the new func-tion extends the original function to clean the crash-inducingrecords and a user would like to see some results rather thannothing, because the current Spark does not provide any out-put to the user when a task crashes, even for successful in-puts. If a user wants to apply a completely different functiong to all records, she can use our Realtime Code Fix at simu-lated breakpoint instead. Similar to the above lazy repair ofrecords, the last executor on hold applies the supplied func-tion to the crash culprits in batch before the end of the stage.
4.4 Forward and Backward TracingBIGDEBUG supports fine-grained tracing of individual records
by invoking a data provenance query on the fly. The data prove-nance problem in the database community refers to identifyingthe origin of final (or intermediate) output. Data provenance sup-port for DISC systems is challenging, because operators such asaggregation, join, and group-by create many-to-one ormany-to-many mappings for inputs and outputs and these mappingsare physically distributed across different worker nodes.
BIGDEBUG uses data provenance capability implementedthrough an extension of Spark’s RDD abstraction (called Linea-geRDD) that leverages Spark’s built-in fault tolerance and datamanagement infrastructure [22]. The LineageRDD abstraction pro-vides programmers with data provenance query capabilities. Prove-nance data is captured at the record level granularity, by taggingrecords with identifiers and associating output record identifierswith the relevant input record identifier, for a given transforma-tion. From any given RDD, a Spark programmer can obtain a Lin-
0, After is said14, and18, done more is said than done ...
(After, 1)(is, 1)
...(is, 1)
...(done, 2)
(After, 1)(is, 2)
...(done, 2)
offset, text (key, partial count) (key, total count)
Agent1input output
0 a14 b18 c. . . . . .
Agent2input output
a xa y
. . . . . .c w
. . . . . .c z
Agent3input output
x 0y 1w 1
. . . . . .z 100
input outputa yc w Step 1input output
0 a18 c Step 2
Figure 9: A logical trace plan that recursively joins data lineagetables, back to the input lines
eageRDD reference and use it to perform data tracing—i.e., theability to transition backward (or forward) in the Spark programdataflow, at the record level.
BIGDEBUG instruments submitted Spark programs with tracingagents that wrap transformations at stage boundaries. These agentsimplement the LineageRDD abstraction and have two responsibil-ities: (1) tag input and output records with unique identifiers for agiven transformation and (2) store the associations between inputand output record identifiers as a data provenance table in Spark’snative storage system. For example, Figure 9 shows intermediateresults and a corresponding data provenance table for each agent.For example, the first line at offset 0 “After is said” is assignedwith a unique output identifier, a. As this line is split into multiplerecords such as (After, 1) and (is, 1), unique output identifiers suchas x and y are assigned to the corresponding key and partial countpairs. BIGDEBUG utilizes specific tracing agents based on the typeof transformation e.g., data ingested from Hadoop Distributed FileSystem (HDFS) and Amazon S3, and all native Spark transforma-tions; agents are pluggable, making it easy to support other inputdata storage environments e.g., Cassandra, HBase, and RDBMS.
Once the provenance data is recorded, tracing queries can be is-sued using the lineage-related methods of the API in Figure 5. ThegoBackAll and goNextAll methods are used to compute thefull trace backward and forward respectively. That is, given someresult record(s), goBackAll returns all initial input records (e.g.,in HDFS) that contributed in the generation of the result record(s);goNextAll returns all the final result records that a starting inputrecord(s) contributed to in a transformation series. A single stepbackward or forward is supported by the goBack and goNextrespectively. At any given point in the trace, the user can interac-tively issue a native Spark collect action to view the raw datareferenced by the LineageRDD.
When a tracing query is issued, BIGDEBUG logically recon-structs the path connecting input to output records by recursivelyjoining the provenance tables generated by the tracing agents, asshown in Figure 9 using the word count example. After executing aword count job, a user may want to perform a full backward tracingfrom the output value (is, 2). BIGDEBUG does this by first retriev-ing the identifier for output (is, 2) from the output provenance table.Figure 9 shows that identifier to be equal to 1, and the correspond-ing mappings have two input identifiers y and w. Tracing proceedsby (recursively) joining the provenance tables, at neighboring cap-ture agents, along the output and input values. 1 represents a joinoperation of provenance tables. For instance, the join of Agent 3

Report to debugger
Record
r1
r2
r3
r4
Record Time (ms)
r1` 5
r2` 200
r3` 8
r4` 6
RDD
Figure 10: When latency monitoring is enabled, stragglerrecords are reported to the user.and Agent 2 produces the Step 1 trace result. Subsequently, join-ing Step 1 with Agent 1 produces the Step 2 trace result, which isthe final trace result referencing HDFS input records at offsets 0and 18, both containing the word “is”.
Supporting data provenance, while logically simple, is difficultto achieve in a DISC environment such as Spark because the size ofinput-output identifier mappings is as large as all intermediate re-sults, and data provenance tables are physically distributed acrossworker nodes. For these reasons, Spark’s internal storage service isused for storing provenance data, and a distributed join implemen-tation uses partition information embedded into the record identi-fiers to optimize the shuffle step. Implementing an optimized dis-tributed join of data provenance tables in Spark is the subject ofanother paper [22], which details the advantage of an optimizeddistributed join in Spark over storing data provenance tables in ex-ternal storage services (e.g., HDFS, MySQL).
4.5 Fine-Grained Latency AlertIn big data processing, it is important to identify which records
are causing delay. Spark reports a running time only at thelevel of tasks, making it difficult to identify individual stragglerrecords—records responsible for slow processing. To localize per-formance anomalies at the record level, BIGDEBUG wraps eachoperator with a latency monitor. For each record at each trans-formation, BIGDEBUG computes the time taken to process eachrecord, keeps track of a moving average, and sends to the monitor,if the time is greater than k standard deviations above the mov-ing average where default k is 2. Figure 10 shows an example ofhow straggler records are tagged and reported to the debugger. Aswe show in Section 5, record-level latency alert poses the highestoverhead among BIGDEBUG’s primitives due to the cost of takinga timestamp for processing each record and computing the movingaverage among millions of records per executor.
5. EVALUATIONWe evaluate BIGDEBUG’s (1) scalability, (2) performance over-
head, (3) localizability improvement in determining crash-inducingrecords, and (4) time saving w.r.t to an existing replay debug-ger. The main purpose of our evaluation is to investigate whetherBIGDEBUG keeps performance similar to the original Spark andretains its scalability, while supporting interactive debugging.
• How does BIGDEBUG scale to massive data?• What is the performance overhead of instrumentation and ad-
ditional communication for debugging primitives?• How much localizability improvement does BIGDEBUG
achieve by leveraging fine-grained, record level tracing?• How much time saving does BIGDEBUG provide through its
runtime crash remediation, in comparison to an existing re-play debugger?
We use a cluster consisting of sixteen i7-4770 machines, eachrunning at 3.40GHz and equipped with 4 cores (2 hyper-threadsper core), 32GB of RAM, and 1TB of disk capacity. The oper-ating system is a 64bit Ubuntu 12.04. The datasets are all storedon HDFS version 1.0.4 with a replication factor of 1—one copyof each dataset across the cluster. We compare BIGDEBUG’s per-
formance against the baseline Spark, version 1.2.1. The level ofparallelism was set at two tasks per core. This configuration allowsus to run up to 120 tasks simultaneously.
We use three Spark programs for our performance experiments:WordCount, Grep, and PigMix query L1. WordCount computes thenumber of word occurrences grouped by unique words. WordCountcomprises of 4 transformations, which are divided into 2 stages: thefirst stage loads the input file (textfile), splits each line into abag of words (flatmap), creates a tuple of (word, 1) (map), andthe second stage reduces the key-value pairs using each word as thekey (reduceByKey). Grep finds the lines in the input datasetsthat contain a queried string. Grep comprises of only 1 stage with2 transformations : textfile reads the input file line by line andfilter applies a predicate to see if the line contains a substring.PigMix’s latency query L1 is a performance benchmark for DISCsystems in which an unstructured data is transformed and analyzed.L1 comprises of 2 stages: the first stage contains textfile, 2maps, flatmap followed by 2 maps and the second stage hasreduceByKey followed by a map.
For our performance experiment, we vary input size from500MB to 1TB by using an unstructured data made up of Zipfdistribution over a vocabulary of 8000 terms. All runs are repeated10 times. We compute a trimmed mean by removing the shortest2 runs and the longest 2 runs, because the running time of DISCprograms depends on various factors such as a warm up of HDFScache, garbage collection, and network I/O. In big data systems, avariation of 5% is considered noise, because of these factors.
5.1 ScalabilityWe perform experiments to show that BIGDEBUG scales to mas-
sive data, similar to Spark. More specifically, we assess the scale upproperty—BIGDEBUG can ingest and process massive data and itsrunning time increases in proportion to the increase in data size. Weassess the scale out property—as the number of worker nodes (thedegree of parallelization) increases, the running time decreases.Scaling Up. Figure 11(a) shows the scale-up experiment whilevarying the data size from a few gigabytes to one terabyte. In thisexperiment, BIGDEBUG is used with the maximum instrumenta-tion where breakpoints and watchpoints are set in every line andlatency monitoring, crash remediation, and data provenance are en-abled for every record at every transformation. The running timeof BIGDEBUG grows steadily in proportion to the running time ofSpark. As the data size increases, BIGDEBUG’s running time alsoincreases, because large input data requires the scheduler to createmore tasks, assign the tasks to workers, and coordinate distributedexecution to improve data locality, throughput, and HDFS caching.
With such maximum instrumentation, BIGDEBUG scales wellto massive data (1TB). Figure 11(b) shows the overhead in Word-Count. BIGDEBUG takes 2.5X longer on average in comparisonto the baseline Spark. This 2.5X overhead is a very conservativeupper bound, as a developer may not need to monitor the latency ofeach record at every transformation and may not need to set break-points on every operator. When disabling the most expensive fea-ture, record-level latency monitoring, BIGDEBUG poses an averageoverhead of 34% only. In Grep and L1, the overheads are 1.76Xand 1.38X with the maximum instrumentation and 7% and 29%respectively when latency monitoring is disabled (see Table 1).
OverheadBenchmark Dataset(GB)
Max w/o LatencyPigMix L1 1, 10, 50, 100, 150, 200 1.38X 1.29X
Grep 20, 30, 40, . . . 90 1.76X 1.07XWord Count 0.5 to 1000 (increment with a log scale) 2.5X 1.34X
Table 1: Performance Evaluation on Subject Programs

1 10 100 1,000
100
1,000
10,000
Dataset(GB)
Tim
e(s)
BIGDEBUG −Maximum
ApacheSpark
(a) Scale Up
1 10 100 1,0000
0.5
1
1.5
2
2.5
3
3.5
4
4.5
5
5.5
Dataset(GB)
Tim
esof
Apa
che
Spar
k
BIGDEBUG’s Maximum Overhead
(b) Maximum Instrumentation
2 3 4 5 6 7 8
50
100
150
200
250
300
350
400Baseline Spark 10GBBaseline Spark 30GBBaseline Spark 50GB
Workers
Tim
e(s)
10GB
30GB
50GB
(c) Scale Out
0 1 2 3 4 5
100
200
300
400
500
600
700
800
900
1,000
1,100
Instructions with breakpoint (out of 5)
Tim
e(s)
Traditional BreakpointSimulated Breakpoint
(d) Traditional vs. Simulated Breakpoint
0 500 1,000 1,500 2,000 2,5000
10
20
30
40
50
Data captured with watchpoint (MB)
Overhea
d(%
)
Watchpoint Overhead on 40GB Dataset
(e) Watchpoint
20 40 60 800
10
20
30
40
50
60
70
Dataset(GB)
Overhea
d(%
)
Tracing+Crash Monitoring+WatchpointTracing
Crash MonitoringWatchpoint
(f) Overhead Per FeatureFigure 11: BIGDEBUG’s Scalability and Overhead
Scaling Out. The property of scaling out is essential for any DISCsystem. We change the number of worker nodes (essentially thetotal number of cores) on a fixed size dataset and record a runningtime for both BIGDEBUG and the baseline Spark. As the numberof cores increases, the running time should decrease. Figure 11(c)shows that BIGDEBUG does not affect the scale-out property of thebaseline Spark. When there are too many workers, it makes it hardfor the Spark scheduler to retain locality, and BIGDEBUG also endsup moving data around at stage boundaries between workers.
5.2 OverheadWe measure the overhead as the increase in the running time
of BIGDEBUG w.r.t the baseline Spark. The performance over-head comes from instrumentation and communication between thedriver and the workers and data transfer to carry the requested de-bug information to the user. BIGDEBUG works at the record level.Therefore, the overhead increases in proportion to the number ofrecords in each stage. For example, when the WordCount programsplits input lines into a bag of words at the flatmap transforma-tion, the overhead increases.Simulated Breakpoint. BIGDEBUG offers almost 0% overheadto pause and instantly resume. This overhead is the same acrossall subject programs because instantly resuming simulated break-point does not involve any additional instrumentation. On the otherhand, a traditional breakpoint adds overhead because it must pauseand cache the intermediate state entirely. Figure 11(d) shows thecomparison results between simulated breakpoints and traditionalbreakpoints, while setting a breakpoint at different transformations.Traditional breakpoints incur orders of magnitude higher overhead,since they materialize all intermediate results regardless of whethera user requests them or not. For example, a traditional breakpoint’soverhead rises sharply after a flatmap transformation that emitsa large number of unaggregated records.On-Demand Watchpoint. We place a watchpoint between two in-structions such that a custom guard reports only a certain percent-
age of intermediate results, e.g., 2%, 5% , 10% etc. Once captured,the intermediate data is sent to the driver for a user to inspect. InFigure 11(e), the x-axis shows the amount of captured data rang-ing from 500MB to 3GB, when the total intermediate data size is40GB. When 500MB of data is transferred to the user at the watch-point, it incurs only 18% overhead. This is a very conservative setup, since the user is unlikely to read 500MB records at once. To iso-late the overhead of setting watchpoints from the overhead of datatransfer, we set a watchpoint at every transformation with a guardthat always evaluates to false. Among all subject program, Word-Count poses the maximum overhead of 9% on average, whereas theoverhead for Grep and L1 is 5% and 3% respectively.Crash Monitoring. We enable crash monitoring for every trans-formation and vary the data size from 20GB to 90 GB to measureoverhead. See Figure 11(f). Crash monitoring imposes 19% over-head in L1. WordCount and Grep incur a lower overhead of 18%and 4% respectively. This overhead comes from monitoring ev-ery record transformation for any kind of a failure, and checking ifthere are any pending crashed records to be repaired at the end oflocal execution in a task.Backward and Forward Tracing. We enable record-level dataprovenance capturing for every transformation and vary the datasize from 20GB to 90GB. See Figure 11(f). The tracing primitiveposes, on average, 24% overhead over the baseline Spark in L1.WordCount and Grep pose, on average, 22% and 5% overhead re-spectively. The majority of the overhead comes from the generationof the data provenance tables maintaining the associations betweeninput and output record identifiers. The cost of storing each dataprovenance table into Spark’s storage layer is small, because it isperformed asynchronously.Fine-Grained Latency Alert. We enable record-level latencymonitoring on every transformation. Record-level latency moni-toring incurs the highest overhead among BIGDEBUG’s features.Latency monitoring alone takes 2.4X longer than baseline Spark ondata size varying from 500MB to 1TB (see Figure 12(a)) in Word-

1 10 100 1,0000
0.5
1
1.5
2
2.5
3
3.5
4
4.5
5
5.5
Datasize(GB)
Tim
esof
Apach
eSpark Latency Alert
(a) Latency Alert Overhead
2,000 4,000 6,000 8,000 10,000
1
2
3
4
5
6
7
8
Number of Tasks in Job
Aver
age
Rec
ords
Per
Task
(Million
s)
Records Per TaskExecution Time
80
120
160
200
240
Tim
e(s)
(b) Localizability vs. Performance
S1 S2 S3 S40
50
100
150
200
Location of crash (Stage)
Tim
e(s)
BIGDEBUG
Arthur
(c) Time Saving
Figure 12: Latency monitoring overhead, time saving through crash remediation, and localizability improvement
Count. In Grep and L1, the overhead is 1.74X and 1.24X. Thesignificant overhead comes from performing a statistical analysisfor each record transformation. A timestamp is recorded beforeand after the transformation of each record to see if its latency lieswithin 2 standard deviations from the average. The overhead is alsoincurred by updating a moving average and a standard deviation.If we disable record-level latency monitoring from the maximuminstrumentation setting, the overhead decreases from 150% (i.e.,2.5X of baseline Spark) to 34% (i.e., 1.34X of baseline Spark) inthe case of the WordCount program.
5.3 Crash Localizability ImprovementSpark reports failures at the level of tasks, while BIGDEBUG
reports specific failure-inducing inputs. BIGDEBUG also detectsspecific straggling records, while Spark only reports a stragglertask causing delay. By construction, our record-level tracing ap-proach has 100% accuracy with zero false positive because it lever-ages data provenance to identify all inputs contributing to a failure.Delta Debugging [39] can further isolate this combination of multi-ple failure-inducing inputs, but will require a larger number of runs,as opposed to BIGDEBUG that requires only a single run.
Therefore, we measure the improvement in localizing failed (ordelayed) records in comparison to the baseline Spark. When de-bugging a program using Spark, a developer may want to increasethe number of tasks to improve fault localizability at the cost ofrunning time. Note that the running time increases as you increasethe number of tasks, since more resources are used for communica-tion and coordination among distributed worker nodes. To quantifythis, we vary the number of tasks and measure the average numberof records per task and the total running time. See Figure 12(b).When configuring Spark with 1000 tasks and 60GB dataset, eachtask handles 7.52 million records on average. If a single recordamong 7.52 million records crashes the task, it is impossible for ahuman being to identify a crash culprit. To improve fault localiz-ability, if a developer increases the number of tasks from 1000 to10,000 to reduce the number of records assigned to each task, eachtask still handles 0.72 million records, and additional communica-tion and coordination increases the total running time by 2.5 times.As Figure 11(f) shows, BIGDEBUG incurs less than 19% overheadfor reporting crash culprits and takes only 2.4X time for latencyalert, while improving fault localizability by orders of millions.
5.4 Time Saving through Crash RemediationWhen a task crashes, the current Spark does not provide any out-
put to the user, even for successful inputs and terminates the taskimmediately. On the other hand, BIGDEBUG allows a user to re-move or modify a crash culprit at runtime to avoid termination.Therefore, BIGDEBUG avoids additional runs when a user tries to
remove crash-inducing records from the original input. For thesame scenario, using a post-hoc instrumentation replay debuggerArthur [13] requires at least three runs. In the first run, a programcrashes and Spark reports failed task IDs. In the second run, a usermust write a custom post-hoc instrumentation query (a new dataflow graph) with those failed task IDs and run the query to recom-pute the intermediate results for the failed tasks. In the third run, auser removes the crash-inducing records and re-runs the job again.Crashes in later stages result in more redundant work in the secondand third runs and hence more time for completion. When a crashoccurs at the 9th stage of a 10 stage job, Arthur must recompute thefirst 9 stages twice, while BIGDEBUG avoids such re-computationcompletely by allowing a user to resolve crashes in the first run.
Figure 12(c) shows our experiment result on time saving. Wecompare BIGDEBUG’s time saving with a post-hoc instrumen-tation replay debugger like Arthur. We conservatively estimateArthur’s performance by running the original Spark for its firstand third runs. We measure time saving by dividing the ad-ditional time required by Arthur by BIGDEBUG’s completiontime. We seed crashes in different transformation locations byupdating an original program to throw an exception at a givenstage, because the magnitude of time saving depends on whichstage a crash occurs. For example, we replace the map func-tion {word => (word,1)} with {word=> if(word =="Crash") crash(); (word,1)} where crash() alwaysthrow a NullPointerException. S1 is a program wherecrashes are seeded in the first stage, S2 is a program where crashesare seeded in the second stage, etc. BIGDEBUG saves the executiontime by 80% on average and reaches up to 100% after S2. In theexperiment, the most time consuming stage is S2 and a crash in S2or later saves a large amount of time.
6. RELATED WORKDebugging Needs for DISC. Fisher et al. [15] interviewed 16 dataanalysts at Microsoft and studied the painpoints of big data analyt-ics tools. Their study finds that a cloud-based computing solutionmakes it far more difficult to debug. Data analysts often find them-selves digging through trace files distributed across multiple VMs.Zhou et al. [40] manually categorize 210 randomly sampled escala-tion of a big data platform at Microsoft. The study finds that 36.2%of in-field failures (i.e., escalations) are caused by system-side de-fects, which include logical and design errors of DISC applications.Job failures and slowdowns are common in DISC applications, ac-counting for 45% and 27% of the escalations. These findings mo-tivate BIGDEBUG.Execution Log Analysis of DISC applications. Several ap-proaches help developers debug DISC applications by collecting

and analyzing execution logs. Boulon et al. [11] monitor Hadoopclusters at runtime and store the log data. Their system collectslogs for understanding a runtime failure, but does not provide real-time debug primitives. Developers typically develop DISC appli-cations using a small sample of data in a local mode or a pseudocloud environment first and deploy the application on a larger cloudwith a considerably larger data set and processing power. Shang etal. [34] compare the execution log captured on the cloud with thelog captured using a local mode. Their system abstracts the exe-cution logs, recovers the execution sequences and compares the se-quences between the pseudo and cloud deployments. Tan et al. [35]analyze Hadoop logs to construct state-machine views of the pro-gram execution to help a developer understand a Hadoop execu-tion log. Their approach computes the histogram of the duration ofeach state and detects anomalies in the program execution. Xu etal. [37] parse console logs and combine source code analysis to de-tect abnormal behavior. Fu et al. [16] map free-form text messagesin log files to logging statements in source code. None of thesepost-mortem log analysis approaches help developers debug DISCapplications realtime.Debuggers for DISC applications. Inspector Gadget [30] is aframework proposal for monitoring and debugging data flow pro-grams in Apache Pig [31]. The proposal is based on informal in-terviews with ten Yahoo employees who write DISC applications.While Inspector Gadget proposes features such as step-through de-bugging, crash culprit determination, tracing, etc., it simply listsdesired debug APIs, but leaves it to others to implement the pro-posed APIs. The tracing API proposed by Inspector Gadget targetscoarse-grained off-line tracing using a centralized server, fallingbehind BIGDEBUG’s ability to trace individual records at runtime.
Arthur [13] is a post-hoc instrumentation debugger that targetsSpark and enables a user to selectively replay a part of the originalexecution. However, a user can only perform post-mortem analysisand cannot inspect intermediate results at runtime. It also requiresa user to write a custom query for post-hoc instrumentation. Tolocalize faults, Arthur requires more than one run. For example, toremove crash-inducing records from the original input, in the firstrun, a program crashes and Spark reports failed tasks IDs. In thesecond run, a user must write a custom post-hoc instrumentationquery (a new data flow graph) with those failed task IDs and runthe query to recompute the intermediate results for the failed tasks.In the third run, a user removes the crash-inducing records and re-runs the job again. Such post-hoc instrumentation incurs significantdebugging time, as demonstrated by Section 5.4. Recon [25] optsfor a post-hoc instrumentation strategy like Arthur.
Graft [32] is a debugger for a graph-based DISC computingframework, Apache Giraph [2]. Graft requires a user to select ver-tices—similar to executors in Spark—to capture events and replaythe execution later. Graft assumes that a user has adequate priorknowledge to know buggy vertices. Similar to Arthur, Graft is apost-hoc instrumentation debugger. Moreover, Graft is built forprocessing graphs only and is not applicable to a data flow frame-work, like Spark.
Daphne [23] lets users visualize and debug DryadLINQ pro-grams. It provides a job object model for viewing the running tasksand enables a user to attach a debugger to a remote process on thecluster. This approach works in DryadLINQ because all communi-cations between tasks is through disk. Such approach could workfor Hadoop or MapReduce that persist intermediate results in thefile system, but does not work for an in-memory processing frame-work such as Spark that achieves orders-of-magnitude better per-formance through in-memory processing and lazy evaluation.Data Provenance for DISC applications. There is a large body of
work that studies techniques for capturing and querying data prove-nance in data-oriented workflows [10]. RAMP [21] instrumentsApache Hadoop with agents that wrap the user-provided map andreduce functions. RAMP agents store data provenance tablesin HDFS, and enable a user to query data provenance data usingApache Hive [36] and Pig [31]. NEWT [27] captures data prove-nance tables and stores in MySQL clusters. A user must submitSQL queries to join data provenance tables in an iterative loop. Be-cause both RAMP and NEWT do not store the referenced raw data,a user can see record identifiers only and cannot view intermediateresults on the fly.
BIGDEBUG supports fine-grained tracing by leveraging priorwork on data provenance within Spark [22]. The data provenancecapability used by BIGDEBUG is orders-of-magnitude faster, be-cause it stores data provenance tables in-memory within Spark’sruntime and performs an optimized distributed join of the prove-nance tables. The design of an optimized, distributed join algo-rithm in Spark is a subject of another paper and is described else-where [22]. Data provenance alone cannot support realtime debug-ging, since a user needs primitives such as simulated breakpointsand guarded watchpoints to interact with a data parallel pipeline atruntime, and data provenance queries must be invoked in the con-text of crashes, failures, or a breakpoint.Replay Debugger. Replay debugging for distributed systems hasbeen extensively studied [29, 24] through systems such as li-blog [17], R2 [20], and DCR [8]. These systems are designed toreplay general distributed programs, and thus recording all sourcesof non-determinism, including message passing order across nodes,system calls, and accesses to memory shared across threads. Theirgoal is to reproduce errors using the captured events. These replaydebuggers incur significant overhead at runtime and even largerslowdown at replay time. In contrast, BIGDEBUG leverages thestructure of a data flow graph to replay sub computations, and apartial replay is to support step-through debugging, while a pro-gram is still running. Frameworks like D3S [26], MaceODB [12]and Aguilera et al. [7] are distributed debuggers for finding frame-work bugs, not application bugs.
7. CONCLUSIONBig data debugging is currently a painstakingly long and expen-
sive process. BIGDEBUG offers interactive debugging primitivesfor an in-memory data-intensive scalable computing (DISC) frame-work. To emulate traditional step-wise debugging in the contextof in-memory big data processing, BIGDEBUG offers simulatedbreakpoints and guarded watchpoints with little performance over-head. BIGDEBUG enables a user to determine crash culprits andresolve them at runtime, avoiding a program re-run from scratch.By leveraging fine-grained data provenance, BIGDEBUG reportsthe origin of a crash culprit and supports tracing intermediate re-sults forward and backward at the record level. It scales to massivedata in the order of terabytes, improves fault localizability by or-ders of millions than baseline Spark, and provides up to 100% timesaving with respect to a posthoc instrumentation replay debugger.
In terms of future work, we plan to construct Spark programbenchmarks and conduct user studies with professional softwareengineers. Instead of having a user specify a guard for an on-demand watchpoint, extracting data invariants from intercepted in-termediate results may be useful for helping the user debug a DISCprogram. Another area for future work is tool-assisted automatedfault localization in BIGDEBUG. For example, with the help of au-tomated fault localization, we envision that a user can isolate thetrace of a failure-inducing workflow, diagnose the root cause of anerror, and resume the workflow for only affected data and code.

AcknowledgementsWe thank the anonymous reviewers for their comments. Partic-ipants in this project are in part supported through NSF CCF-1527923, CCF-1460325, IIS-1302698, CNS-1351047, and NIHU54EB020404. We would also like to thank our industry partnersat IBM and Intel for their gifts.
8. REFERENCES[1] Amazon s3. https://aws.amazon.com/s3/.[2] Apache giraph. http://giraph.apache.org/.[3] Hadoop. http://hadoop.apache.org/.[4] Scala.tool.nsc. http://www.scala-lang.org/api/2.11.0/
scala-compiler/index.html#scala.tools.nsc.package.[5] Spark. https://spark.apache.org/.[6] Spark documentation. http://spark.apache.org/docs/1.2.1/.[7] M. K. Aguilera, J. C. Mogul, J. L. Wiener, P. Reynolds, and
A. Muthitacharoen. Performance debugging for distributedsystems of black boxes. In ACM SIGOPS Operating SystemsReview, volume 37, pages 74–89. ACM, 2003.
[8] G. Altekar and I. Stoica. Dcr: Replay debugging for thedatacenter. Technical Report UCB/EECS-2010-74, EECSDepartment, University of California, Berkeley, May 2010.
[9] M. Armbrust, R. S. Xin, C. Lian, Y. Huai, D. Liu, J. K.Bradley, X. Meng, T. Kaftan, M. J. Franklin, A. Ghodsi, andM. Zaharia. Spark sql: Relational data processing in spark.In Proceedings of the 2015 ACM SIGMOD InternationalConference on Management of Data, pages 1383–1394.ACM, 2015.
[10] O. Biton, S. Cohen-Boulakia, S. B. Davidson, and C. S.Hara. Querying and managing provenance through userviews in scientific workflows. In Proceedings of the 2008IEEE 24th International Conference on Data Engineering,ICDE ’08, pages 1072–1081, Washington, DC, USA, 2008.IEEE Computer Society.
[11] J. Boulon, A. Konwinski, R. Qi, A. Rabkin, E. Yang, andM. Yang. Chukwa, a large-scale monitoring system. In CloudComputing and its Applications (CCA ’08), pages 1–5, 102008.
[12] D. Dao, J. Albrecht, C. Killian, and A. Vahdat. Livedebugging of distributed systems. In Compiler Construction,pages 94–108. Springer, 2009.
[13] A. Dave, M. Zaharia, and I. Stoica. Arthur: Rich post-factodebugging for production analytics applications. Technicalreport, University of California, Berkeley, 2013.
[14] J. Dean and S. Ghemawat. Mapreduce: Simplified dataprocessing on large clusters. In Proceedings of the 6thConference on Symposium on Opearting Systems Design &Implementation - Volume 6, OSDI’04, pages 10–10,Berkeley, CA, USA, 2004. USENIX Association.
[15] D. Fisher, R. DeLine, M. Czerwinski, and S. Drucker.Interactions with big data analytics. interactions,19(3):50–59, May 2012.
[16] Q. Fu, J.-G. Lou, Y. Wang, and J. Li. Execution anomalydetection in distributed systems through unstructured loganalysis. In Proceedings of the 2009 Ninth IEEEInternational Conference on Data Mining, ICDM ’09, pages149–158, Washington, DC, USA, 2009. IEEE ComputerSociety.
[17] D. Geels, G. Altekar, P. Maniatis, T. Roscoe, and I. Stoica.Friday: Global comprehension for distributed replay. InProceedings of the 4th USENIX Conference on Networked
Systems Design & Implementation, NSDI’07, pages 21–21,Berkeley, CA, USA, 2007. USENIX Association.
[18] S. Ghemawat, H. Gobioff, and S.-T. Leung. The google filesystem. In ACM SIGOPS operating systems review,volume 37, pages 29–43. ACM, 2003.
[19] J. E. Gonzalez, R. S. Xin, A. Dave, D. Crankshaw, M. J.Franklin, and I. Stoica. Graphx: Graph processing in adistributed dataflow framework. Proceedings of OSDI, pages599–613, 2014.
[20] Z. Guo, X. Wang, J. Tang, X. Liu, Z. Xu, M. Wu, M. F.Kaashoek, and Z. Zhang. R2: An application-level kernel forrecord and replay. In Proceedings of the 8th USENIXconference on Operating systems design and implementation,pages 193–208. USENIX Association, 2008.
[21] R. Ikeda, H. Park, and J. Widom. Provenance for generalizedmap and reduce workflows. In In Proc. Conference onInnovative Data Systems Research (CIDR), 2011.
[22] M. Interlandi, K. Shah, S. D. Tetali, M. A. Gulzar, S. Yoo,M. Kim, T. Millstein, and T. Condie. Titian: Dataprovenance support in spark. Proc. VLDB Endow.,9(3):216–227, Nov. 2015.
[23] V. Jagannath, Z. Yin, and M. Budiu. Monitoring anddebugging dryadlinq applications with daphne. In Paralleland Distributed Processing Workshops and Phd Forum(IPDPSW), 2011 IEEE International Symposium on, pages1266–1273. IEEE, 2011.
[24] T. J. LeBlanc and J. M. Mellor-Crummey. Debuggingparallel programs with instant replay. Computers, IEEETransactions on, 100(4):471–482, 1987.
[25] K. H. Lee, N. Sumner, X. Zhang, and P. Eugster. Unifieddebugging of distributed systems with recon. In DependableSystems & Networks (DSN), 2011 IEEE/IFIP 41stInternational Conference on, pages 85–96. IEEE, 2011.
[26] X. Liu, Z. Guo, X. Wang, F. Chen, X. Lian, J. Tang, M. Wu,M. F. Kaashoek, and Z. Zhang. D3s: Debugging deployeddistributed systems. In Proceedings of the 5th USENIXSymposium on Networked Systems Design andImplementation, NSDI’08, pages 423–437, Berkeley, CA,USA, 2008. USENIX Association.
[27] D. Logothetis, S. De, and K. Yocum. Scalable lineagecapture for debugging disc analytics. In Proceedings of the4th annual Symposium on Cloud Computing, page 17. ACM,2013.
[28] X. Meng, J. K. Bradley, B. Yavuz, E. R. Sparks,S. Venkataraman, D. Liu, J. Freeman, D. B. Tsai, M. Amde,S. Owen, D. Xin, R. Xin, M. J. Franklin, R. Zadeh,M. Zaharia, and A. Talwalkar. Mllib: Machine learning inapache spark. CoRR, abs/1505.06807, 2015.
[29] R. H. Netzer and B. P. Miller. Optimal tracing and replay fordebugging message-passing parallel programs. The Journalof Supercomputing, 8(4):371–388, 1995.
[30] C. Olston and B. Reed. Inspector gadget: A framework forcustom monitoring and debugging of distributed dataflows.In Proceedings of the 2011 ACM SIGMOD InternationalConference on Management of data, pages 1221–1224.ACM, 2011.
[31] C. Olston, B. Reed, U. Srivastava, R. Kumar, andA. Tomkins. Pig latin: a not-so-foreign language for dataprocessing. In Proceedings of the 2008 ACM SIGMODinternational conference on Management of data, pages1099–1110. ACM, 2008.
[32] S. Salihoglu, J. Shin, V. Khanna, B. Q. Truong, and

J. Widom. Graft: A debugging tool for apache giraph. InProceedings of the 2015 ACM SIGMOD InternationalConference on Management of Data, pages 1403–1408.ACM, 2015.
[33] J. Shafer, S. Rixner, and A. L. Cox. The hadoop distributedfilesystem: Balancing portability and performance. InPerformance Analysis of Systems & Software (ISPASS), 2010IEEE International Symposium on, pages 122–133. IEEE,2010.
[34] W. Shang, Z. M. Jiang, H. Hemmati, B. Adams, A. E.Hassan, and P. Martin. Assisting developers of big dataanalytics applications when deploying on hadoop clouds. InProceedings of the 2013 International Conference onSoftware Engineering, ICSE ’13, pages 402–411,Piscataway, NJ, USA, 2013. IEEE Press.
[35] J. Tan, X. Pan, S. Kavulya, R. Gandhi, and P. Narasimhan.Salsa: Analyzing logs as state machines. In Proceedings ofthe First USENIX Conference on Analysis of System Logs,WASL’08, pages 6–6, Berkeley, CA, USA, 2008. USENIXAssociation.
[36] A. Thusoo, J. S. Sarma, N. Jain, Z. Shao, P. Chakka,N. Zhang, S. Antony, H. Liu, and R. Murthy. Hive-a petabytescale data warehouse using hadoop. In Data Engineering(ICDE), 2010 IEEE 26th International Conference on, pages996–1005. IEEE, 2010.
[37] W. Xu, L. Huang, A. Fox, D. Patterson, and M. I. Jordan.Detecting large-scale system problems by mining consolelogs. In Proceedings of the ACM SIGOPS 22nd symposiumon Operating systems principles, pages 117–132. ACM,2009.
[38] M. Zaharia, M. Chowdhury, T. Das, A. Dave, J. Ma,M. McCauley, M. J. Franklin, S. Shenker, and I. Stoica.Resilient distributed datasets: A fault-tolerant abstraction forin-memory cluster computing. In Proceedings of the 9thUSENIX conference on Networked Systems Design andImplementation, pages 2–2. USENIX Association, 2012.
[39] A. Zeller and R. Hildebrandt. Simplifying and isolatingfailure-inducing input. Software Engineering, IEEETransactions on, 28(2):183–200, 2002.
[40] H. Zhou, J.-G. Lou, H. Zhang, H. Lin, H. Lin, and T. Qin. Anempirical study on quality issues of production big dataplatform. In International Conference on SoftwareEngineering, Software Engineering In Practice (ICSE SEIP).IEEE, May 2015.