big data for official statistics ian ewing chief methodologist unceea june, 2015 1
TRANSCRIPT
1
Big Data for Official Statistics
Ian Ewing<affil> Chief MethodologistUNCEEAJune, 2015
• “… a blanket term for any collection of data sets so large and complex that it becomes difficult to process using on-hand database management tools or traditional data processing applications.” (Wiki, 2014)
• “… there are many definitions of Big Data, which differ on whether you are a computer scientist, a financial analyst, or an entrepreneur pitching an idea to a venture capitalist…” – Big Data Privacy Report to President Obama
• Big Data are the increasingly available digital trails (exhausts) from the ubiquitous information gathering technologies – ABS working definition
What is Big Data?
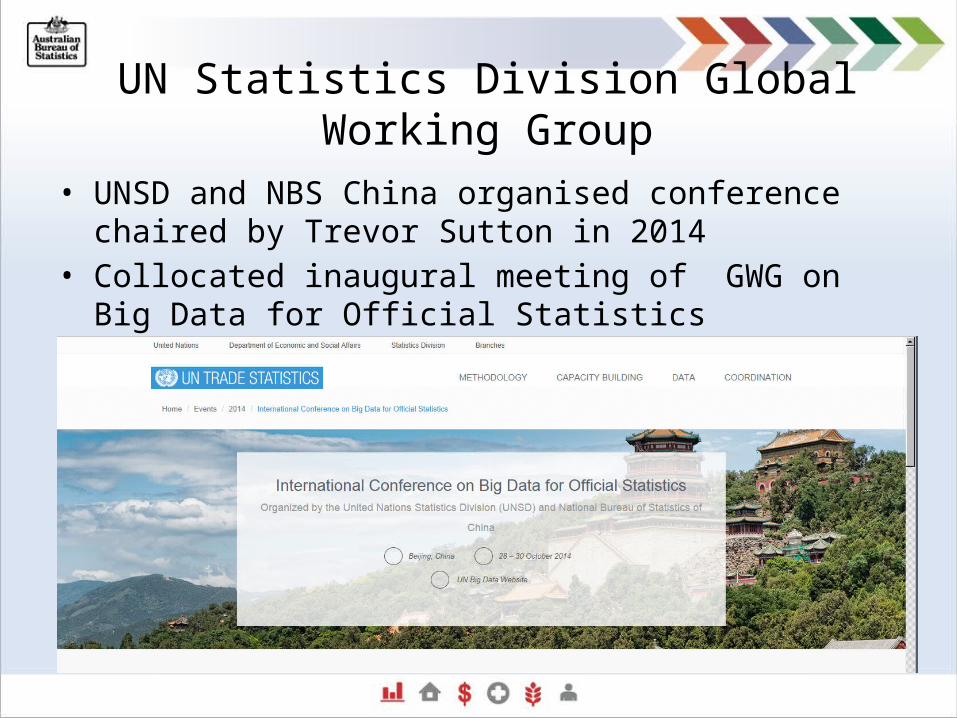
UN Statistics Division Global Working Group
• UNSD and NBS China organised conference chaired by Trevor Sutton in 2014
• Collocated inaugural meeting of GWG on Big Data for Official Statistics
9 Task Teams Established• Big Data and the Sustainable Development goals• Advocacy and Communication• Satellite Imagery, Remote Sensing and Geo-spatial Data• Social Media and Web-Scraping• Mobile Phone data• Access and Partnerships• Skills, Training and Capacity Building• Cross Cutting Issues• Coordination
Task Team on Satellite Imagery, Remote Sensing and Geo-spatial Data
• Chaired by Siu-Ming Tam and coordinated by the ABS • 7 national statistical agencies • 9 international organisations and companies• UN Committee of Experts on Global Geospatial Information
Management to be invited• Regular Meetings• Terms of Reference established and pilot studies commenced
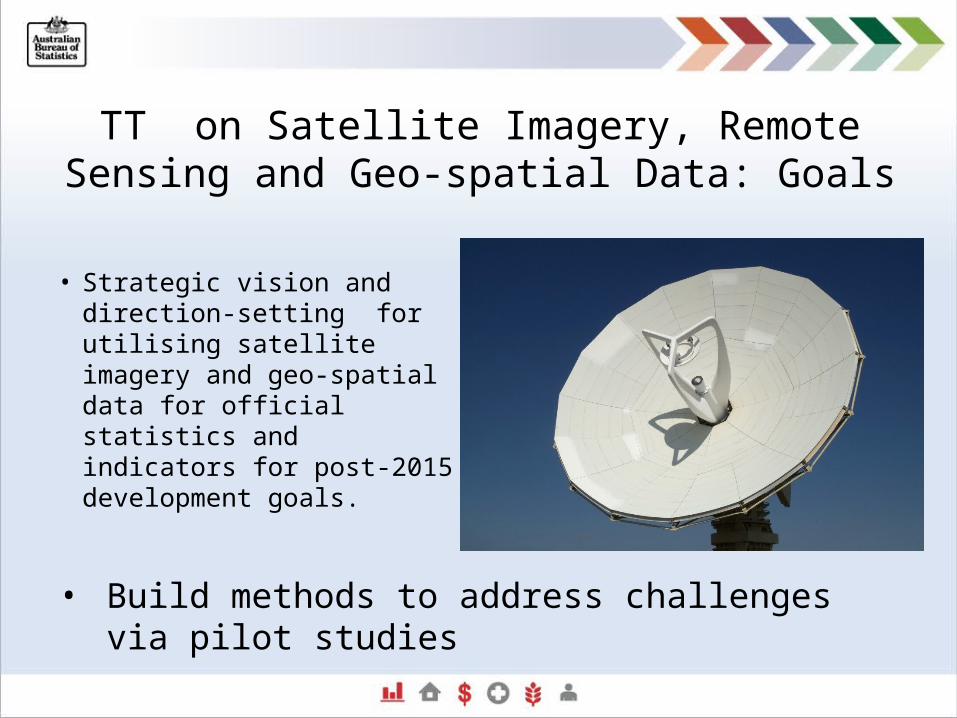
TT on Satellite Imagery, Remote Sensing and Geo-spatial Data: Goals
• Strategic vision and direction-setting for utilising satellite imagery and geo-spatial data for official statistics and indicators for post-2015 development goals.
• Build methods to address challenges via pilot studies
TT on Satellite Imagery, Remote Sensing and Geo-spatial Data: Goals
• Identify the most reliable and accurate statistical methods for estimating quantities of interest.
• Suggest approaches for collecting representative training data of sufficient quality.
• Research, develop and implement assessment methods for predictive models including measures of accuracy and goodness of fit.
• Establish strategies to reuse and adapt algorithms across topics and to build implementations for large volumes of data.
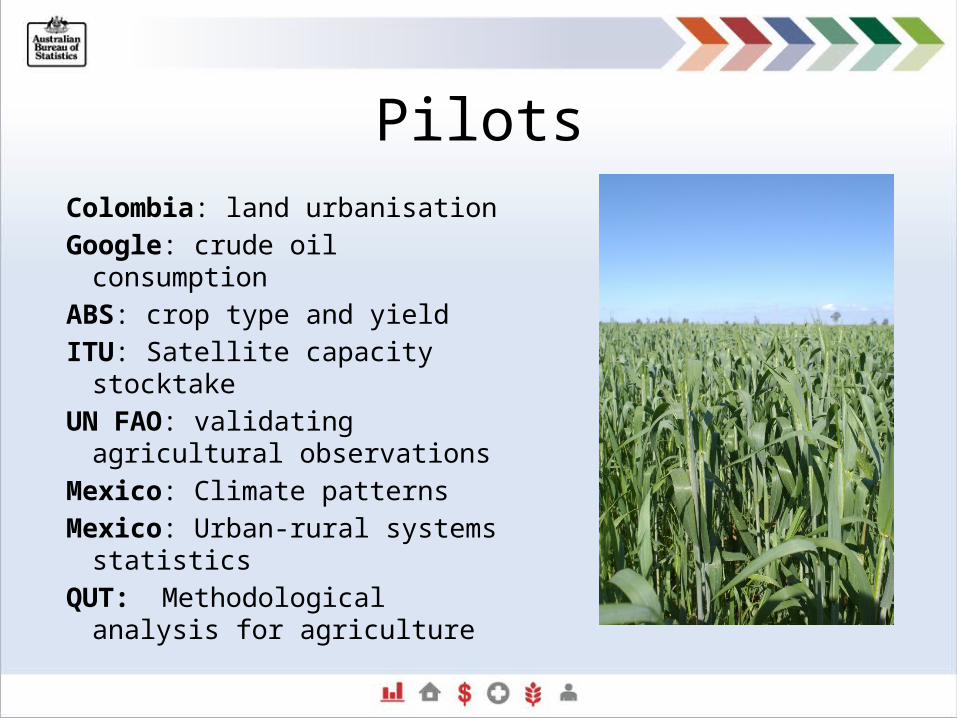
PilotsColombia: land urbanisation Google: crude oil consumptionABS: crop type and yield ITU: Satellite capacity stocktakeUN FAO: validating agricultural
observationsMexico: Climate patternsMexico: Urban-rural systems
statistics QUT: Methodological analysis for
agriculture

Agricultural Production and the Great Barrier Reef
What is a Land Account?• A tool for integrating data about a piece of land– Economic– Environmental– Social
• A method of tracking change in land attributes such as land use, land cover and industry over time.
• A method for identifying causes of change.
• Land Account consist of a series of tables showing interactions with land measured in both physical and monetary terms.
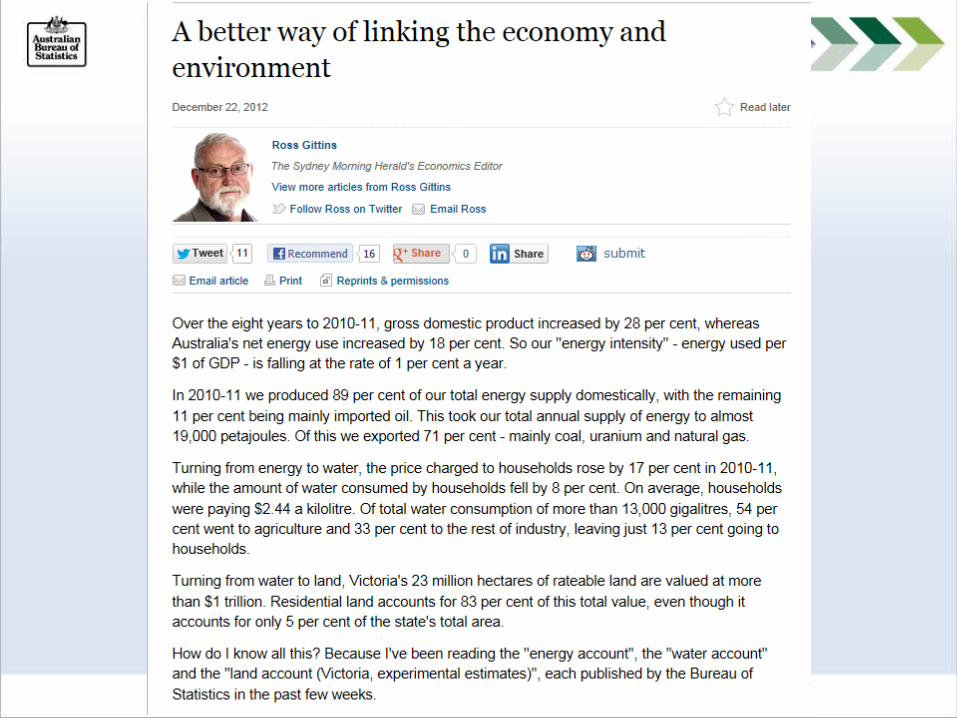
Why a Land Account?Land is fundamental to economic production
Land represents a major proportion of the nation’s value and is a significant cost of production
Worth $3,872.8 b (43.02%) in 2012-13 (Australia’s National Accounts)
The way we use land effects the quality of the environment
Integrated economic, environmental, and social data adds value – contributes to informed decision making
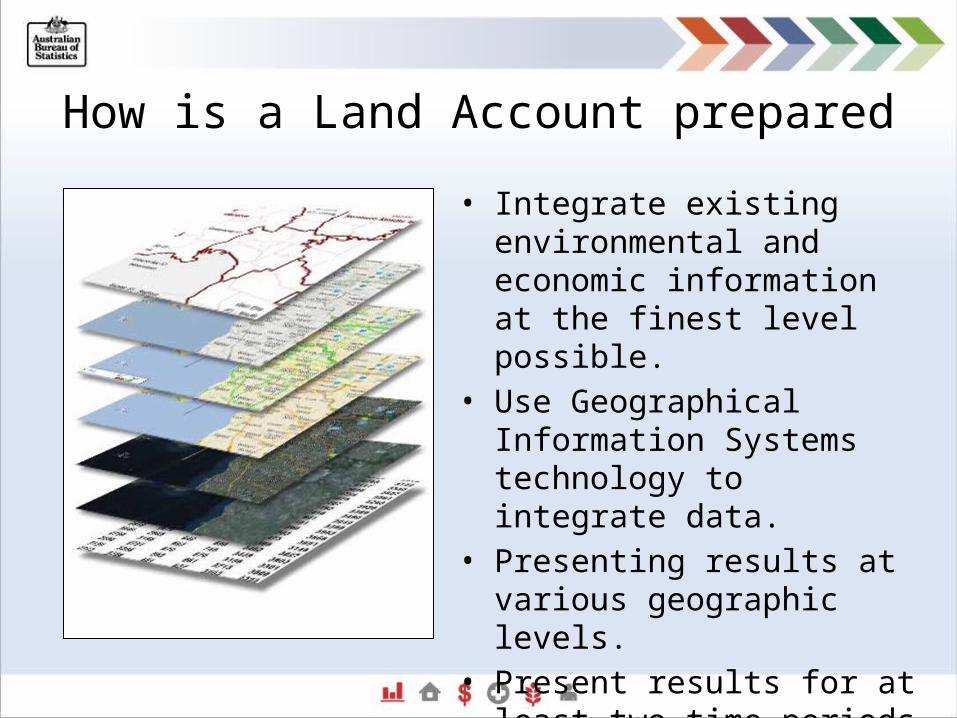
How is a Land Account prepared• Integrate existing environmental
and economic information at the finest level possible.
• Use Geographical Information Systems technology to integrate data.
• Presenting results at various geographic levels.
• Present results for at least two time periods
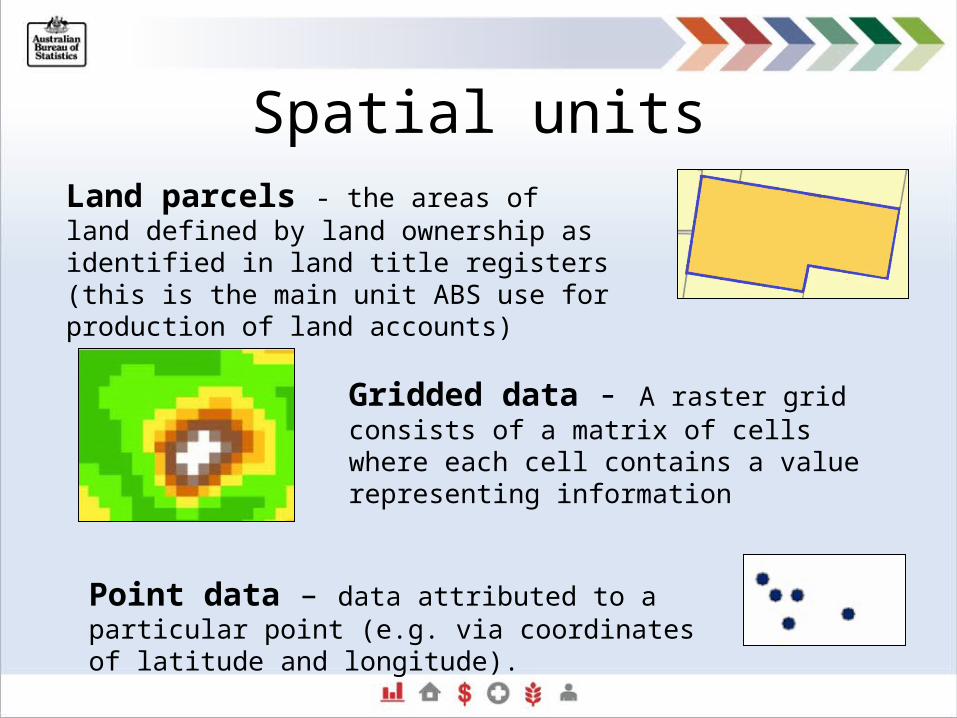
Spatial unitsLand parcels - the areas of land defined by land ownership as identified in land title registers (this is the main unit ABS use for production of land accounts)
Gridded data - A raster grid consists of a matrix of cells where each cell contains a value representing information
Point data – data attributed to a particular point (e.g. via coordinates of latitude and longitude).
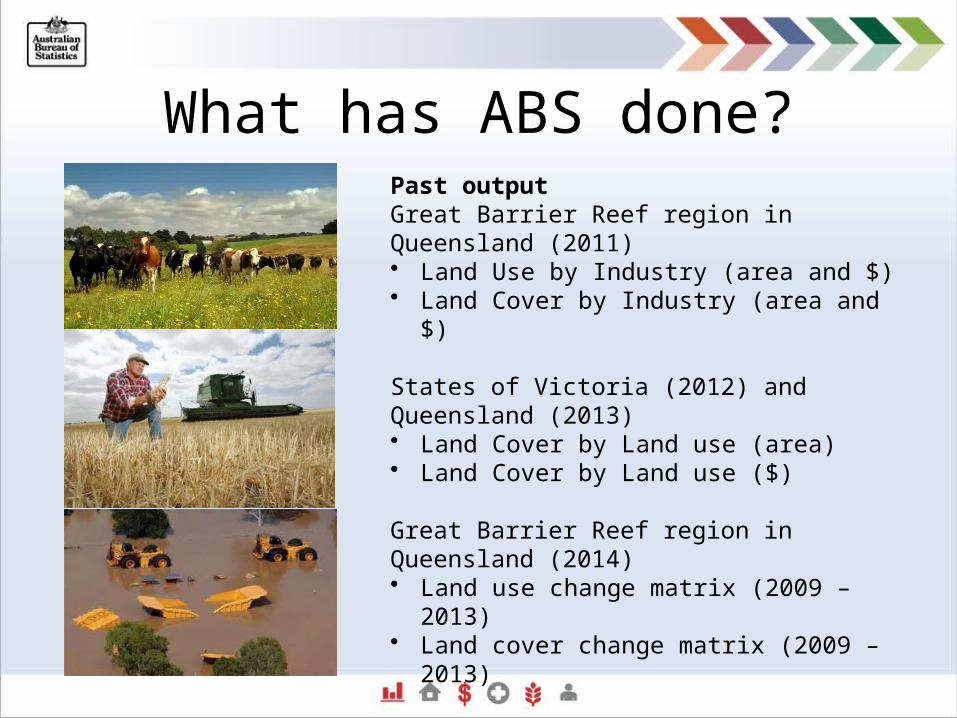
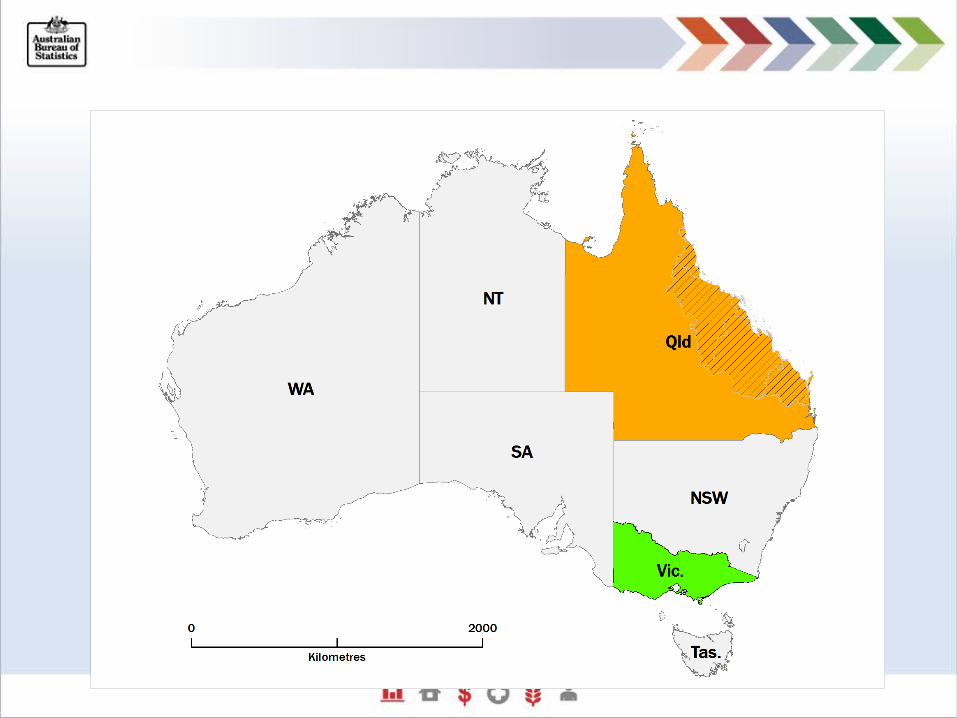
What has ABS done?Past outputGreat Barrier Reef region in Queensland (2011)• Land Use by Industry (area and $)• Land Cover by Industry (area and $)
States of Victoria (2012) and Queensland (2013)• Land Cover by Land use (area)• Land Cover by Land use ($)
Great Barrier Reef region in Queensland (2014)• Land use change matrix (2009 – 2013)• Land cover change matrix (2009 – 2013)
Work in progressState of South Australia (late 2015)• Land use change matrix (2006 – 2011)• Land cover change matrix (2006 – 2011)
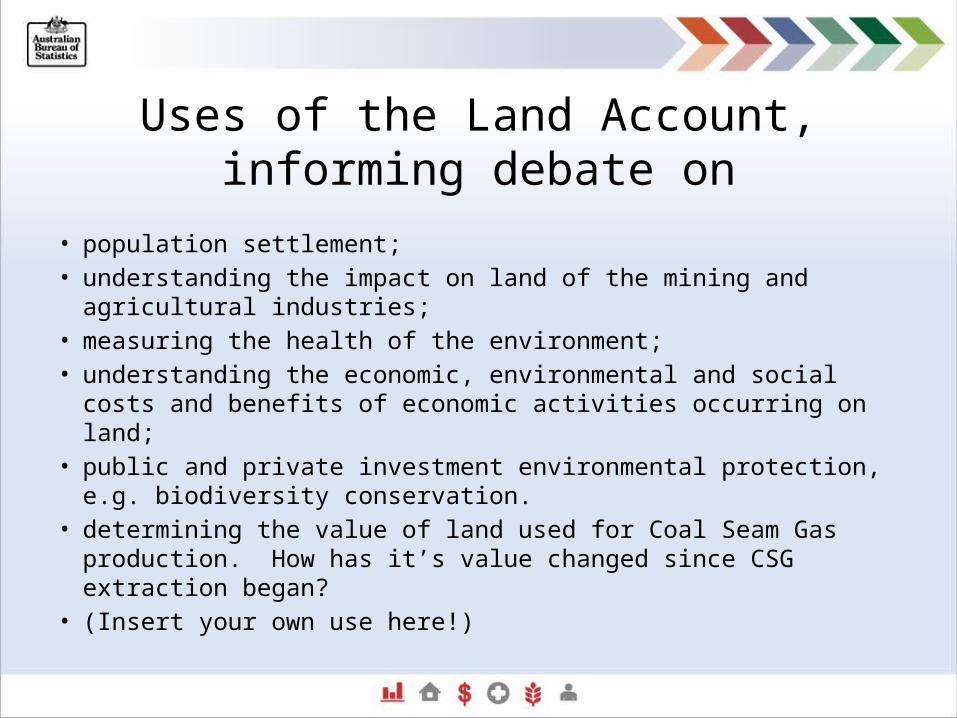
Uses of the Land Account, informing debate on
• population settlement; • understanding the impact on land of the mining and agricultural
industries; • measuring the health of the environment; • understanding the economic, environmental and social costs and
benefits of economic activities occurring on land; • public and private investment environmental protection, e.g.
biodiversity conservation.• determining the value of land used for Coal Seam Gas production.
How has it’s value changed since CSG extraction began?• (Insert your own use here!)
18
Questions on Global Working Group:[email protected]
Questions on Agricultural Production and the Great Barrier Reef: [email protected]