big brother knows your friends: on privacy of social communities
TRANSCRIPT

Big Brother Knows Your Friends: on Privacy ofSocial Communities in Pervasive Networks
Igor Bilogrevic1, Murtuza Jadliwala2?, Istvan Lam5, Imad Aad3, PhilipGinzboorg4, Valtteri Niemi4, Laurent Bindschaedler1, and Jean-Pierre
Hubaux1
1 LCA1, EPFL, Lausanne, Switzerland2 EECS Department, Wichita State University, USA
3 Nokia Research Center, Lausanne, Switzerland4 Nokia Research Center, Helsinki, Finland
5 Faculty of Electrical Engineering and Informatics, BME, Hungaryfirstname.lastname@{epfl.ch, wichita.edu, nokia.com}, [email protected]
Abstract. Wireless network operators increasingly deploy WiFi hotspotsand low-power, low-range base stations in order to satisfy users’ growingdemands for context-aware services and performance. In addition to pro-viding better service, such capillary infrastructure deployment threatensusers’ privacy with respect to their social ties and communities, as itallows infrastructure owners to infer users’ daily social encounters withincreasing accuracy, much to the detriment of their privacy. Yet, to date,there are no evaluations of the privacy of communities in pervasive wire-less networks. In this paper, we address the important issue of privacyin pervasive communities by experimentally evaluating the accuracy ofan adversary-owned set of wireless sniffing stations in reconstructing thecommunities of mobile users. During a four-month trial, 80 participantscarried mobile devices and were eavesdropped on by an adversarial wire-less mesh network on a university campus. To the best of our knowledge,this is the first study that focuses on the privacy of communities in adeployed pervasive network and provides important empirical evidenceon the accuracy and feasibility of community tracking in such networks.
1 Introduction
Every day, mobile operators collect large amounts of users’ data that is minedfor commercial and performance goals, such as billing, throughput, coverage andusage statistics. In addition to the explicit information (such as cost, duration,location) that can be derived from the communications, operators and infrastruc-ture owners are able to gain additional knowledge based on the communicationand contextual patterns, without any action from the user for this regard [20,23].
? The co-author was with EPFL when this work was accomplished.

Users’ home/work locations [20,23], activities [31], interests [33] and social net-works [10,30] can be inferred from their location and social interactions, muchto the detriment of not only their own privacy, but also to that of their peers.
More recently, telecom manufacturers have also added support for seam-less, low-cost, wireless device-to-device communications, such as Nokia InstantCommunity [37], AirDrop by Apple [2] and FlashlinQ by Qualcomm [9], thuscomplementing existing infrastructure-based communications. The possibility ofreal-time data sharing among devices, without the need for infrastructure, en-ables people to form localized and short-lived groups or communities of users,which can emerge in scenarios where the infrastructure is inadequate, expensive,untrusted or hostile [36,16]. Although still an emerging research subject in thewireless domain [39], pervasive communities and their structured networks ofinteractions are able to significantly improve the performance of opportunisticnetworks [26,8], by leveraging on the structural properties and patterns of theevolving user interactions. In the literature, there are several routing and packet-forwarding algorithms [25,27,8] that exploit the underlying evolving social inter-actions to improve the network performance, mostly based on the frequency ofrecorded Bluetooth encounters. Similarly, social communities have been studiedfrom the behavioral perspective [10,14,19], in order to analyze people’s prefer-ences and group formation characteristics. The undoubted value of friendshipnetworks and social ties to service providers such as Facebook and Twitter hasalso dramatically increased their monetary value [7], as more and more targetedadvertisements and tailored services are being proposed to groups of users withsimilar attitudes and interests.
In spite of the soaring interest for the analysis and exploitation of perva-sive communities in the wireless domain, in regard to privacy very little hasbeen achieved. Privacy of communities and their members is a major concern inregions where the ability to keep such information from being inferred by un-scrupulous third-party providers or suppressive governments is critical [36,16].Furthermore, the increased availability of public WiFi hotspots and the rapiddeployment of low-power and low-range cellular base stations (femtocells) [15]makes such inference even more accurate, as more precise user proximity datacan be collected, regardless of the kind of upper-layer protocols and applications.The risks of unsolicited user profiling, data censorship, racial discrimination andpolitical repression, based on users’ physical proximity derived from short-rangecommunications, are a major concern. Because most of the existing literature oncommunities in wireless networks has been primarily focused on performance orhuman behavior, to the best of our knowledge there is no single empirical workthat has addressed the issue of the privacy of communities in deployed wirelessnetworks.
In this paper, we address the problem of community privacy by taking acomparative analysis of the exposure of social relationships and encounters in adeployed wireless peer-to-peer (P2P) network. Over a four-month trial (March-June 2011) with 80 participants, we studied and quantified the extent of leak-age of private community information by users, by providing empirical evidence
2

about the network or infrastructure owner’s accuracy of reconstruction of thesocial communities of people. Our work is unique in three respects:
– We provide the first privacy analysis of the extent of exposure of communityinformation in a deployed wireless network.
– We experimentally evaluate and compare the wireless sniffing stations owner’saccuracy of reconstruction of the social communities of people, based on theobserved traffic patterns, with the local proximity and encounter data thatis collected by the mobile devices.
– We characterize the evolution of the social interactions among the partici-pants and evaluate the strength of their interactions by implementing threedifferent social interaction measures that take into account the number, theproximity, the recency and aging effects of social relationships in the under-lying wireless network.
The remainder of the paper is organized as follows. In Section 2 we introduceand detail the trial framework, its system and network models, whereas in Section3 we outline the community and privacy analysis. In Section 4 we present theresults of the analysis of communities and their privacy vis-a-vis the externaladversary. We discuss the related work in Section 5. We conclude the paper andsuggest ideas for further work in Section 6.
2 Trial Setup
During four months (March-June 2011), we conducted a large-scale trial with80 participants on the EPFL university campus, in order to collect encounterand proximity data. Similarly to previous data collection campaigns [18,22,13],we programmed and distributed 80 Nokia N900 smartphones to the volunteeringparticipants, sampling a coherent population of master’s students and instructorsof two classes taught during the spring semester. The participants were asked tocarry their device with them as frequently as possible, and they were allowed touse it as their primary phone. The complete description of the goals and methodsof the questionnaires and interviews is described in [1]. At the end of the trial,we obtained useful information from 66 devices, amounting to almost ten GBs ofcollected log data and over 8 million packets captured by the adversarial network.The remaining 14 devices were either not used regularly or did not collect thedata properly, hence they were excluded from the analysis.
2.1 Device Configuration
The Nokia devices were configured with both standard infrastructure-based com-munications, such as cellular and WiFi, as well as with a novel WiFi-based P2Ptechnology, called Nokia Instant Community or NIC [37]. Users could connectto both standard Internet services using the WLAN or cellular interface of thedevice, as well as to an experimental context-aware wireless P2P messaging plat-form − in order to exchange information with their physical neighbors in a P2P
3
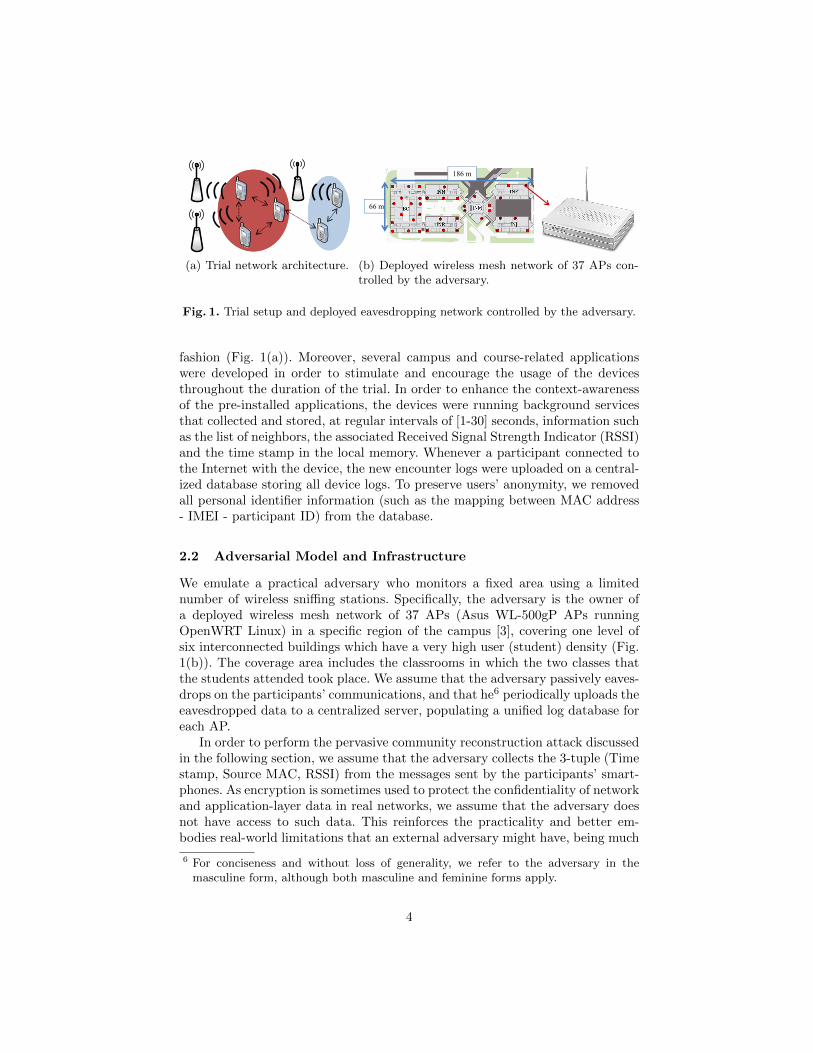
(a) Trial network architecture.
66 m
186 m
(b) Deployed wireless mesh network of 37 APs con-trolled by the adversary.
Fig. 1. Trial setup and deployed eavesdropping network controlled by the adversary.
fashion (Fig. 1(a)). Moreover, several campus and course-related applicationswere developed in order to stimulate and encourage the usage of the devicesthroughout the duration of the trial. In order to enhance the context-awarenessof the pre-installed applications, the devices were running background servicesthat collected and stored, at regular intervals of [1-30] seconds, information suchas the list of neighbors, the associated Received Signal Strength Indicator (RSSI)and the time stamp in the local memory. Whenever a participant connected tothe Internet with the device, the new encounter logs were uploaded on a central-ized database storing all device logs. To preserve users’ anonymity, we removedall personal identifier information (such as the mapping between MAC address- IMEI - participant ID) from the database.
2.2 Adversarial Model and Infrastructure
We emulate a practical adversary who monitors a fixed area using a limitednumber of wireless sniffing stations. Specifically, the adversary is the owner ofa deployed wireless mesh network of 37 APs (Asus WL-500gP APs runningOpenWRT Linux) in a specific region of the campus [3], covering one level ofsix interconnected buildings which have a very high user (student) density (Fig.1(b)). The coverage area includes the classrooms in which the two classes thatthe students attended took place. We assume that the adversary passively eaves-drops on the participants’ communications, and that he6 periodically uploads theeavesdropped data to a centralized server, populating a unified log database foreach AP.
In order to perform the pervasive community reconstruction attack discussedin the following section, we assume that the adversary collects the 3-tuple (Timestamp, Source MAC, RSSI) from the messages sent by the participants’ smart-phones. As encryption is sometimes used to protect the confidentiality of networkand application-layer data in real networks, we assume that the adversary doesnot have access to such data. This reinforces the practicality and better em-bodies real-world limitations that an external adversary might have, being much
6 For conciseness and without loss of generality, we refer to the adversary in themasculine form, although both masculine and feminine forms apply.
4
1. Trial and real-time Data Collection
1. Trial and real-time Data Collection
2. Social Interaction
Characterization
2. Social Interaction
Characterization
3. Social Graph and Community
Analysis
3. Social Graph and Community
Analysis4. Privacy Evaluation4. Privacy Evaluation
1
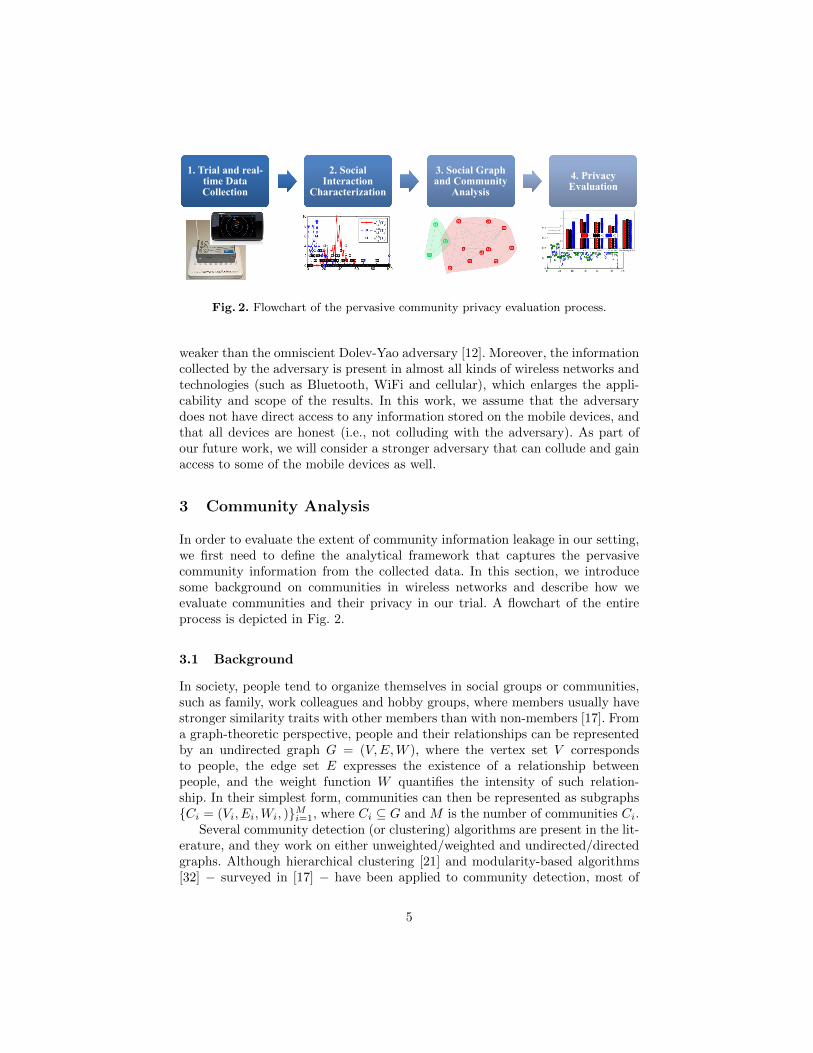
Fig. 2. Flowchart of the pervasive community privacy evaluation process.
weaker than the omniscient Dolev-Yao adversary [12]. Moreover, the informationcollected by the adversary is present in almost all kinds of wireless networks andtechnologies (such as Bluetooth, WiFi and cellular), which enlarges the appli-cability and scope of the results. In this work, we assume that the adversarydoes not have direct access to any information stored on the mobile devices, andthat all devices are honest (i.e., not colluding with the adversary). As part ofour future work, we will consider a stronger adversary that can collude and gainaccess to some of the mobile devices as well.
3 Community Analysis
In order to evaluate the extent of community information leakage in our setting,we first need to define the analytical framework that captures the pervasivecommunity information from the collected data. In this section, we introducesome background on communities in wireless networks and describe how weevaluate communities and their privacy in our trial. A flowchart of the entireprocess is depicted in Fig. 2.
3.1 Background
In society, people tend to organize themselves in social groups or communities,such as family, work colleagues and hobby groups, where members usually havestronger similarity traits with other members than with non-members [17]. Froma graph-theoretic perspective, people and their relationships can be representedby an undirected graph G = (V,E,W ), where the vertex set V correspondsto people, the edge set E expresses the existence of a relationship betweenpeople, and the weight function W quantifies the intensity of such relation-ship. In their simplest form, communities can then be represented as subgraphs{Ci = (Vi, Ei,Wi, )}Mi=1, where Ci ⊆ G and M is the number of communities Ci.
Several community detection (or clustering) algorithms are present in the lit-erature, and they work on either unweighted/weighted and undirected/directedgraphs. Although hierarchical clustering [21] and modularity-based algorithms[32] − surveyed in [17] − have been applied to community detection, most of
5

them lack a fundamental characteristic that is intrinsic to social communities.People are often members of several communities at the same time, such asfriends, family members and work colleagues, and most of the aforementionedalgorithms assign a single vertex to only one community. In order to allow avertex to be assigned to multiple (possibly overlapping) communities, Palla etal. [35] developed a technique, the Clique Percolation Method (CPM), which al-lows different communities to share vertices. The idea is that communities areformed by the union of adjacent k-cliques (complete graphs with k vertices),where two k-cliques are adjacent if they share k − 1 vertices. Due to the socialnature of our trial and the experimental setting, we use the CPM algorithm todetect pervasive communities based on physical proximity and encounter data.
After the pervasive communities have been discovered, several privacy-sensitivestatistics can be obtained from the community structure, their overlap and theirmembers. We describe the relevant statistics in Section 3.3.
3.2 Trial Framework
In order to model the collected encounter data using a graph, hereafter we de-scribe the type of information that is used in order to define the existence andintensity of relationships between users.
Trial Data In our trial, we have two sources of proximity information: (i) thelocal device logs collected by the mobile devices and containing encounter (listof neighbors, the time stamps and the RSSI values of received packets), and(ii) the adversarial (sniffing) logs containing the headers of the packets sent bythe mobile devices, which include the time stamps and RSSI values of receivedpackets at the sniffing stations, as well as the device ID of the sender.
We use these two data sources in order to formulate the “strength” or in-tensity of the social relationships between users and to define the weights ofthe edges connecting the respective vertices in the social graph G = (V,E,W ).There are two types of proximity information in our network: device-to-deviceRSSI data (collected on the devices) and device-to-AP RSSI data (collected bythe adversary). From the local device logs, we can directly obtain the device-to-device proximity information because the recorded RSSI values on the receiv-ing device depend on the real distance to the sending device. However, this isnot exactly the case for the RSSI values recorded by the adversarial network,as they depend on the distance between the sending device and the receivingsniffing station, and not the receiving mobile device. Therefore, the adversaryneeds to derive the device-to-device proximity information from the device-to-AP RSSI values. Hence, we first need to estimate the position of a device, andthen compute the device-to-device proximity information in order to determinethe weights between vertices of the social graph.
To this end, we developed a robust localization algorithm based on RSSI tri-lateration [5], which determines the estimated position of a received packet basedon the RSSI at all sniffing stations that received that packet. Using the position
6
estimate, we then compute the distance and RSSI between mobile devices, asdescribed later in this section.
Social Interaction Intensity We define three distinct weight functions {w(d)i,j }3d=1
between the vertices i, j ∈ V , taking progressively into account the proximity,the intensity and the aging and recency of the relationships between users. We di-vide the timeline of the trial into discrete time intervals {Tk}Nk=1, where N = 120days, and for each day Tk we define the weights wi,j(Tk)(d) between users i, j.
The first and simplest weight function is the (shifted, non-negative) averageof the RSSI value between a pair of users i, j for each day Tk, defined as
wi,j(Tk)(1) =
1
ci,j(Tk)·ci,j(Tk)∑q=1
RSSIi,j(Tk, q)
− rmin
where ci,j(Tk) is the sum of the number of packets received by i (and sent byj) and received by j (and sent by i) during the day Tk, RSSIi,j(Tk, q) is theRSSI value of a packet q received by a user i (and sent by j) or received by j(and sent by i) during the day Tk, and rmin is the minimum RSSI value thatwas recorded during the trial. For instance, we fix rmin = −100 dBm as no RSSIvalues lower than −100 dBm have been recorded by any device. Apart from theintensity, this weight function does not consider the duration of the encounters(as it normalizes the intensity by the number of packets) between users or anyaging or recency effect.
The second weight function takes into account the duration of the encountersthrough the sum of the (shifted, non-negative) RSSI values between users i, j,for each day Tk. It is defined as
wi,j(Tk)(2) = ci,j(Tk) · wi,j(Tk)(1) =
ci,j(Tk)∑q=1
(RSSIi,j(Tk, q)− rmin)
As the devices who are in continuous radio contact automatically exchange morecontext messages than the non-connected devices, this weight function takes intoaccount the duration of the contacts, in addition to their intensity.
As communities of mobile devices are dynamic and evolve over time, thethird weight function captures the natural evolution of social relationships be-tween individuals, where past experience, recency and current state determinethe intensity of interactions among people [34]. In this way, two users that havespent much time together in the past, but have not met on a given day, wouldstill keep a relationship during that day (which is not the case for wi,j(Tk)(1) andwi,j(Tk)(2)), even if its intensity is lower due to the aging effect − thus avoidingstrong temporal fluctuations. Inspired by the formulations in [34,38], we definethe third weight function as
wi,j(Tk)(3) = 1ci,j(Tk)>0
(τ · w(3)
i,j (Tk−1) + (1− τ) · γi,j(Tk))
(1)
+ (1− 1ci,j(Tk)>0) ·(w
(3)i,j (Tke) · θi,j(Tk, Te)
)
7

where
γi,j(Tk) =1
α· wi,j(Tk)(2)
θi,j(Tk, Te) = exp
(− λ(Tk − Te)
1 +∑min(Tk−Te,Te)
r=0 mi,j(Te − r)
)
mi,j(Tk) =
{1 if γi,j(Tk) > β
0 otherwise
and 1ci,j>0 is the indicator function, 0 ≤ τ ≤ 1 is the aging coefficient, α > 0 isthe normalization factor, 0 < λ ≤ 1 is the temporal decay value, 0 ≤ Te ≤ Tk−1is the last day before Tk when users i, j exchanged messages, mi,j(Tk) ∈ {0, 1}is the recency factor that indicates whether a meeting took place during Tk ornot, and β ≥ 0 is the meeting threshold value. The idea behind the formulationis the following: If users i, j exchanged at least one message on a day Tk, thenthe weight of their edge is an exponential moving average of the aged weight− accumulated up to the day before (Tk−1) − and the recent day’s weight; onthe contrary, if i, j did not exchange any message on day Tk, the current day’sweight is a function of the previously accumulated weight, the frequency of theirencounters just before the last encounter and the amount of time between thelast time i, j had exchanged messages (Te) and the current day Tk.
The weight functions can be directly applied to the local-device proximityinformation, as the available proximity information (time stamps, RSSI valuesfrom neighboring devices and their IDs) are sufficient for their computations.However, an intermediate step is required in order to compute the weights byusing the external (adversarial) proximity information (time stamps, RSSI valuesfrom devices to sniffing APs and device IDs). In the following we show how touse the external proximity information in order to compute the edge weights.
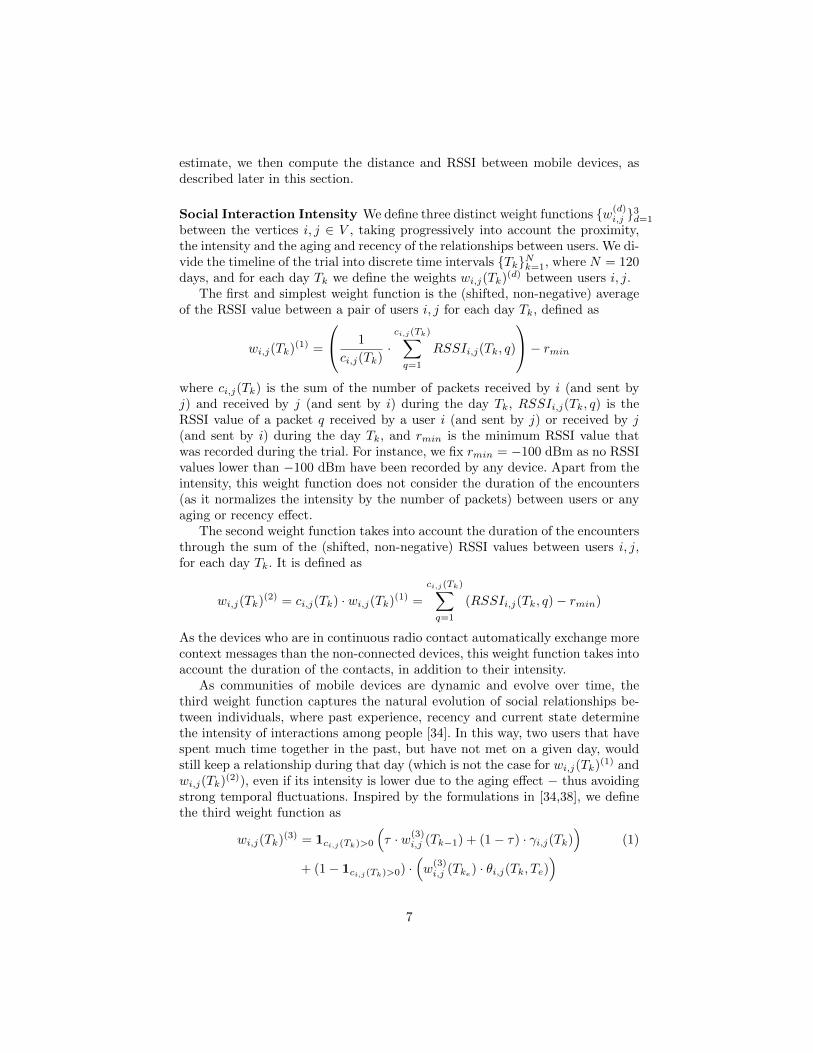
User-Distance Estimation by the Adversary As the adversary does nothave access to device-to-device proximity data, he can decide to only use the esti-mated positions of a user i in a day Tk, defined as Pi(Tk) = {pi(Tk, 1), . . . , pi(Tk, b)},where b is the number of subintervals of a day Tk and pi(Tk, z) = (xi(Tk, z), yi(Tk, z)) ∈R2 is the estimated position of user i in the subinterval z of day Tk. Moreover,because there is a possibility that a user’s packet may not be detected in eachsubinterval z, due to mobility or radio interference, we assume that the last po-sition estimate pi(Tk, zlast) of a user i is valid in f subsequent subintervals, if no{pi(Tk, zlast + 1), . . . , pi(Tk, zlast + f)} are available (Fig. 3).
With such information, the adversary computes the edge weights as follows:
(1) ∀z ∈ {1, . . . , b}, compute pi(Tk, z) for all users i observed on day Tk.
(2) ∀z ∈ {1, . . . , b}, compute the estimated Euclidian distance di,j(Tk, z) =||pi(Tk, z)− pj(Tk, z)|| between any two users i, j observed on day Tk.
8
z = 1z = 1 + f
z = 1 + f + 1
f = 1 subinterval
ij
u
j i
u
r w
j i
di,j(Tk,z)
di,u(Tk,z)
d u,j(T k,z
)
d u,i(T
k,z)
di,j(Tk,z)
du,j (T
k ,z)
Fig. 3. Users’ positions estimates by the adversary. In this example, the adversaryhas the position estimate of user u at z = 1 but not at subsequent subintervals. Inthis case, u’s last position estimate (at z = 1) is assumed to be valid in f subsequentsubintervals. Here f = 1.
(3) ∀z ∈ {1, . . . , b}, compute the estimated RSSI value according to the adaptedHaka-Okumura model for indoor radio propagation [6]
RSSIi,j(Tk, z)[dBm] = Pt + 20 log
(λ
4π
)+ 10n log
(1
di,j(Tk, z)
)where Pt = 20 [dBm] is the transmission power of the mobile device, λ =0.125 [m] is the wavelength, n = 4.8 is the path-loss exponent suited foroffice environments such as the university buildings under observation. The
RSSIi,j(Tk, z) value replacesRSSIi,j(Tk, q) in the weight functions w(d)i,j (Tk),
where z ∈ {1, . . . , b}.
Weight Distributions Due to the different features of a social relationshipthat each weight function models, their numeric values fall in different domains.
For example, if α = 100, β = 1, λ = τ = 0.5 we have 0 ≤ w(1)i,j < rmin,
0 ≤ w(2)i,j < 2.5 · 105 and 0 ≤ w
(3)i,j < 600. It is therefore necessary to put them
on the same scale for the identification of communities, as simply comparingthe absolute values of the three weight functions is pointless. Hence, rather thancomparing absolute values, we compare the weight distributions relative to themaximum of each weight function for each day Tk. To this end, we select an
equal number of bins I(d) for each weight function w(d)i,j (Tk). We then count the
number of weight values that fall inside each such bin for all weight types, andwe compare the distributions.
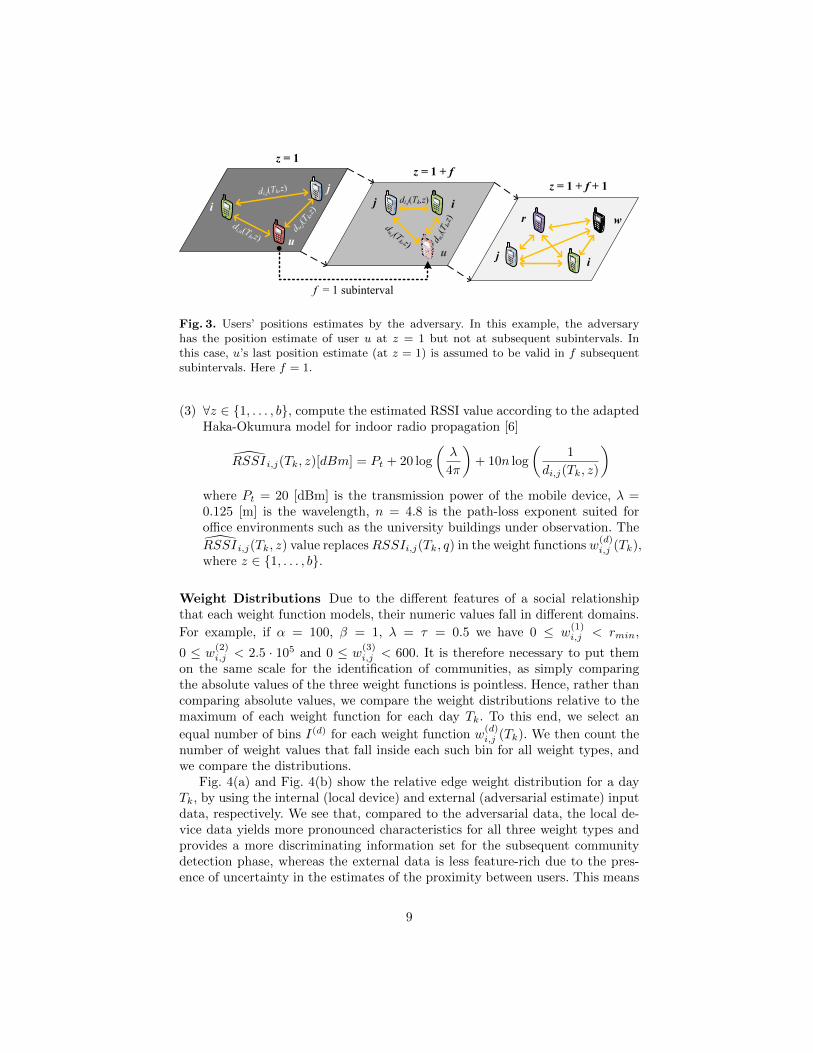
Fig. 4(a) and Fig. 4(b) show the relative edge weight distribution for a dayTk, by using the internal (local device) and external (adversarial estimate) inputdata, respectively. We see that, compared to the adversarial data, the local de-vice data yields more pronounced characteristics for all three weight types andprovides a more discriminating information set for the subsequent communitydetection phase, whereas the external data is less feature-rich due to the pres-ence of uncertainty in the estimates of the proximity between users. This means
9

0 20 40 60 80 1000
2
4
6
8
10
Relative edge weights, from 1 = min to 100 = max
Num
ber
of o
ccur
renc
es
wi,j(1)(T
k)
wi,j(2)(T
k)
wi,j(3)(T
k)
(a) Using internal (local device) inputdata.
0 10 20 30 40 500
2
4
6
8
10
Relative edge weights, from 1 = min to 50 = max
Num
ber
of o
ccur
renc
es
wi,j(1)(T
k)
wi,j(2)(T
k)
wi,j(3)(T
k)
(b) Using external (adversarial estimates)input data.
Fig. 4. Relative edge weight distribution for different input data sets.
that the adversary will likely struggle to infer with high accuracy the communitycharacteristics for that day. We quantify such inaccuracies in Section 4.
Next, we describe the method we adopted to evaluate the extent of commu-nity information leakage and the related privacy measures.
3.3 Communities and Privacy
Having quantified the social interaction intensity as edge weights between anytwo trial participants, we now outline the community detection process, thesuitable community statistics and privacy measures used to evaluate communityprivacy in our work.
Community Detection In its simplest form, the CPM community detectionalgorithm is defined for undirected and unweighted graphs [34], thus requiringonly connectivity between vertices in order to discover communities. However,in order to consider the “strength” of the interactions between vertices, it wasextended to work on weighted graphs by the use of a threshold weight w∗. Inits weighted version, the CPM algorithm considers the existence of an edge ei,j
between two vertices i, j if and only if the weight w(d)i,j > w∗. In order to determine
the threshold weight w∗, Palla et al. propose to choose a value such that “thelargest community becomes twice as big as the second largest one”[35], which isbelow the critical value w∗crit for which a giant connected component arises [11].
In our experiment, we calibrated the {w∗q}Tq=1 threshold values on a per-daybasis, instead of keeping the same w∗ throughout the trial. Because most of theparticipants followed one specific class that took place on Wednesdays, and theremaining days they might or might not have followed any common classes, weregistered high RSSI proximity values on course days and more sparse valueson non-course days. Hence, the per-day threshold {w∗q}Tq=1 was better suited forsuch bi-modal proximity patterns.
10

7
79
64
(a) Communities inferred by using inter-nal data.
79
64
7
(b) Reconstructed communities by the ad-versary.
Fig. 5. Detected communities on a day Tk based on internal (local device) and exter-nal (adversarial estimates) data, respectively. The larger vertices are present in bothcommunity sets.
To illustrate the output of CPM, Fig. 5(a)7 and 5(b) show an example ofthe detected communities on a given day, based on the internal data and theobservations of the adversary respectively. As it can be seen, some communitiesdetected by the adversary are not present in the internal case; there is however anoverlap between the members (the larger vertices) of the two sets of communities.We discuss and quantify this difference in Section 4.
Community Statistics In addition to detecting communities and their mem-bers, we compute five privacy-relevant and common community statistics {S(i)(Tk)}5i=1
that will be compared in the accuracy evaluation process. In particular, for eachday Tk of the trial we compute and compare the following statistics: S1 is thecommunity degree (the number of edges shared between two communities), S2
is the distribution of the community size (the number of members of each com-munity), S3 is the community density (proportion of edges out of all possibleedges relative to the sparsest set with |Ci| − 1 vertices), S4 is the ratio of totalout- and in-degree of communities and S5 is the community membership value(the number of communities a vertex belongs to). The difference between theresults obtained using the internal and external input data is defined by Eq. (2)as the ratio between the absolute difference of the observed statistics over themaximum value
∆Si(Tk) =|Sext
i (Tk)− Sinti (Tk)|
max∀Tk
(Sexti (Tk), Sint
i (Tk)) (2)
We have ∆Si(Tk) = 0 when the adversary’s statistics is exactly the same as thestatistics obtained using the internal proximity data, and ∆Si(Tk) = 1 when the
7 The figure is obtained by using the CFinder application developed by the authorsof the CPM algorithm, freely available on www.cfinder.org.
11
two statistics have the largest discrepancy (or lowest similarity). We define theadversary’s accuracy in inferring the community statistics as 1−∆Si(Tk).
Community Privacy In addition to the differences in statistics ∆Si(Tk), itis crucial to assess the similarity of the community composition in order toascertain in a comprehensive way the privacy leakage of community information.To this end, we compute the well-established Jaccard index measure [28] forcommunity similarity on each day Tk, which is a statistic that computes thesimilarity between two sample sets (or communities) Ci, Cj , where values closeto zero mean that the adversary did not accurately infer the communities andtheir members, whereas values close to one indicate a very good adversarialaccuracy in inferring the same communities. The Jaccard index is defined as
J(Ci, Cj , Tk) =|Ci(Tk)
⋂Cj(Tk)|
|Ci(Tk)⋃Cj(Tk)|
(3)
In order to evaluate the adversary’s accuracy of reconstruction of the com-munities in our pervasive network, we compute the Jaccard index on each dayTk between the communities Ci(Tk), detected using internal device data, versusthe reconstructed communities Cj(Tk), detected using the adversarial estimatedproximity information. Given J(Ci, Cj , Tk) for each i, j on a day Tk, we definethe Jaccard index matrix JMat(Tk), where each element of the matrix is definedas JMat(Tk)i,j = J(Ci, Cj , Tk), i.e., the Jaccard index for all pairs of communi-ties Ci and Cj . Without having access to the internal data, the adversary has noprior knowledge about which community Ci corresponds to which reconstructedcommunity Cj . Therefore, in order to consider the best possible match for anypair of internal/reconstructed communities for each day Tk, we choose the match(Ci(Tk), Cj(Tk)) that maximizes JMat(Tk)i,j . We then compute the aggregatedJaccard index over all such best matches as
JI(Tk) = avg∀i
(max∀j
(JMat(Tk)i,j)
)(4)
for each day Tk of the trial where there is at least one community detected byusing both the internal and adversarial proximity information.
In the next section we quantify the community privacy leakage by computingthe accuracy measure 1 − ∆Si(Tk), and similarity JI(Tk) for each day Tk and
weight function {w(d)i,j }3d=1, comparing the results obtained using the internal
(local device) and external (adversarial) input data respectively.
4 Privacy Evaluation
In this section we provide the experimental evaluation of the privacy of perva-sive communities through a comparative analysis of the adversary’s accuracy ofreconstruction of both community statistics and memberships. First, we eval-
uate the privacy across the three weight functions {w(d)i,j }3d=1 (inter-weight ac-
curacy), by comparing the similarity between communities and the accuracy of
12

0 20 40 60 80 100 1200
0.1
0.2
0.3
0.4
0.5
Day Tk since beginning of trial
JI (
T k)
w
i,j(1)(T
k) w
i,j(2)(T
k) w
i,j(3)(T
k)
(a) Community memberships similarity.
Degree Size Density In/Out Ratio Membership Value0
0.2
0.4
0.6
0.8
1
Community Statistics Si
% A
ccur
acy
over
Tri
al D
urat
ion
wi,j(1) w
i,j(2) w
i,j(3)
(b) Community statistics accuracy.
Fig. 6. Adversary’s accuracy of reconstruction of the pervasive communities for thethree weight functions.
their statistics obtained by using the internal (local device) proximity informa-tion with the external (adversarial estimates) data collected by the set of wirelesssniffing stations. This will allow us to observe the evolution of the accuracy whileincreasing the sophistication of the weight functions, taking progressively into ac-count several features of human and social behavior such as proximity, intensity,aging and recency of social relationships. Second, we perform an intra-weight
comparison for the more realistic weight function w(3)i,j , in order to characterize
the effect of the aging factor τ on the similarity and accuracy of communityreconstruction attained by the adversary.
Fig. 6 and 7 show the adversarial reconstruction similarity and accuracyresults with respect to the communities detected using internal data, for theinter-weight and intra-weight scenarios respectively. For Fig. 6(a) and 7(a), avalue of JI(Tk) = 0 means that on day Tk there were no communities detectedeither using the internal proximity data or the external one. The complete list ofthe experimental parameters − selected in order to provide as much informationas possible − can be found in the Appendix, which is provided as a supportingfile to this document.
4.1 Inter-Weight Accuracy
By observing Fig. 6(a), we first notice that the adversary is able to correctlyreconstruct communities and identify their members in 20%− 40% of the cases,compared to the communities detected by using internal proximity data. Ingeneral, we observe that there is a significant difference in terms of similarity
results between the first two weight functions w(1)i,j , w
(2)i,j and the third function
w(3)i,j . The former two functions are solely based on the observations made on
each particular day and independently of what happened in the previous days.Therefore one noticeable characteristic is the increased fluctuations in the simi-larity from one day to the other, which is a much less visible aspect for the latter
weight function. As w(1)i,j , w
(2)i,j are very exposed to the periodicity of the course
schedule of the participants, the adversary’s similarity of reconstruction of the
13

0 20 40 60 80 100 1200
0.1
0.2
0.3
0.4
Day Tk since beginning of trial
JI (
T k)
w
i,j(3)(T
k,τ = .25) w
i,j(3)(T
k,τ = .5) w
i,j(3)(T
k,τ = .75)
(a) Community memberships similarity.
Degree Size Density In/Out Ratio Membership Value0
0.2
0.4
0.6
0.8
1
Community Statistics Si
% A
ccur
acy
over
Tri
al D
urat
ion
wi,j(3)(τ = .25) w
i,j(3)(τ = .5) w
i,j(3)(τ = .75)
(b) Community statistics accuracy.
Fig. 7. Adversary’s accuracy of reconstruction of the pervasive communities for threedifferent values of the aging factor τ .
actual communities and their members greatly depends on the amount of datacollected by his wireless mesh network. We notice that for the days when moststudents attended a particular class, the reconstruction similarity is higher (upto 40%) than for days in which students do not attend classes together. Henceeven the two basic weight functions are able to provide a sensible similarity tothe adversary when the users’ movements are tracked by several sniffing stationssimultaneously.
Contrary to w(1)i,j and w
(2)i,j , w
(3)i,j is able to capture more proximity information
and allow the CPM algorithm to detect communities on the days in which theother two weight functions were unable to provide a sufficient amount of data.At the same time, however, the peaks of similarity tend to be much lower (25%)
compared to the other functions. This suggests that w(3)i,j , while being able to
produce more community information with scarce data, performs worse in theidentification of the members in each community.
Regarding the difference in community statistics, depicted in Fig. 6(b), we
observe a better accuracy for w(3)i,j compared to w
(1)i,j and w
(2)i,j . In four out of
five community statistics, w(3)i,j has an almost 40% better accuracy compared
to the other functions, which indicates that the former function provides betterresults on a higher structural community level rather than on an lower, individualcommunity member level.
In general, we observe that all three weight functions are better able toproduce accurate community statistics (Fig. 6(b)) than to identify the correct
community members (Fig. 6(a)). In particular, w(3)i,j shows that it is possible to
achieve very accurate community statistics only by relying on externally collecteddata, thus shrinking the discrepancy between the community statistics based oninternal data and adversarial’s estimates down to 9%. This result indicates that,by collecting and analyzing radio information passively and without access tothe devices themselves, an adversary is able to breach the privacy of communityinformation very successfully, although the more fine-grained identification ofmembers of any given community remains a more challenging task.
14

4.2 Intra-Weight Accuracy
Fig. 7(a) shows the adversary’s performance in correctly identifying the commu-
nities and their individual members when using w(3)i,j with three different values of
the aging factor τ = {.25, .5, .75}. According to its definition in Eq. (1), we assign
an increasing coefficient to the past accumulated weight information w(3)i,j (Tk−1)
in the computation of the current day’s weight function w(3)i,j (Tk). The goal is to
study the effect of the “retention” of the intensity from the past on the privacy(or lack thereof) of community information.
One recurring characteristic, present also in the inter-weight comparison, isthat the CPM algorithm detects communities in all days of the trial, indepen-dently of the amount of information available to the adversary on each particularday, even for a small value of τ . When τ = .25, as expected the similarity fluc-tuates more when compared to τ = .5, especially at the beginning of the trial.
However, Fig. 7(a) shows that the stabilization of the similarity is not achievedby simply increasing the value of τ from .25 to .75; in fact, for the intermediatevalue of τ = .5, we notice that the fluctuations are less pronounced than for asmaller or larger value. This suggests that, for relatively small or large values ofthe aging factor, the similarity achieved by the adversary tends to diverge morefrequently from steady values, indicating that a stable value for the aging factoris more likely to be in the middle of the possible values [0.25,0.75], rather than atany of the extremes. When τ = .75, the adversarial similarity increases sharplyas the time passes, especially towards the end of the trial. This is somewhatsurprising, as we would expect that by increasing the emphasis on the past −rather than on the current weight information − the similarity would be morestable when going through the trial. This is an interesting aspect to consider infurther studies on our community data.
When observing the results on the accuracy of the community statistics, asshown in Fig. 7(b), we notice that, among the three considered values of τ , τ = .5is the least accurate, compared to smaller or larger values of τ . Moreover, in fourout of five statistics, the largest value of τ = .75 produces the best accuracy onaverage over the trial duration. This suggests that, although not convergingtowards a stable interval for the accuracy in identifying the communities andtheir members, putting more emphasis on the past accumulated information doesincrease (on average) the adversary’s accuracy in computing correct communitystatistics using only passively collected data from fixed WiFi access points.
Overall, the results indicate that although less stable and more accurate atinferring community structures, emphasizing the past yields better accuracy forboth community detection, identification of their members and for generic com-munity statistics. This finding in particular is concerning in regard to privacy, asthe amount of individual and community data that is collected by external par-ties might provide very accurate statistics, especially for group and community-targeted services. These results are significant, as they show how the messagesource ID, contained in almost any kind of radio message, not only is enough to
15

provide accurate social community statistics, but it is also sufficient to success-fully infer almost half of the members of such communities.
5 Related Work
The structural properties of short-lived communities in pervasive networks havebeen recently investigated from the performance [26,8] and routing [25,27,8]perspectives; the authors of [10,14,19] investigated similar issues on the socio-behavioral level while studying people’s preferences and group formation char-acteristics. For instance, it is shown that performance of packet-forwarding al-gorithms could greatly benefit from the human mobility and sporadic natureof inter-contacts [26], as the different connection frequencies between membersof the same community with respect to members of other communities couldsignificantly improve intra-community packet-forwarding while not disruptinginter-community communications. Similarly, [27] shows how forwarding perfor-mances similar to state-of-the-art algorithms could be achieved at a sensiblylower resource utilization if structural properties of communities are considered.
With respect to privacy, several works on location privacy address the riskand propose protection mechanisms for users’ locations [4,24,29]. These contri-butions focus mostly on individual mobile users and their current neighbors.However, to the best of our knowledge, there is no prior study on the increas-ingly important issue of pervasive community privacy and its evaluation on adeployed network. This work constitutes the first building block for analyzingcommunity privacy issues in pervasive networks.
6 Conclusion and Future Work
In this paper, we have addressed the important aspect of community privacyin pervasive networks. We have conducted an experimental analysis of the ad-versary’s accuracy of reconstruction, on one hand, of the communities and theirindividual members and, on the other hand, of the generic community statisticsthat are less dependant on the correct identification of individual users insidesuch communities.
Through a fine-grained characterization of the intensity of social contactsamong people, we quantified the accuracy in both community reconstruction andcommunity statistics for the whole duration of the trial, showing that even basicsocial intensity functions capture very accurately the generic statistics, such asthe degree of a community, its size and density of links. However, reconstructingmore specific information about the composition of each community and theirindividual members remains more challenging, even when using a more com-prehensive model for characterizing the intensity of social relationships, whichconsiders recency, aging, and contact frequency in addition to proximity andduration. As a result, there is a substantial risk that accurate community infor-mation may be easily collected, inferred and misused by external third-parties,much to the detriment of users’ community privacy.
16

Our results provide empirical evidence about the two distinct levels of com-munity information leakage to external observers, who may be able to infer withhigh accuracy the different social groups and generic communities of people inpervasive networks, while being much less accurate in determining the affiliationof any particular individual to a community. As part of our future work, weintend to pursue the analysis of this dual flow of community information leakageand derive mitigation mechanisms in order to reduce information leakage andthe gap between the accuracy of both generic statistics and specific people’s af-filiations to communities. We also intend to study the adversary’s accuracy ofclassification of the communities and their members based on the type of theirrelationship, such as friends, classmates, study group and strangers.
References
1. Imad Aad, Murtuza Jadliwala, Igor Bilogrevic, Valtteri Niemi, Jean-PierreHubaux, Philip Ginzboorg, and Kari Leppnen. Nokia Instant Community atEPFL: a real-world large-scale wireless peer-to-peer trial. Technical Report EPFL-REPORT-170421, 2011.
2. Apple AirDrop. http://www.apple.com/macosx/whats-new/.3. Aziala-net. http://icawww1.epfl.ch/aziala/index.html.4. A.R. Beresford and F. Stajano. Location privacy in pervasive computing. IEEE
Perv. Comp., 2, 2003.5. Laurent Bindschaedler*, Murtuza Jadliwala*, Igor Bilogrevic, Imad Aad, Philip
Ginzboorg, Valtteri Niemi, and Jean-Pierre Hubaux. Track Me If You Can: On theEffectiveness of Context-based Identifier Changes in Deployed Mobile Networks.In NDSS, 2012.
6. A. Bose and C.H. Foh. A practical path loss model for indoor wifi positioningenhancement. In Int. Conf. on Inform., Comm. & Signal Proc., 2007.
7. Business Week. Facebooks value tops amazon.com; trails only googleon web. http://www.businessweek.com/news/2011-01-28/facebook-s-value-tops-amazon-com-trails-only-google-on-web.html.
8. A. Chaintreau, P. Hui, J. Crowcroft, C. Diot, R. Gass, and J. Scott. Impact ofhuman mobility on opportunistic forwarding algorithms. IEEE TMC, 2007.
9. M.S. Corson, R. Laroia, J. Li, V. Park, T. Richardson, and G. Tsirtsis. TowardProximity-aware Internetworking. Wireless Communications, 2010.
10. D.J. Crandall, L. Backstrom, D. Cosley, S. Suri, D. Huttenlocher, and J. Kleinberg.Inferring social ties from geographic coincidences. Proc. Nat. Academy of Sciences,107, 2010.
11. I. Derenyi, G. Palla, and T. Vicsek. Clique percolation in random networks. Phys-ical review letters, 94, 2005.
12. D. Dolev and A. Yao. On the security of public key protocols. IEEE TIT, 29,1983.
13. N. Eagle and A. Pentland. Reality mining: sensing complex social systems. Pers.and Ubiq. Computing, 10, 2006.
14. N. Eagle, A.S. Pentland, and D. Lazer. Inferring friendship network structure byusing mobile phone data. Proc. Nat. Academy of Sciences, 106, 2009.
15. Femto Forum. http://femtoforum.org/fem2/pressreleases.php?id=277.16. M. Follman. “Bluetoothing” Iran’s revolution. Markfollman.com, 2010.
17

17. S. Fortunato. Community detection in graphs. Physics Reports, 486, 2010.
18. N.W. Gong, M. Laibowitz, and J. Paradiso. Dynamic privacy management inpervasive sensor networks. Ambient Intelligence, 2010.
19. MC Gonzalez, HJ Herrmann, J. Kertesz, and T. Vicsek. Community structure andethnic preferences in school friendship networks. Physica A: Statistical mechanicsand its applications, 379, 2007.
20. M. Gruteser and B. Hoh. On the anonymity of periodic location samples. Securityin Perv. Comp., 2005.
21. T. Hastie, R. Tibshirani, and J. Friedman. The Elements of Statistical Learning(2nd Edition). 2008.
22. T. Henderson, D. Kotz, and I. Abyzov. The changing usage of a mature campus-wide wireless network. In Int. Conf. on Mobile comp. and networking, 2004.
23. B. Hoh, M. Gruteser, H. Xiong, and A. Alrabady. Enhancing security and privacyin traffic-monitoring systems. IEEE Perv. Comp., 5, 2006.
24. J.I. Hong and J.A. Landay. An architecture for privacy-sensitive ubiquitous com-puting. In Conf. on Mobile systems, applications, and services, 2004.
25. T. Hossmann, T. Spyropoulos, and F. Legendre. Know thy neighbor: Towardsoptimal mapping of contacts to social graphs for dtn routing. In INFOCOM, 2010.
26. P. Hui, A. Chaintreau, J. Scott, R. Gass, J. Crowcroft, and C. Diot. Pocket switchednetworks and human mobility in conference environments. In ACM SIGCOMMworkshop on DTN, 2005.
27. P. Hui, J. Crowcroft, and E. Yoneki. Bubble rap: social-based forwarding in delaytolerant networks. IEEE TMC, 2010.
28. P. Jaccard. Etude comparative de la distribution florale dans une portion des alpeset du jura, 1901.
29. M. Jadliwala, I. Bilogrevic, and J.P. Hubaux. Optimizing mixing in pervasivenetworks: A graph-theoretic perspective. ESORICS, 2011.
30. S. Mardenfeld, D. Boston, S.J. Pan, Q. Jones, A. Iamntichi, and C. Borcea. Gdc:Group discovery using co-location traces. In Int. Conf. on Social Comp., 2010.
31. Y. Matsuo, N. Okazaki, K. Izumi, Y. Nakamura, T. Nishimura, and K. Hasida.Inferring Long-term User Property based on Users. In IJCAI, 2007.
32. M.E.J. Newman. Fast algorithm for detecting community structure in networks.Physical Review E, 69, 2004.
33. A. Noulas, M. Musolesi, M. Pontil, and C. Mascolo. Inferring interests from mobil-ity and social interactions. In NIPS Workshop on Analyzing Netw. and Learningw. Graphs, 2009.
34. G. Palla, AL Barabasi, and T. Vicsek. Quantifying social group evolution. Nature,446, 2007.
35. G. Palla, I. Derenyi, I. Farkas, and T. Vicsek. Uncovering the overlapping commu-nity structure of complex networks in nature and society. Nature, 435, 2005.
36. Sam Reeves. Internet is double-edged sword in arab revolts. http://middle-east-online.com/english/?id=46109, 2011.
37. Rhiain. Nokia instant community gets you social. http://conversations.nokia.com/2010/05/25/nokia-instant-community-gets-you-social/.
38. K. Xu, G.H. Yang, V.O.K. Li, and S.Y. Chan. Detecting dynamic communities inopportunistic networks. In ICUFN, 2009.
39. D. Zhang, B. Guo, B. Li, and Z. Yu. Extracting social and community intelligencefrom digital footprints: An emerging research area. Ubiq. Intell. and Computing,2010.
18