bicyclist deaths associated with motor vehicle traffic ... · death of a motorist or a nonmotorist...
TRANSCRIPT

Continuing Education examination available at http://www.cdc.gov/mmwr/cme/conted_info.html#weekly.
U.S. Department of Health and Human ServicesCenters for Disease Control and Prevention
Morbidity and Mortality Weekly ReportWeekly / Vol. 64 / No. 31 August 14, 2015
Physical activity, including bicycling, is linked with multiple health benefits (1). However, although bicycles account for only about 1% of trips across all modes of transportation, on a per trip basis, bicyclists die on U.S. roads at a rate double that of vehicle occupants (2). In 2009, an estimated 392 billion trips (across all modes) were taken in the United States, including 4.1 billion bicycle trips, and 33,808 deaths occurred on U.S roadways (across all modes), including 630 bicyclist deaths (3–5). This report examines mortality trends among cyclists using national collision data from the Fatality Analysis Reporting System (FARS) for the period 1975–2012. Annual rates for cyclist mortality decreased 44%, from 0.41 to 0.23 deaths per 100,000 during this period, with the steepest decline among children aged <15 years. In recent years, reductions in cyclist deaths have slowed. However, age-specific cyclist mortality rates for adults aged 35–74 years have increased since 1975. Multifaceted approaches to bicyclist safety have been shown to be effective in increasing bicycling while decreasing traffic injuries and fatalities (1). With U.S. adults choosing to walk and cycle more, implementation of these approaches might help counter recent increases in adult cyclist deaths.
The U.S. Department of Transportation’s National Highway Traffic Safety Administration (NHTSA) maintains the FARS database. FARS catalogs an annual census of fatal traffic crashes from the years 1975–2012 collected through agreements between NHTSA and agencies in each state. To be included in FARS, an incident 1) must involve a motor vehicle traveling on a roadway open to the public, and 2) must have resulted in the death of a motorist or a nonmotorist within 30 days of the crash.
This analysis uses FARS variables that were consistent during the period 1975–2012. Cyclist fatalities were identified using the “person type” descriptors “nonmotorist: pedalcyclist,” “nonoc-cupant bicyclist,” and “bicyclist” in the FARS “person” tables. Consistent data from the entire study period were available from
48 states (data were not available from Alaska and Hawaii) and the District of Columbia. The age and sex of the injured person as well as the state and county of the crash were collected from FARS. Annual county population, stratified by age and sex, was obtained from the National Cancer Institute’s Surveillance, Epidemiology, and End Results (SEER) program.* Age-adjusted mortality rates were calculated for each year using CDC’s pub-lished weights for the 2000 U.S. standardized population.† Data
Bicyclist Deaths Associated with Motor Vehicle Traffic — United States, 1975–2012
Jason Vargo, PhD1; Benjamin G. Gerhardstein, MPH2; Geoffrey P. Whitfield, PhD3; Arthur Wendel, MD3
* Additional information available at http://seer.cancer.gov/popdata.† Additional info available at http://stacks.cdc.gov/view/cdc/13357.
INSIDE842 Surveillance for Waterborne Disease Outbreaks
Associated with Drinking Water — United States, 2011–2012
849 Outbreaks Associated With Environmental and Undetermined Water Exposures — United States, 2011–2012
852 Suspected Palytoxin Inhalation Exposures Associated with Zoanthid Corals in Aquarium Shops and Homes — Alaska, 2012–2014
856 Notes from the Field: Investigation of Tuberculosis in a High School — San Antonio, Texas, 2012
857 Notes from the Field: Use and Interpretation of a Rapid Respiratory Syncytial Virus Antigen Detection Test Among Infants Hospitalized in a Neonatal Intensive Care Unit — Wisconsin, March 2015
858 Announcement862 QuickStats
Morbidity and Mortality Weekly Report
838 MMWR / August 14, 2015 / Vol. 64 / No. 31
The MMWR series of publications is published by the Center for Surveillance, Epidemiology, and Laboratory Services, Centers for Disease Control and Prevention (CDC), U.S. Department of Health and Human Services, Atlanta, GA 30329-4027.Suggested citation: [Author names; first three, then et al., if more than six.] [Report title]. MMWR Morb Mortal Wkly Rep 2015;64:[inclusive page numbers].
Centers for Disease Control and PreventionThomas R. Frieden, MD, MPH, Director
Harold W. Jaffe, MD, MA, Associate Director for Science Joanne Cono, MD, ScM, Director, Office of Science Quality
Chesley L. Richards, MD, MPH, Deputy Director for Public Health Scientific ServicesMichael F. Iademarco, MD, MPH, Director, Center for Surveillance, Epidemiology, and Laboratory Services
MMWR Editorial and Production Staff (Weekly)Sonja A. Rasmussen, MD, MS, Editor-in-Chief
Charlotte K. Kent, PhD, MPH, Executive Editor Jacqueline Gindler, MD, Acting EditorTeresa F. Rutledge, Managing Editor
Douglas W. Weatherwax, Lead Technical Writer-EditorTeresa M. Hood, MS, Jude C. Rutledge, Writer-Editors
Martha F. Boyd, Lead Visual Information SpecialistMaureen A. Leahy, Julia C. Martinroe,
Stephen R. Spriggs, Brian E. Wood,Visual Information Specialists
Quang M. Doan, MBA, Phyllis H. King,Teresa C. Moreland, Terraye M. Starr
Information Technology Specialists
MMWR Editorial BoardTimothy F. Jones, MD, Nashville, TN, ChairmanMatthew L. Boulton, MD, MPH, Ann Arbor, MI
Virginia A. Caine, MD, Indianapolis, INJonathan E. Fielding, MD, MPH, MBA, Los Angeles, CA
David W. Fleming, MD, Seattle, WAWilliam E. Halperin, MD, DrPH, MPH, Newark, NJ
King K. Holmes, MD, PhD, Seattle, WARima F. Khabbaz, MD, Atlanta, GA
Patricia Quinlisk, MD, MPH, Des Moines, IAPatrick L. Remington, MD, MPH, Madison, WIWilliam L. Roper, MD, MPH, Chapel Hill, NC
William Schaffner, MD, Nashville, TN
were downloaded, processed, and analyzed using generalized linear models with statistical software.
Over the 38-year study period, FARS captured 29,711 cyclist deaths. Annual cyclist fatalities declined from a high of 955 in 1975 to 717 in 2012. The annual age-adjusted mortality rate declined 44%, from a high of 0.41 per 100,000 in 1975 to 0.23 per 100,000 in 2012 (Figure 1). The proportion of cyclist deaths among all annual motor vehicle–related fatalities was highest in 1975 at 2.3%, dipped to a low of 1.4% in 2003, and increased to 2.2% by 2012 (Figure 1).
Trends in age-specific cyclist mortality rates varied in mag-nitude and direction (Figure 2). In bivariate linear models, mortality rates for age groups <35 years and ≥75 years decreased significantly over the study period, with the largest decrease among children aged <15 years. Historically, mortality rates for children aged <15 years were substantially higher than rates for other age groups. In 1975, the mortality rate for children aged <15 years was 1.18 per 100,000, more than four times higher than the rate (0.25 per 100,000) for persons aged ≥15 years. This pattern shifted over the 38-year study period, and by 2012, the rate among children aged <15 years (0.09 per 100,000) was one third that of all other age groups (0.27 per 100,000). During 1975–2012, the cyclist mortality rate among children aged <15 years declined 92%. The overall decrease in age-adjusted mortality rates can be attributed to declines among children aged <15 years because no linear decline was observed when children were excluded from models.
Mortality rates for adults aged 35–74 years increased signifi-cantly during the study period. The largest increase was among adults aged 35–54 years, with the mortality rate increasing nearly threefold, from 0.11 to 0.31 per 100,000.
The overall mortality rate for males was six times greater than the overall mortality rate for females. In 2012, males accounted for 87% of total bicycle deaths in the United States. This proportion increased over the 38-year study period, from 79% in 1977 to a peak of 90% in 2001.
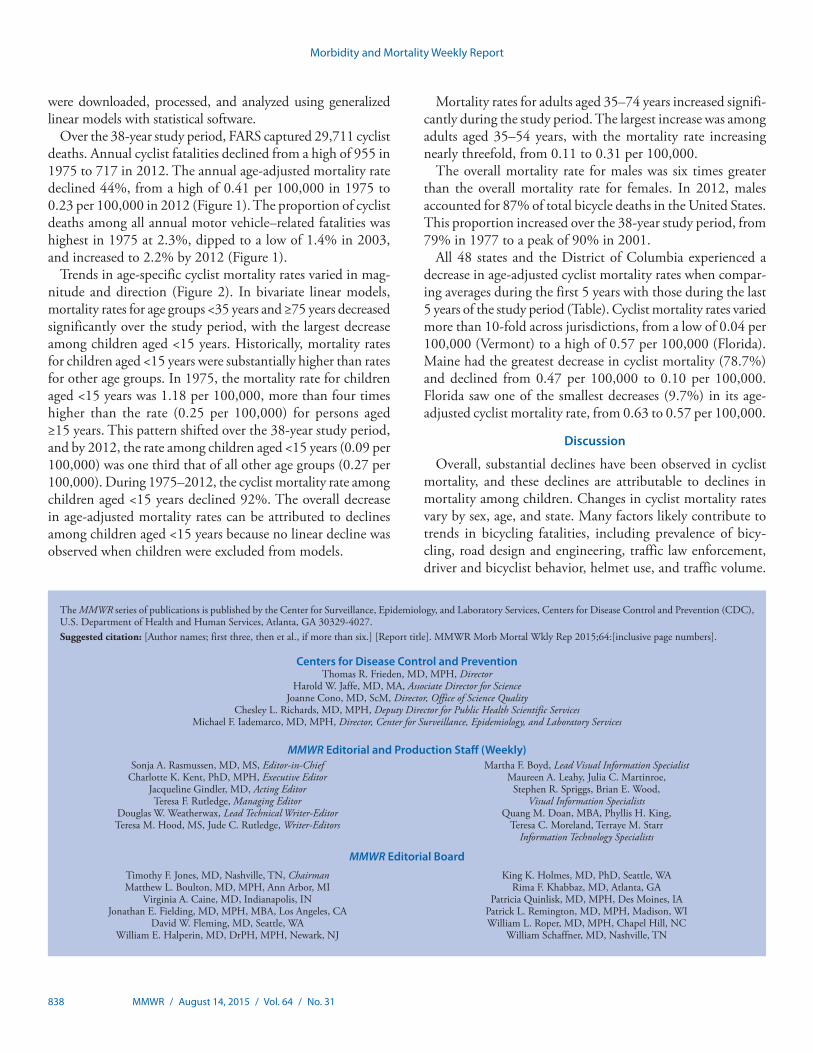
All 48 states and the District of Columbia experienced a decrease in age-adjusted cyclist mortality rates when compar-ing averages during the first 5 years with those during the last 5 years of the study period (Table). Cyclist mortality rates varied more than 10-fold across jurisdictions, from a low of 0.04 per 100,000 (Vermont) to a high of 0.57 per 100,000 (Florida). Maine had the greatest decrease in cyclist mortality (78.7%) and declined from 0.47 per 100,000 to 0.10 per 100,000. Florida saw one of the smallest decreases (9.7%) in its age-adjusted cyclist mortality rate, from 0.63 to 0.57 per 100,000.
Discussion
Overall, substantial declines have been observed in cyclist mortality, and these declines are attributable to declines in mortality among children. Changes in cyclist mortality rates vary by sex, age, and state. Many factors likely contribute to trends in bicycling fatalities, including prevalence of bicy-cling, road design and engineering, traffic law enforcement, driver and bicyclist behavior, helmet use, and traffic volume.

Morbidity and Mortality Weekly Report
MMWR / August 14, 2015 / Vol. 64 / No. 31 839
Although bicycles account for a relatively small share of trips across all modes of transportation, the share of total household trips taken by bicycle has doubled over the last 35 years, and in 2009, bicycling accounted for approximately 1% of trips in the United States (4). Recent years have seen the largest increase in bicycling; for instance, during 2000–2012, the number of U.S. workers who traveled to work by bicycle increased 61% (6). This growth is not uniform because most has occurred among men aged 25–64 years, whereas cycling rates have remained steady for women and have fallen among children (4). Although many factors could influence cyclist mortality trends, the observed trends by age and sex during the study period likely reflect the changing prevalence of cycling among those groups. Thus, the decline in bicyclist mortality among children might be attributable to fewer child bicycle trips rather than a result of safer road conditions. Increased use of helmets among children might also have contributed to reduced child bicyclist mortality over the study period (7).
The findings in this report are subject to at least three limita-tions. First, FARS fatalities must involve a motor vehicle on a public road, so this analysis does not include cyclist fatalities in which a vehicle was not involved or which occurred off of a public road. Second, mortality rates based on population do not account for exposure to bicycling in the way that expressing deaths per unit time bicycling, distance traveled, or number
of trips would. This analysis found that approximately 2% of 2009 motor vehicle–related deaths were cyclists, and data from the 2009 National Household Travel Survey suggest that travel by bicycle accounted for 0.9% of all travel time and 0.2% of all travel distance (8). Mode-specific deaths expressed per unit distance traveled or per trip would likely further highlight dis-parities between modes (2). Calculation and interpretation of age-specific state mortality rates were limited by the rarity of fatalities for some year-state-age group combinations. Finally, the analysis focused on long-term trends in FARS data and, therefore, did not use variables that were added in recent years. Future studies could explore recent cyclist mortality trends in greater detail by incorporating newer FARS data on crash location, road type, helmet use, distraction, or inebriation, as well as data from other sources on cycling trips and distance traveled among various age groups.
Public health goals of increased physical activity and popu-lation interest in alternatives to automobile transportation place additional focus on bicycle safety. Over the past decade, per capita motor vehicle travel has decreased (9), and persons have used bicycles for more utilitarian trips (e.g., commut-ing to work or going to the grocery store) (4,6). The reasons for these transportation shifts are multifactorial and include economic drivers, such as fuel prices and unemployment, as well as health and environmental benefits. Nonetheless, these
FIGURE 1. Cyclist age-adjusted annual mortality rate and cyclist proportion of all motor vehicle–related deaths — United States, 1975–2012
Cyclist age-adjusted annual mortality rate (deaths per 100,000)Cyclist deaths as % of all motor vehicle–related deaths
Healthy People 2020 target (0.22 cyclist deaths per 100,000)
0.0
0.1
0.2
0.3
0.4
1980 1990 2000 2010
Year
Cycl
ist a
ge-a
djus
ted
annu
al m
orta
lity
rate
(dea
ths
per 1
00,0
00)
0.0
0.5
1.0
1.5
2.0
Cyclist deaths as % of all m
otor vehicle–related deaths

Morbidity and Mortality Weekly Report
840 MMWR / August 14, 2015 / Vol. 64 / No. 31
shifts, combined with recent increases in the proportion of road deaths accounted for by cyclists (Figure 1), suggest an opportunity for expanding traditional road safety interventions
in the United States (which have largely focused on vehicle passenger safety) with interventions designed to protect cyclists.
This report underscores the importance of improving bicycle safety in the United States with the aim of preventing fatalities. In addition, a common perception that cycling is unsafe might contribute to low levels of bicycling, diminishing opportunities for physical activity, particularly among women and children (10). Several countries and some U.S. cities have higher bicycle use and lower mortality rates than the United States overall. Many have implemented multifaceted, integrated approaches to bicycling that address safety while also promoting cycling (1). Such approaches often include extensive bicycle infra-structure (e.g., physically separated bike lanes), traffic calming measures (e.g., speed humps), legal interventions (e.g., lowered speed limits), travel programs (e.g., safe routes to school), and education to encourage safe bicyclist and motorist behavior (1). Other strategies that can reduce fatalities include helmet laws and improved conspicuity of cyclists via lights and bright or reflective clothing.§ Overall, cyclist mortality has decreased in
FIGURE 2. Cyclist annual mortality rates relative to the Healthy People 2020 target, by age group — United States, 1975–2012
0.3
0.6
0.9
1.2
0.01980 1990 2000 2010
Year
Cycl
ist a
nnua
l mor
talit
y ra
te (d
eath
s pe
r 100
,000
)
Healthy People 2020 target (0.22 cyclist deaths per 100,000)
0–14 yrs15–34 yrs
35–54 yrs
55–74 yrs
≥75 yrs
Summary
What is already known on this topic?
On a per trip basis, bicyclists are twice as likely as vehicle occupants to die on U.S. roads. About 1% of all trips are by bicycle, and bicycling has increased recently among adults while declining among children.
What is added by this report?
During 1975-2012, overall annual rates for cyclist mortality decreased 44%, with the steepest decline among children aged <15 years. In contrast, cyclist mortality rates increased for adults aged 35–74 years, particularly men aged 35–54 years.
What are the implications for public health practice?
Multifaceted, integrated approaches to bicycling have improved safety while also promoting cycling. With cycling increasing in the United States, especially in urban areas, improving bicycle safety could prevent potential increases in cyclist mortality rates.
§ Additional information available at http://www.nhtsa.gov/staticfiles/nti/pdf/811727.pdf.

Morbidity and Mortality Weekly Report
MMWR / August 14, 2015 / Vol. 64 / No. 31 841
TABLE. Average annual age-adjusted cyclist mortality rates, by state* — United States, 1975–1979 and 2008–2012
State 1975–1979 2008–2012 % decrease
Alabama 0.23 0.12 48.0Arizona 0.62 0.32 48.1Arkansas 0.33 0.20 40.1California 0.41 0.29 29.6Colorado 0.31 0.20 33.9Connecticut 0.30 0.14 51.2Delaware 0.51 0.38 25.5District of Columbia 0.30 0.14 53.6Florida 0.63 0.57 9.7Georgia 0.41 0.18 55.9Idaho 0.39 0.20 48.9Illinois 0.36 0.20 45.4Indiana 0.41 0.20 52.4Iowa 0.31 0.15 52.2Kansas 0.34 0.17 49.3Kentucky 0.27 0.14 48.0Louisiana 0.50 0.33 34.4Maine 0.47 0.10 78.7Maryland 0.24 0.12 51.2Massachusetts 0.29 0.13 56.9Michigan 0.51 0.22 56.3Minnesota 0.47 0.17 64.9Mississippi 0.38 0.21 45.8Missouri 0.24 0.07 71.1Montana 0.38 0.15 60.8Nebraska 0.29 0.08 71.9Nevada 0.59 0.20 66.0New Hampshire 0.32 0.11 64.2New Jersey 0.30 0.17 45.0New Mexico 0.33 0.27 17.9New York 0.43 0.21 51.9North Carolina 0.46 0.25 45.1North Dakota 0.42 0.15 65.1Ohio 0.32 0.14 55.4Oklahoma 0.30 0.17 44.5Oregon 0.48 0.26 45.9Pennsylvania 0.30 0.11 62.9Rhode Island 0.19 0.10 45.0South Carolina 0.71 0.28 60.1South Dakota 0.41 0.10 74.6Tennessee 0.32 0.11 64.9Texas 0.39 0.20 49.6Utah 0.37 0.17 55.0Vermont 0.25 0.04 82.4Virginia 0.30 0.14 53.9Washington 0.30 0.13 56.5West Virginia 0.25 0.06 76.9Wisconsin 0.52 0.16 69.4Wyoming 0.18 0.17 6.7
* Includes 48 states and the District of Columbia (data were not available from Alaska and Hawaii).
recent years, but adults remain at elevated risk. Multifaceted approaches to bicycle road safety are likely needed to ensure bicycling safety for all.
1Global Health Institute, University of Wisconsin-Madison; 2Division of Community Health Investigations, Agency for Toxic Substances Disease Registry; 3Healthy Community Design Initiative, National Center for Environmental Health, CDC.
Corresponding author: Jason Vargo, [email protected], 608-263-6209.
References 1. Pucher J, Dill J, Handy S. Infrastructure, programs, and policies to
increase bicycling: an international review. Prev Med 2010;50(Suppl 1): S106–25.
2. Beck LF, Dellinger AM, O’Neil ME. Motor vehicle crash injury rates by mode of travel, United States: using exposure-based methods to quantify differences. Am J Epidemiol 2007;166:212–8.
3. Santos A, McGuckin N, Nakamoto HY, Gray D, Liss S. Summary of travel trends: 2009 National Household Travel Survey. Washington, DC: National Highway Traffic Safety Administration; 2011. Available at http://nhts.ornl.gov/2009/pub/stt.pdf.
4. Pucher J, Buehler R, Seinen M. Bicycling renaissance in North America? An update and re-appraisal of cycling trends and policies. Transport Res A-Pol 2011;45:451–75.
5. National Highway Traffic Safety Administration. Traffic safety facts, 2009 data: bicyclists and other cyclists. Washington, DC: National Highway Traffic Safety Administration; 2009. Available at http://www-nrd.nhtsa.dot.gov/Pubs/811386.pdf.
6. McKenzie B. The mode less traveled: bicycling and walking to work in the United States 2008–2012. Available at http://www.census.gov/prod/2014pubs/acs-25.pdf.
7. Dellinger AM, Kresnow MJ. Bicycle helmet use among children in the United States: the effects of legislation, personal and household factors. J Safety Res 2010;41:375–80.
8. US Department of Transportation. 2009 National Household Travel Survey. Washington, DC: Federal Highway Administration; 2009. Available at http://nhts.ornl.gov.
9. Sivak M. Has motorization in the US peaked? Part 5: update through 2012. University of Michigan Transportation Research Institute Report no. UMTRI-2014–11. Available at http://deepblue.lib.umich.edu/bitstream/handle/2027.42/106404/102994.pdf.
10. CDC. Barriers to children walking and biking to school—United States, 1999. MMWR Morb Mortal Wkly Rep 2002;51:701–4.

Morbidity and Mortality Weekly Report
842 MMWR / August 14, 2015 / Vol. 64 / No. 31
Advances in water management and sanitation have sub-stantially reduced waterborne disease in the United States, although outbreaks continue to occur (1). Public health agen-cies in the U.S. states and territories* report information on waterborne disease outbreaks to the CDC Waterborne Disease and Outbreak Surveillance System (http://www.cdc.gov/healthywater/surveillance/index.html). For 2011–2012, 32 drinking water–associated outbreaks were reported, account-ing for at least 431 cases of illness, 102 hospitalizations, and 14 deaths. Legionella was responsible for 66% of outbreaks and 26% of illnesses, and viruses and non-Legionella bacteria together accounted for 16% of outbreaks and 53% of illnesses. The two most commonly identified deficiencies† leading to drinking water–associated outbreaks were Legionella in build-ing plumbing§ systems (66%) and untreated groundwater (13%). Continued vigilance by public health, regulatory, and industry professionals to identify and correct deficiencies associated with building plumbing systems and groundwater systems could prevent most reported outbreaks and illnesses associated with drinking water systems.
This report provides information on drinking water–associated¶ waterborne disease outbreaks in which the first illness occurred in 2011 or 2012** (http://www.cdc.gov/healthywater/surveillance/drinking-surveillance-reports.html), and summarizes outbreaks reported to the Waterborne Disease and Outbreak Surveillance System through the electronic National Outbreak Reporting System (http://www.cdc.gov/nors/about.html) as of October 30, 2014. For an event to be defined as a waterborne disease outbreak, two or more persons must be linked epidemiologically by time, location
of water exposure, and case illness characteristics; and the epidemiologic evidence must implicate water as the probable source of illness. Data submitted for each outbreak include 1) the number of cases, hospitalizations, and deaths; 2) the etiologic agent (confirmed or suspected); 3) the implicated water system; 4) contributing factors in the outbreak; and 5) the setting of exposure.
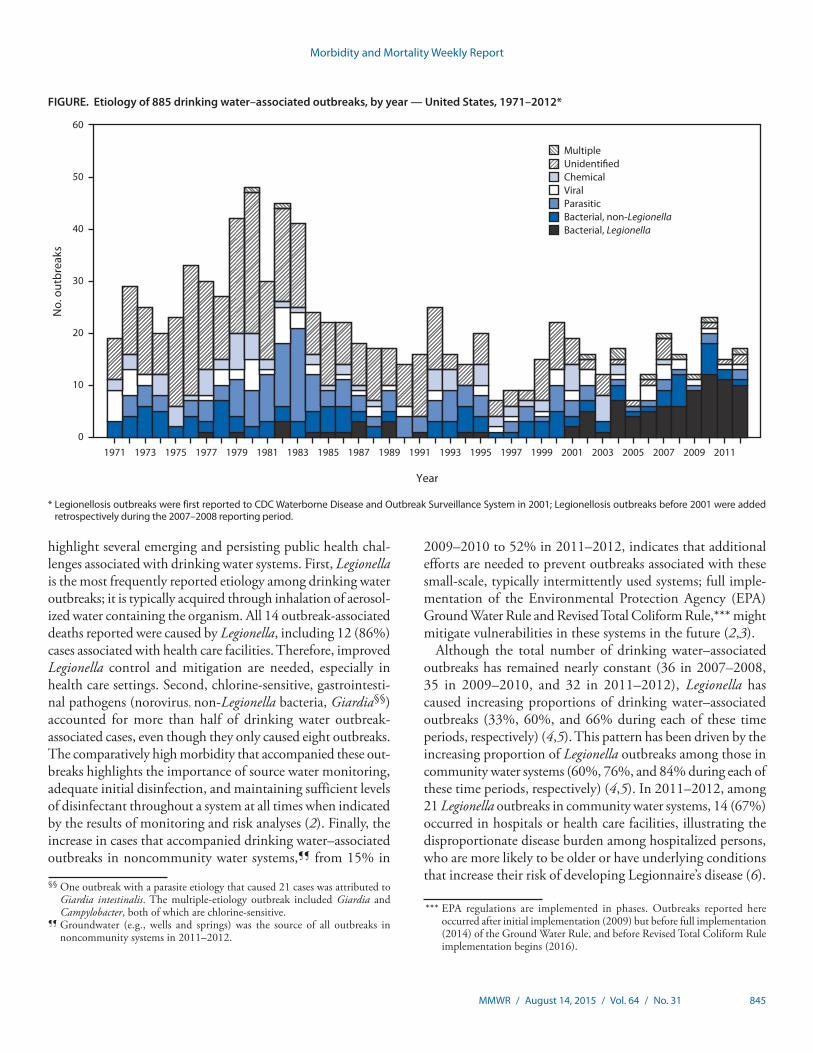
Public health officials from 14 states reported 32 out-breaks associated with drinking water during the time period (Table 1) (http://www.cdc.gov/healthywater/surveillance/drinking-water-tables-figures.html). These outbreaks resulted in at least 431 cases, 102 hospitalizations (24% of cases), and 14 deaths. At least one etiologic agent was identified in 30 (94%) outbreaks. Legionella was implicated in 21 (66%) outbreaks, 111 (26%) cases, 91 (89%) hospitalizations, and all 14 deaths. Norovirus was implicated in two single-etiology outbreaks involving 138 cases, with no hospitalizations or deaths. Three outbreaks caused by non-Legionella bacteria resulted in 90 (21%) cases, among which 56 (62%) were caused by Shiga toxin–producing Escherichia coli, 22 (24%) by Shigella son-nei, and 12 (13%) by Pantoea agglomerans (hospital-acquired bloodstream infection). Common exposure settings among drinking water–associated outbreaks were hospitals or health care facilities (n = 16, 50%), hotels (n = four, 13%), and camps/cabins (n = three, 9%). The number and etiological categories of drinking water–associated outbreaks reported every year since 1971 were reviewed for comparison (Figure).
The etiologies, water systems, water sources, predominant illness types, and deficiencies identified for drinking water–associated outbreaks and outbreak-associated cases were ranked in order of frequency (Table 2). Legionella was the most frequently reported outbreak etiology (65.6%), thus acute respiratory illness was the most commonly reported illness type. Outbreaks associated with community water systems††
Surveillance for Waterborne Disease Outbreaks Associated with Drinking Water — United States, 2011–2012
Karlyn D. Beer, PhD1,2; Julia W. Gargano, PhD2; Virginia A. Roberts, MSPH2; Vincent R. Hill, PhD2; Laurel E. Garrison, MPH3; Preeta K. Kutty, MD3; Elizabeth D. Hilborn, DVM4; Timothy J. Wade, PhD4; Kathleen E. Fullerton, MPH2; Jonathan S. Yoder, MPH, MSW2
* Territories include the District of Columbia, Guam, Puerto Rico, the Marshall Islands, the Federated States of Micronesia, the Commonwealth of the Northern Mariana Islands, Palau, and the U.S. Virgin Islands.
† Outbreaks are assigned one or more deficiency classifications based on available data. (http://www.cdc.gov/healthywater/surveillance/deficiency-classification.html).
§ “Plumbing” refers to the pipes that are within a building or within a service line leading into a building, distinguished from the distribution system of pipes that compose the water supply.
¶ Drinking water, also called potable water, is water for human consumption (e.g., drinking, bathing, showering, hand washing, teeth brushing, food preparation, dishwashing, maintaining oral hygiene) and includes water collected, treated, stored or distributed in public and individual water systems, as well as bottled water.
** This report also includes two previously unreported outbreaks with first case onset dates in 2009.
†† Community and noncommunity water systems are public water systems that have ≥15 service connections or serve an average of ≥25 residents for ≥60 days/year. A community water system serves year-round residents of a community, subdivision, or mobile home park. A noncommunity water system serves an institution, industry, camp, park, hotel, or business and can be nontransient or transient. Nontransient systems serve ≥25 of the same persons for ≥6 months of the year but not year-round (e.g., factories and schools) whereas transient systems provide water to places in which persons do not remain for long periods of time (e.g., restaurants, highway rest stations, and parks). Individual water systems are small systems not owned or operated by a water utility that have <15 connections or serve <25 persons.

Morbidity and Mortality Weekly Report
MMWR / August 14, 2015 / Vol. 64 / No. 31 843
(78.1%) outnumbered those associated with noncommunity systems and bottled water. Outbreaks associated with water systems that used surface water sources (56.3%) were more frequently reported than outbreaks associated with all other sources. The deficiency that led to most drinking water–associ-ated outbreaks (n = 21, 65.6%) was the presence of Legionella in drinking water systems. The second most common deficiency was untreated groundwater (i.e., groundwater contamination at the source), both alone (n = four, 12.5%) and in combination
with untreated surface water (n = one, 3.1%). All five drink-ing water–associated outbreaks with groundwater deficiencies (including one outbreak with multiple deficiencies) occurred in noncommunity water systems; four occurred in camps or outdoor workplaces and one occurred in a meeting facility. No reported outbreaks occurred in individual water systems (e.g., private wells).
Among 431 cases attributed to drinking water–associated out-breaks, the etiologies, illnesses, water sources and systems, and
TABLE 1. Waterborne disease outbreaks associated with drinking water (N = 32), by state/jurisdiction and month of first case onset — Waterborne Disease and Outbreak Surveillance System, United States, 2011–2012
State/ Jurisdiction Month Year Etiology*
Predominant illness†
No. cases
No. hospital-izations§
No. deaths¶ Water system** Water source Setting
Alaska Jun 2012 Giardia intestinalis AGI 21 0 0 Transient noncommunity
Spring, Well, River/Stream††
Camp/Cabin
Arizona Mar 2011 Unknown AGI 3 0 0 Nontransient noncommunity
Spring Outdoor workplace
Colorado Oct 2012 Propylene glycol suspected§§
AGI 7 0 0 Community Lake/Reservoir/Impoundment
Hospital/Health care
Florida Aug 2009¶¶ L. pneumophila serogroup 1
ARI 10 4 1 Community Unknown Hotel/Motel/Lodge/Inn
Florida Jul 2011 Shigella sonnei subgroup D
AGI 22 0 0 Commercially bottled
Unknown Indoor workplace/Office
Florida Mar 2012 Unknown*** AGI 3 0 0 Commercially bottled
Well Indoor workplace/Office
Idaho May 2012 Campylobacter, Giardia intestinalis
AGI 7 0 0 Community River/Stream/Well Community/Municipality
Illinois Aug 2012 Pantoea agglomerans†††
Other 12 9 0 Community Lake/Reservoir/Impoundment
Hospital/Health care
Maryland May 2011 L. pneumophila serogroup 1
ARI 7 6 1 Community Well Hotel/Motel/Lodge/Inn
Maryland May 2012 L. pneumophila serogroup 1
ARI 3 2 1 Community Lake/Reservoir/Impoundment
Hospital/Health care
New Mexico Jun 2011 Norovirus AGI 119 0 0 Transient noncommunity
Spring§§§ Camp/Cabin
New York Apr 2009¶¶¶ L. pneumophila serogroup 1
ARI 4 4 0 Community Lake/Reservoir/Impoundment
Apartment/Condo
New York Jun 2011 L. pneumophila serogroup 1
ARI 2 2 Community River/Stream Hospital/Health care
New York Sep 2011 L. pneumophila serogroup 1
ARI 12 10 0 Community Lake/Reservoir/Impoundment
Hotel/Motel/Lodge/Inn
New York Sep 2011 L. pneumophila serogroup 1
ARI 3 0 Community Lake/Reservoir/Impoundment
Hospital/Health care
New York Jan 2012 L. pneumophila serogroup 1
ARI 3 Community Lake/Reservoir/Impoundment
Hotel/Motel/Lodge/Inn
New York Mar 2012 L. pneumophila serogroup 1
ARI 2 1 0 Community Lake/Reservoir/Impoundment
Hospital/Health care
New York Apr 2012 L. pneumophila serogroup 1
ARI 2 2 Community Lake/Reservoir/Impoundment
Apartment/Condo
New York Oct 2012 L. pneumophila serogroup 1
ARI 2 1 0 Community Lake/Reservoir/Impoundment
Hospital/Health care
New York Nov 2012 L. pneumophila serogroup 1
ARI 2 2 0 Community Lake/Reservoir/Impoundment
Hospital/Health care
Ohio Jan 2011 L. pneumophila serogroup 1
ARI 11 11 1 Community Well Hospital/Health care
Ohio Mar 2011 L. pneumophila serogroup 1
ARI 8 7 0 Community Lake/reservoir/impoundment
Hospital/Health care
Ohio Aug 2011 L. pneumophila ARI 10 4 2 Community Lake/Reservoir/Impoundment
Hospital/Health care
Ohio Nov 2012 L. pneumophila serogroup 1
ARI 2 2 0 Community Lake/Reservoir/Impoundment
Hospital/Health care
See table footnotes on the next page.
Morbidity and Mortality Weekly Report
844 MMWR / August 14, 2015 / Vol. 64 / No. 31
deficiencies were distributed differently than among the related outbreaks. Viruses caused 32.0% of cases, followed by Legionella (25.8%), and non-Legionella bacteria (20.9%). Over half of cases (51.5%) were linked to noncommunity water systems, and cases linked to groundwater (60.6%) were more frequently reported than all other reported sources. Most cases involved acute gastrointestinal illness (71.5%). Together, deficiencies of untreated groundwater and Legionella in drinking water systems accounted for 72.4% of all outbreak-associated cases.
Data were received concerning two previously unreported outbreaks with onset dates of first illness in 2009 (Table 1).
These outbreaks were caused by Legionella pneumophila sero-group 1, and resulted in 14 cases, eight hospitalizations and one death. Data on these two outbreaks are presented (Table 1) (Figure) but are not included in the analysis of outbreaks that occurred in 2011 and 2012.
Discussion
Since the early 20th century, water treatment processes and regulations have greatly reduced the transmission of pathogens through public drinking water supplies in the United States (1). The outbreaks reported during this surveillance period
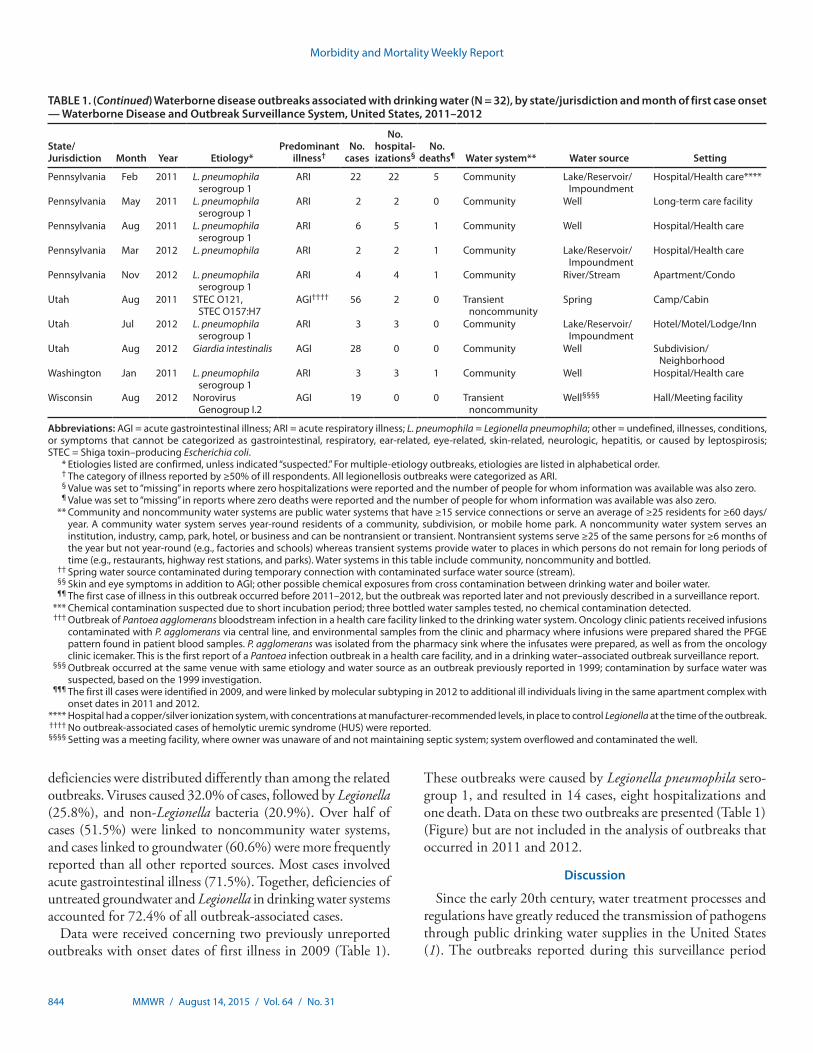
TABLE 1. (Continued) Waterborne disease outbreaks associated with drinking water (N = 32), by state/jurisdiction and month of first case onset — Waterborne Disease and Outbreak Surveillance System, United States, 2011–2012
State/ Jurisdiction Month Year Etiology*
Predominant illness†
No. cases
No. hospital-izations§
No. deaths¶ Water system** Water source Setting
Pennsylvania Feb 2011 L. pneumophila serogroup 1
ARI 22 22 5 Community Lake/Reservoir/Impoundment
Hospital/Health care****
Pennsylvania May 2011 L. pneumophila serogroup 1
ARI 2 2 0 Community Well Long-term care facility
Pennsylvania Aug 2011 L. pneumophila serogroup 1
ARI 6 5 1 Community Well Hospital/Health care
Pennsylvania Mar 2012 L. pneumophila ARI 2 2 1 Community Lake/Reservoir/Impoundment
Hospital/Health care
Pennsylvania Nov 2012 L. pneumophila serogroup 1
ARI 4 4 1 Community River/Stream Apartment/Condo
Utah Aug 2011 STEC O121, STEC O157:H7
AGI†††† 56 2 0 Transient noncommunity
Spring Camp/Cabin
Utah Jul 2012 L. pneumophila serogroup 1
ARI 3 3 0 Community Lake/Reservoir/Impoundment
Hotel/Motel/Lodge/Inn
Utah Aug 2012 Giardia intestinalis AGI 28 0 0 Community Well Subdivision/Neighborhood
Washington Jan 2011 L. pneumophila serogroup 1
ARI 3 3 1 Community Well Hospital/Health care
Wisconsin Aug 2012 Norovirus Genogroup I.2
AGI 19 0 0 Transient noncommunity
Well§§§§ Hall/Meeting facility
Abbreviations: AGI = acute gastrointestinal illness; ARI = acute respiratory illness; L. pneumophila = Legionella pneumophila; other = undefined, illnesses, conditions, or symptoms that cannot be categorized as gastrointestinal, respiratory, ear-related, eye-related, skin-related, neurologic, hepatitis, or caused by leptospirosis; STEC = Shiga toxin–producing Escherichia coli. * Etiologies listed are confirmed, unless indicated “suspected.” For multiple-etiology outbreaks, etiologies are listed in alphabetical order. † The category of illness reported by ≥50% of ill respondents. All legionellosis outbreaks were categorized as ARI. § Value was set to “missing” in reports where zero hospitalizations were reported and the number of people for whom information was available was also zero. ¶ Value was set to “missing” in reports where zero deaths were reported and the number of people for whom information was available was also zero. ** Community and noncommunity water systems are public water systems that have ≥15 service connections or serve an average of ≥25 residents for ≥60 days/
year. A community water system serves year-round residents of a community, subdivision, or mobile home park. A noncommunity water system serves an institution, industry, camp, park, hotel, or business and can be nontransient or transient. Nontransient systems serve ≥25 of the same persons for ≥6 months of the year but not year-round (e.g., factories and schools) whereas transient systems provide water to places in which persons do not remain for long periods of time (e.g., restaurants, highway rest stations, and parks). Water systems in this table include community, noncommunity and bottled.
†† Spring water source contaminated during temporary connection with contaminated surface water source (stream). §§ Skin and eye symptoms in addition to AGI; other possible chemical exposures from cross contamination between drinking water and boiler water. ¶¶ The first case of illness in this outbreak occurred before 2011–2012, but the outbreak was reported later and not previously described in a surveillance report. *** Chemical contamination suspected due to short incubation period; three bottled water samples tested, no chemical contamination detected. ††† Outbreak of Pantoea agglomerans bloodstream infection in a health care facility linked to the drinking water system. Oncology clinic patients received infusions
contaminated with P. agglomerans via central line, and environmental samples from the clinic and pharmacy where infusions were prepared shared the PFGE pattern found in patient blood samples. P. agglomerans was isolated from the pharmacy sink where the infusates were prepared, as well as from the oncology clinic icemaker. This is the first report of a Pantoea infection outbreak in a health care facility, and in a drinking water–associated outbreak surveillance report.
§§§ Outbreak occurred at the same venue with same etiology and water source as an outbreak previously reported in 1999; contamination by surface water was suspected, based on the 1999 investigation.
¶¶¶ The first ill cases were identified in 2009, and were linked by molecular subtyping in 2012 to additional ill individuals living in the same apartment complex with onset dates in 2011 and 2012.
**** Hospital had a copper/silver ionization system, with concentrations at manufacturer-recommended levels, in place to control Legionella at the time of the outbreak. †††† No outbreak-associated cases of hemolytic uremic syndrome (HUS) were reported. §§§§ Setting was a meeting facility, where owner was unaware of and not maintaining septic system; system overflowed and contaminated the well.
Morbidity and Mortality Weekly Report
MMWR / August 14, 2015 / Vol. 64 / No. 31 845
highlight several emerging and persisting public health chal-lenges associated with drinking water systems. First, Legionella is the most frequently reported etiology among drinking water outbreaks; it is typically acquired through inhalation of aerosol-ized water containing the organism. All 14 outbreak-associated deaths reported were caused by Legionella, including 12 (86%) cases associated with health care facilities. Therefore, improved Legionella control and mitigation are needed, especially in health care settings. Second, chlorine-sensitive, gastrointesti-nal pathogens (norovirus, non-Legionella bacteria, Giardia§§) accounted for more than half of drinking water outbreak-associated cases, even though they only caused eight outbreaks. The comparatively high morbidity that accompanied these out-breaks highlights the importance of source water monitoring, adequate initial disinfection, and maintaining sufficient levels of disinfectant throughout a system at all times when indicated by the results of monitoring and risk analyses (2). Finally, the increase in cases that accompanied drinking water–associated outbreaks in noncommunity water systems,¶¶ from 15% in
2009–2010 to 52% in 2011–2012, indicates that additional efforts are needed to prevent outbreaks associated with these small-scale, typically intermittently used systems; full imple-mentation of the Environmental Protection Agency (EPA) Ground Water Rule and Revised Total Coliform Rule,*** might mitigate vulnerabilities in these systems in the future (2,3).
Although the total number of drinking water–associated outbreaks has remained nearly constant (36 in 2007–2008, 35 in 2009–2010, and 32 in 2011–2012), Legionella has caused increasing proportions of drinking water–associated outbreaks (33%, 60%, and 66% during each of these time periods, respectively) (4,5). This pattern has been driven by the increasing proportion of Legionella outbreaks among those in community water systems (60%, 76%, and 84% during each of these time periods, respectively) (4,5). In 2011–2012, among 21 Legionella outbreaks in community water systems, 14 (67%) occurred in hospitals or health care facilities, illustrating the disproportionate disease burden among hospitalized persons, who are more likely to be older or have underlying conditions that increase their risk of developing Legionnaire’s disease (6).
FIGURE. Etiology of 885 drinking water–associated outbreaks, by year — United States, 1971–2012*
0
10
20
30
40
50
60
No.
out
brea
ks
MultipleUnidenti�edChemicalViralParasiticBacterial, non-LegionellaBacterial, Legionella
1971 20092007200520032001199919971995199319911989
Year
19871985198319811979197719751973 2011
* Legionellosis outbreaks were first reported to CDC Waterborne Disease and Outbreak Surveillance System in 2001; Legionellosis outbreaks before 2001 were added retrospectively during the 2007–2008 reporting period.
§§ One outbreak with a parasite etiology that caused 21 cases was attributed to Giardia intestinalis. The multiple-etiology outbreak included Giardia and Campylobacter, both of which are chlorine-sensitive.
¶¶ Groundwater (e.g., wells and springs) was the source of all outbreaks in noncommunity systems in 2011–2012.
*** EPA regulations are implemented in phases. Outbreaks reported here occurred after initial implementation (2009) but before full implementation (2014) of the Ground Water Rule, and before Revised Total Coliform Rule implementation begins (2016).

Morbidity and Mortality Weekly Report
846 MMWR / August 14, 2015 / Vol. 64 / No. 31
Legionella outbreaks are particularly challenging to prevent and control, in part because the organism lives and multiplies in building plumbing systems, which usually fall outside water utility and regulatory oversight (6,7). One Legionella outbreak occurred in a hotel that used point-of-entry water filters, which effectively dechlorinated all water entering the building, and
illustrates the importance of maintaining sufficient residual disinfectant in plumbing systems.
The five drinking water–associated outbreaks and 222 outbreak-associated cases from noncommunity water sys-tems reported for 2011–2012 represented an increase since 2009–2010, illustrating two additional public health challenges beyond Legionella. First, the etiologies in these outbreaks were
TABLE 2. Rank order (most to least common) of etiology, water system, water source, predominant illness, and deficiencies associated with 32 drinking water outbreaks and 431 outbreak-related cases — United States, 2011–2012
Characteristic Rank
Outbreaks (N = 32) Cases (N = 431)
Category No. (%) Category No. (%)
Etiology1 Bacteria, Legionella 21 (65.6) Viruses 138 (32.0)2 Bacteria, non-Legionella 3 (9.4) Bacteria, Legionella 111 (25.8)3 Parasites 2 (6.3) Bacteria, non-Legionella 90 (20.9)4 Viruses 2 (6.3) Parasites 49 (11.4)5 Unknown 2 (6.3) Chemical* 26 (6.0)6 Chemical* 1 (3.1) Unknown 10 (2.3)7 Multiple† 1 (3.1) Multiple† 7 (1.6)
Water system§
1 Community 25 (78.1) Noncommunity 222 (51.5)2 Noncommunity 5 (15.6) Community 184 (42.7)3 Bottled 2 (6.3) Bottled 25 (5.8)
Water source1 Surface water 18 (56.3) Ground water 261 (60.6)2 Ground water 11 (34.4) Surface water 120 (27.8)3 Mixed¶ 2 (6.3) Unknown 22 (5.1)4 Unknown 1 (3.1) Mixed¶ 28 (6.5)
Predominant Illness**1 ARI 21 (65.6) AGI 308 (71.5)2 AGI 10 (31.3) ARI 111 (25.8)3 Other†† 1 (3.1) Other†† 12 (2.8)
Deficiency§§
1 Legionella spp. in drinking water system¶¶ 21 (65.6) Untreated ground water*** 201 (46.6)2 Untreated ground water*** 4 (12.5) Legionella spp. in drinking water system¶¶ 111 (25.8)3 Premise plumbing system††† 2 (6.3) Premise plumbing system 33 (7.7)4 Unknown/Insufficient information 2 (6.3) Distribution system§§§ 28 (6.5)5 Distribution system§§§ 1 (3.1) Point of use, bottled¶¶¶ 22 (5.1)6 Multiple**** 1 (3.1) Multiple**** 21 (4.9)7 Point of use, bottled¶¶¶ 1 (3.1) Unknown/Insufficient information 15 (3.5)
Abbreviations: AGI = acute gastrointestinal illness; ARI = acute respiratory illness. * Propylene glycol detected in drinking water after cross-connection with HVAC water system. † One outbreak had multiple etiologic agent types: Campylobacter spp. (i.e., non-Legionella bacterium) and Giardia intestinalis (i.e., parasite). § Community and noncommunity water systems are public water systems that have ≥15 service connections or serve an average of ≥25 residents for ≥60 days a
year. Community water systems serve year-round residents of a community, subdivision, or mobile home park. Noncommunity water systems serve an institution, industry, camp, park, hotel, or business.
¶ Includes outbreaks with mixed water sources (i.e., ground water and surface water). Two giardiasis outbreaks were associated with mixed source community water systems.
** The category of illness reported by ≥50% of ill respondents; all legionellosis outbreaks were categorized as ARI. §§ Outbreaks are assigned one or more deficiency classifications. (Source: Brunkard, JM, Ailes E, Roberts VA, et al. Surveillance for waterborne disease outbreaks
associated with drinking water—United States, 2007–2008. MMWR Surveill Summ 2011;60:38–68). †† Symptoms for one outbreak caused by Pantoea agglomerans bloodstream infection were categorized as “other.” ¶¶ Deficiency 5A. Drinking water, contamination of water at points not under the jurisdiction of a water utility or at the point of use: Legionella spp. in water system,
drinking water. *** Deficiency 2. Drinking water, contamination of water at/in the water source, treatment facility, or distribution system: untreated ground water. ††† Deficiency 6. Drinking water, contamination of water at points not under the jurisdiction of a water utility or at the point of use: Plumbing system deficiency after
the water meter or property line (e.g., cross-connection, backflow, or corrosion products). §§§ Deficiency 4. Drinking water, contamination of water at/in the water source, treatment facility, or distribution system: Distribution system deficiency, including
storage (e.g., cross-connection, backflow, contamination of water mains during construction or repair). ¶¶¶ Deficiency 11C. Drinking water, contamination of water at points not under the jurisdiction of a water utility or at the point of use: Contamination at point of use,
commercially bottled water. **** Multiple deficiencies were assigned to one giardiasis outbreak which contributed 21 cases: deficiency 1, untreated surface water; and deficiency 2, untreated
ground water.

Morbidity and Mortality Weekly Report
MMWR / August 14, 2015 / Vol. 64 / No. 31 847
Summary
What is already known on this topic?
Waterborne disease outbreaks associated with drinking water continue to occur in the United States. CDC collects data on waterborne disease outbreaks submitted from all states and territories through the Waterborne Disease and Outbreak Surveillance System.
What is added by this report?
During 2011–2012, a total of 32 drinking water–associated outbreaks were reported to CDC, resulting in 431 cases of illness, 102 hospitalizations, and 14 deaths. Legionella accounted for 66% of outbreaks and 26% of illnesses, and viruses and non-Legionella bacteria together accounted for 16% of outbreaks and 53% of illnesses. The two most commonly identified deficiencies leading to drinking water–associated outbreaks were Legionella in building plumbing systems (66%) and untreated groundwater (13%).
What are the implications for public health practice?
Efforts to identify and correct the deficiencies implicated in drinking water–associated outbreaks, particularly Legionella growth in plumbing systems, and contaminated groundwater, could prevent many outbreaks and illnesses. Additional research is needed to understand the interventions and regulations that are most effective for controlling the growth of Legionella and for reducing outbreaks of legionellosis.
varied but were predominantly norovirus, non-Legionella bac-teria and Giardia. Moreover, the majority of cases caused by these pathogens occurred during the five outbreaks associated with noncommunity systems. Second, all five noncommunity outbreaks originated from groundwater sources. Specifically, four occurred in outdoor camp or work settings where a source spring was contaminated directly or by inflow from a stream, and the fifth occurred at a meeting facility where a well was contami-nated with septic tank overflow. Because these outbreaks share common settings, water system types, and chlorine-sensitive pathogens, a large potential reduction in gastrointestinal illnesses is possible when noncommunity groundwater systems are prop-erly maintained and operated to reduce or inactivate microbial contamination. In addition, these outbreaks underscore the importance of protecting groundwater sources from fecal con-tamination. Groundwater source protection will be enhanced by improved awareness of and full compliance with protective regulations, such as EPA’s Ground Water Rule and Revised Total Coliforms Rule (2,3). However, EPA lacks authority to regulate private wells or onsite wastewater systems (i.e., septic systems) not connected to public water or wastewater systems. Septic systems are used in 20% of U.S. homes, and each year 10%–20% of septic systems malfunction (8). Improper design, maintenance, or location of private wells and septic systems contributed to 67% of reported outbreaks from groundwater
contamination from 1971–2008 (9), but these outbreaks can be avoided with proper design and regular service and maintenance as recommended by EPA (8).
The findings in this report are subject to at least two limita-tions. First, the detection and investigation of outbreaks might be incomplete, for several reasons. Linking illness to drinking water is inherently difficult through outbreak investigation methods (e.g., case-control and cohort studies) because most persons have daily exposure to tap water (10). The capacity to conduct environmental investigations that can provide information on water system deficiencies contributing to out-breaks, and strengthen evidence implicating drinking water as a common source of infection, might vary by state and locality. Second, the level of surveillance and reporting activity, as well as reporting requirements, vary across states and localities. For these reasons, outbreak surveillance data underestimate actual values, and should not be used to estimate the total number of outbreaks or cases of waterborne disease.
Compared with the previous 2-year reporting period (2009–2010), the proportion of outbreaks with deficiencies in the federally regulated portions of public water systems (i.e., up to the water meter or property line) during 2011–2012 has declined from 46% to 20%. Nonetheless, challenges with noncommunity water systems are ongoing, and efforts to prevent illnesses associated with untreated groundwater are needed. Furthermore, deficiencies at non-federally (i.e., not under jurisdiction of water utilities or EPA) regulated points, such as private wells and building plumbing systems, are also increasingly reported to cause illness, especially legionellosis. Of additional concern is the likelihood that, as older age is a risk factor for Legionnaire’s disease (6), an aging U.S. popula-tion will result in an increased proportion of individuals at higher risk. Expanded partnerships between public health, regulatory, and industry professionals to develop and use both regulatory and nonregulatory approaches to identify and address groundwater and building plumbing system deficien-cies could prevent most reported outbreaks associated with drinking water systems.
Acknowledgments
State, territorial, local, and freely associated state waterborne disease coordinators, epidemiologists, and environmental health personnel; Hannah Reses, Michael J. Beach, PhD, Division of Foodborne, Waterborne, and Environmental Diseases, National Center for Emerging and Zoonotic Infectious Diseases, CDC.
1Epidemic Intelligence Service, CDC; 2Division of Foodborne, Waterborne, and Environmental Diseases, National Center for Emerging and Zoonotic Infectious Diseases, CDC; 3Division of Bacterial Diseases, National Center for Immunization and Respiratory Diseases, CDC; 4U.S. Environmental Protection Agency.
Corresponding author: Karlyn Beer, [email protected], 404-718-1151.

Morbidity and Mortality Weekly Report
848 MMWR / August 14, 2015 / Vol. 64 / No. 31
References 1. Cutler D, Miller G. The role of public health improvements in health
advances: the twentieth-century United States. Demography 2005;42:1–22.
2. National Primary Drinking Water Regulations: Ground Water Rule. 40 C.F.R. Sect. 141.400 (2006).
3. National Primary Drinking Water Regulations: Revisions to the Total Coliform Rule. 40 C.F.R. Sect. 141.851 (2013).
4. Brunkard JM, Ailes E, Roberts VA, et al. Surveillance for waterborne disease outbreaks associated with drinking water—United States, 2007–2008. MMWR Surveill Summ 2011;60(No. SS-12):38–68.
5. CDC. Surveillance for waterborne disease outbreaks associated with drinking water and other nonrecreational water—United States, 2009–2010. MMWR Morb Mortal Wkly Rep 2013;62:714–20.
6. Falkinham JO 3rd, Hilborn ED, Arduino MJ, Pruden A, Edwards MA. Epidemiology and ecology of opportunistic premise plumbing pathogens: Legionella pneumophila, Mycobacterium avium, and Pseudomonas aeruginosa. Environ Health Perspect 2015;123:749–58.
7. Marciano-Cabral F, Jamerson M, Kaneshiro ES. Free-living amoebae, Legionella and Mycobacterium in tap water supplied by a municipal drinking water utility in the USA. J Water Health 2010;8:71–82.
8. US Environmental Protection Agency. Water: septic (onsite/decentralized) systems. Washington, DC: US Environmental Protection Agency; 2014. Available at http://water.epa.gov/infrastructure/septic/.
9. Wallender EK, Ailes EC, Yoder JS, Roberts VA, Brunkard JM. Contributing factors to disease outbreaks associated with untreated groundwater. Ground Water 2014;52:886–97.
10. Tostmann A, Bousema T, Oliver I. Investigation of outbreaks complicated by universal exposure. Emerg Infect Dis 2012;18:1717–22.

Morbidity and Mortality Weekly Report
MMWR / August 14, 2015 / Vol. 64 / No. 31 849
Exposures to contaminated water can lead to waterborne dis-ease outbreaks associated with various sources, including many that are classified and reported separately as drinking water† (1) or recreational water§ (2). Waterborne disease outbreaks can also involve a variety of other exposures (e.g., consuming water directly from backcountry or wilderness streams, or inhaling aerosols from cooling towers and ornamental foun-tains). Additionally, outbreaks might be epidemiologically linked to multiple water sources or may not have a specific water source implicated.
This report describes waterborne disease outbreaks associ-ated with environmental and undetermined water exposures (combining and replacing the previously reported categories “water not intended for drinking,” “water of unknown intent,” and “other nonrecreational water”) (3,4), in which the first ill-ness occurred in 2011 or 2012.¶ Outbreaks that were reported to the Waterborne Disease and Outbreak Surveillance System (http://www.cdc.gov/healthywater/surveillance/index.html) through the electronic National Outbreak Reporting System (http://www.cdc.gov/nors/about.html) as of October 30, 2014, were included. Data collected for each outbreak include the numbers of cases of illness, hospitalizations, and deaths; the suspected or confirmed etiologic agent; the implicated water source; and the setting of exposure.
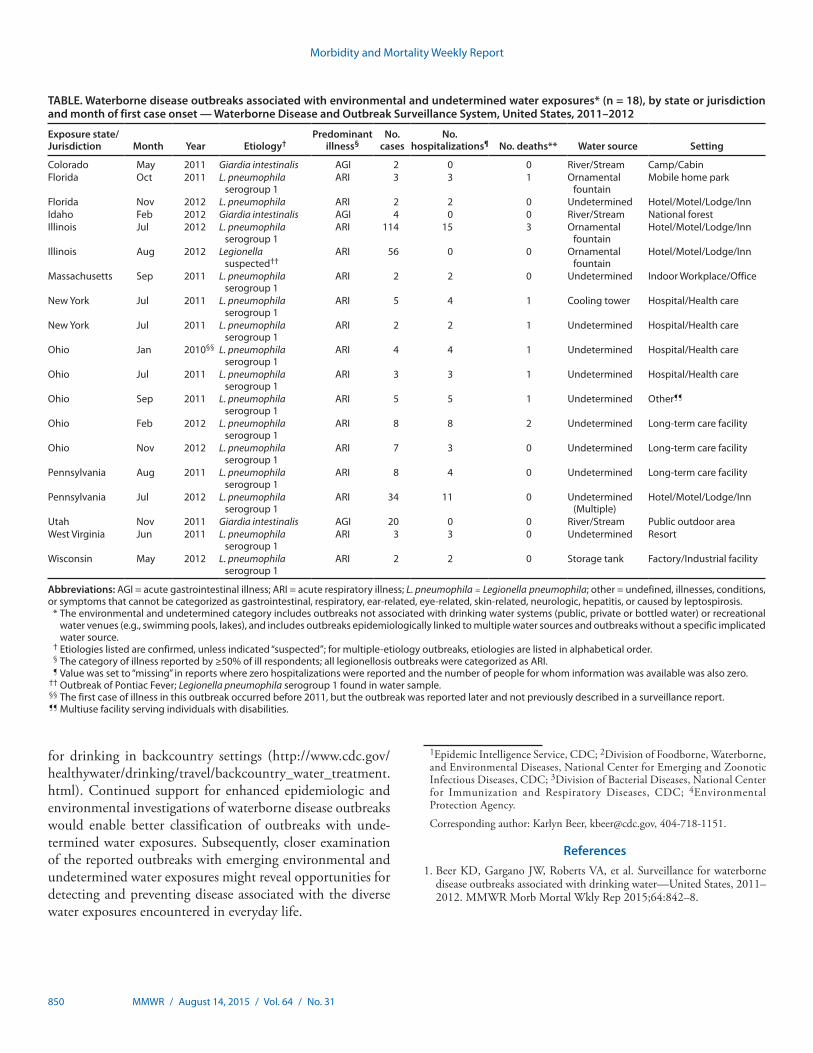
During 2011–2012, public health officials from 11 states reported 18 outbreaks associated with environmental or undetermined water exposures, causing 280 cases of illness, 67 hospitalizations (24% of cases), and 10 deaths (Table). These 18 outbreaks included 15 legionellosis outbreaks that resulted in 254 cases and all 10 deaths. The legionellosis outbreaks occurred in hotels and motels (n = four), hospitals
and healthcare facilities (n = three),** long-term–care facilities (n = three), an indoor workplace/office (n = one), a factory/industrial setting (n = one), a mobile home park (n = one), a resort (n = one), and a multi-use facility (n = one). Five legionellosis outbreaks had a known water source, including ornamental fountains (n = three), a cooling tower (n = one), and a storage tank (n = one). For 10 legionellosis outbreaks the water source was undetermined. Among these, one outbreak had multiple implicated sources (drinking water, spa, and cool-ing system), and the remaining nine had insufficient data to implicate a particular source. Five of the 10 deaths caused by Legionella were health care facility–associated, including two associated with long-term care facilities, two with hospitals, and one with an unknown type of health care facility. In addi-tion to the 15 legionellosis outbreaks, three Giardia intestinalis outbreaks occurred, following drinking of untreated water directly from rivers or streams in outdoor settings.
Waterborne disease outbreaks not associated with drinking water or recreational water have been increasingly reported during the past 10 years. The increase is primarily associated with an increasing number of reported Legionella outbreaks, concomitant with the rise in Legionella outbreaks associ-ated with drinking water systems (1) (http://www.cdc.gov/healthywater/surveillance/drinking-water-tables-figures.html). The variety of settings and water sources implicated in the Legionella outbreaks reported here highlights the complexity of Legionella control and mitigation in the built environment, particularly in settings where susceptible persons congregate, such as hospitals, long-term care facilities, and other health-care settings (5). Outbreaks associated with untreated water sources highlight the importance of properly treating water
Outbreaks Associated With Environmental and Undetermined Water Exposures — United States, 2011–2012
Karlyn D. Beer, PhD1,2*; Julia W. Gargano, PhD2*; Virginia A. Roberts, MSPH2; Hannah E. Reses2; Vincent R. Hill, PhD2; Laurel E. Garrison, MPH3; Preeta K. Kutty, MD3; Elizabeth D. Hilborn, DVM4; Timothy J. Wade, PhD4; Kathleen E. Fullerton, MPH2; Jonathan S. Yoder, MPH, MSW2
* These authors contributed equally to this work.† Drinking water, also called potable water, is water for human consumption
(e.g., drinking, bathing, showering, hand washing, teeth brushing, food preparation, dishwashing, maintaining oral hygiene) and includes water collected, treated, stored, or distributed in public and individual water systems, as well as bottled water.
§ Recreational water includes water in venues that are treated (e.g., pools, hot tubs, spas) or untreated (e.g., lakes, oceans).
¶ One previously unreported outbreak with first case onset date in 2010 is reported in the Table, but not summarized in text.
** Characteristics of hospitals and health care facilities (e.g., inpatient vs. outpatient) are not systematically collected in the National Outbreak Reporting System (NORS); however, long-term care facility settings are specified in NORS and might be reported as a subset of hospitals and health care facilities. Of three health care–associated legionellosis outbreaks, two were reported to have occurred in hospitals with inpatient facilities; the third occurred in an unspecified type of health care facility.
Morbidity and Mortality Weekly Report
850 MMWR / August 14, 2015 / Vol. 64 / No. 31
for drinking in backcountry settings (http://www.cdc.gov/healthywater/drinking/travel/backcountry_water_treatment.html). Continued support for enhanced epidemiologic and environmental investigations of waterborne disease outbreaks would enable better classification of outbreaks with unde-termined water exposures. Subsequently, closer examination of the reported outbreaks with emerging environmental and undetermined water exposures might reveal opportunities for detecting and preventing disease associated with the diverse water exposures encountered in everyday life.
1Epidemic Intelligence Service, CDC; 2Division of Foodborne, Waterborne, and Environmental Diseases, National Center for Emerging and Zoonotic Infectious Diseases, CDC; 3Division of Bacterial Diseases, National Center for Immunization and Respiratory Diseases, CDC; 4Environmental Protection Agency.
Corresponding author: Karlyn Beer, [email protected], 404-718-1151.
References1. Beer KD, Gargano JW, Roberts VA, et al. Surveillance for waterborne
disease outbreaks associated with drinking water—United States, 2011–2012. MMWR Morb Mortal Wkly Rep 2015;64:842–8.
TABLE. Waterborne disease outbreaks associated with environmental and undetermined water exposures* (n = 18), by state or jurisdiction and month of first case onset — Waterborne Disease and Outbreak Surveillance System, United States, 2011–2012
Exposure state/ Jurisdiction Month Year Etiology†
Predominant illness§
No. cases
No. hospitalizations¶ No. deaths** Water source Setting
Colorado May 2011 Giardia intestinalis AGI 2 0 0 River/Stream Camp/CabinFlorida Oct 2011 L. pneumophila
serogroup 1ARI 3 3 1 Ornamental
fountainMobile home park
Florida Nov 2012 L. pneumophila ARI 2 2 0 Undetermined Hotel/Motel/Lodge/InnIdaho Feb 2012 Giardia intestinalis AGI 4 0 0 River/Stream National forestIllinois Jul 2012 L. pneumophila
serogroup 1ARI 114 15 3 Ornamental
fountainHotel/Motel/Lodge/Inn
Illinois Aug 2012 Legionella suspected††
ARI 56 0 0 Ornamental fountain
Hotel/Motel/Lodge/Inn
Massachusetts Sep 2011 L. pneumophila serogroup 1
ARI 2 2 0 Undetermined Indoor Workplace/Office
New York Jul 2011 L. pneumophila serogroup 1
ARI 5 4 1 Cooling tower Hospital/Health care
New York Jul 2011 L. pneumophila serogroup 1
ARI 2 2 1 Undetermined Hospital/Health care
Ohio Jan 2010§§ L. pneumophila serogroup 1
ARI 4 4 1 Undetermined Hospital/Health care
Ohio Jul 2011 L. pneumophila serogroup 1
ARI 3 3 1 Undetermined Hospital/Health care
Ohio Sep 2011 L. pneumophila serogroup 1
ARI 5 5 1 Undetermined Other¶¶
Ohio Feb 2012 L. pneumophila serogroup 1
ARI 8 8 2 Undetermined Long-term care facility
Ohio Nov 2012 L. pneumophila serogroup 1
ARI 7 3 0 Undetermined Long-term care facility
Pennsylvania Aug 2011 L. pneumophila serogroup 1
ARI 8 4 0 Undetermined Long-term care facility
Pennsylvania Jul 2012 L. pneumophila serogroup 1
ARI 34 11 0 Undetermined (Multiple)
Hotel/Motel/Lodge/Inn
Utah Nov 2011 Giardia intestinalis AGI 20 0 0 River/Stream Public outdoor areaWest Virginia Jun 2011 L. pneumophila
serogroup 1ARI 3 3 0 Undetermined Resort
Wisconsin May 2012 L. pneumophila serogroup 1
ARI 2 2 0 Storage tank Factory/Industrial facility
Abbreviations: AGI = acute gastrointestinal illness; ARI = acute respiratory illness; L. pneumophila = Legionella pneumophila; other = undefined, illnesses, conditions, or symptoms that cannot be categorized as gastrointestinal, respiratory, ear-related, eye-related, skin-related, neurologic, hepatitis, or caused by leptospirosis. * The environmental and undetermined category includes outbreaks not associated with drinking water systems (public, private or bottled water) or recreational
water venues (e.g., swimming pools, lakes), and includes outbreaks epidemiologically linked to multiple water sources and outbreaks without a specific implicated water source.
† Etiologies listed are confirmed, unless indicated “suspected”; for multiple-etiology outbreaks, etiologies are listed in alphabetical order. § The category of illness reported by ≥50% of ill respondents; all legionellosis outbreaks were categorized as ARI. ¶ Value was set to “missing” in reports where zero hospitalizations were reported and the number of people for whom information was available was also zero. †† Outbreak of Pontiac Fever; Legionella pneumophila serogroup 1 found in water sample. §§ The first case of illness in this outbreak occurred before 2011, but the outbreak was reported later and not previously described in a surveillance report. ¶¶ Multiuse facility serving individuals with disabilities.

Morbidity and Mortality Weekly Report
MMWR / August 14, 2015 / Vol. 64 / No. 31 851
2. Hlavsa MC, Roberts VA, Kahler AM, et al. Outbreaks of illness associated with recreational water—United States, 2011–2012. MMWR Morb Mortal Wkly Rep 2015;64:668–72.
3. Brunkard JM, Ailes E, Roberts VA, et al. Surveillance for waterborne disease outbreaks associated with drinking water—United States, 2007–2008. MMWR Surveill Summ 2011;60(No. SS-12):38–68.
4. CDC. Surveillance for waterborne disease outbreaks associated with drinking water and other nonrecreational water—United States, 2009–2010. MMWR Morb Mortal Wkly Rep 2013;62:714–20.
5. Fields BS, Benson RF, Besser RE. Legionella and Legionnaires’ disease: 25 years of investigation. Clin Microbiol Rev 2002;15:506–26.

Morbidity and Mortality Weekly Report
852 MMWR / August 14, 2015 / Vol. 64 / No. 31
On August 12, 2014, an Anchorage hospital notified the Alaska Section of Epidemiology (SOE) that a middle-aged male resident of Anchorage (patient A) had arrived in the emergency department with possible palytoxin exposure. Patient A complained of a bitter metallic taste, fever, weakness, cough, and muscle pain 7–8 hours after introduction of live zoanthid coral into his home aquarium. Palytoxin, a potent toxin known to produce the reported effects, is contained in zoanthid marine corals (1,2).
This call prompted SOE to launch an epidemiologic inves-tigation, during which investigators interviewed exposed persons, obtained environmental specimens for testing, and provided advice about avoiding continued exposure. Patient A reported that two persons (patients B and C) who lived with him experienced similar symptoms around the same time. Patient A also reported that the owner of a local aquarium shop knew of numerous reported aquarium-related poison-ings associated with suspected palytoxin-containing zoanthids, both through personal experience and through online marine aquarium forums (3). Patient A reported that the shop’s owner believed that he and several of his employees and customers had been previously exposed, some multiple times.
A specimen obtained from patient A’s introduced coral, as well as a specimen obtained from the shop, were both posi-tive for palytoxin. An extended investigation identified seven additional Anchorage residents who appeared to have expe-rienced acute palytoxin-related illness during the preceding 2 years. Many aquarium store employees and marine aquarium hobbyists are not aware of palytoxin as a potentially serious hazard associated with handling some zoanthid corals sold in aquarium stores or exchanged by hobbyists. Persons who are likely to handle such organisms should be made aware of the potential health risks so that they understand how to prevent exposure to this potent toxin.
Case ReportsOn August 11, 2014, at 10:30 p.m., a relative of patient A
transferred 70 pounds (32 kg) of live coral from a plastic container into patient A’s 200-gallon (758-L) aquarium in his 1,600-square-foot (149 square-meter) mobile home. During the transfer, several coral fragments fell to the floor, causing some of the live polyps to break off. Patients B and C were asleep in an adjacent room <20 feet [<6 m] from the aquarium
while the coral was being transferred. Patient A arrived home at 11:30 p.m. and slept for approximately 7 hours in the room with the aquarium. On August 12, at approximately 7:00 a.m., patients A, B, and C awoke with neurologic, respiratory, musculoskeletal, and other symptoms (Table). Because of the severity of patient A’s symptoms, which included cough, nausea, headache, and muscle and joint pain, he was taken to a nearby hospital emergency department, where he was tachy-cardic, tachypneic, and febrile (maximum temperature = 103°F [39.4°C]). His white blood cell count was elevated at 13,800 cells/cubic milliliter with 86% neutrophils. His renal func-tion tests, urinalysis, troponin I, creatinine kinase, and chest radiograph were unremarkable. Influenza A and B tests were negative. He was admitted to the hospital for supportive care. Patients B and C gradually improved throughout the day and their symptoms completely resolved by 7:00 p.m. Patient A was released 2 days later, after resolution of his symptoms. The person who introduced the coral into the aquarium was reported to be asymptomatic.
Patient A stated that the household dog had vomited the morning after coral introduction (August 12) and both the dog and the household cat appeared to be lethargic that day. Patients A and C noted a visible mist and sensed humidity in the mobile home on the morning after coral introduction, lead-ing them to suspect a possible problem with the aquarium. The patients reported learning that palytoxin was a possible cause of their illness from the owner of the shop. The shop owner stated that he had experienced similar symptoms on multiple occasions after handling zoanthid corals, and that he had read numerous similar reports posted by other marine aquarium enthusiasts through online blogs (3). SOE advised patients A, B, and C to decontaminate surfaces near the aquarium with dilute household bleach while wearing personal protective equipment including face mask, goggles, and overalls.
Laboratory AnalysisSOE arranged with the U.S. Food and Drug Administration
Center for Food Safety and Applied Nutrition to test coral samples from the shop and from the aquarium in patient A’s house. Three samples from the shop and two samples from the home of patient A were selected on the basis of visual resemblance to zoanthids previously reported to contain palytoxin (2). Quantitative analysis was performed using high
Suspected Palytoxin Inhalation Exposures Associated with Zoanthid Corals in Aquarium Shops and Homes — Alaska, 2012–2014
Ali K. Hamade, PhD1; Sandrine E. Deglin, PhD1; Joe B. McLaughlin, MD1; Jonathan R. Deeds, PhD2; Sara M. Handy, PhD2; Ann M. Knolhoff, PhD2

Morbidity and Mortality Weekly Report
MMWR / August 14, 2015 / Vol. 64 / No. 31 853
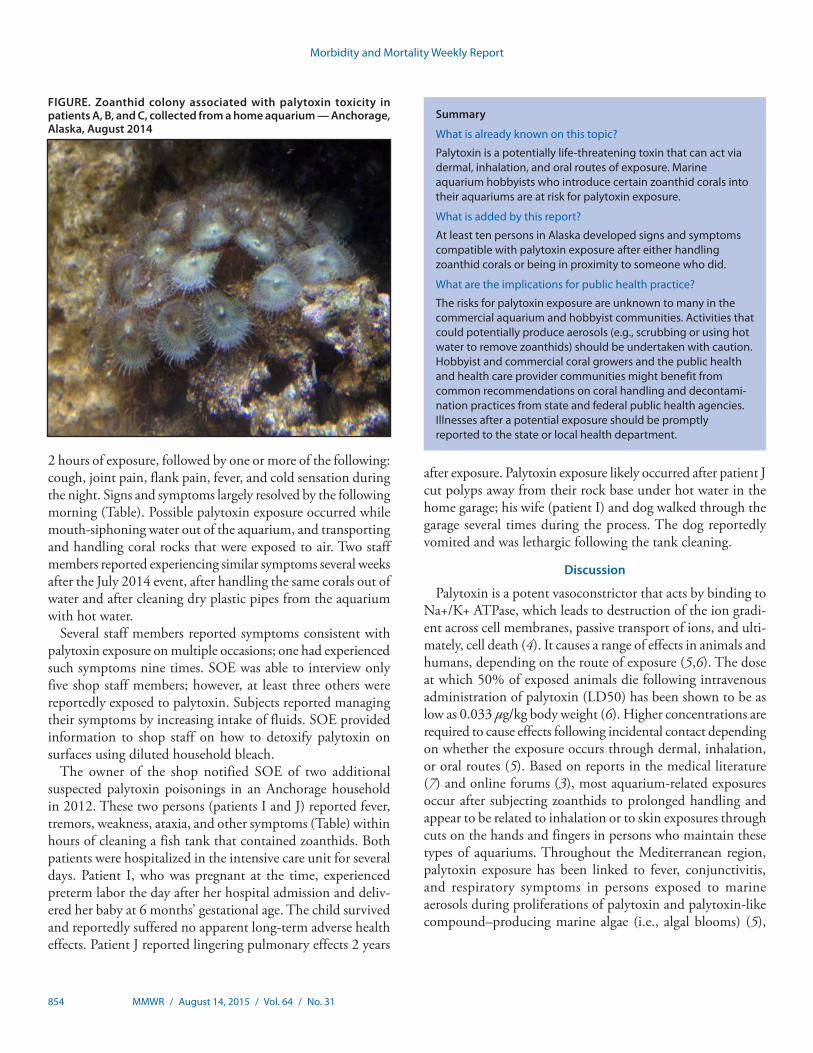
performance liquid chromatography with ultraviolet detec-tion compared against a palytoxin standard (2). The analysis confirmed 7.3 mg crude palytoxin/g wet weight of zoanthid tissue in one coral sample from patient A’s home aquarium (Figure) and 6.2 mg crude palytoxin/g wet weight zoanthid in one coral sample from the shop. The three additional coral samples were nontoxic or only weakly toxic. The levels of paly-toxin in the corals exceeded those found in investigations of previous similar poisoning events (0.5 mg/g–3.5 mg/g) (2). An additional analysis by high resolution liquid chromatography mass spectrometry (2) confirmed that the primary toxin in both samples was palytoxin (molecular weight = 2,680 kilodaltons). Genetic analysis (2) determined that both toxin-containing zoanthid samples were consistent with previous molecular iden-tifications of a highly toxic variety of Palythoa species collected from multiple aquarium shops in Maryland and Virginia, and from three similar aquarium-related poisoning events in New
York, Ohio, and Virginia. Both specimens were genetically and visually distinct from the nontoxic or weakly toxic specimens from this case and similar previous cases.
Additional Case ReportsSOE followed up with the owner of the shop to identify
additional cases. He reported that he and several aquarium shop staff members had experienced numerous episodes of likely palytoxin poisoning resulting in acute onset of clini-cally compatible symptoms (Table). The most recent recalled incident occurred in July 2014, and involved seven staff mem-bers who were exposed either while dismantling a customer’s private aquarium containing corals or upon later handling of the aquarium contents at the shop. SOE interviewed four of the staff and the shop owner (patients D, E, F, G, and H). All reported experiencing a bitter metallic or salty taste within
TABLE. Characteristics of patients in reported and investigated cases of palytoxin poisonings — Anchorage, Alaska, 2012–2014
Characteristic
Patient
A B C D E F G H I J
Outbreak no. 1 1 1 2 2 2 2 2 3 3Patient sex, age (yrs) M, 32 F, 30 M, 50 M, 43 M, 24 M, 52 M, 24 M, 40s F, 29 M, 32Year exposed 2014 2014 2014 2014 2014 2014 2014 2014 2012 2012SymptomsBitter metallic taste x x x x x x x xSalty taste x x xParesthesia x x x x xNausea x x x x xVomiting xWeakness x x x x x x x xAtaxia x x x xMuscle spasms x x xLoss of appetite x xDyspnea x x x x x Unsure x xHeadache x xCough x x x xScratchy throat x x x x xJoint/muscle pain x x x x x x xFever x x x x x x x x xTremors x x x x x x x x x xDry mouth/throat x xKidney pain x x x xDysphagia x xDizziness x x xTimes exposed 1 1 1 6–8 1 2–3 1 9 1 1Additional reported
symptoms/signsLungs “on fire”;
light sensitivity; tachycardia (135 bpm); fever (103°F); BP 118/69; 96% O2 saturation
Lungs “heavy, compressed”; raspy voice; painful swallowing
Nose bleed; floating sensation
“Pulmonary congestion”
Inhaler used for 4 weeks after 5-day hospitalization (3 days in ICU)
Dysphonia; dysarthria; hyperventilation; anoxia (low [34%] O2 saturation); loss of consciousness; inhaler use for 4 weeks after 9-day hospitalization (5 days in ICU); full recovery of aerobic capacity incomplete 2 years after exposure (self-reported)
Abbreviation: ICU = intensive care unit, O2 = oxygen.
Morbidity and Mortality Weekly Report
854 MMWR / August 14, 2015 / Vol. 64 / No. 31
2 hours of exposure, followed by one or more of the following: cough, joint pain, flank pain, fever, and cold sensation during the night. Signs and symptoms largely resolved by the following morning (Table). Possible palytoxin exposure occurred while mouth-siphoning water out of the aquarium, and transporting and handling coral rocks that were exposed to air. Two staff members reported experiencing similar symptoms several weeks after the July 2014 event, after handling the same corals out of water and after cleaning dry plastic pipes from the aquarium with hot water.
Several staff members reported symptoms consistent with palytoxin exposure on multiple occasions; one had experienced such symptoms nine times. SOE was able to interview only five shop staff members; however, at least three others were reportedly exposed to palytoxin. Subjects reported managing their symptoms by increasing intake of fluids. SOE provided information to shop staff on how to detoxify palytoxin on surfaces using diluted household bleach.
The owner of the shop notified SOE of two additional suspected palytoxin poisonings in an Anchorage household in 2012. These two persons (patients I and J) reported fever, tremors, weakness, ataxia, and other symptoms (Table) within hours of cleaning a fish tank that contained zoanthids. Both patients were hospitalized in the intensive care unit for several days. Patient I, who was pregnant at the time, experienced preterm labor the day after her hospital admission and deliv-ered her baby at 6 months’ gestational age. The child survived and reportedly suffered no apparent long-term adverse health effects. Patient J reported lingering pulmonary effects 2 years
after exposure. Palytoxin exposure likely occurred after patient J cut polyps away from their rock base under hot water in the home garage; his wife (patient I) and dog walked through the garage several times during the process. The dog reportedly vomited and was lethargic following the tank cleaning.
Discussion
Palytoxin is a potent vasoconstrictor that acts by binding to Na+/K+ ATPase, which leads to destruction of the ion gradi-ent across cell membranes, passive transport of ions, and ulti-mately, cell death (4). It causes a range of effects in animals and humans, depending on the route of exposure (5,6). The dose at which 50% of exposed animals die following intravenous administration of palytoxin (LD50) has been shown to be as low as 0.033 µg/kg body weight (6). Higher concentrations are required to cause effects following incidental contact depending on whether the exposure occurs through dermal, inhalation, or oral routes (5). Based on reports in the medical literature (7) and online forums (3), most aquarium-related exposures occur after subjecting zoanthids to prolonged handling and appear to be related to inhalation or to skin exposures through cuts on the hands and fingers in persons who maintain these types of aquariums. Throughout the Mediterranean region, palytoxin exposure has been linked to fever, conjunctivitis, and respiratory symptoms in persons exposed to marine aerosols during proliferations of palytoxin and palytoxin-like compound–producing marine algae (i.e., algal blooms) (5),
Summary
What is already known on this topic?
Palytoxin is a potentially life-threatening toxin that can act via dermal, inhalation, and oral routes of exposure. Marine aquarium hobbyists who introduce certain zoanthid corals into their aquariums are at risk for palytoxin exposure.
What is added by this report?
At least ten persons in Alaska developed signs and symptoms compatible with palytoxin exposure after either handling zoanthid corals or being in proximity to someone who did.
What are the implications for public health practice?
The risks for palytoxin exposure are unknown to many in the commercial aquarium and hobbyist communities. Activities that could potentially produce aerosols (e.g., scrubbing or using hot water to remove zoanthids) should be undertaken with caution. Hobbyist and commercial coral growers and the public health and health care provider communities might benefit from common recommendations on coral handling and decontami-nation practices from state and federal public health agencies. Illnesses after a potential exposure should be promptly reported to the state or local health department.
FIGURE. Zoanthid colony associated with palytoxin toxicity in patients A, B, and C, collected from a home aquarium — Anchorage, Alaska, August 2014

Morbidity and Mortality Weekly Report
MMWR / August 14, 2015 / Vol. 64 / No. 31 855
but detailed inhalation studies in animal models are lacking. No antidote is available for palytoxin; treatment is supportive.
Zoanthids (Class Anthozoa, Subclass Hexacorallia, Order Zoanthidia [colonial anemones]) are common in home aquariums. They are considered relatively easy to keep and are often recommended to new aquarium owners. Some types of colonial anemones form large aggregations encrusting a hard substrate. In an aquarium, these aggregations often require thinning or removal. Because of the way these organisms attach to surfaces, aggressive methods are sometimes required for their removal, including cutting, scraping, applying chemicals, or scalding with hot water, which lead to an increased potential for palytoxin exposure, often through the presumed produc-tion of aerosols (7). Other potential exposure routes include direct contact with eyes, through skin lesions, and incidental ingestion. Although not all zoanthids contain palytoxin, some zoanthids commonly found in home aquariums contain high concentrations of this toxin (2). Some coral enthusiasts appear to be able to maintain them without ill effects, likely through proper handling, aquarium management, and decontamination practices. Palytoxin can be neutralized by soaking the coral for 30 minutes in a ≥0.1% household bleach solution (1 part 5%–6% sodium hypochlorite [household bleach] to 10 parts water, prepared fresh) (8). Contaminated items should be soaked in diluted bleach before disposal (3).
Palytoxin is known to some coral hobbyists (3), and the Anchorage aquarium shop displayed many signs warning that some coral might be very toxic. However, no U.S. regulations govern the testing or labeling of coral that might contain toxins, including palytoxin. Regulations for the importation of corals currently enforced by the U.S. Fish and Wildlife Service pertain to endangered species and reflect ecological concerns (9). General recommendations on coral handling and decontamination practices would be helpful for hobbyists, commercial coral growers, and the public health and clinical provider communities.
Currently, no official evidence-based recommendations exist for proper personal protective equipment use for coral hobbyists and aquarium shop staff, and development of such
recommendations might be helpful. Activities that could potentially produce aerosols (e.g., scrubbing or using hot water to remove zoanthids) should be undertaken with caution. Patients A, B, and C did not handle any of the corals directly; rather, they were present in the home shortly after the intro-duction of palytoxin-containing zoanthids to the aquarium. Until data from controlled inhalation experiments in an animal model are available, this apparent link between palytoxin and inhalation toxicity will remain associative and evidence-based recommendations on appropriate respiratory protection or handling best practices will not be possible.
Acknowledgments
Karen Martinek, MS, Dave Verbrugge, Division of Public Health, State of Alaska.
1Section of Epidemiology, Division of Public Health, State of Alaska; 2Center for Food Safety and Applied Nutrition, U.S. Food and Drug Administration.
Corresponding author: Ali Hamade, [email protected].
References1. Moore RE, Scheuer PJ. Palytoxin: a new marine toxin from a coelenterate.
Science 1971;172:495–8.2. Deeds JR, Handy SM, White KD, Reimer JD. Palytoxin found in Palythoa
sp. zoanthids (Anthozoa, Hexacorallia) sold in the home aquarium trade. PLoS One 2011;6:e18235.
3. Reef Central Online Community [Internet]. Available at http://www.reefcentral.com/forums/index.php?s.
4. Hilgemann DW. From a pump to a pore: how palytoxin opens the gates. Proc Natl Acad Sci U S A 2003;100:386–8.
5. Tubaro A, Durando P, Del Favero G, et al. Case definitions for human poisonings postulated to palytoxins exposure. Toxicon 2011;57:478–95.
6. Wiles JS, Vick JA, Christensen MK. Toxicological evaluation of palytoxin in several animal species. Toxicon 1974;12:427–33.
7. Sud P, Su MK, Greller HA, Majlesi N, Gupta A. Case series: inhaled coral vapor—toxicity in a tank. J Med Toxicol 2013;9:282–6.
8. CDC. Guidelines for work with toxins of biological origin. In: Biosafety in micobiological and biomedical laboratories (BMBL), 5th ed. (appendix I). Atlanta, GA: US Department of Health and Human Services, CDC; 2009. Available at http://www.cdc.gov/biosafety/publications/bmbl5/BMBL5_appendixI.pdf.
9. US Fish and Wildlife Services [Internet]. Coral. Washington, DC: US Fish and Wildlife Services, International Affairs; 2015. Available at http://www.fws.gov/international/animals/coral.html.

Morbidity and Mortality Weekly Report
856 MMWR / August 14, 2015 / Vol. 64 / No. 31
Notes from the Field
Investigation of Tuberculosis in a High School — San Antonio, Texas, 2012
Tommy L. Camden, MS1; Dora Maruffo1; Norma Santos1; John J. Nava, MD1; Carlos Alcantara2
On February 21, 2012, the San Antonio Metropolitan Health District (SAMHD) Tuberculosis Clinic was notified that two students at Madison High School had laboratory-confirmed pulmonary tuberculosis (TB). During March–September 2012, public health officials from SAMHD collaborated with the school district to conduct an outbreak investigation that included performing tuberculin skin tests (TSTs) on high-risk contacts of active TB patients. To ensure compliance, all TSTs were performed at the school. Initial screening was conducted as soon as a contact was identified and was followed by a second TST ≥8 weeks after the patients with active TB were removed from the school. All positive TSTs were confirmed with an interferon gamma release assay (IGRA) (T-Spot.TB, Oxford Immunotec, Inc.) performed by SAMHD laboratory services (1). IGRA tests can provide additional evidence of infection to encourage acceptance and adherence of foreign-born patients who believe their positive TST is attributable to Bacille Calmette-Guerin vaccination and might also prompt greater acceptance of treatment for latent TB infection compared with a positive TST alone.
Overall, 400 students and 26 faculty members received TSTs. As a result of screening, a third student with active pul-monary TB was identified on April 3, and nine cases of latent TB infection were diagnosed. Because most of these students were initially tested as the school year was ending, follow-up testing for most of them was completed by June 7, after school was officially closed for the summer. However, those students who did not have follow-up testing by that date were tested at the beginning of the school year in September 2012. After identification of the third case, the contact investigation was extended beyond the school to include family members and close friends of all patients. No additional cases of TB or latent TB infection were identified.
All three patients with active TB were symptomatic and had abnormal chest radiographs. All were smear-positive and had positive nucleic acid amplification tests, and the diagnosis of TB was confirmed by culture and IGRA. Active TB patients were started on treatment with two or more anti-TB medica-tions (2–4), and laboratory isolates were sent to the California Department of Public Health Microbial Diseases Laboratory Branch, which is contracted by CDC to perform genotyping. Two of the patients had a history of travel to Vietnam several
years earlier; isolates from those two patients were genotypically linked and part of a cluster with similar genotype patterns in other parts of the United States. The isolate from the third patient, who had a history of travel to Africa, was one of only two genotypically identical isolates in the United States.
Interrupting the chain of disease transmission is a critical function of local health departments. The outbreak in this high school led to widespread media attention and concern among students, parents, and the community. In addition to SAMHD evaluating possibly exposed persons and assisting patients to complete the prolonged treatment course, part-nering between school and public health officials was crucial to the investigation and management of this outbreak. This partnership ensured communication with the public as the investigation progressed and was facilitated through television and radio interviews, health advisories, press releases, factsheets, and timely bilingual English-Spanish updates developed for the faculty, students, and parents. Challenges included ensuring that the contact investigation and screening activities continued during the summer break and following up on students who had graduated. Developing these partnerships at the local level is important for implementing rapid and effective public health responses to community or school outbreaks.
Acknowledgments
Chris Thompson, Brian Kennedy, Cynthia Carillo, James Madison High School. Maria Perez, MA, Northeast Independent School District Health Services. Roger Pollok, Mark Wade, San Antonio Metropolitan Health District. Charles Wallace, PhD, TB Program Manager, Texas Department of State Health Services.
1San Antonio Metropolitan Health District, San Antonio, Texas; 2Division of Tuberculosis Elimination, National Center for HIV/AIDS, Viral Hepatitis, STD, and TB Prevention, CDC.
Corresponding author: Tommy L. Camden, [email protected], 210-207-2293.
References1. Immunotec O. Inc. T-Spot.TB package insert. Available at http://www.
oxfordimmunotec.com/north-america/wp-content/uploads/sites/2/T-SPOT-PI-TB-US-v4.pdf.
2. CDC. Guidelines for preventing the transmission of Mycobacterium tuberculosis in health-care settings, 2005. MMWR Morb Mortal Recomm Rep 2005;54(No. RR-17).
3. CDC. Controlling tuberculosis in the United States: recommendations from the American Thoracic Society, CDC, and the Infectious Diseases Society of America. MMWR Morb Mortal Recomm Rep 2005;54(No. RR-12).
4. CDC. Core curriculum on tuberculosis: what the clinician should know. Sixth ed. Atlanta, GA: US Department of Health and Human Services, CDC; 2013. Available at http://www.cdc.gov/tb/education/corecurr/pdf/corecurr_all.pdf.

Morbidity and Mortality Weekly Report
MMWR / August 14, 2015 / Vol. 64 / No. 31 857
Use and Interpretation of a Rapid Respiratory Syncytial Virus Antigen Detection Test Among Infants Hospitalized in a Neonatal Intensive Care Unit — Wisconsin, March 2015
Lina I. Elbadawi, MD1,2; Thomas Haupt, MS2; Erik Reisdorf, MPH3; Tonya Danz3; Jeffrey P. Davis, MD2
On March 25, 2015, the Wisconsin Division of Public Health was notified of a possible respiratory syncytial virus (RSV) infection outbreak among infants hospitalized in a neonatal intensive care unit (NICU). On March 23, the index patient (neonate A), aged 3 days, had feeding intolerance and apnea. A nasopharyngeal swab specimen collected from neonate A was tested using a single-manufacturer rapid RSV antigen detection test (RRADT) at the hospital laboratory; the result was positive. The following day, because of concern about the possibility of more widespread RSV infection, RRADT was used to test nasopharyngeal swab specimens from neonate B, aged 1 month, who had resided in a different hospital room in the NICU and had developed an increased oxygen require-ment, apnea, and poor feeding that day, as well as from two asymptomatic neonates who were hospitalized in the same room with neonate A; all three were positive. Later that day, nasopharyngeal swab specimens from the remaining 16 asymp-tomatic NICU patients were tested using the same RRADT; seven tests were positive, making a total of 11 positives. All 20 RRADTs were performed at the hospital laboratory.
On March 25, the same 20 nasopharyngeal specimens were sent to the Wisconsin State Laboratory of Hygiene for con-firmatory testing using a multiplex respiratory virus real-time polymerase chain reaction (PCR) panel (eSensor, GenMark Diagnostics, Inc.) that targets 18 viruses, including RSV subgroups A and B. Sixteen nasopharyngeal specimens were negative for all 18 virus targets; three were positive for RSV-A, including the specimens from neonates A and B and from one asymptomatic neonate whose RRADT result was positive. A nasopharyngeal swab specimen from one other asymptomatic neonate with a positive RRADT tested positive for human coronavirus 229E by PCR. All nasopharyngeal specimen PCR results were confirmed at CDC. Therefore, among 17 speci-mens that were RSV-negative by PCR, eight were positive by RRADT, for a false-positivity rate of 47%.
The sensitivity (percentage of persons with the disease who have a positive test) and specificity (percentage of persons without the disease who have a negative test) of RRADTs
for detecting RSV are characteristics of the test. However, test result interpretation depends on the positive predictive value (PPV) (i.e., the proportion of test-positive patients who have RSV infection), which is influenced by RSV infection prevalence. Studies among infants and young children with symptoms consistent with respiratory illness during peak RSV season (late January through March) demonstrated a sensitivity, specificity, and PPV for RRADT of 80%–85%, 96%–100%, and 85%–100%, respectively (1–3). However, the reported PPV of a test might not be applicable if the patient being tested is dissimilar to the population evaluated to determine the PPV; in this case, the PPV of a test used on symptomatic infants might not necessarily apply to asymptomatic infants, even if both are tested during peak RSV season.
Other possible contributors to the high rate of false positives include contaminated viral transport media or applied topical preparations, such as emollients to the neonates’ nares. Aliquots from all infant nasopharyngeal specimens were provided to the RRADT manufacturer without personal identifying informa-tion for validation and verification; testing of these specimens was conducted by the manufacturer, and the hospital laboratory RRADT results were replicated.
At the conclusion of the investigation, Wisconsin Division of Public Health recommended to the facility that the RRADT be used only for testing symptomatic neonates in accordance with manufacturer guidelines. In addition, the division rec-ommended that any positive RRADT results be confirmed by real-time PCR that would detect RSV A and B. Diagnostic tests indicated for use in patients with a characteristic clinical illness might produce misleading results if used for another purpose, such as for screening of asymptomatic patients.
1Epidemic Intelligence Service, CDC; 2Division of Public Health, Wisconsin Department of Health Services; 3Wisconsin State Laboratory of Hygiene.
Corresponding author: Lina I. Elbadawi, [email protected], 608-266-0392.
References1. Wisconsin Department of Health Services. Respiratory virus surveillance
report for the week ending June 20, 2015, week 24–15. Available at https://www.dhs.wisconsin.gov/influenza/influenza-report-week-24.pdf.
2. Kanwar N, Hassan F, Nguyen A, Selvarangan R. Head-to-head comparison of the diagnostic accuracies of BD Veritor™ System RSV and Quidel® Sofia® RSV FIA systems for respiratory syncytial virus (RSV) diagnosis. J Clin Virol 2015;65:83–6.
3. Leonardi GP, Wilson AM, Dauz M, Zuretti AR. Evaluation of respiratory syncytial virus (RSV) direct antigen detection assays for use in point-of-care testing. J Virol Methods 2015;213:131–4.
Notes from the Field

Morbidity and Mortality Weekly Report
858 MMWR / August 14, 2015 / Vol. 64 / No. 31
Announcement
Community Preventive Services Task Force Issues 2014–2015 Annual Report to Congress
The Community Preventive Services Task Force recently posted a new report on its website: 2014–2015 Annual Report to Congress, Federal Agencies, and Prevention Stakeholders. This report includes a special update on task force recommendations to prevent cancers and is available at http://www.thecommu-nityguide.org/annualreport.
Established in 1996 by the U.S. Department of Health and Human Services, the task force is an independent, nonfederal, unpaid panel of public health and prevention experts whose members are appointed by the Director of CDC. The task force provides information for decision makers on programs, services, and policies aimed at improving population health. Although CDC provides administrative, research, and techni-cal support for the task force, the recommendations developed are those of the task force and do not undergo review or approval by CDC.

Morbidity and Mortality Weekly Report
MMWR / August 14, 2015 / Vol. 64 / No. 31 859
TABLE. Average start time and percentage distribution of start times for public middle, high, and combined schools,* by school level and state — Schools and Staffing Survey 2011–12 school year
School level and state
Estimated no. of public middle,
high, and combined schools
Estimated no. of students in public middle, high, and combined schools
Average start time (a.m.)¶
Percentage distribution† of public middle, high, and combined school start times
Before 7:30 a.m.
7:30 a.m. to 7:59 a.m.
8:00 a.m. to 8:29 a.m.
8:30 a.m. or later
No. (SE) No. (SE) Time (SE)§ % (SE) % (SE) % (SE) % (SE)
Total 39,700 (390) 26,284,000 (613,100) 8:03 (1) 6.7 (0.4) 31.9 (0.8) 43.7 (0.8) 17.7 (0.7)School levelMiddle 13,990 (169) 8,674,000 (135,800) 8:04 (1) 4.8 (0.7) 35.9 (1.3) 40.4 (1.1) 18.9 (1.0)High 18,360 (434) 14,995,000 (413,600) 7:59 (1) 9.5 (0.6) 33.0 (1.1) 43.1 (1.1) 14.4 (0.9)Combined 7,350 (571) 2,615,000 (300,600) 8:08 (3) 3.5 (0.7) 21.6 (2.2) 51.5 (2.6) 23.4 (2.7)StateAlabama 680 (39) 344,000 (31,100) 7:49 (2) 6.4 (2.2)†† 57.8 (4.4) 34.0 (5.3) —** —Alaska —** — —** — 8:33 (8) 0.0 —§§ 11.6 (3.8)†† 11.6 (4.8)†† 76.8 (7.8)Arizona 860 (159) 506,000 (53,100) 8:03 (3) 8.1 (2.9)†† 23.3 (6.6) 47.3 (5.8) 21.3 (5.0)Arkansas 450 (28) 292,000 (30,300) 8:01 (1) —** — 29 (4.7) 63.0 (4.7) 7.3 (2.0)California 3,880 (219) 3,303,000 (146,300) 8:07 (2) 3.5 (0.9) 27.7 (3.1) 47.6 (3.3) 21.2 (2.9)Colorado 730 (84) 527,000 (51,700) 7:54 (2) 16.9 (5.1) 31.3 (6.6) 40.9 (5.1) 10.9 (2.6)Connecticut 380 (24) 260,000 (23,900) 7:46 (2) 13.8 (2.9) 57.4 (4.2) 24.0 (3.8) 4.8 (2.1)††
Delaware 090 (4) 63,000 (4,900) 7:42 (3) 24.0 (5.3) 51.9 (6.3) 16.6 (4.6) 7.5 (3.0)††
District of Columbia
—** — —** — —** — —** — —** — —** — —** —
Florida 1,570 (100) 1,406,000 (111,400) 8:17 (3) 19.5 (2.5) 18.6 (2.4) 19.3 (2.9) 42.6 (3.8)Georgia 1,030 (24) 955,000 (77,500) 8:09 (2) —** — 28.7 (4.3) 43.9 (4.6) 24.0 (3.4)Hawaii —** — —** — 8:03 (3) 0.0 —§§ 42.5 (17.3)†† 57.5 (17.3)†† 0.0 —§§
Idaho 370 (182) 157,000 (40,300) 8:13 (28) 0.0 —§§ 20.9 (7.5)†† 58.3 (14.5) —** —Illinois 1,590 (48) 1,008,000 (145,200) 8:13 (3) —** — 19.7 (3.4) 48.7 (5.5) 28.4 (6.0)Indiana 740 (27) 559,000 (43,800) 7:58 (2) —** — 41.8 (3.2) 45.1 (4.0) 10.2 (2.7)Iowa 550 (35) 249,000 (31,300) 8:23 (6) 0.0 —§§ 6.3 (2.0)†† 66.3 (7.2) 27.4 (7.6)Kansas 540 (20) 204,000 (20,000) 8:00 (1) —** — 26.5 (3.5) 71.5 (3.7) —** —Kentucky 710 (32) 358,000 (33,100) 8:03 (4) 8.6 (4.2)†† 24.8 (4.0) 49.0 (5.8) 17.5 (4.0)Louisiana 630 (32) 316,000 (33,100) 7:40 (2) 29.9 (4.8) 53.1 (4.9) 12.1 (3.5) —** —Maine 240 (5) 105,000 (5,500) 7:53 (3) 6.6 (1.9) 53.1 (5.1) 32.8 (4.8) 7.5 (3.6)††
Maryland —** — —** — —** — —** — —** — —** — —** —Massachusetts 700 (58) 527,000 (48,600) 7:53 (4) 8.0 (3.6)†† 53.3 (6.1) 27.2 (5.1) 11.5 (5.4)††
Michigan 1,540 (47) 891,000 (59,100) 7:54 (2) 9.5 (2.1) 43.6 (3.6) 39.0 (3.5) 7.9 (2.2)Minnesota 1,100 (58) 522,000 (43,100) 8:18 (3) 0.9 (0.4)†† 18.8 (2.6) 46.7 (3.7) 33.6 (3.5)Mississippi 570 (23) 272,000 (18,600) 7:47 (2) 12.4 (3.7)†† 58.3 (4.3) 29.3 (4.3) 0.0 —§§
Missouri 900 (37) 530,000 (28,700) 7:54 (1) 6.7 (1.7) 39.0 (3.9) 51.0 (3.9) 3.2 (1.4)††
Montana 220 (15) 78,000 (8,200) 8:13 (2) 0.0 —§§ 5.8 (2.1)†† 80.9 (6.1) 13.4 (5.5)††
Nebraska 370 (26) 150,000 (19,200) 8:07 (1) 0.0 —§§ 8.0 (2.5)†† 88.9 (2.4) 3.0 (1.4)††
Nevada 260 (12) 276,000 (20,900) 7:51 (3) 18.0 (3.0) 30.7 (5.5) 38.2 (6.0) 13.1 (3.6)New Hampshire 180 (18) 116,000 (7,800) 7:46 (2) 11.6 (3.2) 64.4 (5.7) 19.7 (4.4) —** —New Jersey 870 (52) 698,000 (45,200) 8:00 (2) 6.7 (2.0) 37.2 (4.5) 41.2 (4.7) 14.9 (3.6)New Mexico 310 (99) 151,000 (47,000) 8:10 (3) 1.6 (0.7)†† 24.1 (5.8) 53.9 (10.2) 20.4 (5.9)New York 2,070 (108) 1,670,000 (149,100) 7:59 (2) 7.7 (3.1)†† 31.6 (2.9) 49.6 (3.4) 11.0 (2.5)North Carolina 1,120 (35) 768,000 (88,900) 8:03 (2) —** — 36.6 (5.0) 45.3 (5.4) 15.2 (4.2)North Dakota 220 (9) 67,000 (5,000) 8:31 (1) 0.0 —§§ 2.8 (1.2)†† 18.7 (3.2) 78.5 (3.4)Ohio 1,640 (73) 1,061,000 (60,800) 7:52 (2) 13.1 (2.0) 45.3 (4.3) 29.3 (3.7) 12.3 (3.0)
See table footnotes on next page.
Erratum
Vol. 64, No. 30In the report, “School Start Times for Middle School and
High School Students — United States, 2011–12 School Year,” an error occurred in the arrangement of column headings in the table on pages 811 and 812. The corrected table follows.

Morbidity and Mortality Weekly Report
860 MMWR / August 14, 2015 / Vol. 64 / No. 31
TABLE. (Continued) Average start time and percentage distribution of start times for public middle, high, and combined schools,* by school level and state — Schools and Staffing Survey 2011–12 school year
School level and state
Estimated no. of public middle,
high, and combined schools
Estimated no. of students in public middle, high, and combined schools
Average start time (a.m.)¶
Percentage distribution† of public middle, high, and combined school start times
Before 7:30 a.m.
7:30 a.m. to 7:59 a.m.
8:00 a.m. to 8:29 a.m.
8:30 a.m. or later
No. (SE) No. (SE) Time (SE)§ % (SE) % (SE) % (SE) % (SE)
Oklahoma 700 (27) 356,000 (29,000) 8:10 (2) 0.0 —§§ 12.0 (2.8) 77.6 (3.9) 10.4 (2.8)Oregon 480 (25) 282,000 (21,100) 8:14 (3) —** — 25.2 (3.8) 45.0 (4.1) 28.9 (4.2)Pennsylvania 1,280 (145) 1,001,000 (189,700) 7:48 (2) 13.0 (3.0) 51.3 (6.6) 32.6 (7.9) 3.1 (1.3)††
Rhode Island 100 (10) 68,000 (6,200) 7:50 (4) 24.8 (6.1) 27.5 (7.9) 40.3 (9.2) —** —South Carolina 500 (9) 411,000 (26,400) 8:03 (2) —** — 35.3 (6.5) 50.9 (6.8) 12.3 (3.7)South Dakota 230 (11) 78,000 (5,200) 8:13 (2) —** — 6.6 (2.7)†† 77.7 (4.2) 14.8 (4.9)††
Tennessee 760 (47) 533,000 (31,000) 7:57 (3) 13.3 (3.4) 29.4 (4.7) 40.0 (5.1) 17.2 (3.5)Texas 3,940 (183) 2,556,000 (254,700) 8:05 (2) 3.1 (1.2)†† 28.3 (3.4) 46.3 (3.5) 22.4 (2.7)Utah 410 (22) 297,000 (45,200) 8:05 (3) 0.0 —§§ 33.1 (5.3) 49.6 (5.9) 17.3 (5.9)††
Vermont 100 (2) 46,000 (2,600) 8:05 (2) —** — 34.1 (5.1) 48.0 (4.8) 15.1 (3.0)Virginia 850 (17) 555,000 (37,700) 8:04 (2) 10.0 (2.6) 26.6 (4.4) 42.6 (4.4) 20.8 (3.6)Washington 930 (35) 526,000 (42,300) 8:08 (2) 6.4 (1.9)†† 24.2 (3.8) 50.2 (4.6) 19.3 (3.5)West Virginia 300 (5) 160,000 (7,000) 7:54 (2) 11.1 (2.0) 33.9 (3.3) 47.9 (4.0) 7.1 (2.3)††
Wisconsin 860 (37) 423,000 (44,200) 7:59 (3) 2.3 (1.0)†† 48.2 (5.4) 39.1 (4.3) 10.4 (4.4)††
Wyoming 130 (8) 50,000 (4,300) 7:59 (1) 0.0 —§§ 41.1 (5.2) 58.9 (5.2) 0.0 —§§
Source: U.S. Department of Education, National Center for Education Statistics, Schools and Staffing Survey (SASS), “Public School Data File,” 2011–12.Abbreviation: SE = standard error. * Middle schools include any schools with no grade lower than 5 and no grade higher than 8. High schools include any school with no grade lower than 7 and at
least one grade higher than 8. Combined schools include any schools with at least one grade lower than 7 and at least one grade higher than 8, or with all students in ungraded classrooms.
† Detail may not sum to totals because of rounding and because some data are not shown. § SE of average start time is expressed in minutes. ¶ Schools with afternoon start times were not included in analysis. ** Reporting standards not met. Relative standard error ≥0.5 or the response rate <50%. †† Interpret data with caution. 0.3 ≤ relative standard error < 0.5. §§ Rounds to zero. SE is not applicable.

Morbidity and Mortality Weekly Report
MMWR / August 14, 2015 / Vol. 64 / No. 31 861
Erratum
Vol. 64, No. 30In the report, “Lack of Measles Transmission to Susceptible
Contacts from a Health Care Worker with Probable Secondary Vaccine Failure — Maricopa County, Arizona, 2015,” on page 833, the last sentence of the report, “2 doses of MMR vaccine, administered ≥28 days apart, are recommended for children aged ≥12 months and adults born after 1956, for preven-tion of measles,” should be replaced with the sentence: “All vaccine-eligible persons aged ≥12 months should receive the age-appropriate number of MMR vaccine doses unless they have other evidence of measles immunity.”

Morbidity and Mortality Weekly Report
862 MMWR / August 14, 2015 / Vol. 64 / No. 31
In 2013, overall, 8.4% of primary care physicians reported that they did not accept new patients. However, acceptance varied by the patient’s expected payment source: 35% of physicians did not accept new Medicaid patients, 27.7% did not accept new Medicare patients, and 19.3% did not accept new privately insured patients.
Source: National Electronic Health Records Survey data, available at http://www.cdc.gov/nchs/ahcd/ahcd_questionnaires.htm.
Reported by: Esther Hing, MPH, [email protected], 301-458-4271; Sandra Decker, PhD; Eric Jamoom, PhD.
QuickStats
FROM THE NATIONAL CENTER FOR HEALTH STATISTICS
* With 95% confidence intervals.
0 5 10 15 20 25 30 35 40
Not accepting any new patients
Private insurance
Medicare
Medicaid
% of physicians
Percentage* of Office-Based Primary Care Physicians Not Accepting New Patients, by Source of Payment — United States, 2013

ISSN: 0149-2195
The Morbidity and Mortality Weekly Report (MMWR) Series is prepared by the Centers for Disease Control and Prevention (CDC) and is available free of charge in electronic format. To receive an electronic copy each week, visit MMWR’s free subscription page at http://www.cdc.gov/mmwr/mmwrsubscribe.html. Paper copy subscriptions are available through the Superintendent of Documents, U.S. Government Printing Office, Washington, DC 20402; telephone 202-512-1800.
Readers who have difficulty accessing this PDF file may access the HTML file at http://www.cdc.gov/mmwr/index2015.html. Address all inquiries about the MMWR Series, including material to be considered for publication, to Executive Editor, MMWR Series, Mailstop E-90, CDC, 1600 Clifton Rd., N.E., Atlanta, GA 30329-4027 or to [email protected].
All material in the MMWR Series is in the public domain and may be used and reprinted without permission; citation as to source, however, is appreciated.
Use of trade names and commercial sources is for identification only and does not imply endorsement by the U.S. Department of Health and Human Services.
References to non-CDC sites on the Internet are provided as a service to MMWR readers and do not constitute or imply endorsement of these organizations or their programs by CDC or the U.S. Department of Health and Human Services. CDC is not responsible for the content of these sites. URL addresses listed in MMWR were current as of the date of publication.
Morbidity and Mortality Weekly Report