bicycle and pedestrian detection final report stop 320 395 john ireland ... 6.1 ferrous-metal...
TRANSCRIPT

BICYCLE AND PEDESTRIAN DETECTION
Final Report
February 27, 2003
Prepared for:
United States Department of Transportation Federal Highway Administration
and
Minnesota Department of Transportation
Office of Traffic Engineering/ITS Mail Stop 320
395 John Ireland Boulevard St. Paul, MN 55155-1899
(651) 282-2115
Prepared by:
SRF Consulting Group, Inc. Suite 150
One Carlson Parkway Minneapolis, MN 55447
(763) 475-0010

i
TABLE OF CONTENTS 1. Project Overview 1
1.1 Introduction 1 1.2 Background 1 1.3 Project Objectives 1 1.4 Participating Vendors and Sensors 2 1.5 Description of Test Site 3 1.6 Report Outline 4
2. Bicycle and Pedestrian Detection Applications 5 3. Literature Review 9 4. Commercially Available Detection Systems 12
4.1 PUSSYCATS - Automated Pedestrian Detection 12 4.2 Traffic 2000 Limited - Pedestrian Detection 12 4.3 PUFFIN – Automated Pedestrian System 12 4.4 NOVAX - Automated Pedestrian Crossing System 13 4.5 ASIM – Dynamic Pedestrian Detection 13 4.6 Microwave Sensors – Pedestrian Detection 13 4.7 The Japanese Advanced Cruise-Assist Highway System Research Associate –
Pedestrian Detection 13 5. Field Test Description 14
5.1 Introduction 14 5.2 Sensor Installation 15 5.3 Data Collection System 19 5.4 Baseline Data 20 5.5 Data Collection 20
6. Analysis and Results 22 6.1 Ferrous-Metal Bicycle Detection Results 22 6.2 Non-Ferrous (Aluminum) Bicycle Detection Results 22 6.3 Pedestrian Detection Results 23
7. Conclusions 24 8. Next Steps 25 9. References 27

1
1. Project Overview 1.1 INTRODUCTION The majority of traffic detection technology and sensor research has focused on the detection of “motorized” traffic. This has left a need for objective information on the performance of “non-motorized’ traffic detectors. Bicycles and pedestrians are the two most common types of non-motorized traffic. In recent years, sensors have been developed to detect the presence of pedestrians and the speed and presence of bicycles. This has been accomplished with a variety of technologies, including microwave, infrared, video and inductive loops. With the development of ITS applications, automated pedestrian detectors are beginning to compliment the existing pushbutton detectors. These applications optimize intersection operations and improve safety by reducing the conflicts between vehicles and pedestrians. Similarly, bicycle detectors are being used to provide detection inputs to traffic signals for call and extend functions. These technologies are also a valuable tool in gathering historic data. This report documents the current state of pedestrian and bicycle detection and presents evaluation results from a field test conducted of six different bicycle/pedestrian sensors. 1.2 BACKGROUND The Bicycle and Pedestrian Detection Project is a component of the Evaluation of Non-Intrusive Technologies for Traffic Detection (NIT Project) which is funded by Federal Highway Administration (FHWA) and Minnesota Department of Transportation (Mn/DOT). The evaluation of sensor performances for motorized traffic detection was completed in two phases; Phase I evaluated 17 different non-intrusive sensors from 1995 to 1997 and Phase II investigated 9 non-intrusive sensors from 2000 to 2002. Results obtained from these two phases of research are available on the Mn/DOT NIT website at http://projects.dot.state.mn.us/nit/. In October 2001, an Evaluation Test Plan was developed to guide the evaluation of NIT Phase II. The desire to detect non-motorized traffic was listed as one of the project goals and objectives in this test plan. After the completion of the Phase II Final Report in September 2002, the bicycle and pedestrian evaluation started. Literature search, sensor procurement and test site selection and preparation were conducted prior to the official data collection and evaluation. Official data collection was conducted on October 8, 2002. Data analysis and report preparation were completed in the subsequent months. 1.3 PROJECT OBJECTIVES The primary goal of this project is to identify the applications and evaluate the accuracy of different non-intrusive technologies in detection of non-motorized traffic, namely bicycles and pedestrians. This project goal is supported by the following objectives:

2
Objective 1: Identify the applications for non-motorized traffic detection Objective 2: List similar projects that had been conducted in non-motorized traffic
detection Objective 3: Conduct a field test to evaluate participating sensor performance 1.4 PARTICIPATING VENDORS AND SENSORS An extensive vendor database was developed in NIT Phase II. This database includes vendors from the United States and around the world that manufacture non-intrusive traffic sensors. The database is contained in Appendices A and B of the NIT Phase II Final Report (available on the project website). This database was reviewed to select those sensors that have the ability to detect bicycles or pedestrians. These vendors were contacted in August 2002 to identify candidate sensors and determine their interest in participating in this test. Ultimately, five vendors agreed to participate in the test, including one international vendor. With the addition of existing inductive loop detectors, a total of six sensors representing five different technologies were field tested and evaluated. Table 1 lists the vendors, sensors and other technical data for those that participated in the field evaluation. Notice that the list includes a combination non-intrusive and intrusive sensors. Intrusive sensors were included because bicycle and pedestrian trails are much easier to close than roadways during sensor installation. Table 1 Summary Of Participating Vendors And Sensors
Vendor Sensor
Technology
Pedestrian / Bicycle Detection
Installation
Power Supply
ASIM DT 272
Passive Infrared / Ultrasonic
Pedestrian / Bicycle
Sidefire
12 – 24 VDC
Diamond TTC-4420
Infrared Pedestrian / Bicycle
Sidefire
Internal Power Supply: 6 V
MS Sedco SmartWalk 1400
Microwave Pedestrian / Bicycle
Sidefire
12 – 24 VAC or VDC
ISS/TCC Autoscope Solo
Video Pedestrian / Bicycle
Sidefire
24 VAC for Solo MVP 110-220 VAC for Interface Panel
3M Microloop
Magnetic
Metal Bicycle Under Pavement 12 – 24 VDC
Inductive Loop Detector
Magnetic Metal Bicycle Under Pavement 24 VDC

3
1.5 DESCRIPTION OF TEST SITE The Cedar Lake Trail, located within one-half mile of the NIT test site, was selected for this test. This is a bicycle and pedestrian commuter facility with a pedestrian lane and two bicycle lanes. The bicycle and pedestrian trails are physically separated on the portion of the trail selected for testing. This test site is on the western end of the I-394 underpass. An existing loop detector count station provided a source of power and cabinet to house data collection equipment. Data from the existing loop detectors was captured and used as another sensor for this test. Microloop detectors were installed in the pavement and all of the remaining sensors were mounted on an existing light pole next to the cabinet. Figure 1 shows the test site. Refer to Section 5 for a more detailed description of the sensor installation and data acquisition system.
Figure 1: Field Test Site
Bike Trail Pedestrian TrailCabinet
Light Pole

4
1.6 REPORT OUTLINE Chapter 2 describes primary applications for detecting bicycles and pedestrians. Chapter 3 summarizes the literature review of previous studies and research in this area. Detailed information on non-motorized detection systems that are commercially available is included in Chapter 4. Test procedures and detailed test information, including data collection procedures are described in Chapter 5. Data analysis and test results summary are presented in Chapter 6. Conclusions, future related studies and references are included in Chapter 7, 8 and 9.

5
2. Bicycle and Pedestrian Detection Applications The detection of bicycles and pedestrians can improve the safety, convenience and efficiency of transportation systems. Detection applications range from pedestrian presence detection to volume data for bicycle facilities. A list of major applications of non-motorized traffic detection is provided below. 1. Curbside Pedestrian Detection
Curbside detection of pedestrians at a signalized intersection can be used to automatically place a call to the traffic signal controller for a pedestrian WALK indication. A similar application detects pedestrians at the curb and automatically activates a flashing beacon. This application may be used at pedestrian crossings in school zones. Curbside detection is commonly used in conjunction with the standard pedestrian pushbutton. The automatic detection is then considered a supplemental component of the crossing; it is not intended to replace the function of the pushbutton. A good example of an automated pedestrian detection application is a pedestrian crosswalk flasher system installed at the Weaver Lake Elementary School in Maple Grove, Minnesota in 1997. The system uses the NOVAX Lane King ultrasonic sensor to detect the presence of pedestrians waiting at the curb. When a pedestrian is detected, a flashing beacon is activated through a signal control cabinet to alert the approaching vehicles to the presence of pedestrians in the crossing. The system supplements the standard pushbutton. The automatic detection was added to increase the safety of children who may not always use the pushbutton.
Figures 2 and 3 illustrate the project site and a close-up of the detector.
2. Crosswalk Pedestrian Detection
The detection of pedestrians in the crosswalk of a signalized intersection can be used to extend the pedestrian phase of the intersection’s traffic signal. This application increases the safety of the crossing by allowing extra walk time for pedestrians who may need more time to make the crossing. The crossing’s efficiency is also improved by truncating the walk phase if the crossing has cleared.
3. Intersection Approach Bicycle Detection
Bicycle detection can been used to provide presence information at approaches to signalized intersections. The detection provides a signal actuation input to the intersection controller, enabling the detection of both bicycles and vehicles. This improves the safety of the intersection by servicing bicycle movements when they are detected, reducing the frequency of bicyclists disobeying the traffic signal. Conventional inductive loop detectors are normally not sensitive enough to detect bicycles. Specially-designed bicycle loop detectors must be installed for this purpose. Research conducted by the Montana Department of Transportation in

6
Missoula, Montana, by the Australian Road Research Board, and by the 3M Corporation have produced some detector designs. Refer to Section 3.3, 3.4 and 9 for details.
4. Historical Data
Volume, speed and classification data can be used to provide a historic record of facility usage for a variety of users (i.e. bicyclists, pedestrians and in-line skaters).

7
Figure 2: Weaver Lake Elementary School Crosswalk Flasher System
Detection Zone

8
Figure 3: Sensor and Flasher Pole
Ultrasonic Sensor (Supplemental Detector)
Pushbutton (Primary Detector)

9
3. Literature Review This section summarizes the results of a literature search in bicycle and pedestrian detection. 3.1 Hughes and Huang – Automated Pedestrian Detection Ronald Hughes and Herman Huang evaluated an automated pedestrian detection system that supplements the existing pushbutton crossing system to reduce pedestrian/vehicle conflicts and inappropriate crossings at signalized intersections. Two technologies were used for the detection study: a microwave-based sensor (SMARTWALK 1400 by Microwave Sensors, Inc.) and an infrared-based sensor. The systems were installed in three test sites: Los Angeles, CA (Infrared and microwave), Phoenix, AR (microwave), and Rochester, NY (microwave). Video data was collected for “before” and “after“ periods of sensor operations. Analysis of the video images was conducted through the comparison of "with" and "without" operations of the pedestrian detection to determine the advantages of the system. Three performance measurements were examined: • Occurrence of vehicle-pedestrian conflicts • Pedestrian likelihood of crossing during different signal phases • Pedestrian behaviors while crossing (run, hesitated or aborted) Results – The study showed that there was a significant reduction both in vehicle-pedestrian conflicts and the likelihood of inappropriate pedestrian crossings when using the automated pedestrian detection system in conjunction with conventional pedestrian call devices. At the same time, the system also improved the pedestrian crossing behavior. The data proved that automated pedestrian detection capabilities can provide significant operational and safety benefits. There was no significant difference between using microwave-based sensors and infrared-based sensors. 3.2 University of Northumbria – Advances in Automated Pedestrian Counting Sexton and Zhang developed an image-processing algorithm to count pedestrians in real time manner. They performed a comparative analysis to evaluate the system’s algorithm. The video sensor and video sensor processor (TMS320C50) were used in the system. Video data was recorded by SNCF at the test sites and time periods of greatest interest. The evaluation was conducted by comparing manually recorded counts to the system processed counts. The average error was calculated as performance measurements in the analysis. Results – Performance of the system exceeded the original expectations with average error of 13.6 percent for total flow in and 9.3 percent for total flow out. The tests also demonstrated the capability of the system to provide a bi-directional counting accuracy of better than 85 percent.
10
3.3 Australian Road Research Board Ltd. – Bicycle Detection Ronald Leschinski conducted an experiment to evaluate bicycle detection using inductive loops in 1994. Four types of loops were tested in the study: the Symmetripole Loop, the Sturminster Newton Loop, California University Loop and the Chinese SCOOT Loop. The change in loop inductance measured between the open road and with a vehicle over the loop was used as analytical measurements. The study compared the performances of four different loops against the standard installed loop in detecting different types of bicycles based on the measurements. Results – The results showed that the Symmetripole Loop is inadequate for bicycle detection and the other three loops proved to have better performance in detecting variety types of bicycle. The Chinese SCOOT Loop demonstrated the best performance for all types of bicycles at different sensitivity levels. 3.4 Maki and Marshall – Bicycle Detection Pam Maki and Peter Marshall conducted a case study on bicycle detection using an inductive loop detector with a unique shape and a specific winding pattern in Missoula, Montana. As a component of a traffic signal system upgrade for the City of Missoula, the Montana Department of Transportation added 154 loop detectors to 32 actuated signalized intersections throughout the city. The detectors are used to accommodate both bicycles and vehicles in the same lane with the same equipment. 3M Company developed the loop design. The configuration of the newly designed loop detector is an 8-foot by 8-foot square with wire running in three parallel diagonals. This configuration provides the sensitivity to detect the bicycles. Installation and placement information were also provided in the discussion. Results – The study found that the loop’s winding pattern, shape and size are all factors that affect its performance. A good loop design considers these factors, resulting in a sensitivity that can detect the presence of both bicycles and vehicles. 3.5 Purdue University – Bicycle Detection Parker and Eidson evaluated the performance of bicycle detection and in-line skate detection using both traditional bicycle loops and magnetometers (3M’s Microloop) in 2000. The test was conducted using the loop-test bed and detection equipment in Purdue University, Indiana. The study evaluated how well the two different loops could detect bicycles and in-line skaters. The test used two bicycles and two in-line skates that drove over the loop detectors at different speeds and different paths. Presence mode data was recorded for each bicycle trial. The analysis was conducted by comparing the successful detection of these two modes by the loops. Results – The study showed that Microloops were better in detecting bicycles than traditional loops but both loops did not detect in-line skates in any test situations. It also

11
indicated that detection performance is independent of speed, position and movement angle for both inductive loops and magnetometers. 3.6 United States Department of Transportation – Bicycle and Pedestrian Data The Bureau of Transportation Statistics recently published Bicycle and Pedestrian Data: Sources, Needs and Gaps. This in-depth study identified volume as one of the most critical data requirements. Volume data can provide specific information on user characteristics, time of day, day of week, geographic area, or facility type. The study identified the following use for historical volume data: • Tracking trends in usage
• Developing exposure measures for crash analysis
• Evaluating level of service on a facility by comparing volumes to capacity
• Identifying and prioritizing improvements
• Calibrating travel demand models The study identifies the need for systematic data collection. Consistency would allow different metropolitan areas to aggregate their data and compare trends over time. The study goes on to state that a need exists to develop “uniform data collection methods and reporting formats, demonstrating new data collection technologies, and developing case studies for successful data collection efforts”. 3.7 University of Massachusetts – Automated Bicycle/Pedestrian Detection Noyce and Dharmaraju conducted a study on automated bicycle and pedestrian detection in 2001. The study identified existing ITS technologies that can detect bicycles and pedestrians in the transportation industry, including their applications and limitations. An active infrared sensor (Autosense II) was specifically selected and evaluated for its capabilities of counting and classification of bicycle and pedestrian in the study. Results - Field tests found that Autosense II was very effective in both detection and classification of bicyclists and the detection of pedestrians. The results showed that 97 percent of the bicyclists observed were correctly detected and 92 percent of pedestrians observed were successfully detected. The study results also showed that 77 percent of bicyclists detected were correctly classified as “non-motorized” traffic. The report also indicated that none of the market-available ITS sensors were effective at both detection and classification of bicycles and pedestrians. Active infrared and video sensors were the technologies that are capable of detecting and classifying pedestrians and bicycles. The Final Report included a discussion of infrared sensor algorithm, causes of detection errors, and recommendations for changes in Autosense II hardware and software.

12
4. Commercially Available Detection Systems Several automated pedestrian and bicycle detection systems are commercially available. A brief description of each of these systems is provided here. Some of these systems have been formally evaluated, in which case the evaluation results are summarized. 4.1 PUSSYCATS - AUTOMATED PEDESTRIAN DETECTION Pedestrian Urban Safety SYstem and Comfort At Traffic Signals (PUSSYCATS) is an intelligent crossing system that incorporates an automated pedestrian detection system. The system can be adapted to pedestrian behavior and needs. The system utilizes a curbside mat detector (pressure sensor) instead of the conventional pushbutton to detect the presence of pedestrians waiting on the curb and uses an infrared sensor to detect the presence of pedestrians at the crossing. By detecting the both waiting and walking pedestrians, PUSSYCATS can help pedestrians who have difficulty pressing the crossing button pass a call to the signal system, improve the efficiency by adapting the signal timing to the behavior of the pedestrians, and increase the safety through better detection of the presence of pedestrians at the curb and in the crosswalk. PUSSYCATS has proven to be an efficient, safe and convenient system with its adaptation to the needs of pedestrians. 4.2 TRAFFIC 2000 LIMITED - PEDESTRIAN DETECTION Traffic 2000 Limited Inc. developed the 2000 Pedestrians Detection System, a curbside pedestrian detection system that uses a pressure plate to detect pedestrians. The system consists of two components: detection plate and interface. The detection plate is actually a pressure sensor that uses a screened piezo cable. It connects to a microprocessor-controlled interface via a signal cable to detect the presence of pedestrians at the curb site. The detection zone can be customized by arranging the plates into different configurations during installation. The system has been approved by the UK Highway Agency. It can be used as the automated presence detector (mat) in the PUFFIN crossing system (See below). 4.3 PUFFIN – AUTOMATED PEDESTRIAN SYSTEM Pedestrian User Friendly Intelligent Crossing (PUFFIN) is an automated pedestrian detection and intelligent crossing system that was developed by AGD System Ltd in United Kingdom. Similar to PUSSYCATS, PUFFIN incorporates an automated pedestrian detection system to detect the presence of pedestrians by using either above-ground sensor, such as radar detector (AGD420), or in-ground pressure sensor mat. By detecting pedestrians in crosswalk, the system can request a cancel call right after a pedestrian leaves the crosswalk. Similarly, the system can provide an input to the controller so that the pedestrian crossing time may be extended as needed. These features increase the efficiency and safety of the crossing. Further more, the system detects the

13
presence of approaching vehicles by using radar detectors. This minimizes the disruption to traffic flow by delaying the pedestrian call until a gap in traffic occurs. In general, the system is able to provide increased efficiency for both pedestrian and vehicular road users. 4.4 NOVAX - AUTOMATED PEDESTRIAN CROSSING SYSTEM NOVAX Industries Corporation manufactures an ultrasonic sensor for the detection of pedestrians and/or vehicles. The sensor can be mounted overhead or to the side of the road. The detection zone can be adjusted to ensure that pedestrians are detected. 4.5 ASIM – DYNAMIC PEDESTRIAN DETECTION ASIM has developed a Dynamic Passive Infrared Pedestrian Detector that is used for automated pedestrian detection. It can improve the safety and efficiency of pedestrian crossings, optimize traffic flow through green phase extension, and monitor vehicle presence. The detectors are typically mounted on the top of a signal head and aimed to cover both the crosswalk and curbside waiting areas. 4.6 MICROWAVE SENSORS – PEDESTRIAN DETECTION MS Sedco markets a series of pedestrian detectors. These detectors can detect pedestrians in both the crosswalk and curbside areas. The technologies for the detection includes infrared and ultrasonic. The SmartWALK 1400 and SmartWALK 1800 have been certified by the FCC and used in different projects. The SmartWALK 1400 is able to initially detect pedestrians in the targeted curbside area and maintain that detection for even very small pedestrian movement (this sensor was evaluated in the field test portion of this project). The SmartWALK 1800 is able to detect the pedestrian moving in the designated crosswalk area, even if the movement is minimal. 4.7 THE JAPANESE ADVANCED CRUISE-ASSIST HIGHWAY SYSTEM RESEARCH
ASSOCIATE – PEDESTRIAN DETECTION The Japanese Advanced Cruise-Assist Highway System Research Associate (AHSRA) developed a new pedestrian detection sensor in 1999. The sensor can detect the location of the pedestrian when they cross the street and protect the vulnerable travelers from traffic accidents. The detection sensor detects the location of a moving object using visible light and to differentiate the human beings and moving vehicles by using the infrared image. The system can detect pedestrians within a wide area of a roadway and can provide data on pedestrian’s position and speed.

14
5. Field Test Description This section presents detailed information on the field evaluation components of the bicycle and pedestrian test. The test procedures described here are based on the test methodology presented in the Evaluation Test Plan. This section includes a description of the following test components: sensor installation, data collection system, baseline description, sensor data collection and data analysis. 5.1 INTRODUCTION While the bicycle and pedestrians field tests are conceptually very similar to the tests conducted at the freeway and intersection test sites, there were some distinctions that posed a significant challenge to testing activities. 1. First, there is no data collection shelter at the bicycle/pedestrian test site. This made
the bicycle/pedestrian test an outdoor version of the activities that were formerly conducted in the shelter. The limited trailside facilities only allow a temporary outdoor data collection station, not a permanent setup. Sensors and the necessary testing equipment could not be left at the test site overnight because of safety and security issues. As a result, sensors were installed and calibrated at the site, and then disassembled and removed for the night. The same procedure must be followed each day of testing; limiting the amount of testing that can be accomplished in one day. Because of these challenges, a two-day test plan was carefully developed: one day of sample data collection and one day of official data collection.
2. Second, the volume of pedestrians and bicycles using the trail varies based on the
time of day and the weather. Most bicyclists and pedestrians utilize trail facilities during the daylight hours; few use the facility after sunset or in bad weather. As a result, the raw volume of non-motorized traffic is much lower than motorized traffic volumes. Therefore, instead of collecting twenty-four hours traffic data as in freeway and intersection tests, the bicycle/pedestrian test only collected data when test personnel were in attendance. Ideally, the test should be conducted at a peak time of a day in a nice weather condition in order to obtain enough sample data. However, in order to meet the test schedule and get a decent amount of sample data, test personnel took turns riding one of two bicycles and walking/jogging through the detection zones during off peak periods. Approximately 300 observations were collected in this manner.

15
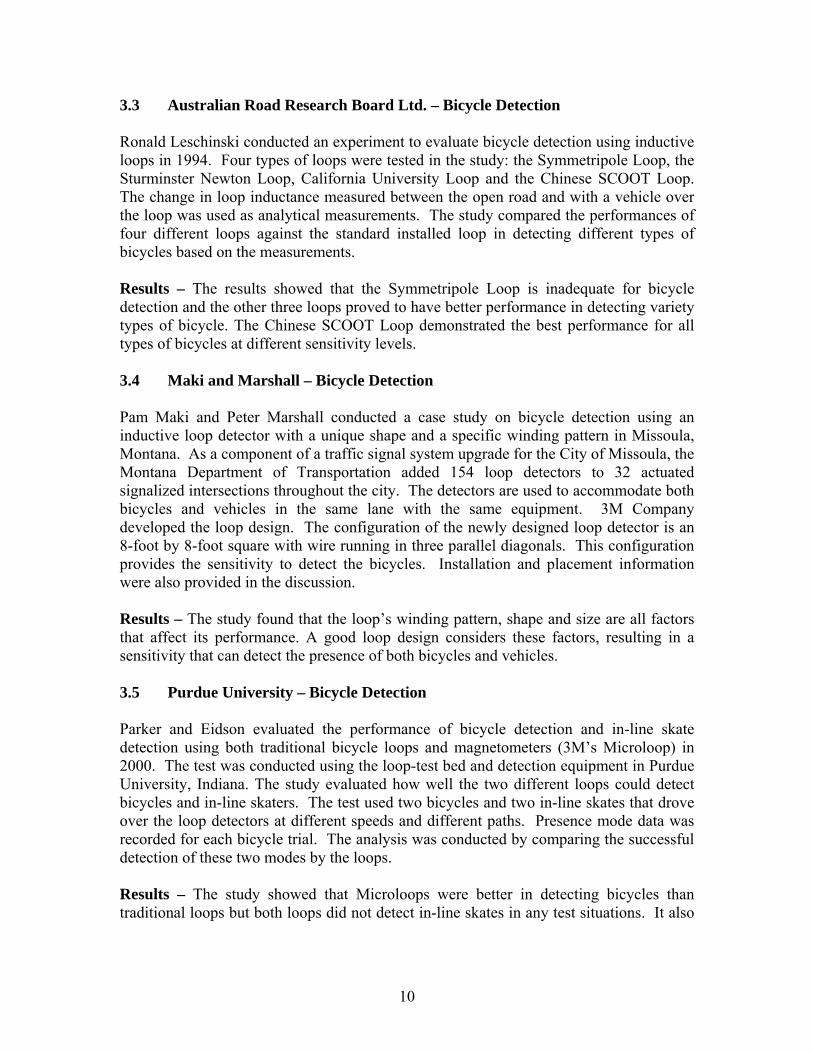
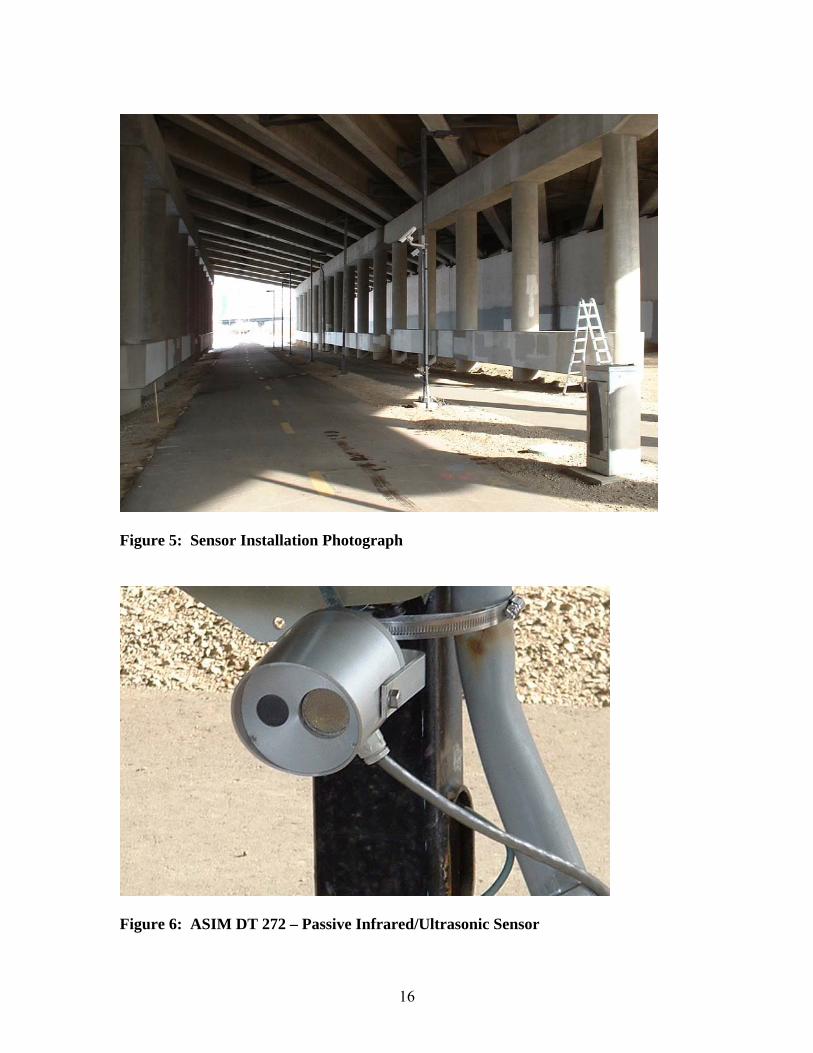
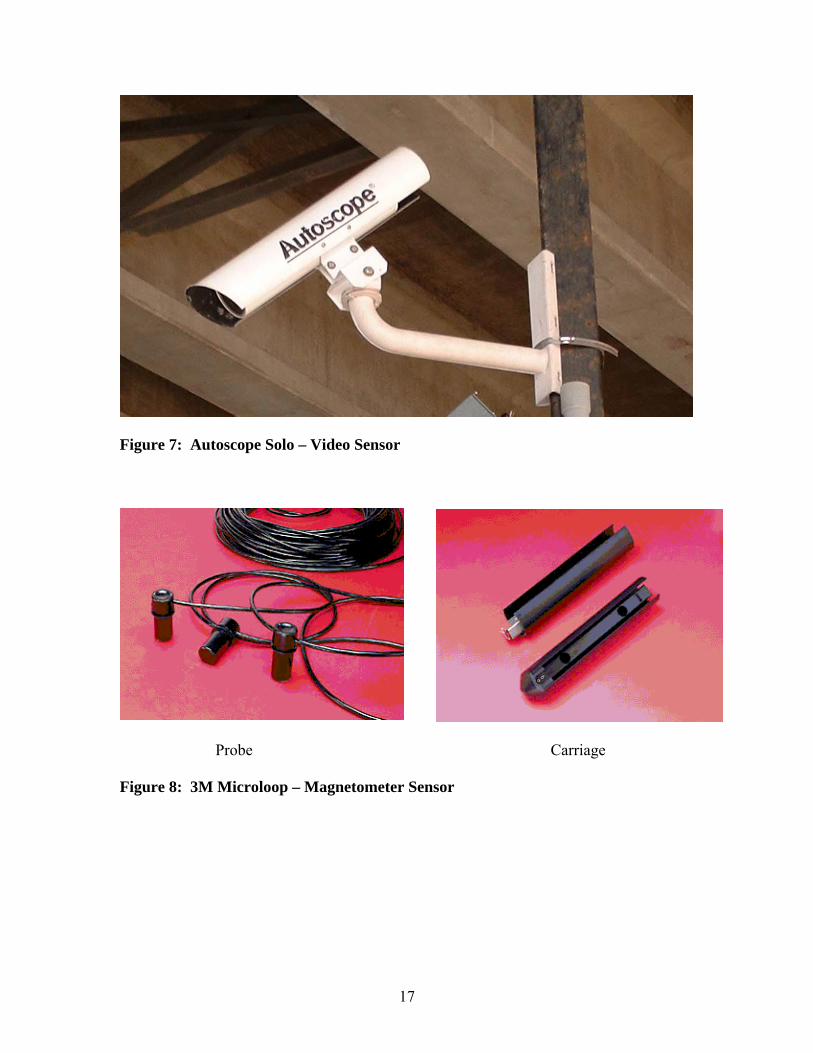
5.2 SENSOR INSTALLATION Inplace inductive loop detectors were included in this evaluation. 3M Microloops (magnetometers) were core-drilled in the pavement. Remaining sensors were installed at vendor-recommended heights on a sidefire light pole located in the median between the bicycle trail and pedestrian trail. Table 2 shows the mounting locations of each sensor. Table 2 Summary Of Sensor Mounting Locations Sensor Technology Mounting Height (Ft) ASIM – DT 272 Passive Infrared / Ultrasonic 3 Diamond – Traffic Counter Infrared 4 Ms Sedco – SmartWalk Microwave 10 Autoscope - Solo Video 12 3M Microloop Magnetic In-pavement Inductive Loop Magnetic In-pavement
All pole-mounted sensors were mounted to face the same detection zone. This allowed all sensors to detect objects that passed through the detection zone simultaneously, reducing errors related to lane switching. A three-inch reflector mounted on the top of a wood stick was installed on the opposite side of trail to receive and reflect the infrared beam transmitted from Diamond TTC sensor. Figures 4 and 5 show the sensor installation. Figures 6 through 10 are photographs of the installed sensors.
Existing Cabinet
Existing Light Pole
Autoscope Solo
MS Sedco - SmartWalk
ASIM DT272Diamond TTC
3M Microloop
Detection Zone
Loop Detector
Bicycle Trail Pedestrian Trail
Diamond TTC Reflector
Existing Handhole
Figure 4: Sensor Installation Schematic
16
Figure 5: Sensor Installation Photograph
Figure 6: ASIM DT 272 – Passive Infrared/Ultrasonic Sensor
17
Figure 7: Autoscope Solo – Video Sensor
Probe Carriage
Figure 8: 3M Microloop – Magnetometer Sensor

18
Diamond IR Emitter Diamond Reflector on Wood Stake Figure 9: Diamond TTC – Infrared Sensor
Figure 10: MS Sedco Traffic Counter – Microwave Sensor

19
5.3 DATA COLLECTION SYSTEM The data collection system in this test consisted of several portable hardware components, including three personal computers, a videocassette recorder (VCR), and a television. A terminal panel provided power and communication interface from inside the existing City of Minneapolis cabinet located at the test site. ● Personal Computers: used for sensor calibration, real time traffic monitoring, and
other functions involving vendor’s interface software. ● Automatic Data Recorder (ADR): a Peek ADR 3000 was used to capture relay
outputs from sensors that provided this output. ● Television: used for traffic monitoring and video sensor calibration. ● VCR: used for recording traffic images during data collection periods in order to
establish a permanent record of test activities. ● Terminal panel: used for power supply and interface communication. Figure 11 shows the data collection layout.
Television
3M Probes
ExistingCabinet
Terminal Panel
Power Supply
Bicycle Trail
Pedestrian Trail
3M Probes
Power Strip
Laptop computerTelevision Laptop computer
Existing Light Pole
Sensors
Communication Cables
Power Cables
Table
Loop
Loop
Existing Handhole
Figure 11: Test Site Schematic
20
5.4 BASELINE DATA Unlike the freeway and intersection test sites, which utilized inductive loop detectors as a baseline data source, manual observations served as the baseline for bicycle and pedestrian detection. Because the test was conducted in October, temperatures were not conducive to high bicycle/pedestrian traffic in the test area. In order to collect enough data, test personnel rode bicycles and walked passing through the detection zone multiple times in order to ensure enough test data. A combination of a ferrous-metal bicycle (chrome alloy), a non-ferrous bicycle (aluminum), and one test personnel walking/jogging through the detection zone were detected. A total of 100 one-way trips for the ferrous-metal bicycle, a total of 51 one-way trips for the non-ferrous aluminum bicycle and 100 one-way walk trips for the pedestrian detection test were counted in three separate data collection periods. The total trips were counted by multiple test personnel to ensure the baseline reliability. In addition, the whole test was videotaped to provide a permanent record of the test activities. 5.5 DATA COLLECTION Due to the test site security issues described earlier in this section, all data was collected during daylight hours when test personnel were in attendance. A two-day data collection procedure was scheduled for October 7 and 8, 2002. On the first day, all sensors were installed, wired, configured and calibrated for sample data collection. Sample data was collected to ensure the calibration and optimal performance of each sensor before the official test. The calibration of all sensors was confirmed through comparison between the real time data displayed in each sensor interface and manual observations. Once the results showed that a sensor was optimally calibrated, all calibration parameters were saved in the sensor’s interface software for the next day’s official data collection. The official data collection was conducted on the morning of October 8, 2002. Test data was collected from sensors through their real time interface, from the relay outputs, or stored in sensor software package for subsequent download and analysis. The following list highlights the data collection approach for each of the six sensors evaluated in this test: ASIM DT272: Count data was obtained by downloading cumulative count data from the vendor’s software. Autoscope Solo: Real time count data was manually collected by counting the flash of emulated sensor outputs shown in the vendor’s software package as displayed on a monitor. Data can also be captured from the relay outputs or by downloading aggregated data from the vendor’s software, but these options were not operational on the day of testing.

21
Diamond Traffic Counter: Real time data was used to calibrate the sensor by manually counting audio signals that were generated at the moment an object blocked the pulsed infrared light between the sensor and the reflector. Official data was collected from Diamond sensor by manually observing the cumulative count data displayed on the LCD read out located directly on the back of the sensor. The counter was cleared between each test. MS Sedco SmartWalk 1400: Real time count data was manually collected by counting an external LED flasher that was connected to the sensor. 3M Microloop: Cumulative real time count data was displayed in real time on the sensor’s software interface. Data was collected by recording this number at the end of each test. Inplace Inductive Loops: Loop data was collected by the Automated Data Record (Peak ADR 3000). Because the 3M Microloop cannot detect non-ferrous metallic objects, no data was collected for this sensor for the non-ferrous aluminum bicycle test.

22
6. Analysis and Results Building on the evaluation goals and objectives identified in the Evaluation Test Plan, the evaluation approach was to utilize a comparative analysis between baseline data and sensor data. Total count data collected from all sensors was compared to the baseline data that was manually counted by test personnel. Percent difference is used to identify sensor performance. The evaluation considered three separate detection objects: a ferrous-metal (chrome alloy) bicycle a non-ferrous (aluminum) bicycle and pedestrians. Volume data was the major evaluation measurement. Test results for each of the categories are summarized as follows: 6.1 FERROUS-METAL BICYCLE DETECTION RESULTS A ferrous-metal bicycle was driven through the detection zone a total of 100 times. The results show that the percent difference of all participating sensors was less than 5 percent (95 percent accuracy). Loops were the best-performing sensor with an accuracy of 100 percent. Both Autoscope Solo and ASIM DT 272 were at 99 percent accuracy. 3M Microloops showed 98 percent accuracy and both the MS Sedco SmartWalk and Diamond Traffic Counter were 96 percent accurate. Table 3 summarizes these results. Notice that the 3M Microloops were installed in two separate lanes, but the lane 2 data was not operational on the day of the test. Therefore, only 50 data points are available for lane 1. Table 3 Summary Of Ferrous-Metal Bicycle Detection Results Baseline Sensor Count % Difference Loops 100 100 0% Autoscope - Solo 100 101 1% Ms Sedco - SmartWalk 100 96 4% ASIM - DT272 100 101 1% Diamond - Traffic Counter 100 96 4% 3M – Microloop Lane1 50 49 2% 6.2 NON-FERROUS (ALUMINUM) BICYCLE DETECTION RESULTS A non-ferrous (aluminum) bicycle was driven through the detection zone a total of 51 times. Notice that the 3M Microloop did not detect the aluminum bicycle because magnetometers rely on ferrous-metal for detection. However, the loop detectors detected the aluminum bicycle because they can detect any metallic objects, including aluminum. The results show that the Loops, Autoscope Solo, and ASIM DT 272 were 100 percent accurate and the MS Sedco sensor was 98 percent accurate. Table 4 shows the results for this test.

23
Table 4 Summary Of Non-Ferrous (Aluminum) Bicycle Detection Results Baseline Sensor Count % Difference Loops 51 51 0% Autoscope - Solo 51 51 0% Ms Sedco - SmartWalk 51 50 2% ASIM - DT272 51 51 0% 6.3 PEDESTRIAN DETECTION RESULTS Participating sensors performed well in detecting pedestrians. A total of 100 baseline observations were collected during the test. 100 percent accuracy was obtained for Autoscope Solo, ASIM DT 272 and the MS Sedco. Diamond Traffic Counter showed 93 percent accuracy in detecting pedestrians. Table 5 presents the results summary. Table 5 Summary Of Pedestrian Detection Results Baseline Sensor Count % Difference Autoscope - Solo 100 100 0% Ms Sedco – SmartWalk 1400 100 100 0% ASIM - DT272 100 100 0% Diamond - Traffic Counter 100 93 7%

24
7. Conclusions Conducting a field test of bicycle and pedestrian detectors was a challenging and at times entertaining affair. The cold days in early October were not the peak of trail usage, so test personnel found themselves walking, jogging and bicycling around the test area as an array of sensors monitored their movements. The use of test personnel had the advantage of allowing a relevant sample size to be collected quickly and of providing a consistent detection target. The drawback to using test personnel was that a “real world” test was not entirely possible because only two different types of bicycles and two different pedestrians were used. Nevertheless, a successful test was conducted, revealing some encouraging results about the present state of bicycle and pedestrian detection. Some of the overall findings of the study are highlighted below: • The type of trail facility to be monitored plays a role in selecting the appropriate
sensor. A heavily used trail in an urban area, such as the Cedar Lake Trail test site, requires a sensor that can be installed out of the way of possible vandalism. Most of the sensors tested are suitable to this type of installation, especially inductive loops and magnetometers, which are installed under the pavement. Two sensors, the ASIM and Diamond, require installation at a height of less than four-feet, making them a possible target for vandalism when installed immediately next to a trail. As noted below, the Diamond sensor can be mounted further from the trail, greatly reducing the chance of vandalism.
• The infrared beam of the Diamond counter can cross great distances, allowing the
sensor to be installed several hundred feet from the trail. This makes sensor placement very flexible, especially since the sensor has a camouflaged housing. The primary application for this sensor is a natural setting where traffic on hiking or game trails is of interest.
• Some sensors are designed to offer real-time information, while others are focused
primarily on the collection of historical data. Each data collection approach has a particular need. For example, historical data is most appropriate for periodic data downloading at trails, and real time data outputs are needed as inputs to signal controllers at intersections.
• Several factors must be considered when assessing the cost of bicycle and pedestrian
sensors. The level of expertise required and time required to install and calibrate a sensor can easily be more important than the sensor’s initial cost. Some of the sensors evaluated have a simple point and shoot setup, while others require interface with the vendor-supplied software to configure detection zones. In general, greater sensor complexity brings a greater variety of sensor outputs. Also, a reliable sensor can reduce the amount of maintenance work that must be done.
• A solar or battery-powered sensor can be used in a location without an accessible
source of power. For example, the Diamond counter is strictly a battery-powered sensor.

25
• A sensor with serial communication capability can allow for remote adjustment of calibration parameters and troubleshooting.
• In addition to presence, 3M Microloop magnetometers can provide a bicycle’s speed.
This was briefly investigated in the field where baseline speeds agreed fairly closely with the sensor’s speeds. The test found the baseline and sensor speeds to generally be within 10 percent of one another.
8. Next Steps While the current phase of research has provided a good insight into the performance of bicycle and pedestrian detectors, it has also identified areas that deserve further study. For example, future studies could examine sensor performance in a greater variety of test sites. Each trail has its own unique challenges for selecting sensor-mounting locations. Beyond detection at trails, a need exists to study the ability to detect pedestrians at signalized intersections (the curbside and crosswalk detection applications described earlier). There is also a need to detect bicycles as they approach intersections in order to ensure that they are detected and served like other vehicles utilizing the intersection. Finally, future studies could include more sensors and could collect data over a longer period of time in order to study reliability. A future component of the NIT project will explore the use of portable traffic detectors. This project, the Portable Non-Intrusive Traffic Detection System (PNITDS) project, will examine applications for temporary volume data collection. This project will address the challenges of collecting temporary count data along high-volume roadways that make the placement of road tubes difficult and unsafe for personnel. The proposed PNITDS system will monitor traffic on multi-lane, high volume facilities without exposing personnel to traffic. If project funds allow, the portable system will also be evaluated as a means to collect bicycle and pedestrian data. Mn/DOT is leading this state pooled fund study with assistance from the FHWA. The goal of the PNITDS Project is to provide data collection practitioners with a cost-effective design of a PNITDS system and an independent assessment of a variety of detection technologies. The project will document prior PNITDS efforts conducted in Virginia, New York and Minnesota, prepare a detailed design specification for a portable system and conduct field tests with a variety of sensors. In addition, Application Guidelines will be developed to demonstrate how the portable system can be applied to real-world applications. The guidelines will assist transportation agencies in selecting detection techniques and mounting locations for specific needs. The Application Guidelines will include the following elements: • Where to install the portable system for most effective detection (i.e., distance from
roadway)
• How to take advantage of existing roadside infrastructure (i.e., roadside signs, overhead catwalks)

26
• Crash-worthiness concerns
• Pros and cons of different sensors
• Pros and cons different power supplies (i.e., solar power)
• Ease of installation, maintenance and operation.
• System costs, including all components and sensors
• Considerations for use in specific applications Field tests will be conducted during the late summer and early fall of 2003. If project funds allow, a traveling demonstration will bring the PNIT system to agencies that have participated in the pooled fund study. The demonstration will be conducted with a van containing the PNIT system and several non-intrusive sensors. The demonstration will allow participating states to have their data collection personnel attend and gain first hand experience with the system operation. The PNIT project utilizes the experience and facilities that the Minnesota Department of Transportation and SRF Consulting Group, Inc. have acquired through previous NIT evaluations. Study results will be posted on the project website at http://projects.dot.state.mn.us/nit/.

27
9. References 1. Bureau of Transportation Statistics, United States Department of Transportation,
Bicycle and Pedestrian Data: Sources, Needs and Gaps, 1999. 2. Ronald Hughes, Herman Huang, August 2001, “Evaluation of Automated
Pedestrian Detection at Signalized Intersections”, FHWA-RD-00-097. 3. G. Sexton, X. Zhang, 1995, “Advances in Automated Pedestrian Counting”, IEE
ECOS95, May 1995, pp 106-110, IEE publication No. 408. 4. David A. Noyce, May 2002, “An Evaluation of Technologies for Automated
Detection and Classification of Pedestrians and Bicycles”, Final Report, University of Massachusetts.
5. Maki, Pamela J. and Peter S. Marshall, “Accommodating Bicycles at Signalized
Intersections with Loop Detectors: A Case Study and Example”. 6. Klein, L. A., and Kelley, M.R. (1991). “Detection Technology for IVHS: Final
Report,” FHWA-RD-95-100. 7. Klein, L. A., “Sensor Technologies and Data Requirements for ITS,” Norwood,
MA: Artech House, 2001. 8. 3M Corporation, “Loops System for Passage Detection of Bicycles and Other
Vehicles”, Application Note EC-01, June 1982.