bibliometric research performance indicators for the
TRANSCRIPT
Bibliometric Research Performance Indicators for the Nordic CountriesA PuBlICAtIoN fRom the NoRIA-Net “the use of BIBlIometRICs IN ReseARCh PolICy ANd evAluAtIoN ACtIvItIes”
Network members:Norwegian Institute for studies in Innovation, Research and education (NIfu-steP), Norwaydanish Agency for science, technology and Innovation, denmarkRANNIs, Iceland swedish Research Council, swedenAcademy of finland, finland
Editor: Jesper W. schneider, Royal school of library & Information science, denmark

2
3
Bibliometric Research Performance Indicators for the Nordic CountriesA PuBlICAtIoN fRom the NoRIA-Net “the use of BIBlIometRICs IN ReseARCh PolICy ANd evAluAtIoN ACtIvItIes”
Norwegian Institute for studies in Innovation, Research and education (NIfu steP) (dag W. Aksnes, Gunnar sivertsen)
danish Agency for science, technology and Innovation (lotte faurbæk)
the Icelandic Centre for Research, (RANNIs)(Þorvaldur finnbjörnsson, sóley Gréta sveinsdóttir morthens)
swedish Research Council (magnus Gunnarsson, Johan fröberg, ulf Kronman, staffan Karlsson [network coordinator])
Academy of finland (Annamaija lehvo, Anu Nuutinen) Royal school of library & Information science, denmark (Jesper Wiborg schneider)

4
Table of ContentsPreface 5
Abstract 6
Introduction 8 Methodologicalconsiderations 8
1. Publicationactivity 10 Totalproduction 10 Relativegrowth 12 PublicationsfromtheNordiccountriesasashareoftheworldtotal 13 Publicationspercapita 14 Researchexpenditurepercapita 15 Conclusionsfromchapter1 16
2. Researchprofiles 17 PercentageoffractionalizedpublicationsperresearchfieldforeachNordiccountry 17 Relativespecializationindex 18 Conclusionsfromchapter2 21
3. RelativecitationimpactoftheNordiccountries 22 Overallfieldnormalizedcitationratesforselectedcountriesfor2004-2007 23 TrendsinnationalcitationratesfortheNordiccountries 24 TrendsinfieldcitationratesfortheNordiccountries 25 Generaltrends 36 Publicationactivityandcitationimpactbycountry 36 TheNordiccountries’shareofhighlycitedpapers 42 Conclusionsfromchapter3 43
References 45
Appendix1:MainSubjectAreas 46
Appendix2:Fractionalizedpublicationcountsforeachfield 51

5
NordForsk is a platform for joint Nordic research and research policy development. The aim is to promote cooperation which adds value to what is going on nationally, and thereby contribute to the knowledge society through continuous efforts to improve the quality of Nordic research and innovation.
Within its policy role, NordForsk facilitates debate on important Nordic research and research policy issues. The basis for this is analysis of developments in the research community and how these might impact on NordForsk’s advice to the Nordic Council of Ministers. NordForsk funds a number of NORIA networks with the goal to contribute to joint Nordic priorities on research and innovation policy issues, and as a consequence to sustainable collaboration and investments.
Early in 2008, a Nordic network on bibliometrics was established. It includes those with special com-petence in this field working at or on behalf of national research funding agencies in Denmark, Finland, Iceland, Norway and Sweden. The goal was to facilitate cross-country comparisons of research performance in bibliometric terms. Therefore the network concentrated on methodological and database issues, seeking to reach agreement on successful approaches and procedures in order to reach this goal.
This is the second report from this NORIA network. The report provides readers with essential infor-mation and perspectives on current and future possibilities to reach excellence in Nordic research. It is important because it shows in which fields the Nordic countries already are strong and in some cases even excellent. In addition, it highlights challenges and possible ways to prevent future problems.
In short, the work of NordForsk’s NORIA network on bibliometrics constitutes a basis for broad discus-sion on the potential of Nordic collaboration to contribute to excellence in research and innovation both globally and regionally.
Gunnel Gustafsson, Director of NordForsk
Preface

6
The report investigates international research per-formance for the Nordic countries over a 20-year period from 1989 through 2008 using bibliometric indicators derived from the Thomson Reuters data-base at the Swedish Research Council. Develop-ments in publication activity, research profiles, and relative citation impacts, both at the national and field specific levels are focused. Both fractionalized publication counting and field normalized citation scores, based on normalizations at the individual paper level, are applied.
The report has three main chapters. Chapter 1 investigates developments in publication activity. Chapter 2 investigates research profiles derived from publication output, for the Nordic countries based on the period 2004 – 2008. Finally, Chapter 3 investigates the developments in relative citation impact, both at the national and field levels, for the Nordic countries, as well as the shares of highly cited papers.
The analysis of publication activity shows a sig-nificant increase in the number of scientific articles published by Nordic researchers in the recent 20 years. Sweden has by far the largest publication out-put of the Nordic countries, with almost two times the publication output of the second and third most productive countries, Denmark and Finland. When publication output is measured per 1000 population, Sweden also ranks above the other Nordic countries in the most recent 5-year period (2004-2008). Fur-thermore, Norway and Iceland have, compared to the other Nordic countries, a significantly higher relative growth in their publication output in the most recent 5 year period.
The main findings in the research profile analys-is show that the research profiles for the period 2004-2008 vary considerably between the Nordic countries. Denmark and Sweden are similar with an emphasis on clinical medicine and biomedical
research. Norway and Iceland on the other hand have a strong emphasis on geosciences, biology and agricultural research. Finland’s profile is distinctive among the Nordic countries, with strong emphasis upon agriculture, biology and information, commu-nication technology.
All the Nordic countries belong to the world’s most cited countries, ranging from Denmark on fourth place to Finland on eleventh place. The developments in relative citation rates during the whole period under study show that Sweden’s rates are stable some 10% above the world average. Since the mid-1990s Den-mark has had a steep rise in citation impact to a current level more than 20% above the world average. Norway and Iceland have seen the largest rise in impact during the same period with a current level around 15% above the world average for Iceland and 9% for Norway. The development in citation impact for Finland has been different; a small rise in impact during the late 1980s was followed by a decline in the early 2000s, leading to a citation impact in the last period almost identical to that for the first period. Much of the increase in cita-tion rates for Denmark and Norway can be attributed to increased citation rates of national publications. For Iceland the increase is due to increased citation rates to international publications. International publications from Finland and Sweden received lower citation rates while rates to the national ones remained constant.
The overall pattern is repeated for many of the subject categories, either on higher citation levels (Agriculture, Biology, Materials Sciences) or on lower (Biomedicine, Social sciences). However, for some sub-ject categories the case is different. For example, in Chemistry Sweden and Denmark have considerably higher citation rates (25-50 % above the world average) than the other Nordic countries. In Engineering and Physics Denmark stands out at a stable level 30-40 % above world average, while the other Nordic countries group together around the world average. In Mathe-
Abstract

7
matics the pattern is quite different all countries except Iceland remain on very high citation levels (15-30 % above world average). The analysis generally find that Denmark has managed to move all research fields up to or above the world average in citation impact in the last period. For Finland the field of Geosciences stands out with a strong development both in size and cita-tion rates, while ICT has increased in volume but the citation rate has decreased. For Iceland the Geosciences stand out with a very large share of the Icelandic pub-lications and a high citation rate as well. Norway has increased its citation rates in all fields except Mathe-matics, and stands strong in fields concerning natural resources (Geosciences, Agriculture and Biology). For Sweden we see a trend that all fields move towards the world average, fields that used to be strong weaken, and fields that used to be weak strengthen.
The trends for the share of highly cited papers (above the 99th percentile) are very much the same
for the Nordic countries as the trends for average cita-tion rates, with the exception that the Swedish shows a small increase.
Finally, the methodology used in the report sets different conditions for the countries depending on the size of the publication output, the citation rates are more easily affected for small countries than for large. It is thus not surprising that Sweden gener-ally shows the most stable trend and Iceland the most unstable trend, the statistics for Iceland is in general more unstable due to often small numbers. The Dan-ish development is however still exceptional. Denmark has increased her citation rates dramatically, and now seems to have stabilised in the world elite, with an aver-age citation rate 20% or more above the world average. Norway and Iceland also have had strong increases, but from lower levels than Denmark. Sweden and Finland, on the other hand, have remained on the same citation levels, or even declined.

8
This report investigates international research per-formance in the Nordic countries over a 20-year period. It is the third and final report from the NOIRA-net on The use of bibliometrics in research policy and evaluation activities supported by NordForsk 2008-20091. Research performance is measured by bibliometric methods, and two types of measures are used; measures of research activity and meas-ures of research impact. Measures of research activ-ity are based on fractionalized publication counts, and impact measures are based on relative citation indicators. We should emphasize that citation-based performance indicators do not measure research quality per se. They may reflect important aspects of quality, but citations are primarily a formalized account of information use and can thus be taken as an indicator of reception at this level (Glänzel & Schoepflin, 1995).
Our report focuses on characterizing the trends in publication activity among the Nordic countries and identifying research profiles for these countries. It also investigates the trends in relative citation impact for the Nordic countries, both at a national level and at field-specific levels.
Methodological considerations
The data source for the present report is the Thom-son Reuters database at the Swedish Research Council, which includes: Science Citation Index Expanded, Social Sciences Citation Index, and Arts & Humanities Citation Index2. The analyses cover a 20-year period from 1989 through 2008. Publica-tions have been restricted to include only research articles, letters, and reviews as defined by Thompson Reuters. We use the data cleaning techniques devel-oped at the Swedish Research Council.
The 255 journal subject classes used by Thom-son Reuters have been grouped into 14 main sub-ject groups. The classification is a slight modifi-
cation of the scheme developed by Katz & Hicks (1995) (Appendix 1): clinical medicine; biomedicine; biology; agriculture3; chemistry; materials sciences; physics; geosciences; engineering; information, communication, and technology (ICT); mathemat-ics; social science; arts and humanities; and others (i.e. a small share of Thompson Reuter’s multidis-ciplinary journal category). Notice that publication and citation activities in the categories of arts and humanities and others are very low. Coverage of jour-nals varies considerably from country to country. Consequently, these categories have been excluded from most analyses. To indicate their volume, we have kept the categories in some of the publication activities reported, but we have not performed exclu-sive citation analyses for these areas. Further, it is well known that Thomson Reuters’ Social Science Citation Index is heavily biased towards American journals and covers only 5% to 15% of the research publications produced in social science fields (Sivert-sen, 2009). For that reason, bibliometric analyses of the social sciences, if done at all, should be per-formed and interpreted cautiously. We have decided to include such analyses in the present report and will discuss the implications of the findings where needed.
Bibliometric analyses in this report are based on journal articles and reviews. Hence, subject areas such as engineering and ICT may be underrepre-sented because these areas have conference pro-ceedings as their main publication source. Hence, results from these areas should also be interpreted cautiously.
Many publications are internationally co-authored and result from collaborative efforts involving more than one country. Furthermore, bibliometric stud-ies apply different principles and counting methods. The most common is whole counting, i.e. no frac-tional attribution of credit (every country gets full
Introduction
9
credit for internationally co-authored papers). A sec-ond alternative is fractionalized counting where the credit is divided equally between all the contributing authors/countries. For example, if an article has one author from Denmark and one from Iceland, each country would receive a value of 0.5 paper. One can argue that these counting methods are complemen-tary: The whole or integer count gives the number of papers in which the country participated. A frac-tional count gives the number of papers creditable to the country, assuming that all authors made equal contributions to a co-authored paper and that all con-tributions add up to one (Moed, 2005). Contrary to most large-scale, national, bibliometric analyses, we apply fractionalized counting and use a complete-normalized counting scheme (Olesen Larsen, 2008).
Another note of caution: small data sets are more vulnerable to fluctuations due to greater variability.
Highly skewed distributions, which are common in bibliometrics, influence relative citation rates. Hence, a few highly cited papers can influence aver-age citation rates considerably, especially when the data set is small. Changes in small research areas or in small countries may therefore be more visible, but less important. Increases and decreases in pub-lication and citation patterns may also be influenced by changes in the selection of journals indexed in the citation databases, which determines the “world size” of the research area.
The report is presented in three chapters. The first chapter addresses publication activity of the Nordic countries for the given period. The second chapter characterizes the research profile for each of the Nordic countries, while the final chapter uses a variety of relative indicators to investigate the cita-tion impact concerning the Nordic countries.

10
This chapter aims to review the trends in publica-tion activity in the Nordic countries over a 20-year period, from 1989 through 2008. The chapter presents both absolute and relative indicators to characterize the trends and enable comparisons between the countries. We focus only on the total publication activity for the countries. Hence, all subject areas are combined to produce aggregated publication numbers at 5-year intervals. As described in the introduction, contrary to most national-level bibliometric analyses, we apply a fractional publica-tion counting scheme. Consequently, the figures in our report deviate from some of the other published indicators, e.g. those presented in national science and technology indicator reports, which are based on whole counts of each country’s contributions to internationally co-authored articles. The number of publications is much lower when each country only receives its fractionalized share of each publication. This also holds for the citation indicators. We apply a fractionalized counting scheme where all the basic units (addresses) in a publication share 1 credit, and where a country gets 1 fraction each time it appears in the address list. For example, in an article with 4 Swedish addresses and 1 Danish address, Sweden receives 4/5 and Denmark 1/5 of the credit for the article. Citations to the articles are allocated in the same manner.
Apart from the mathematically appealing property of fractional counting, where the sum of the publi-cation counts of all countries equals the number of publications in the world, this also prevents differing co-publication patterns from affecting the publica-tion counts. When whole counts are used, a country with a high share of international co-publication will have a higher publication count than a country with a low share of international co-publications, all else being equal. Although international co-publication may be interesting, important, and even desirable,
it should be kept separate from publication volume. International research cooperation by the Nordic countries is analysed in a separate report (Gunnars-son et al 2010) .
First, we describe the total publication activity in fractionalized numbers. Then we present the relative growth in publication activity, followed by the Nordic share of the world total publication activity. Finally, we present a relative indicator of publications per capita in the Nordic countries, and a related eco-nomic indicator of research expenditure per capita in the Nordic countries.
Total production
Total publication activity is calculated for four, 5-year periods. FIGURE 1 illustrates the trends in total pub-lication activity for the 20-year period, abridged to four, 5-year periods. TABLE 1 presents the actual numbers. FIGURE 2.1 in Gunnarsson et.al (2010) shows annual publication activity.
1. Publication activity

11
We see a clear rise in publication activity for all coun-tries during the 20-year period. Among the Nordic countries, Sweden consistently has by far the larg-est publication activity during the whole period, with nearly twice the publication output of the second- and third-most productive countries, Denmark and Finland.
Growth in the Thompson Reuters database and in the science system itself may explain the increases. The number of journals and their annual volumes of articles have been increasing in the database (Testa 2010; 2008 Journal Citation Reports 2010), but the science system in general has also been expanding
from year to year. More funding is being spent on research activities, and these activities involve an increasing number of scientists. This too is reflected in the publication counts. It is difficult to assess whether the increase in database coverage correlates with the increase in the total scientific literature glo-bally, but at least some part of the increase can be seen as a database artefact (Aksnes & Hessen 2009). To further investigate this aspect we calculated the relative growth in publication activity for the Nor-dic countries compared to the relative growth of the world, which actually corresponds to the growth in the database.
10000
20000
30000
40000
50000
60000
70000
1989-1993 1994-1998 1999-2003 2004-2008
Denmark Finland IcelandNorway Sweden
FIgure 1: DeveloPmenT In ToTAl PublICATIon ACTIvITy, ToTAl ProDuCTIon In FrACTIonAlIzeD PublICATIon CounTs.
Denmark Finland Iceland Norway Sweden
1989-1993 22125.8 19498.9 563.4 14200.7 46327.9
1994-1998 26685.8 25975.7 934.0 17920.4 56030.2
1999-2003 29120.3 29683.2 1069.4 19187.4 59234.0
2004-2008 32448.4 32466.7 1470.0 25013.8 62199.2
TAble 1: PublICATIon ACTIvITy, ToTAl ProDuCTIon In FrACTIonAlIzeD PublICATIon CounTs.
12
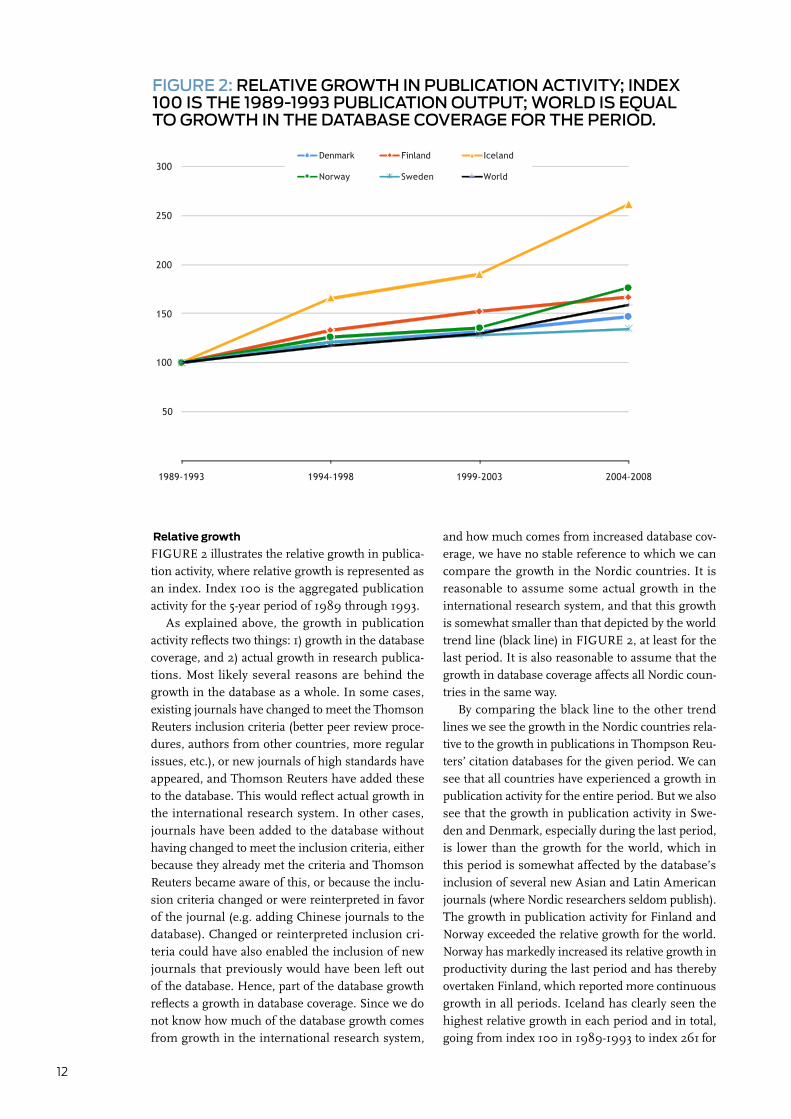
Relative growth
FIGURE 2 illustrates the relative growth in publica-tion activity, where relative growth is represented as an index. Index 100 is the aggregated publication activity for the 5-year period of 1989 through 1993.
As explained above, the growth in publication activity reflects two things: 1) growth in the database coverage, and 2) actual growth in research publica-tions. Most likely several reasons are behind the growth in the database as a whole. In some cases, existing journals have changed to meet the Thomson Reuters inclusion criteria (better peer review proce-dures, authors from other countries, more regular issues, etc.), or new journals of high standards have appeared, and Thomson Reuters have added these to the database. This would reflect actual growth in the international research system. In other cases, journals have been added to the database without having changed to meet the inclusion criteria, either because they already met the criteria and Thomson Reuters became aware of this, or because the inclu-sion criteria changed or were reinterpreted in favor of the journal (e.g. adding Chinese journals to the database). Changed or reinterpreted inclusion cri-teria could have also enabled the inclusion of new journals that previously would have been left out of the database. Hence, part of the database growth reflects a growth in database coverage. Since we do not know how much of the database growth comes from growth in the international research system,
and how much comes from increased database cov-erage, we have no stable reference to which we can compare the growth in the Nordic countries. It is reasonable to assume some actual growth in the international research system, and that this growth is somewhat smaller than that depicted by the world trend line (black line) in FIGURE 2, at least for the last period. It is also reasonable to assume that the growth in database coverage affects all Nordic coun-tries in the same way.
By comparing the black line to the other trend lines we see the growth in the Nordic countries rela-tive to the growth in publications in Thompson Reu-ters’ citation databases for the given period. We can see that all countries have experienced a growth in publication activity for the entire period. But we also see that the growth in publication activity in Swe-den and Denmark, especially during the last period, is lower than the growth for the world, which in this period is somewhat affected by the database’s inclusion of several new Asian and Latin American journals (where Nordic researchers seldom publish). The growth in publication activity for Finland and Norway exceeded the relative growth for the world. Norway has markedly increased its relative growth in productivity during the last period and has thereby overtaken Finland, which reported more continuous growth in all periods. Iceland has clearly seen the highest relative growth in each period and in total, going from index 100 in 1989-1993 to index 261 for
50
100
150
200
250
300
1989-1993 1994-1998 1999-2003 2004-2008
Denmark Finland Iceland
Norway Sweden World
FIgure 2: relATIve growTh In PublICATIon ACTIvITy; InDex 100 Is The 1989-1993 PublICATIon ouTPuT; worlD Is equAl To growTh In The DATAbAse CoverAge For The PerIoD.

13
the last period (2004-2008). In 2004, Norway imple-mented a new funding model for higher education institutions. The funding of these institutions is now based partially on the measurement of their scientific and scholarly publishing. It is likely that the model has contributed to part of the increase by impacting incen-tives, although the actual contribution of this effect is difficult to establish4 .
Collectively, FIGURES 1 and 2 show a general increase in publication productivity for all Nordic countries. While this is not so visible in FIGURE 1, Iceland has in fact had the highest relative growth among the Nordic countries.
Publications from the Nordic countries as a share
of the world total
FIGURE 3 shows each Nordic country’s share of the total publications in the world (i.e. Thompson Reu-ters’ publication databases).
FIGURE 3 supplements the information depicted in FIGURES 1 and 2. Sweden’s relative share of world publications has diminished markedly dur-ing the last period. TABLE 2 below shows the actual percentage shares for each country in each period.
FIgure 3: shAre oF worlD PublICATIons From The norDIC CounTrIes.
TAble 2: shAre oF worlD PublICATIons From The norDIC CounTrIes.
Denmark Finland Iceland Norway Sweden
1989-1993 0.689% 0.607% 0.018% 0.442% 1.443%
1994-1998 0.708% 0.689% 0.025% 0.475% 1.486%
1999-2003 0.698% 0.712% 0.026% 0.460% 1.420%
2004-2008 0.636% 0.636% 0.029% 0.490% 1.218%
0,00%
0,20%
0,40%
0,60%
0,80%
1,00%
1,20%
1,40%
1,60%
1,80%
2,00%
1989-1993 1994-1998 1999-2003 2004-2008
Denmark Finland IcelandNorway Sweden

14
Denmark and Finland have also witnessed a slight decrease in shares, whereas Norway and Ice-land have been rather stable with a small increase in shares. The latter corresponds to the positive growth rates especially for the last period, as depicted in the previous figures for these two countries. Declining shares obviously mean an increasing growth for other countries. We know that the shares of publi-cations from China, India, Brazil, and other large countries have increased considerably during the last 10 years. Given this situation, a decline in most other countries is expected. A stable or slight increase, as in the case of Iceland and Norway, could in fact be considered as a significant rise in the relative con-tribution to world science. The decline for Sweden in the latest period is also notable. Since part of the database growth is due to increased coverage, the trends depicted in FIGURE 3 should be interpreted as an indication of relative stability for the Nordic countries, except perhaps for Sweden.
Publications per capita
No international data are available to reliably com-pare output in terms of publications to input in terms of number of researchers. Instead, publication output is usually compared to the size of the popula-tion in the different countries – although differences in population do not necessarily reflect differences in research efforts.
Much of the difference among countries in pub-lication output shown above can be attributed to dif-ferences in country size and investments in research. To better compare differences in publication output this and the next section present statistics on per capita production and total investments in research.
We have analyzed the average number of publica-tions per 1000 population in each Nordic country for the last period, 2004-2008. In FIGURE 4 we have shown both whole and fractionalized counts to investigate potential differences that could be attrib-uted to international collaboration in publications.
0.00 0.50 1.00 1.50 2.00 2.50
Denmark
Finland
Iceland
Norway
Sweden
Whole countsFractionalized counts
FIgure 4: AverAge number oF PublICATIons Per 1000 PoPulATIon For The PerIoD 2004-2008. *
*Darkbluebarsindicatefractionalpublicationcountsandlightbarsindicatewholepublicationcounts.PopulationstatisticsfromOECDdata,2007.

15
It is of interest to note the difference in rank order between whole and fractionalized counts for the Nordic countries. When we look at whole counts, Sweden has an average of 1.97 publications per 1000 population, followed by Denmark with 1.79, with Finland and Iceland tied at 1.69, and finally Norway with 1.56. The rank order changes somewhat when we use fractionalized counts. Sweden remains the most productive country per 1000 population, with an average of 1.26 publications. However, Finland has overtaken Denmark with an average of 1.23 pub-lications per 1000 population compared to 1.19 for Denmark. Furthermore, Norway has overtaken Ice-land with an average of 1.07 publications per 1000 population compared to 0.95 for Iceland.
What do these differences indicate? The largest gap between whole and fractionalized publication counts is found for Iceland. The gap indicates that Iceland has a much higher proportion of international collaboration in their publications compared to the
other Nordic countries. This is confirmed in the first of our reports published by Nordforsk (Gunnarson et al., 2010), for example in FIGURE 2.4. In other words, the number of countries involved in the pub-lications is lower for the other Nordic countries, as fractionalized counting on a country level obviously reduces the share of publication counts if interna-tional collaboration is present in a publication.
Research expenditure per capita
As background information, we have provided data on research expenditures in the Nordic countries. FIGURE 5 shows the research and development (R&D) expenditures measured per capita for 2007. Sweden is by far the most research-intensive coun-try, followed by Finland. However, the large majority of R&D expenditures can be attributed to the business enterprise sector. Most of the expenditures in this sec-tor are for developmental work, and very little of this activity results in scientific publications. In Norway,
FIgure 5: 2007 reseArCh exPenDITure Per 1000 PoPulATIon In norwegIAn kroner In 2007.*
1 3 5 7 9 11 13
Denmark
Finland
Iceland
Norway
Sweden
Total expenditure per 1000 capitaPublic expenditure per 1000 capita
*LightbluebarsaretotalexpendituresanddarkbluebarsareexpendituresattributedtheHigherEducationSectorandtheGovern-mentalSector;basedonOECDfigurespublishedin“ReportonScience&TechnologyIndicatorsforNorway2009”.
16
for example, only 4% of the journal articles can be attributed to this sector. Hence, it is more relevant to look at the R&D spending in the higher education sec-tor and the government sector (dark blue bars). Here, the picture changes. Iceland and Norway spend a significantly higher amount on R&D per capita than do Sweden Finland, and Denmark.
The patterns of expenditures and publications per capita differ markedly (cf. FIGURES 4 and 5). Most notably, Norway and Iceland spend more but publish less. Nevertheless, the evidence is insufficient to con-clude that Norwegian and Icelandic researchers are less productive than their Nordic colleagues. Basi-cally, these datasets are difficult to compare since they do not cover the same domains. For instance, the social sciences and humanities, which are rela-tively large areas in terms of public expenditures, are poorly coved by the Thomson Reuters data. More-over, the publication counts include articles from industry. Although this sector contributes modestly to the overall national publication output, it is nev-ertheless a factor that needs to be considered since the size of the sector differs significantly between the
Nordic countries. Further analyses would therefore be required to provide reliable conclusions on the scientific productivity of the countries.
Conclusions from chapter 1
The number of scientific articles published by Nor-dic researchers has increased markedly in the recent 20 years. Sweden has by far the largest publication output of the Nordic countries, with almost twice the publication output of the second and third most pro-ductive countries, Denmark and Finland. Also when measured on a per capita basis, Sweden ranks above the other Nordic countries, with 1.26 publications (fractionalized) per 1000 population during the most recent 5-year period (2004-2808). However, the dif-ference is not large, and Finland and Denmark fol-low as second and third with 1.23 and 1.19 publica-tions per 1000 population, respectively. Norway and Iceland have somewhat lower productivity numbers with 1.07 and 0.95 publications. The two latter coun-tries have, nevertheless, a significantly higher rela-tive growth in their publication output during the recent period than do the other Nordic countries.

17
This chapter aims to break down the overall publica-tion activity of the Nordic countries into main subject areas to characterize each country’s research profile. We have restricted the presentation of research pro-files to only the last and most recent 5-year period (2004-2008). Two analyses are presented. First we present the percentage shares of fractionalized publication counts distributed among the 14 major subject areas for each country for the period 2004 through 2008. Subsequently we present Relative Specialization Indices for each country to character-ize their research profiles more distinctly.
Percentage of fractionalized publications per
research field for each Nordic country
TABLE 3 below presents the percentage share of fractionalized publication counts distributed among major subject areas for each Nordic country. Further, we have included two reference units to compare against the Nordic country profiles; the aggregated unit of EU-15 countries and the United States. Notice that in this analysis we include all 14 subject areas. The first row shows the total fractionalized publica-tion counts for the period, and the successive rows present the percentage distributions by subject area.
2. research profiles
Denmark Finland Iceland Norway Sweden EU-15 USA
Totalpublications(fractionalized)
25666.8 25810.7 1121.1 19348.6 49739.5 1198220 1089285.8
ClinicalMedicine 31.0% 29.2% 29.2% 29.1% 32.1% 29.0% 29.2%
Biomedicine 19.6% 15.3% 15.8% 12.9% 17.7% 15.1% 18.0%
Biology 4.6% 4.8% 8.0% 7.0% 4.2% 3.4% 4.0%
Agriculture 9.5% 8.9% 9.1% 9.7% 6.2% 6.0% 5.2%
Chemistry 6.3% 6.7% 2.7% 5.2% 7.5% 8.9% 6.1%
MaterialsScience 1.6% 2.9% 0.8% 1.6% 3.0% 2.8% 1.9%
Physics 7.6% 8.7% 4.8% 4.9% 8.8% 10.8% 8.5%
Geosciences 2.9% 2.3% 13.2% 6.3% 2.3% 2.8% 2.7%
Engeering 4.5% 4.4% 2.0% 5.3% 5.3% 4.6% 4.2%
ICT5 4.4% 8.1% 2.6% 4.8% 4.6% 6.0% 4.9%
Mathmatics 1.8% 2.1% 2.2% 2.4% 2.2% 2.9% 2.3%
SocialSciences 4.9% 5.4% 7.4% 8.7% 5.2% 5.4% 9.4%
Art&Humanities 1.4% 1.4% 2.1% 2.0% 0.9% 2.3% 3.3%
Other 0.1% 0.0% 0.1% 0.1% 0.0% 0.1% 0.1%
TAble 3: PerCenTAge DIsTrIbuTIon oF FrACTIonAlIzeD PublICATIons Per reseArCh FIelD For The norDIC CounTrIes, eu-15, AnD usA DurIng 2004-2008.

18
The numbers presented in TABLE 3 confirm that clinical medicine is by far the largest research field for all countries investigated (including EU-15), with around one third of all publications belonging to this subject area. Further, with slightly more variation in percentages among the countries, biomedicine is undoubtedly the second largest research field for all countries investigated, again including EU-15. Together clinical medicine and biomedicine account for somewhere between 42% and 50% of the pub-lications for the countries investigated. At a more detailed level, TABLE 3 also shows that the share of publications for Sweden and Denmark is somewhat larger in clinical medicine and biomedicine com-pared to the other Nordic countries, the EU-15, and the United States (except for Denmark and USA in biomedicine). Denmark, Finland, Iceland, and Norway have a relatively large share of their publi-cations in the agricultural research field, compared to Sweden, EU-15, and the United States. Whereas the share of physics publications is somewhat lower for Norway and Iceland compared to the other coun-tries, but their share of geoscience publications is markedly higher. Geoscience constitutes 13.2% of Iceland’s publications for the period, which makes it the third largest research area in Iceland when measured in publication output. Social science con-stitutes 8.7% of Norway’s publications for the period, which is slightly higher than Denmark, Finland, and Sweden, but not the United States. In Chapter 3 we address the issue of low coverage and bias towards the United States in the social sciences. However, we should emphasize that the figures for the arts, humanities, and social sciences should be treated with caution. Analyses from Norway, based on com-plete publication output data from national research institutions, indicate that the overall share of pub-lications from these fields is larger than depicted in TABLE 3, which is a consequence of the rather poor and biased coverage in the Thompson Reuters database for arts & humanities and some social sci-ence fields. Finally, publication activity in the Other category is meagre for all countries. This area con-tains a small and lowly -cited share of publications in multidisciplinary journals, e.g. Science, Nature, and PNAS, namely the publications that could not be cat-egorized into one or more of the other subject areas by the subject re-classification algorithm used by the Swedish Research Council (Gunnarsson et al., 2008).
To conclude, from TABLE 3 it appears that Nor-way and Iceland, and to some extent Sweden and Denmark, have similar research profiles. The next section investigates this in greater detail, where we present Relative Specialization Indices for each country to characterize their relative research pro-files more accurately.
Relative specialization index
The publication profile of national research in the Nordic countries is expressed by the Relative Special-ization Index (RSI), defined in REIST-2 (1997). RSI indicates whether a country has a relatively higher or lower share in world publications in particular fields of science than its overall share in the world total of publications. The symmetric RSI is a relative indi-cator based on the Activity Index (AI). The Activity Index is defined as:
RSI takes its values in the range [-1, 1]. It indicates whether a country has higher-than-average activity in a scientific field (RSI >1) or a lower-than-average activity (RSI <1). RSI = 0 reflects a completely bal-anced situation. It is important to note that RSI reflects a certain internal balance among the fields in the given country, i.e. positive RSI values must always be balanced by negative ones (no country can have its RSI values all positive or all negative). Fur-thermore, low values indicate homogenous distribu-tions between the various research fields.
A benchmark used for all research fields is RSI = 0, which corresponds to the world standard case and is graphically visualized by a regular dodecagon6. Any country’s deviation from this standard therefore results in more or less characteristic deformation of the regular dodecagon.
Glänzel (2000) identified four basic paradigmatic patterns in publication profiles based on RSI:n Type I: Western model, which is the characteristic
pattern of developed Western countries with clini-cal medicine and biomedical research as domi-nating fields.
n Type II: Characteristic pattern of the former socialist countries, present economies in transi-tion, and China with excessive activity in chemis-try and physics.
n Type III: Bioenvironmental model, which is the pat-tern most typical for developing and more natu-ral-resource-oriented countries (e.g. Australia, or South Africa) that focus mainly on biology and earth and space sciences.
n Type IV: Japanese model, now also typical for other developed Asian economies where engineering and chemistry are predominant.
the share of given field in the publications of the given country
the share of given field in the world total of publicationsAI=
RSI= AI - 1
AI + 1
The RSI is then defined as:
19
It should be noted that Glänzel’s (2000) “paradig-matic patterns” are derived from categorization of research fields in eight major areas, excluding social sciences and arts & humanities. The major research fields include: clinical medicine, biomedical research, biology, chemistry, physics, mathematics engineering, and earth and space sciences. This is important to consider when interpreting the present Nordic country publication profiles.
Similar to Glänzel (2000), we have excluded arts & humanities and the other (multidisciplinary) sub-ject areas. We have included the social sciences, how-ever, since publication activity is visible. Otherwise, the definitions of groups vary to some degree, but we should be able to characterize the Nordic countries based on Glänzel’s “paradigmatic patterns”.
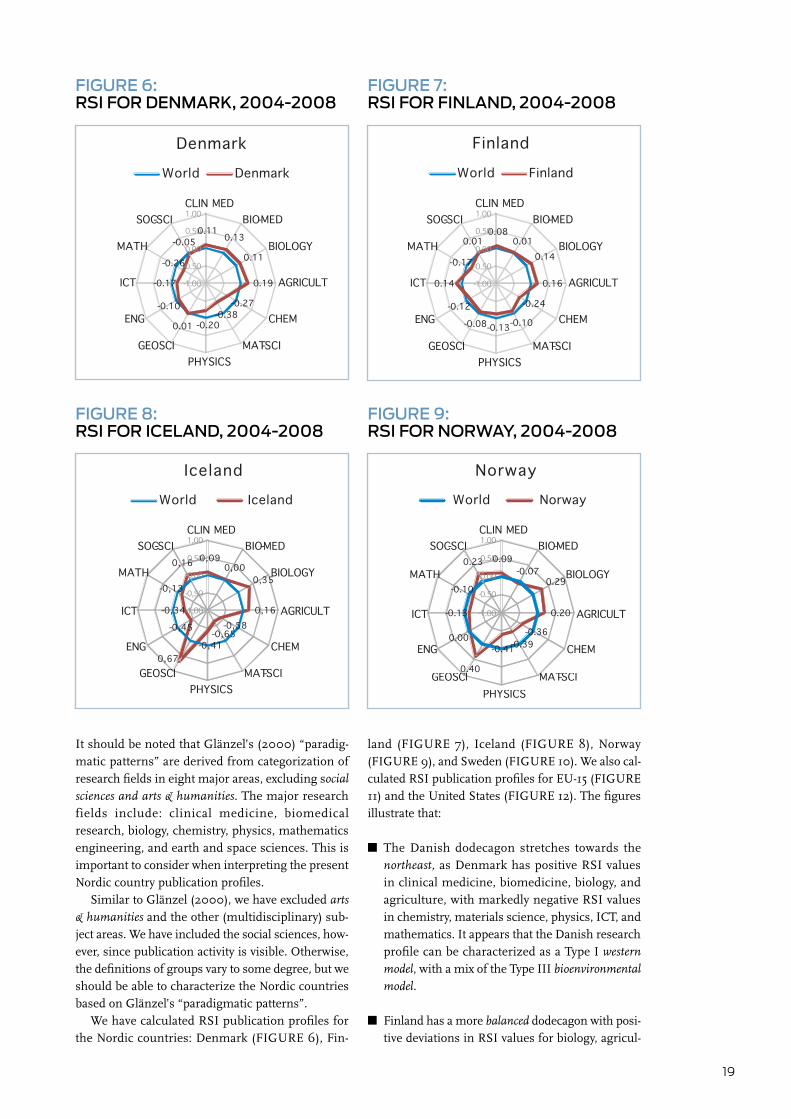
We have calculated RSI publication profiles for the Nordic countries: Denmark (FIGURE 6), Fin-
land (FIGURE 7), Iceland (FIGURE 8), Norway (FIGURE 9), and Sweden (FIGURE 10). We also cal-culated RSI publication profiles for EU-15 (FIGURE 11) and the United States (FIGURE 12). The figures illustrate that:
n The Danish dodecagon stretches towards the northeast, as Denmark has positive RSI values in clinical medicine, biomedicine, biology, and agriculture, with markedly negative RSI values in chemistry, materials science, physics, ICT, and mathematics. It appears that the Danish research profile can be characterized as a Type I western model, with a mix of the Type III bioenvironmental model.
n Finland has a more balanced dodecagon with posi-tive deviations in RSI values for biology, agricul-
0.110.13
0.11
0.19
-0.27-0.38
-0.200.01
-0.10
-0.17
-0.26
-0.05
-1.00
-0.50
0.00
0.50
1.00CLIN MED
BIO-MED
BIOLOGY
AGRICULT
CHEM
MAT-SCIPHYSICS
GEOSCI
ENG
ICT
MATH
SOC-SCI
DenmarkWorld Denmark
0.080.01
0.14
0.16
-0.24
-0.10-0.13-0.08
-0.12
0.14
-0.17
0.01
-1.00
-0.50
0.00
0.50
1.00CLIN MED
BIO-MED
BIOLOGY
AGRICULT
CHEM
MAT-SCIPHYSICS
GEOSCI
ENG
ICT
MATH
SOC-SCI
FinlandWorld Finland
0,090,00
0,35
0,16-0,58
-0,65-0,41
0,67
-0,45
-0,34
-0,13
0,16
-1,00
-0,50
0,00
0,50
1,00CLIN MED
BIO-MED
BIOLOGY
AGRICULT
CHEM
MAT-SCIPHYSICS
GEOSCI
ENG
ICT
MATH
SOC-SCI
IcelandIcelandWorld
0.09-0.07
0.29
0.20
-0.36-0.39-0.41
0.40
0.00
-0.13
-0.10
0.23
-1.00
-0.50
0.00
0.50
1.00CLIN MED
BIO-MED
BIOLOGY
AGRICULT
CHEM
MAT-SCIPHYSICS
GEOSCI
ENG
ICT
MATH
SOC-SCI
NorwayNorwayWorld
FIgure 6: rsI For DenmArk, 2004-2008
FIgure 8: rsI For ICelAnD, 2004-2008
FIgure 7: rsI For FInlAnD, 2004-2008
FIgure 9: rsI For norwAy, 2004-2008
20
ture, and ICT. Correspondingly, Finland has nega-tive values especially for chemistry, and less so for materials science, physics, and mathematics. It seems that the research profile for Finland can be characterized as primarily a Type III bioenvi-ronmental model, with a mix of both Type I western model and Type IV, the latter due to the relative high visibility in the ICT research area.
n The dodecagon for Iceland (FIGURE 8 below) is deformed considerably with substantial posi-tive RSI values for geosciences and biology, and less so for agriculture and social sciences. Conse-quently, some areas, chemistry, materials science, physics, engineering, ICT, and to a lesser degree mathematics have notable negative RSI values. The research profile for Iceland is clearly a Type III bioenvironmental model.
n The dodecagon for Norway (FIGURE 9) resembles that of Iceland. The dodecagon stretches towards geosciences in the southwest, biology-agriculture in the east, and with a positive deviation in the social sciences. These are exactly the same fields in which Iceland has positive RSI values. Further, Norway has negative values in chemistry, materials science, physics, and less so in ICT and mathemat-ics. Like Iceland, the research profile for Norway also seems to be a Type III bioenvironmental model.
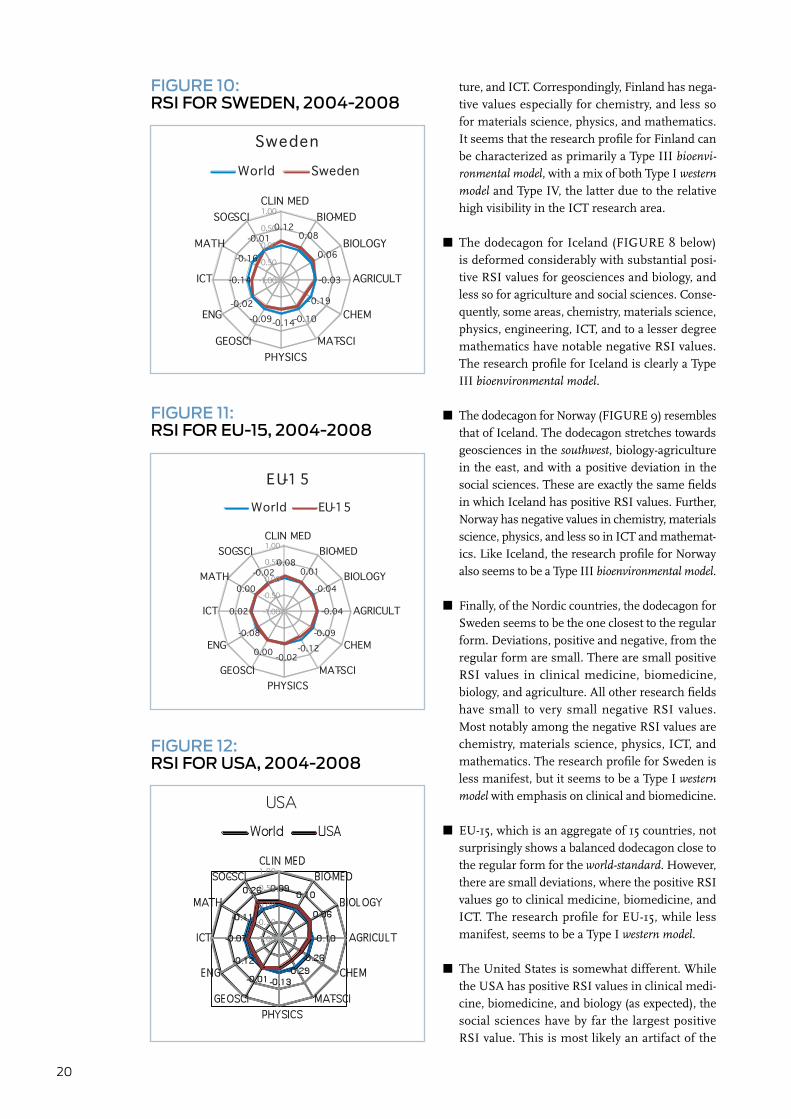
n Finally, of the Nordic countries, the dodecagon for Sweden seems to be the one closest to the regular form. Deviations, positive and negative, from the regular form are small. There are small positive RSI values in clinical medicine, biomedicine, biology, and agriculture. All other research fields have small to very small negative RSI values. Most notably among the negative RSI values are chemistry, materials science, physics, ICT, and mathematics. The research profile for Sweden is less manifest, but it seems to be a Type I western model with emphasis on clinical and biomedicine.
n EU-15, which is an aggregate of 15 countries, not surprisingly shows a balanced dodecagon close to the regular form for the world-standard. However, there are small deviations, where the positive RSI values go to clinical medicine, biomedicine, and ICT. The research profile for EU-15, while less manifest, seems to be a Type I western model.
n The United States is somewhat different. While the USA has positive RSI values in clinical medi-cine, biomedicine, and biology (as expected), the social sciences have by far the largest positive RSI value. This is most likely an artifact of the
0.120.08
0.06
-0.03
-0.19
-0.10-0.14-0.09-0.02
-0.14
-0.16
-0.01
-1.00
-0.50
0.00
0.50
1.00CLIN MED
BIO-MED
BIOLOGY
AGRICULT
CHEM
MAT-SCIPHYSICS
GEOSCI
ENG
ICT
MATH
SOC-SCI
SwedenSwedenWorld
0.080.01
-0.04
-0.04
-0.09-0.12
-0.020.00
-0.08
0.02
0.00
-0.02
-1.00
-0.50
0.00
0.50
1.00CLIN MED
BIO-MED
BIOLOGY
AGRICULT
CHEM
MAT-SCIPHYSICS
GEOSCI
ENG
ICT
MATH
SOC-SCI
EU-15World EU-15
0.090.10
0.06
-0.10
-0.26-0.29
-0.13-0.01
-0.12
-0.07
-0.11
0.26
-1.00
-0.50
0.00
0.50
1.00CLIN MED
BIO-MED
BIOLOGY
AGRICULT
CHEM
MAT-SCIPHYSICS
GEOSCI
ENG
ICT
MATH
SOC-SCI
USAWorld USA
FIgure 10: rsI For sweDen, 2004-2008
FIgure 11: rsI For eu-15, 2004-2008
FIgure 12: rsI For usA, 2004-2008
21
database. When we include the social sciences, we know that this area is biased towards Ameri-can publications; hence, the US profile will reflect this. We think it would be fair to consider the research profile of the United States as a Type 1 western model.
Conclusions from chapter 2
According to Glänzel (2000), in 1997 Denmark, Sweden, Finland, and Norway all corresponded to the Type I western model. Glänzel, however, argued that Norway’s profile could be considered a mix of Type I and Type III, changing increasingly towards a Type III profile. The findings in this report support Glänzel’s suggestions for Norway. Only Denmark and Sweden can be considered Type I research pro-files. Finland is more of a mix between Type I and Type IV, whereas the research profiles of Norway and Iceland can be considered Type III with a focus on natural resources. Consequently, the research pro-files vary considerably between the Nordic countries. Another conclusion is that the four basic paradig-matic patterns in publication profiles suggested by Glänzel (2000) are not very useful in describing the recent publication activities of the Nordic countries; only Iceland and Norway fit the model well.

22
The aim of this chapter is to investigate the trends in relative citation impact of the Nordic countries for the 19-year period7. We present several citation analys- es. First we investigate the overall field normalized citation rates for the countries with highest impact in world, including the Nordic countries, for the last period (2004-2007). This analysis aggregates all research fields into one overall citation score. Next we investigate the trends in overall citation rates for the Nordic countries. Again, this is done for all fields combined. Subsequently, we investigate the trends in citation rates for the Nordic countries in 12 of the 14 research fields; arts & humanities and other are excluded from the analyses (cf. Appendix 1). Then we compare each Nordic country’s relative citation rates in the different fields to their publication activ-ity in the same fields. This is done for the first and last periods, combined in a single graph. Finally, we investigate the share of highly cited publications from the Nordic countries.
All citation analyses presented in this report are conducted according to the following procedure and calculation: n Field normalized citation rates,n Including self-citations,n Three-year citation windows.
Relative citation scores are calculated in a way simi-lar to the well-known “crown indicator”8. The citation rates per publication type for each year in the citation window are compared to the average citation rates for the same type of publications in the same years for the specific research field. Consequently, citation rates are normalized according to publication type, citation year after publication, and field-specific cita-tion patterns. This enables comparison of relative citation indicators between research fields, publica-tion types, and publication years.
We report relative citation rates as index values, where index 100 is the world average for the field; values above or below index 100 can be interpreted as percentage differences from the world average.
In the present analyses, self-citations have not been excluded, since they will most likely not affect country-level analyses. In other words, it is expected that national self-citation rates will level out.
We chose 3-year citation windows since we found that longer windows did not alter the trends already identified in the 3-year windows. Note that the last period is reduced to 4 years; the material published in 2008 had been cited for one year only when the study was compiled, which is a too short a period to be meaningful. Further, the citation window for publications from 2007 is only 2 years.
Small data sets reflect greater variation and are less reliable than larger data sets; this is one of the axioms of statistics. Since Iceland generally has small data sets, we have chosen not to show Iceland in all graphs below; the variation in some cases is so high that the statistics would not be meaningful. This required us to use different scales, and some graphs show Iceland’s citation rates to fluctuate con-siderably. The latter mostly being an artifact of small numbers, the influence of few highly cited papers, leading to larger variation.
First we present the combined field normalized citation rates for the countries with the highest impact in the world (including the Nordic countries) for the last period. We then present the trends in overall citation rates for the Nordic countries for the entire period.
3. relative citation impact of the nordic countries
23
3. relative citation impact of the nordic countries
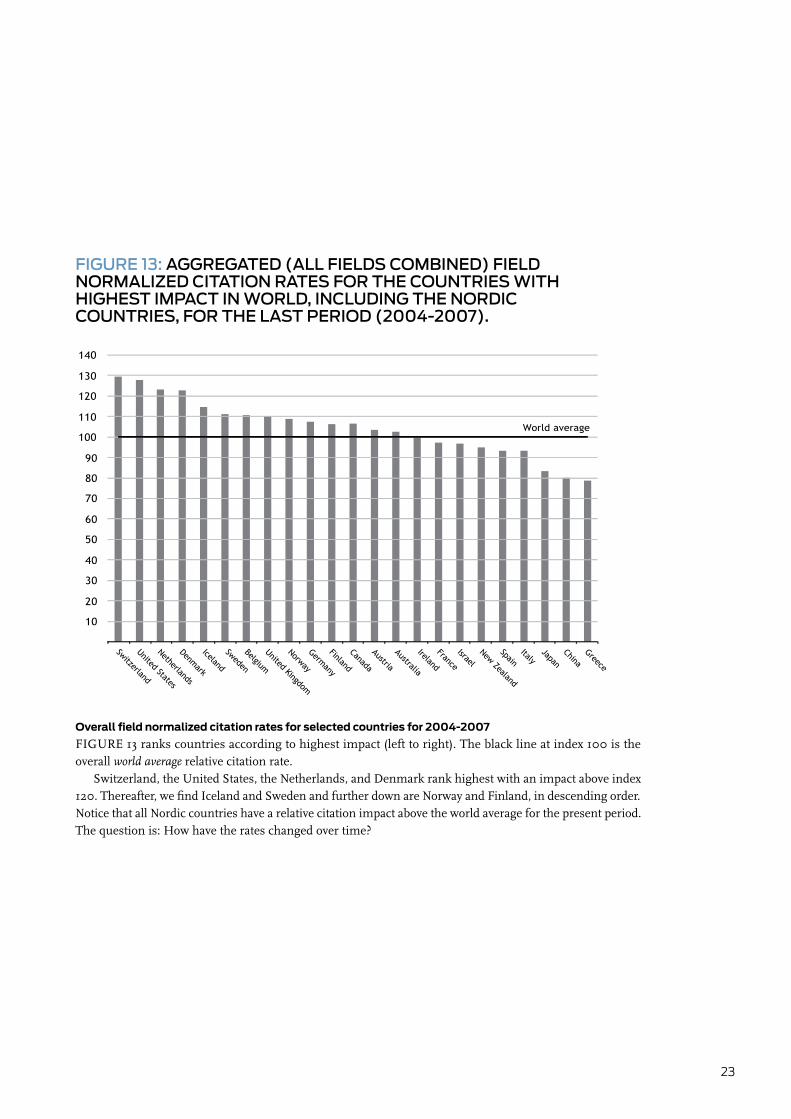
Overall field normalized citation rates for selected countries for 2004-2007
FIGURE 13 ranks countries according to highest impact (left to right). The black line at index 100 is the overall world average relative citation rate.
Switzerland, the United States, the Netherlands, and Denmark rank highest with an impact above index 120. Thereafter, we find Iceland and Sweden and further down are Norway and Finland, in descending order. Notice that all Nordic countries have a relative citation impact above the world average for the present period. The question is: How have the rates changed over time?
FIgure 13: AggregATeD (All FIelDs CombIneD) FIelD normAlIzeD CITATIon rATes For The CounTrIes wITh hIghesT ImPACT In worlD, InCluDIng The norDIC CounTrIes, For The lAsT PerIoD (2004-2007).
Switzerland
United States
Netherlands
Denmark
Iceland
Sweden
Belgium
United Kingdom
Norway
Germany
Finland
Canada
Austria
Australia
Ireland
France
Israel
New Zealand
SpainItaly
JapanChina
Greece
10
20
30
40
50
60
70
80
90
100
110
120
130
140
World average

24
Trends in national citation rates for the Nordic
countries
FIGURE 14 illustrates the trends in national citation rates for the Nordic countries. We see that Sweden and Denmark were nearly at the same level in the first period. Sweden later experienced a slight decline, whereas Denmark shows a considerable increase in citation rates during the period studied. For Finland, we see a rise and later a decline to the original level. Iceland and Norway, on the other hand, have experi-enced considerable increases in citation rates, espe-cially during the last three periods.
There is some indication that one reason for the variation in smaller countries is the influence of highly cited papers; see FIGURES 32 and 33 for shares of highly cited papers.
One approach to understand the patterns found in FIGURE 14 is to split the data into national publica-tions (all author addresses within the same country) and international publications (authors represent more than one country). TABLE 4 shows the mean relative citation impact for national and international publications for the first and last period. Much of the increase in the national mean citation rates for Den-mark and Norway can be attributed to increased cita-tion rates of national publications. For Iceland, the increase is due to increased citations of international publications, while Finland and Sweden experienced a decreasing citation impact of their international publications and a constant impact regarding their national ones.
In the next section we break down the national level into fields and investigate the trends in field citation rates for the Nordic countries.
FIgure 14: DeveloPmenT oF relATIve CITATIon ImPACT For All FIelDs. weIghTeD AverAge ACCorDIng To FIelD sIze; InDex 100 Is The worlD AverAge In The gIven PerIoD.
World average
80
90
100
110
120
130
1989-1993 1994-1998 1999-2003 2004-2007
All fieldsDenmark FinlandIceland NorwaySweden
Country National publications International publications
1989-1993 2004-2007 Change 1989-1993 2004-2007 Change
Denmark 1.00 1.12 0.12 1.62 1.48 -0.13
Finland 0.97 0.97 0.01 1.53 1.33 -0.20
Iceland 0.85 0.81 -0.04 1.47 1.60 0.13
Norway 0.87 0.97 0.11 1.32 1.36 0.03
Sweden 1.05 1.02 -0.03 1.48 1.34 -0.14
TAble 4: meAn relATIve CITATIon ImPACT For nATIonAl AnD InTernATIonAl PublICATIons.

25
Trends in field citation rates for the Nordic countries
We present the trends in citation rates for 12 fields, excluding arts & humanities and other. We do not go into detailed descriptions for each field. The aim is to emphasize similarities and dissimilarities with the general patterns and identify salient cases. Consequently, we summarize the comments in the discussion section immediately after FIGURE 26.
Despite fluctuations during the period, in the field of agriculture (FIGURE 15) all Nordic countries have relative citation rates well above the world average in the last period. All countries increased their citation rates between the second and third periods, but while Norway and Iceland continued their increase between the third and fourth periods, the other countries fell back.
FIgure 15: DeveloPmenT oF relATIve CITATIon ImPACT For The FIelD oF AgrICulTure; InDex 100 Is The worlD AverAge For The FIelD In The gIven PerIoD.
World average
80
90
100
110
120
130
140
150
1989-1993 1994-1998 1999-2003 2004-2007
AgricultureDenmark FinlandIceland NorwaySweden
26
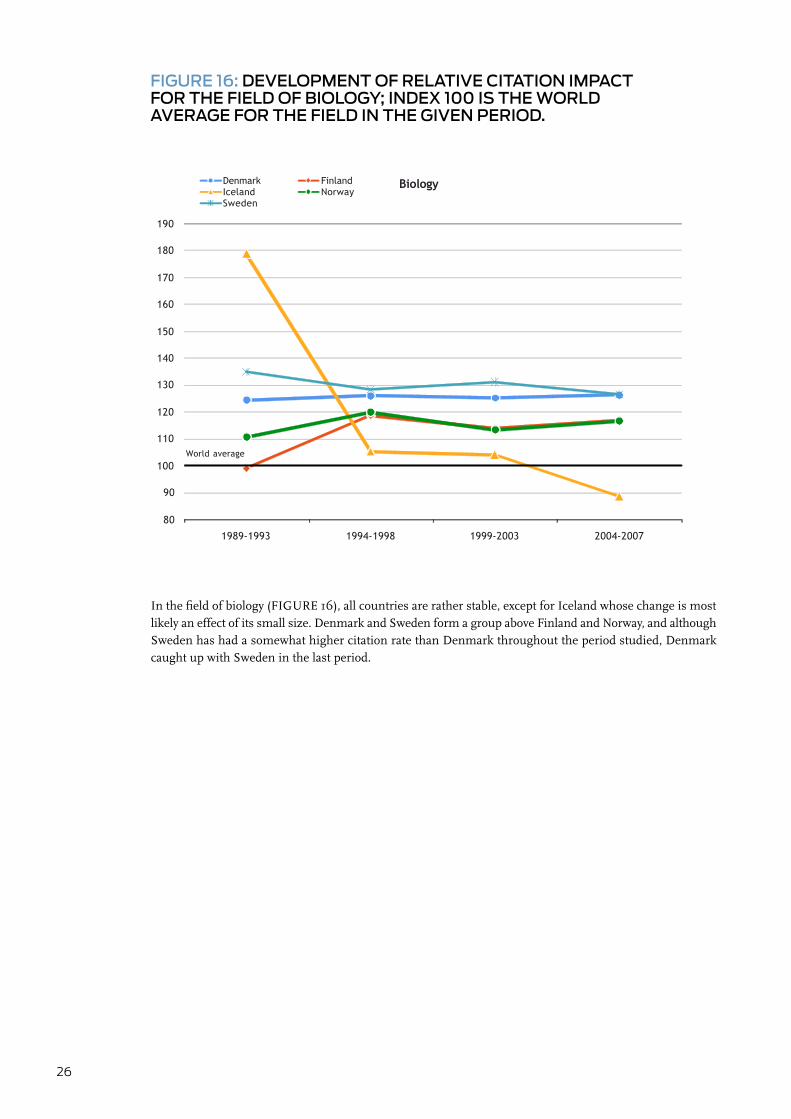
In the field of biology (FIGURE 16), all countries are rather stable, except for Iceland whose change is most likely an effect of its small size. Denmark and Sweden form a group above Finland and Norway, and although Sweden has had a somewhat higher citation rate than Denmark throughout the period studied, Denmark caught up with Sweden in the last period.
FIgure 16: DeveloPmenT oF relATIve CITATIon ImPACT For The FIelD oF bIology; InDex 100 Is The worlD AverAge For The FIelD In The gIven PerIoD.
World average
80
90
100
110
120
130
140
150
160
170
180
190
1989-1993 1994-1998 1999-2003 2004-2007
BiologyDenmark FinlandIceland NorwaySweden
27
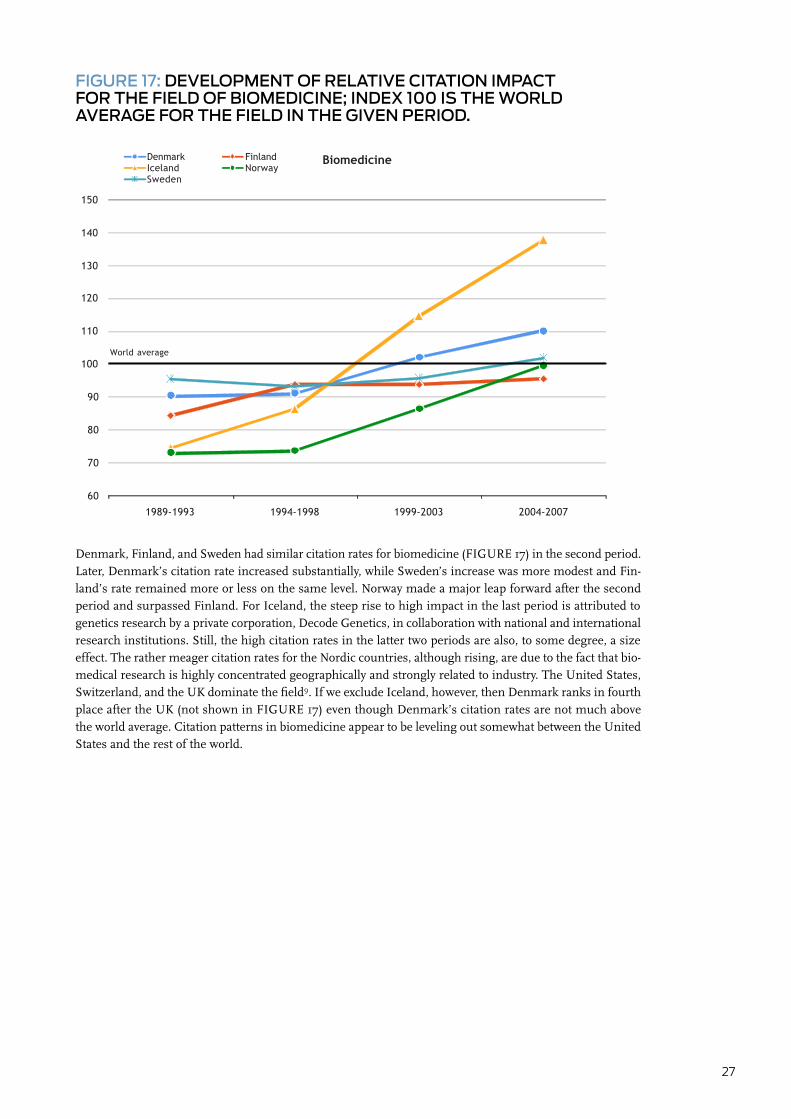
Denmark, Finland, and Sweden had similar citation rates for biomedicine (FIGURE 17) in the second period. Later, Denmark’s citation rate increased substantially, while Sweden’s increase was more modest and Fin-land’s rate remained more or less on the same level. Norway made a major leap forward after the second period and surpassed Finland. For Iceland, the steep rise to high impact in the last period is attributed to genetics research by a private corporation, Decode Genetics, in collaboration with national and international research institutions. Still, the high citation rates in the latter two periods are also, to some degree, a size effect. The rather meager citation rates for the Nordic countries, although rising, are due to the fact that bio-medical research is highly concentrated geographically and strongly related to industry. The United States, Switzerland, and the UK dominate the field9. If we exclude Iceland, however, then Denmark ranks in fourth place after the UK (not shown in FIGURE 17) even though Denmark’s citation rates are not much above the world average. Citation patterns in biomedicine appear to be leveling out somewhat between the United States and the rest of the world.
World average
60
70
80
90
100
110
120
130
140
150
1989-1993 1994-1998 1999-2003 2004-2007
BiomedicineDenmark FinlandIceland NorwaySweden
FIgure 17: DeveloPmenT oF relATIve CITATIon ImPACT For The FIelD oF bIomeDICIne; InDex 100 Is The worlD AverAge For The FIelD In The gIven PerIoD.
28
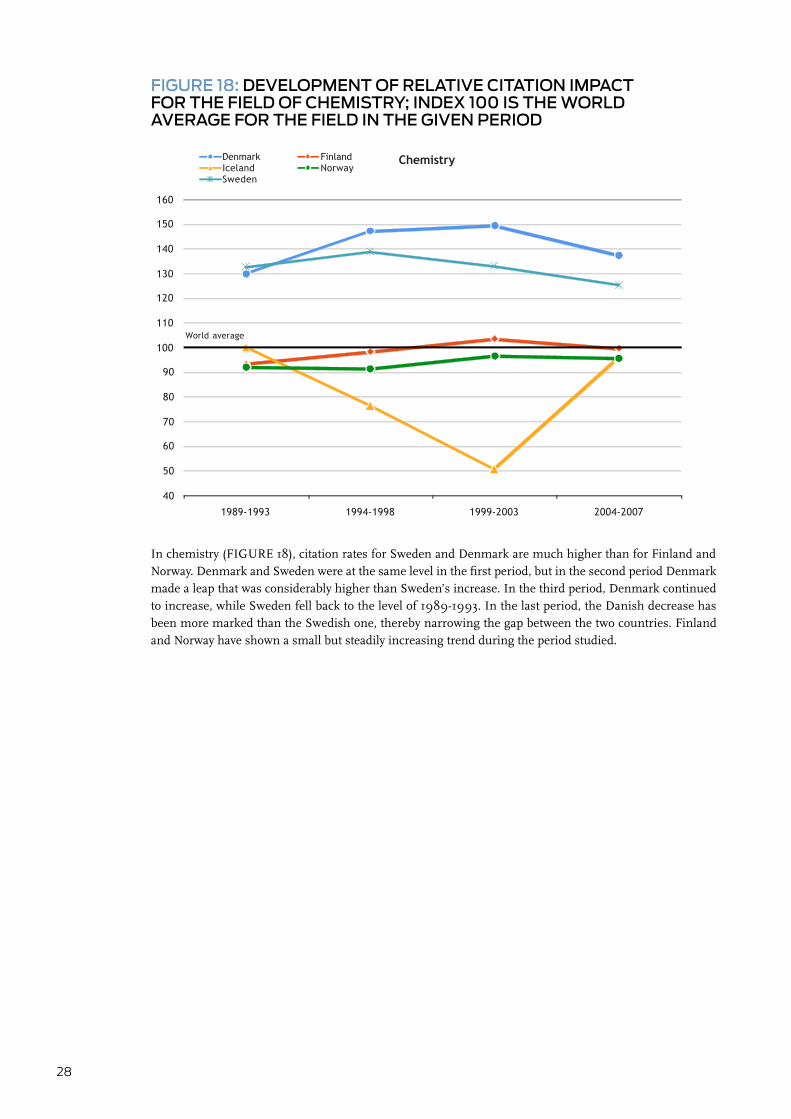
In chemistry (FIGURE 18), citation rates for Sweden and Denmark are much higher than for Finland and Norway. Denmark and Sweden were at the same level in the first period, but in the second period Denmark made a leap that was considerably higher than Sweden’s increase. In the third period, Denmark continued to increase, while Sweden fell back to the level of 1989-1993. In the last period, the Danish decrease has been more marked than the Swedish one, thereby narrowing the gap between the two countries. Finland and Norway have shown a small but steadily increasing trend during the period studied.
World average
40
50
60
70
80
90
100
110
120
130
140
150
160
1989-1993 1994-1998 1999-2003 2004-2007
ChemistryDenmark FinlandIceland NorwaySweden
FIgure 18: DeveloPmenT oF relATIve CITATIon ImPACT For The FIelD oF ChemIsTry; InDex 100 Is The worlD AverAge For The FIelD In The gIven PerIoD

29
Clinical medicine (FIGURE 19) is by far the largest research field in all countries, which of course has the greatest influence on overall citation rates. Sweden experienced a small decrease, but remained close to stable. Citation rates for Norway, Iceland, and Denmark increased, but the rate for Finland fell abruptly. For a detailed analysis and evaluation of research in clinical medicine in Sweden and Finland, see their joint evaluation report from 2009 . The Danish rise between the second and third periods is spectacular, especially considering the size of the field.
World average
80
90
100
110
120
130
1989-1993 1994-1998 1999-2003 2004-2007
Clinical medicineDenmark FinlandIceland NorwaySweden
FIgure 19: DeveloPmenT oF relATIve CITATIon ImPACT For The FIelD oF ClInICAl meDICIne; InDex 100 Is The worlD AverAge For The FIelD In The gIven PerIoD.
30
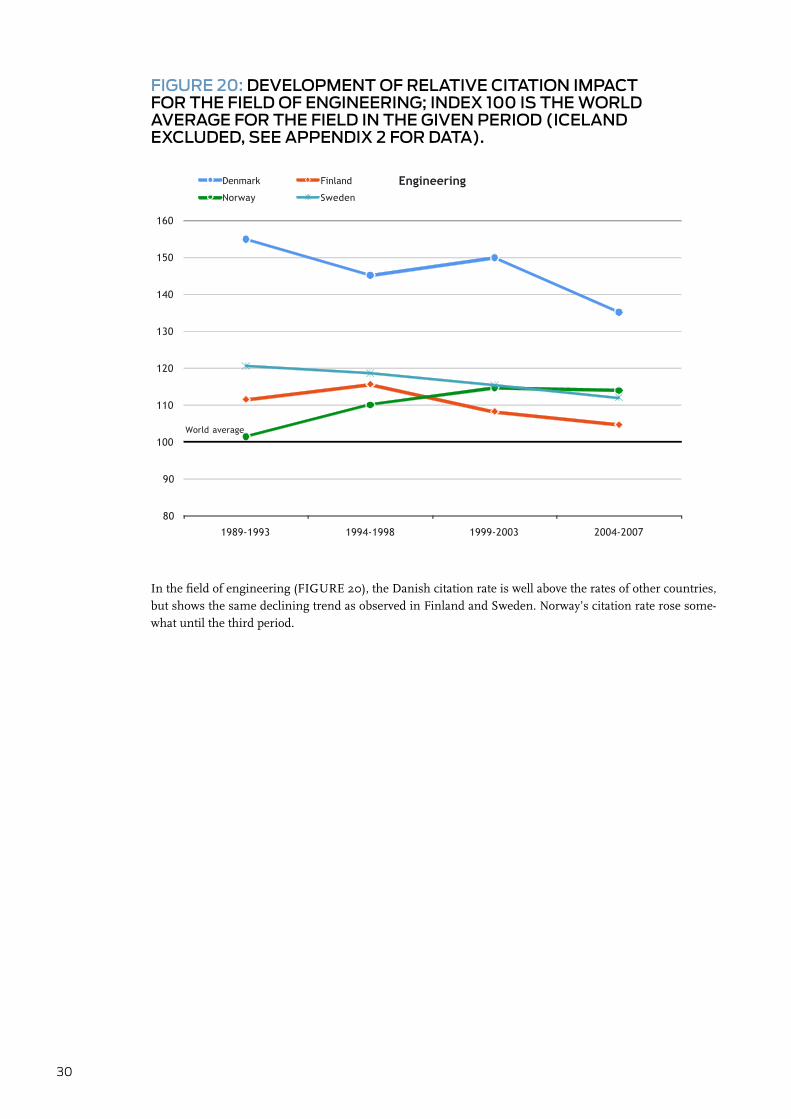
In the field of engineering (FIGURE 20), the Danish citation rate is well above the rates of other countries, but shows the same declining trend as observed in Finland and Sweden. Norway’s citation rate rose some-what until the third period.
World average
80
90
100
110
120
130
140
150
160
1989-1993 1994-1998 1999-2003 2004-2007
Engineering Denmark Finland
Norway Sweden
FIgure 20: DeveloPmenT oF relATIve CITATIon ImPACT For The FIelD oF engIneerIng; InDex 100 Is The worlD AverAge For The FIelD In The gIven PerIoD (ICelAnD exCluDeD, see APPenDIx 2 For DATA).

31
In geosciences (FIGURE 21), Finland demonstrates a strong and almost linear growth in citation rates during the period, perhaps due to more highly cited papers. Starting from a low level, Finland surpassed Sweden and Norway. Denmark was at approximately the same level as Sweden and Norway in the first period, but man-aged to increase its citation rate (between the first and second periods the increase was as steep as Finland’s, but started from a much higher level). Denmark remains well above Finland, although the gap between the two countries has narrowed.
The most dramatic change, however, is the Icelandic decline between the second and fourth periods, moving Iceland from an impressive 150 to a much more modest 114. This is alarming, since geosciences is one of Iceland’s specialties (around 13% of publications in the period from 2004-2008, i.e. approximately 140 fractionalized publications).
FIgure 21: DeveloPmenT oF relATIve CITATIon ImPACT For The FIelD oF geosCIenCes; InDex 100 Is The worlD AverAge For The FIelD In The gIven PerIoD.
World average
40
50
60
70
80
90
100
110
120
130
140
150
160
1989-1993 1994-1998 1999-2003 2004-2007
GeosciencesDenmark FinlandIceland NorwaySweden
32
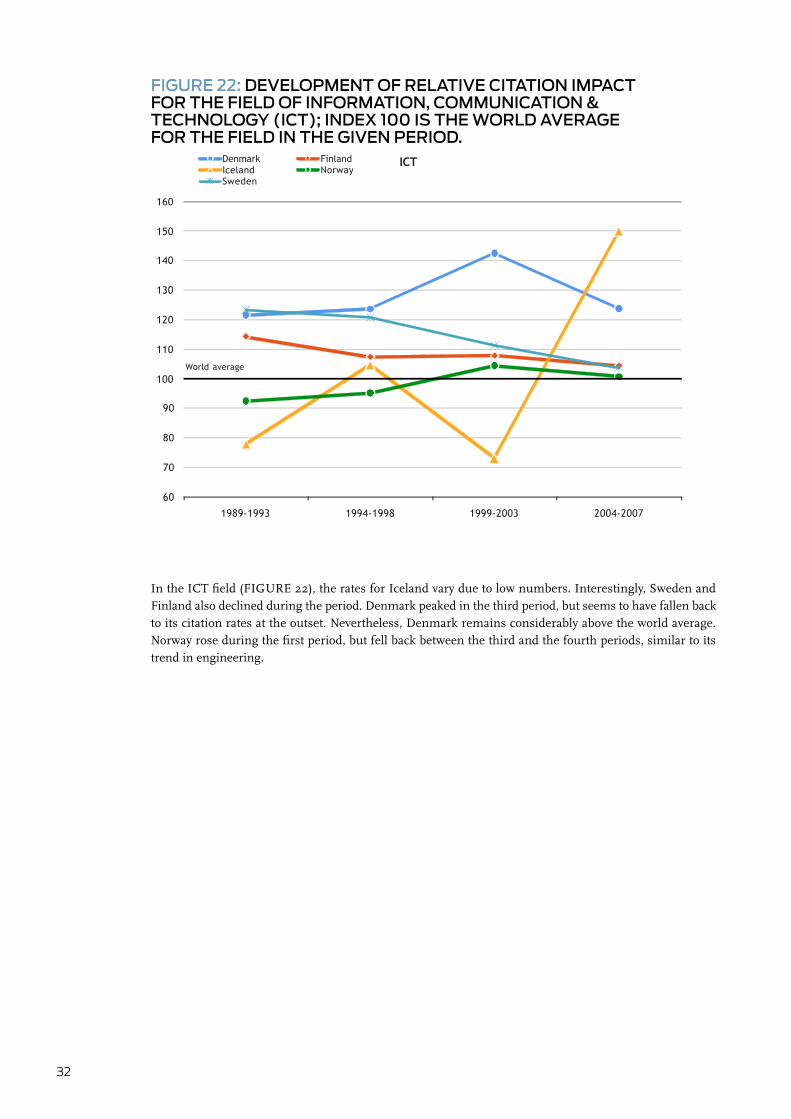
In the ICT field (FIGURE 22), the rates for Iceland vary due to low numbers. Interestingly, Sweden and Finland also declined during the period. Denmark peaked in the third period, but seems to have fallen back to its citation rates at the outset. Nevertheless, Denmark remains considerably above the world average. Norway rose during the first period, but fell back between the third and the fourth periods, similar to its trend in engineering.
FIgure 22: DeveloPmenT oF relATIve CITATIon ImPACT For The FIelD oF InFormATIon, CommunICATIon & TeChnology (ICT); InDex 100 Is The worlD AverAge For The FIelD In The gIven PerIoD.
World average
60
70
80
90
100
110
120
130
140
150
160
1989-1993 1994-1998 1999-2003 2004-2007
ICTDenmark FinlandIceland NorwaySweden

33
In the field of materials science (FIGURE 23), the steep increase for Iceland between the third and fourth periods is attributed to two highly cited papers published in 2006. Denmark again made a major leap between the second and third periods (note the scale of the y axis) and has remained at the high level. Sweden kept pace with Denmark up until the 1999-2003 period, but fell back in the last period. Norway has shown a steady increase.
FIgure 23: DeveloPmenT oF relATIve CITATIon ImPACT For The FIelD oF mATerIAls sCIenCe; InDex 100 Is The worlD AverAge For The FIelD In The gIven PerIoD.
World average
405060708090
100110120130140150160170180190200210220230240250260
1989-1993 1994-1998 1999-2003 2004-2007
Materials ScienceDenmark FinlandIceland NorwaySweden
34
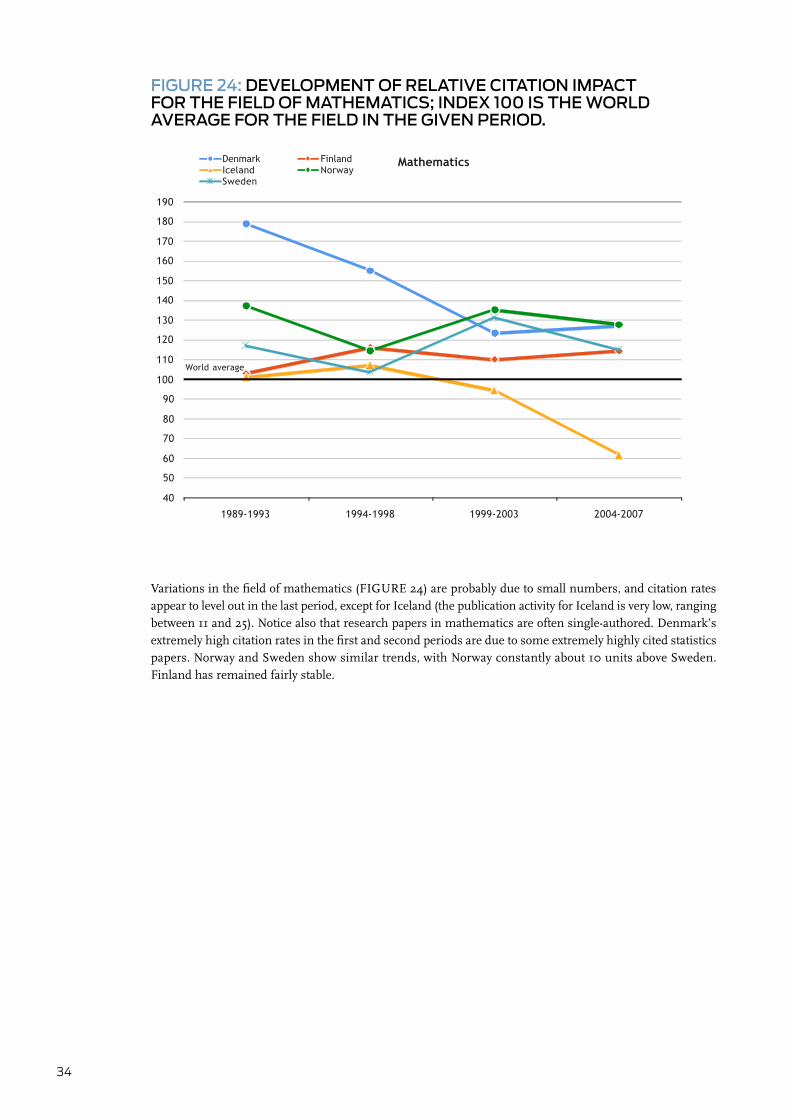
Variations in the field of mathematics (FIGURE 24) are probably due to small numbers, and citation rates appear to level out in the last period, except for Iceland (the publication activity for Iceland is very low, ranging between 11 and 25). Notice also that research papers in mathematics are often single-authored. Denmark’s extremely high citation rates in the first and second periods are due to some extremely highly cited statistics papers. Norway and Sweden show similar trends, with Norway constantly about 10 units above Sweden. Finland has remained fairly stable.
FIgure 24: DeveloPmenT oF relATIve CITATIon ImPACT For The FIelD oF mAThemATICs; InDex 100 Is The worlD AverAge For The FIelD In The gIven PerIoD.
World average
40
50
60
70
80
90
100
110
120
130
140
150
160
170
180
190
1989-1993 1994-1998 1999-2003 2004-2007
MathematicsDenmark FinlandIceland NorwaySweden
35
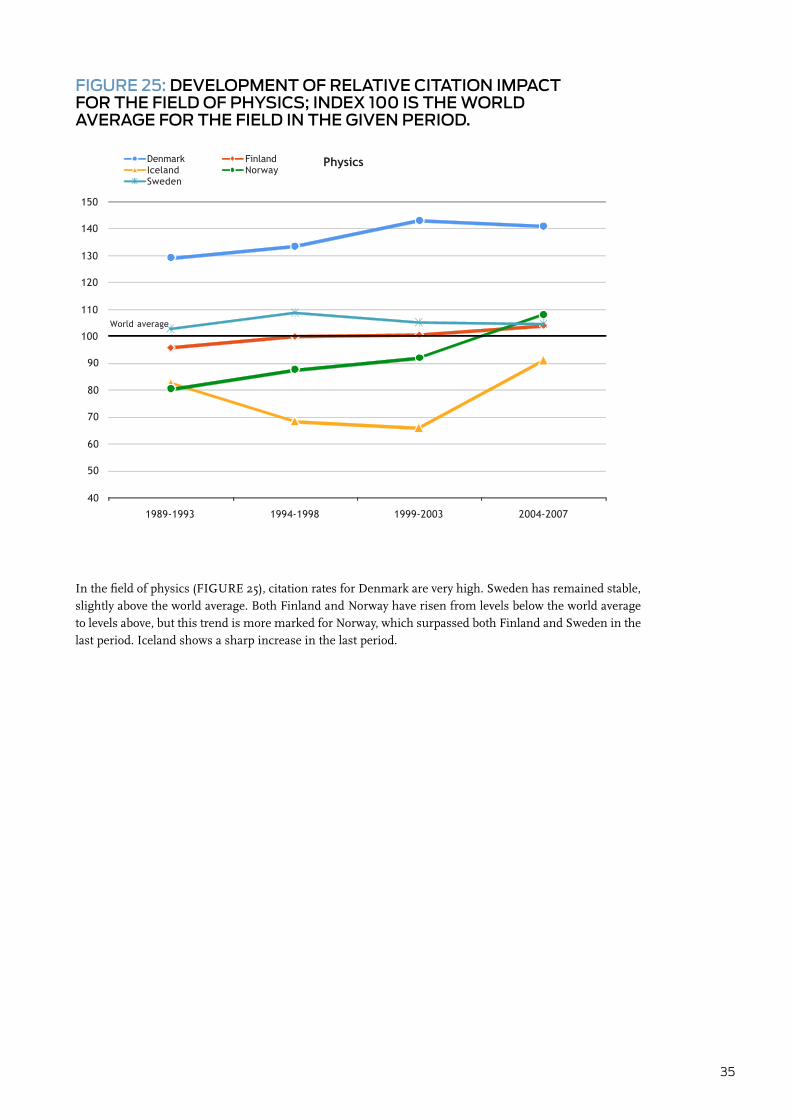
In the field of physics (FIGURE 25), citation rates for Denmark are very high. Sweden has remained stable, slightly above the world average. Both Finland and Norway have risen from levels below the world average to levels above, but this trend is more marked for Norway, which surpassed both Finland and Sweden in the last period. Iceland shows a sharp increase in the last period.
FIgure 25: DeveloPmenT oF relATIve CITATIon ImPACT For The FIelD oF PhysICs; InDex 100 Is The worlD AverAge For The FIelD In The gIven PerIoD.
World average
40
50
60
70
80
90
100
110
120
130
140
150
1989-1993 1994-1998 1999-2003 2004-2007
PhysicsDenmark FinlandIceland NorwaySweden
36
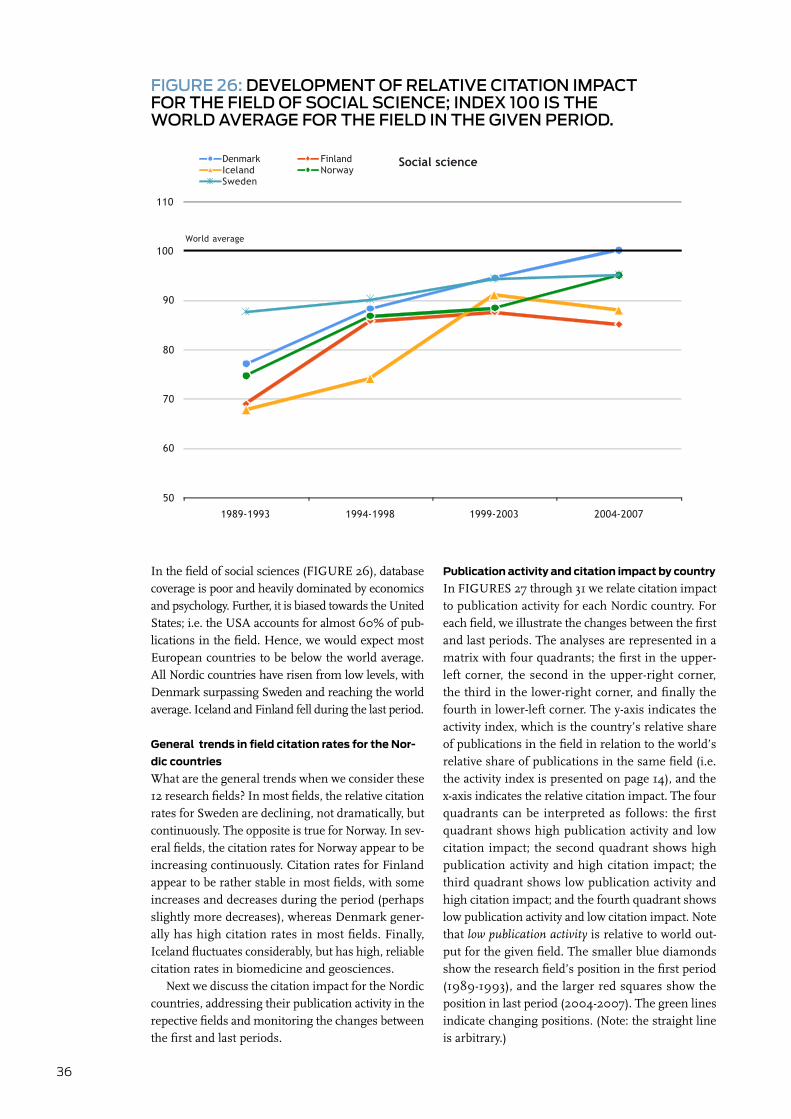
In the field of social sciences (FIGURE 26), database coverage is poor and heavily dominated by economics and psychology. Further, it is biased towards the United States; i.e. the USA accounts for almost 60% of pub-lications in the field. Hence, we would expect most European countries to be below the world average. All Nordic countries have risen from low levels, with Denmark surpassing Sweden and reaching the world average. Iceland and Finland fell during the last period.
General trends in field citation rates for the Nor-
dic countries
What are the general trends when we consider these 12 research fields? In most fields, the relative citation rates for Sweden are declining, not dramatically, but continuously. The opposite is true for Norway. In sev-eral fields, the citation rates for Norway appear to be increasing continuously. Citation rates for Finland appear to be rather stable in most fields, with some increases and decreases during the period (perhaps slightly more decreases), whereas Denmark gener-ally has high citation rates in most fields. Finally, Iceland fluctuates considerably, but has high, reliable citation rates in biomedicine and geosciences.
Next we discuss the citation impact for the Nordic countries, addressing their publication activity in the repective fields and monitoring the changes between the first and last periods.
Publication activity and citation impact by country
In FIGURES 27 through 31 we relate citation impact to publication activity for each Nordic country. For each field, we illustrate the changes between the first and last periods. The analyses are represented in a matrix with four quadrants; the first in the upper-left corner, the second in the upper-right corner, the third in the lower-right corner, and finally the fourth in lower-left corner. The y-axis indicates the activity index, which is the country’s relative share of publications in the field in relation to the world’s relative share of publications in the same field (i.e. the activity index is presented on page 14), and the x-axis indicates the relative citation impact. The four quadrants can be interpreted as follows: the first quadrant shows high publication activity and low citation impact; the second quadrant shows high publication activity and high citation impact; the third quadrant shows low publication activity and high citation impact; and the fourth quadrant shows low publication activity and low citation impact. Note that low publication activity is relative to world out-put for the given field. The smaller blue diamonds show the research field’s position in the first period (1989-1993), and the larger red squares show the position in last period (2004-2007). The green lines indicate changing positions. (Note: the straight line is arbitrary.)
FIgure 26: DeveloPmenT oF relATIve CITATIon ImPACT For The FIelD oF soCIAl sCIenCe; InDex 100 Is The worlD AverAge For The FIelD In The gIven PerIoD.
World average
50
60
70
80
90
100
110
1989-1993 1994-1998 1999-2003 2004-2007
Social scienceDenmark FinlandIceland NorwaySweden
37
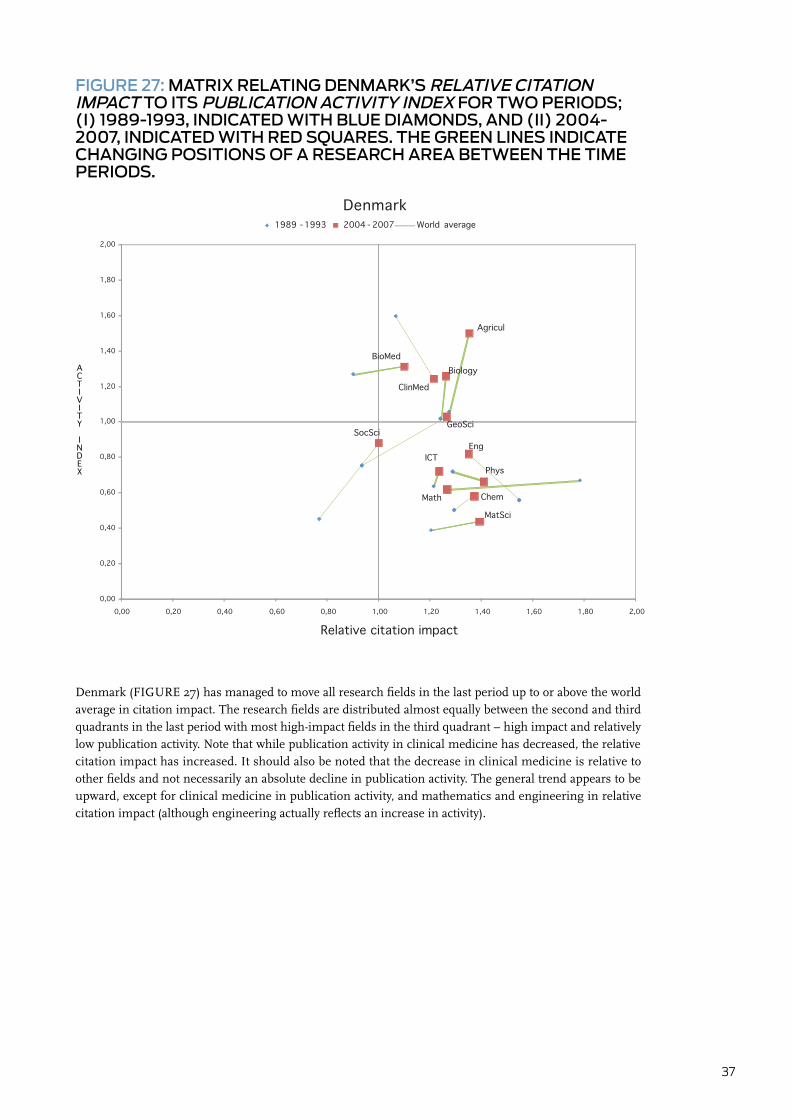
Denmark (FIGURE 27) has managed to move all research fields in the last period up to or above the world average in citation impact. The research fields are distributed almost equally between the second and third quadrants in the last period with most high-impact fields in the third quadrant – high impact and relatively low publication activity. Note that while publication activity in clinical medicine has decreased, the relative citation impact has increased. It should also be noted that the decrease in clinical medicine is relative to other fields and not necessarily an absolute decline in publication activity. The general trend appears to be upward, except for clinical medicine in publication activity, and mathematics and engineering in relative citation impact (although engineering actually reflects an increase in activity).
FIgure 27: mATrIx relATIng DenmArk’s relATIve CITATIon ImPACT To ITs PublICATIon ACTIvITy InDex For Two PerIoDs; (I) 1989-1993, InDICATeD wITh blue DIAmonDs, AnD (II) 2004-2007, InDICATeD wITh reD squAres. The green lInes InDICATe ChAngIng PosITIons oF A reseArCh AreA beTween The TIme PerIoDs.
Agricul
BiologyBioMed
Chem
ClinMed
Eng
GeoSci
ICT
MatSci
Math
Phys
SocSci
0,00
0,20
0,40
0,60
0,80
1,00
1,20
1,40
1,60
1,80
2,00
0,00 0,20 0,40 0,60 0,80 1,00 1,20 1,40 1,60 1,80 2,00
Relative citation impact
Denmark1989 -1993 2004 - 2007 World average
ACTIVITY
INDEX
38
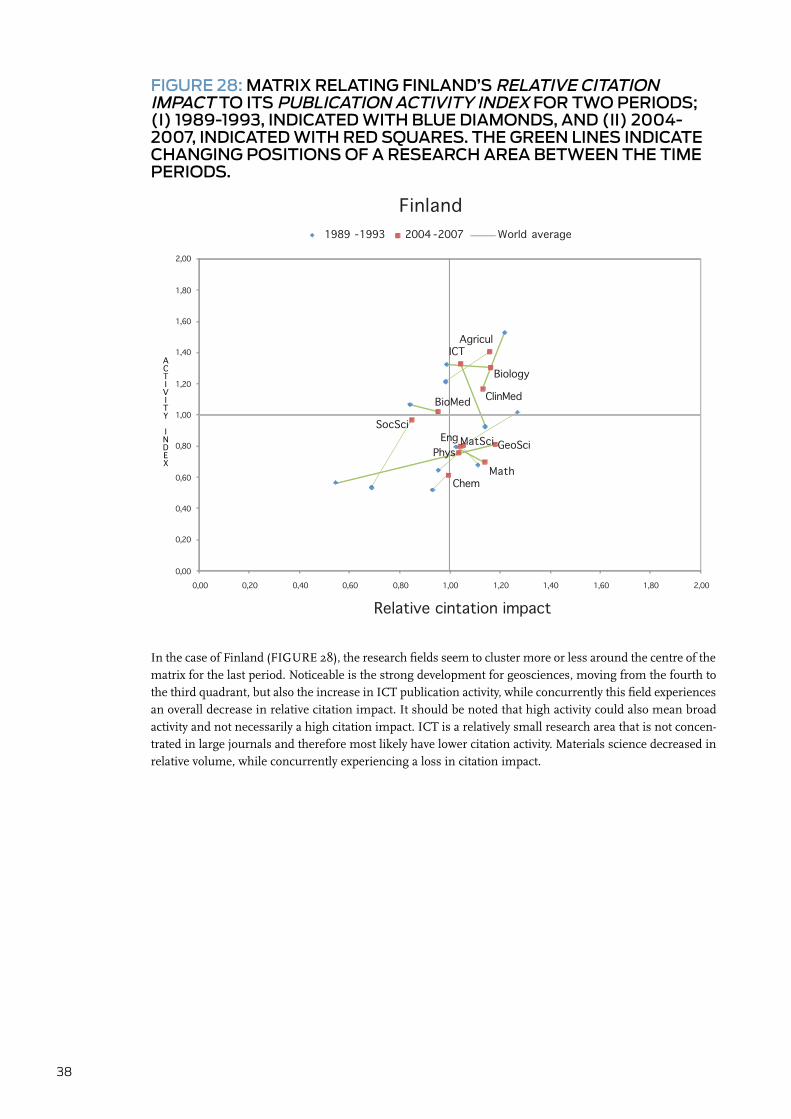
In the case of Finland (FIGURE 28), the research fields seem to cluster more or less around the centre of the matrix for the last period. Noticeable is the strong development for geosciences, moving from the fourth to the third quadrant, but also the increase in ICT publication activity, while concurrently this field experiences an overall decrease in relative citation impact. It should be noted that high activity could also mean broad activity and not necessarily a high citation impact. ICT is a relatively small research area that is not concen-trated in large journals and therefore most likely have lower citation activity. Materials science decreased in relative volume, while concurrently experiencing a loss in citation impact.
FIgure 28: mATrIx relATIng FInlAnD’s relATIve CITATIon ImPACT To ITs PublICATIon ACTIvITy InDex For Two PerIoDs; (I) 1989-1993, InDICATeD wITh blue DIAmonDs, AnD (II) 2004-2007, InDICATeD wITh reD squAres. The green lInes InDICATe ChAngIng PosITIons oF A reseArCh AreA beTween The TIme PerIoDs.
Agricul
Biology
BioMed
Chem
ClinMed
Eng GeoSci
ICT
MatSci
MathPhys
SocSci
0,00
0,20
0,40
0,60
0,80
1,00
1,20
1,40
1,60
1,80
2,00
0,00 0,20 0,40 0,60 0,80 1,00 1,20 1,40 1,60 1,80 2,00
Relative cintation impact
Finland1989 -1993 2004 -2007 World average
ACTIVITY
INDEX
39
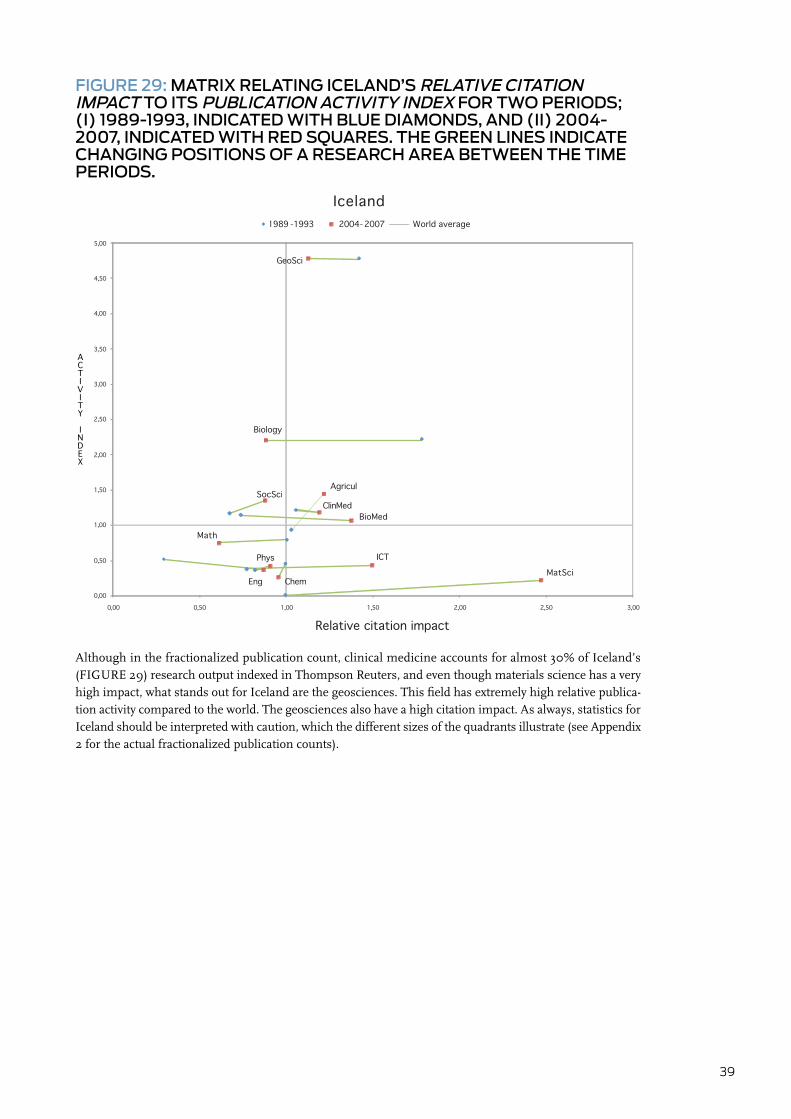
Although in the fractionalized publication count, clinical medicine accounts for almost 30% of Iceland’s (FIGURE 29) research output indexed in Thompson Reuters, and even though materials science has a very high impact, what stands out for Iceland are the geosciences. This field has extremely high relative publica-tion activity compared to the world. The geosciences also have a high citation impact. As always, statistics for Iceland should be interpreted with caution, which the different sizes of the quadrants illustrate (see Appendix 2 for the actual fractionalized publication counts).
FIgure 29: mATrIx relATIng ICelAnD’s relATIve CITATIon ImPACT To ITs PublICATIon ACTIvITy InDex For Two PerIoDs; (I) 1989-1993, InDICATeD wITh blue DIAmonDs, AnD (II) 2004-2007, InDICATeD wITh reD squAres. The green lInes InDICATe ChAngIng PosITIons oF A reseArCh AreA beTween The TIme PerIoDs.
Agricul
Biology
BioMed
Chem
ClinMed
Eng
GeoSci
ICT
MatSci
Math
Phys
SocSci
0,00
0,50
1,00
1,50
2,00
2,50
3,00
3,50
4,00
4,50
5,00
0,00 0,50 1,00 1,50 2,00 2,50 3,00
Relative citation impact
Iceland1989 -1993 2004-2007 World average
ACTIVITY
INDEX

40
Noticeably, and in support of the trend in field citation rates identified in the previous section, Norway (FIG-URE 30) has increased its citation impact in all fields but mathematics, moving close to or above the world average. It is also noticeable that Norway is strong in fields involving natural resources, e.g. geosciences, agri-culture, and biology. But Norway also has relatively high publication activity in social sciences. The research fields are stretched out along the centre of the matrix.
FIgure 30: mATrIx relATIng norwAy’s relATIve CITATIon ImPACT To ITs PublICATIon ACTIvITy InDex For Two PerIoDs; (I) 1989-1993, InDICATeD wITh blue DIAmonDs, AnD (II) 2004-2007, InDICATeD wITh reD squAres. The green lInes InDICATe ChAngIng PosITIons oF A reseArCh AreA beTween The TIme PerIoDs.
Agricul
Biology
BioMed
Chem
ClinMed
Eng
GeoSci
ICT
MatSci
Math
Phys
SocSci
0,00
0,20
0,40
0,60
0,80
1,00
1,20
1,40
1,60
1,80
2,00
2,20
2,40
2,60
0,00 0,20 0,40 0,60 0,80 1,00 1,20 1,40 1,60 1,80 2,00
Relative citation impact
Norway1989 -1993 2004 -2007 World average
ACTIVITY
INDEX

41
The Swedish research fields (FIGURE 31) are moving towards the centre of the matrix. This applies to both dimensions, i.e. relative publication activity and relative citation impact. Higher impact fields in the first period lose impact in the last period. Social sciences, engineering, and mathematics have increased in relative size, while biomedicine and clinical medicine have decreased. Further, there have been considerable citation decreases in biology, agriculture, chemistry, and ICT. This is true also for engineering, but concurrently this field has grown.
Generally, FIGURE 27 through FIGURE 31 confirm the previous findings and trends in publication activity and citation impact for the Nordic countries.
FIgure 31: mATrIx relATIng sweDen’s relATIve CITATIon ImPACT To ITs PublICATIon ACTIvITy InDex For Two PerIoDs; (I) 1989-1993, InDICATeD wITh blue DIAmonDs, AnD (II) 2004-2007, InDICATeD wITh reD squAres. The green lInes InDICATe ChAngIng PosITIons oF A reseArCh AreA beTween The TIme PerIoDs.
Agricul
BiologyBioMed
Chem
ClinMed
Eng
GeoSciICT
MatSci
MathPhys
SocSci
0,00
0,20
0,40
0,60
0,80
1,00
1,20
1,40
1,60
1,80
2,00
0,00 0,20 0,40 0,60 0,80 1,00 1,20 1,40 1,60 1,80 2,00
Relative citation indicator
Sweden1989 -1993 2004-2007 World average
ACTIVITY
INDEX
42
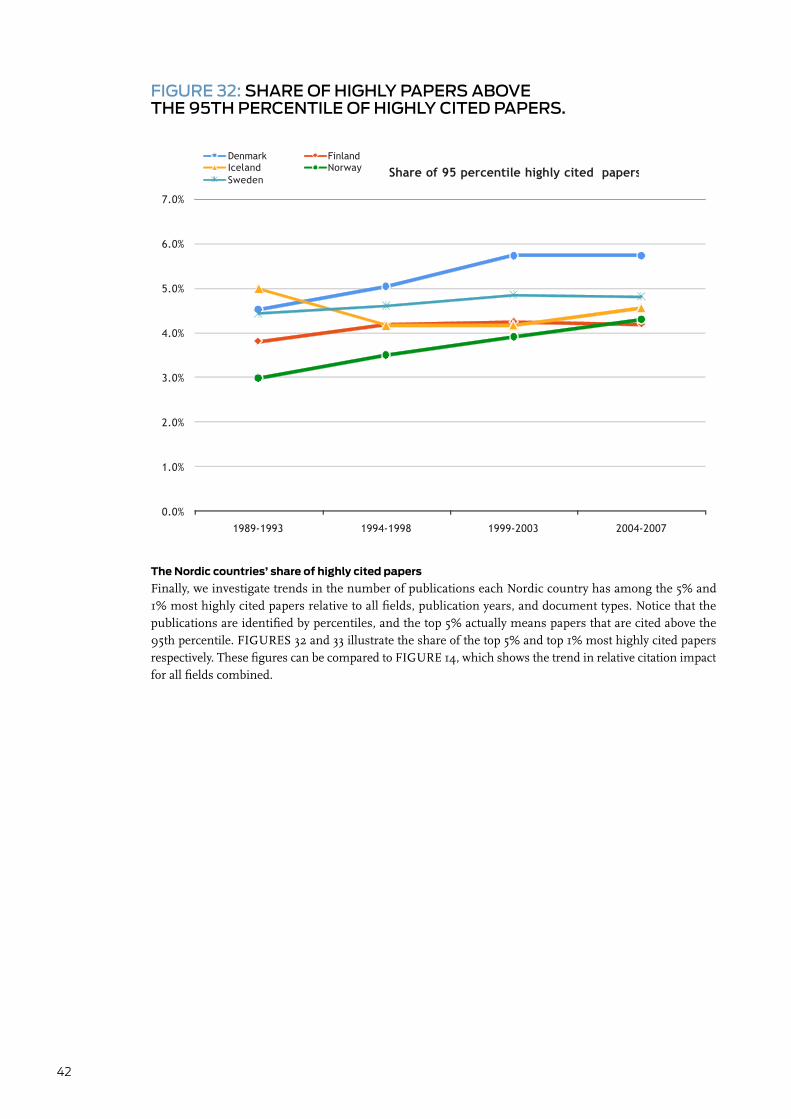
The Nordic countries’ share of highly cited papers
Finally, we investigate trends in the number of publications each Nordic country has among the 5% and 1% most highly cited papers relative to all fields, publication years, and document types. Notice that the publications are identified by percentiles, and the top 5% actually means papers that are cited above the 95th percentile. FIGURES 32 and 33 illustrate the share of the top 5% and top 1% most highly cited papers respectively. These figures can be compared to FIGURE 14, which shows the trend in relative citation impact for all fields combined.
FIgure 32: shAre oF hIghly PAPers Above The 95Th PerCenTIle oF hIghly CITeD PAPers.
0.0%
1.0%
2.0%
3.0%
4.0%
5.0%
6.0%
7.0%
1989-1993 1994-1998 1999-2003 2004-2007
Share of 95 percentile highly cited papersDenmark FinlandIceland NorwaySweden

43
The overall trend is similar to FIGURE 14. Denmark has high overall citation rates and also the largest share of highly cited papers among the Nordic coun-tries. Norway is increasing its share of highly cited papers. Finland’s share increases between the first two periods but decreases between the two last, whereas Iceland seems to have a few very highly cited papers in last period. These papers most likely account for some of the very high citation rates iden-tified in a few fields for Iceland. Finally, contrary to the trend in overall citation rates, Sweden appears to be experiencing a small increase in highly cited papers. This indicates that the cause behind the over-all decrease in citation impact should be looked for elsewhere.
Conclusions from chapter 3
In the last period studied, i.e. 2004 through 2007, the Nordic countries were amongst the world’s most-cited countries, ranging from Denmark in fourth place to Finland in eleventh place.
In the first period studied, 1989 through 1993, Sweden and Denmark were at approximately the same level (just over 10% above the world average). While Sweden has remained basically at the same level since then, Denmark has taken a major leap, primarily between 1994-1998 and 1999-2003. Fin-land started at about 5% above the world average
(a level lower than Sweden and Denmark in the 1989-1993 period), but rose to almost 10% above world average during the 1990s and early 2000s. In the 2004-2007 period, however, Finland returned to nearly the same level as in 1989-1993.
In 1989-1993 Norway started at the lowest cita-tion level of all the Nordic countries (about 5% below the world average), but has since shown a steady increase, surpassing Finland in 2004-2007. Iceland advanced rapidly during the last two periods and in 2004-2007 held second place in the Nordic group, around 15% above the world average. It should be remembered that statistics for Iceland, due to its small size, are strongly affected by individual, highly cited publications.
Splitting the data into national publications (where all authors represent the same country) and international publications (where more than one country is represented among the authors) we find that much of the increase in citation rates for Den-mark and Norway can be attributed to increased cita-tion rates of national publications. For Iceland the increase is due to increased citation rates of inter-national publications, while Finland and Sweden experienced decreasing citation rates regarding their international publications and constant rates regard-ing the national ones.
FIgure 33: shAre oF hIghly PAPers Above The 99Th PerCenTIle oF hIghly CITeD PAPers.
0.0%
0.2%
0.4%
0.6%
0.8%
1.0%
1.2%
1.4%
1989-1993 1994-1998 1999-2003 2004-2007
Share of 99 percentile highly cited papersDenmark FinlandIceland NorwaySweden
44
When splitting the data into broad subject catego-ries, we find the overall pattern repeated for many categories. At times the pattern is repeated on higher citation levels (agriculture, biology, materials sciences) and at times on lower levels (biomedicine, social sci-ences). However, for some subject categories the overall pattern is not repeated. In chemistry, Sweden and Denmark form a group with considerably higher citation rates (25-50% above the world average) than Finland and Norway (on or slightly below the world average); the statistics for Iceland are unstable due to small publication numbers. In clinical medicine, Finland started at the highest Nordic level (more than 20% above the world average), but recently has fallen back about 10 percentage points. In geo-sciences, Denmark, Finland, Norway, and Sweden started at levels below the world average and have now reached levels well above. Iceland started at a very high level (40%-50% above world average), but has fallen back to a more characteristic Nordic level of 12% above the world average. In engineering and physics, Denmark stands out at a stable level 30% to 40 % above the world average (more stable for physics than for engineering), while the other Nordic countries group together around the world average (where the Norwegian trend is clearly increasing). In mathematics, the pattern is quite different, probably due to the small underlying publication volumes, although all Nordic countries except Iceland remain on very high citation levels (15%-30% above world average). Generally, Iceland shows unstable values for several fields, since the number of underlying publications in many cases is very small (< 100).
Looking at the different fields country-by-country, we see that in the last period Denmark has managed to push all research fields up to or above the world average in citation impact. For Finland, the field of geosciences stands out with a strong trend in both size and citation rate, while ICT has increased in volume but decreased in citation rate. For Iceland, the geo-sciences stand out with a very large volume compared to other countries and also a high citation rate. Nor-way has increased its citation rates in all fields except
mathematics, and stands strong in fields involving natural resources (geosciences, agriculture, and biol-ogy). For Sweden, we see a trend where all fields are moving towards the world average – fields that used to be strong are weakening, while fields that used to be weak are strengthening.
Since citations are unevenly distributed across publications (some papers receive many citations while most papers receive few) it is worth studying the highly cited papers. In fact, the trends for these papers and the trends for average citation rates are much the same for the Nordic countries, except that Sweden’s trend shows a small increase in the share of highly cited papers. Consequently, the explanation for the general decline in Swedish citations is likely to be hidden amongst the papers with medium or low citation rates.
It should be noted that the methodology used here sets different conditions for the countries depending on the size of publication output. Large countries change their citation rates less easily than small countries, and in this respect Sweden is 2.0 to 2.5 times larger than Denmark, Finland, and Norway, and more than 40 times larger than Iceland. Hence, it is not surprising that Sweden generally shows the most stable trend, and Iceland shows the most unsta-ble trend. The trend in Denmark is, however, excep-tional. Contrary to what could have been expected in the late 1980s, Denmark has increased her citation rates dramatically, and now seems to have stabilized amongst the world elite, with an average citation rate 20% or more above the world average. Norway and Iceland have also experienced strong increases, but from lower levels than Denmark. Sweden and Fin-land, on the other hand, have remained at the same citation levels, or even declined.
This chapter has focused on the differences between the Nordic countries, but we must remem-ber that on a higher level all Nordic countries are similar, with high citation rates in all fields. In agri-culture, biology, materials sciences, and perhaps math-ematics the Nordic countries are especially strong.
45
Aksnes, D.W. & Hessen, D.O. (2009). The structure and development of polar research (1981-2007). A publication-based approach. Arctic, Antarctic, and Alpine Research, 2, p. 155-163.
Clinical Research in Finland and Sweden. Evaluation Report. Publications of the Academy of Finland 5/09. [Electronic resource] http://www.aka.fi/Tiedostot/Tiedostot/Julkaisut/05_09%20Clinical%20Research.pdf.
Glänzel, W. (2000). Science in Scandinavia: A Bibliometric Approach. Scientometrics, 48 (2), p. 121-150.
Glänzel, W. & Schoepflin, U. (1995). A bibliometric study on ageing and reception processes of scientific literature. Journal of Information Science, 21 (1), p. 37-53.
Gunnarsson, M., Fröberg, J. Jacobsson, & Karlsson, S. (2008). Subject classification of publications in the ISI database based on references and citations. Swedish Research Council, Stockholm.
Gunnarson, M., Aksnes, D.W., Faubærk, L. Finnbjörnsson, Þ.; Fröberg, J., Karlsson, S., Kronman, U, Lehvo, A., Nuutinen, A., Schneider, J.W., Sivertsen, G., Sveinsdóttir Morthens, S.G. (2010). ). International Research Cooperation in the Nordic Countries. A publication from the NORIA-net “The use of bibliometrics in research policy and evaluation activities”. Noria-Net Report 2. NordForsk, Oslo.
Katz, J. S. & Hicks, D. (1995). The Classification of Interdisciplinary Journals: A New Approach. The Fifth Biennial Conference of The International Society for Scientometrics and Informatics, Rosary College, River Forest, Il., USA.
Larsen, P.O. (2008). The state of the art in publication counting. Scientometrics. 77(2), p. 235-251.
Lundberg, J. (2007). Lifting the crown – citation z-score. Journal of Infometrics, 1 (2007), p. 145-154.
Moed, H. F., Debruin, R. E., & Van Leeuwen, T. N. (1995). New bibliometric tools for the assessment of National Research Performance – Database description, overview of indicators and first applications. Scientometrics, 33(3), p. 381–422.
Moed, H.F. (2005). Citation Analysis in Research Evaluation. Springer-Verlag: Dordrecht, The Netherlands.
REIST-2 (1997). The European Report on Science and Technology Indicators 1997. Second Edition, EUR 17639. European Commission, Brussels.
Sivertsen, Gunnar (2009) Publication patterns in all fields. In Åström, Fredrik; Danell, Rickard; Larsen, Birger & Wiborg-Schneider, Jesper (eds.) Celebrating Scholarly Communication Studies. A Festschrift for Olle Persson at his 60th Birthday. Special volume of the e-newsletter of the international society for scientometrics and informetrics. Vol. 05-S June 2009:55-60.
Testa, Jim (2010). Regional content expansion in Web of Science: Opening borders to exploration. Thomson Reuters. [Electronic resource, February 9 2010: http://wokinfo.com/products_tools/multidisciplinary/webofscience/contentexp/expansionessay/]
2008 Journal Citation Reports - New Titles (2010). Thomson Reuters. [Electronic resource, February 9 2010: http://
isiwebofknowledge.com/products_tools/analytical/jcr/08jcr-newtitles/]
references
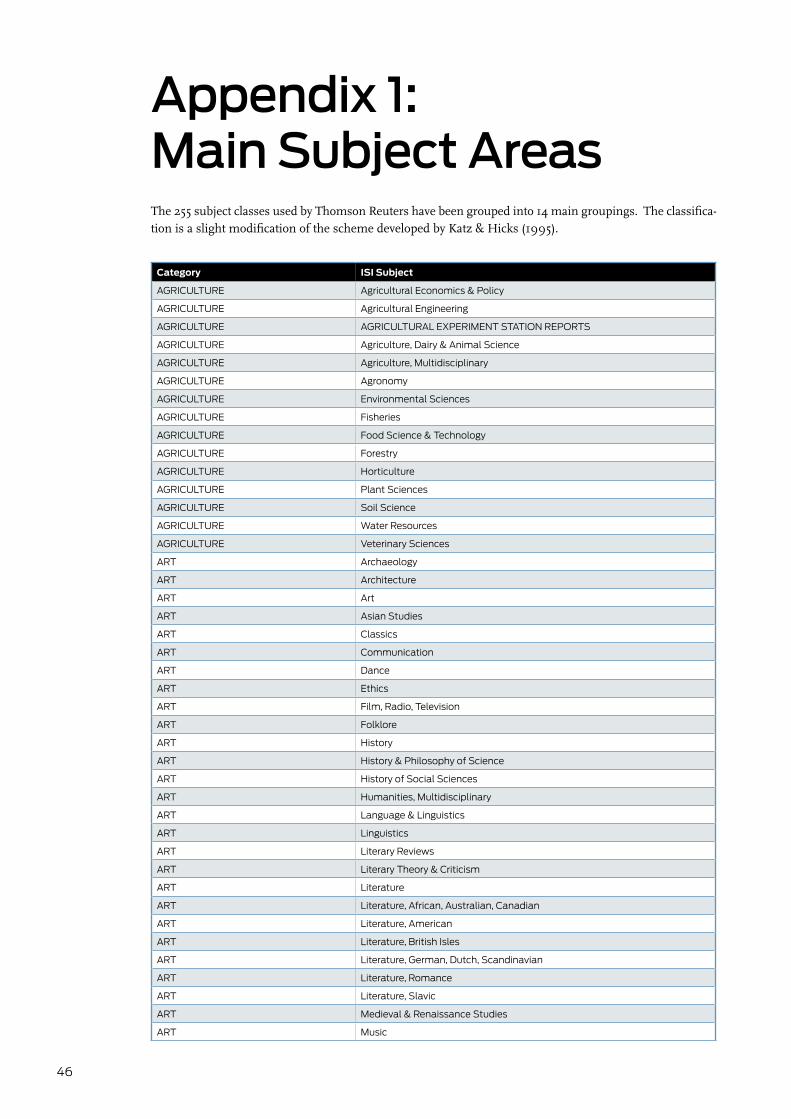
46
Appendix 1: main subject Areas The 255 subject classes used by Thomson Reuters have been grouped into 14 main groupings. The classifica-tion is a slight modification of the scheme developed by Katz & Hicks (1995).
Category ISI Subject
AGRICULTURE AgriculturalEconomics&Policy
AGRICULTURE AgriculturalEngineering
AGRICULTURE AGRICULTURALEXPERIMENTSTATIONREPORTS
AGRICULTURE Agriculture,Dairy&AnimalScience
AGRICULTURE Agriculture,Multidisciplinary
AGRICULTURE Agronomy
AGRICULTURE EnvironmentalSciences
AGRICULTURE Fisheries
AGRICULTURE FoodScience&Technology
AGRICULTURE Forestry
AGRICULTURE Horticulture
AGRICULTURE PlantSciences
AGRICULTURE SoilScience
AGRICULTURE WaterResources
AGRICULTURE VeterinarySciences
ART Archaeology
ART Architecture
ART Art
ART AsianStudies
ART Classics
ART Communication
ART Dance
ART Ethics
ART Film,Radio,Television
ART Folklore
ART History
ART History&PhilosophyofScience
ART HistoryofSocialSciences
ART Humanities,Multidisciplinary
ART Language&Linguistics
ART Linguistics
ART LiteraryReviews
ART LiteraryTheory&Criticism
ART Literature
ART Literature,African,Australian,Canadian
ART Literature,American
ART Literature,BritishIsles
ART Literature,German,Dutch,Scandinavian
ART Literature,Romance
ART Literature,Slavic
ART Medieval&RenaissanceStudies
ART Music

47
ART ORIENTALSTUDIES
ART PHILOSOPHY
ART Poetry
ART Religion
ART Theater
BIOLOGY BiodiversityConservation
BIOLOGY Biology
BIOLOGY BIOLOGY,MISCELLANEOUS
BIOLOGY DevelopmentalBiology
BIOLOGY Ecology
BIOLOGY Entomology
BIOLOGY EvolutionaryBiology
BIOLOGY Limnology
BIOLOGY Marine&FreshwaterBiology
BIOLOGY Mycology
BIOLOGY Ornithology
BIOLOGY ReproductiveBiology
BIOLOGY Zoology
BIOMEDICINE Anatomy&Morphology
BIOMEDICINE BiochemicalResearchMethods
BIOMEDICINE Biochemistry&MolecularBiology
BIOMEDICINE Biophysics
BIOMEDICINE Biotechnology&AppliedMicrobiology
BIOMEDICINE CellBiology
BIOMEDICINE Chemistry,Medicinal
BIOMEDICINE COMPUTERCRITICALREVIEWS
BIOMEDICINE CYTOLOGY&HISTOLOGY
BIOMEDICINE Genetics&Heredity
BIOMEDICINE Immunology
BIOMEDICINE Mathematical&ComputationalBiology
BIOMEDICINE Microbiology
BIOMEDICINE Microscopy
BIOMEDICINE Neurosciences
BIOMEDICINE Parasitiology
BIOMEDICINE Pharmacology&Pharmacy
BIOMEDICINE Physiology
BIOMEDICINE SportSciences
CHEMISTRY Chemistry,Analytical
CHEMISTRY Chemistry,Applied
CHEMISTRY Chemistry,Inorganic&Nuclear
CHEMISTRY Chemistry,Multidisciplinary
CHEMISTRY Chemistry,Organic
CHEMISTRY Chemistry,Physical
CHEMISTRY Crystallography
CHEMISTRY Electrochemistry
CHEMISTRY PolymerScience
CHEMISTRY Spectroscopy
CLINICALMEDICINE Allergy
CLINICALMEDICINE Andrology
CLINICALMEDICINE Anesthesiology
CLINICALMEDICINE Cardiac&CardiovascularSystem
CLINICALMEDICINE ClinicalNeurology
CLINICALMEDICINE CriticalCareMedicine

48
CLINICALMEDICINE Dentistry,OralSurgery&Medicine
CLINICALMEDICINE Dermatology
CLINICALMEDICINE EmergencyMedicine
CLINICALMEDICINE Endocrinology&Metabolism
CLINICALMEDICINE Gastroenterology&Hepatology
CLINICALMEDICINE Geriatrics&Gerontology
CLINICALMEDICINE Gerontology
CLINICALMEDICINE HealthCareSciences&Services
CLINICALMEDICINE Hematology
CLINICALMEDICINE InfectiousDiseases
CLINICALMEDICINE Integrative&ComplementaryMedicine
CLINICALMEDICINE MedicalEthics
CLINICALMEDICINE MedicalInformatics
CLINICALMEDICINE MedicalLaboratoryTechnology
CLINICALMEDICINE Medicine,General&Internal
CLINICALMEDICINE MEDICINE,LEGAL
CLINICALMEDICINE MEDICINE,MISCELLANEOUS
CLINICALMEDICINE Medicine,Research&Experimental
CLINICALMEDICINE Neuroimaging
CLINICALMEDICINE Nursing
CLINICALMEDICINE Nutrition&Dietetics
CLINICALMEDICINE Obstetrics&Gynecology
CLINICALMEDICINE Oncology
CLINICALMEDICINE Ophthalmology
CLINICALMEDICINE Orthopedics
CLINICALMEDICINE Otorhinolaryngology
CLINICALMEDICINE Pathology
CLINICALMEDICINE Pediatrics
CLINICALMEDICINE PeripheralVascularDisease
CLINICALMEDICINE Psychiatry
CLINICALMEDICINE Psychology,Clinical
CLINICALMEDICINE Public,Environmental&OccupationalHealth
CLINICALMEDICINE Radiology,NuclearMedicine&MedicalImaging
CLINICALMEDICINE Rehabilitation
CLINICALMEDICINE RespiratorySystem
CLINICALMEDICINE Rheumatology
CLINICALMEDICINE SubstanceAbuse
CLINICALMEDICINE Surgery
CLINICALMEDICINE Toxicology
CLINICALMEDICINE Transplantation
CLINICALMEDICINE TropicalMedicine
CLINICALMEDICINE Urology&Nephrology
CLINICALMEDICINE Virology
ENG Construction&BuildingTechnology
ENG Energy&Fuels
ENG Engineering,Aerospace
ENG Engineering,Biomedical
ENG Engineering,Chemical
ENG Engineering,Civil
ENG Engineering,Environmental
ENG Engineering,Geological
ENG Engineering,Industrial
ENG Engineering,Manufacturing
ENG Engineering,Marine
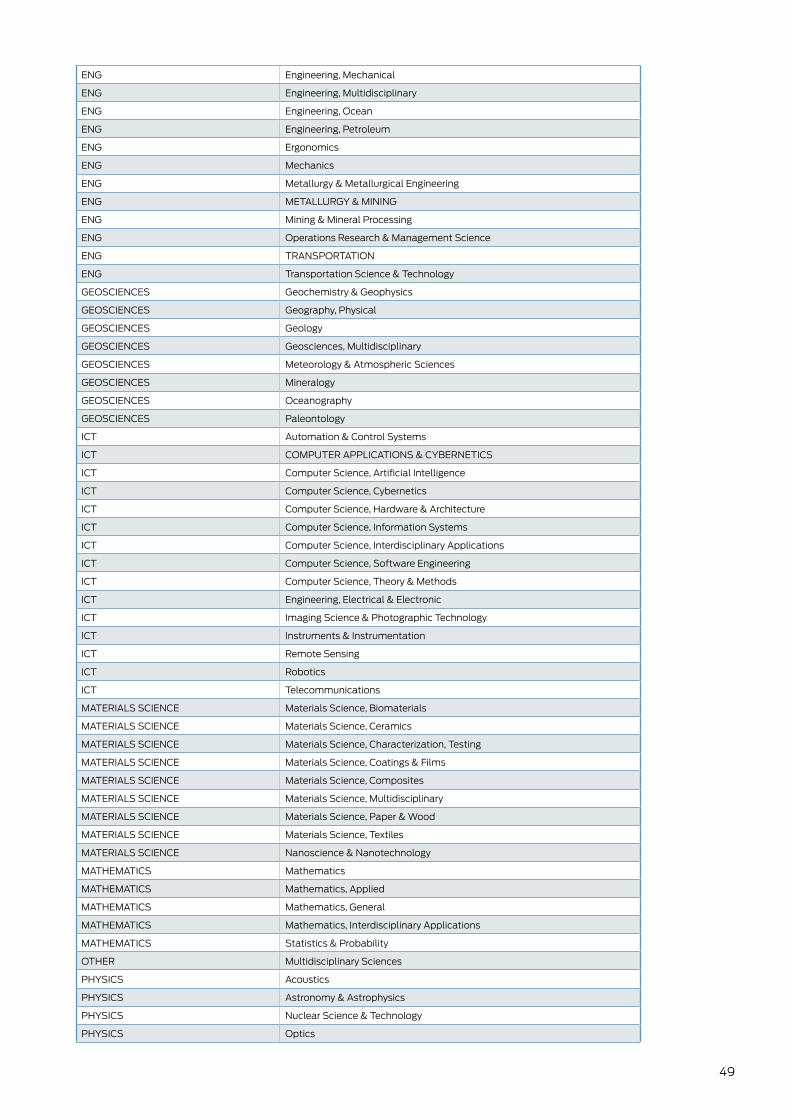
49
ENG Engineering,Mechanical
ENG Engineering,Multidisciplinary
ENG Engineering,Ocean
ENG Engineering,Petroleum
ENG Ergonomics
ENG Mechanics
ENG Metallurgy&MetallurgicalEngineering
ENG METALLURGY&MINING
ENG Mining&MineralProcessing
ENG OperationsResearch&ManagementScience
ENG TRANSPORTATION
ENG TransportationScience&Technology
GEOSCIENCES Geochemistry&Geophysics
GEOSCIENCES Geography,Physical
GEOSCIENCES Geology
GEOSCIENCES Geosciences,Multidisciplinary
GEOSCIENCES Meteorology&AtmosphericSciences
GEOSCIENCES Mineralogy
GEOSCIENCES Oceanography
GEOSCIENCES Paleontology
ICT Automation&ControlSystems
ICT COMPUTERAPPLICATIONS&CYBERNETICS
ICT ComputerScience,ArtificialIntelligence
ICT ComputerScience,Cybernetics
ICT ComputerScience,Hardware&Architecture
ICT ComputerScience,InformationSystems
ICT ComputerScience,InterdisciplinaryApplications
ICT ComputerScience,SoftwareEngineering
ICT ComputerScience,Theory&Methods
ICT Engineering,Electrical&Electronic
ICT ImagingScience&PhotographicTechnology
ICT Instruments&Instrumentation
ICT RemoteSensing
ICT Robotics
ICT Telecommunications
MATERIALSSCIENCE MaterialsScience,Biomaterials
MATERIALSSCIENCE MaterialsScience,Ceramics
MATERIALSSCIENCE MaterialsScience,Characterization,Testing
MATERIALSSCIENCE MaterialsScience,Coatings&Films
MATERIALSSCIENCE MaterialsScience,Composites
MATERIALSSCIENCE MaterialsScience,Multidisciplinary
MATERIALSSCIENCE MaterialsScience,Paper&Wood
MATERIALSSCIENCE MaterialsScience,Textiles
MATERIALSSCIENCE Nanoscience&Nanotechnology
MATHEMATICS Mathematics
MATHEMATICS Mathematics,Applied
MATHEMATICS Mathematics,General
MATHEMATICS Mathematics,InterdisciplinaryApplications
MATHEMATICS Statistics&Probability
OTHER MultidisciplinarySciences
PHYSICS Acoustics
PHYSICS Astronomy&Astrophysics
PHYSICS NuclearScience&Technology
PHYSICS Optics
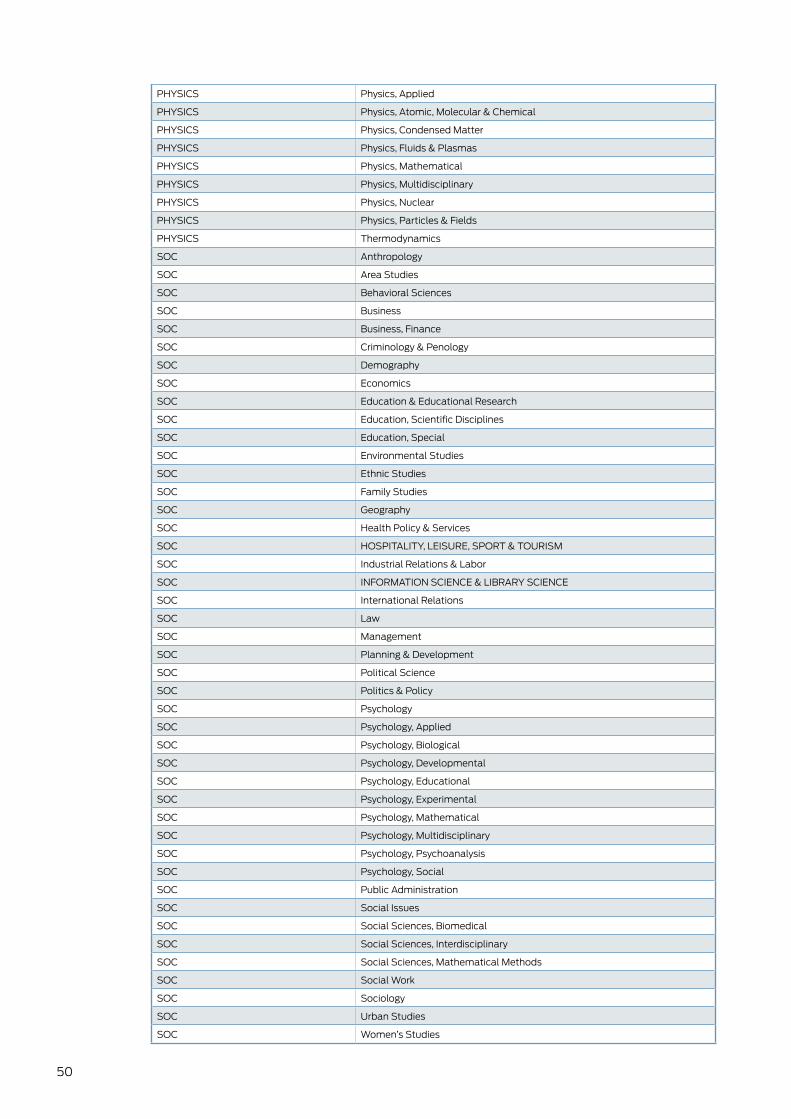
50
PHYSICS Physics,Applied
PHYSICS Physics,Atomic,Molecular&Chemical
PHYSICS Physics,CondensedMatter
PHYSICS Physics,Fluids&Plasmas
PHYSICS Physics,Mathematical
PHYSICS Physics,Multidisciplinary
PHYSICS Physics,Nuclear
PHYSICS Physics,Particles&Fields
PHYSICS Thermodynamics
SOC Anthropology
SOC AreaStudies
SOC BehavioralSciences
SOC Business
SOC Business,Finance
SOC Criminology&Penology
SOC Demography
SOC Economics
SOC Education&EducationalResearch
SOC Education,ScientificDisciplines
SOC Education,Special
SOC EnvironmentalStudies
SOC EthnicStudies
SOC FamilyStudies
SOC Geography
SOC HealthPolicy&Services
SOC HOSPITALITY,LEISURE,SPORT&TOURISM
SOC IndustrialRelations&Labor
SOC INFORMATIONSCIENCE&LIBRARYSCIENCE
SOC InternationalRelations
SOC Law
SOC Management
SOC Planning&Development
SOC PoliticalScience
SOC Politics&Policy
SOC Psychology
SOC Psychology,Applied
SOC Psychology,Biological
SOC Psychology,Developmental
SOC Psychology,Educational
SOC Psychology,Experimental
SOC Psychology,Mathematical
SOC Psychology,Multidisciplinary
SOC Psychology,Psychoanalysis
SOC Psychology,Social
SOC PublicAdministration
SOC SocialIssues
SOC SocialSciences,Biomedical
SOC SocialSciences,Interdisciplinary
SOC SocialSciences,MathematicalMethods
SOC SocialWork
SOC Sociology
SOC UrbanStudies
SOC Women’sStudies

51
Appendix 2: Fractionalized publication counts for each field
AGRICULTURE 1989-1993 1994-1998 1999-2003 2004-2008
Denmark 1535.71 2464.18 2903.49 2434.19
Finland 1556.33 2119.25 2513.22 2298.20
Iceland 34.33 69.19 93.82 102.08
Norway 1098.47 1667.53 2005.94 1884.99
Sweden 2888.47 3536.02 3631.43 3069.16
BIOLOGY 1989-1993 1994-1998 1999-2003 2004-2008
Denmark 813.45 1174.00 1508.02 1186.43
Finland 935.79 1315.99 1494.03 1238.05
Iceland 45.09 57.03 75.58 90.08
Norway 1044.91 1236.44 1475.43 1355.17
Sweden 1897.19 2180.00 2515.94 2082.40
ENG 1989-1993 1994-1998 1999-2003 2004-2008
Denmark 555.88 961.42 1065.54 1144.51
Finland 598.33 885.91 1102.39 1126.35
Iceland 13.10 17.58 15.08 22.47
Norway 620.37 985.09 966.69 1027.60
Sweden 1483.57 2284.35 2684.86 2628.97
GEOSCIENCES 1989-1993 1994-1998 1999-2003 2004-2008
Denmark 404.54 681.24 995.40 733.55
Finland 268.39 414.58 593.55 585.82
Iceland 65.27 89.56 123.50 148.07
Norway 854.74 1010.62 1249.20 1224.50
Sweden 787.61 1169.26 1331.63 1128.66
ICT 1989-1993 1994-1998 1999-2003 2004-2008
Denmark 564.70 768.70 1110.15 1129.60
Finland 727.55 1128.70 1796.21 2096.50
Iceland 8.54 12.99 26.98 29.46
Norway 340.15 554.17 673.08 919.65
Sweden 1163.56 1728.06 2457.18 2275.98
MATHEMATICS 1989-1993 1994-1998 1999-2003 2004-2008
Denmark 372.75 506.75 577.51 466.46
Finland 391.79 436.53 575.57 530.34
Iceland 11.17 25.58 19.16 24.37
Norway 262.42 344.23 437.86 459.07
Sweden 554.98 907.22 1000.19 1074.13
PHYSICS 1989-1993 1994-1998 1999-2003 2004-2008
Denmark 1862.97 2592.47 2556.96 1940.94
Finland 1477.74 2045.74 2448.82 2242.53
Iceland 23.86 50.79 66.06 53.68
Norway 726.89 973.77 860.88 939.76
Sweden 3528.44 4916.02 5449.71 4361.84

52
ART 1989-1993 1994-1998 1999-2003 2004-2008
Denmark 284.05 319.71 385.16 356.98
Finland 256.48 270.72 365.16 355.45
Iceland 9.50 23.47 30.36 23.58
Norway 279.94 333.16 341.83 389.22
Sweden 402.95 427.63 591.79 460.07
BIOMEDICINE 1989-1993 1994-1998 1999-2003 2004-2008
Denmark 4606.48 5502.70 5874.37 5029.04
Finland 3419.14 4267.77 4754.03 3944.04
Iceland 105.13 158.69 170.12 177.21
Norway 2417.71 2648.18 2684.98 2501.23
Sweden 10783.84 11778.56 11317.35 8814.57
CHEMISTRY 1989-1993 1994-1998 1999-2003 2004-2008
Denmark 1212.30 1621.81 1876.72 1612.13
Finland 1105.79 1683.56 1948.56 1724.51
Iceland 27.91 34.70 41.43 30.77
Norway 840.69 1105.67 1013.64 1001.76
Sweden 3400.92 4117.07 4344.00 3729.26
CLINICAL MEDICINE 1989-1993 1994-1998 1999-2003 2004-2008
Denmark 9084.87 8915.71 8768.37 7966.47
Finland 7679.04 9692.91 9913.06 7532.18
Iceland 175.01 312.21 329.00 326.83
Norway 4706.94 5516.63 5713.52 5638.63
Sweden 17120.62 19544.26 19605.60 15989.75
MATERIALS SCIENCE
1989-1993 1994-1998 1999-2003 2004-2008
Denmark 176.99 338.16 352.24 403.17
Finland 412.35 681.67 890.43 746.76
Iceland 0.08 12.50 4.35 8.66
Norway 125.36 259.82 304.34 313.27
Sweden 761.11 1381.68 1823.46 1508.95
OTHER 1989-1993 1994-1998 1999-2003 2004-2008
Denmark 23.75 22.08 24.01 17.21
Finland 10.33 12.61 6.92 5.91
Iceland 3.00 1.83 2.33 1.00
Norway 18.92 19.50 11.67 9.68
Sweden 55.48 37.42 23.00 21.40
SOC SCI 1989-1993 1994-1998 1999-2003 2004-2008
Denmark 627.34 816.91 1122.31 1246.09
Finland 659.89 1019.75 1281.22 1384.04
Iceland 41.45 67.88 71.63 82.87
Norway 863.15 1265.54 1448.37 1684.04
Sweden 1499.14 2022.64 2457.82 2594.38

53
1 The reports can be downloaded at: http://www.vr.se/english/nordic_bibliometrics
2 Certain data included herein are derived from the Science Citation Index Expanded, Social Science Citation Index and Arts & Humanities Citation Index, prepared by Thomson Reuters®, Philadelphia, Pennsylvania, USA, © Copyright Thomson Reuters® 2009. All rights reserved.
3 Agriculture includes the subject areas of fisheries and forestry.
4 See http://nifu.pdc.no/index.php?seks_id=12474.
5 Information and Communications Technology.
6 This section includes only 12 fields since two, “Arts & Humanities” and “Other”, have been left out, see below.
7 Note: the last period is reduced to 4 years due to a lack of citation data for publications in 2008.
8 In the crown indicator, normalization is done on an aggregated level – the citation average for a given country is divided by the weighted citation average for the relevant fields (Moed et al 1995, p. 399). In our calculations, normalization is done on a item level – the citation for each paper from a given country is divided by the average citations for the field of that paper. These differences are described in detail in: (Lundberg, 2007, p. 146-147).
9 cf. Appendix D in Clinical Research in Finland and Sweden. Evaluation Report (2009): http://www.aka.fi/Tiedostot/Tiedostot/Julkaisut/05_09%20Clinical%20Research.pdf.
10 http://www.aka.fi/Tiedostot/Tiedostot/Julkaisut/05_09%20Clinical%20Research.pdf
11 See the section on Methodological considerations
endnotes

54

55
56
Isbn 978-82-93089-00-1
DE
SIG
N: M
ILL
IME
TER
PR
ES
S A
S
www.nordforsk.org