bibliometric analysis of thermodynamic research: a science - intech
TRANSCRIPT

Chapter 21
© 2012 Fu and Ho, licensee InTech. This is an open access chapter distributed under the terms of the Creative Commons Attribution License (http://creativecommons.org/licenses/by/3.0), which permits unrestricted use, distribution, and reproduction in any medium, provided the original work is properly cited.
Bibliometric Analysis of Thermodynamic Research: A Science Citation Index Expanded-Based Analysis
Hui-Zhen Fu and Yuh-Shan Ho
Additional information is available at the end of the chapter
http://dx.doi.org/10.5772/48360
1. Introduction
Thermodynamics is the study of energy and its transformation (Holman, 1985). This subject has evolved since the beginning of the eighteenth century (Look & Saucer, 1982). Most studies of thermodynamics are primarily concerned with two forms of energy: heat and work (Holman, 1985; Keizer, 1985; Rosakis et al., 2000). Thermodynamics advanced dramatically in the 1960s and 1970s, primarily in the area of critical phenomena (Callen, 1985). In recent years, thermodynamic research has been conducted in more systems, such as corn-ethanol biofuel cycle (Patzek, 2004), lipid-peptide interactions (Seelig, 2004), DNA structural motifs (SantaLucia & Hicks, 2004), and glass-forming substances (Ngai, 2000).
Bibliometrics, as a measure of scientific performance, has been widely applied to research evaluation for a long period (Saracevi & Perk, 1973; Luukkonen, 1990; Friedberg, 2000). It has been employed to evaluate various researches, for example biology (Sainte-Marie 2010), desalination research (Tanaka & Ho, 2011), solid waste research (Fu et al., 2010), acupuncture research (Han & Ho, 2011), and global climate change (Li et al., 2011). In exited bibliometric analyses, the analyzed aspects usually covering languages (Alfaraz & Calvino, 2004; Chiu & Ho, 2007; Ferrara, 2011), annual publication outputs (Chiu & Ho, 2007; Tsay, 2008), journals (Schubert et al., 1989; Tsay, 2008), categories (Moed et al., 1995; Yamazaki, 1994), and contributing countries and institutions (Schubert et al., 1989; Chiu & Ho, 2007; Tanaka & Ho, 2011; Li et al., 2011). In recent years, author keywords which could provide a reasonably detailed picture of the article’s subject (Garfield, 1990), have been quantitatively analyzed to figure out the research emphases and trends (Chiu & Ho, 2007; Fu et al., 2010; Li

Thermodynamics – Fundamentals and Its Application in Science 520
et al., 2011). To analyze these aspects, the common evaluation indicators number of publications and their publication share were utilized (Schubert et al., 1989; Rehn et al., 2007). Impact factor was introduced by Garfield and Sher (1963) to help select additional source journals using the recent citations received from other journals, and has been also widely used to rank and evaluate journals (Garfield, 1996; Moed, 2002). In particular, the five indicators including total, independent, collaborative, first author, and corresponding author articles have been recently used to compare the publication performance of countries and institutions in the researched of Japanese lung cancer (Ho et al., 2010), solid waste research (Fu et al., 2010), desalination research (Tanaka & Ho, 2011), acupuncture research (Han & Ho, 2011), global climate change (Li et al., 2011), and estuary pollution (Sun et al., 2012). In addition, rankings are useful indicators, especially in terms of institutions and researchers in urgent demand by politics (Weingart, 2003). These indicators including number of publication, publication share, impact factor, rankings, and five newly indicators were utilized for the evaluation of thermodynamics research.
The aim of this study was to systematically evaluate not only the publication characteristics of languages, annual publication outputs, journals and Web of Science categories, and national and inter-institutional contributors, but also the research emphases and trends by author keywords to obtain an overview of thermodynamic research during the period from 1991 to 2010.
2. Methodology
2.1. Data collection
Documents used in this study were derived from the Science Citation Index Expanded (SCI-Expanded) database of the Web of Science, the Thomson Reuters. According to Journal Citation Reports (JCR), it indexes 8,073 journals with citation references across 174 scientific disciplines in 2010. The data was collected on November 20 in 2011, and the detail data collection process is illustrated in Fig. 1. Firstly, thermodynamics related keywords including “thermodynamic”, “thermodynamics”, “free energy change”, “enthalpy change”, and “entropy change” were searched in terms of topic (including four parts: title, abstract, author keywords, and KeyWords Plus) within the publication year limitation from 1991 to 2010 based on SCI-Expanded. Total 157,140 documents were therefore found out. However, these 157,140 documents contained the documents not closely relating to thermodynamics which was searched only in terms of KeyWords Plus which providing search terms extracted from the titles of papers cited in each new article listed in Current Contents (Garfield, 1990). To efficiently obtain the characteristics of thermodynamics, this study only focused on the documents (50,865) with searching keywords in front page which including three parts: title, abstract, and author keywords, while the documents where searching keywords only appeared in KeyWords Plus were excluded. These documents consists of 19 document types, where articles (41,245) dominants with a percentage of 81%, followed by proceedings paper (4,860; 10%), meeting abstract (1,787; 3.5%), and review (1,407; 2.8%).

Bibliometric Analysis of Thermodynamic Research: A Science Citation Index Expanded-Based Analysis 521
Finally, the journal articles (41,245) were extracted from the 50,865 documents for subsequent analyses.
Figure 1. Data collection process for searching thermodynamic related research
2.2. Analyzing structure
The analyzing aspects were divided into five sections from different angles. To be specific, the analytic structure of analytic structure of bibliometric analysis of thermodynamic research is presented in Fig. 2. The first section dealt with the basic information covering the distribution of languages and annual production. The second section revealed the performance of productive journals and Web of Science categories. Then national contributors countries and institutional contributors institutions were analyzed in the following third and fourth sections. Finally, recent research emphases and trends were examined by the frequency of author keywords.
Figure 2. Analytic structure of bibliometric analysis of thermodynamic research
Web of Science SCI-Expanded
Topic = “thermodynamic” or “thermodynamics” or “free energy change” or “enthalpy change” or “entropy change” Lemmatization = off Year published = 1991-2010
157140 documents
“thermodynamic”, “thermodynamics”, “free energy change”, “enthalpy change”, and “entropy change” in front page (title, abstract, and author keywords)
50865 documents Document type = article
41245 articles

Thermodynamics – Fundamentals and Its Application in Science 522
2.3. Indicators and acronyms
The indicators displayed in Fig. 2 for detail analysis are explained in Table 1. As for the section of national and institutional contributors, some newly indicators (CP, SP, FP, and RP) were employed to evaluate the performance of countries/territories and institutions. The institutions’ and countries/territories’ contributions were identified by the appearance of at least one author in the publications. Collaboration type was determined by the addresses of the authors. The articles were classified by four types for country/territory and institution. (1) The term “single country article” was assigned if the researchers’ addresses were from the same country. The term “single institution article” was assigned if the researchers’ addresses were from the same institution. (2) The term “internationally collaborative article” was designated to those articles that were coauthored by researchers from multiple countries. The term “inter-institutionally collaborative article” was assigned if authors were from different institution. (3) The term “first author article” was assigned if the first author was from the country/territory or institution for analysis. (4) The term “corresponding author article” was assigned if the corresponding author was from the country/territory or institution for analysis. In addition, the acronyms used in the following analysis were listed in Table 2.
Abbreviation IndicatorsTP Number of scientific publications by the analyzed unit (document type,
language, year, journal, Web of Science category, country/territory, institution, or author keyword)
% Number of papers of an actor (document type, language, journal, country/territory, institution, or author keyword) as a share of the total number of articles
%C Number of articles of “internationally collaborative articles” or “inter-institutionally collaborative articles” as a share of the number of articles of an actor (country/territory or institution)
IF Impact factor reported in Journal Citation Reports 2010SP Number of “single country articles” or “single institution articles” CP Number of “internationally collaborative articles” or “inter-institutionally
collaborative articles”FP Number of “first author articles”RP Number of “corresponding author articles”R Rankings of number of articles (TP, SP, CP, RP, or FP) by countries or
institutions
Table 1. Explanation of the abbreviations used in subsequent analysis
3. Results and discussion
3.1. Language and publication outputs
There are 41,245 articles with 17 languages used. English which had 38,976 articles (94%) is the most frequently used language in thermodynamic research. The other languages used in more than 100 articles were Russian (863), Chinese (156), French (151), Japanese (147), and

Bibliometric Analysis of Thermodynamic Research: A Science Citation Index Expanded-Based Analysis 523
Full Name Acronyms
Canada, France, Germany, Italy, Japan, Russia, the UK, and the USA G8 Canada, France, Germany, Italy, Japan, the UK, and the USA G7 Chinese Academy of Sciences CAS Russian Academy of Sciences RAS Central South University CSU Naval University of Engineering NUE calculation of phase diagram CALPHAD
Table 2. Introduction of the acronyms used in subsequent analysis
German (146). Some other languages that were less used were as follows: Spanish, Portuguese, Polish, Czech, Korean, Ukrainian, Croatian, Hungarian, Slovak, Serbo-Croatian, and Romanian. The high proportion of English also appears in other research areas, such as 94% of desalination research (Tanaka & Ho, 2011), and 93% in acupuncture research (Han & Ho, 2011). Non-English language publications considerably dilute the the measured impact of published articles (van Raan, 2005).
Figure 3. The growth trend of articles in thermodynamic research

Thermodynamics – Fundamentals and Its Application in Science 524
Journal TP (%) IF Web of Science category (rankings by IF) Russian Journal of Physical Chemistry A
827 (2.0) 0.503 physical chemistry (114/127)
Journal of Alloys and Compounds
768 (1.9) 2.134 physical chemistry (63/127); multidisciplinary materials science (50/225); metallurgy & metallurgical engineering (5/76)
Physical Review B 741 (1.8) 3.774 condensed matter physics (13/68) Journal of Chemical Physics
716 (1.7) 2.920 atomic, molecular & chemical physics (7/33)
Journal of Chemical Thermodynamics
697 (1.7) 2.794 thermodynamics (3/51); physical chemistry (46/127)
Thermochimica Acta 652 (1.6) 1.899 analytical chemistry (33/73); physical chemistry (71/127)
Biochemistry 601 (1.5) 3.226 biochemistry & molecular biology (120/286)
Journal of Physical Chemistry B
584 (1.4) 3.603 physical chemistry (32/127)
Fluid Phase Equilibria 483 (1.2) 2.253 thermodynamics (5/51); physical chemistry (61/127); chemical engineering (24/135)
CALPHAD-Computer Coupling of Phase Diagrams and Thermochemistry
450 (1.1) 1.429 thermodynamics (16/51); physical chemistry (81/127)
Physical Review E 444 (1.1) 2.352 fluids & plasmas physics (8/31); mathematical physics (4/54)
Journal of Colloid and Interface Science
411 (1.0) 3.066 physical chemistry (40/127)
Journal of Chemical and Engineering Data
400 (1.0) 2.089 multidisciplinary chemistry (44/147); chemical engineering (28/135)
Surface Science 382 (0.93) 2.010 physical chemistry (69/127); condensed matter physics (19/68)
Journal of Solution Chemistry
360 (0.87) 1.335 physical chemistry (85/127)
Journal of Molecular Biology
339 (0.82) 4.008 biochemistry & molecular biology (86/286)
Journal of the American Chemical Society
317 (0.77) 9.019 multidisciplinary chemistry (11/147)
Physical Review D 278 (0.67) 4.964 astronomy & astrophysics (8/55); particles & fields physics (5/27)
Physical Review Letters 262 (0.64) 7.621 multidisciplinary physics (5/80)

Bibliometric Analysis of Thermodynamic Research: A Science Citation Index Expanded-Based Analysis 525
Journal TP (%) IF Web of Science category (rankings by IF) Langmuir 242 (0.59) 4.268 multidisciplinary chemistry (24/147);
physical chemistry (29/127); multidisciplinary materials science (26/225)
Table 3. Characteristics of top 20 journals with the most articles in thermodynamics
The thermodynamic research revealed a growth trend through the study period, especially in recent years. The number of articles has been climbing up from 1991 to 2010 in Fig. 3. According to the annual growth rate, it can be divided into two stages: 1991-2003 and 2004-2010. In the first stage, the growth rate was 48 articles per year from 1,412 in 1991 to 1,988 in 2003, while in the second stage the growth rate has risen four-fold to 203 articles per year from 2,169 in 2004 to 3,410 in 2010.
3.2. Journals and Web of Science categories
3.2.1. Journals
The total articles (41,245) were published in 2,434 sources among 150 Web of Science categories. Table 3 lists the top 20 journals with the greatest number of articles. The impact factors of these journals were also exhibited as reputation of a journal attached much attention by the authors and editors (van Raan, 2001). Approximately 24% of the articles resided in these 20 journals. Russian Journal of Physical Chemistry A (IF = 0.523) which was founded in 1930, published the most articles (827; 2.0%). Its former was Zhurnal fizicheskoi khimii (1930-1999) and Russian Journal of Physical Chemistry (1999-2006). Articles published in this journal concern chemical thermodynamics and thermochemistry (http://www.maik.ru/cgi-perl/journal.pl?name=physcha&page=main) which is closely related to the topic of this study.
Among the total institutions (1,004) contributing to Russian Journal of Physical Chemistry A, 831 institutions (83%) belonged to Russia while only 173 institutions (17%) belonged to other countries. Following three journals: Journal of Alloys and Compounds (IF = 2.134), Physical Review B (IF = 3.774), and Journal of Chemical Physics (IF = 2.920), all had the more than 700 articles. However, the journal which had the highest IF (9.019) was Journal of the American Chemical Society in the category of multidisciplinary chemistry which was ranked 17th. Physical Review Letters in multidisciplinary physics category was ranked 19th in the list and ranked 2nd in terms of IF (7.621). Furthermore, of these 2,434 sources, 1,828 (75%) sources only contained less than 10 articles; 519 (21%) sources contained 11-100 articles, 60 (2.5%) sources contained 101-200 articles; 20 (0.82%) sources contained 201-600 articles; and seven sources (0.28%) contained more than 600 articles, accounting for 11 percent of the total articles. The trends of the annual publication outputs of the top core seven journals are displayed in Fig. 4. The curves of these seven journals (Russian Journal of Physical Chemistry A, Journal of Alloys and Compounds, Physical Review B, Journal of Chemical Physics, Journal of Chemical Thermodynamics, and Thermochimica Acta Biochemistry) had been interlacing in the study period. However, after 2008, Journal of Alloys and Compounds which published 108 articles in 2009 and 70 articles in 2010 showed its domination in the thermodynamic field.

Thermodynamics – Fundamentals and Its Application in Science 526
Figure 4. The trends of top seven journals with more than 600 articles
3.2.2. Web of Science categories
As for category analysis, excluding the 84 articles without subject category information, the remained 41,161 articles were analyzed. The most common category was physical chemistry (10,295; 25%), followed distantly by other categories. A half of the above top 20 journals are assigned to the category of physical chemistry. Within the total 150 Web of Science categories, 92 categories (61%) published articles less than 100 articles; 40 categories (27%) published 101-1000 articles; 12 categories (8.0%) published 1,001-3,000 articles; only six categories (4.0%) published more than 3,000 articles. The six core categories including physical chemistry, multidisciplinary materials science, multidisciplinary chemistry, metallurgy & metallurgical engineering, chemical engineering, and biochemistry & molecular biology, took the majority of the total articles with a great percentage of 55%. As illustrated in Fig. 5, these categories showed greater growth rates in recent years than those in 1990s. These trends were similar to the above trends of annual total publication outputs. The articles of position 1st category of physical chemistry which contained 127 journals increased from 390 in 1991 to 777 in 2010. The 2nd position category of multidisciplinary materials science which included 225 journals increased six-fold from 70 in 1991 to 423 in 2010.

Bibliometric Analysis of Thermodynamic Research: A Science Citation Index Expanded-Based Analysis 527
Figure 5. The trends of top seven Web of Science categories with more than 3000 articles
3.3. National contributors
3.3.1. Global geographical distribution
Excluding 263 articles without any author address information on the Web of Science, the 40,982 articles originated from 128 countries. Articles originating from England, Scotland, Northern Ireland, and Wales were reclassified as being from the United Kingdom (UK) (Chiu & Ho, 2005). Articles from Hong Kong were included in the ones from China. The geographical global distribution of thermodynamic research is shown in Fig. 6. According to their production, the 128 countries were divided into five parts. Particularly, 81 countries (63%) belonged to the first part of 1-100 articles; 36 countries (28%) belonged to the second part of 101-1,000 articles; seven countries (Japan, France, India, Italy, UK, Spain, and Canada) belonged to the third part of 1,001-3,000 articles; three countries (China, Russia, and Germany) belonged to the fourth part of 3,001-5,000 articles; and only one country (USA) which totally published 9,161 articles, belonged to the fifth part of 5,001-10,000 articles. Although there were only 11 countries which published more than 1,000 articles, these 11 countries produced 77% articles. The majority of articles originated from a small number of particular countries. Furthermore, five continents contributed to the thermodynamics

Thermodynamics – Fundamentals and Its Application in Science 528
research differently. Europe with 42 countries published the most articles 22,969 (56%); Asia with 42 countries published the second most articles 13,163 (32%); and America with sixteen countries published the third most articles 12,333 (30%). Africa, and Oceania two continents made much less contributions, and the quantity of them were 933 (2.3%), and 667 (1.6%), respectively. It is noticeable that Europe is taking the leading position of thermodynamic research. Asia was seeing a striking increase to catch up with Europe in terms of scientific output (Friedberg, 2000; von Bubnoff, 2005).
Figure 6. Global geographical distribution of thermodynamics research outputs
3.3.2. Characteristics of top 20 countries/territories
With respect to international collaboration, 33,234 (81%) were independent publications and 7,748 (19%) were internationally collaborative publications. The collaboration rate was a little greater than that of other areas, such as 14% biosorption technology for water treatment (Ho, 2008), 16% of desalination research (Tanaka & Ho, 2011), 16% of solid waste research (Fu et al., 2010), and 14% of acupuncture research (Han & Ho, 2011). Table 4 shows the characteristics of the top 20 productive countries. The eight major industrialized countries G8, ranked in the top 11 in Table 4, had 59% over the investigation period. Similarly, the seven major industrialized countries G7 the USA, Germany, the UK, Japan, France, Canada, and Italy accounted for a significant proportion exited in many researches (Li et al., 2009; He, 2009; Fu et al., 2010; Wang et al., 2010). The USA dominated, ranking 1st in independent and collaborative articles, as well as first author and corresponding author articles. Total 1,421 contributing institutions (13%) were affiliated with USA, followed by China (824 institutions, 7.7%), and Russia (792 institutions, 6.5%). The 2nd position China, the 7th position India, and the 19th position Iran had low percentages of collaboration less than 20%. It was not coincident that China emerged as a leading nation in science production (Zhou & Leydesdorff, 2006; Zhou & Leydesdorff, 2008). In most fields, the USA had the quantity (number of papers) lead, although the China has made dramatic strides to overtake the USA, except the biomedical field and some aspects of environmental science (Kostoff, 2008).

Bibliometric Analysis of Thermodynamic Research: A Science Citation Index Expanded-Based Analysis 529
Country IN TP TP R (%) SP R (%) CP R (%) FP R (%) RP R (%) %C USA 1,421 9,162 1 (22) 1 (20) 1 (33) 1 (19) 1 (18) 28 China 824 4,652 2 (11) 2 (12) 5 (10) 2 (11) 2 (11) 17 Russia 792 3,792 3 (9.3) 3 (9.1) 6 (10) 3 (8.2) 3 (8.6) 20 Germany 724 3,421 4 (8.3) 6 (5.5) 2 (21) 4 (6.3) 4 (6.2) 47 Japan 580 2,804 5 (6.8) 4 (6.3) 7 (9.0) 5 (5.8) 5 (5.8) 25 France 792 2,515 6 (6.1) 7 (4.1) 3 (15) 7 (4.6) 7 (4.5) 46 India 652 2,201 7 (5.4) 5 (5.7) 15 (3.8) 6 (5.1) 6 (5.0) 13 Italy 390 1,858 8 (4.5) 8 (3.6) 8 (8.6) 8 (3.8) 8 (3.8) 36 UK 315 1,797 9 (4.4) 9 (2.5) 4 (12) 9 (3.0) 9 (2.9) 53 Spain 210 1,487 10 (3.6) 11 (2.5) 9 (8.4) 10 (2.9) 10 (2.8) 44 Canada 192 1,446 11 (3.5) 10 (2.5) 10 (7.8) 11 (2.7) 11 (2.6) 42 Poland 171 934 12 (2.3) 12 (1.6) 11 (5.1) 12 (1.7) 12 (1.7) 42 Netherlands 145 741 13 (1.8) 18 (1.1) 13 (4.7) 17 (1.3) 19 (1.2) 50 Brazil 196 733 14 (1.8) 14 (1.5) 19 (3.1) 13 (1.5) 13 (1.5) 33 Ukraine 229 720 15 (1.8) 15 (1.4) 18 (3.1) 14 (1.4) 14 (1.4) 34 Switzerland 111 690 16 (1.7) 21 (0.93) 12 (4.9) 19 (1.2) 18 (1.2) 55 Sweden 106 645 17 (1.6) 19 (1.1) 16 (3.5) 20 (1.2) 20 (1.1) 42 South Korea 176 632 18 (1.5) 17 (1.3) 22 (2.5) 16 (1.3) 16 (1.4) 31 Iran 173 587 19 (1.4) 13 (1.5) 32 (1.0) 15 (1.4) 15 (1.4) 14 Australia 106 566 20 (1.4) 23 (0.79) 14 (3.9) 21 (1.0) 21 (1.0) 54
IN: Number of institutions.
Table 4. Characteristics of the top 20 productive countries/territories
Besides, the 9th position UK, the 13th position Netherlands, the 16th position Switzerland, and the 20th position Australia had high cooperation rates no less than 50%. It was also reported that international collaboration in both within and outside the European Communities played an increasing role for European scientific literature (Narin et al., 1991; Glänzel, 1999). South Korea and Iran had higher rankings in terms of FP and RP than that of TP, while Netherlands and Sweden had lower rankings in terms of FP and RP. Moreover, from the above languages analysis, except English, the popular languages (Russian, Chinese, French, Japanese, and German) were just the mother tongue of the top five countries China, Russia, Germany, Japan, and France except the USA. The excellent performance of these countries was consistent with the results of language analysis.
3.3.3. Comparison of top six countries
The comparison of top six countries with the most articles in 2010 is illustrated in Fig. 7. The USA hold the trump card based on the total number of articles in the study period, but did not have the highest growth rate. China which was ranked 1st according to the 2010 production had the highest growth rate of 32 articles per year, and surpassed the USA in 2009, following distantly by other countries. USA, India, and Russia had the lower growth

Thermodynamics – Fundamentals and Its Application in Science 530
rate of 10 - 13 articles per year. The following Germany and France had the growth rate of 6.3 and 5.9 articles per year. Particularly, Russia experienced a sharply increase in the first three year from 6 articles in 1991 to 174 articles in 1993, may due to its large fund for recovery of the politic reason (Goodman, 1993; Webb, 1994). The Russian annual output grew from 1980 to 1990, but fell after the dissolution of the USSR in late 1991; from 1994 there has been an inconsistent partial recovery, and by 2000 the annual output had approximately regained its 1980 value (Wilson & Markusova, 2004). It seems that the recovery time of Russian thermodynamic research was shorter.
Figure 7. Trends of top six countries with most articles in 2010
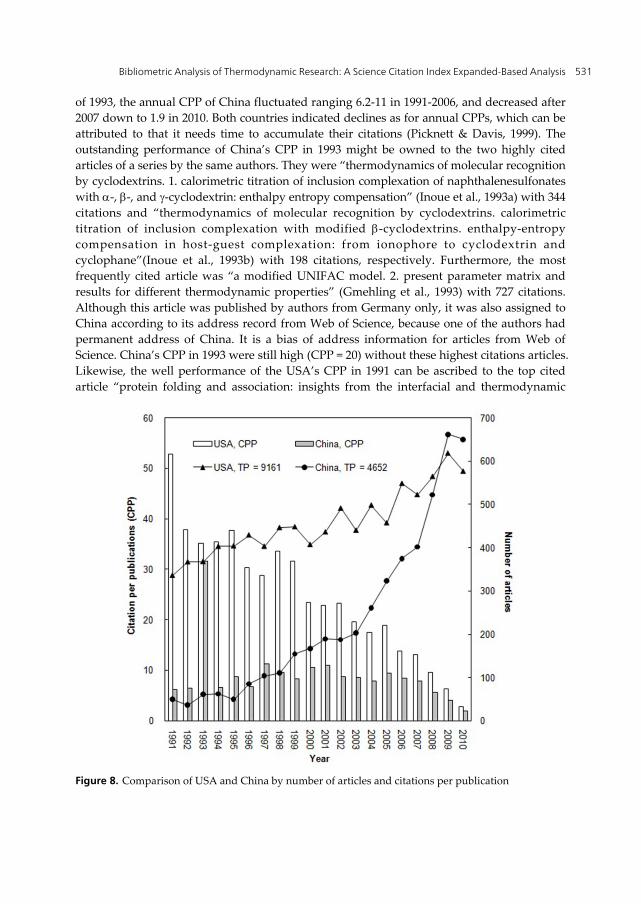
3.3.4. Comparison of China and USA
In order to compare the most productive country in 1991-2010, the USA and the most active country in 2010, China, annual number of articles and citations per publication (CPP) of both were presented in Fig. 8. Total citations were collected on November 20 in 2011 from web of Science. From the above analysis, China experienced a high grow rate and got ahead of the USA in 2009 and kept on top in 2010. However, in terms of CPP, the mean number of China was 7.1 which was much less than that of the USA (23). The annual CPP of the USA showed a declined trend in 1991-2010, ranging from 53 in 1991 to 2.8 in 2010. Except the year
Bibliometric Analysis of Thermodynamic Research: A Science Citation Index Expanded-Based Analysis 531
of 1993, the annual CPP of China fluctuated ranging 6.2-11 in 1991-2006, and decreased after 2007 down to 1.9 in 2010. Both countries indicated declines as for annual CPPs, which can be attributed to that it needs time to accumulate their citations (Picknett & Davis, 1999). The outstanding performance of China’s CPP in 1993 might be owned to the two highly cited articles of a series by the same authors. They were “thermodynamics of molecular recognition by cyclodextrins. 1. calorimetric titration of inclusion complexation of naphthalenesulfonates with -, -, and -cyclodextrin: enthalpy entropy compensation” (Inoue et al., 1993a) with 344 citations and “thermodynamics of molecular recognition by cyclodextrins. calorimetric titration of inclusion complexation with modified -cyclodextrins. enthalpy-entropy compensation in host-guest complexation: from ionophore to cyclodextrin and cyclophane”(Inoue et al., 1993b) with 198 citations, respectively. Furthermore, the most frequently cited article was “a modified UNIFAC model. 2. present parameter matrix and results for different thermodynamic properties” (Gmehling et al., 1993) with 727 citations. Although this article was published by authors from Germany only, it was also assigned to China according to its address record from Web of Science, because one of the authors had permanent address of China. It is a bias of address information for articles from Web of Science. China’s CPP in 1993 were still high (CPP = 20) without these highest citations articles. Likewise, the well performance of the USA’s CPP in 1991 can be ascribed to the top cited article “protein folding and association: insights from the interfacial and thermodynamic
Figure 8. Comparison of USA and China by number of articles and citations per publication

Thermodynamics – Fundamentals and Its Application in Science 532
properties of hydrocarbons” which was published in 1991 (Nicholls et al., 1991) and received 4,999 citations. Most scientific publications from China have a lower citation impact than the world average and have a lower citation rate than expected (Glänzel et al., 2002). It is suggested that China’s science needs to move from the “quantitative expansion” phase in nowadays to a “rising quality” phase (Jin & Rousseau, 2005). In general, China showed a high growth rate in recent years and dominant now in annual production, but still needs to make efforts on increasing their citations in thermodynamics.
3.4. Institutional contributors
3.4.1. Characteristics of top 20 institutions
After examining the national contributors, the characteristics of institutional contributors institutions were identified. Of 40,982 articles from 10,696 institutions in 128 countries, 16,628 (41%) were inter-institutionally collaborative publications, and 24,354 (59%) were independent publications. The percentage of collaboration among institutions was much higher than that among countries (19%). The inter-institutional collaboration rate was usually greater than international collaboration rates (Fu et al., 2010; Han & Ho, 2011; Li et al., 2011; Tanaka &Ho, 2011). The number of articles of institutions was smaller than the country, and it was reported that the collaboration was more likely to happen when the size of actors was small (Narin et al., 1991). Nevertheless, the inter-institutional collaboration rate (41%) of thermodynamic research was observed to be lower than that of many other fields, such as 62% of global climate change (Li et al., 2011), 53% in atmospheric simulation (Li et al., 2009), 44% in solid waste research (Fu et al., 2010), and 53% of acupuncture research (Han &Ho, 2011). Four institutions in the USA and Japan, three in China, two each in Russia, and one each in Sweden, Ukraine, UK, India, France, and Italy were ranked in the top 20 productive institutions (16%) as shown in Table 5. It is worth noting that the Russian Academy of Sciences ranked 1st and Chinese Academy of Sciences ranked 2nd are both integrated research centers and made up of many relatively independent institutions distributed throughout their country. At present, the publications of these institutions were pooled as one heading, and publications divided into branches would result in different rankings. A bias appeared because national research institutions might have many branches in different cities, for example the CAS (Li et al., 2009), the RAS (Li et al., 2009), and Indian Institute of Technology (Tanaka & Ho, 2011). RAS founded the most productive thermodynamic journal of Russian Journal of Physical Chemistry A. In particular, 228 articles (28%) were contributed by RAS, and 117 articles (14%) were contributed by Moscow Lomonosov State University in Russia based on the total articles (817 articles with author information) of Russian Journal of Physical Chemistry A during 1991-2010. With the exception of these two institutions, the most productive institution is Moscow Lomonosov State University in Russia (425; 1.0%), followed by Tohoku University in Japan (335; 0.82%), and Centre National de la Recherche Scientifique in France (313; 0.76%). However, a bias would appear in the analysis of institutions which was used by different names in their publications. It is strongly recommended that an “international identity number” for all institutions when authors published their paper with an institution as affiliation in a Web of Science-listed journal (Chiu &Ho, 2007).

Bibliometric Analysis of Thermodynamic Research: A Science Citation Index Expanded-Based Analysis 533
Institution TP TP R (%)
SP R (%)
CP R (%)
FP R (%)
RP R (%)
%C
Russian Academy of Sciences, Russia 1,604 1 (3.9) 1 (3.7) 1 (4.2) 1 (3.0) 1 (3.1) 43 Chinese Academy of Sciences, China 720 2 (1.8) 3 (0.92) 2 (3.0) 2 (1.1) 2 (1.1) 69 Moscow Lomonosov State University, Russia
425 3 (1.0) 2 (0.93) 5 (1.2) 3 (0.75) 3 (0.80) 47
Tohoku University, Japan 335 4 (0.82) 10 (0.52) 4 (1.3) 8 (0.46) 7 (0.45) 62 Centre National de la Recherche Scientifique, France
313 5 (0.76) 23 (0.34) 3 (1.4) 11 (0.41) 13 (0.39) 73
University of Tokyo, Japan 280 6 (0.68) 6 (0.57) 11 (0.84) 6 (0.46) 6 (0.45) 50 University of Science and Technology Beijing, China
265 7 (0.65) 9 (0.53) 14 (0.82) 5 (0.47) 5 (0.48) 52
Royal Institute of Technology, Sweden 261 8 (0.64) 14 (0.45) 7 (0.91) 12 (0.41) 11 (0.40) 58 Pennsylvania State University, USA 256 9 (0.62) 5 (0.58) 19 (0.69) 9 (0.45) 10 (0.43) 45 Central South University, China 247 10 (0.60) 11 (0.51) 18 (0.74) 4 (0.50) 4 (0.52) 50 University of Wisconsin-Madison, USA 245 11 (0.60) 14 (0.45) 15 (0.81) 14 (0.41) 18 (0.37) 55 Indian Institute of Technology, India 242 12 (0.59) 4 (0.67) 42 (0.48) 6 (0.46) 8 (0.44) 33 University of California, USA 241 13 (0.59) 18 (0.39) 8 (0.88) 16 (0.39) 22 (0.33) 61 Osaka University, Japan 240 14 (0.59) 16 (0.41) 11 (0.84) 17 (0.37) 15 (0.38) 58 Massachusetts Institute of Technology, USA
222 15 (0.54) 8 (0.55) 35 (0.53) 10 (0.42) 11 (0.40) 40
University of Cambridge, UK 220 16 (0.54) 29 (0.30) 8 (0.88) 22 (0.34) 24 (0.33) 66 Polish Academy of Sciences, Poland 219 17 (0.53) 24 (0.33) 13 (0.83) 22 (0.34) 21 (0.35) 63 National Research Council, Italy 208 18 (0.51) 166
(0.11) 6 (1.1) 52 (0.20) 58 (0.19) 87
National Academy of Sciences of Ukraine, Ukraine
201 19 (0.49) 7 (0.57) 80 (0.37) 12 (0.41) 9 (0.43) 31
Kyoto University, Japan 200 20 (0.49) 18 (0.39) 27 (0.63) 18 (0.36) 17 (0.37) 53
Table 5. Characteristics of the top 20 productive institutions.
More independent institutions might lead to more first author articles and corresponding author articles or vice versa. Some institutions which had low collaboration rates no more than 40% usually had a higher rank in FP and RP. For example, the 12th place Indian Institute of Technology in India with the low collaboration rate of 33% ranked 6th in FP and 8th in RP; the 15th position Massachusetts Institute of Technology in USA with the low collaboration rate of 40% ranked 10th in FP and 11th in RP; the 19th position National Academy of Sciences of Ukraine in Ukraine with the low collaboration rate of 31% ranked 12th in FP and 9th in RP. On the other hand, some institutions which had high collaboration rates more than 70% were ranked lower in the rankings of FP and RP. For example, the 5th position Centre National de la Recherche Scientifique in France with the high collaboration rate of 73% ranked 11th in FP and 13th in RP; the 18th position National Research Council in Italy with the high collaboration rate of 87% ranked 52th in FP and 58th in RP.

Thermodynamics – Fundamentals and Its Application in Science 534
3.4.2. Comparison of top seven institutions
To identify the growth trends of active institutions in recent years, the trends of top seven productive institutions with most articles in 2010 are shown in Fig. 9. The most productive institution - RAS had an overwhelming majority in the total articles, and CAS was just down by three articles in 2010, following distantly by the other institutions. CAS as the China’s highest academic institution in natural sciences played an active role in terms of scientific outputs in recent years as the exponentially growth scientific production in China (Li et al., 2009; Fu et al., 2010; Tanaka &Ho, 2011; Fu et al., 2011; Li et al., 2011).
Figure 9. Trends of top seven institutions with most articles in 2010
Although three universities in China including Central South University, Naval University of Engineering, and SiChuan University just ranked 10th, 39th, and 43rd of total articles from 1991 to 2010, but they had high rankings (3rd, 4th, and 7th) with respect to the number of articles in 2010. The growth rates of the top institutions differed from each other. Particularly, based on the last decade (2001-2010), CAS showed the highest growth rate of 7.2 articles per year; CSU and NUE showed the growth rate of 4 – 5 articles per year. The other four institutions, RAS, Moscow Lomonosov State University, University of Science and Technology Beijing, and SiChuan University showed the growth rate of 1 – 2 articles

Bibliometric Analysis of Thermodynamic Research: A Science Citation Index Expanded-Based Analysis 535
per year. About 14% percent articles in RAS were published in Russian Journal of Physical Chemistry A which was founded by RAS. It was interesting that the top three institutions (CAS, CSU, and NUE) with the greatest growth rates were all in China. CSU was established in 2000 by merging three separate universities: Hunan Medical University, Changsha Railway University, and Central South University of technology, and was involved in “985 Project” and “211 Project” which were supported by Chinese government to promote the development and reputation of the Chinese higher education system (http://iecd.csu.edu.cn/en-US/ColumnS.aspx?cid=12). Moreover, CSU hold one SCI journal named Transactions of Nonferrous Metals Society of China which published 11% thermodynamic related articles of CSU in the study period. Another institution, NUE ranks as a military university of higher learning subjected to the leadership of the Central Military Commission and the Party Committee of the PLA Navy, and is listed as one of the five comprehensive universities in the armed forces and the army “2110 project” that enjoys the priority in development. It falls into the category of key national university specializing in engineering (http://english.chinamil.com.cn/site2/special-reports/2007-06/21/content_853791.htm).
3.5. Research emphases and trends
Bibliometric analysis of author keywords has been only observed in recent years (Chiu &Ho, 2007; Wang et al., 2010; Li et al., 2011). It tried to find the research emphases and trends by quantitatively analyzing the frequency of author keywords. Excluding some articles without author keywords information, 23,458 articles (57%) with records of author keywords in the SCI-Expanded database were analyzed. There were 45,182 author keywords listed by authors, 43,930 (97%) keywords were used no more than ten times, which indicated that thermodynamic research involved diverse scientific literature and a wide disparity in research focuses (Chuang et al., 2007). Only 74 (0.16%) author keywords were used no less than 100 times, suggesting that the mainstream research in thermodynamics was considered to focus on a small field. Four five-year intervals (1991-1995, 1996-2000, 2001-2005, and 2006-2010) were employed to obtain the trends of these author keywords as well as minimize the year-to-year fluctuations. The top 30 author keywords (accounting for 37% of the total articles) in the latest interval 2006-2010 are listed in Table 6.
Except the author keywords “thermodynamics”, “thermodynamic properties”, “thermodynamic parameters”, and “thermodynamic” related to searching keywords, the three most frequently used author keywords were “kinetics” (883; 3.8%), “adsorption” (736; 3.1%), and “phase diagram” (545; 2.3%). “Thermodynamics” and “kinetics” were related to one another in ways, and were both commonly used to describe process (Kocks et al., 1975; Astumian, 1997; Ho & Ofomaja, 2005). “Adsorption” was a widely applied process, for example in environmental science (Wang et al., 2010; Wang et al., 2011; Chuang et al., 2011). The term “phase diagram” is a type of chart used to obtaining thermodynamic data at equilibrium (Kleppa, 1952; Svirbely, 1954).

Thermodynamics – Fundamentals and Its Application in Science 536
Author keywords TP 1991-2010 R (%)
1991-1995 R (%)
1996-2000 R (%)
2001-2005 R (%)
2006-2010 R (%)
thermodynamics 5,943 1 (25) 1 (31) 1 (25) 1 (23) 1 (25) thermodynamic properties
1,577 2 (6.7) 2 (5.5) 2 (8.4) 2 (5.9) 2 (6.7)
kinetics 883 3 (3.8) 6 (2.5) 8 (2.2) 3 (3.6) 3 (4.8) adsorption 736 5 (3.1) 11 (1.5) 10 (1.9) 6 (2.5) 4 (4.4) thermodynamic parameters
778 4 (3.3) 3 (2.6) 3 (3.5) 4 (3.2) 5 (3.5)
thermodynamic 503 9 (2.1) 26 (1.0) 15 (1.3) 10 (2.1) 6 (2.7) phase diagram 545 7 (2.3) 21 (1.2) 6 (2.3) 9 (2.1) 7 (2.7) entropy 548 6 (2.3) 8 (2.0) 7 (2.2) 7 (2.5) 8 (2.4) thermodynamic modeling
338 13 (1.4) 165 (0.27) 56 (0.50) 16 (1.3) 9 (2.2)
thermodynamic analysis
385 11 (1.6) 12 (1.5) 14 (1.7) 12 (1.3) 10 (1.8)
heat capacity 533 8 (2.3) 3 (2.6) 5 (2.7) 5 (2.8) 11 (1.7) calorimetry 503 9 (2.1) 5 (2.5) 4 (3.0) 8 (2.2) 12 (1.7) phase diagrams 260 17 (1.1) 26 (1.0) 31 (0.68) 25 (0.83) 13 (1.5) CALPHAD 186 25 (0.79) N/A 782 (0.068) 35 (0.66) 14 (1.3) solubility 325 14 (1.4) 10 (2.0) 16 (1.3) 13 (1.3) 14 (1.3) enthalpy 373 12 (1.6) 8 (2.0) 9 (1.9) 11 (1.7) 16 (1.3) thermodynamic property
212 20 (0.90) 59 (0.59) 64 (0.45) 25 (0.83) 17 (1.2)
density functional theory
158 36 (0.67) 1288 (0.045) 415 (0.11) 56 (0.53) 18 (1.1)
isothermal titration calorimetry
177 28 (0.75) 1288 (0.045) 108 (0.34) 31 (0.70) 19 (1.1)
thermodynamic stability
265 16 (1.1) 38 (0.77) 16 (1.3) 13 (1.3) 20 (1.0)
isotherm 120 60 (0.51) 1288 (0.045) 565 (0.09) 231 (0.18) 21 (1.0) equation of state 316 15 (1.3) 7 (2.4) 13 (1.7) 13 (1.3) 21 (1.0) density 178 27 (0.76) 29 (1.0) 41 (0.59) 60 (0.51) 23 (0.94) molecular dynamics 172 29 (0.73) 165 (0.27) 31 (0.68) 47 (0.61) 24 (0.93) free energy 163 33 (0.69) 165 (0.27) 52 (0.52) 51 (0.59) 25 (0.92) phase equilibria 228 19 (1.0) 32 (0.86) 25 (0.83) 18 (1.2) 26 (0.91) biosorption 101 72 (0.43) N/A N/A 431 (0.11) 27 (0.89) AB initio calculations
121 59 (0.52) N/A 170 (0.25) 147 (0.26) 27 (0.89)
phase transition 158 36 (0.67) 52 (0.64) 58 (0.47) 60 (0.51) 29 (0.86) nonequilibrium thermodynamics
190 24 (0.81) 23 (1.1) 27 (0.81) 39 (0.64) 30 (0.85)
N/A: Not Available
Table 6. The most frequently used 30 author keywords in 2006-2010

Bibliometric Analysis of Thermodynamic Research: A Science Citation Index Expanded-Based Analysis 537
In particular, there were also some emerging hotspots in thermodynamics recently. Some author keywords including the 3rd “adsorption”, the 9th “thermodynamic modeling”, the 14th “CALPHAD”, the 17th “thermodynamic property”, the 18th “density functional theory”, the 19th “isothermal titration calorimetry”, the 20th “thermodynamic stability”, the 21st “isotherm”, the 25th “free energy”, the 27th “biosorption”, and the 28th “AB initio calculations” in the list showed the increasing trends during the study period. It is noticeable that “CALPHAD”, “biosorption”, and “AB initio calculations” increased rapidly from zero articles in 1991-1995 into the top 30 rankings in 2006-2010. “CALPHAD” was firstly used as the author keyword of the article entitled “compilation of ‘CALPHAD’ formation enthalpy data - Binary intermetallic compounds in the COST507 Gibbsian database” in 1998 (Fries & Jantzen, 1998). However, “CALPHAD method” had been used as the author keyword of the article titled “thermodynamic study on the Ag-Sb-Sn system” in 1996 (Oh et al., 1996). The first article which employed “biosorption” as author keyword was titled “determination of the equilibrium, kinetic and thermodynamic parameters of the batch biosorption of nickel(II) ions onto Chlorella vulgaris” in Process Biochemistry in 2002 (Aksu, 2002). “Biosorption” as a process for water treatment received increasing attention in recent years (Ho, 2008). As for “AB initio calculations”, it was originally utilized as author keywords of the article “an AB initio study of structures and energetics of copper sulfide clusters” in 1996 (Dehnen et al., 1996). Similarly, “density functional theory”, “isothermal titration calorimetry”, and “isotherm” grew fast from the 1288th (only one article) in 1991-1995 to 18th, 19th, and 21st in 2006-2010. The article targeting at “density functional theory” could be found in 1994 and it was entitled “density-functional theory as thermodynamics” (Nagy & Parr, 1994). Thermodynamical interpretation of the density functional theory for an electronic ground state was developed (Nagy & Parr, 1994). The following article which utilized “density functional theory” as author keyword was published in 1999. For the phrase “isothermal titration calorimetry”, the article which used it as author keyword appeared in 1995, and it was titled “comparative thermodynamic analyses of the Fv, Fab* and Fab fragments of anti-dansyl mouse monoclonal-antibody” (Shimba, 1995). However, it should be noticed that there was a bias that all these analysis were based on the data (57%) with author keywords information from SCI-Expanded.
4. Conclusion
Except the dominant language English, Russian, Chinese, French, Japanese and German were the most common languages. Above all, the growth process of annual thermodynamic scientific outputs can be divided into two stages, and the annual growth rate of the second stage 2004-2010 was four times of that in the first stage 1991-2003. Secondly, Russian Journal of Physical Chemistry was the most productive journal, and then Journal of Alloys and Compounds and Journal of Chemical Physics. The most common category was found to be physical chemistry. Thirdly, the global geographic distribution discovered that Europe took the leading position, following by Asia, America, Africa and Oceania. In particular, the eight major industrialized countries (G8: Canada, France, Germany, Italy, Japan, Russia, the UK, and USA) played a prominent role with more than a half contribution, especially the USA.

Thermodynamics – Fundamentals and Its Application in Science 538
However, China experienced the greatest growth rate, and surpassed the USA in 2009 in terms of annual production, but needs to enhance its quality of publications. China and India had low collaboration rates while the UK, Netherlands, and Switzerland in Europe with a smaller size had high collaboration rates. In general, the thermodynamic research presented a higher international collaboration rate but a lower inter-institutional collaboration rate in comparison with other fields. Russian Academy of Sciences and Chinese Academy of Sciences took the leading position of institutions, following distantly by Tohoku University in Japan, and Centre National de la Recherche Scientifique in France. It was also revealed that the institutions with lower collaboration rates usually published greater proportion of first author articles and corresponding author articles, and vice versa. Finally, by analyzing the latest most frequently used author keywords, it was concluded that the items “thermodynamic properties”, “kinetics”, “adsorption”, “thermodynamic parameters”, “phase diagram”, and “entropy” are the traditional research hotspots and will continue being the emphases in the foreseeable future. “CALPHAD”, “density functional theory”, “isothermal titration calorimetry”, “isotherm”, “biosorption”, and “AB initio calculations”, as the quickly increasing concernings, are the newly thermodynamic research hotspots.
Author details
Hui-Zhen Fu1, Yuh-Shan Ho1,2,* 1Department of Environmental Sciences, Peking University, People’s Republic of China 2Trend Research Centre, Asia University, Taiwan
5. References
Aksu, Z. (2002). Determination of the equilibrium, kinetic and thermodynamic parameters of the batch biosorption of nickel(II) ions onto Chlorella vulgaris. Process Biochemistry, Vol.38, No.1, (September 2002), pp. 89-99, ISSN 0032-9592
Alfaraz, P.H. & Calvino, A.M. (2004). Bibliometric study on food science and technology: Scientific production in Iberian-American countries (1991-2000). Scientometrics, Vol.61, No.1, pp. 89-102, ISSN 0138-9130
Astumian, R.D. (1997). Thermodynamics and kinetics of a Brownian motor. Science, Vol.276, No.5314, (May 1997), pp.917-922, ISSN 0036-8075
Callen, H.B. (1985). Thermodynamics and an introduction to thermostatistics (2nd Edition), John Wiley & Sons, pp. vii, ISBN 978-0-471-86256-7, USA
Chiu, W.T. & Ho, Y.S. (2005). Bibliometric analysis of homeopathy research during the period of 1991 to 2003. Scientometrics, Vol.63, No.1, (April 2005), pp. 3-23, ISSN 0138-9130
Chiu, W.T. & Ho, Y.S. (2007). Bibliometric analysis of tsunami research. Scientometrics, Vol.73, No.1, (October 2007), pp. 3-17, ISSN 0138-9130
Chuang, K.Y., Huang, Y.L. & Ho, Y.S. (2007). A bibliometric and citation analysis of stroke-related research in Taiwan. Scientometrics, Vol.72, No.2, (August 2007), pp. 201-212, ISSN 0138-9130
* Corresponding Author

Bibliometric Analysis of Thermodynamic Research: A Science Citation Index Expanded-Based Analysis 539
Chuang, K.Y., Wang, M.H. & Ho, Y.S. (2011). High-impact papers presented in the subject category of water resources in the Essential Science Indicators database of the institute for scientific information. Scientometrics, Vol.87, No.3, (June 2011), pp. 551-562, ISSN 0138-9130
Dehnen, S., Schafer, A., Ahlrichs, R. & Fenske, D. (1996). An AB initio study of structures and energetics of copper sulfide clusters. Chemistry-A European Journal, Vol.2, No.4, (April 1996), pp. 429-435, ISSN 0947-6539
Ferrara, S.D., Bajanowski, T., Cecchi, R., Boscolo-Berto, R. & Viel, G. (2011). Bio-medicolegal scientific research in Europe: a comprehensive bibliometric overview. International Journal of Legal Medicine, Vol.125, No.3, (May 2011), pp. 393-402, ISSN 0937-9827
Friedberg, A.L. (2000). Will Europe’s past be Asia’s future? Survival, Vol.42, No.3, pp. 147-59, ISSN 0039-6338
Fries, S.G. & Jantzen, T. (1998). Compilation of ‘CALPHAD’ formation enthalpy data - Binary intermetallic compounds in the COST507 Gibbsian database. Thermochimica Acta, Vol.314, No.1-2, (April 1998), pp. 23-33, ISSN 0040-6031
Fu, H.Z., Chuang, K.Y., Wang, M.H. & Ho, Y.S. (2011). Characteristics of research in China assessed with Essential Science Indicators. Scientometrics, Vol.88, No.3, (September 2011), pp. 841-862, ISSN 0138-9130
Fu, H.Z., Ho, Y.S., Sui, Y.M. & Li, Z.S. (2010). A bibliometric analysis of solid waste research during the period 1993-2008. Waste Management, Vol.30, No.12, (December 2010), pp. 2410-2417, ISSN 0956-053X
Garfield, E. (1990). KeyWords PlusTM - ISIS breakthrough retrieval method. 1. Expanding your searching power on current-contents on diskette. Current Contents, Vol.32, (August 1990), pp. 5-9
Garfield, E. (1996). How can impact factors be improved? British Medical Journal, Vol.313, No.7054, (August 1996), pp. 411-413, ISSN 0959-535X
Garfield, E. & Sher, I.H. (1963). New factors in evaluation of scientific literature through citation indexing. American Documentation, Vol.14, No.3, pp. 195-201, ISSN 0096-946X
Glänzel, W., Schubert, A. & Braun, T. (2002). A relational charting approach to the world of basic research in twelve science fields at the end of the second millennium. Scientometrics, Vol.55, No.3, pp. 335-348, ISSN 0138-9130
Glänzel, W., Schubert, A. & Czerwon, H.J. (1999). A bibliometric analysis of international scientific cooperation of the European Union (1985-1995). Scientometrics, Vol.45, No.2, (June 1999), pp. 185-202, ISSN 0138-9130
Gmehling, J., Li, J.D. & Schiller, M. (1993). A modified UNIFAC model. 2. Present parameter matrix and results for different thermodynamic properties. Industrial & Engineering Chemistry Research, Vol.32, No.1, (January 1993), pp. 178-193, ISSN 0888-5885
Goodman, B. (1993). Noted researchers laud donation to Russian science. Scientist, Vol.7, No.1, (January 1993), pp. 3, ISSN 0890-3670
Han, J.S. & Ho, Y.S. (2011). Global trends and performances of acupuncture research. Neuroscience and Biobehavioral Reviews, Vol.35, No.3, (January 2011), pp. 680-687, ISSN 0149-7634
He, T.W. (2009). International scientific collaboration of China with the G7 countries. Scientometrics, Vol.80, No.3, (September 2009), pp. 571-582, ISSN 0138-9130

Thermodynamics – Fundamentals and Its Application in Science 540
Ho, Y.S. (2008). Bibliometric analysis of biosorption technology in water treatment research from 1991 to 2004. International Journal of Environment and Pollution, Vol.34, No.1-4, pp. 1-13, ISSN 0957-4352
Ho, Y.S. & Ofomaja, A.E. (2005). Kinetics and thermodynamics of lead ion sorption on palm kernel fibre from aqueous solution. Process Biochemistry, Vol.40, No.11, (November 2005), pp. 3455-3461, ISSN 1359-5113
Ho, Y.S., Satoh, H. & Lin, S.Y. (2010). Japanese lung cancer research trends and performance in Science Citation Index. Internal Medicine, Vol.49, No.20, pp. 2219-2228, ISSN 0918-2918
Holman, J.P. (1985). Thermodynamics (3rd edition), McGraw-Hill, pp. 2, ISBN 978-0-070-29608-4, New York, USA
Jin, B.H. & Rousseau, R. (2005). China's quantitative expansion phase: Exponential growth but low impact. ISSI 2005: Proceedings of the 10th International Conference of the International Society for Scientometrics and Informetrics, pp. 362-370, ISBN 91-7140-339-6, Stockholm, Sweden, July 24-28, 2005
Inoue, Y., Hakushi, T., Liu, Y., Tong, L.H., Shen, B.J. & Jin, D.S. (1993a). Thermodynamics of molecular recognition by cyclodextrins. 1. Calorimetric titration of inclusion complexation of naphthalenesulfonates with -, -, and -cyclodextrin: enthalpy entropy compensation. Journal of the American Chemical Society, Vol.115, No.2, (January 1993), pp. 475-481, ISSN 0002-7863
Inoue, Y., Liu, Y., Tong, L.H., Shen, B.J. & Jin, D.S. (1993b). Thermodynamics of molecular recognition by cyclodextrins. Calorimetric titration of inclusion complexation with modified -cyclodextrins. Enthalpy-entropy compensation in host-guest complexation: From ionophore to cyclodextrin and cyclophane. Journal of the American Chemical Society, Vol.115, No.23, (November 1993), pp. 10637-10644, ISSN 0002-7863
Keizer, J. (1985). Heat, work, and the thermodynamic temperature at nonequilibrium steady-states. Journal of Chemical Physics, Vol.82, No.6, pp. 2751-2771, ISSN 0021-9606
Kleppa, O.J. (1952). A thermodynamic study of liquid metallic solutions. 4. approximate thermodynamic data from the phase diagram for the systems copper bismuth, copper lead and copper thallium. Journal of the American Chemical Society, Vol.74, No.23, pp. 6047-6051, ISSN 0002-7863
Kocks, U.F., Argon, A.S. & Ashby, M.F. (1975). Thermodynamics and kinetics of slip. Progress in Materials Science, Vol.19, No.1-281, pp. 1-281, ISSN 0079-6425
Kostoff, R.N. (2008). Comparison of China/USA science and technology performance. Journal of Informetrics, Vol.2, No.4, (October 2008), pp. 354-363, ISSN 1751-1577
Li, J.F., Wang, M.H. & Ho, Y.S. (2011). Trends in research on global climate change: A Science Citation Index Expanded-based analysis. Global and Planetary Change, Vol.77, No.1-2, (May 2011), pp. 13-20, ISSN 0921-8181
Li, J.F., Zhang, Y.H., Wang, X.S. & Ho, Y.S. (2009). Bibliometric analysis of atmospheric simulation trends in meteorology and atmospheric science journals. Croatica Chemica Acta, Vol.82, No.3, (December 2009), pp. 695-705, ISSN 0011-1643
Look, D.C. & Saucer, H.J. (1982). Thermodynamics, Wadsworth, pp.4, ISBN 978-0-818-50491-4, California, USA
Luukkonen, T. (1990). Bibliometrics and evaluation of research performance. Annals of Medicine, Vol.22, No.3, (June 1990), pp. 145-150, ISSN 0785-3890

Bibliometric Analysis of Thermodynamic Research: A Science Citation Index Expanded-Based Analysis 541
Moed, H.F. (2002). The impact-factors debate: the ISI’s uses and limits. Nature, Vol.415, No.6873, (February 2002), pp. 731-732, ISSN 0028-0836
Moed, H.F., de Bruin, R.E. & Van Leeuwen, Th.N. (1995). New bibliometric tools for the assessment of national research performance: Database description, overview of indicators and first applications. Scientometrics, Vol.33, No.3, (July-August 1995), pp. 381-422, ISSN 0138-9130
Nagy, A. & Parr, R.G. (1994). Density-functional theory as thermodynamics. Proceedings of the Indian Academy of Sciences-Chemical Sciences, Vol.106, No.2, (April 1994), pp. 217-227, ISSN 0253-4134
Narin, F., Stevens, K. and Whitlow Edith S. (1991). Scientific co-operation in Europe and the citation of multinationally authored papers. Scientometrics, Vol.21, No.3, (July-August 1991), pp. 313-323, ISSN 0138-9130
Ngai, K.L. (2000). Dynamic and thermodynamic properties of glass-forming substances. Journal of Non-Crystalline Solids, Vol.275, No.1-2, (September 2000), pp. 7-51, ISSN 0022-3093
Nicholls, A., Sharp, K.A. & Honig, B. (1991). Protein folding and association - insights from the interfacial and thermodynamic properties of hydrocarbons. Proteins-Structure Function and Genetics, Vol.11, No.4, pp. 281-296, ISSN 0887-3585
Oh, C.S., Shim, J.H., Lee, B.J.A. & Lee, D.N. (1996). Thermodynamic study on the Ag-Sb-Sn system. Journal of Alloys and Compounds, Vol.238, No.1-2, (May 1 1996), pp. 155-166, ISSN 0925-8388
Patzek, T.W. (2004). Thermodynamics of the corn-ethanol biofuel cycle. Critical Reviews in Plant Sciences, Vol.23, No.6, pp. 519-567, ISSN 0735-2689
Picknett, T. & Davis, K. (1999). The 100 most-cited articles from JMB. Journal of Molecular Biology, Vol.293, No.2, (October 1999), pp. 173-176, ISSN 0022-2836
Rehn,C., Kronman, U. & Wadskog, D. (2007). Bibliometric indicators-definitions and usage at Karolinska Institutet. in Karolinska Institutet, 13.03.2012, Available from http://kib.ki.se/sites/kib.ki.se/files/Bibliometric_indicators_definitions_1.0.pdf
Rosakis, P., Rosakis, A.J., Ravichandran, G. & Hodowany, J. (2000). A thermodynamic internal variable model for the partition of plastic work into heat and stored energy in metals. Journal of the Mechanics and Physics of Solids, Vol.48, No.3, (March 2000), pp. 581-607, ISSN 0022-5096
Sainte-Marie, B. (2010). The first 30 years of the journal of crustacean biology - a bibliometric study. Journal of Crustacean Biology, Vol.30, (November 2010), pp. 541-549, ISSN 0278-0372
SantaLucia, J. & Hicks, D. (2004). The thermodynamics of DNA structural motifs. Annual Review of Biophysics and Biomolecular Structure, Vol.33, pp.415-440, ISSN 1056-8700
Saracevi, T. & Perk, L.J. (1973). Ascertaining activities in a subject area through bibliometric analysis. Journal of the American Society for Information Science, Vol.24, No.2, pp. 120-134, ISSN 0002-8231
Schubert, A., Glänzel, W. & Braun, T. (1989). Scientometric datafiles: A comprehensive set of indicators on 2649 journals and 96 countries in all major science fields and subfields 1981-1985. Scientometrics, Vol.16, No.1-6, (June 1989), pp. 3-478, ISSN 0138-9130

Thermodynamics – Fundamentals and Its Application in Science 542
Seelig, J. (2004). Thermodynamics of lipid-peptide interactions. Biochimica Et Biophysica Acta-Biomembranes, Vol.1666, No.1-2, (November 2004), pp. 40-50, ISSN 0005-2736
Shimba, N., Torigoe, H. and Takahashi, H., Masudaa, K., Shimadaa, I., Arataa, Y. & Saraib, A. (1995). Comparative thermodynamic analyses of the Fv, Fab* and fab fragments of anti-dansyl mouse monoclonal antibody. Febs Letters, Vol.360, No.3, (March 6 1995), pp. 247-250, ISSN 0014-5793
Sun, J.S., Wang, M.H. & Ho, Y.S. (2012). A historical review and bibliometric analysis of research on estuary pollution. Marine Pollution Bulletin, Vol.64, No.1, (January 2012), pp. 13-21, ISSN 0025-326X
Svirbely, W.J. (1954). Thermodynamic data for the zinc indium system obtained from the phase diagram. Journal of Physical Chemistry, Vol.58, No.7, pp. 557-559, ISSN 0022-3654
Tanaka, H. & Ho, Y.S. (2011). Global trends and performances of desalination research. Desalination and Water Treatment, Vol.25, No.1-3, (January 2011), pp. 1-12, ISSN 1944-3994
Tsay, M.Y. (2008). A bibliometric analysis of hydrogen energy literature, 1965-2005. Scientometrics, Vol.75, No.3, (June 2008), pp. 421-438, ISSN 0138-9130
van Raan, A.F.J. (2001). Bibliometrics and Internet: Some observations and expectations. Scientometrics, Vol.50, No.1, (January 2001), pp. 59-63, ISSN 0138-9130
van Raan, A.F.J. (2005). For your citations only? Hot topics in bibliometric analysis. Measurement: Interdisciplinary Research and Perspectives, Vol.3, No.1, (January 2005), pp. 50-62, ISSN 1536-6367
von Bubnoff, A. (2005). Asia squeezes Europe’s lead in science. Nature, Vol.436, No.7049, (July 2005), pp. 314-314, ISSN 0028-0836
Wang, M.H., Li, J.F. & Ho, Y.S. (2011). Research articles published in water resources journals: A bibliometric analysis. Desalination and Water Treatment, Vo.28, No.1-3, (April 2011), pp. 353-365, ISSN 1944-3994
Wang, M.H., Yu, T.C. & Ho, Y.S. (2010). A bibliometric analysis of the performance of Water Research. Scientometrics, Vol.84, No.3, (September 2010), pp. 813-820, ISSN 0138-9130.
Webb, T.D. (1994). Societies aid in large-scale effort to support Russian science. Scientist, Vol.8, No.2, (January 1994), pp. 3, ISSN 0890-3670
Weingart, P. (2003). Evaluation of research performance: The danger of numbers. Schriften der Forschungszentrums Jülich: Vol II. Bibliometric analysis in science and research: Applications, benefits and limitations, pp. 7-19, ISBN 3-89336-334-3, Forschungszentrums Jülich, Germany, November 5–7, 2003
Wilson, C.S. & Markusova, V.A. (2004). Changes in the scientific output of Russia from 1980 to 2000, as reflected in the Science Citation Index, in relation to national politico-economic changes. Scientometrics, Vol.59, No.3, pp. 345-389, ISSN 0138-9130
Yamazaki, S. (1994). Research activities in life sciences in Japan. Scientometrics, Vol.29, No.2, (February 1994), pp. 181-190, ISSN 0138-9130
Zhou, P. & Leydesdorff, L. (2006). The emergence of China as a leading nation in science. Research Policy, Vol.35, (February 2006), pp. 83-104, ISSN 0048-7333
Zhou, P. & Leydesdorff, L. (2008). China ranks second in scientific publications since 2006. ISSI Newletter, Vol.4, (March 2008), pp. 7-9