bibliography - molecular machines online: mmi-bibliography | 2 the isolation of intact rna from tiny...
TRANSCRIPT

-Bibliography Vol 3 No 1 * 2010
Issue on Laser Microdissection for Transcriptomics
Molecular Machines & Industries

In this issue This issue is dedicated to all researchers, who wish to study gene expression in individual cells and tissue areals after Laser Microdissection. It provides tips and tricks for the set up of representative Work Flow`s starting from fresh frozen or FFPE material and features helpful publications in this field.
Customer ReportSingle or small subsets of cells reveal “clean-cut” transcriptome profiles by Eric Cabuy MEng, MSc, PhD Single Cell Genomics, Friedrich Miescher Institute for Biomedical Research, Basel, Switzerland
Using Laser Microdissection and Transcriptional Profiling to Identify the Molecular Constituents of Taste Buds by Bryan D. Moyer, Ph.D. Former Associate Director, Ion Channel Biology, Senomyx, Inc., San Diego, CA, USA
MMI ReportDesigning a Work Flow for RNA based analysis using Laser Microdissected Materials by the MMI team MMI AG
Featured Publications
References
The LMD-Bibliograhy is published by Molecular Machines & Industries.com, ISSN 1662-8535 Editor: Dr. Antje Plaschke-Schluetter, e-mail: [email protected] Board: Norbert Brill, Andre Imhof & Prof. Stefan SeegerConcept & Layout: Kathrin Plaschke – Grafik & Design – HamburgThe mmi Caplift technology is patented by Molecular Machines & Industries. MMI is a registered trademark.
»Lead the way to micromanipulation«
C o N T E N T S
MMI-Bibliography online: www.molecular-machines.com/News
MMI-Bibliography | 2www.molecular-machines.com

The isolation of intact RNA from tiny amounts of starting
material is the most critical step for sound gene expression
analysis, based on microarrays. Microarrays have long been
established for the generation of gene expression profiles
that reflect differences between normal and diseased states.
Differently expressed genes may have the potential to serve
as new targets in drug discovery. But getting a proper sam-
ple from bedsite or the operation suit to bench is a monu-
mental task, demanding an all-out effort and a strictly har-
monized work flow between all people involved. The rising
demand for new biomarkers as drug targets that could eventually be used to fight life threat-
ening diseases like cancer and neurological disorders fostered the development of new
products and protocols based on Laser Microdissection. Laser Microdissection is a well ac-
cepted technology and is used to specifically cut out diseased versus non diseased cells from
heterogeneous biopsy material.
The aim of this third issue of the MMI Bibliography is to show recent advancements in the
protocol development for Transcriptomics after Laser Microdissection. It introduces outstand-
ing approaches and turn key steps for the implementation of such work flows.
The report from Eric Cabuy, who heads the Single Cell Genomics Facility at the Friedrich
Miescher Institute for Biomedical Research in Basel, Switzerland is focussed on gene expres-
sion profiling of motoneurons from fresh frozen sections of the mouse brain. This work was
recently published in Nature Neuroscience.
In his report, Bryan Moyer introduces the strategy that allowed Senomyx Inc., to generate
the first comprehensive taste bud gene expression library in primates and rodents. This work
is based on highthrough put Laser Microdissection of fresh frozen primate and rodent tongue
blocks coupled to whole genome transcriptional profiling after isothermal amplification.
The contribution from our team entitled “Designing a Work Flow: RNA based analysis using
Laser Microdissected Material” .for Microarray or Quantitative Real-Time PCR analysis high-
lights the individual steps for work flow implementation and refers to actual publications
on protocol development and optimization.
The whole MMI Team hopes that you enjoy this issue. In case you feel that you would like
to contribute to future issues, please contact us. We value your opinion and input, which
will help us to further strengthen our technical developments, based on your needs. Watch
for the seminar announcements on our web-page and the scheduled meetings and train-
ings. our next User-Meeting takes place in october 2010, check our WEB-Site for the exact
dates, program and speakers.
We look forward to: »Welcome you to our Upcoming User-Meeting in october 2010«
Dr. Antje Plaschke-Schluetter
MMI AG Zuerich
»Lead the way together with you«
E D I T o R I A L
MMI-Bibliography | 3www.molecular-machines.com

Ever since we are studying the molecular biology of organisms, one of the primary
efforts is to identify new types of cells and then to elucidate their meaning. In mo-
lecular biology experiments, proteins and nucleic acids are measured as average val-
ues in large populations of cells. This may lead to the wrong conclusions on the as-
sumption that individual cells differ from each other. The vast complexity we see at
the nano-scale between individual cells would reveal differences at the single cell
level, an obvious statement for those studying the physical properties of cells [1].
As information is lost by averaging signals, it is necessary to study individual or very
small subsets of cells in order to determine mechanistic details. Thirteen years ago
Zhao already argued that each cell in a tissue is an individual acting in concert with
its neighbors [2]. The overall behavior of the tissue may therefore be an emergent
property of the organization of and interaction between individual cells. This hypoth-
esis may have profound consequences for cell biology.
In September 2005 I joined the Friedrich Miescher Institute (FMI) in Basel, Switzerland
where I was given the task to establish a laboratory in Single Cell Genomics (SCG).
SCG at the FMI broadly refers to the molecular biology of individual and small sub-
sets of cells that share similar characteristics or functions. The facility’s main role is to
manage laser-dissection microscopy-based projects, provide advice on experimental
design as well as teaching and centrally deals with the isolation of single cells and
down-stream workflows. Affymetrix microarrays (3’ expression, gene and tiling) are
currently the principal way of transcriptome profiling. Due to the nature of dealing
with different projects, the workflows for handling small numbers of cells are char-
acterized by different parameters and design with regard to cell source, type, num-
bers, preparation, staining, microarrays etc. Because of this, any form of semi-au-
tomation cannot be applied at the moment. Some of these projects may take 2–4
years and therefore the procedural consistency is very important.
Life cells in suspension are isolated individually by hand-controlled micromanipula-
tion or by fluorescence-activated cell sorting (FACS). FACS offers a last resort because
mechanical dissociation of the tissue and the time needed to stain and process sam-
ples contribute to potential changes in gene expression. For the majority of projects
single cells are isolated with a laser capture microscope (LCM). We have opted for
the LCM from MMI for its superb laser cutting capability (short pulse duration, high
repetition rate), its design (contamination-free sandwich technology) and its user-
friendly operation which is the best adapted to our institute’s environment of differ-
ent temporary users. For extracting RNA, cryo-preserved tissues are superior. These
are cooled down in isopentane before being stored at minus 80 degrees. We cryo-cut
sections at a specific thickness depending on cell size and place one section at a time
on the PET-membrane, immediately followed by a single dehydration step. We sub-
sequently proceed to LCM to capture and lyse cells as quickly as possible. This is es-
sential for analyzing single cells in order to snap freeze their physiological states. The
»Lead the way to micromanipulation«
CUSToMER REPoRTS
Erik Cabuy, MEng, MSc, PhDSingle Cell GenomicsFriedrich Miescher Institute for Biomedical Research Basel, Switzerland
Single or small subsets of cells:Reveal `clean-cut` transcriptome profiles
MMI-Bibliography | 4www.molecular-machines.com
overview of the MMI laser capture microscope set-up at FMI in Basel
The GeneChip Mouse Genome 430 2.0 array from Affymetrix, used in our study

next step which is equally important is to purify RNA while maintaining its integrity.
My experiments on single cells (neurons, oocytes) have shown that glass fiber filters
are superior to other means of RNA extraction e.g. oligo dT-coated magnetic beads,
which are not very practical in semi-high throughput. Quality control is performed
on amplified cRNA/cDNA using the Agilent RNA 6000 Pico/Nano Bioanalyzer pro-
cedure. RNA can be amplified from minute samples in different ways by using IVT-
or PCR-based amplification techniques. The method of choice depends on wheth-
er microarrays hybridize with RNA, ssDNA or dsDNA. Despite all efforts in protocol
development, a linear amplification which involves a reverse transcription of mRNA
by using a poly-T primer linked to a T7 promoter is still the method that I prefer for
microarray profiling. The limitation of capturing only poly(A)-tailed mRNA gives us at
least the advantage of amplifying specifically RNA to a large extent.
one of the projects that we have been working on is a study of amyotrophic later-
al sclerosis (ALS), a neurodegenerative disorder characterized by loss of motor neu-
rons resulting in progressive paralysis. The idea for this study was to longitudinal-
ly analyze gene changes in 10 motor neurons per sample in a mouse model of ALS.
At the time (mid 2005) it was generally considered that amplifying RNA from such
low numbers of cells for gene expression analysis on Affymetrix microarrays was
not feasible. In order to assess the technical contributions to any observed expres-
sion differences, I first tested different IVT-based amplification techniques on 10,000
gradually down to 400 laser-dissected liver cells and microarray data revealed vari-
ous correlation values. In a second experiment, RNA was taken from lower numbers
down to a single neuron using one of the amplification methods (largely equal to
the Eberwine protocol) to improve detection level, reliability, efficiency and speed of
workflows. Gene level signals and quality controls were obtained from Genedata’s
Refiner software. once the workflow was established, I immediately embarked on
several projects e.g. one in studying ALS [3]. Motor neurons were identified by us-
ing fluorescently-labeled dextran beads as a tracer injected into muscles. 25–30 sec-
tions representing approximately 10 motor neurons were micro-dissected and col-
lected per tube. I then preformed microarray experiments in batches of maximum
4 times three replicates using 430 2.0 Arrays. Normally, for an experiment like this,
the mean raw expression values are highly reproducible and the average present
calls are about 50%. The ALS study clearly demonstrates the feasibility of using the
MMI LCM to perfectly capture single cells consistently during the course of a project
that may last for several years.
References[1] Phillips, R., Kondev, J., Theriot, J. | Physical biology of the cell. 2009, by Garland Science, Taylor & Francis Group, LLC.
[2] Zhao, J. | Cell individuality: A basic multicellular phenomenon and its role in the pathogenesis of disease. Medical Hypotheses 1995, 44(5): 400-2
[3] Saxena, S., Cabuy, E., Caroni, P. | A role for motoneuron subtype-selective ER stress in disease manifestations of FALS mice. Nature Neuroscience 2009, 12:627-636
»Lead the way to advanced transcriptomics«
CUSToMER REPoRTS
MMI-Bibliography | 5www.molecular-machines.com
Isolation of single cells in action:
Experimental results of microarray data representing the gene expression profiles of two replicates containing each 10 laser-dissected neurons.
View onto a membrane slide: before and after capturing of single cells
A single dehydrated brain tissue section mounted on top of a membrane-slide
Frozen brain embbeded in Tissue-TEK on a Cryostat ready for sectioning

Sensory organs are comprised of a heterogeneous collection of cell types including specialized sensory cells, support cells, nerve fibers, blood vessels, epithelial cells, and connective tissue. Collection and analysis of pure populations of sensory cells is important to further understand the molecular processes and pathways active in the traditional senses of vision, hearing, gustation, olfaction, and mechanosensation as well as the non-traditional senses of balance, temperature, and pain. Gustation, the sense of taste, is mediated by thousands of sparsely distributed taste buds lo-calized on the tongue surface and oral cavity. Each taste bud is comprised of 50-100 cells that are hard-wired to detect one of the five known taste qualities: sweet, bit-ter, umami (the taste of monosodium glutamate), sour, and salty [1].
Taste buds represent less than 1% of the tongue surface. Therefore, a major chal-lenge in taste research is the collection of sufficient quantities of pure taste buds for experimentation. Historically, this has been accomplished by proteolytic dissociation of gustatory tissue followed by manual isolation of taste buds [2]. This approach is effective but drawbacks include low throughput, damage to taste cells as well as compromised RNA integrity if proteolysis is not carefully monitored, and contamina-tion of taste buds with surrounding lingual epithelial cells and connective tissue.
To comprehensively identify the genes, processes, and pathways active in gestation in the peripheral nervous system, Senomyx devised an approach to collect and ana-lyze gene expression in pure preparations of taste buds. our approach involved laser microdissection of taste buds followed by transcriptional profiling using a combina-tion of microarray and RT-PCR technologies. Taste buds and surrounding non-gustato-ry lingual epithelium are collected to identify genes specifically or preferentially ex-pressed in taste cells. Laser microdissection is a proven effective tool to rapidly iso-late pure populations of specific cells from structurally diverse tissues, while micro-arrays and end-point/qPCR allow genome wide or focused interrogation of RNA ex-pression patterns respectively.
Fresh frozen primate and rodent tongue blocks are sectioned and stained prior to la-ser microdissection using the MMI Cell Cut instrument. 10 μm sections are prepared, corresponding to the thickness of a single taste bud cell. A short post-mortem inter-val (less than 5 minutes), RNase-free working conditions, rapid workflow from cry-osectioning to laser microdissection (1-2 hours), and staining protocols that mini-mize tissue hydration, such as the Ambion LCM staining kit using solutions that are at least 50% anhydrous, are crucial to maximize RNA integrity. We have optimized la-ser microdissection throughput and can routinely collect over 10,000 taste bud cells in a single day (over 1,000 individual taste buds). RNA is isolated and linearly am-plified using one or two step methodologies. Single primer isothermal amplification using both random and oligo-dT based reverse transcription, generates over 5 ug of amplified cDNA from 1,000 collected taste bud cells (over 100 individual taste buds).
»Lead the way to micromanipulation«
CUSToMER REPoRTS
Bryan D. Moyer, Ph.D.Associate Director, Ion Channel BiologySenomyx, Inc. San Diego, CA, USA
MMI-Bibliography | 6www.molecular-machines.com
Section from front of tongue (fungi form papilla) with a single taste bud encir-cled in black and highlighted with red arrow. Note that the taste bud compris-es only a small fraction of the section. Scale bar is 20 μm.
Figure 1
Identify the Molecular Constituents of Taste Budsby using Laser Microdissection and Transcriptional Profiling
A
A
C
B
B
C
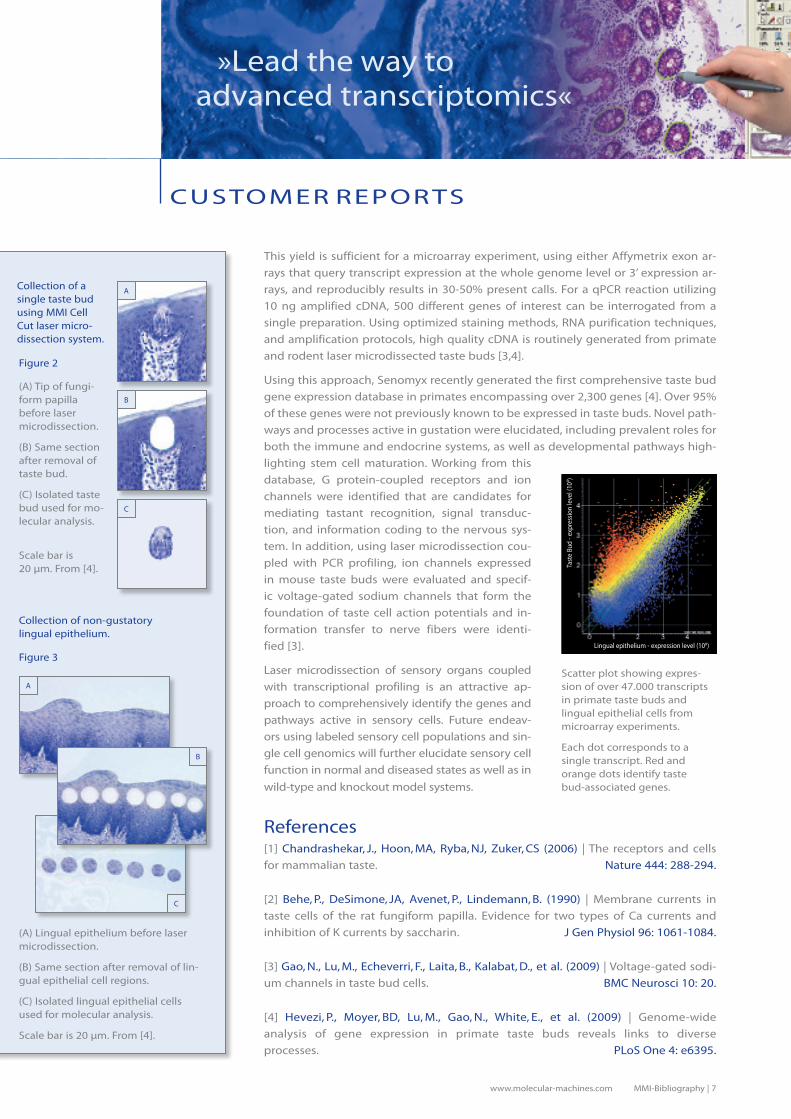
Scatter plot showing expres-sion of over 47.000 transcripts in primate taste buds and lingual epithelial cells from microarray experiments.
Each dot corresponds to a single transcript. Red and orange dots identify taste bud-associated genes.
Tast
e Bu
d - e
xpre
ssio
n le
vel (
10x )
Lingual epithelium - expression level (10x)
This yield is sufficient for a microarray experiment, using either Affymetrix exon ar-rays that query transcript expression at the whole genome level or 3’ expression ar-rays, and reproducibly results in 30-50% present calls. For a qPCR reaction utilizing 10 ng amplified cDNA, 500 different genes of interest can be interrogated from a single preparation. Using optimized staining methods, RNA purification techniques, and amplification protocols, high quality cDNA is routinely generated from primate and rodent laser microdissected taste buds [3,4].
Using this approach, Senomyx recently generated the first comprehensive taste bud gene expression database in primates encompassing over 2,300 genes [4]. over 95% of these genes were not previously known to be expressed in taste buds. Novel path-ways and processes active in gustation were elucidated, including prevalent roles for both the immune and endocrine systems, as well as developmental pathways high-lighting stem cell maturation. Working from this database, G protein-coupled receptors and ion channels were identified that are candidates for mediating tastant recognition, signal transduc-tion, and information coding to the nervous sys-tem. In addition, using laser microdissection cou-pled with PCR profiling, ion channels expressed in mouse taste buds were evaluated and specif-ic voltage-gated sodium channels that form the foundation of taste cell action potentials and in-formation transfer to nerve fibers were identi-fied [3].
Laser microdissection of sensory organs coupled with transcriptional profiling is an attractive ap-proach to comprehensively identify the genes and pathways active in sensory cells. Future endeav-ors using labeled sensory cell populations and sin-gle cell genomics will further elucidate sensory cell function in normal and diseased states as well as in wild-type and knockout model systems.
References[1] Chandrashekar, J., Hoon, MA, Ryba, NJ, Zuker, CS (2006) | The receptors and cells for mammalian taste. Nature 444: 288-294.
[2] Behe, P., DeSimone, JA, Avenet, P., Lindemann, B. (1990) | Membrane currents in taste cells of the rat fungiform papilla. Evidence for two types of Ca currents and inhibition of K currents by saccharin. J Gen Physiol 96: 1061-1084.
[3] Gao, N., Lu, M., Echeverri, F., Laita, B., Kalabat, D., et al. (2009) | Voltage-gated sodi-um channels in taste bud cells. BMC Neurosci 10: 20.
[4] Hevezi, P., Moyer, BD, Lu, M., Gao, N., White, E., et al. (2009) | Genome-wide analy sis of gene expression in primate taste buds reveals links to diverse processes. PLoS one 4: e6395.
»Lead the way to advanced transcriptomics«
CUSToMER REPoRTS
MMI-Bibliography | 7www.molecular-machines.com
Figure 2
Collection of a single taste bud using MMI Cell Cut laser micro-dissection system.
Collection of non-gustatory lingual epithelium.
Figure 3
(A) Tip of fungi-form papilla before laser microdissection.
(B) Same section after removal of taste bud.
(C) Isolated taste bud used for mo-lecular analysis.
Scale bar is 20 μm. From [4].
(A) Lingual epithelium before laser microdissection.
(B) Same section after removal of lin-gual epithelial cell regions.
(C) Isolated lingual epithelial cells used for molecular analysis.
Scale bar is 20 μm. From [4].

The combined application of laser microdissection and RNA based gene expression experiments like qPCR or microarray studies has greatly increased during the last couple of years and has been proven many times in publications. Take a closer look at our reference list. A recent publication by Harrel et al., clearly demonstrates, that contaminating cells alter gene signatures, when comparing profiles obtained from whole organ preparations versus laser microdissected tissue areas1. Success using laser microdissected material can be as easy as using whole tissue sections as long as the proper precautions and considerations are taken2. Here we outline a typical RNA based LMD experiment and detail the steps that matter for the isolation of in-tact RNA.
A typical gene expression study can be broken down into the following steps:
• Sample Preparation: Securing the sample from the donor and preparing it. This covers either freezing in embedding medium for fresh frozen material or fixation and paraffin embedding in “Formalin Fixed Paraffin Embedded” work flow`s
• Cell Identification: Sectioning and staining the sample for cell identification
• Laser Micro Dissection: adjust the LMD instrument to specifically enrich cell populations
• Extraction, Purification & Quality Control: Lysis of microdissected cells and RNA purification
• Amplification: Amplifying the RNA after reverse transcription to maximize the amount available
• Labeling: Attaching fluorescent labels to the PCR step for visualization and:
• Molecular analysis: of microarray data or qRT-PCR results after hybridization to a gene chip
Each of these steps can be important and can mean success or failure of the exper-iment. While many different sample types, fixation methods and preparation meth-ods can be used for LMD, the preferred method is to use fresh frozen material, frozen in an oCT block, for gene expression profiling. FFPE material can also be used for RNA analysis but there are additional challenges related to the cross-linking of nucleic acids and proteins during the fixation process.
Current clinical praxis involves fixing of patient material in forma-lin and embedding the samples in paraffin blocks. These blocks are stable over time and represent a huge source of biological in-
»Lead the way to micromanipulation«
M M I R E P o R T S
Miles Bellamy Application Scientist & ConsultantMMI Inc. U.S.
Lee Petruk National Sales ManagerMMI Inc. U.S.
Caroline Stevens Marketing MMI AG Zurich
Ludmila Merker Service Technician MMI AG Zurich
MMI-Bibliography | 8www.molecular-machines.com
1 Harrel, C.J., Dye, W.W., Harvell, E.M.D., Sartorius, A.C., Horwitz, B.K., (2008), Contaminating cells alter gene signatures in whole organ versus la-ser capture microdissected tumors: a comparison of experimental breast cancers and their lymph node metastases. Clin Exp Metastasis. 2008; 25 (1): 81-8.2 Erickson, S.H., Albert, S.P., Gillespie, W.J., Canales-Rodriguez, J., Linehan, M.W., Pinto, A.P., Chuaqui, F.R., Emmert-Buck, R.M., (2009), Quantitative RT-PCT gene expression analysis of laser microdissected tissue samples, Nat. Protoc.2009, 4, 902-922
Did you know … … that the Illumina DASL – assay
was developed with mmi CellCut microdissected material? See reference Li et al.,
tip
MMI team members
Designing a Work FlowRNA based analysis using Laser Microdissected MaterialLee Petruk · Miles Bellamy · Caroline Stevens · Ludmilla Merker · Antje Plaschke-Schluetter

A
formation. A number of new developments have made mRNA profiling from FFPE tissue a reality and specific FFPE-optimized DNA microarray platforms have been developed.
It turned out, that many scientists analyze small interfering RNA`s from FFPE mate-rial. Due to their small size of only about 20 to 25 nucleotides, siRNA can easily be extracted and is not subject to further degradation. Approved commercial kits are available to fulfill this task even for sample material that was proc-essed according to clinical routine protocols3. This article is partic-ularly focusing on the preparation and quality assessment of RNA from lasermicrodissected fresh frozen material. For the latest devel-opments in the field of microarray analysis from laser microdissect-ed FFPE material we refer to the special report by Tanney & Kennedy as well as to the short technical report by Linton et al., and the publication by Werner et al.
Sample preparationSample preparation starts when the tissue is removed from the patient or animal. Inherent RNases, DNases and Proteases will immediately become active starting to degrade their substrates. The goal in sample preparation is to preserve all avail-able RNA by minimizing the amount of time between tissue removal and freez-ing at -80C or in liquid nitrogen* or by transferring the tissue in-to Formalin for fixation in the course of a FFPE protocol. The im-plementation of tissue removal and processing protocols needs to be quality controlled by a series of RNA extractions and evalu-ations using a Bioanalyzer or Nanodrop instrument – see also un-der RNA Extraction and Quality control. The success of laser microdissection experi-ments strongly follows the rule: “Garbage in garbage out”. Time is well spent on op-timizing the sample preparation procedure. After successful removal and preserva-tion steps, the sample is then cut onto membrane slides using a cryostat for frozen material or a microtome for FFPE material. Sections are cut at a thickness between 5 and 10 microns.
Cell Identification and Laser MicrodissectionStaining is not completely necessary for all experiments – some scientist`s identi-fy the cells or tissue areas of interest without any staining by viewing them under
»Lead the way to optimized Work Flow`s «
M M I R E P o R T S
MMI-Bibliography | 9www.molecular-machines.com
3 Hlubek, F., Schuster, C., Budczies, J., Kirchner, T., (2010), Robust microRNA expression profiling of specific cells in complex archival tissue stained by immunohistochemistry, Abstract at AACR 2010 and paper in submitted
Fresh Frozen Sample Preparation:A cryomold with oCT embedded tissue floating on an Isopentane cooling bath …
… and frozen, ready to use
Alternative Freezing Methods > Isopentane cooled over liquid > Nitrogen Isopentane cooled
with dry ice (preferred)
tip
* Take care > Snap Freezing in liquid
nitrogen induces ice crystals
tip
Frozen brain embbeded in Tissue-TEK on a Cryostat ready for sectioning
• 30” 75% EtoH Quick fix• 30” H2o Hydrolize sample to accept aqueous stain• 30”- 60” Stain optimize stain concentration to fit this time frame• 30” H2o Removes excess stain • 30” 75% EtoH Gradual dehy dra tion to maintain morphology
• 30” 95% EtoH Gradual dehy dra tion to maintain morphology• 30” 100% EtoH Sample is com- pletely dehydrated• 5’ Xylene Removes EtoH* • 5’ Air dry Removes the xylene (or 100% EtoH)
*can be omitted, but sample may absorb some water from the atmosphere due to hydro philic nature of 100% EtoH
Basic Fix & Stain protocol

phase contrast – but it is very common to identify the cells of interest by staining. When staining the sample it is important to minimize the amount of time that the sample is exposed to aqueous solutions. A typical staining protocol would include fixation prior to staining and dehydration afterwards. A basic Fix & Stain protocol is outlined in Box 1 and can be used as a starting point. Immunostaining is also com-patible with LMD, see the featured publications, page 12.
Pat Stockton, who runs a Core Facility for laser microdissection at the NIH, has opti-mized her Work Flow according to the two vital criteria: best stain and shortest over-all time allowed from start to nucleic acid extraction. She usually stain`s frozen tis-sue samples with Cresyl Violet (CVa) for gene expression profiling. Boxes A and B show the exact protocols for this staining and the whole laser dissection procedure.
This optimized protocol has been the basis for several successful studies and publi-cations4.
Using the CellCut graphical interface to identify cells of interest, cut them out using the mmi high precision and low power UV laser, collecting the sample using an ad-hesive cap, and processing the sample in the attached PCR tube is a very simple process that takes the least amount of time of the whole experiment. When using the instrument, allow a small buff-er (about as wide as the cut path) between the cell of interest and the laser cut so that UV energy is not absorbed into the surround-ing tissue. Successful results can be achieved from as few as 10 cells. However to im-prove your chances of success it is recommended to use 500 cells or more if possi-ble, especially for beginners5. As a general rule for calculation purposes you can ex-pect to recover ~10 pg of total RNA from one cell. Use the mmi area calculation tool to get an idea about the sections sizes you recovery and an estimate of the number of cells that you dissected. This number is highly variable based on tissue type, sam-ple thickness, tissue quality, etc and should only be used a guide.
RNA extraction & Purification & Quality Control There are many kits by many manufacturers that can be used effectively with LMD samples. The most popular extraction method is to use a GITC (guanidinium iso-thiocyanate) based extraction buffer and purification columns. These types of kits are common in RNA laboratories. When selecting a kit, choose one that elutes in-to a small volume of elution buffer or water (~10 to 20 ul) as you will have a small amount of RNA due to the nature of the experiment. For comparative qPCR experi-ments it is imperative to check the quantity, the quality and the integrity of the RNA preparation. RNA yields are very low after laser microdissection, but the NanoDrop spectrophotometric technology is an excellent choice to assess RNA quantities down to 2ng per μl. This sensitive detection limit is not within the resolution of an Agilent Bioanalyzer system, which is at > 25 ng per μl. Using RiboGreen dye to fluorescent-ly label RNA in combination with a Fluorospectrometer of type NanoDrop 3300 even scales down the measurement sensitivity to 25 ng per ml or 25 pg per ul.
Nevertheless, in this Work Flow, the appropriate Agilent Bioanalyzer chip – either the Nano or the Pico Chip – give valuable information on the RNA quality and integrity
»Lead the way to micromanipulation«
M M I R E P o R T S
MMI-Bibliography | 10www.molecular-machines.com
4 Gohlke, M.J., Stockton, S.P., Sieber, S., Foley, J., Portier, J., (2009), AhR- mediated gene expression in the developing mouse telencephalon, Reproductive Toxicology 28, 312- 328.
MMI offers a highly approved and ready to use H & E Staining Kit – RNase-free: # 70301 You simply pipet from drop bottles
tip
CVa Solution
0.5 g Cresyl Violet acetate (Sigma-Aldrich)
50 ml Nuclease-free Water Make fresh and filter!
1. 75% EtoH 1 minute2. Nuclease-free water 30 seconds3. Cresyl Violet (Filtered) stain 30 seconds4. 75% EtoH 30 seconds5. 95% EtoH 30 seconds6. 100% EtoH 30 seconds x2
B
Adjusting the mmi high precision and low power UV laser is easy and convinient

New Software
»Lead the way to scientific references«
M M I R E P o R T S
by displaying the so called RIN number, as shown in the figure below: The Agilent Bioanalyzer Chips have a qualitative range of 50 – 5.000 pg per ml for the Pico Chip and of 5 – 500ng per ml for the Nano Chip.
RIN numbers greater than 5 are considered good, but results could be obtained from samples showing even lower RIN numbers.
RNA AmplificationMost microarray experiments will require the use of RNA amplification because the RNA output from your LMD experiment will likely be in the low nanogram range and the input requirements from your microarray manufacturer will likely be in the low microgram range. There are two amplification methods that people are using for LMD experiments; linear amplification and whole transcript amplification (WTA).
Linear amplification is considered the gold standard for RNA. Both customer re-ports in this issue de-scribe linear amplifi-cation and there are many publications that support this pro-tocol as a reliable and reproducible meth-od for increasing RNA yield. The process is based on doing re-verse transcription from the 3’ end. The one down side of this is that the sample will be 3’ oriented and this must be taken into account when analyzing the data. WTA is an alternative to linear amplification that appears to becoming popular6. This is based on using a randomized set of primers that eliminates the 3’ orientation seen in linear amplification. As this technology is new, there are not as many publications to sup-port this amplification. However this does appear to be gaining popularity and may be the preferred amplification method in the future, only time will tell.
When designing a genetic experiment the most critical factor is to ensure that the sample has good RNA in before beginning the experiment. Proper sample acquisi-tion and sample assessment are critical, as the whole experiment can be compro-mised if these are not performed properly. The instrument itself, while critical, ac-tually is the smallest expense of time in the process. Extraction, amplification, la-beling and analysis are reliable and proven RNA methods that can be easily incor-porated into your LMD experiments. As long as you are working with a high quality sample, and the correct precautions are taken regarding the low amount of materi-al that will be collected, then your existing staining and analysis methods can easi-ly be incorporated into an LMD experiment.
MMI-Bibliography | 11www.molecular-machines.com
Protocol for Laser Microdissection
by Pat Stockton
Wear gloves at all times and change frequently.
From frozen tissue:1. Cut 4 membrane slides containing
two sections per slide at 8 µm2. Cut 1 Map H&E at 6 µm for cover-
slipping and diagnosis3. Hold slides on dry ice to stain in
batches for LM*4. RNA isolation and RT-PCR to micro-
array analysis by investigatorBriefly:1. Thaw the Nucleic Acid Extraction
Buffer before using2. Quick stain with fresh
1% aqueous CVa (filtered)3. Air dry for 5 minutes under hood4. Prepare MMI laser microscope
and sample tubes during the 5 minute drying
5. Find target areas and microdissect all samples within 20 minutes for best RNA, recording the session with images saved as you progress
6. As tubes are finished, pipet in the RNA extraction buffer closing tubes to shake down the buffer covering your LM samples on the cap. Vortex the inverted tubes, briefly, and leave in verted until all tubes are collected or dilute the sample by pipetting up and down on the adhesive lid
7. Follow the detailed protocol of the Kit supplier
8. Spin down, gently, to button the lysed RNA for -80º C storage until RNA isolation is performed. Rapid isolation is best, long freezer storage is not recommended.
9. Check by NanoDrop and PicoChip in the Microarray lab to quantify RNA.
*Start by staining and microdissecting one slide and work up your number and speed to do three to five slides in the 20 minute time period.
C
optimized protocol
5 Espina, W., Wulfkuhle, J.D., Calvert, V.S., VanMeter, A., Zhou, W., Coukus, G., Geha, D.H. Petricoin, E.F. and Liotta, L.A., (2006), Laser-capture microdissection, Nat. Protoc. 1, 586 -603 6 Tomlins, A.S., mehra, R., Rhodes, R.D., Shah, B.R., Rubin. A. M., Bruening, E., Makarov, V., Chinnaiyan, M.A., (2006), Whole Transcriptome Amplification for gene Expression Profiling and Development of Molecular Archives, Neoplasia, Vol 8, 153-162

Grafical and tabular display of an Agilent Bioanalyzer run. Sample 6 contains 1093 pg/ul RNA and has a RIN number of 6.1 Courtesy of Dr. Maake, University of Zurich
»Lead the way to micromanipulation«
MMI-Bibliography | 12www.molecular-machines.com
Featured PublicationsSonne, S. B., Dalgaard, D. M., Nielsen, E. J., Hoei-Hansen, E. C., Rajpert-De Meyts. E., Gjer dum, L. M., Leffers, H., (2009) | optimizing Staining Protocols for Laser Micro dissec tion of Specific Cell Types from the testis including Carcinoma In Situ, PLoS oNE, May 2009 may; vol4 (5)e5536
Sonne, S. B., Almstrup, K., Dalgaard, M., Juncker, A. S., Edsgard, D., Ruban, L., Harrison, N. .J, Schwager, C., Abdollahi, A., Huber, P. E., Brunak, S., Gjerdrum, L. M., Moore, H. D., An drews, P. W., Skakkebaek, N. E., Rajpert-De Meyts, E., Leffers, H., (2009) | Analysis of gene expression pro-files of microdissected cell populations indicates that testicular carcinoma in situ is an ar-rested gonocyte, Cancer Res. 2009 Jun 15;69(12):5241-50
The accompanying methods article to the publication in Cancer Research 2009 has been published in the open Access Journal PLoS one and provides all interested scientists with a comprehensive overview on different staining and fixation methods for fresh frozen and FFPE protocols. Almost all commercially available kits were tested and results were sum-marized according to RIN numbers measured with an Agilent pico kit. All LMD experiments were performed on an MMI CellCutplus System.
Buckanovich , R. J., Sasaroli D., o`Brien-Jenkins, A., Bothbyl, J., Conejo-Garcia, J. R., Be nen cia, F., Liotta, L. A., Gimotty, P. A. and Coukos, G. (2006) | Use of immuno-LCM to identify the in situ expression profile of cellular constituents of the tumor microenvironment Cancer Biol. Ther. 5, 635-642
A research publication leading the way to the identification of new biomarkers in the tu-mor environment by transcriptional expression profiling combining LMD with immune-LCM. A very detailed methods part with excellent pictures and explanations of all necessary ti-tration steps. An optimized immunostaining prot ocol is introduced that takes 25 min and works with a range of commercially available antibodies. Duration between LMD start of RNA extraction was 3 hours max without significant loss or degradation of RNA. In agree-ment with the findings by Sonne et al., – see above – Acetone was among the best fixa-tives for fresh frozen material.
John, H., Wlach, M., Lehmann, T., Maake, M., 2009 | Connexin45 expression in the human ob-structed detrusor muscle; World J Urol (2009) 27:411–418
A recent publication by Dr. Maakes group at the university of Zurich. For the first time this work provides molecular evidence that in patients who suffer from bladder outlet obstruc-tion due to benign prostate hyperplasia, the expression of connexin 45 can be precisely as-signed to the detrusor muscle cells, whereas connexin43 expression can be assigned to the surrounding stroma. Both tissue compartments were microdissected and analyzed by qRT-PCR separately. This work also illustrates, that particular tissue structures can be resolved and targeted by laser microdissection without any further staining of a tissue section, as shown in figure 1 of the publication
Zembutsu, H., Suzuki, Y., Sasaki, A., Tsunoda, T., okazaki, M., Yoshimoo, M., Hasegawa, T., Hirata, K., Nakamura, Y., (2008 epub ahead) | Predicting response to docetaxel neoadjuvant chemotherapy for advanced breast cancers through genome-wide expression profiling; International Journal of oncology 2009 34; 361-370
one of the first studies that integrated laser microdissection into a clinical study in order to predict breast cancer patient outcome under therapy – here with docetaxel. This group an-alyzed gene expression profiles of biopsy materials from 29 advanced breast cancers using a cDNA microarray consisting of 36,864 genes or ESTs, after enrichment of cancer cell popu-lation with the mmi CellCutplus laser microdissection system Analyzing eight PR (partial re-sponse) patients and twelve patients with SD (stable disease) or PD (progressive disease) response, the group identified dozens of genes that were expressed differently between the ‘responder (PR)’ and ‘nonresponder (SD or PD)’ groups. A selection of nine ‘predictive’ genes showing the most significant differences together with a numerical prediction scoring system that clearly separated the responder group from the non-responder group was developed.
RNA Quality control results for the studies of bladder dysfunctions, see Maake et al.,
Expression of smoothelin variants in the human detrusor
FEATURED PUBLICATIoNS
Erickson, S. H., Albert, S. P., Gillespie, W. J., Canales-Rodriguez, J., Line-han, M. W., Pinto, A. P., Chuaqui, F. R., Emmert-Buck, R. M., (2009)
Quantitative RT-PCT gene expression analysis of laser microdissected tissue samples Nat. Protoc.2009, 4, 902-922
Gao, N., Lu, M., Echeverri, F., Laita, B., Kalabar, D., Wlilliams, E. M., Hevezi, P., Zlotnik, A., Moyer, D. B., (2009)
Voltage-gated sodium channels in taste bud cells BMC Neuroscience 10:20
Ashida, S., Furihata, M., Katagiri, T., Tamu ra, K., Anazawa, Y., Yoshioka, H., Miki, T., Fujioka, T., Shuin, T., Naka mura, Y., and Nakagawa, H. (2006)
Expression of novel molecules, MICAL2-PV (MICAL2 prostate cancer variants), increases with high Gleason score and prostate cancer progression. Clin. Cancer Res. 12, 2767-2773
Ashida, S., Nakagawa, H., Katagiri, T., Furi hata, M., Iiizumi, M., Anazawa, Y., Tsunoda, T., Takata, R., Kasahara, K., Miki, T., Fujioka, T., Shuin, T., and Nakamura, Y. (2004)
Molecular features of the transition from prostatic intraepithelial neoplasia (PIN) to prostate can-cer: genome-wide gene-expression profiles of prostate cancers and PINs. Cancer Res. 64, 5963-5972
Bohm, M., Wieland, I., Schutze, K., and Rubben, H. (1997)
Microbeam MoMeNT: non-contact laser microdissection of membrane-mounted native tissue. Am. J. Pathol. 151, 63-67
Buckanovich, R. J., Sasaroli, D., o‘Brien-Jen kins, A., Botbyl, J., Conejo-Garcia, J. R., Benencia, F., Liotta, L. A., Gimotty, P. A., and Coukos, G. (2006)
Use of immuno-LCM to identify the in situ expression profile of cellular constituents of the tumor microenvironment. Cancer Biol. Ther. 5, 635-642
Buckanovich, R. J., Sasaroli, D., o‘Brien-Jenkins, A., Botbyl, J., Hammond, R., Katsaros, D., Sandaltzopou los, R., Liotta, L. A., Gimotty, P. A., and Coukos, G. (2007)
Tumor vascular proteins as biomarkers in ovarian cancer. J. Clin. oncol. 25, 852-861
Cowherd, S. M., Espina, V. A., Petricoin, E. F., III, and Liotta, L. A. (2004)
Proteomic analysis of human breast cancer tissue with laser-capture microdissection and reverse-phase protein microarrays. Clin. Breast Cancer 5, 385-392
Dahl, E., Kristiansen, G., Gottlob, K., Klaman, I., Ebner, E., Hinzmann, B., Hermann, K., Pilarsky, C., Durst, M., Klinkhammer-Schalke, M., Blaszyk, H., Knuechel, R., Hartmann, A., Rosenthal, A., and Wild, P.J. (2006)
Molecular profiling of laser-microdissected matched tumor and normal breast tissue identifies karyopherin alpha2 as a potential novel prognostic marker in breast cancer. Clin. Cancer Res. 12, 3950-3960
Espina, V., Dettloff, K. A., Cowherd, S., Petricoin, E. F., III, and Liotta, L. A. (2004)
Use of proteomic analysis to monitor responses to biological therapies. Expert. opin. Biol. Ther. 4, 83-93
Espina, V., Heiby, M., Pierobon, M., and Liotta, L. A. (2007) Laser capture microdissection technology. Expert. Rev. Mol. Diagn. 7, 647-657
Espina, V., Wulfkuhle, J. D., Calvert, V. S., VanMeter, A., Zhou, W., Coukos, G., Geho, D. H., Petricoin, E. F., III, and Liotta, L . A. (2006)
Laser-capture microdissection. Nat. Protoc. 1, 586-603
Fevr, T., Robine, S., Louvard, D., and Huelsken, J. (2007) Wnt/beta-catenin is essential for intestinal homeostasis and maintenance of intestinal stem cells. Mol. Cell Biol. 27, 7551-7559
Gjerdrum, L. M., Abrahamsen, H. N., Villegas, B., Sorensen, B. S., Schmidt, H., and Hamilton-Dutoit, S. J. (2004)
The influence of immunohistochemistry on mRNA recovery from microdissected frozen and forma-lin-fixed, paraffin-embedded sections. Diagn. Mol. Pathol. 13, 224-233
Gjerdrum, L. M. and Hamilton-Dutoit, S. (2005a) Laser-assisted microdissection of membrane-mounted sections following immunohistochemistry and in situ hybridization. Methods Mol. Biol. 293, 139-149
Gjerdrum, L.M. and Hamilton-Dutoit, S. (2005b) Laser-assisted microdissection of membrane-mounted tissue sections. Methods Mol. Biol. 293, 127-138
Gjerdrum, L. M., Lielpetere, I., Rasmussen, L. M., Bendix, K., and Hamilton-Dutoit, S. (2001)
Laser-assisted microdissection of membrane-mounted paraffin sections for polymerase chain reaction analysis: identification of cell populations using immunohistochemistry and in situ hybridization. J. Mol. Diagn. 3, 105-110
Agarwal, N., Lippmann, E. S., Shusta, E. V., (2010) Identification and expression profiling of blood-brain barrier membrane proteins, Journal of Neurochemistry 2010; 112; 625-635
Cunnea, P., McMahon, J., o`Connell, E., Mashayekhi, K., Fitzgerald, U., McQuaid, S., (2009)
Gene expression analysis of the microvascular compartment in multiple sclerosis using laser microdissected blood vessels, Acta Neuropathol 2010; 119; 601-615
Gao, N., Lu, M., Echeverri, F., Laita, B., Kalabat, D., et al., (2009) Voltage-gated sodium channels in taste bud cells, BMC Neurosci 2010; 10; 20
Gohlke, M. J., Stockton, S. P., Sieber, S., Foley, J., Portier, J., (2009) AhR-mediated gene expression in the developing mouse telencephalon Reproductive Toxicology 28, 312- 328
Harrel, C. J., Dye, W. W., Harvell, E. M. D., Sartorius, A. C., Horwitz, B. K., (2008)
Contaminating cells alter gene signatures in whole organ versus laser capture microdissected tumors: a comparison of experimental breast cancers and their lymph node metastases Clin Exp Metastasis. 2008; 25 (1): 81-8.
Hatakeyama, H., Kondo, T., Fujii, K., Nakanishi, Y., Kato, H., Fukuda, S., and Hirohashi, S. (2006)
Protein clusters associated with carcinogenesis, histological differentiation and nodal metastasis in esophageal cancer. Proteomics. 6, 6300-6316
»Lead the way to scientific references«
MMI-Bibliography | 13www.molecular-machines.com
R E F E R E N C E S
Saxena, S., Cabuy, E., Caroni, P., (2009) A role for motoneuron subtype-selective ER stress in disease manifestations of FALS mice Nat Neurosci. 2009 may; 12(5), 627-636
Hlubek, F., Brabletz, T., Budczies, J., Pfeiffer, S., Jung, A., Kirchner, T., (2007)
Heterogeneous expression of Wnt/ß-Catenin target genes within colorectal cancer Int. J. Cancer: 121, 1941-1948
Linton, K., Hey, Y.,Dibben, S., Miller, C. J., Freemont, A. J., Radford, J. A., Pepper, S. D.,(2009)
Methods comparison for high-resolution transcriptional analysis of archival material on Affymetrix Plus 2.0 and Exon 1.0 microarrays, BioTechniques 2009; 47(1); 587-596
Lassman, S., Kreutz, C., Schoepflin, A., Hopt, U., Timmer, J., Werner, M., (2009)
A novel approach for reliable microarray analysis of microdissected tumor cells from formalin-fixed and paraffin-embedded colorectal cancer resection specimens, J. Mol.Med. 2009; 87; 211-224
Li, H-R., Wang-Rodriguez, J., Murlidharan Nair, T., Yeakley, J. M., Kwon, Y-S., Bibkova, M., Zheng, C., Zhou, L., Zhang, K., Downs, T., Fu, X-D., Fan, J. B., (2006)
Two-Dimensional Transcriptome Profiling: Identification of Messenger RNA Isoform Signatures in Prostate Cancer from Archived Paraffin-Embedded Cancer Specimens, Cancer Res. 2006; april 15; 66 (8); 4079- 4088
John, H., Walch, M., Lehmann, T., Maake, C., (2009) Connexin 45 expression in the human obstructed detrusor muscle, World J Urol 2009; 27; 411-418
Hevezi, P., Moyer, B. D., Lu, M., Gao, N., White, E., et al., (2009) Genome-wide analysis of gene expression in primate taste buds reveals links to diverse processes, PLoS one (2009) 4: e6395
Jorgensen, A., Nielsen J. E., Morthorst, J. E., Bjerregaard, P., Leffers, H., (2009)
Laser capture microdissection of gonads from juvenile zebrafish; Reproductive Biology and Endocrinology 2009, 7:97 doi:10.1186/1477-7827-7-97
Romaniuk, T. L., Ueda, T., Le, N., Haile, S., Yong, T. M. K., Thomson, T., Vessella, R. L., Sadar, M. D., (2009)
Novel Bomarkers for Prostate Cancer Including Noncoding Transcripts; Am J Pathol 2009; 175; 2264-2276
Kasper, G., Vogel, A., Klaman, I., Grone, J., Petersen, I., Weber, B., Castanos-Velez, E., Staub, E., and Mennerich, D. (2005a)
The human LAPTM4b transcript is upregulated in various types of solid tumours and seems to play a dual functional role during tumour progression. Cancer Lett. 224, 93-103
Kasper, G., Weiser, A. A., Rump, A., Sparbier, K., Dahl, E., Hartmann, A., Wild, P., Schwidetzky, U., Castanos-Velez, E., and Lehmann, K. (2005b)
Expression levels of the putative zinc transporter LIV-1 are associated with a better outcome of breast cancer patients. Int. J. Cancer 117, 961-973
Kondo, T. and Hirohashi, S. (2006) Application of highly sensitive fluorescent dyes (CyDye DIGE Fluor saturation dyes) to laser micro-dissection and two-dimensional difference gel electrophoresis (2D-DIGE) for cancer proteomics. Nat. Protoc. 1, 2940-2956
Kondo, T., Seike, M., Mori, Y., Fujii, K., Yamada, T., and Hirohashi, S. (2003)
Application of sensitive fluorescent dyes in linkage of laser microdissection and two-dimensional gel electrophoresis as a cancer proteomic study tool. Proteomics. 3, 1758-1766
Kube, D. M., Savci-Heijink, C. D., Lamblin, A. F., Kosa ri, F., Vasmatzis, G., Cheville, J. C., Connelly, D. P., and Klee, G. G. (2007)
optimization of laser capture microdissection and RNA amplification for gene expression profiling of prostate cancer. BMC. Mol. Biol. 8, 25
Kumar-Sinha, C., Shah, R. B., Laxman, B., Tom lins, S. A., Harwood, J., Schmitz, W., Conzelmann, E., Sanda, M.G., Wei, J. T., Rubin, M. A., and Chinnaiyan, A. M. (2004)
Elevated alpha-methylacyl-CoA racemase enzymatic activity in prostate cancer. Am. J. Pathol. 164, 787-793
Moreno-Bueno, G., Hardisson, D., Sanchez, C.,Sarrio, D., Cassia, R., Garcia-Rostan, G., Prat, J., Guo, M., Herman, J. G., Matias-Guiu, X., Esteller, M., and Palacios, J. (2002)
Abnormalities of the APC/beta-catenin pathway in endometrial cancer. oncogene 21, 7981-7990
obama, K., Ura, K., Li, M., Katagiri, T., Tsunoda, T., Nomu ra, A., Satoh, S., Nakamura, Y., and Furukawa, Y. (2005)
Genome-wide analysis of gene expression in human intrahepatic cholangiocarcinoma. Hepatology 41, 1339-1348
orimo, T., ojima, o., HIraoka, N., Saito, S., Kosuge, T., Kakisaka, T., Yokoo, H., Nakanshi, K., Karniyama, T., Todo, S., Hirohashi, S., Kondo, T. ( 2008)
Proteomic Profiling Reveals the Prognostic Value of Adenomatous Polyposis Coli-End-Binding Protein 1 in Hepatocellular Carcinoma Journal of Hepatology in press
Pugh, T. J., Bebb, G., Barclay, L., Sutcliffe, M., Fee, J., Salski, C., o‘Connor, R., Ho, C., Murray, N., Melosky, B., English, J., Vielkind, J., Horsman, D., Laskin, J. J. and Marra, M. A. (2007)
Correlations of EGFR mutations and increases in EGFR and HER2 copy number to gefitinib response in a retrospective analysis of lung cancer patients. BMC. Cancer 7, 128
Sanchez-Aguilera, A., Delgado, J., Camacho, F. I., Sanchez-Beato, M., Sanchez, L., Montalban, C., Fres no, M. F., Martin, C., Piris, M. A., and Garcia, J. F. (2004)
Silencing of the p18INK4c gene by promoter hypermethylation in Reed-Sternberg cells in Hodgkin lymphomas. Blood 103, 2351-2357
Scarpino, S., Cancellario, d. F., Di, N. A., Pasquini, A., Marzullo, A., and Ruco, L . P. (2004a)
Increased expression of Met protein is associated with up-regulation of hypoxia inducible factor-1 (HIF-1) in tumour cells in papillary carcinoma of the thyroid. J. Pathol. 202, 352-358
Scarpino, S., Di, N. A., Melotti, F., Talerico, C., Cancrini, A., and Ruco, L. (2007a)
Papillary carcinoma of the thyroid: low expression of NCAM (CD56) is associated with downregula-tion of VEGF-D production by tumour cells. J. Pathol. 212, 411-419
Hlubek, F., Schuster, C., Budczies, J., Kirchner, T., (2010) Robust microRNA expression profiling of specific cells in complex archival tissue stained by immunohistochemistry Abstract at AACR 2010 and paper in submitted.
»Lead the way to scientific references«
R E F E R E N C E S
MMI-Bibliography | 14www.molecular-machines.com

Sonne, S. B., Dalgaard, D. M., Nielsen, E. J., Hoei-Hansen, E. C., Rajpert-De Meyts. E., Gjerdum, L. M., Leffers, H., (2009)
optimizing Staining Protocols for Laser Microdissection of Specific Cell Types from the testis including Carcinoma In Situ PLoS oNE, May 2009 may; vol4 (5)e5536
Sonne, S. B., Almstrup, K., Dalgaard, M., Juncker, A.S., Edsgard ,D., Ruban, L., Harrison, N.J., Schwager ,C., Abdollahi, A., Huber, P. E., Brunak, S., Gjerdrum, L. M., Moore, H. D., Andrews, P. W., Skakkebaek, N. E., Rajpert-De Meyts, E., Leffers, H., (2009)
Analysis of gene expression profiles of microdissected cell populations indicates that testicular carcinoma in situ is an arrested gonocyte Cancer Res. 2009 Jun 15;69(12):5241-50
Tanney, A., & Kennedy, R. D. (2010) Developing mRNA based biomarkers from formalin-fixed paraffin-embedded tissue, Personalized Medicine 2010; 7(2); 205-211
Wu, M., Han, L., Shi, Y., Xu, G., Wei, J., You, L., Chen, Y., Zhu, T., Li, S., Meng, L., Lu, Y., Zhou, J., Wang, S., Ma, D., (2009)
Development and characterization of a novel method for the analysis of gene expression patterns in lymphatic endothelial cells derived from primary breast tissues, J Cancer Res Clin oncol 2009; (doi:10.1007/s00432-009-0727-9) published online november 2009
Zembutsu, H., Suzuki, Y., Sasaki, A., Tsunoda, T., okazaki, M., Yoshi-moo, M., Hasegawa, T., Hirata, K., Nakamura, Y., (2008 epub ahead)
Predicting response to docetaxel neoadjuvant chemotherapy for advanced breast cancers through genome-wide expression profiling; International Journal of oncology 2009 34; 361-370
... to be continued.
Scarpino, S., Di, N. A., Rapazzotti-onelli, M., Pilozzi, E., and Ruco, L. (2004b)
Papillary carcinoma of the thyroid: methylation is not involved in the regulation of MET expression. Br. J. Cancer 91, 703-706
Scarpino, S., Di, N. A., Stoppacciaro, A., Anto nelli, M., Pilozzi, E., Chiarle, R., Palestro, G., Marino, M., Facciolo, F., Rendina, E. A., Webster, K. E., Kinkel, S. A., Scott, H. S., and Ruco, L. (2007b)
Expression of autoimmune regulator gene (AIRE) and T regulatory cells in human thymomas. Clin. Exp. Immunol. 149, 504-512
Scarpino, S., Di, N. A., Taraboletti, G., Cancrini, A., and Ruco, L . P. (2005)
Hepatocyte growth factor (HGF) downregulates thrombospondin 1 (TSP-1) expression in thyroid papillary carcinoma cells. J. Pathol. 205, 50-56
Schipper, H., Papp, T., Johnen, G., Pemsel, H., Bastrop, R., Muller, K. M., Wiethege, T., Jaworska, M., Krismann, M., Schiffmann, D., and Rahman, Q. (2003)
Mutational analysis of the nf2 tumour suppressor gene in three subtypes of primary human malignant mesotheliomas. Int. J. oncol. 22, 1009-1017
Takata, R., Katagiri, T., Kanehira, M., Tsunoda, T., Shuin, T., Miki, T., Namiki, M., Kohri, K., Matsu shita, Y., Fujioka, T., and Nakamura, Y. (2005)
Predicting response to methotrexate, vinblastine, doxorubicin, and cisplatin neoadjuvant chemo-therapy for bladder cancers through genome-wide gene expression profiling. Clin. Cancer Res. 11, 2625-2636
Tamura, K., Furihata, M., Tsunoda, T., Ashida, S., Takata, R., obara, W., Yoshioka, H., Daigo, Y., Nasu, Y., Kumon, H., Konaka, H., Namiki, M., Tozawa, K., Kohri, K., Tanji, N., Yoko yama, M., Shimazui, T., Akaza, H., Mizutani, Y., Miki, T., Fujioka, T., Shuin, T., Nakamura, Y., and Nakagawa, H. (2007)
Molecular features of hormone-refractory prostate cancer cells by genome-wide gene expression profiles. Cancer Res. 67, 5117-5125
Tomlins, S. A., Mehra, R., Rhodes, D. R., Cao, X., Wang, L., Dhana-seka ran, S. M., Kalyana-Sundaram, S., Wei, J. T., Rubin, M. vA., Pienta, K. J., Shah, R.vB., and Chinnaiyan, A. M. (2007)
Integrative molecular concept modeling of prostate cancer progression. Nat. Genet. 39, 41-51
Tomlins, S. A., Mehra, R., Rhodes, D. R., Shah, R. B., Rubin, M. A., Bruening, E., Makarov, V., and Chinnaiyan, A. M. (2006)
Whole transcriptome amplification for gene expression profiling and development of molecular archives. Neoplasia. 8, 153-162
Tveito, S., Maelandsmo, G. M., Hoifodt, H. K., Rasmussen, H., and Fodstad, o. (2007)
Specific isolation of disseminated cancer cells: a new method permitting sensitive detection of target molecules of diagnostic and therapeutic value. Clin. Exp. Metastasis 24, 317-327
Wang, L. and Zhu, H. (2006) Clonal analysis of palmar fibromatosis: a study whether palmar fibromatosis is a real tumor. J. Transl. Med. 4, 21
Yamabuki, T., Daigo, Y., Kato, T., Hayama, S., Tsu noda, T., Miyamoto, M., Ito, T., Fujita, M., Hoso kawa, M., Kondo, S., and Nakamura, Y. (2006)
Genome-wide gene expression profile analysis of esophageal squamous cell carcinomas. Int. J. oncol. 28, 1375-1384
Zhang, L., Yang, N., Conejo-Garcia, J. R., Katsa ros, D., Mohamed-Hadley, A., Fracchioli, S., Schlien ger, K., Toll, A., Levine, B., Rubin, S. C., and Coukos, G. (2003a)
Expression of endocrine gland-derived vascular endothelial growth factor in ovarian carcinoma. Clin. Cancer Res. 9, 264-272
Zhang, L., Yang, N., Park, J.W., Katsaros, D., Fracchioli, S., Cao, G., o‘Brien-Jenkins, A., Randall, T. C., Rubin, S. C., and Coukos, G. (2003b)
Tumor-derived vascular endothelial growth factor up-regulates angiopoietin-2 in host endothelium and destabilizes host vasculature, supporting angiogenesis in ovarian cancer. Cancer Res. 63, 3403-3412
MMI-Bibliography | 15www.molecular-machines.com
»Lead the way to scientific references«
R E F E R E N C E S
The manufacturer reserves the right to make technical changes without prior notice. August 2010
MMI GmbH
Breslauer Strasse 2
85386 Eching, Germany
Phone : +49 89 319 048 40
Fax : +49 89 319 048 59
Mail : [email protected]
www.molecular-machines.com
MMI Inc.
P.o. Box 348
Haslett, MI 48840, USA
Phone: +1 603 629 95 36
Fax: +1 321 978 0304
Mail: [email protected]
www.molecular-machines.com
MMI AG
Flughofstrasse 37
8152 Glattbrugg, Switzerland
Phone: +41 44 809 10 10
Fax: +41 44 809 10 11
Mail: [email protected]
www.molecular-machines.com
SPECIFICATIoNS
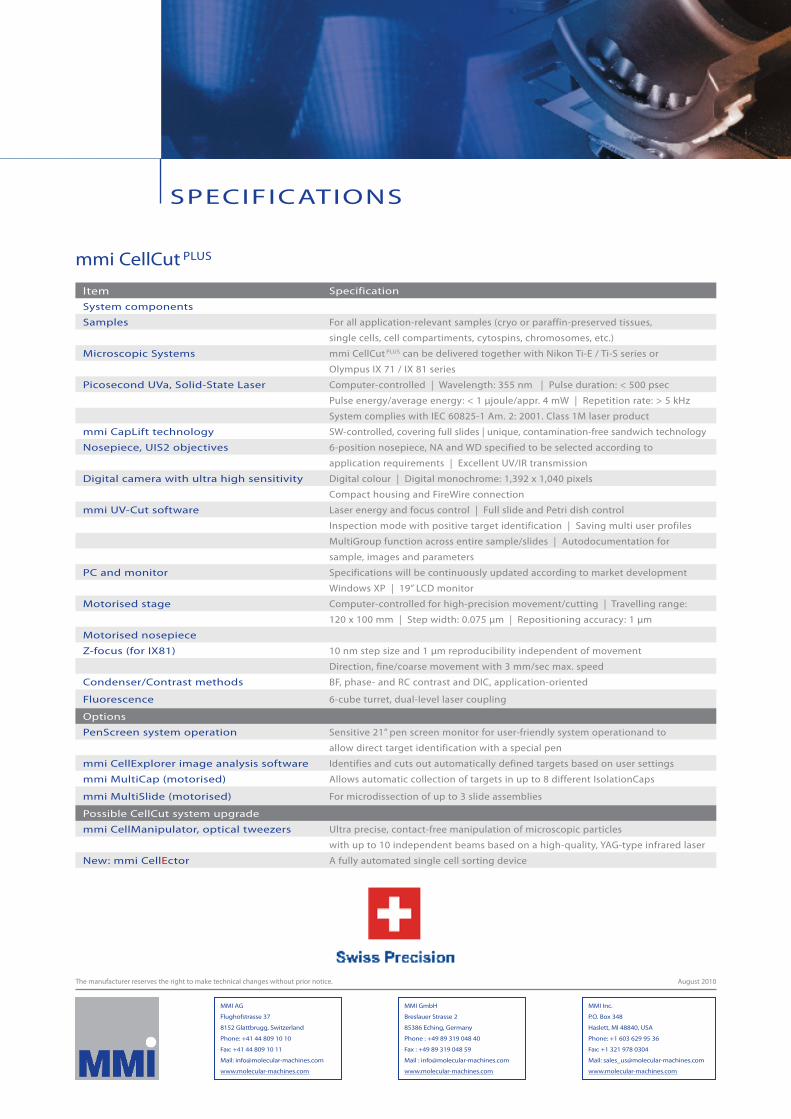
mmi CellCut PLUS
Item Specification
System components
Samples For all application-relevant samples (cryo or paraffin-preserved tissues,
single cells, cell compartiments, cytospins, chromosomes, etc.)
Microscopic Systems mmi CellCut PLUS can be delivered together with Nikon Ti-E / Ti-S series or
olympus IX 71 / IX 81 series
Picosecond UVa, Solid-State Laser Computer-controlled | Wavelength: 355 nm | Pulse duration: < 500 psec
Pulse energy/average energy: < 1 μjoule/appr. 4 mW | Repetition rate: > 5 kHz
System complies with IEC 60825-1 Am. 2: 2001. Class 1M laser product
mmi CapLift technology SW-controlled, covering full slides | unique, contamination-free sandwich technology
Nosepiece, UIS2 objectives 6-position nosepiece, NA and WD specified to be selected according to
application requirements | Excellent UV/IR transmission
Digital camera with ultra high sensitivity Digital colour | Digital monochrome: 1,392 x 1,040 pixels
Compact housing and FireWire connection
mmi UV-Cut software Laser energy and focus control | Full slide and Petri dish control
Inspection mode with positive target identification | Saving multi user profiles
MultiGroup function across entire sample/slides | Auto documentation for
sample, images and parameters
PC and monitor Specifications will be continuously updated according to market development
Windows XP | 19” LCD monitor
Motorised stage Computer-controlled for high-precision movement/cutting | Travelling range:
120 x 100 mm | Step width: 0.075 μm | Repositioning accuracy: 1 μm
Motorised nosepiece
Z-focus (for IX81) 10 nm step size and 1 μm reproducibility independent of movement
Direction, fine/coarse movement with 3 mm/sec max. speed
Condenser/Contrast methods BF, phase- and RC contrast and DIC, application-oriented
Fluorescence 6-cube turret, dual-level laser coupling
options
PenScreen system operation Sensitive 21” pen screen monitor for user-friendly system operationand to
allow direct target identification with a special pen
mmi CellExplorer image analysis software Identifies and cuts out automatically defined targets based on user settings
mmi MultiCap (motorised) Allows automatic collection of targets in up to 8 different IsolationCaps
mmi MultiSlide (motorised) For microdissection of up to 3 slide assemblies
Possible CellCut system upgrade
mmi CellManipulator, optical tweezers Ultra precise, contact-free manipulation of microscopic particles
with up to 10 independent beams based on a high-quality, YAG-type infrared laser
New: mmi CellEctor A fully automated single cell sorting device