biaxial dielectrophoresis force spectroscopy: article a...
TRANSCRIPT

Biaxial Dielectrophoresis Force Spectroscopy:A Stoichiometric Approach for ExaminingIntermolecular Weak Binding InteractionsIn Soo Park,†,▼ Tae Joon Kwak,‡,▼ Gyudo Lee,§ Myeonggu Son,† Jeong Woo Choi,† Seungyeop Choi,†
Kihwan Nam,∥ Sei-Young Lee,† Woo-Jin Chang,‡ Kilho Eom,⊥ Dae Sung Yoon,# Sangyoup Lee,∥,¶
Rashid Bashir,△ and Sang Woo Lee*,†
†Department of Biomedical Engineering, Yonsei University, Wonju 220-710, Korea‡Mechanical Engineering Department, University of WisconsinMilwaukee, Milwaukee, Wisconsin 53211, United States§T.H. Chan School of Public Health, Harvard University, Boston, Massachusetts 02115, United States∥Biomedical Research Institute, Korea Institute of Science and Technology, Seoul 136-791, Korea⊥Biomechanics Laboratory, College of Sport Science, Sungkyunkwan University, Suwon 440-746, Korea#Department of Bio-convergence Engineering, Korea University, Seoul 136-703, Korea¶Department of Biomedical Engineering, University of Science and Technology, Daejeon 305-350, Korea△Department of Bioengineering, Micro and Nanotechnology Laboratory, University of Illinois at UrbanaChampaign Champaign,Illinois 61801, United States
*S Supporting Information
ABSTRACT: The direct quantification of weak intermo-lecular binding interactions is very important for manyapplications in biology and medicine. Techniques that canbe used to investigate such interactions under a controlledenvironment, while varying different parameters such asloading rate, pulling direction, rupture event measurements,and the use of different functionalized probes, are stilllacking. Herein, we demonstrate a biaxial dielectrophoresisforce spectroscopy (BDFS) method that can be used toinvestigate weak unbinding events in a high-throughput manner under controlled environments and by varying the pullingdirection (i.e., transverse and/or vertical axes) as well as the loading rate. With the BDFS system, we can quantitativelyanalyze binding interactions related to hydrogen bonding or ionic attractions between functionalized microbeads and asurface within a microfluidic device. Our BDFS system allowed for the characterization of the number of bonds involved inan interaction, bond affinity, kinetic rates, and energy barrier heights and widths from different regimes of the energylandscape.
KEYWORDS: dielectrophoresis force spectroscopy, intermolecular weak binding interactions, energy landscape, microfluidic device,pulling direction
Noncovalent weak molecular interactions includinghydrogen bonds, van der Waals forces, electrostaticattraction/repulsion, and hydrophobic interactions
play an essential role in a wide range of biological processesranging from molecular recognition to cell motility.1 Quantify-ing these weak binding forces involved in molecularinteractions can yield fundamental information that can explainhow molecular interactions occur and their interplay with eachother in biochemical processes. For a decade, force spectros-copy (FS), for example, fluorescent resonance energy transfer,2
atomic force microscopy,3,4 optical tweezers,5,6 and magnetictweezers,7 has enabled quantitative understanding of molecular
interactions including DNA/RNA interactions, methylation,8
ligand−receptor binding affinity on cell surfaces,9,10 and proteinfolding/unfolding.11−13 In general, FS methods need more thanseveral hundred measurements for statistical analysis of theensemble average of physical quantities such as forces and end-to-end distances.13 For instance, the ensemble average of forcesrequired for protein unfolding has to be measured underdifferent pulling regimes ranging from the quasi-equilibrium to
Received: August 24, 2015Accepted: March 3, 2016
Artic
lewww.acsnano.org
© XXXX American Chemical Society A DOI: 10.1021/acsnano.5b05286ACS Nano XXXX, XXX, XXX−XXX

non-equilibrium state. As such, an ensemble average providesinformation with regard to the free energy landscape of weakbinding interactions.14,15 Furthermore, rupture forces andenergy landscapes can vary due to slight changes inexperimental conditions such as pulling directions,16−18 loadingrates,19,20 temperatures,21 and stiffness constant (defined asΔF/Δx) of the force probe.16−22 Considerable progress hasalso been made in investigating the rupture force and energylandscape pathway mechanism for each condition.16−22
However, there is no method to examine the rupture forceand energy landscape of weak binding interactions byperturbing the free energy landscape with more than onevariable (e.g., loading rate and pulling direction at the sametime) under the same environment, as these variables can haveindividual as well as combined effects which are very importanttoward understanding biological processes in living systems.Recently, we have developed a new force spectroscopy
measurement approach called dielectrophoretic (DEP) tweez-ers, where hundreds of polymeric microbeads are used asprobes to measure intermolecular binding forces.23−25 This is apromising technique due to the low cost of microfluidic chips,simple operating procedures, and the high precision measure-ment of intermolecular forces. Since this measurementtechnique can apply loading rates that can vary from thequasi-equilibrium state (extremely low loading rate) to the non-equilibrium state (high loading rate), energy landscapes of acertain ligand−receptor interaction can be investigated bymeasuring high-throughput unbinding events simultaneouslywith a wide range of loading rates.25 However, the DEPtweezers approach reported before allows only an examination
of intermolecular forces in the vertical direction (and hencecould be termed “vertical DEP force spectroscopy”, VDFS) anddid not examine the force interactions when the loading andpulling is in the horizontal or transverse direction.As force interaction measurements are important to measure
in both vertical and horizontal directions (parallel andtransverse directions to the molecular orientations), here wereport the development of a biaxial DEP force spectroscopy(BDFS) method, which can be used to investigate the ruptureforce of noncovalent interactions between single functionalgroups through “lateral” and “vertical” movement of microbe-ads used as probes in microfluidic devices. We show that lateralDEP force spectroscopy (termed LDFS) can examineintermolecular forces as the microbeads are moved along theelectrode, where the magnitude of DEP force is graduallydecreased from the edge to the center of the electrode. Thismeans that a loading rate gradient is formed naturally in thelateral direction. Using our new biaxial DEP force spectroscopymeasurement, both vertical (VDFS) and lateral (LDFS) loadingcan also be applied sequentially under the same exactconditions. We first demonstrated the high-throughputmeasurement of hydrogen bond and ionic interaction betweensingle functionalized group as a model inside a microfluidicdevice, by sequentially applying the two different pullingdirections as well as different loading rates. From thisdemonstration, we observed that bond numbers involved inthe rupture event, bond affinity, and dissociation rate of theweak intermolecular interactions depend on pulling directionsas well as loading rates. Our approach can be used to gain abetter understanding of the effect of the pulling direction and
Figure 1. Concept of the BDFS system. (a) Schematic illustration of BDFS. (b−g) Time-lapse optical images exhibit how BDFS works as acombination of LDFS and VDFS. Ten micrometer polystyrene microbeads are aligned on the edge of the electrode by positive DEP forceacting on the beads by applying 50 Vp‑p at 1 kHz and are moved toward the center of the electrode by LDFS and stopped at a certain positionon the electrode with the application of 27 Vp‑p AC with 1 MHz (negative DEP force acting on the beads) (b−d), used for LDFS. When themagnitude of the applied AC increases to 35 Vp‑p, the microbeads are aligned at the center of electrode (e). As the magnitude is increased, themicrobeads are levitated (f,g), used for VDFS. The scale bar is 40 μm, and the time interval is 20 s. (h) Simulation results depict electric fieldintensity at the IDT electrode in a microfluidic chip. For negative DEP forces on the overall IDT electrode, microbeads are aligned at thecenter of electrode by lateral DEP forces and are trapped and levitated simultaneously by the vertical DEP force.
ACS Nano Article
DOI: 10.1021/acsnano.5b05286ACS Nano XXXX, XXX, XXX−XXX
B

loading rate on intermolecular interactions with regard tomechanical and chemical kinetics.
RESULTSObservation of Bead Behavior in the BDFS System.
First, the movement of 10 μm polystyrene microbeads coatedwith carboxyl or amino functional groups on carboxyl-functionalized silicon dioxide surfaces was observed by applyingDEP forces. These forces were generated via the introductionof AC signals to interdigitated (IDT) electrodes locatedbeneath the silicon dioxide layer. Before the AC signal wasapplied, interaction between the beads and the functionalizedoxide surface occurred with hydrogen bonds (carboxyl-terminated beads and carboxyl-terminated surfaces at pH 4)or electrical attractions (amino-terminated beads and carboxyl-terminated surfaces at pH 7). van der Waals interactionsbetween the beads and the functionalized surface wereneglected, indicating that the bond force is much smallerthan the hydrogen and ionic bond force. Additionally,hydrophobic interactions could be also ignored because, eventhough the polystyrene beads may be hydrophobic, the oxidesurface is hydrophilic (Supporting Figure S1).24,25 Figure 1apresents a schematic diagram of the measurement system, inwhich an AC signal was applied to the electrode (see alsoSupporting Movie M1). The beads were aligned on the edge ofthe electrode, which is the position that starts a lateralmovement, by positive DEP force acting on the beads (Figure1b). Since the beads should not be moved vertically from thefunctionalized surface but be moved laterally through thesurface by the negative DEP force, we carefully controlled themagnitude of the applied voltage. As a result, the beads on thefunctionalized silicon dioxide substrate were moved laterallytoward the center of the electrode and stopped at a certainposition on the surface (Figure 1b−d). The beads weresequentially aligned at the center of the electrodes (Figure 1e)and were moved upward from the silicon dioxide surface(Figure 1f,g). These observations were also verified via thegrayscale measurement method that we reported in a priorstudy (see also Supporting Figure S2).25 In order to investigatethe lateral movement of the bead, the motion of each bead wasclosely observed, and we found that the beads rolled across thefunctionalized silicon dioxide surface when lateral movementswere initiated via the lateral DEP force (Supporting Figure S3).Finite Element Analysis Based Simulation. To
quantitatively characterize the lateral and vertical movementof the beads, a finite element analysis (FEA) based simulation
was performed (a detailed description of the simulation methodcan be found in Materials and Methods and Supporting NoteN1 and Figure S5). Figure 2a represents the DEP force actingon a bead as a function of its position on the electrode. TheDEP force was greater in the lateral direction than in thevertical direction (between 5 and 35 μm), as shown in Figure2a. The bead was mainly controlled by lateral DEP forces untilit reached the center of the electrode (Figure 1b−e)(Supporting Figure S2). Moreover, the DEP force in thevertical direction was insufficient to move the bead upwardeven after breaking the intermolecular interactions between thebead and the surface during the rolling of the beads across theelectrodes.
Measurement of Physical Quantities Correspondingto Weak Binding Interaction Forces in BDFS. We exploredthe characteristics of hydrogen bonds and ionic bindinginteractions with the BDFS method as the concentration ofcarboxyl functional groups on the silicon dioxide surface wasvaried in conjunction with the magnitude of the applied voltageon the electrode located beneath the substrate surface. First,carboxyl-functionalized polystyrene beads (10 μm) werealigned with the edges of the electrodes, which were coveredby the carboxyl-functionalized oxide surface in a microfluidicchip. The beads and oxide surface interacted via hydrogenbonding. Subsequently, when voltages were applied at 1 MHz,the beads that were at the edges began to move toward thecenter of the electrode and stopped at a certain positionbetween the edge and the center of the electrode (e.g., Figure1b−d). These voltages were 27, 70, and 100 Vp‑p,corresponding to the concentrations of 5, 10, and 50 mM ofcarboxyl groups used to functionalize the substrate surfaces,respectively. Furthermore, the velocity and the stoppingposition of the beads was calculated from imaging of theirmovement, as shown in Figure 2b. The microbeads stopped atdifferent locations of the electrode depending on the density ofthe functional group. The stopping positions were 25.8 ± 0.64,26.4 ± 1.29, and 30.71 ± 0.51 μm, corresponding to the threecarboxyl concentrations, respectively (see Supporting Note N2for the detailed method used to measure the stop positions).Voltages applied to align the beads at the center of theelectrodes (e.g., Figure 1e) were further increased to 35, 105,and 126 Vp‑p, respectively. Sequentially, the hydrogen bondrupture conditions as measured via vertical DEP forces (e.g.,Figure 1f,g) were 42, 123, and 134 Vp‑p, respectively, accordingto grayscale measurement data, as shown in Figure 2c.
Figure 2. Finite element analysis of BDFS, lateral movement displacement, and grayscale height variation graph. (a) Parallel plot of simulatedvertical and lateral dielectrophoresis forces at 5 μm heights from the edge of the electrode to the center as 100 Vp‑p was applied. (b,c)Hydrogen interaction between carboxyl-terminated beads and the carboxyl-functionalized oxide surface at pH 4 with 5, 10, and 50 mMconcentrations. Scale bar (inset) is 20 μm. (b) Lateral movement velocity graph as a function of electrode position for LDFS as the appliedvoltages were 27, 70, and 100 Vp‑p. (c) Grayscale height variation graph as a function of applied voltage for VDFS.
ACS Nano Article
DOI: 10.1021/acsnano.5b05286ACS Nano XXXX, XXX, XXX−XXX
C

Additionally, the ionic binding interactions were alsoexamined via amino-functionalized beads and carboxyl-functionalized silicon dioxide surfaces using the sameprocedures described above. The voltages required to makethe beads move from the edge to the center before stopping ata certain position were 55, 145, and 175 Vp‑p at the surfacefunctional group concentrations of 5, 10, and 50 mM,respectively. As seen in Figure 2c, after the beads were alignedto the center of the electrode, the voltages necessary to ruptureionic binding interactions were measured to be 89, 218, and246 Vp‑p. The microbeads were also observed to stop atdifferent locations of the electrode at 23.6 ± 0.88, 26.8 ± 0.82,and 29 ± 0.67 μm, respectively (Supporting Figure S6).Multifunctional Probe Array in BDFS. Herein, we
observed the lateral movement of more than hundreds ofcarboxyl-coated beads or amino-coated beads at the same timeby applying lateral DEP forces in a microfluidic device.Sequentially, the vertical movements of these beads were alsoobserved under the same environment in the microfluidicdevice as the applied voltage was varied. Furthermore, toremove the force loading effect in each measurement system
when rupture occurred, the loading rate of the LDFS systemclosely matched that of the VDFS system as much as possible(see Supporting Note N3 for a detailed description of loadingrates). Figure 3a reveals the distribution of stop positionsmeasured by LDFS at different concentrations of surfacefunctionalization when hydrogen-bond-mediated interactionsoccurred between carboxyl-coated beads and the carboxyl-functionalized surface. The voltages were measured todetermine the rupture force of the hydrogen-bond-mediatedinteraction by VDFS, as shown in Figure 3b of the sequence.Moreover, Figure 3c,d also describes the stop positions andvoltages at which rupture occurred as measured by BDFS,corresponding with the ionic binding interactions betweenamino-coated beads and the carboxyl-functionalized silicondioxide surface.
DISCUSSIONIn order to study the binding interactions between the beadsand functionalized surfaces, we developed a sequential lateraland vertical movement method within the LDFS/VDFSmeasurement system. Figure 4a describes the schematic
Figure 3. Histogram graph representing the number of the functionalized beads as a function of stop position and rupture voltage. (a,b)Hydrogen interaction between carboxyl-terminated beads and the carboxyl-functionalized oxide surface at pH 4 with 5, 10, and 50 mMconcentrations: (a) stop position for LDFS; (b) rupture voltage for VDFS. (c,d) Electrostatic attraction (ionic) bond between amino-terminated beads and the carboxyl-functionalized oxide surface at pH 7 with 1, 5, 10, and 50 mM concentrations: (c) stop position for LDFS;(d) rupture voltage for VDFS.
ACS Nano Article
DOI: 10.1021/acsnano.5b05286ACS Nano XXXX, XXX, XXX−XXX
D

diagram during lateral movement of the beads for thedeveloped method. During the lateral movement, the followingrelationship exists, FLDEP > Fdrag + Ff_kinetic + Ftorque, where FLDEPis the lateral DEP force, Fdrag is Stokes’ drag force as a functionof bead velocity, Ff_kinetic is the kinetic friction force that consistsof weak binding interaction forces between the functionalizedbeads and functionalized surfaces, and Ftorque is torque forcethat can be generated by shear force and surface adhesionrelated to the wall effect as the beads move on the surface. Asshown in Figure 2a, as the beads approached the center of theelectrode, the lateral DEP force was also reduced, resulting in avelocity decrease for the bead (e.g., Figure 2b). This lead to areduced Stokes’ velocity for the bead. Hence, when the beadstopped at a certain position, the Stokes’ drag force and torquewere zero (see Supporting Note N4 for detailed description),and Ff_kinetic became the static friction force (Ff_static). Hence thelateral DEP force exerted on the bead was equivalent to theweak binding interactions present at the stop position. Usingthese experimental results, and by calculating the DEP force viaFEA based simulations, we can extract the weak bindinginteraction forces under investigation. Figure 4c,e shows theextracted force graphs which depend on the concentration offunctional groups on the substrate surface using the LDFS
method. In the VDFS system presented in Figure 4b, thefollowing relationship exists as the functionalized beads areseparated from the functionalized surface, FVDEP = Ff_static +Fgravity, where FVDEP is the vertical DEP force and Fgravity is thegravitational force on the bead. Since the effect of gravity(∼10−13 N) is negligible compared to the weak bindingforces,24 the rupture forces of both interactions using measureddata from the VDFS method is represented in Figure 4d,f.25
Interestingly, we found that the mean forces required to rupturethe bonds in VDFS are always slightly higher than those inLDFS even though the experimental conditions of both systemswere identical.To further explore this phenomenon, we investigated the
relationship between the force-pulling directions and weakbinding interactions by using Poisson statistical analysis methodwith the experimental data in Figure 4. Using the Poissonstatistical analysis method (a detailed description of theanalytical method can be found in Materials and Methods),the specific number of bonds within the contact area can beextracted from the mean forces and standard deviations in theexperimental results (Figure 4 inset tables). The differencebetween the calculated specific number of bonds in the LDFSand VDFS systems may have originated from differences in
Figure 4. (a,b) Schematic illustration of the BDFS system model: (a) LDFS system when the functionalized bead is moved along thefunctionalized surface on the electrode; (b) schematic illustration of the VDFS system model when the functionalized bead is levitated on theelectrode. (c-f) Histogram and Gaussian fitting graphs as a function of rupture force, rupturing the weak binding interactions as theconcentration is varied, and the mean rupture force and standard deviation (insets): (c) hydrogen interaction in the LDFS system; (d)hydrogen interaction in the VDFS system; (e) ionic interaction in the LDFS system; (f) ionic interaction in the VDFS system. Themeasurement consistency of the BDFS system was also validated by applying the different magnitude of the applied AC signal (see SupportingFigure S7).
ACS Nano Article
DOI: 10.1021/acsnano.5b05286ACS Nano XXXX, XXX, XXX−XXX
E
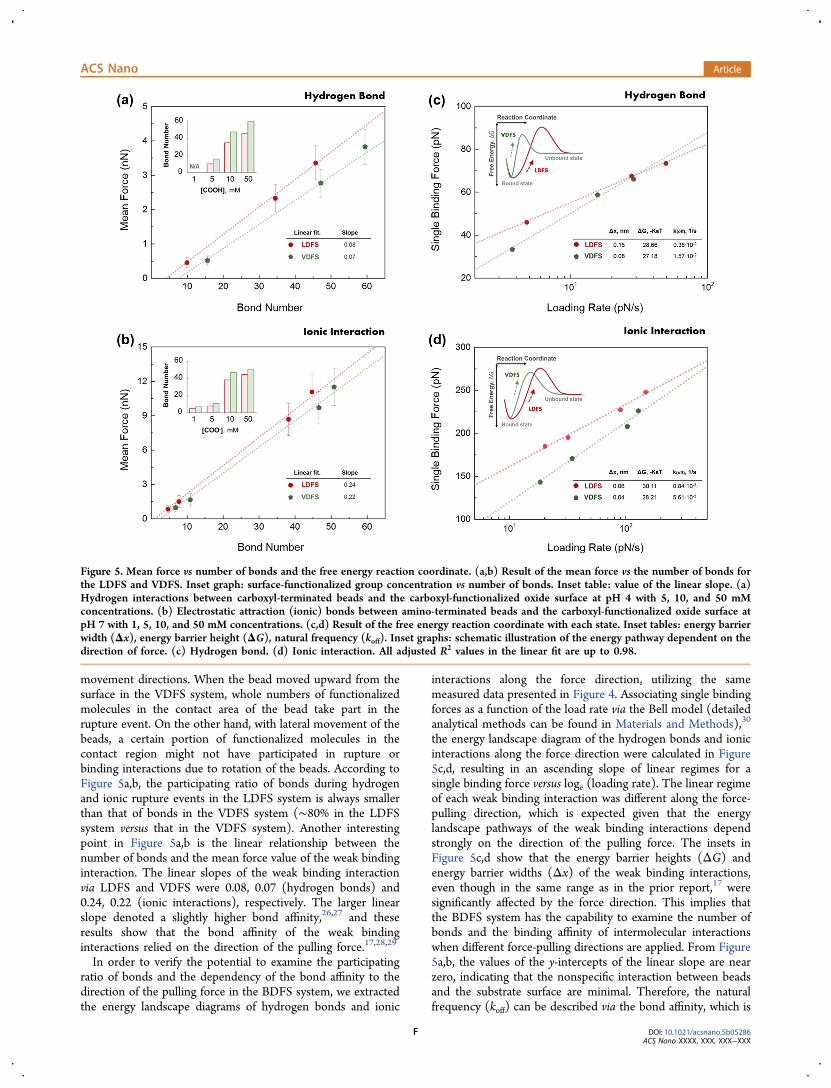
movement directions. When the bead moved upward from thesurface in the VDFS system, whole numbers of functionalizedmolecules in the contact area of the bead take part in therupture event. On the other hand, with lateral movement of thebeads, a certain portion of functionalized molecules in thecontact region might not have participated in rupture orbinding interactions due to rotation of the beads. According toFigure 5a,b, the participating ratio of bonds during hydrogenand ionic rupture events in the LDFS system is always smallerthan that of bonds in the VDFS system (∼80% in the LDFSsystem versus that in the VDFS system). Another interestingpoint in Figure 5a,b is the linear relationship between thenumber of bonds and the mean force value of the weak bindinginteraction. The linear slopes of the weak binding interactionvia LDFS and VDFS were 0.08, 0.07 (hydrogen bonds) and0.24, 0.22 (ionic interactions), respectively. The larger linearslope denoted a slightly higher bond affinity,26,27 and theseresults show that the bond affinity of the weak bindinginteractions relied on the direction of the pulling force.17,28,29
In order to verify the potential to examine the participatingratio of bonds and the dependency of the bond affinity to thedirection of the pulling force in the BDFS system, we extractedthe energy landscape diagrams of hydrogen bonds and ionic
interactions along the force direction, utilizing the samemeasured data presented in Figure 4. Associating single bindingforces as a function of the load rate via the Bell model (detailedanalytical methods can be found in Materials and Methods),30
the energy landscape diagram of the hydrogen bonds and ionicinteractions along the force direction were calculated in Figure5c,d, resulting in an ascending slope of linear regimes for asingle binding force versus loge (loading rate). The linear regimeof each weak binding interaction was different along the force-pulling direction, which is expected given that the energylandscape pathways of the weak binding interactions dependstrongly on the direction of the pulling force. The insets inFigure 5c,d show that the energy barrier heights (ΔG) andenergy barrier widths (Δx) of the weak binding interactions,even though in the same range as in the prior report,17 weresignificantly affected by the force direction. This implies thatthe BDFS system has the capability to examine the number ofbonds and the binding affinity of intermolecular interactionswhen different force-pulling directions are applied. From Figure5a,b, the values of the y-intercepts of the linear slope are nearzero, indicating that the nonspecific interaction between beadsand the substrate surface are minimal. Therefore, the naturalfrequency (koff) can be described via the bond affinity, which is
Figure 5. Mean force vs number of bonds and the free energy reaction coordinate. (a,b) Result of the mean force vs the number of bonds forthe LDFS and VDFS. Inset graph: surface-functionalized group concentration vs number of bonds. Inset table: value of the linear slope. (a)Hydrogen interactions between carboxyl-terminated beads and the carboxyl-functionalized oxide surface at pH 4 with 5, 10, and 50 mMconcentrations. (b) Electrostatic attraction (ionic) bonds between amino-terminated beads and the carboxyl-functionalized oxide surface atpH 7 with 1, 5, 10, and 50 mM concentrations. (c,d) Result of the free energy reaction coordinate with each state. Inset tables: energy barrierwidth (Δx), energy barrier height (ΔG), natural frequency (koff). Inset graphs: schematic illustration of the energy pathway dependent on thedirection of force. (c) Hydrogen bond. (d) Ionic interaction. All adjusted R2 values in the linear fit are up to 0.98.
ACS Nano Article
DOI: 10.1021/acsnano.5b05286ACS Nano XXXX, XXX, XXX−XXX
F

related to the dissociation rate during a bond rupture event.The natural frequencies of hydrogen and ionic interactions inLDFS are 0.36 × 10⁻² and 0.84 × 10⁻³ (1/s), which are incontrast with the values of 1.57 × 10⁻² and 5.61 × 10⁻³ (1/s)for VDFS, as shown in the insets of Figure 5c,d. This showsthat small dissociation rates in bond rupture events correspondwith large bond affinities. Moreover, the energy landscapes aretilted to lower energy barriers via the force-pulling direction (inVDFS), indicating that the probability of bond survival islowered while bond dissociation is accelerated.26,27 This trendis similar to the previous description that bond affinitycorresponded with the number of bonds (Figure 5a,b).
CONCLUSIONIn conclusion, we reported the application of a biaxialdielectrophoretic force spectroscopy method, which combinedlateral dielectrophoretic force spectroscopy with verticaldielectrophoretic spectroscopy within a microfluidic device. Inthe LDFS system, the lateral movements of functionalizedbeads across a substrate surface due to rotation was used toinvestigate weak binding interactions, whereas the VDFSsystem used vertical movements to examine the particularinteractions. Using this system, we measured hydrogen andionic interactions as a model system, with various pullingdirections and loading rates, to rupture the binding interactionsbetween carboxyl- or amino-functionalized beads and carboxyl-functionalized silicon dioxide surfaces under the same environ-ment. From the measured data, it was observed that thedifference of bond numbers participating in the rupture eventsis about 20% lower in the lateral direction versus that in thevertical pulling directions. Moreover, the slope in the LDFSsystem, which was extracted from the linear relationshipbetween the number of bonds and the mean rupture force ofthe weak binding interaction, was greater than what wasmeasured for the VDFS system, denoting a higher bond affinityin the lateral pulling direction. Lastly, energy barrier widths andheights were calculated from the measured data in the BDFSsystem in conjunction with the Bell model, resulting in averification of the existence of different energy pathwaysdenoted by the pulling direction. The dissociation rates of theweak binding interactions extracted from the Bell model andmeasured data also confirmed the existence of 4−6 times higherbond affinities in the lateral pulling direction. Using themethods in this study provided deeper insight and a betterunderstanding of characteristics such as the number of bondsparticipating in an interaction, bond affinities, free energylandscapes, and association/dissociation rates as well asproviding a demonstration of the simplicity and power of thistool for use in the investigation of weak binding interactions.
MATERIALS AND METHODSMicrochip Fabrication. An interdigitated electrode array pattern
was prepared on an oxidized silicon wafer through the lift-off process,where each electrode line was 80 μm wide with a 40 μm gap. A 0.1 μmthick chromium layer was deposited via thermal evaporation andsubsequently patterned using a lift-off process. The metal electrodeswere shielded with a 0.8 μm thick plasma-enhanced chemical vapordeposited silicon dioxide. The electrode contact pads weresubsequently prepared via wet etching processes to apply voltage tothe IDT array (Supporting Note N5).Preparation of the Carboxyl-Terminated Oxide Surface
Layers. The IDT electrode shielded by an oxide layer was immersedinto a solution consisting of H2SO4/H2O2 (3:7), resulting in theformation of a hydroxyl-functionalized substrate (SiO2−OH). The
hydroxyl-functionalized substrate was discretely placed into a 1, 5, 10,and 50 mM solution of 3-aminopropyltriethoxysilane (A3648, Sigma-Aldrich, St. Louis, MO, USA) solution in ethanol for 80 min, resultingin an amino-functionalized substrate (SiO2−NH2). This amino-functionalized substrate was immersed in 0.1 M succinic anhydride(239690, Sigma-Aldrich) in DMF (N,N-dimethylformamide,D158550, Sigma-Aldrich) for 24 h. The chip with carboxyl-functionalgroups on its surface (SiO2−COOH) was washed with DMF and DIwater and dehydrated with nitrogen gas31 (see Supporting Note N6for detailed density quantification of the surface functional group).
Functionalization of Microbeads. Functionalized polystyrenemicrobeads (carboxyl-terminated beads and amino-terminated mi-crobeads) used in the experiments were purchased from SpherotechInc. (Libertyville, IL, USA), and the original stock solution containingthe microbeads contained PBS buffer (pH 7.4) stabilized with 0.02%sodium azide. For the experiments, the stock solutions were dilutedwith DI water as follows: 1.8 mL of DI water + 15 μL of the 10 μmbead stock solution. After dilution, the concentration of beads in thediluted solution was ∼5 × 10⁵ particles/mL.
Experimental Setup. The silicon dioxide surface inside the chipwas functionalized using each molecule. A PDMS (polydimethylsilox-ane) layer was used to form an open reservoir above the chip.Commercially available functionalized polystyrene beads suspended inDI water were poured into the reservoir. Next, a cover glass slide wasused to cover the top of PDMS reservoir. For high-voltageapplications, a sinusoidal signal at 1 kHz to 1 MHz with 0−300 Vpeak-to-peak voltages was applied to the chip using an amplifier(WMA-300, Falco Systems, Amsterdam, The Netherlands) that wasalready interconnected to the function generator. The amplitude andfrequency of the signal generated by the function generator or theamplifier was rechecked with an oscilloscope (WaveRunner 6050,LeCroy, New York, NY, USA) for the confirmation. By applying thesinusoidal signal at various voltage levels and loads, movement of thebeads was observed and recorded with top-view microscopes, whichwere connected to high-speed CCD cameras (Motion Scope M3,Redlake, San Diego, CA, USA) with Frame-Grabber (Xcelera-CL PX4Dual, Teledyne DALSA, Co., Waterloo, ON, Canada), simultaneously.Images were acquired at 1−100 frame/s for each experimentalcondition, and bead movement was tracked via ImageJ software (NIH,USA) with a particle tracker and detector plug-in.32
Method for Converting Applied Voltage to DEP Force inEarlier Papers. The total DEP force is given by
∑
∑πε
ε εε ε
= −∇
= −+ !! ! ! !
∂ Φ∂ ∂ ∂
=+ −
+ +
∞
+
+ + =
⎡⎣⎢⎢
⎤⎦⎥⎥
F U
UK r
n i j k x y z
Kn n
n n
,
2(2 1)
1,
(2 1)( )
( 1)
n
nm n
n
i j k n
n
i j k
np m
p m
total0
(2 1) 2
(1)
where n is the force order, Φ refers to the electrostatic potential of theexternal electric field, and Kn is the nth-order Clausius−Mossottifactor.23−25,33 Based on this equation, the total DEP force wascalculated from a custom-built code run on MATLAB (2010a,Mathworks, USA). The electrical field profiles for the IDT electrodesused in the experiment, when the AC signal with 1 V to 300 Vp‑p and 1kHz to 1 MHz was applied to the electrodes, were generated from afinite element program (v3.5a, COMSOL Multiphysics) with a gridspacing of 0.2 μm. The experimental parameters and the generatedelectric field data were used as inputs for the MATLAB code.Consequently, the DEP force could be calculated depending on theapplied voltage. It should be noted that the effect of electrothermalforces generated by the applied voltage can be neglected in the system(see Supporting Note N7). Hence, we only consider the DEP forceacting on the functionalized beads when the voltage is applied into thesystem.
Calculation of the Gravitational Force on the Beads in theSystem. The formula for calculating the force of gravity may be
ACS Nano Article
DOI: 10.1021/acsnano.5b05286ACS Nano XXXX, XXX, XXX−XXX
G

written as π ρ ρ−r g( )p m43
3 ), where r (5 μm) is the radius of the bead,
ρp (1.03 × 10³ kg/m3) and ρm (1 × 10³ kg/m3) are the densities of thebead and media, and g (9.8 m/s2) is the gravitational accelerationconstant. As a result, the gravitational force on the microbeads is about∼0.1 pN.Method for Calculating an Individual Bond Using Poisson
Statistics. Bond formation between a microbead and the substratesurface should vary with measurement conditions such as moleculardensity, contact area, and so on. The Poisson statistical method is ableto minimize the difference between the measured conditions andextracts the binding strength of the individual. For Poisson statisticalanalysis, it is assumed that the individual bond is discrete randomvariables and the rupture force between the surface and the probe isthe sum of the binding of the individual. According to previousreports, these assumptions are considered to be reasonable.34,35
Poisson distribution is the probability of observing a random sample ofn discrete events (i.e., n events to cause the rupture of an individualbond), and the rupture force should vary as a Poisson distribution withthe following mean (m) and variance (σ2):
σ= =m nF nFand 2 (2)
where F and n are the binding force of each of the stationary contactareas and the number of individual bonds, respectively. Then, theindividual binding force can be described as
σ=Fm
2
(3)
Estimating Energy Barrier Height and Width Based onKinetic theory. The Arrhenius equation ΔG = −kBT·ln(koff/kA) wasused to analyze the energy barrier height, ΔG, where koff denotes thenatural frequency, kB is the Boltzmann constant, T is the absolutetemperature, and kA is the Arrhenius frequency factor (in noncovalentinteractions, kA = ∼109 s−1).17 Slopes of linear regimes for singlebinding forces versus logarithmic loading rates reflect the energybarrier. Based on Bell theory, Fs = (kBT/Δx)·ln((Δx/rf)/(koffkBT)),the logarithmic x-intercept denotes the natural frequency, koff, andeach slope represents the force scale f = kBT/Δx, where Fs, Δx, and rfare the single binding force, energy barrier width, and loading rate,respectively.17,30
ASSOCIATED CONTENT*S Supporting InformationThe Supporting Information is available free of charge on theACS Publications website at DOI: 10.1021/acsnano.5b05286.
Additional figures, experimental details, and moviedescriptions (PDF)Movie M1 (AVI)Movie M2 (AVI)Movie M3 (AVI)
AUTHOR INFORMATIONCorresponding Author*E-mail: [email protected] Contributions▼I.S.P. and T.J.K. contributed equally to this work.NotesThe authors declare no competing financial interest.
ACKNOWLEDGMENTSThis research was supported by Basic Science ResearchProgram through the National Research Foundation of Korea(NRF) funded by the Ministry of Science, ICT & FutureP l a nn i n g (NRF -2013R1A2A2A03005767 , NRF -2013R1A1A2053613), Republic of Korea, and by the Yonsei
University Future-leading Research Initiative of 2015 (2015-22-0059).
REFERENCES(1) Bustamante, C.; Chemla, Y. R.; Forde, N. R.; Izhaky, D.Mechanical Processes in Biochemistry. Annu. Rev. Biochem. 2004, 73,705−748.(2) Wang, X.; Ha, T. Defining Single Molecular Forces Required toActivate Integrin and Notch Signaling. Science 2013, 340, 991−994.(3) Bustamante, C.; Rivetti, C.; Keller, D. J. Scanning ForceMicroscopy under Aqueous Solutions. Curr. Opin. Struct. Biol. 1997, 7,709−716.(4) Ros, R.; Schwesinger, F.; Anselmetti, D.; Kubon, M.; Schafer, R.;Pluckthun, A.; Tiefenauer, L. Antigen Binding Forces of IndividuallyAddressed Single-Chain Fv Antibody Molecules. Proc. Natl. Acad. Sci.U. S. A. 1998, 95, 7402−7405.(5) Liang, M. N.; Smith, S. P.; Metallo, S. J.; Choi, I. S.; Prentiss, M.;Whitesides, G. M. Measuring the Forces Involved in PolyvalentAdhesion of Uropathogenic Escherichia Coli to Mannose-PresentingSurfaces. Proc. Natl. Acad. Sci. U. S. A. 2000, 97, 13092−13096.(6) Moffitt, J. R.; Chemla, Y. R.; Izhaky, D.; Bustamante, C.Differential Detection of Dual Traps Improves the Spatial Resolutionof Optical Tweezers. Proc. Natl. Acad. Sci. U. S. A. 2006, 103, 9006−9011.(7) Gosse, C.; Croquette, V. Magnetic tweezers: Micromanipulationand Force Measurement at the Molecular Level. Biophys. J. 2002, 82,3314−3329.(8) Zhu, R.; Howorka, S.; Proll, J.; Kienberger, F.; Preiner, J.; Hesse,J.; Ebner, A.; Pastushenko, V. P.; Gruber, H. J.; Hinterdorfer, P.Nanomechanical Recognition Measurements of Individual DNAMolecules Reveal Epigenetic Methylation Patterns. Nat. Nanotechnol.2010, 5, 788−791.(9) Bell, G. Models for the Specific Adhesion of Cells to Cells. Science1978, 200, 618−627.(10) McEver, R. P.; Zhu, C. Rolling Cell Adhesion. Annu. Rev. CellDev. Biol. 2010, 26, 363−396.(11) Rief, M.; Gautel, M.; Oesterhelt, F.; Fernandez, J. M.; Gaub, H.E. Reversible Unfolding of Individual Titin Immunoglobulin Domainsby AFM. Science 1997, 276, 1109−1112.(12) Eom, K.; Makarov, D. E.; Rodin, G. J. Theoretical Studies of theKinetics of Mechanical Unfolding of Cross-Linked Polymer Chainsand Their Implications for Single-Molecule Pulling Experiments. Phys.Rev. E 2005, 71, 021904.(13) Borgia, A.; Williams, P. M.; Clarke, J. Single-Molecule Studies ofProtein Folding. Annu. Rev. Biochem. 2008, 77, 101−125.(14) Zlatanova, J.; Lindsay, S. M.; Leuba, S. H. Single Molecule ForceSpectroscopy in Biology using the Atomic Force Microscope. Prog.Biophys. Mol. Biol. 2000, 74, 37−61.(15) Greenleaf, W. J.; Woodside, M. T.; Block, S. M. High-Resolution, Single-Molecule Measurements of Biomolecular Motion.Annu. Rev. Biophys. Biomol. Struct. 2007, 36, 171−190.(16) Williams, P. M. Analytical Descriptions of Dynamic ForceSpectroscopy: Behavior of Multiple Connections. Anal. Chim. Acta2003, 479, 107−115.(17) Dietz, H.; Berkemeier, F.; Bertz, M.; Rief, M. AnisotropicDeformation Response of Single Protein Molecules. Proc. Natl. Acad.Sci. U. S. A. 2006, 103, 12724−12728.(18) Carrion-Vazquez, M.; Li, H.; Lu, H.; Marszalek, P. E.;Oberhauser, A. F.; Fernandez, J. M. The Mechanical Stability ofUbiquitin is Linkage Dependent. Nat. Struct. Biol. 2003, 10, 738−743.(19) Best, R. B.; Paci, E.; Hummer, G.; Dudko, O. K. PullingDirection as a Reaction Coordinate for the Mechanical Unfolding ofSingle Molecules. J. Phys. Chem. B 2008, 112, 5968−5976.(20) Mickler, M.; Dima, R. I.; Dietz, H.; Hyeon, C.; Thirumalai, D.;Rief, M. Revealing the Bifurcation in the Unfolding Pathways of GFPby Using Single-Molecule Experiments and Simulations. Proc. Natl.Acad. Sci. U. S. A. 2007, 104, 20268−20273.(21) Rico, F.; Moy, V. T. Energy Landscape Roughness of theStreptavidin-Biotin Interaction. J. Mol. Recognit. 2007, 20, 495−501.
ACS Nano Article
DOI: 10.1021/acsnano.5b05286ACS Nano XXXX, XXX, XXX−XXX
H

(22) Maitra, A.; Arya, G. Model Accounting for the Effects of Pulling-Device Stiffness in the Analyses of Single-Molecule Force Measure-ments. Phys. Rev. Lett. 2010, 104, 108301.(23) Lee, S. W.; Li, H.; Bashir, R. Dielectrophoretic Tweezers forExamining Particle-Surface Interactions within Microfluidic Devices.Appl. Phys. Lett. 2007, 90, 223902.(24) Baek, S. H.; Chang, W. J.; Baek, J. Y.; Yoon, D. S.; Bashir, R.;Lee, S. W. Dielectrophoretic Technique for Measurement of Chemicaland Biological Interactions. Anal. Chem. 2009, 81, 7737−7742.(25) Park, I. S.; Eom, K.; Son, J.; Chang, W. J.; Park, K.; Kwon, T.;Yoon, D. S.; Bashir, R.; Lee, S. W. Microfluidic Multifunctional ProbeArray Dielectrophoretic Force Spectroscopy with Wide Loading Rates.ACS Nano 2012, 6, 8665−8673.(26) Kuo, S. C.; Lauffenburger, D. A. Relationship betweenReceptor/Ligand Binding Affinity and Adhesion Strength. Biophys. J.1993, 65, 2191−2200.(27) Cozens-Roberts, C.; Quinn, J. A.; Lauffenberger, D. A.Receptor-Mediated Adhesion Phenomena. Model Studies with theRadical-Flow Detachment Assay. Biophys. J. 1990, 58, 107−125.(28) Rajesh, R.; Giri, D.; Jensen, I.; Kumar, S. Role of PullingDirection in Understanding the Energy Landscape of Proteins. Phys.Rev. E 2008, 78, 021905.(29) Guinn, E. J.; Jagannathan, B.; Marqusee, S. Single-MoleculeChemo-Mechanical Unfolding Reveals Multiple Transition StateBarriers in a Small Single-Domain Protein. Nat. Commun. 2015, 6,6861.(30) Merkel, R.; Nassoy, P.; Leung, A.; Ritchie, K.; Evans, E. EnergyLandscapes of Receptor−Ligand Bonds Explored with Dynamic ForceSpectroscopy. Nature 1999, 397, 50−53.(31) An, Y.; Chen, M.; Xue, Q.; Liu, W. Preparation and Self-Assembly of Carboxylic Acid-Functionalized silica. J. Colloid InterfaceSci. 2007, 311, 507−513.(32) Feng, Y.; Goree, J.; Liu, B. Accurate Particle PositionMeasurement from Images. Rev. Sci. Instrum. 2007, 78, 053704.(33) Jones, T. B. Basic Theory of Dielectrophoresis and Electro-rotation. Engin. in Med. Bio. Mag. 2003, 22, 33−42.(34) Williams, J. M.; Han, T.; Beebe, T. P., Jr. Determination ofSingle-Bond Forces from Contact Force Variances in Atomic ForceMicroscopy. Langmuir 1996, 12, 1291−1295.(35) Wenzler, L. A.; Moyes, G. L.; Olson, L. G.; Harris, J. M.; Beebe,T. P., Jr. Single-Molecule Bond-Rupture Force Analysis of Interactionsbetween AFM Tips and Substrates Modified with Organosilanes. Anal.Chem. 1997, 69, 2855−2861.
ACS Nano Article
DOI: 10.1021/acsnano.5b05286ACS Nano XXXX, XXX, XXX−XXX
I