bi 4.1 quick start guide
TRANSCRIPT

BI 4.1 Quick Start Guide

2 Version 0.5
BI 4.1 Quick Start Guide ................................................................................................................................ 1
Introduction .............................................................................................................................................. 4
Logging in .................................................................................................................................................. 4
Home Screen ............................................................................................................................................. 5
Documents ................................................................................................................................................ 6
Preferences ............................................................................................................................................... 8
Setting Up Preferences to Display Public Folders ................................................................................... 10
Web Intelligence ..................................................................................................................................... 11
Create a New Web Intelligence Document............................................................................................. 12
Query Properties ..................................................................................................................................... 14
Opening a Web Intelligence Report in View Mode ................................................................................ 15
Menu bar in Reading Tab ........................................................................................................................ 16
Menu Bar in Design Tab .......................................................................................................................... 16
Opening a Web Intelligence Report in Modify Mode ............................................................................. 17
More about the Design Tab .................................................................................................................... 17
Table .................................................................................................................................................... 18
Heading ............................................................................................................................................... 18
Report Elements.................................................................................................................................. 18
Formatting........................................................................................................................................... 18
Data Access ......................................................................................................................................... 19
Analysis ............................................................................................................................................... 19
Page Set up.......................................................................................................................................... 19
Customising Reports ............................................................................................................................... 19
Tables .................................................................................................................................................. 19
Adding object names .......................................................................................................................... 20
Adding Totals ...................................................................................................................................... 21
**New Functionality** - Copying Tables ............................................................................................ 21
**New Functionality** - Formulas ..................................................................................................... 21
**New Functionality** - in User Response Prompts ......................................................................... 22
**New Functionality** - Hiding Dimensions ..................................................................................... 22
3 Version 0.5
**New Functionality** - Charts .......................................................................................................... 23
**New Functionality** - Fold/Unfold ................................................................................................. 23
**New Functionality** - Group Function ........................................................................................... 24
Training and Further Guidance ............................................................................................................... 25
Appendix 1: Differences Between HTML and Applet (Java) Mode ......................................................... 26
Appendix 2: Client Specification and Browser/Java/OS Support ............................................................ 27
4 Version 0.5
Introduction This document provides a brief overview of the new Business Intelligence 4.1 application to help users get started with it. It is a living document and will continue to be updated as feedback is received from users.
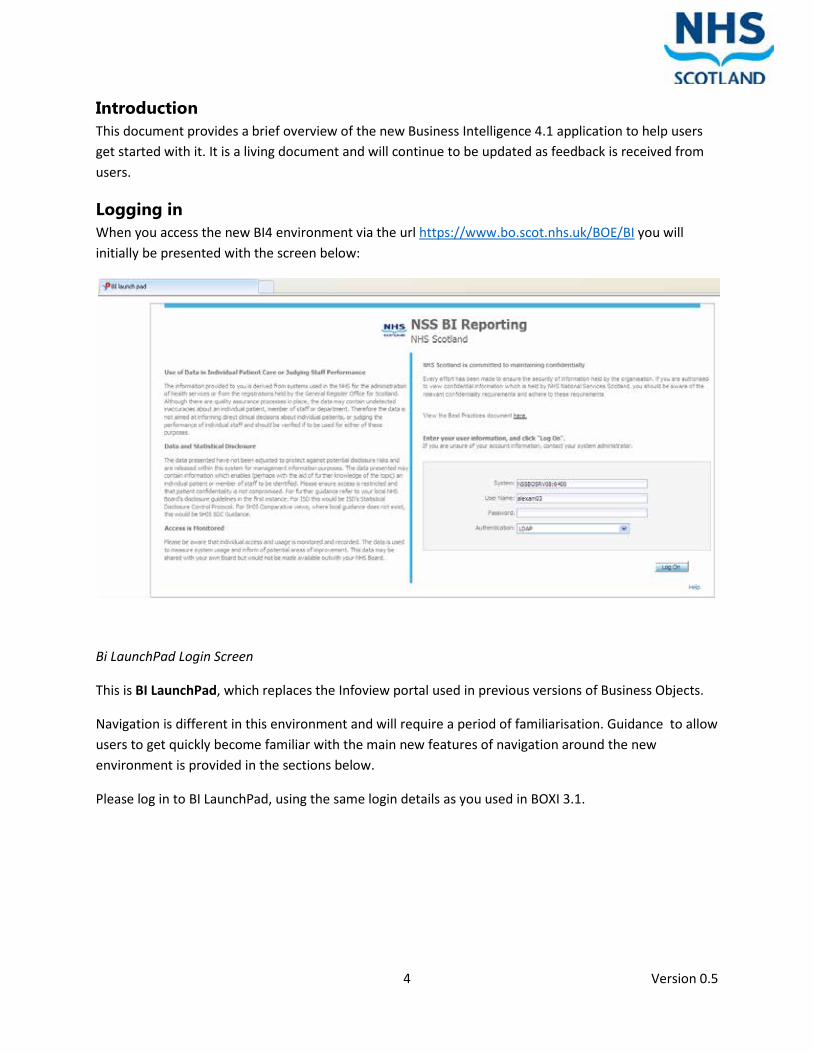
Logging in When you access the new BI4 environment via the url https://www.bo.scot.nhs.uk/BOE/BI you will initially be presented with the screen below:
Bi LaunchPad Login Screen
This is BI LaunchPad, which replaces the Infoview portal used in previous versions of Business Objects.
Navigation is different in this environment and will require a period of familiarisation. Guidance to allow users to get quickly become familiar with the main new features of navigation around the new environment is provided in the sections below.
Please log in to BI LaunchPad, using the same login details as you used in BOXI 3.1.

5 Version 0.5
Home Screen Once you have logged in you will be presented with the Home screen, shown below. You will notice that it is now possible to directly access your recently viewed and run reports via the My Recently User Documents and My Recently Run Documents panels. The Web Intelligence application, used to create and edit reports, can also be opened from this screen, as indicated. The Documents and Preferences options are indicated in red since they are covered in greater detail in the next two sections.
Home Tab

6 Version 0.5
Documents Select the Documents tab as shown in the Home Screen screenshot above and as indicated below:
You will be presented with something similar to the screen below. Although similar in appearance to BOXI 3.1 there are two main differences to be aware of in this screen:
• in order to view Public Folders you need to click on the area indicated by “Access Public Folders here” in the Documents Tab screenshot .
• In order to access Web Intelligence to create or edit a report, first of all select Applications, then Web Intelligence and once the application opens choose the new document icon as shown in Web Intelligence Tab screenshot.
Documents Tab
7 Version 0.5
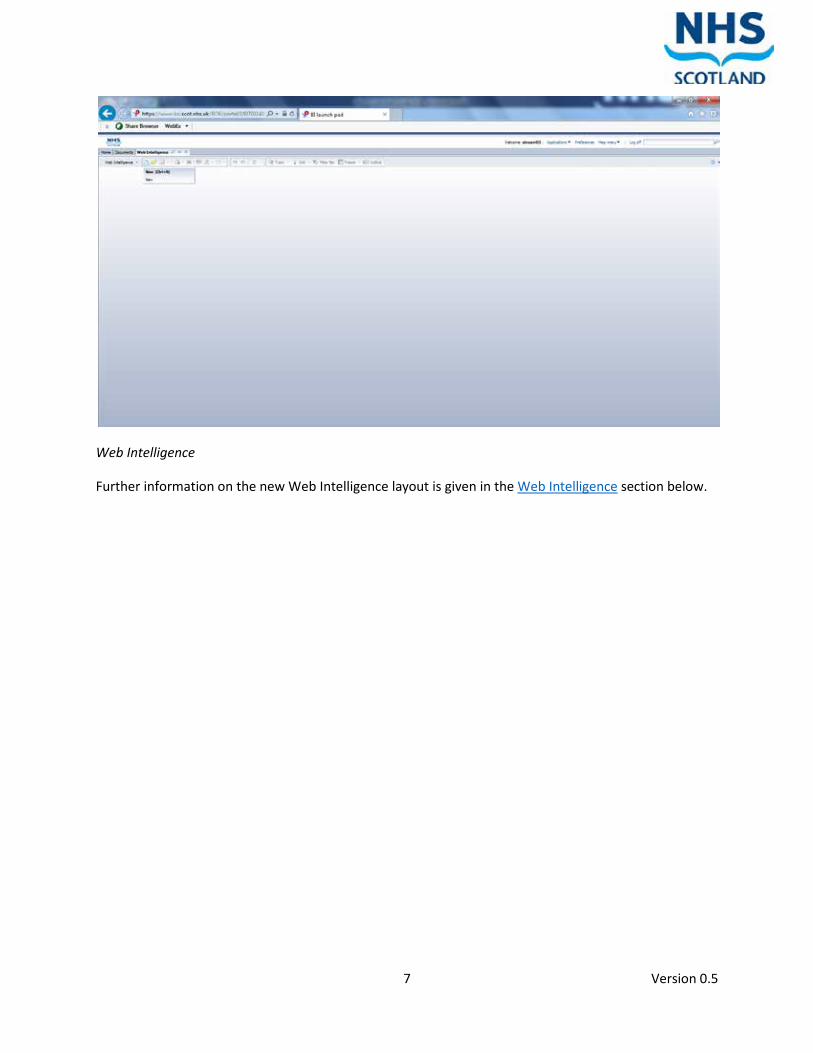
Web Intelligence
Further information on the new Web Intelligence layout is given in the Web Intelligence section below.
8 Version 0.5
Preferences
As with BOXI 3.1 there are two different modes for viewing and modifying reports, HTML and Applet (Java) mode. We strongly recommend that you use HTML mode by default and switch to Applet mode only if absolutely necessary. HTML offers a lightweight, stable fast viewing and development interface when compared with Java. It is also the only interface with a Wizard that allows you to easily link documents via hyperlinks. However, Java has a number of features that HTML does not. Most report developers will rarely use these additional features and those who just view and refresh reports don’t need to use Java at all. The main differences between Java and HTML are detailed in Appendix 1 below.
Almost all of the screenshots in this document have been created using HTML mode. For information on using the Applet (Java) please see links in the section: Further Information
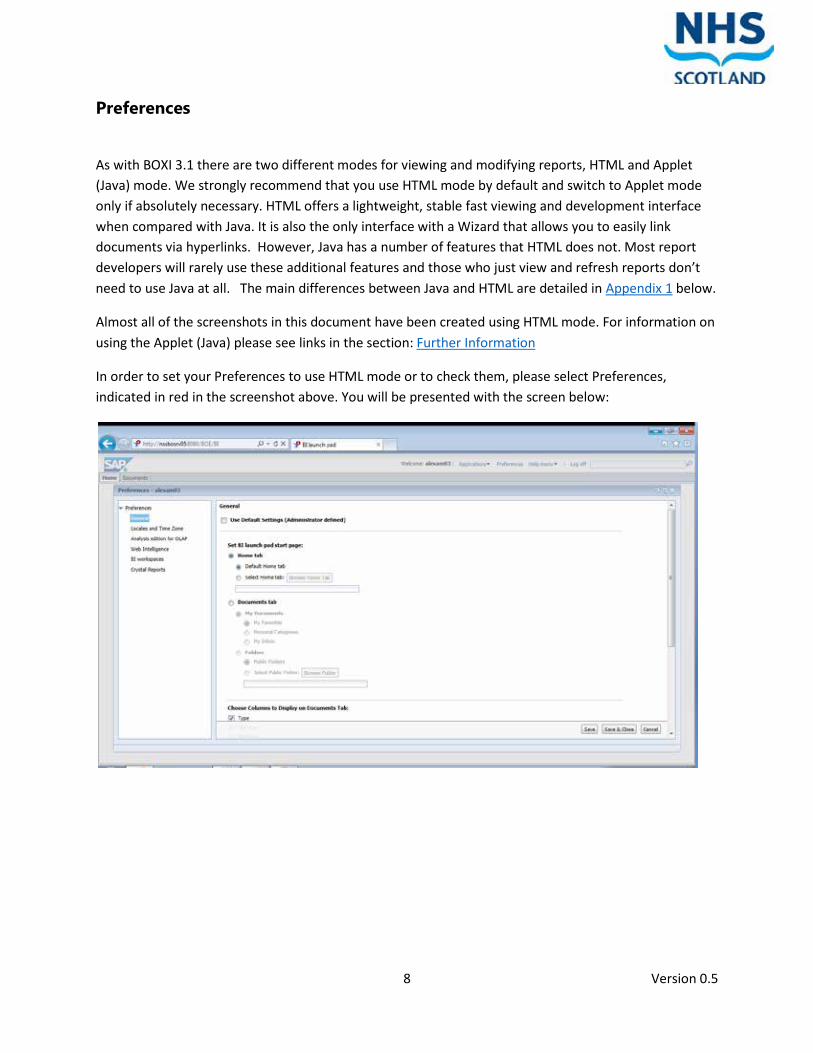
In order to set your Preferences to use HTML mode or to check them, please select Preferences, indicated in red in the screenshot above. You will be presented with the screen below:
9 Version 0.5
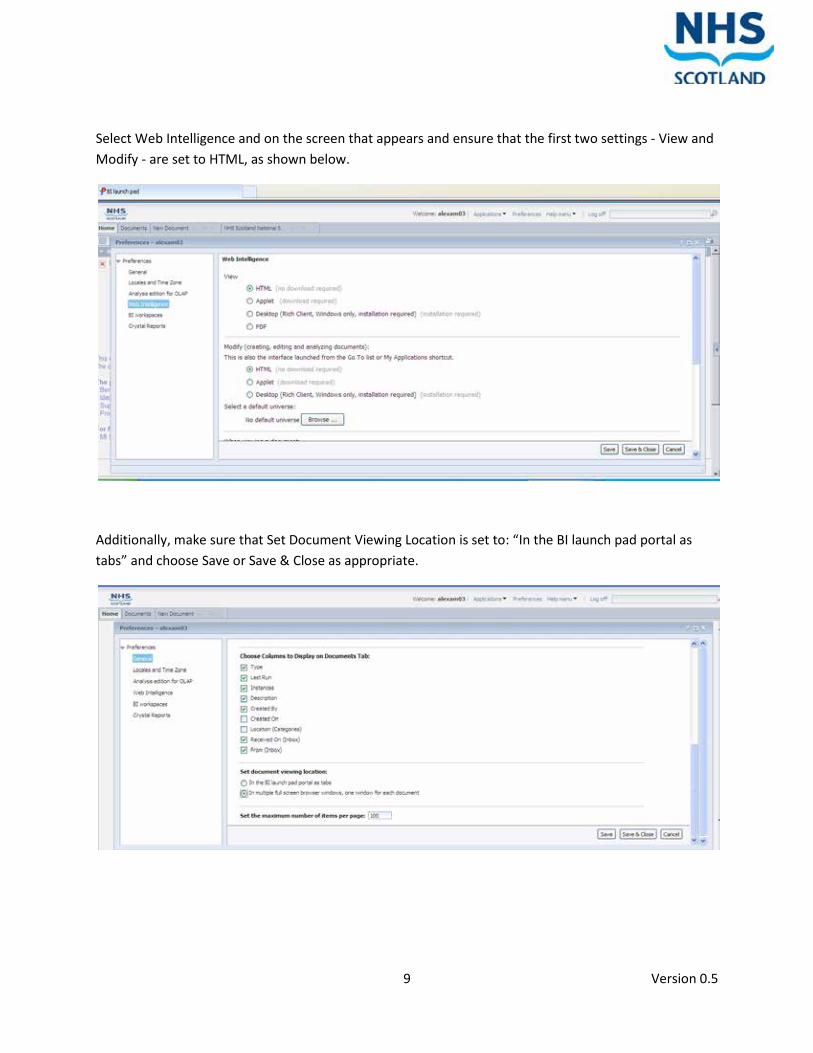
Select Web Intelligence and on the screen that appears and ensure that the first two settings - View and Modify - are set to HTML, as shown below.
Additionally, make sure that Set Document Viewing Location is set to: “In the BI launch pad portal as tabs” and choose Save or Save & Close as appropriate.

10 Version 0.5
Setting Up Preferences to Display Public Folders If your preference is to initially be presented with Public Folders rather than My Favourites whenever you access the Documents tab, you can set up access to a particular folder in Preferences, as shown in the screenshot below:
11 Version 0.5
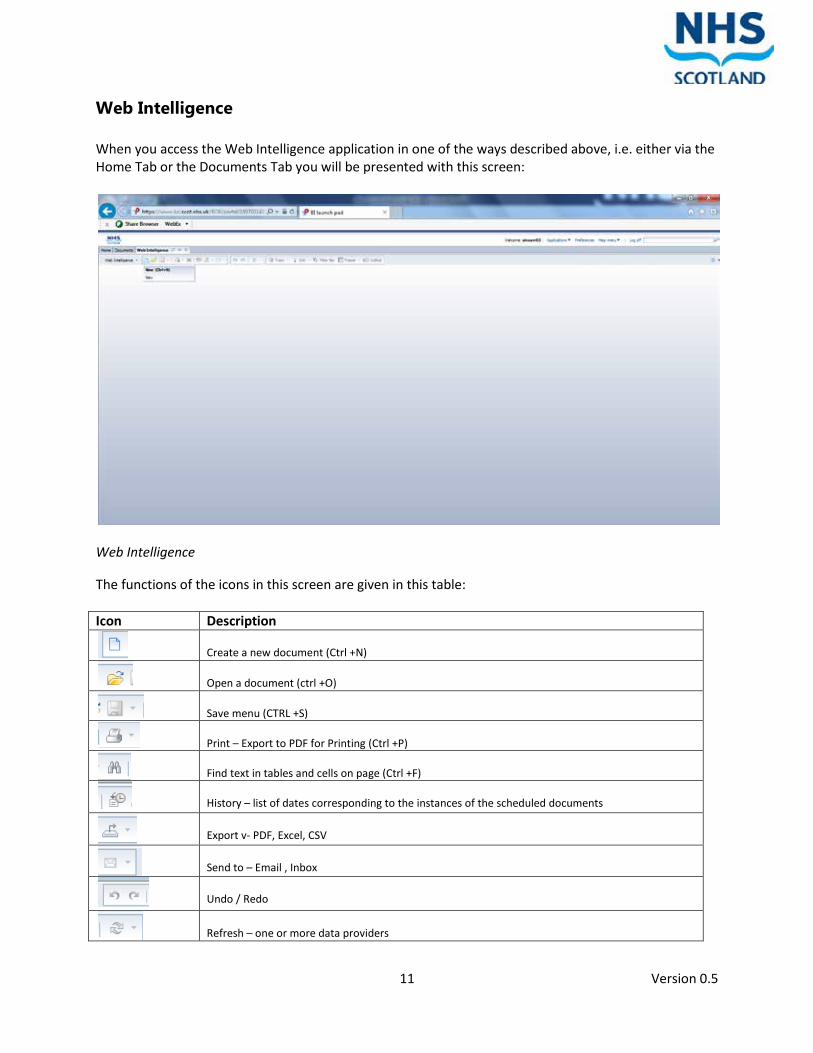
Web Intelligence When you access the Web Intelligence application in one of the ways described above, i.e. either via the Home Tab or the Documents Tab you will be presented with this screen:
Web Intelligence The functions of the icons in this screen are given in this table: Icon Description
Create a new document (Ctrl +N)
Open a document (ctrl +O)
Save menu (CTRL +S)
Print – Export to PDF for Printing (Ctrl +P)
Find text in tables and cells on page (Ctrl +F)
History – list of dates corresponding to the instances of the scheduled documents
Export v- PDF, Excel, CSV
Send to – Email , Inbox
Undo / Redo
Refresh – one or more data providers

12 Version 0.5
Track – Activate or deactivate tracking changes
Filter bar – Click to hide/show filter bar
Freeze – keep the header or a portion of the table visible while the rest of the table scrolls
Outline – shows or hides the outline option for folding and unfolding elements
Web Intelligence Icons
Create a New Web Intelligence Document
Click on
You will see a list of universes which you have permissions to access. Selecting a universe will return the screen below:
Select Universe and Click OK
13 Version 0.5
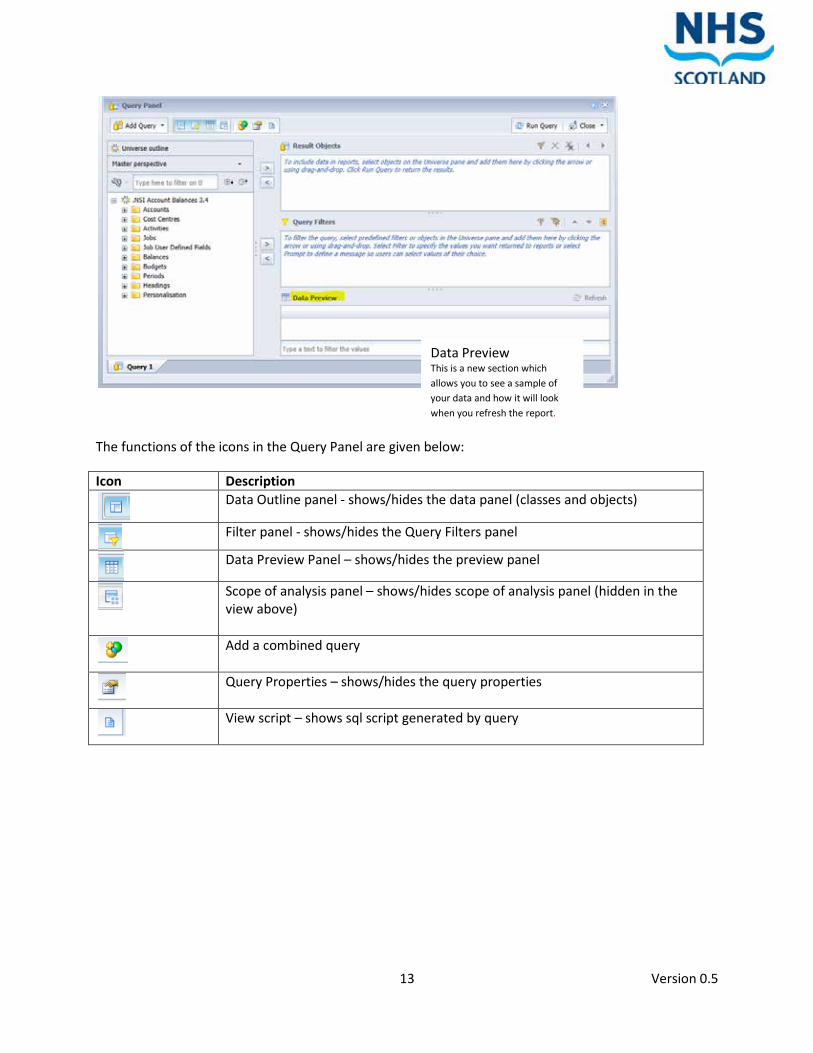
The functions of the icons in the Query Panel are given below:
Icon Description
Data Outline panel - shows/hides the data panel (classes and objects)
Filter panel - shows/hides the Query Filters panel
Data Preview Panel – shows/hides the preview panel
Scope of analysis panel – shows/hides scope of analysis panel (hidden in the view above)
Add a combined query
Query Properties – shows/hides the query properties
View script – shows sql script generated by query
Data Preview This is a new section which allows you to see a sample of your data and how it will look when you refresh the report.

14 Version 0.5
Query Properties
Creating a small query and clicking on Refresh in the Data Preview prior to refreshing the report shows how the report will look, very good for creating new reports and testing.
Click Run Query This opens a new application window and closes the query panel Your report has been created.
15 Version 0.5
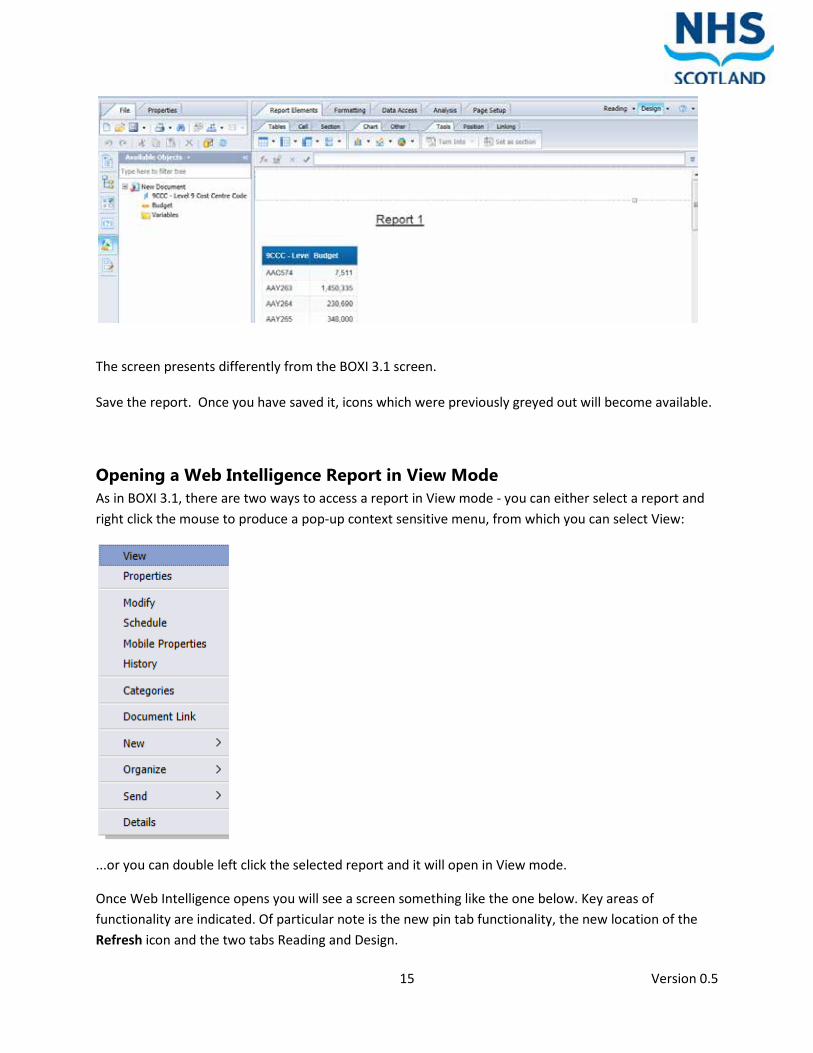
The screen presents differently from the BOXI 3.1 screen. Save the report. Once you have saved it, icons which were previously greyed out will become available.
Opening a Web Intelligence Report in View Mode As in BOXI 3.1, there are two ways to access a report in View mode - you can either select a report and right click the mouse to produce a pop-up context sensitive menu, from which you can select View:
...or you can double left click the selected report and it will open in View mode.
Once Web Intelligence opens you will see a screen something like the one below. Key areas of functionality are indicated. Of particular note is the new pin tab functionality, the new location of the Refresh icon and the two tabs Reading and Design.

16 Version 0.5
Web Intelligence Report in View Mode
The reports open by default on the Reading tab.
Menu bar in Reading Tab (HTML/PDF)
Apply filters and drill in this tab.
The Design tab will be visible if you have the requisite rights and it allows a user to modify a report using either Java or HTML depending on the View preference set earlier.
Menu Bar in Design Tab (View data/View Structure)
The Design tab contains the menus for manipulating and formatting the report on tabs at the top of the report where previously these would have been spread between the data panel and menu bars.

17 Version 0.5
Opening a Web Intelligence Report in Modify Mode
If you have the requisite rights to modify a report you can select a report and right click the mouse to produce a pop-up context sensitive menu, from which you can select Modify:
This will open the Report on the Design tab, allowing you to modify it. Note: when choosing modify either HTML or Java will be invoked depending on which of those you chose when setting Preferences for Modify mode.
More about the Design Tab Design mode can open in two ways: With Data or Structure only, which are self-explanatory. You might chose to use Structure only when working with a large report because of the overhead involved in data being presented to the screen as you make structural changes.
In order to edit queries, once in Design mode you need to select the Data Access tab as indicated:

18 Version 0.5
You can then choose to Edit a query, which is a process very similar to the one in BOXI 3.1 and is similar to query creation outlined above in Create a New Web Intelligence Document.
In Design mode, clicking into a table or heading adds more toolbars:
Table
Heading
Report Elements Tables and Cells – in BOXI 3.1 would have been shown on the Data Panel under the templates tab
Section – allows you to insert a section.
Formatting In BOXI 3.1 was In the Data Panel under properties.

19 Version 0.5
Data Access In BOXI 3.1 these icons would have been on the menu bar.
Analysis These icons would have been on the menu bar, there is one new icon in this section.
Page Set up Contains the settings for formatting a page.
Customising Reports
Tables Converting a vertical table into a crosstab report click Turn into on the tools menu and select Cross Table.
Selecting the More Transformations options allows you to amend the columns and row headings to suit your requirements
Report has no object descriptions

20 Version 0.5
Adding object names
Highlight the table by clicking on top left hand corner (X) and Right click and select Format Table
Check Show object names
Object names are now visible

21 Version 0.5
Adding Totals Highlight column with values
When you click Sum on a crosstab you get an Option Sum or Default Aggregation – (on a vertical table these would be the same)
**New Functionality** - Copying Tables
We can now copy queries, variables, tables and charts from one Web Intelligence document to another. When copying an object all the dependant objects are also copied.
• Select Table to copy • Create a new document with no data source • Paste the table in the report • A new connection to the universe has been created when you copied the table and can be
refreshed as required. NB: This is only available in the Java interface/Rich Client
**New Functionality** - Formulas The formula language contains new functions and operators for working with hierarchical data.
Aggregate Returns the default aggregation of a measure and has additional parameters to specify a member set expression on a hierarchy
Depth Returns the depth of a member in a hierarchy Isleaf Determines if object is a leaf member Parent Ancestor Children Descendants
Define a member set on a hierarchy

22 Version 0.5
Siblings Lag Range Before After Before after Self Self after Self before Self before after
New operators for working with hierarchies
Min Max Sum Count Average
All have additional parameters to specify a member set expression on a hierarchy
**New Functionality** - in User Response Prompts A new operator has been added to the list of available operators called Prompts... the purpose of this is to allow the user to add the user response prompt easily without making errors in the prompt text.
**New Functionality** - Hiding Dimensions In BOXI 3.1 if you wanted to restrict/filter a column and then hide the column this would be done by formatting it in white and reducing the size of the column, a new formatting property has been added called Hide Dimension, right click on column and select hide/unhide as required.

23 Version 0.5
**New Functionality** - Charts Several new chart types have been introduced
• Pie chart with depth • Scatter charts • Bubble charts • Box plot • Heat map • Tree map
And additional support for hierarchical display in charts No longer need to go into structure mode to create/amend charts.
**New Functionality** - Fold/Unfold This is new in BI4 but was available in Deski version 6.5.
Create a sample report and add a section break:
In Design mode Select Interact > Outline
Two arrows appear, shown above underlined in Red

24 Version 0.5
The outer left arrow is used to perform actions on the block, the inner left arrow is used to perform actions on the section.
Clicking on the arrow at A461 hides the details
Clicking the arrow again “unhides” the details for A461
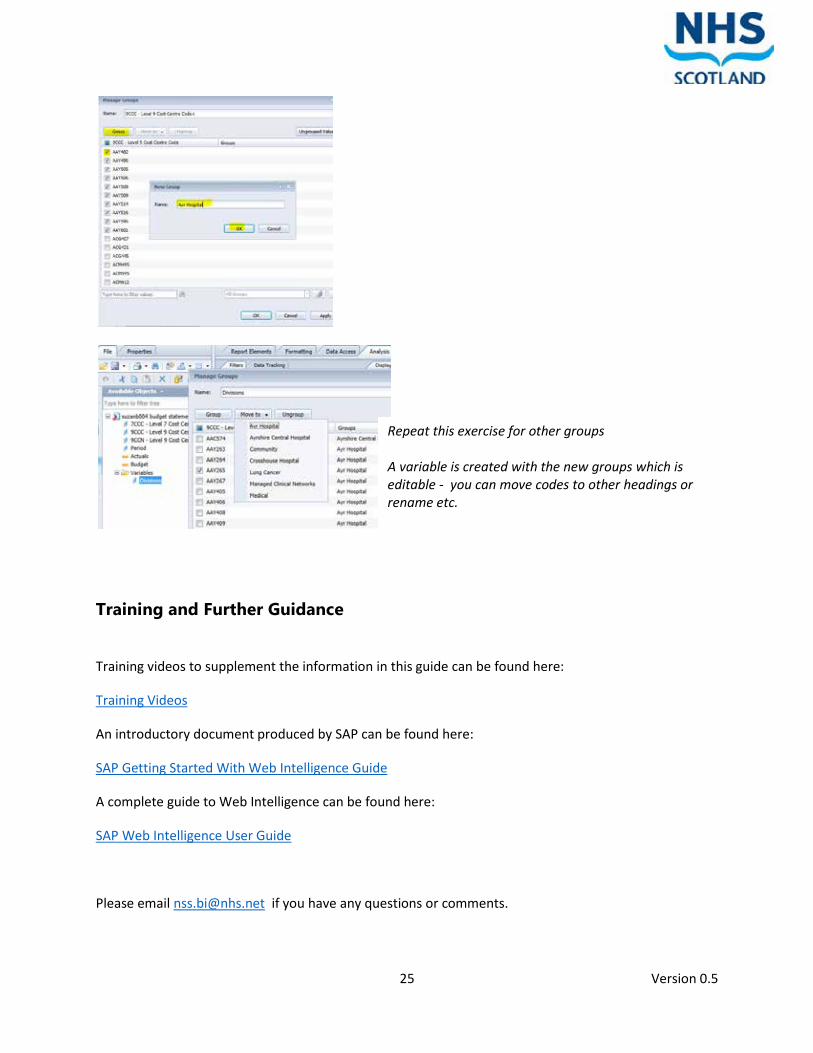
**New Functionality** - Group Function This functionality reduces the reliance on users creating their own grouping variables .
Select the values you wish to group together, click Group and rename as required
This functionality was available in the Deski version of Business Objects. Click into a dimension column to place the grouping in Select Analysis tab – Group - Manage Group
25 Version 0.5
Training and Further Guidance
Training videos to supplement the information in this guide can be found here:
Training Videos
An introductory document produced by SAP can be found here:
SAP Getting Started With Web Intelligence Guide
A complete guide to Web Intelligence can be found here:
SAP Web Intelligence User Guide
Please email [email protected] if you have any questions or comments.
Repeat this exercise for other groups A variable is created with the new groups which is editable - you can move codes to other headings or rename etc.
26 Version 0.5
Appendix 1: Differences Between HTML and Applet (Java) Mode
Note: within NSS there is an ongoing Windows 7 upgrade programme. Once users are upgraded they will have access to a Thin App which will allow users within NSS to run BI4 using Java if they choose to. As stated above, for a faster, more stable experience HTML remains the recommended option.
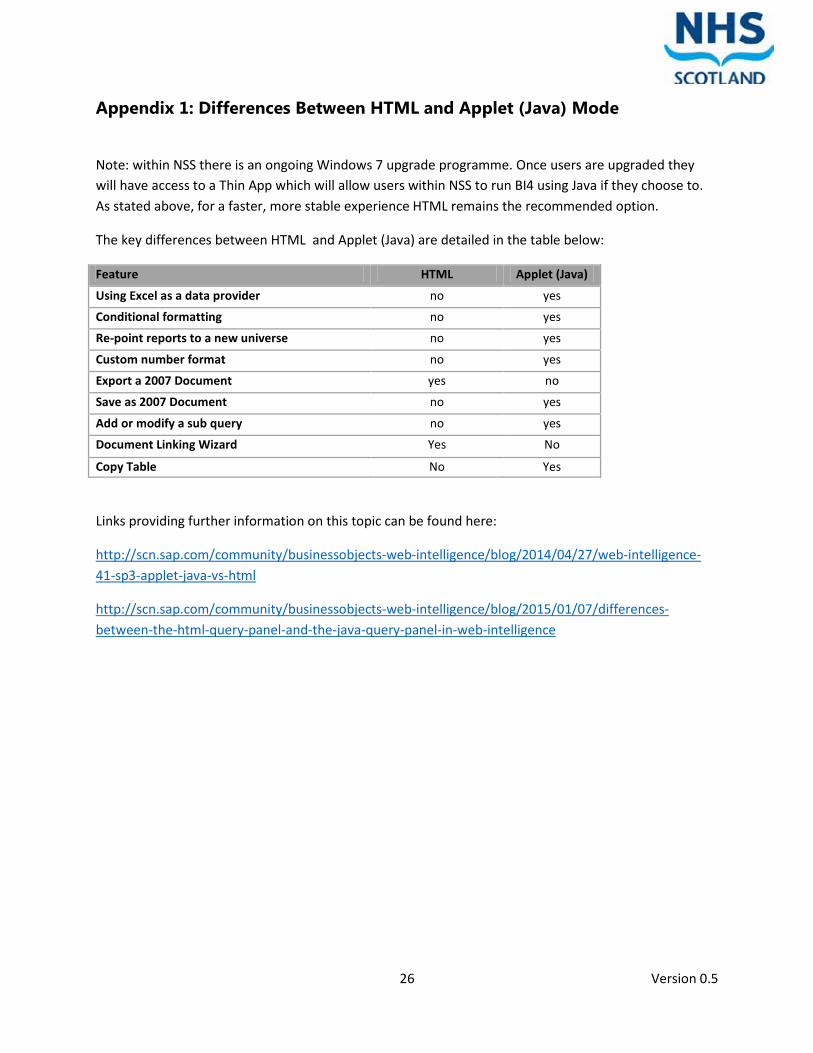
The key differences between HTML and Applet (Java) are detailed in the table below:
Feature HTML Applet (Java)
Using Excel as a data provider no yes
Conditional formatting no yes
Re-point reports to a new universe no yes
Custom number format no yes
Export a 2007 Document yes no
Save as 2007 Document no yes
Add or modify a sub query no yes
Document Linking Wizard Yes No
Copy Table No Yes
Links providing further information on this topic can be found here:
http://scn.sap.com/community/businessobjects-web-intelligence/blog/2014/04/27/web-intelligence-41-sp3-applet-java-vs-html
http://scn.sap.com/community/businessobjects-web-intelligence/blog/2015/01/07/differences-between-the-html-query-panel-and-the-java-query-panel-in-web-intelligence

27 Version 0.5
Appendix 2: Client Specification and Browser/Java/OS Support
Minimum official supported client hardware requirements are Dual Core CPU with 2GB RAM. However, since client workstations are running various other applications they should have at least 4GB RAM and a Pentium 4 class processor at or above 2.0 GHz.
Web Browser Java Version Windows Desktop
IE 8 Java 7, 8 Windows 7 SP1
IE 9 Java 7, 8 Windows 7 SP1
IE 10 Java 7, 8 Windows 7 SP1 +Windows 8
IE 11 Java 7, 8 Windows 7 SP1 + Windows 8.1
Firefox ESR 31.x Java 7, 8 Windows 7 SP1 + Windows 8 + Windows 8.1
Google Chrome As of release 45 no longer supports technology
required for Java applets
Windows 7 SP1 + Windows 8 + Windows 8.1