bhutan power corporation limited tariff review · pdf fileapril 2013. the bpc submitted that...
TRANSCRIPT

Bhutan Electricity Authority
Bhutan Power Corporation Limited Tariff Review Report
October 2013
i
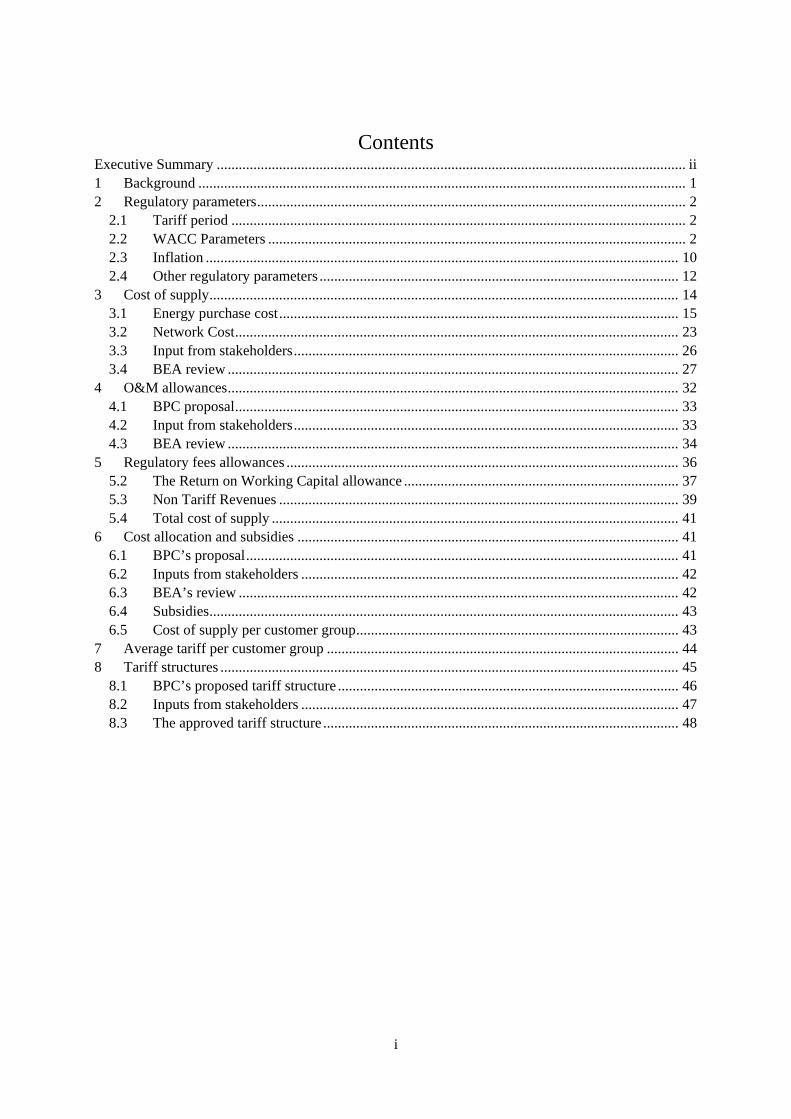
Contents
Executive Summary ................................................................................................................................ ii 1 Background ..................................................................................................................................... 1 2 Regulatory parameters ..................................................................................................................... 2
2.1 Tariff period ............................................................................................................................ 2 2.2 WACC Parameters .................................................................................................................. 2 2.3 Inflation ................................................................................................................................. 10 2.4 Other regulatory parameters .................................................................................................. 12
3 Cost of supply ................................................................................................................................ 14 3.1 Energy purchase cost ............................................................................................................. 15 3.2 Network Cost ......................................................................................................................... 23 3.3 Input from stakeholders ......................................................................................................... 26 3.4 BEA review ........................................................................................................................... 27
4 O&M allowances ........................................................................................................................... 32 4.1 BPC proposal ......................................................................................................................... 33 4.2 Input from stakeholders ......................................................................................................... 33 4.3 BEA review ........................................................................................................................... 34
5 Regulatory fees allowances ........................................................................................................... 36 5.2 The Return on Working Capital allowance ........................................................................... 37 5.3 Non Tariff Revenues ............................................................................................................. 39 5.4 Total cost of supply ............................................................................................................... 41
6 Cost allocation and subsidies ........................................................................................................ 41 6.1 BPC’s proposal ...................................................................................................................... 41 6.2 Inputs from stakeholders ....................................................................................................... 42 6.3 BEA’s review ........................................................................................................................ 42 6.4 Subsidies ................................................................................................................................ 43 6.5 Cost of supply per customer group ........................................................................................ 43
7 Average tariff per customer group ................................................................................................ 44 8 Tariff structures ............................................................................................................................. 45
8.1 BPC’s proposed tariff structure ............................................................................................. 46 8.2 Inputs from stakeholders ....................................................................................................... 47 8.3 The approved tariff structure ................................................................................................. 48

ii
Executive Summary The Druk Green Power Corporation Limited (DGPC) generation tariff has been reviewed and set at Nu. 1.39/kWh. The annual average royalty energy volume of 1,049 GWh, which is 15% of the expected generation from Kurichhu, Basochhu, Tala and Chukha hydropower plants adjusted for auxiliary consumption has been approved by the Royal Government of Bhutan. The Bhutan Power Corporation Limited (BPC) tariff application has been reviewed and the allowed pre-tax Weighted Average Cost of Capital (WACC) is determined as 9.40 %, based on a 10 % after-tax cost of equity, a 2.06 % cost of debt, and a 40 % gearing ratio. The cost allowances have been set according to the provisions of the Tariff Determination Regulation. The BPC’s total costs of supply increase steadily over the tariff period, largely driven by new investments in transmission system. The BEA has determined an average cost of supply of Nu. 0.114/kWh for Wheeling, Nu. 2.16/kWh High Voltage (HV), Nu. 4.42/kWh for Medium Voltage (MV) and Nu. 5.26/kWh for Low Voltage (LV) consumers for the tariff period 2013/14 to 2015/16. The Royal Government approved the use of full annual average royalty energy volume of 1,049 GWh valued at the domestic generation tariff of Nu. 1.39/kWh and allocated an annual subsidy amount of Nu.1,271.704 million to LV consumers and an annual subsidy of Nu. 186.296 million to MV customers for the period 2013/14 to 2015/16. The HV customers will not be subsidized and will be paying the full cost of supply as per the Economic Development Policy 2010. Based on the approved subsidies and the annual average royalty energy volume, the BEA has approved the following tariff structure for the tariff period 1st October 2013 to 30th June 2016.
Customer Category Unit 2013/2014 2014/2015 2015/2016
Low Voltage (LV) LV Block I (Rural domestic) 0 – 100 kWh Nu./kWh 0 0 0
LV Block I (Others) 0-100 kWh Nu./kWh 0.98 1.12 1.28
LV Block II (All) >100-300 kWh Nu./kWh 1.86 2.13 2.45
LV Block III (All) >300 kWh Nu./kWh 2.46 2.82 3.23
LV bulk Nu./kWh 2.56 3.07 3.68 Medium Voltage (MV) Energy charge Nu./kWh 1.98 2.19 2.43 Demand charge Nu./kW/m 155 195 235 High Voltage (HV) Energy charge Nu./kWh 1.67 1.81 1.96 Demand charge Nu./kW/m 130 155 180
With the approved subsidies, the royalty energy price has been determined to be zero as per Section 8.2.3 of the Tariff Determination Regulation.
1
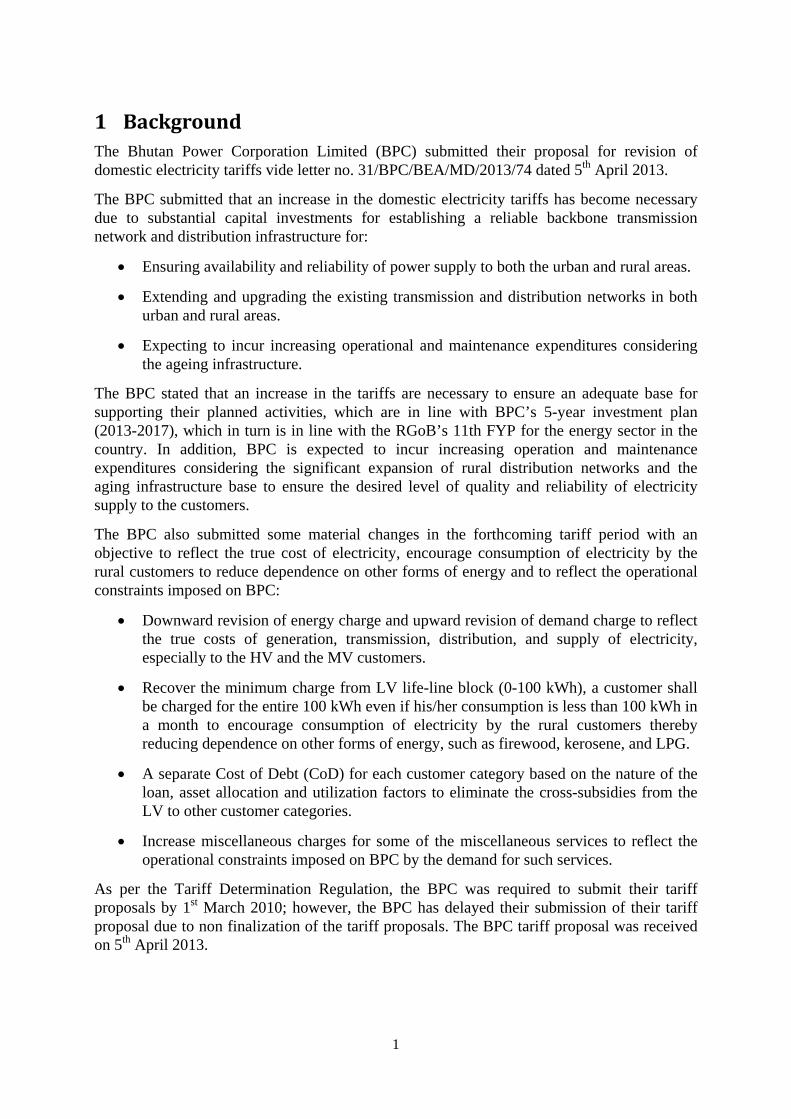
1 Background The Bhutan Power Corporation Limited (BPC) submitted their proposal for revision of domestic electricity tariffs vide letter no. 31/BPC/BEA/MD/2013/74 dated 5th April 2013.
The BPC submitted that an increase in the domestic electricity tariffs has become necessary due to substantial capital investments for establishing a reliable backbone transmission network and distribution infrastructure for:
• Ensuring availability and reliability of power supply to both the urban and rural areas.
• Extending and upgrading the existing transmission and distribution networks in both urban and rural areas.
• Expecting to incur increasing operational and maintenance expenditures considering the ageing infrastructure.
The BPC stated that an increase in the tariffs are necessary to ensure an adequate base for supporting their planned activities, which are in line with BPC’s 5-year investment plan (2013-2017), which in turn is in line with the RGoB’s 11th FYP for the energy sector in the country. In addition, BPC is expected to incur increasing operation and maintenance expenditures considering the significant expansion of rural distribution networks and the aging infrastructure base to ensure the desired level of quality and reliability of electricity supply to the customers.
The BPC also submitted some material changes in the forthcoming tariff period with an objective to reflect the true cost of electricity, encourage consumption of electricity by the rural customers to reduce dependence on other forms of energy and to reflect the operational constraints imposed on BPC:
• Downward revision of energy charge and upward revision of demand charge to reflect the true costs of generation, transmission, distribution, and supply of electricity, especially to the HV and the MV customers.
• Recover the minimum charge from LV life-line block (0-100 kWh), a customer shall be charged for the entire 100 kWh even if his/her consumption is less than 100 kWh in a month to encourage consumption of electricity by the rural customers thereby reducing dependence on other forms of energy, such as firewood, kerosene, and LPG.
• A separate Cost of Debt (CoD) for each customer category based on the nature of the loan, asset allocation and utilization factors to eliminate the cross-subsidies from the LV to other customer categories.
• Increase miscellaneous charges for some of the miscellaneous services to reflect the operational constraints imposed on BPC by the demand for such services.
As per the Tariff Determination Regulation, the BPC was required to submit their tariff proposals by 1st March 2010; however, the BPC has delayed their submission of their tariff proposal due to non finalization of the tariff proposals. The BPC tariff proposal was received on 5th April 2013.

2
As part of the tariff determination process, a public hearing was conducted on 18th July 2013 at the NRDCL Conference Hall, Thimphu. The BEA had initially planned to conduct the public hearing in May 2013, however the conduct of the public hearing was delayed due to the Election Commission of Bhutan’s directives to defer the public hearing to after the elections. Any written comments from the public were to be sent to the BEA Secretariat before 4 pm on 29th July 2013.
2 Regulatory parameters
2.1 Tariff period The length of the tariff period is not regulated in the Tariff Determination Regulation and is therefore to be determined as part of the tariff review.
The BPC tariff proposal is for a three year tariff period. The 2012 financial statements have been used as a reference for calculations of the proposed allowances.
The BEA’s view is that a three year tariff period is reasonable considering the prevailing uncertainties in the development of the electricity sector in the next few years. The tariff period is the same as proposed by the Druk Green Power Corporation (DGPC), which is necessary to avoid a new review of BPC’s tariffs in the middle of a tariff period. Therefore, the BEA recommends the proposed three year tariff period, starting from July 2013 and lasting until the end of June 2016. The new tariffs shall be valid from 1st October 2013 and to 30th June 2016.
2.2 WACC Parameters The WACC shall be calculated as the before-tax Weighted Average Cost of Capital in accordance with section 6.6.3 in the TDR:
GearingCoDTaxGearingCoEWACC ×+
−−×
=)1(
)1(
Where,
• WACC is the weighted average cost of capital, as a percentage;
• CoE is the cost of equity, as a percentage; as determined by the Authority for the Licensee;
• Gearing is the standard ratio of debt to total fixed assets, as determined by the BEA;
• CoD is the cost of debt, as a percentage, being the weighted average interest rate of the Licensee’s loans;
• Tax is the prevailing rate of company taxation, as a percentage.

3
2.2.1 BPC proposal
The BPC has proposed an individual WACC for each customer category. In the proposal, BPC proposes a post-tax CoE of 16% and a gearing ratio of 44%, which is BPC’s actual gearing ratio as on 31st December 2012. The WACC parameters for export, HV, MV and LV customers are proposed as below:
Table 1 BPC Proposed WACC
Export HV MV LV Cost of Equity 16% 16% 16% 16%
Cost of Debt 9.43% 10.73% 1.38% 1.27%
Gearing 44% 44% 44% 44%
Tax 30% 30% 30% 30%
WACC 16.9% 17.5% 13.41% 13.36%
The BPC has proposed an individual Cost of Debt for each customer category. The CoDs are based on actual cost of assets allocated and used by each of the customer categories. BPC is of the view that a common CoD for all customer categories implies cross-subsidies between them, and the purpose of the proposal is to remove such cross-subsidies.
2.2.2 Inputs from stakeholders
The CEO of Druk Holding and Investment (DHI) expressed that a CoE of 10% is quite low compared to commercial debt in Bhutan during the public hearing and with such a low CoE, there is no incentive to invest in BPC. Therefore, he asked the BEA consider a CoE higher than 10%.
The BCCI in their written comments submitted while determining the CoE, it is not appropriate to equate the power scenario in Bhutan to that of India as the conditions prevailing in these countries are different. Firstly, India is currently experiencing a huge shortage in firm as well as peak power requirement and it is imperative to attract players in this sector so as to overcome the shortage. Secondly, a relatively high CoE would be admissible for private sector investments as the risks associated with transmission and distribution (T&D) of power is relatively high. However, in Bhutan’s case, allowing a high CoE for a state run monopoly with no associated risks is not warranted. Further, it was also submitted that a CoE of 10% is used and approved by the BEA during the last tariff period. Accordingly, it was recommended that the allowable CoE for BPC be reviewed and lowered to a more reasonable and acceptable figure.
The BPC in their written comments submitted that an increase in CoE from 10% to 16%, India is for ensuring reasonable returns to the shareholder in light of other competitive investment opportunities in the country where the return on investments are much higher than 16% for projects of comparable risks and social obligations. Accordingly, BPC proposed cost of equity of 16% for the next tariff period.
4
The BPC in their written comments submitted that the proposal to segregate the CoD as per customer category and elimination of cross subsidies from the LV to other customer categories are in line with Section 7.6 and Section 7.7 of the TDR. The BPC also stated that its weighted average CoD is much lower than the market CoD because of the inclusion of soft Rural Electrification loans under the grace period with 0% interest rate which are targeted for LV customers. Therefore, BPC stated that the inclusion of the RE loans in the calculation of CoD for the wheeling and HV customers will not be fair since they do not at all use the RE distribution assets. Accordingly, BPC proposed for separate CoD for each customer category based on the nature and usage of the outstanding and expected debt by each customer category.
2.2.3 BEA review
The WACC parameters are determined in the Tariff Determination Regulation Schedule C, but may be updated by the BEA from time to time. The parameters are discussed in the subsections below.
2.2.3.1 Tax The BEA has verified that the proposed tax rate is in accordance with the rate prescribed in the Income Tax Act of the Kingdom of Bhutan 2001 Chapter 9, section 45. The BEA has found no reasons to amend the proposed tax rate.
2.2.3.2 Cost of Debt The BPC has estimated a consolidated CoD of 2.76% based on the loan details in Table 2. The loan balances of 31.12.2012 have been used as the starting point to derive the loan balances at the end of each consecutive year.
Table 2 BPC’s calculation of average Cost of Debt – Loan Balance (Nu. mill) and interest rate
Particulars of Loan Interest
Rate 31.12.2012 31.12.2013 31.12.2014 31.12.2015
RE I 6 % 190.99 182.69 174.39 166.08
RE II 6 % 348.19 329.87 311.54 293.21
RE III 6 % 419.25 401.02 382.79 364.57
THP 9 % 659.83 549.86 439.89 329.92
RE JICA I 0 % 1,374.37 1,374.37 1,374.37 1,374.37
RE IV ADB 0 % 1,029.18 1,029.18 1,029.18 1,029.18
RE JICA II 0 % 575.27 979.81 979.81 979.81
RE V ADB 0 % 343.53 726.22 726.22 726.22
NPPF 9 % 503.13 461.20 419.28 377.35
ADA LOAN 0 % 40.73 255.32 277.94 277.94 Future Loan Transmission Programme) 13.32 % 18.60 1,100.09
Total 5,484.47 6,289.53 6,133.99 7,018.73
CoD per year 2.76 % 2.96 % 2.32 % 2.15 % 3.70 %

5
The BEA has verified the loan balance as of 31.12.2012 in the proposal against the loan balance in the audited balance sheet for 2012. The total loan balance for 2012 in the tariff proposal amounts to Nu 5,484 million, while in the audited accounts it amounts to Nu 5,720 million. The deviation of Nu 236 million is due to the JICA I loan, where BPC states that they will have a saving equal to this amount.
The BEA found that the proposed loan balance of 2012 for THP also includes IDC of Nu. 202.4 million. Since IDC is to be capitalized it should not be included in the estimated CoD. It is not clear what the IDC loan balance for the years 2013-2015 will be for the THPA loans. Based on a yearly payment of Nu 76.238 million on the THP without IDC, we have calculated a yearly payment of Nu 33.734 million for the IDC. The total payment each year will then be Nu 109.972 million, as described in the application.
The CoD proposed by BPC is the weighted average of the interest rate on existing loans as well as the loans that are envisaged to be taken during the tariff period, using the loan balance at the end of each year (i.e. in the middle of the tariff year) as weights.
The BEA has checked the interest rates and the proposed loan balances against the loan agreements, and found them to be correct.
For the future loans (Transmission Program) that is expected to be financed through a mix of debt and equity in the forthcoming tariff period, the BPC has assumed a gearing ratio of 70 % and an interest rate of 13.32 %. The interest rate is based on the weighted average interest rate of the interest rates offered by the domestic financial institutions (Bank of Bhutan & Bhutan National Bank) for a 10 year secured manufacturing/industry loan.
Due to the decreasing inflation, it is expected that the lenders interest rate will decrease as well. Further, it is assumed that BPC as a company owned by the RGoB will be able to borrow money at a lower interest rate than private companies. The only loan BPC has taken in the current tariff period is from NPPF, who offered the loan at an interest rate of 9%. The BEA viewed that the BPC should be able to take up similar loans also in the next tariff period at a slightly higher interest rate of 9.5%.
When estimating the future loan balances, BPC has inflated the capital drawdown amount each year for each project using a forecasted inflation index of 9% per year. BPC has allocated 70% of the inflated future capital drawdown to debt for the transmission investments that are to be financed through both equity and debt. Next, they have calculated an annual IDC of the debt financed capital drawdown. This is added to the outstanding loan balance for the tariff period. The outstanding loan is included in the loan balance when capitalized, where the BPC also includes the IDC. Since IDC is included in the investment schedule when capitalized and added to the asset value, it is not to be included in the loan balance. Further, the BEA has reduced the expected loan balance of future loans due to expectations of deferred investments compared to BPC’s proposed investment plan.
The interest rates and loan balances used by the BEA to estimate the regulatory CoD for the next tariff period are shown in Table 3. The weighted average interest rate per year is calculated using the estimated loan balances for each loan as weights. The CoD for the tariff period is calculated as the weighted average of the annual interest rate, using the total loan balances per year as weights. BEA has used a gearing of 70 % and an inflation of 7.94 % for future loans.
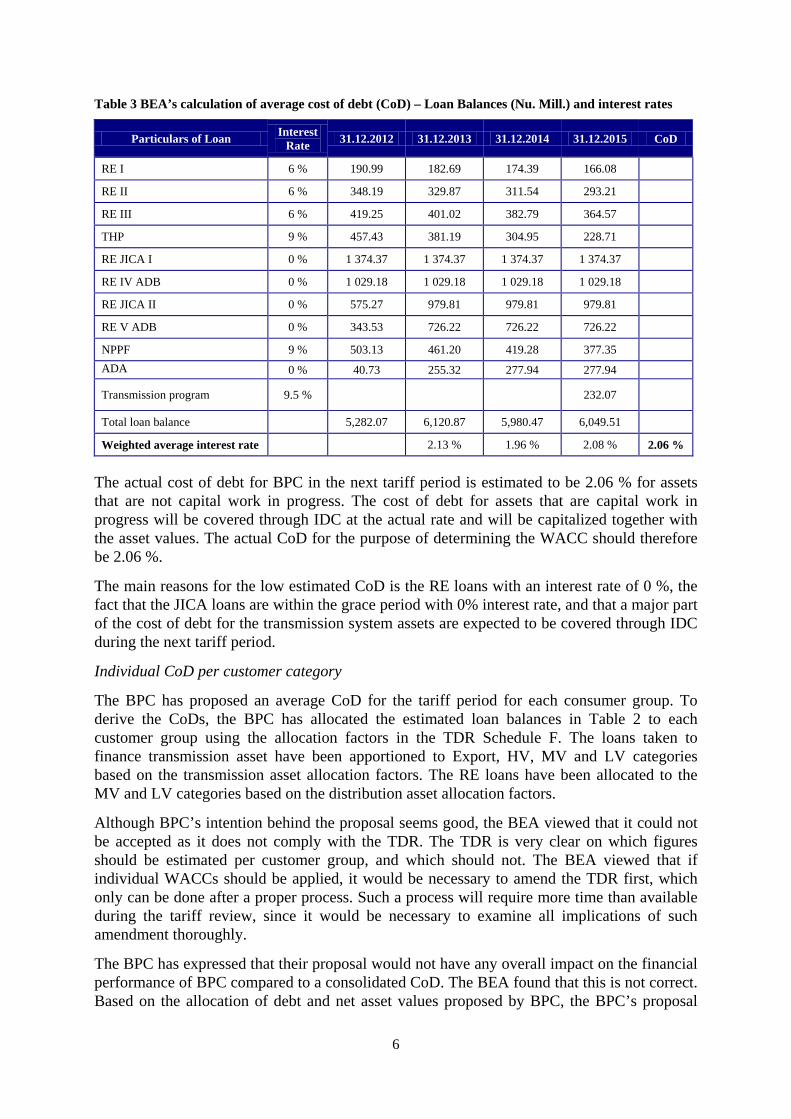
6
Table 3 BEA’s calculation of average cost of debt (CoD) – Loan Balances (Nu. Mill.) and interest rates
Particulars of Loan Interest Rate 31.12.2012 31.12.2013 31.12.2014 31.12.2015 CoD
RE I 6 % 190.99 182.69 174.39 166.08
RE II 6 % 348.19 329.87 311.54 293.21
RE III 6 % 419.25 401.02 382.79 364.57
THP 9 % 457.43 381.19 304.95 228.71
RE JICA I 0 % 1 374.37 1 374.37 1 374.37 1 374.37
RE IV ADB 0 % 1 029.18 1 029.18 1 029.18 1 029.18
RE JICA II 0 % 575.27 979.81 979.81 979.81
RE V ADB 0 % 343.53 726.22 726.22 726.22
NPPF 9 % 503.13 461.20 419.28 377.35 ADA 0 % 40.73 255.32 277.94 277.94
Transmission program 9.5 % 232.07
Total loan balance 5,282.07 6,120.87 5,980.47 6,049.51
Weighted average interest rate 2.13 % 1.96 % 2.08 % 2.06 %
The actual cost of debt for BPC in the next tariff period is estimated to be 2.06 % for assets that are not capital work in progress. The cost of debt for assets that are capital work in progress will be covered through IDC at the actual rate and will be capitalized together with the asset values. The actual CoD for the purpose of determining the WACC should therefore be 2.06 %.
The main reasons for the low estimated CoD is the RE loans with an interest rate of 0 %, the fact that the JICA loans are within the grace period with 0% interest rate, and that a major part of the cost of debt for the transmission system assets are expected to be covered through IDC during the next tariff period.
Individual CoD per customer category
The BPC has proposed an average CoD for the tariff period for each consumer group. To derive the CoDs, the BPC has allocated the estimated loan balances in Table 2 to each customer group using the allocation factors in the TDR Schedule F. The loans taken to finance transmission asset have been apportioned to Export, HV, MV and LV categories based on the transmission asset allocation factors. The RE loans have been allocated to the MV and LV categories based on the distribution asset allocation factors.
Although BPC’s intention behind the proposal seems good, the BEA viewed that it could not be accepted as it does not comply with the TDR. The TDR is very clear on which figures should be estimated per customer group, and which should not. The BEA viewed that if individual WACCs should be applied, it would be necessary to amend the TDR first, which only can be done after a proper process. Such a process will require more time than available during the tariff review, since it would be necessary to examine all implications of such amendment thoroughly.
The BPC has expressed that their proposal would not have any overall impact on the financial performance of BPC compared to a consolidated CoD. The BEA found that this is not correct. Based on the allocation of debt and net asset values proposed by BPC, the BPC’s proposal

7
would give an undue profit of approximately Nu. 180 million per year in the next tariff period. The reason for this is that introducing individual CoDs without also introducing individual gearing ratios is not a consistent way of dealing with the cost of capital. With individual gearing ratios, the differences in the individual WACCs would be significant higher than proposed by BPC. This emphasizes the importance of a thorough examination of all implications before it is decided to amend the WACC provisions in the TDR.
The BEA would like to add that it is not evident that a consolidated WACC implies any cross-subsidy, as in general the liabilities of a company are not tied to specific assets. Currently BPC is in a situation where the debt can be connected to specific investment projects. In the longer run this is not likely to be the case as new debt will be taken and old debt will be refinanced independently of any specific investment. Also under such circumstances the interest rates of a company’s loan portfolio can vary significantly.
2.2.3.3 Cost of Equity BPC has applied for a CoE of 16 %, referring to the CERC norms for Cost of Equity (CoE) in the Indian power sector. In India the regulated CoE is 15.5 %, plus 0.5 % if the investment project is commissioned according to the plan. The BPC’s view is that the CoE of the power sector in Bhutan should be equal to or higher than the CoE of the Indian power sector, considering the integrated nature of the two sectors. The BEA viewed that despite the close links between India and Bhutan, the CoE for the two sectors are not directly comparable mainly due to differences in gearing ratios and the investors’ perspective.
The CoE can be estimated in many ways, but the Capital Asset Pricing Model (CAPM) is widely used. According to the CAPM model the CoE should be estimated as:
(1)
is the Equity Risk Premium, which normally is measured as the extra return that stocks have to offer relative to Government bonds to compensate for the higher risk of investing in stocks. is the risk free rate, and normally is the return on the Government bond the ERP is measured against. The is the only sector specific variable in the formula, and is a measure of the systematic risk for the sector compared to the risk of a balanced portfolio on the stock market. Higher the risk compared to the stock market, higher the .
The is normally estimated based on the correlation between a company’s or sector’s return and the return on a balanced stock market portfolio. If the return of the company correlates perfectly with the market portfolio, is 1. If the return of the company is more volatile than the return on the market portfolio is higher than 1, and if it is less volatile then it is less than 1. If there is no correlation between the company’s return and the return on the market portfolio, is 0. If there is a negative correlation, is less than 0, and this implies that the company’s return will increase if the return on the stock market decreases. The is not a measure of the total risk of investing in only the specific company or sector, but a measure of the risk that the investor cannot remove through diversification of his investment in a well balanced portfolio. Traditionally the is much lower for the power sector than other sectors listed on the stock exchange, due to the low covariance between return on assets between the power sector and the market portfolio. This is also the reason for why investments in the power sector are attractive to investors despite the lower return on assets. The investor can reduce its risk by adding power sector investments to its portfolio.
8
is the levered beta, which take the capital structure (gearing) of the company into account. If two companies with the same systematic risk (represented by the unlevered beta, ) have different gearing, they will have different . The transformation from the unlevered beta to the levered beta, taking the Debt/Equity-ratio (D/E) into account, is done by most practitioners according to the following formula:
(2)
Whether the CERC CoE norm of 16 % is relevant in Bhutan or not is depends on whether the risk free rate, the equity risk premium and levered beta is the same or not. If all parameters are the same in both countries, the answer is yes. It any of the parameters are different, the answer is most likely no. Whether it should be higher or lower will depend on the differences in the factors.
If investors in Bhutan have access to the same Government bonds and stock markets as Indian investors, we can assume that the risk free rate and the equity risk premium are the same in both countries. However, the BEA viewed that the equity risk premium should be lower due to differences in the investors’ perspective between India and Bhutan. DHI as an investor will most likely have limitations in its investment possibilities compared to an Indian private investor. Due to such limitations, the BEA viewed that the ERP should be lower for DHI than for Indian investors. Regarding the levered beta, the BEA viewed that there should be differences due to different gearing ratios. The differences in gearing between Indian and Bhutanese companies will give differences in , and therefore also in the CoE.
To exemplify the view of the BEA, we have calculated the differences assuming that a CoE of 16 % is a reasonable level in India. Given that the underlying factors in the CoE formula is relevant for the power sector in Bhutan, the CoE can be recalculated to a level suitable for Bhutan if we know two out of the three parameters in formula (2).
In an article on the CoE in India from June 2010, it is argued that the CoE for Indian investors should be 15.5 %1, the same as the CERC norm. The article is written by Saurabh Mukherjea, Head of Equities, Institutional Equities, Ambit Capital. He assumed the risk free rate to be 7.4 % (expected return on 10-year Government bond), the levered beta to be 1.1, and the ERP to be 7.25 %. From formula (2) we get:
(3)
Since he assumed to be 1.1, and we know that the CERC gearing norm is 70% debt and 30% equity, we can apply formula (2) to calculate the .
(4)
DGPC has a gearing of around 40 percent. By applying formula (2) on , which we for this calculation assume to be the same in India and Bhutan, we get a for the BPC like:
(5)
1 http://www.vccircle.com/byinvitation/2010/06/14/what-real-cost-equity-india

9
By replacing the of 1.1 (India) with 0.56 (Bhutan), we get the following CoE for Bhutan:
(6)
Under the assumptions in Mukherjea’s calculations the Indian CoE adjusted for the BPC’s gearing ratio is 11.5 %, which could be a benchmark used in the tariff review. However, the BEA viewed that both the and the ERP assumptions are too high in Mukherjea’s example.
One of the few sources for assessing the CoE using CAPM on the power sector of India is Professor of Finance, Aswath Damodaran at the Stern School of Business at the New York University. He is an authority in corporate finance and equity evaluation, and has done many studies of equities throughout the world. Also in the Indian power sector. Much of his work and data is available at his website2.
Professor Damodaran calculates CoE in USD, with the return on as 10-year US Government bond as a risk free rate of return. His updated figures for 2013 regarding the CoE estimation for the Indian power sector are:
• Risk free rate: 1.76 % (10 year US Government bond)
• ERP: 8.8 percent, based on an ERP of 5.8 % for mature markets and a country risk premium for India of 3 %.
• Unlevered beta, : 0.4657, estimated for the Indian power sector.
Adjusting the unlevered beta to a levered beta at 40 % gearing, using formula (4), gives a of 0.7762. Inserting these figures into formula (2) we get:
(7)
However, this CoE is in USD. To transform the CoE into other currencies, Professor Damodaran suggests adjusting the CoE with the difference between the inflation in that currency and the USD. The difference in inflation between India and US has been approximately 4.7 % the last 10 years, but the 2009 and 2010 figures were quite extreme. The average difference in the inflation forecast for the next 3 years is around 3 %3. Adjusting the result in (7) for expected differences in the inflation, we get an estimated CoE for Bhutan of 11.6 %. The BEA viewed that also the and ERP used by Professor Damodaran was too high for Bhutan.
The BEA viewed that the best estimate of CoE could be obtained using the CAPM model on the updated data of Professor Damodaran, adjusting the and the ERP, and applying the differences in the expected inflation between the US and India. None of the figures are accurate, but the BEA viewed that the should be in the interval 0.3 – 0.4, the ERP in the interval 7.2% – 8.8% and the inflation in the interval 3% - 4%. The reason for adjusting the was that the more frequent tariff reviews reduces the impact of recessions in Bhutan compared to India, and hence reduces the systematic risk too.
Regarding the ERP, DHI is an investor with limitations in its investment portfolio compared to a private international investor. Such limitations will result in an expected return on investments that is lower than the one assumed by professor Damodaran. It is quite common to assume that Governments in general should expect a lesser return on assets than investors on stock exchange, though there might be examples of the opposite. 2 http://pages.stern.nyu.edu/~adamodar/ 3 www.tradingeconomics.com

10
The BEA has found it difficult to estimate the differences in inflation between the US and India exactly. Based on the historic differences it should be more than 4 %. Based on the current expectations it should be less than 3%. BEA expects it to be between 3 and 4 %.
Based on the expected intervals of the , the ERP and the inflation the BEA viewed that a CoE of 10 % should be appropriate for investors in BPC equity.
2.2.3.4 Gearing The BPC proposed a gearing ratio of 44%, which the BPC states is the company’s actual gearing ratio as on 31st December 2012. The BPC also states that BPC would have preferred adoption of different gearing ratios for the individual customer category to reflect true cost of supply.
BEA viewed that the gearing ratio should be assessed using the average debt over the next tariff period over the average net asset value for the same period.
According to BPC’s proposal the average loan balance in the next tariff period is expected to be Nu. 6,481 million, whilst the net asset value used for determining the tariffs is expected to be Nu. 16,371 million. This gives a gearing ratio of 39.6%.
Using BEA’s reviewed figures, the average loan balance as of 31.12.2015 in the next tariff period is expected to be Nu. 6,059 million, whilst the net asset value used for determining the tariffs is expected to be Nu. 15,191 million. This gives a gearing ratio of 39.8%. The BEA therefore viewed that the gearing ratio of 40% should be used, as prescribed in the TDR Schedule C.
The BEA would like to point out that the relatively low gearing of BPC has a negative impact on the BPC tariffs. Due to the low share of debt, the tariffs are higher than necessary. The impact on the tariffs of reducing the debt will be the opposite of what some of the customers stated during the public hearing. If the debt is reduced, the cost of supply will increase. The reason is that the CoE is higher than the CoD. A post-tax CoE of 10% is equal to a pre-tax CoE of 14.3%. The BEA is of the view that the BPC should move towards an optimal gearing, which probably is in the range of 60-70% debt. If a change in gearing is not observed towards the next tariff review, the BEA may have to review the practice of using a gearing close to the observed one. In India they use a gearing of 70% in the regulatory WACC, independently of the actual gearing of the companies.
2.2.3.5 The WACC Using a CoD of 2.06 %, CoE of 10 %, Gearing ratio of 40 % and a Tax Rate of 30 % the BEA has estimated the WACC to be 9.40 %.
2.3 Inflation The historical inflation rates are used for calculation of historical costs in 2012-values, which is the base year for this tariff review. The forecasted inflation rate is used for the calculation of the forecasted costs (allowances) and investments in each of the years in the tariff period.

11
2.3.1 BPC proposal
The BPC has proposed the realized inflation rates for the prevailing tariff period as estimated by the National Statistics Bureau as shown in the Table 4 below. The BPC states that the Authority approved an average inflation rate of 5% against BPC’s proposed forecast of 5.96% in 2010. The realized inflation rate for the period has been significantly higher (around 10% for the 4th quarter of 2012) than the approved figure which has adversely impacted BPC on O&M costs and return on assets.
Table 4 Historical inflation rates
2010 2011 2012 Average
Inflation 7.0 % 8.8 % 10.9 % 8.9 %
The average inflation rate for the next tariff period is proposed by BPC to be 8.9% based on the arithmetic average of the realized inflation rates for 2010, 2011 and 2012.
2.3.2 Input from stakeholders
The BCCI in their written comments submitted that for inflation, a more realistic figure should be used based on the forecast made by the International Monetary Fund (IMF).
The BPC in their written comments submitted that the consistent and uniform application of the inflation forecast mechanism would be fair rather than convenient change in the applied mechanism resulting in lower recoveries, always impacting the financial performance of the Licensee.
2.3.3 BEA review
The BEA has verified that the inflation rates for the years of 2010 to 2012 are consistent with the official figures from National Statistics Bureau. These figures should be used when inflating historical figures to 2012 values in this tariff review.
The BPC has not used any forecasts when estimating the future inflation rate, but has proposed the average inflation over the three past years. The BEA does not find the methodology appropriate for the tariff review. The BEA has checked that the World Economic Outlook International Monetary Fund (IMF) for the forecasted inflation for the period 2013 to 2016. The IMF forecasts are shown in Table 5. The ADB Asian Development Outlook 2013 from April 2013 has forecasted the inflation of 2013 to 9.3% and expects 7.4% in 2014.
The BEA recognized that forecasting the inflation is very difficult, and that different sources will have different estimations. However, the BEA viewed that the IMF forecast should be used as basis for the determination of the expected inflation in the next tariff period, as it was done in the last review. The average of the forecasts for the period 20013-2016 is 7.94%. The BEA therefore determined the annual inflation to be used when determining the tariffs should be 7.94 % per year in the next tariff period.

12
Table 5 Inflation forecast4
Year IMF*
2013 9.33% 2014 8.16%
2015 7.68% 2016 6.57% Average 2013-2016 7.94%
The BEA has approved an average historical inflation rate of 8.9% and the forecasted inflation rate of 7.94 % to be used in this tariff review.
Using an annual inflation rate of 7.94 % instead of 8.9 % has an impact on all of the allowances proposed by the BPC, except for the energy cost. It has an impact on the allowances for return on assets and depreciations through reduced capitalized investment amounts and estimated depreciations.
2.4 Other regulatory parameters The O&M benchmark parameters are determined in the Tariff Determination Regulation Schedule A, but may be updated by the BEA from time to time. These parameters are discussed in section 4.3.2. The O&M efficiency gain parameters are discussed in 4.3.3. The technical loss allowances are discussed in section 2.4.1, and the commercial loss allowances are discussed in section 2.4.2. The collection rate is discussed in section 2.4.3. These regulatory parameters are determined in the Tariff Determination Regulation Schedule E, but may be updated by the BEA from time to time.
2.4.1 Technical transmission and distribution losses
The technical transmission and distribution losses are losses due to resistance in the network lines, cables and transformers and cannot be fully avoided. Since these losses are requiring the BPC to purchase more energy than they sell, they have an impact on the tariffs. The higher the technical losses, the more energy must be purchased per unit sold, and hence the tariff will increase.
2.4.1.1 BPC’s proposal The BPC has proposed technical losses of 2% for HV, 2.5% for MV, 12% for LV which is as per Schedule E of the TDR.
2.4.1.2 BEA review The BEA reviewed the historical losses for BPC and as per the calculations the global losses for BPC are as in Table 6.
4 Inflation, end of period prices from http://www.imf.org/external/pubs/ft/weo/2013/01/weodata/download.aspx

13
Table 6 – Global technical losses - % of energy purchase
2010 2011 2012 Global losses 5.07% 4.99% 4.26%
Based on the historical losses of the BPC, it is recommended that the technical loss allowances be fixed as shown in Table 7.
Table 7 – BEA’s approved technical losses
Losses HV 2.0 % MV 2.5 % LV 12.0 %
2.4.2 Commercial losses
The commercial losses are mainly due to low metering efficiency and electricity theft. According to the Tariff Determination Regulation section 5.7 and 6.8 the commercial losses shall be taken into consideration when determining the tariffs.
2.4.2.1 BPC’s proposal The BPC has proposed the commercial losses of 0.5% for HV, 1% for MV and 5% for the LV customers considering that a commercially lossless system cannot be expected. According to the Tariff Determination Regulation schedule E the commercial losses are calculated considering 5% losses of LV sales and 0 % for MV and HV.
Table 8 – BPC’s proposed commercial loss factors
2010 2011 2012 Commercial losses: 1.49 % 1.49 % 1.51 %
2.4.2.2 BEA’s review As BPC should have achieved 100 % metering and the commercial losses mainly relates to electricity theft. Therefore, a commercial loss allowance of 0.5% and 1% for HV and MV are high since BPC has confirmed that there were no historical case of electricity theft from HV and MV lines and none are reported to BEA for consideration. Therefore commercial loss has been calculated considering of 0% for HV and MV sales and 5% for LV sales as per the TDR Schedule E will be used for calculation of the commercial losses in Table 9.
Table 9 – BEA’s approved commercial loss factors
2013 2014 2015 Commercial losses: 1.06% 1.04% 1.06%
2.4.3 Collection rates
The collection rate is the rate of billed energy sales that is actually paid by the customers. The rate will be less than 100 % if any of the customers never pays an electricity bill and the security deposits do not fully cover the unpaid bill. To avoid the BPC from having an
14
economic loss due to unpaid bills, the expected losses are borne by the other customers, as determined in the Tariff Determination Regulation sections 6.9 and 9.5.3.
2.4.3.1 BPC’s proposal The BPC has proposed the collection rates of 98% (LV=91%, MV=98% and HV=100%) based on the BPC’s actual weighted average collection rate for the year 2012. As per the Tariff Determination Regulation Schedule E the collection rates are 100 % for all the customer categories (HV, MV and LV).
2.4.3.2 BEA’s review The BEA has scrutinized the collection rate calculation, books of accounts and other information provided by the BPC, but cannot find any evidence justifying a weighted average collection rate of 98 %. The outstanding bills of 2011 and 2012 are used to compute the collection efficiency and BPC has not reported any outstanding bills earlier than 2011. Therefore BEA assumes that there are no outstanding bills other than the 2011 and 2012. According to the books of accounts only small amount of bad debt stemming from unpaid bills is written off every now and then.
Table 10 – Write offs
2010 2011 2012 Debtors write off (Nu. Mil) 0.42 0 0.48
The doubtful debts for last seven years for BPC is not significant compared to the revenues collected. The doubtful debts amounted to less than 0.5% of the total revenues. Therefore most of these doubtful debts seem to be late payment and not totally unpaid bills.
Late payments/outstanding bills shall not be included in the calculation of collection rates. The BPC’s costs of late payments are to be covered through their late payment surcharges and security deposits. Collection rate will be less than 100%, if any customer never pays an electricity bill or security deposit does not fully recover the unpaid bills. Therefore BEA assumes the outstanding bills will always be paid in future and late payments are charged through the penalty surcharges. The write-offs of unpaid bills are included in the historical O&M costs of the BPC and are already considered in the O&M allowances. Further adjustments for unpaid bills are not necessary. Therefore, the collection rate is determined to be 100 % for all customer groups when reviewing the tariffs for the next tariff period.
3 Cost of supply According to the Tariff Determination Regulation section 9.5.2 the cost of supply for a customer group in a particular year shall be determined as the sum of energy purchase costs, network costs, the cost of working capital, less any Non-Tariff Revenue, less any subsidies allocated to that Customer Group, as follows:
CCC
CCCCC
SUBREVWCNETWORKIMALLOCIMPORTIPSALESPPPLOSSCOST
−−++××+××+=
)1(
The energy purchase cost, consisting of power purchase from DGPC and imports from India, is described in section 3.1. The network cost, consisting of BPC’s costs related to building,

15
operating and maintaining their network, is described in section 3.2. The cost of working capital is described in section 5.2. The non-tariff revenues are described in section 5.3. The subsidies are described in section 4.4.
3.1 Energy purchase cost The Energy cost is the cost incurred by the BPC for purchasing the energy from DGPC and India for supply to the customers which is determined as per the following equation:
CCCC IMALLOCIMPORTIPSALESPPPLOSS ××+××+= )1(Cost PurchaseEnergy
Where
• Energy Purchase CostC is the cost for Customer Group “C”, in million Ngultrum;
• LOSSC is the sum of technical and commercial losses allocated to Customer Group “C”, as a percentage;
• PPP is the Power Purchase Price, which is the Additional Price determined for the DGPC, in Ngultrum per kWh;
• SALESC is the sales for the year attributed to Customer Group “C”, in GWh.
• IP is the average import price in Ngultrum per kWh;
• IMPORT is the volume of electricity imported, in GWh;
• IMALLOCC is the allocation of import costs to Customer Groups, for which the high voltage customer group equals one (100 %) and for other customer groups equals zero (0 %).
3.1.1 Power purchase from DGPC
The power purchase cost for a specific customer group is the sales adjusted for the loss factor multiplied with the power purchase price.
3.1.1.1 Power purchase price For the purchase of power from the DGPC’s various generating plants, the BPC has proposed a royalty energy price of Nu. 0.13/kWh for energy drawn within the royalty limit and an additional energy price of Nu. 1.2/kWh for energy drawn above the royalty limit. However, BPC submits that as permitted by regulation, any revisions of the prevailing generation tariffs will be incorporated in this proposal and requests the BEA to consider allowing these costs as determined by the BEA to factor in while determining the final tariffs.
3.1.1.2 Sales forecasts The sales forecasts are used to estimate the power purchase costs of the BPC and also for estimating the average cost of supply per unit sold. The sales forecasts have therefore a large impact on the determined tariffs.

16
3.1.1.2.1 BPC’s proposal The BPC has forecasted the sales volumes for each customer category as detailed in Table 11.
Table 11 – BPC’s sales forecasts per customer category
Sales forecast (GWh) 2012 (actual) 2013 2014 2015 LV 378 392 413 435 MV 124 155 198 247 HV 1267 1,307 1,376 1376 Total domestic sales 1769 1,855 1,987 2,057 Wheeling 4938 4,927 5156 5128
3.1.1.2.2 Input from stakeholders The BCCI in their written comments recommended that the energy sales forecast for HV and MV customers should be made based on the historical trend of energy sales and the projected drawal of power by new customers. The demand in MW can then be estimated by assuming a load factor also based on the historical trend. Estimating a more realistic MW for the HV and MV customer category is important as it will have a major bearing on the demand charge calculated for the two customer categories.
3.1.1.2.3 BEA’s review BPC has projected the sale for rural LV domestic customers by considering the forecasted Rural Electrification (RE) customers and historical average energy consumption of 92 kWh per household and the average consumption growth rate of 1.9% for RE fill in customers. The LV industrial sale has been assumed to increase at the rate of 1 %. The LV sales forecast for other customers in the LV category was projected based on the historical consumption trend for the period 2004- 2012.
The BEA found that LV sales forecast follows a trend that was found to be realistic, as can be seen from
Figure 1.
Figure 1 – Historical and forecasted LV energy sales in GWh
The MV sales forecast consists of the sales forecast for the MV industries and the hydropower construction power. The MV industries sales consider the MV contracted demand and average load factor for the past two - three years (2010-2012). For the new industries which are expected to come online in 2013, a load factor of 0.1 (2013) and 0.2 (2014) was proposed

17
considering the trend in consumption pattern of new industries during initial start up phase. A load factor of 0.27 is used for 2015-2016 which is the average load factor of all MV industries. The MV industries sales forecast follows a trend that was found to be realistic.
The hydropower construction power forecast includes the construction power requirement for Punastangchhu I and II, Mangdechhu, Dagachhu, Sankosh, Kuri-Gongri, Chamkharchhu, Kholongchhu, Wangchhu, Bunakha, Amochhu, Nikachhu, Druk Bindu and existing hydropower projects with a load factor of 0.50.
Table 12 –Forecast Hydropower Construction Power
Demand (MW)
Energy(GWh) Project 2013 2014 2015 2016 2013 2014 2015 2016 Punatsangchhu I 8.0 9.0 10.0 9.0 35.04 39.42 43.80 39.42 Punatsangchhu I 1.5 3.0 5.0 6.0 6.57 13.14 21.90 26.28 Mangdechhu 1.0 2.5 4.0 5.0 4.38 10.95 17.52 21.90 Dagachhu 1.4 0.5 - - 6.13 2.19 0.00 4.38 Sankosh - 1.5 3.0 5.0 6.57 13.14 8.76 Kuri-Gongri - - 0.2 1.0 0.88 6.57 Chamkharchhu - 0.2 1.0 2.0 0.88 4.38 6.57 Kholongchhu - 0.5 1.0 1.5 2.19 4.38 4.38 Wangchhu - 0.5 1.0 1.5 2.19 4.38 6.57 Bunakha - 0.2 0.5 1.0 0.88 2.19 8.76
Amochhu - 0.5 1.0 1.5 2.19 4.38 Nikachhu - 0.2 1.0 2.0 0.88 4.38 Total 2.4 6.6 12.7 20.5 10.51 28.91 55.63 67.89
The BEA found that Punatsangchu I and II projects are drawing power at 66 kV and therefore, the demand and energy forecast should be deducted from the MV customers and included under HV customers.
The BEA asked the DGPC and the Department of Hydropower and Power Systems (DHPS) to verify the hydropower construction power forecast submitted by the BPC. It was found that the DHPS projections are much higher and optimistic than the BPC projections. However, based on the historical consumption pattern of the hydropower projects under construction, BPC’s projection seems more realistic. Based on the above, the BEA decided on the hydropower construction power estimate given in Table 13. The energy forecasts are estimated using load factors of 0.5. The total MV sales forecast in each tariff year will be as in Table 13. The MV sales forecasts are illustrated in

18
Figure 2.
Table 13 – BEA's MV sales forecast (GWh)
2013/14 2014/15 2015/16 MV industries 102.9 116.5 125.7 HP construction power 10.5 28.9 55.6 Total MV Sales 113 145 181
19
Figure 2 – Historical and forecasted MV energy sales in GWh
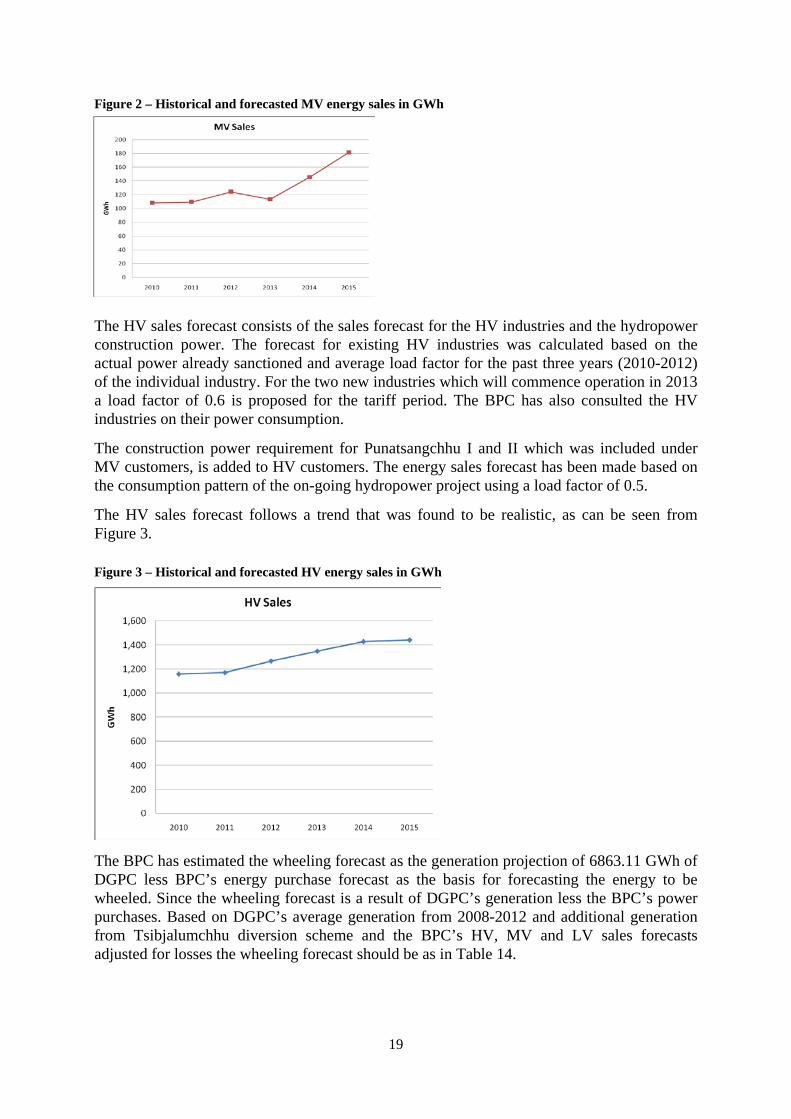
The HV sales forecast consists of the sales forecast for the HV industries and the hydropower construction power. The forecast for existing HV industries was calculated based on the actual power already sanctioned and average load factor for the past three years (2010-2012) of the individual industry. For the two new industries which will commence operation in 2013 a load factor of 0.6 is proposed for the tariff period. The BPC has also consulted the HV industries on their power consumption.
The construction power requirement for Punatsangchhu I and II which was included under MV customers, is added to HV customers. The energy sales forecast has been made based on the consumption pattern of the on-going hydropower project using a load factor of 0.5.
The HV sales forecast follows a trend that was found to be realistic, as can be seen from Figure 3.
Figure 3 – Historical and forecasted HV energy sales in GWh
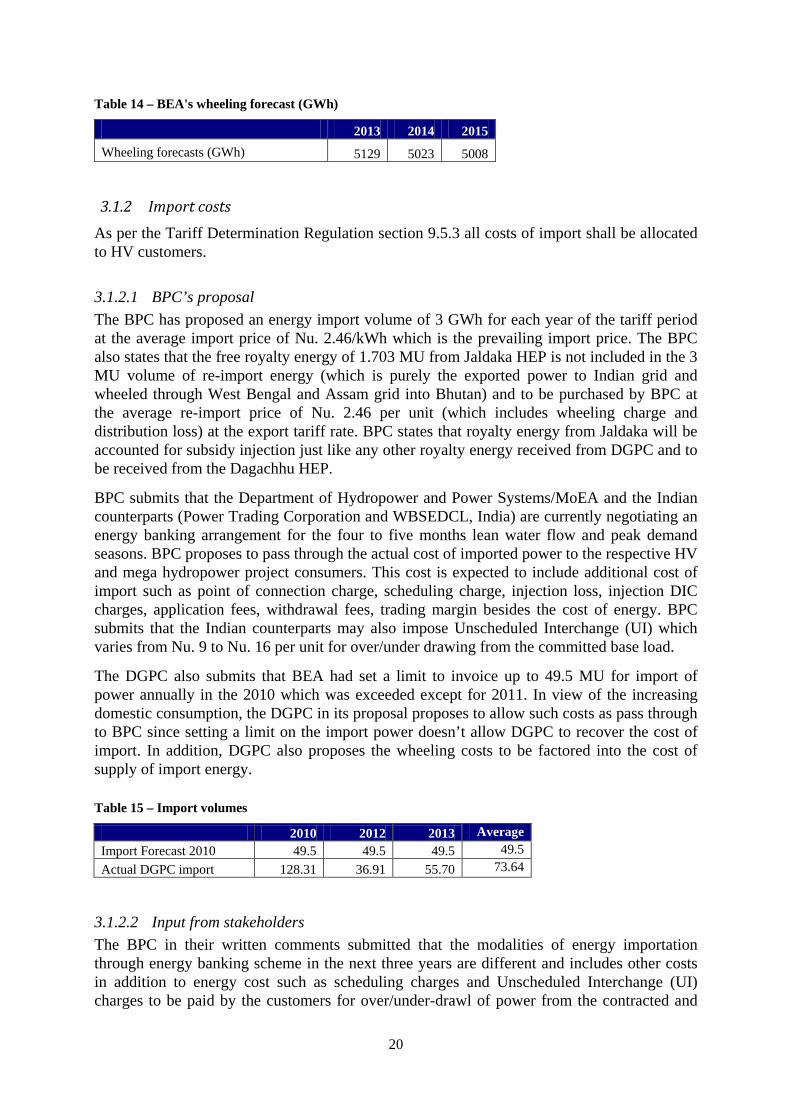
The BPC has estimated the wheeling forecast as the generation projection of 6863.11 GWh of DGPC less BPC’s energy purchase forecast as the basis for forecasting the energy to be wheeled. Since the wheeling forecast is a result of DGPC’s generation less the BPC’s power purchases. Based on DGPC’s average generation from 2008-2012 and additional generation from Tsibjalumchhu diversion scheme and the BPC’s HV, MV and LV sales forecasts adjusted for losses the wheeling forecast should be as in Table 14.
20
Table 14 – BEA's wheeling forecast (GWh)
2013 2014 2015 Wheeling forecasts (GWh) 5129 5023 5008
3.1.2 Import costs
As per the Tariff Determination Regulation section 9.5.3 all costs of import shall be allocated to HV customers.
3.1.2.1 BPC’s proposal The BPC has proposed an energy import volume of 3 GWh for each year of the tariff period at the average import price of Nu. 2.46/kWh which is the prevailing import price. The BPC also states that the free royalty energy of 1.703 MU from Jaldaka HEP is not included in the 3 MU volume of re-import energy (which is purely the exported power to Indian grid and wheeled through West Bengal and Assam grid into Bhutan) and to be purchased by BPC at the average re-import price of Nu. 2.46 per unit (which includes wheeling charge and distribution loss) at the export tariff rate. BPC states that royalty energy from Jaldaka will be accounted for subsidy injection just like any other royalty energy received from DGPC and to be received from the Dagachhu HEP.
BPC submits that the Department of Hydropower and Power Systems/MoEA and the Indian counterparts (Power Trading Corporation and WBSEDCL, India) are currently negotiating an energy banking arrangement for the four to five months lean water flow and peak demand seasons. BPC proposes to pass through the actual cost of imported power to the respective HV and mega hydropower project consumers. This cost is expected to include additional cost of import such as point of connection charge, scheduling charge, injection loss, injection DIC charges, application fees, withdrawal fees, trading margin besides the cost of energy. BPC submits that the Indian counterparts may also impose Unscheduled Interchange (UI) which varies from Nu. 9 to Nu. 16 per unit for over/under drawing from the committed base load.
The DGPC also submits that BEA had set a limit to invoice up to 49.5 MU for import of power annually in the 2010 which was exceeded except for 2011. In view of the increasing domestic consumption, the DGPC in its proposal proposes to allow such costs as pass through to BPC since setting a limit on the import power doesn’t allow DGPC to recover the cost of import. In addition, DGPC also proposes the wheeling costs to be factored into the cost of supply of import energy.
Table 15 – Import volumes
2010 2012 2013 Average Import Forecast 2010 49.5 49.5 49.5 49.5 Actual DGPC import 128.31 36.91 55.70 73.64
3.1.2.2 Input from stakeholders The BPC in their written comments submitted that the modalities of energy importation through energy banking scheme in the next three years are different and includes other costs in addition to energy cost such as scheduling charges and Unscheduled Interchange (UI) charges to be paid by the customers for over/under-drawl of power from the contracted and
21
committed demand. Considering that as on date the energy banking arrangement between the two counterparts is still in negotiation stage and the associated modalities are yet to be established, the upfront determination of tariffs for the import energy is likely to be unrealistic, thus, creating distortions. Further, BPC stated that the treatment of energy import cost through energy banking as pass-through cost as proposed can also be readily implemented as BPC has decoupled the fixed capacity costs and energy costs in its proposed tariff structure for the HV customer category.
Based on these justifications, BPC requested BEA to review its decision regarding recovery of cost of import energy through the energy banking scheme as pass-through cost.
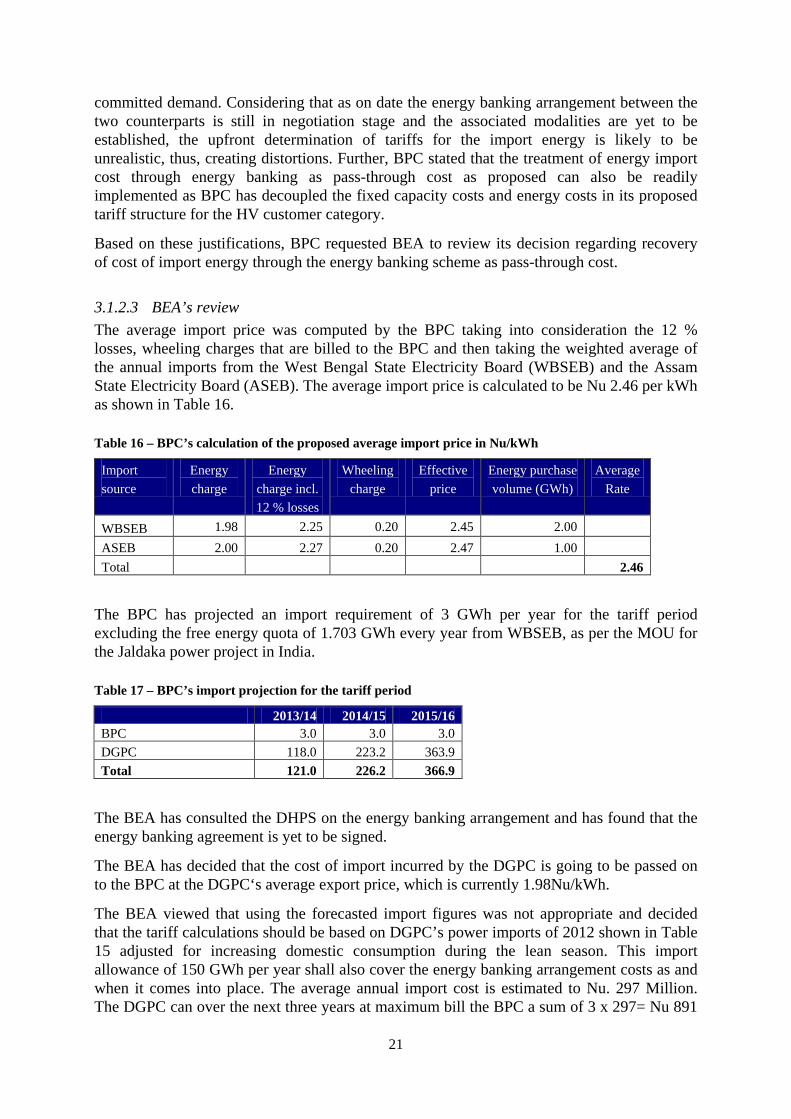
3.1.2.3 BEA’s review The average import price was computed by the BPC taking into consideration the 12 % losses, wheeling charges that are billed to the BPC and then taking the weighted average of the annual imports from the West Bengal State Electricity Board (WBSEB) and the Assam State Electricity Board (ASEB). The average import price is calculated to be Nu 2.46 per kWh as shown in Table 16.
Table 16 – BPC’s calculation of the proposed average import price in Nu/kWh
Import source
Energy charge
Energy charge incl. 12 % losses
Wheeling charge
Effective price
Energy purchase volume (GWh)
Average Rate
WBSEB 1.98 2.25 0.20 2.45 2.00 ASEB 2.00 2.27 0.20 2.47 1.00 Total 2.46
The BPC has projected an import requirement of 3 GWh per year for the tariff period excluding the free energy quota of 1.703 GWh every year from WBSEB, as per the MOU for the Jaldaka power project in India.
Table 17 – BPC’s import projection for the tariff period
2013/14 2014/15 2015/16 BPC 3.0 3.0 3.0 DGPC 118.0 223.2 363.9 Total 121.0 226.2 366.9
The BEA has consulted the DHPS on the energy banking arrangement and has found that the energy banking agreement is yet to be signed.
The BEA has decided that the cost of import incurred by the DGPC is going to be passed on to the BPC at the DGPC‘s average export price, which is currently 1.98Nu/kWh.
The BEA viewed that using the forecasted import figures was not appropriate and decided that the tariff calculations should be based on DGPC’s power imports of 2012 shown in Table 15 adjusted for increasing domestic consumption during the lean season. This import allowance of 150 GWh per year shall also cover the energy banking arrangement costs as and when it comes into place. The average annual import cost is estimated to Nu. 297 Million. The DGPC can over the next three years at maximum bill the BPC a sum of 3 x 297= Nu 891

22
Million for recovery of import costs. The weighted average import price is estimated to be 1.97 Nu/kWh for the total import volume for both the BPC and the DGPC imports and the import volumes will be as in Table 18 below.
Table 18 – Expected import volumes
2013/14 2014/15 2015/16 BPC import 4.703 4.703 4.703 DGPC import 150 150 150 Total 154.703 154.703 154.703
3.1.3 Total energy costs
The BPC has proposed to meet the above power purchase requirement through purchase from the DGPC, the BPC’s mini and micro hydro generation and through imports as shown in Table 19.
Table 19 – BPC’s proposed power purchase scheme in GWh
2013 2014 2015
Own generation 15 15 15 Imports 3 3 3 Royalty 1,011 1,063 1,069 Additional Energy 1,055 1,147 1,219 Total energy purchase forecast 2,083 2,228 2,306
The actual embedded generation has gradually decreased from 25 MU in 2009 to 15 MU in 2012 due to wear and tear of equipments and damage caused due to floods. Considering the on-going rehabilitation works, embedded generation forecast of 15 MU for the tariff period has been used.
BPC has calculated the royalty energy from DGPC as 15% of DGPC’s aggregated forecasted generation after adjusting for the auxiliary consumption and plant availability of 98%, however as per the TDR, the generation is adjusted only for auxiliary consumption. The contribution of royalty energy from DGPC has not taken into account the additional generation available from the Tsibjalumchhu diversion scheme from 2014 onwards.
The review has resulted in amendments of the import, royalty energy and purchase from the DGPC which is shown in the Table 20 below.
Table 20 – BEA’s calculated power purchase scheme in GWh
2013 2014 2015 Own generation 15 15 15
BPC Imports 4.703 4.703 4.703 Royalty Energy 1,043 1,048 1,057
Purchase from DGPC 865 998 1,065
DGPC imports 150 150 150
Total energy purchase forecast 2,078 2,215 2,292

23
These costs of power purchase from the DGPC adjusted for the losses are allocated to the HV, MV and LV customers. The cost of imports is allocated to the HV customers as per the Tariff Determination Regulation.
The total energy cost for the different customer categories are estimated by BPC as in Table 21, using a generation tariff of 1.20 Nu/kWh.
Table 21 – BPC’s estimated energy costs per customer category (Million Nu.)
2013 2014 2015 Wheeling 59 62 62 HV 1621 1705 1706 MV 198 252 315 LV 568 598 629 Total 2446 2617 2710
The changes given in Table 20 have an impact on the power purchase costs, and the BEA estimates of the energy costs per customer group using the approved generation tariff of Nu. 1.39/kWh as shown in Table 22.
Table 22 – BEA’s estimated energy costs per customer category (Million Nu.)
2013 2014 2015 Wheeling 71 70 70 HV 2,026 2,139 2,158 MV 167 213 266 LV 645 680 715 Total 2,909 3,102 3,209
3.2 Network Cost The annual network costs allocated to each Customer Group shall comprise a share of each element of the total annual network costs, where the sum of allocations across all Customer Groups shall equal the total annual network costs referred to in subsection 9.3.2 in the Tariff Determination Regulation.
[ ] [ ][ ] C
iCii
iCii
iCiiC
FALLOCFEESOMALLOCOM
AALLOCDEPAALLOCASSETWACCNETWORK
×+×+
×+××=
∑
∑∑
,
,,
Where
• NETWORKC is the network cost allocated to Customer Group “C”, in million Ngultrum;
• WACC is the Weighted Average Cost of Capital for the Licensee, determined in accordance with Section 6.6 in the TDR, as a percentage.
• ASSETi is the net historical value of assets in asset category “i”, in million Ngultrum;
24
• DEPi is the depreciation allowance for assets in asset category “i”, in million Ngultrum;
• OMi is operating and maintenance allowance for cost category “i” , in million Ngultrum;
• FEES is the allowance for fees and levies, in million Ngultrum;
• AALLOCi,C is the allocation factor to Customer Category “C” for asset-related costs in asset category “i”, as a percentage, where∑ =
C CiAALLOC 1,
• OMALLOCi,C is the allocation factor to Customer Category “C” for operating and maintenance costs in cost category “i”, as a percentage, where
∑ =C CiOMALLOC 1,
• FALLOCC is the allocation factor for fees, as a percentage, where ∑ =
C CiFALLOC 1,
3.2.1 Allowance for depreciations and return of fixed assets
As per Section 6.4 of the TDR, asset values shall be based on historical asset values. The Licensees are allowed to include interest accrued during construction (IDC) when capitalizing the assets. The BEA shall make allowance for asset additions and asset disposals and other asset value adjustments over the course of the Tariff Period.
As per Section 6.5 of the TDR, the allowance for depreciations shall be based on the economic lifetime of the assets, in accordance with Schedule B of the regulation. The allowance for depreciation allows considering asset additions and removals over the Tariff Period.
As per Section 6.6 of the TDR, the return on assets shall be determined as the product of the WACC multiplied by the net asset values at the start of any year. The net asset values used for the determination of the return on assets shall exclude any assets used for rural electrification purposes that have been paid for by donor grants.
3.2.1.1 BPC proposal
3.2.1.1.1 Asset schedule at the end of 2012 The asset values at the end of 2012 were submitted in Schedule A in the application model and the aggregate figures are shown in Table 23. The BPC states in the application that they have calculated the depreciation, accumulated depreciations and net asset values as provided in the TDR.

25
Table 23 BPC’s proposed Non-granted assets at end of 2012 (Nu. mill)
Gross value Acc. Dep Net value Dep
Buildings & land 1,620.6 402.1 1,218.5 52.9
Generation 710.7 389.3 321.4 34.3
Transmission 7,462.0 1,495.2 5,966.8 233.5
Distribution 6,051.2 1,066.9 4,984.3 192.8
Vehicles 230.0 134.1 95.9 22.3
Office equipment 649.4 340.0 309.3 90.0
Tools 183.0 95.7 87.3 12.7
Total 16,906.8 3,923.3 12,983.5 638.5
BPC stated in their proposal that any grants received by the RGoB were passed on to BPC as equity, and their view was that none of their assets should be treated as granted. The figures in Table 23 therefore contain all fixed assets of BPC.
3.2.1 Investments
The proposed investment schedule is, according to the BPC, in line with BPC’s 5-year investment plan drawn for the period 2013-2017, which in turn is in line with the RGoB’s proposed 11th FYP for the energy sector in the country. The BCP states that the investments in the next five years are geared towards network augmentation to meet increased demand for power; renewal of ageing assets to deliver better reliability in the future and to meet safety requirements; and building transmission network for the evacuation of power from the upcoming hydropower projects. The programs have been divided into two major areas – “Plan works” and “Out of plan works”. The latter one will be taken up by BPC on behalf of others agencies, but these investments are not included in the submitted investments figures in the tariff application. The estimated total annual capital outlays in 2012 costs for BPC’s investments are shown in Table 24.
Table 24 BPC’s planned capital outlay for investments in Nu. Million. 2012 values.
2013 2014 2015 2016 2017 Total
”Plan works” outlay 2,406 3, 011 1,839 1,855 1,258 10,370
”Out of plan works” outlay 5,306 9 ,484 9,273 9,124 6,083 39,270
Total annual outlay 7,712 12,495 11,112 10,979 7,341 49,640
The investment schedule for the next tariff period as proposed by the BPC in the tariff application form is shown in Table 25. The total figures for 2014 and 2015 in the tariff application form are slightly different from the figures in BPC’s proposal write-up. The investments are the capitalized amounts of the “Plan works” outlays including IDC for the projects completed in each year. For calculation of IDC BPC used an interest rate of 13.32%. The figures are based on the BPC’s investment plan for the period 2013-2017, which are in 2012 values, and have been inflated to the different capitalization years using an annual inflation rate of 8.9%.
26
Table 25 BPC’s proposed capitalization schedule in Nu. Million.
2013 2014 2015 Total
Buildings & land 230 361 475 1,066
Generation 1 2 3 6
Transmission 363 1,913 1,881 4,157
Distribution 702 1,149 746 2,596
Vehicles 35 41 46 122
Office equipment 79 114 142 335
Tools 32 50 74 157
Total 1,442 3,690 3,367 8,439
Since BPC viewed that there are no granted assets with BPC, the investment proposal in Table 25 also includes investment financed through grants from donors.
3.2.2 Proposed return on assets and depreciations
The net asset value for each year has been calculated as gross asset value less the accumulated depreciation. The proposed return on assets allowance is calculated as the product of the proposed WACC (14.02 %) and the expected net asset value at the end of each tariff year. The depreciation allowances are proposed according to their expected depreciations during the next tariff period. The figures are shown in Table 26.
Table 26 BPC proposed return on assets and depreciation allowances
Nu. Mill 2013 2014 2015
Gross asset values 18,348.7 21,978.3 25,345.7
Accumulated depreciation 4,625.0 5, 472.0 6,461.5
Net asset value 13,723.8 16,506.3 18,884.2
Return on Asset (RoA) 1,923.5 2, 313.5 2,646.8
Depreciation (DEP) 701.6 847.1 989.5
3.3 Input from stakeholders During the public hearing, some of the industrial customers expressed that the utilization of assets is less than 50% and that there is serious need for review of investments by BEA. The BCCI in their written comments submitted that the BPC has not been able to capitalize assets as proposed and the proposed investment and capitalization schedule made by BPC needs to be reviewed and scrutinized in greater detail. The BCCI also recommended that the performance factor for each asset class based on the historical trend be used to estimate a more realistic figure for the actual addition of assets for the tariff period 2013-2015. So that the adjustments can be made accordingly in the next tariff period (2016-2018) based on the actual capitalization that will be achieved for the tariff period (2013-2015).

27
The BPC in their written comments submitted that the investment in T&D assets are mainly driven by the policies of RGoB for the energy sector in the country and all the investments are approved by the relevant departments like DHPS and DRE. The same, after being vetted by these departments, are put up to BEA for approval, before the same are implemented.
The BCCI in their written comments submitted that the depreciation that was approved by BEA for the last tariff period far exceeded the actual depreciation costs incurred by BPC. Accordingly, it is recommended that this over-recovery made by BPC needs to be adjusted in the forthcoming tariff period.
The BPC in their written comments submitted that the over recovery of depreciation as submitted by BCCI is not correct as it works out to Nu. 76.95 million only as per BPC. Further, BPC stated that there isn’t any such provision in the TDR 2010 that allows adjustment in the next tariff for the over or under recovery in the previous tariff period. If this be the case, BPC should rightfully be allowed for the under recovery on account of the estimation of the energy sales forecasts which was purely done on the basis of the contracted power withdrawal of the HV customers.
The BCCI also stated that the BPC’s proposal also includes a return on assets for granted assets that were provided by the Austrian Government for electrification of Phobjikha valley. It is accordingly recommended that the asset classes funded by the Austrian Government for rural electrification works in Phobjikha valley be adjusted in determining the tariff for 2013 to 2015.
3.4 BEA review
3.4.1 Asset schedule at the end of 2012
Since BPC was of the view that all its assets should be treated as equity, BPC sought the clarification on the treatment of the funds released for Rural Electrification from the Ministry of Economic Affairs (MoEA). The MoEA in turn sought clarification from the Ministry of Finance (MoF) on the subject. The MoF vide letter No. MoF/PED/30/2013/3497 dated May 20, 2013 clarified that assets acquired through grants maybe treated as capital reserve in the book of accounts and the capital cost recovery should be as per the BEA Tariff Determination Regulation.
Based on the clarification provided by the MoF, BPC has submitted gross and net asset values, accumulated and annual depreciation for the granted assets, as shown in Table 27. The BEA has shifted these values from non-granted assets to granted assets. These assets will therefore not contribute to any return on assets, as determined in section 6.6.2 in the TDR.
Table 27 Granted fixed assets at the end of 2012 (Nu. mill)
Gross value Acc. Dep. Net value Dep
RE Distribution 1,147.4 180.4 967.0 42.5

28
Table 28 BEA reviewed non-granted fixed assets at end of 2012 (Nu. mill)
Gross value Acc. Dep. Net value Dep
Buildings and land 1,620.6 402.1 1,218.5 52.9
Generation 710.7 389.3 321.4 34.3
Transmission 7,462.0 1,495.2 5,966.8 233.5
Distribution 4, 905.7 886.8 4,018.9 150.6
Vehicles 229.2 134.0 95.2 22.1
Office equipment 649.1 340.0 309.2 90.0
Tools 182.1 95.5 86.5 12.7
TOTAL 15 ,759.4 3 ,742.9 12,016.5 596.0
3.4.2 Investments
The BPC’s total budget requirement to implement the “Plan works” in the Five Year Investment Plan (2013 – 2017) amounts to Nu. 10,369 million (2012 figures). In addition the BPC is planning to undertake investments called “Out of plan works” for an amount of Nu. 39,270 million, but these investments are not included in BPC’s proposal.
The BPC has derived the investment schedule from the Investment Plan firstly by adding expected IDC to the debt drawdown amounts, secondly by capitalizing the estimated IDC and annual capital drawdown figures in the expected year of completion, thirdly by inflating the capitalized amounts from the start of the project to the year of capitalization. BPC used an inflation rate of 8.9 %, and an interest rate of 13.32%.
The BEA found that the treatment of capital work in progress (CWIP) at the end of 2012 was not clear. At the end of 2012 the CWIP balance of BPC was Nu. 6,665 million. Further, BEA found that capitalized amounts of granted assets had to be submitted separately. Due to the huge amount of proposed investments, the BEA found it necessary to go through the investment plan with the BPC project managers to evaluate the priorities, risks and status related to each project.
Due to these issues, a meeting was held at BPC office on11/07/2013. The BPC informed that they had not included the relevant CWIP balance in the investment schedule. Out of the CWIP balance of Nu. 6,665 million, Nu 3,445 million was related to “Plan works” and should have been included in the proposal. BPC expected to capitalize Nu. 2,483 million in 2013 and Nu. 962 million in 2014. During the meeting, BPC proposed to defer several of their investment by 1 to 2 years. On 16/07/2013 the BEA received new information about investments where capitalized CWIP was included, the investment schedule was updated according to the deferred investments, and the investments in granted assets were reported separately. After correcting some minor errors in the spreadsheet model submitted by BPC, BEA asked BPC to confirm that the new figures was in line with BPC’s investment schedule. BPC confirmed this on 17/07/2013. BPC’s updated investment schedule, including also 2016, is shown in Table 29 and
Table 30.

29
Table 29 Proposed capitalization of non-granted assets, in Nu. Mill.
2013 2014 2015 2016 Total
Buildings and land 498 361 475 198 1,532
Generation 19 2 3 3 27
Transmission 1,264 835 2,382 2,202 6,683
Distribution 1,833 1,565 462 535 4,394
Vehicles 35 41 46 53 175
Office equipment 112 150 509 245 1,015
Tools 43 62 87 111 303
TOTAL 3,805 3,015 3,963 3,346 14,129
Table 30 Proposed capitalization of granted assets, Nu. Mill.
2013 2014 2015 2016 Total
Distribution 255 474 - - 729
During the 2010 tariff review, the BEA found that the actual capital expenditures in 2008 and 2009 were less than 50% of the proposed amounts, and around 57% of the approved amounts. The actual capitalized amount in 2009 was around 41% of the proposed amount and 59% of the approved amount. During the review BPC expressed that it was more optimistic about the performance for the tariff period 2010/11-2012/13.
The BEA has compared the actual capitalization in the years 2010-2013 with the figures proposed by the BPC in 2010 and the reviewed figures used by the BEA when determining the tariffs for 2010/11-2012/13.

30
Table 31 Capitalized investments compared to BPC’s proposal and BEA’s review in 2010
2010 2011 2012 20135 Total Performance
Buildings & land (Nu. Mil) BPC Proposal 256 290 266 106 918 90%
BEA Review 178 200 181 71 630 131%
Annual accounts 201 214 143 264 822 Generation (Nu. Mil)
BPC Proposal 54 31 7 06 92 19%
BEA Review 48 27 6 0 82 22%
Annual accounts 0 -1 0 19 18 Transmission (Nu. Mil)
BPC Proposal 468 910 1,299 1, 688 4,365 45%
BEA Review 395 736 1,043 1,358 3,533 55%
Annual accounts 440 -54 760 800 1,947 Distribution (Nu. Mil)
BPC Proposal 2,655 626 2,033 2,690 8,004 58%
BEA Review 2,406 499 1,678 2, 417 6,999 67%
Annual accounts 230 1,560 1,018 1,855 4,663 Vehicles, office equipment and tools (Nu. Mil)
BPC Proposal 86 499 359 360 1, 304 52%
BEA Review 60 183 223 122 588 116%
Annual accounts 90 271 274 46 681 Total (Nu. Mil)
BPC Proposal 3,519 2,356 3,964 4,844 14,683 55%
BEA Review 3,086 1,645 3,131 3, 970 11,832 69%
Annual accounts 960 1,991 2,195 2,984 8,130
From the table above it is evident that the BPC’s proposed investment schedule has been far too optimistic in the tariff period 2010/11 – 2012/13 as it was in the previous tariff period. Therefore, the total cost of supply of BPC was estimated too high due to corresponding high provision for depreciations and return on assets. One might think that this also caused that the tariffs was determined too high. However, since the tariffs are estimated as the total cost of supply per customer group divided on total consumption per customer group (discounted values), also the consumption forecast errors must be taken into consideration.
The BEA has performed a rough assessment of the impact of the forecast errors on the tariffs by inserting the actual consumption, actual capitalized investments and average inflation of 8.9% in the tariff model from 2010. The LV consumption forecasts were quite good, whereas the HV and the MV were far too high. Since wheeling is estimated as the total generation less
5 The expected annual account figures for 2013 are based on the BEA’s review. Some of the figures BPC has proposed are higher. BPC proposed Nu. 498 million for buildings and land, Nu. 1,264 million for transmission, and Nu. 191 million for vehicles, office equipment and tools. In total BPC proposed Nu. 3,805 million to be capitalized in 2013, compared to the Nu. 2,984 million reviewed by the BEA. With BPC’s estimate the overall performance would be 76%, and for transmission 68%. 6 The figure is not including investments of Nu. 2,477 million in Druk Bindu and Begana hydroelectric projects proposed by BPC, but regarded as not relevant for the tariff review by the BEA.

31
sales to BPC, the wheeling forecasts were too low. The assessment shows that the unsubsidized LV tariff and the wheeling charges were estimated too high, whilst MV and HV tariffs were estimated too low.
Table 32 Approved vs assessed unsubsidized cost of supply per kWh
Wheeling HV MV LV
Approved 0.111 1.74 2.54 4.21
Assessed 0.097 1.86 3.82 3.66
From this assessment it is evident that HV customers have benefited from the forecast errors, whilst DGPC has lost. Since MV and LV customers are subsidized, they have not lost. However, the RGoB could have allocated less subsidies to maintain the LV and MV at the approved level.
The BEA has reviewed the proposed investment schedule based on the information submitted by BPC, the status of the different projects at the middle of July 2013, the expected risks related to the different projects, and BPC’s investment performance in the past. The BEA has assumed an annual inflation rate of 7.94 % and an interest rate of 9.5% for calculation of IDC.
Based on the status of the ongoing transmission projects BEA viewed that it is likely that some of the investments will not be capitalized before 2014. BEA viewed that in general the transmission investments were too optimistic when taking into account the need for such investments, and thought that several of the projects will be deferred compared to BPC’s plans. The BEA also viewed that taking into account the huge amount of “Out of plan” investment BPC plans to undertake in the next five years (Nu. 39,270 million, compared to Nu. 12.885 million for the previous five year period), it is likely that they may not be able to perform even as much as the current tariff period when it comes to investments.
For distribution the BEA found the proposal more realistic. However, the BEA found it likely that some projects will be delayed compared to BPC’s plans and adjusted the proposed figures accordingly. The BEA viewed that the proposed investments for building and lands, vehicles, office equipment and tools in general were too high compared to the needs for such investments and reduced the figures.
Table 33 BEA’s reviewed. capitalized investments schedule in Nu. Million.
2013 2014 2015 2016 Total
Buildings & land 400 250 180 260 1,090
Generation 19 2 3 3 27
Transmission 800 500 200 1,200 2,700
Distribution 1,600 1,400 500 400 3,900
Vehicles 18 20 23 26 86
Office equipment 63 69 94 329 555
Tools 29 40 54 69 192
Total 2,928 2,281 1,054 2,286 8,549

32
3.4.3 Return on assets and depreciations
The BPC has proposed that the return on assets shall be based on the capitalized amount at the end of each tariff year. As per the TDR, Schedule 6.6.1, the return on assets shall be determined as the product of the WACC multiplied by the net asset values at the start of any year. To estimate the expected net asset value in the beginning of a tariff year, the BEA has taken the average of the opening and closing balance of the relevant calendar year.
The depreciation allowance shall reflect the expected annual depreciations during a tariff year. The books of accounts for 2012 will not reflect the full amount of annual depreciations for investments capitalized during 2012. Therefore, the BEA has added 50 % of the estimated annual depreciations for the 2012 investments when calculating the annual depreciations from 2013 and onwards. The investments from 2013 are assumed to be capitalized in the middle of any tariff year, and hence, the first year only 50 % of the annual depreciations are allowed. The BEA has converted the expected depreciations in calendar years to tariff years by taking 50 % of the depreciations from each of the calendar years enclosing the tariff year.
Based on the review of the asset schedule of 2012, the investment plan of 2013-2016, the approved WACC and all other factors taken into consideration, the approved return on assets and depreciation allowances for the next tariff period are as in Table 34.
Table 34 Approved return on assets and depreciation allowances
2013/14 2014/15 2015/16
Gross asset values 17,223 19,828 21,495
Accumulated dep 4,307 5,121 6,042
Net asset value 14,192 16,347 17,330
Return on Asset (RoA) 1,233 1,407 1,483
Depreciation (DEP) 814 921 1,018
4 O&M allowances The O&M cost allowance is determined as per Section 6.3 of the TDR. The Operating and Maintenance allowance shall incorporate expenses including, but not limited to, salaries and wages, transportation expenses, insurance of assets, maintenance expenses, office materials, rentals, consumables and all such expenses that are treated as recurrent costs under standard accounting practices.
The determination of the operating and maintenance allowance shall take into consideration historical costs, as adjusted for inflation, incurred by the Licensee; industry benchmarks applicable to the Licensee; opportunities for efficiency improvements; and may include comparison with benchmarks from comparable utilities in the region.
The determination of the operating and maintenance allowance shall take into consideration additional costs associated with new assets and growth in the customer base, using appropriate industry benchmarks applicable to the Licensee.

33
4.1 BPC proposal Considering the difficulties inherent in the estimation of any parameters that drive O&M allowance, BPC believes that the benchmark O&M, efficiency gain, and percent benchmark O&M established by the Authority is too stringent for BPC considering the Bhutanese economy and the topographical condition under which BPC operates.
The BPC has proposed an O&M allowance of Nu. 981 million, the actual O&M cost of the year 2012, instead of the average historical O&M cost of 2010, 2011 and 2012. Further, BPC propose an increase in the O&M benchmark allowance for the transmission assets from 1 % to 2 %. The BPC expects the O&M costs for the transmission assets to increase in the forthcoming tariff period considering the ageing pre-corporatization transmission assets and the substantial transmission network expansion.
Table 35 BPC's proposed O&M Benchmarks
BPC TDR
Micro and mini hydro 2.5 % 2.5 %
Diesel generation 10.0 % 10.0 %
Transmission 2.0 % 1.0 %
Distribution 3.0 % 3.0 %
Other 2.0 % 2.0 %
The O&M allowance figures for the period 2013-2016 proposed by the BPC are calculated based on the allowance for the base year, adding annual allowances for the investment schedule in each year (2013-2015) multiplied with the proposed benchmarks in Table 35. The proposed O&M allowances are shown in Table 36.
Table 36 Total O&M allowances proposed by BPC
2013 2014 2015
OM allowances (Nu. Mill) 1,104 1,286 1,475
The O&M allowances are adjusted for inflation using an annual inflation rate of 8.9 %. The BPC has proposed using 0 % efficiency gains on O&M costs during the tariff period.
4.2 Input from stakeholders The BCCI in their written comments submitted that the BPC has not shown any figures for rental income and this has not been reflected in the analysis. Therefore, the income from this source needs to be provided by BPC.
The BCCI submitted that, as per schedule 14 of the annual report of BPC for 2011 and 2012, Nu. 25.081 million and Nu. 38.059 million is shown under “other miscellaneous expenses” for the two years respectively while for 2010, only Nu. 11.807 million was booked under the same budget head. Based on this information being made available by BPC, the allowable O&M costs for 2011 and 2012 needs to be readjusted accordingly.
The BCCI also recommended that the costs incurred for O&M be reviewed thoroughly as a lot of inadmissible costs have been assumed by BPC for calculating the benchmark O&M costs.

34
The BCCI submitted that the benchmark O&M rates for the various activities (Generation, Transmission, Distribution and Others) needs to be reviewed by the BEA and revised accordingly as application of these benchmark values to the Current Replacement Cost (CRC) of BPC’s does not yield or reflect the actual or prudent O&M costs incurred by BPC.
The BPC in their written comments submitted that the allocated 1% O&M benchmark for the transmission assets to be capitalized in the next three years would be grossly inadequate considering the terrain, limitation for use of automation, and other unique constraints and challenges that are particular to BPC. The BPC also stated that the present O&M costs in the Financial Statements of BPC do not reflect any costs associated with insurance and the BPC is presently apportioning part of the general reserves as Insurance reserve for the T&D Assets. Accordingly, the BPC request BEA for making additional provision for the same either through increased provisions under allowable O&M costs or through increase in RoE.
4.3 BEA review The breakup of the proposed O&M allowances proposed by BPC is shown in Table 37.
Table 37 Break up of O&M allowances proposed by BPC
2012 2013 2014 2015 O&M 2012 allowance 980.5 1,067.8 1,162.9 1,266.3
O&M additions 2013 investments 35.9 39.1 42.5
O&M additions 2014 investments 84.1 91.6
O&M additions 2015 investments 74,8
O&M allowances (rounded off) 981 1,104 1,286 1,475
As per Schedule A of the TDR, the benchmark O&M cost allowance is 1 % for transmission. Multiplying the current O&M benchmarks with the estimated current replacement costs, the benchmarked O&M works out to Nu. 505 million.
Table 38 O&M Benchmarks based on Current Replacement Cost (CRC) of the assets as of 2012
Benchmark O&M Current
Replacement Cost (2012)
Benchmark O&M (2012)
Proposed O&M
Micro and mini hydro 2.50 % 1,437 35.9 69.8
Transmission 1.00 % 11,985 119.8 232.8
Distribution 3.00 % 8,509 255.3 495.9
Other 2.00 % 4,687 93.7 182.1
Total 26,617 505 981
The historical O&M costs of BPC are shown in Table 39.
Table 39 Estimated historical O&M costs for BPC (2012 values)
O&M costs 2010 2011 2012 Average
Nominal values (Nu. Mill) 669.5 757.6 980.5 802.5
2012 values (Nu. Mill) 779.4 824.3 980.5 861.4
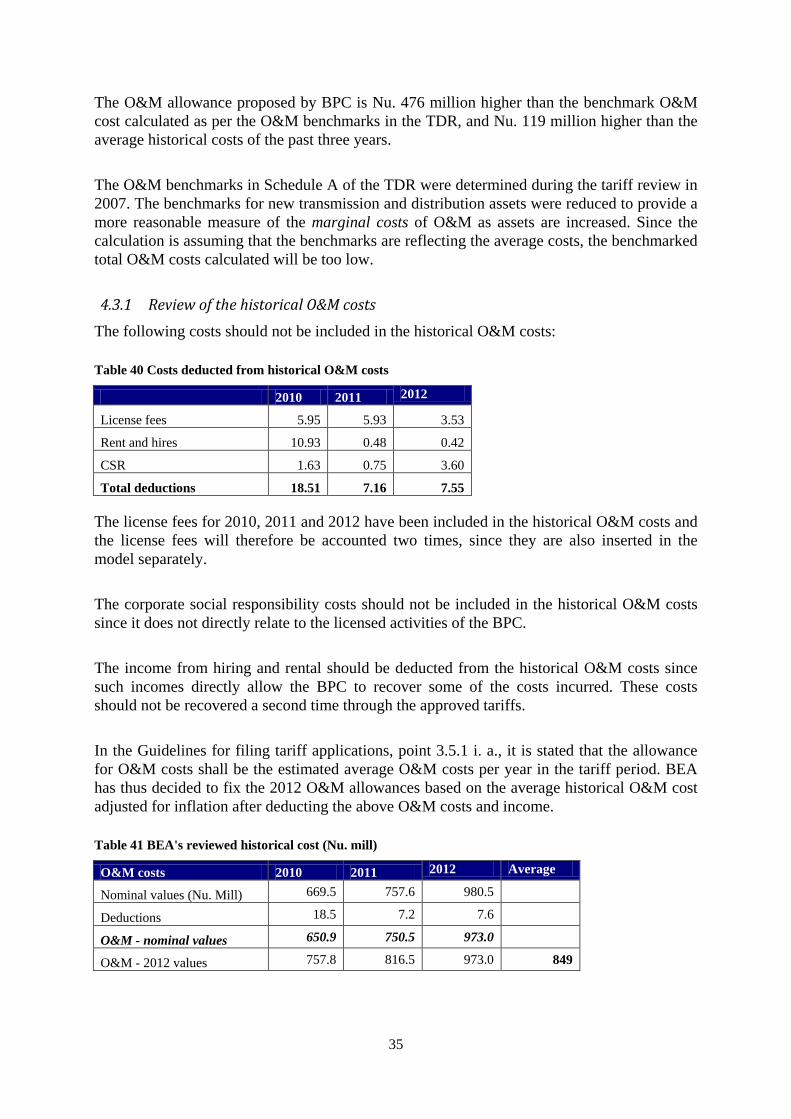
35
The O&M allowance proposed by BPC is Nu. 476 million higher than the benchmark O&M cost calculated as per the O&M benchmarks in the TDR, and Nu. 119 million higher than the average historical costs of the past three years.
The O&M benchmarks in Schedule A of the TDR were determined during the tariff review in 2007. The benchmarks for new transmission and distribution assets were reduced to provide a more reasonable measure of the marginal costs of O&M as assets are increased. Since the calculation is assuming that the benchmarks are reflecting the average costs, the benchmarked total O&M costs calculated will be too low.
4.3.1 Review of the historical O&M costs
The following costs should not be included in the historical O&M costs:
Table 40 Costs deducted from historical O&M costs
2010 2011 2012
License fees 5.95 5.93 3.53
Rent and hires 10.93 0.48 0.42
CSR 1.63 0.75 3.60
Total deductions 18.51 7.16 7.55
The license fees for 2010, 2011 and 2012 have been included in the historical O&M costs and the license fees will therefore be accounted two times, since they are also inserted in the model separately.
The corporate social responsibility costs should not be included in the historical O&M costs since it does not directly relate to the licensed activities of the BPC.
The income from hiring and rental should be deducted from the historical O&M costs since such incomes directly allow the BPC to recover some of the costs incurred. These costs should not be recovered a second time through the approved tariffs.
In the Guidelines for filing tariff applications, point 3.5.1 i. a., it is stated that the allowance for O&M costs shall be the estimated average O&M costs per year in the tariff period. BEA has thus decided to fix the 2012 O&M allowances based on the average historical O&M cost adjusted for inflation after deducting the above O&M costs and income.
Table 41 BEA's reviewed historical cost (Nu. mill)
O&M costs 2010 2011 2012 Average
Nominal values (Nu. Mill) 669.5 757.6 980.5
Deductions 18.5 7.2 7.6
O&M - nominal values 650.9 750.5 973.0
O&M - 2012 values 757.8 816.5 973.0 849

36
4.3.2 Review of O&M benchmarks
The BPC has proposed to increase the benchmarks for the transmission category from 1 % to 2 %. BPC justify this increase with an expected increase in the O&M costs for these assets in the forthcoming period, mainly due to ageing pre-corporatization transmission assets and a substantial transmission network expansion.
The BEA has decided to set the O&M benchmarks only for the new investments, as was done in the 2007 and 2010 reviews. The benchmarks shall therefore reflect the marginal costs and not the average cost. Some of the investments in transmission assets are related to rehabilitation and replacement of old assets, which should reduce the O&M costs rather than increase them. Thus, only new assets should affect the O&M benchmark. If we divide the average O&M cost for transmission assets with the 2012 replacement cost for the same type of assets, it results in 1.7 %. This indicates that an O&M benchmark of 2 % for transmission is too high. BEA will use an O&M benchmark of 1 % for transmission assets.
Table 42 BEA's approved O&M benchmarks
2007/10 2010/13 2013/16
Micro and mini hydro 2.5 % 2.5 % 2.5 %
Diesel generation 10.0 % 10.0 % 10.0 %
Transmission 1.0 % 1.0 % 1.0 %
Distribution 2.0 % 3.0 % 3.0 %
Other 2.0 % 2.0 % 2.0 %
4.3.3 Efficiency gains
BPC propose an O&M efficiency gain target of 0 % in the tariff period. This target is justified by the lack of an objective framework for determining efficiency gains in the regulation. Further, BPC submits that the increasing O&M expenses expected to be incurred for the maintenance of ageing transmission and distribution assets from the 1980’s and expanding RE network maintenance costs calls for a review of the logic to determine O&M efficiency gains.
BEA’s view is that several circumstances indicate that there should be possibilities of efficiency gains in the next tariff period: (1) Bhutan is a fast developing country, a general increase in efficiency should be expected; (2) and several of the investments in BPC’s investment plan will probably improve their efficiency. Based on the above reasons, BEA has decided to fix an annual O&M efficiency target of 2 %.
5 Regulatory fees allowances As per the Fees and Charges of the Regulatory Fees Regulation, Schedule 1, the license fee for transmission and distribution is calculated as 0.2 % of revenues from electricity tariff. Provided that the annual License fee shall be payable in advance, at the commencement of the financial year based on estimated revenue for the ensuing financial year as determined by the Authority.

37
5.1.1 BPC proposal
The BPC has proposed regulatory fees as shown in Table 43, according to the “Regulatory Fees Regulations of 2006”. The regulatory fees also include the expected system operator (Bhutan Power System Operator) fees of Nu. 14 million each year.
Table 43 BPC's proposed regulatory fees (Nu. mill)
2013/14 2014/15 2015/16
Regulatory fees 22 22 22
5.1.2 Input from stakeholders
The BCCI in their written comments requested BEA to verify if the inclusion of Nu. 14 million annually for the National Load Dispatch Centre (NLDC) is justifiable and allowable by BEA or not.
5.1.3 BEA review
BEA viewed that the expected system operator fee was not relevant for this tariff review. Based on the approved tariffs, the BEA has estimated the regulatory fees shown in Table 44.
Table 44 BEA's estimated regulatory fees (Nu. mill)
2013/14 2014/15 2015/16
Regulatory fees 8.60 10.00 11.39
5.2 The Return on Working Capital allowance The allowance for Return on Working Capital is regulated in the TDR Section 9.4.2. The allowance is calculated as:
×+××= cc
ccc IALLOCSINVENTORIEARREARSREVENUEWACCWC 365
Where
• WCc is the cost of working capital allocated to Customer Group “c” in million Ngultrum;
• WACC is the Weighted Average Cost of Capital for the licensee determined in accordance with the TDR Section 6.6 as a percentage;
• INVENTORIESc is the allowance for the value of inventories in million Ngultrum;
• IALLOCc is the allocation factor to Customer Group “c” for inventories, as a percentage;
• REVENUE is the Cost of Supply for a Customer Group (Costc) less the Working Capital (WCc);
• ARREARSc is the allowed days receivables for a Customer Group, in days.
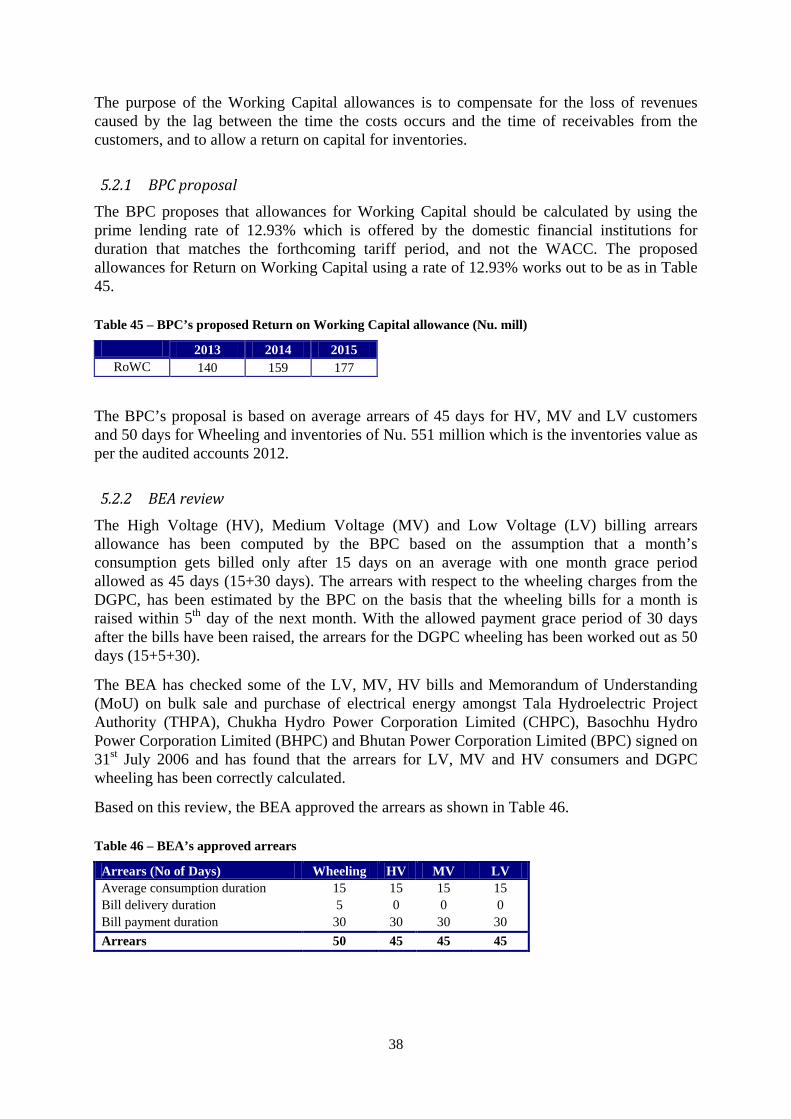
38
The purpose of the Working Capital allowances is to compensate for the loss of revenues caused by the lag between the time the costs occurs and the time of receivables from the customers, and to allow a return on capital for inventories.
5.2.1 BPC proposal
The BPC proposes that allowances for Working Capital should be calculated by using the prime lending rate of 12.93% which is offered by the domestic financial institutions for duration that matches the forthcoming tariff period, and not the WACC. The proposed allowances for Return on Working Capital using a rate of 12.93% works out to be as in Table 45.
Table 45 – BPC’s proposed Return on Working Capital allowance (Nu. mill)
2013 2014 2015 RoWC 140 159 177
The BPC’s proposal is based on average arrears of 45 days for HV, MV and LV customers and 50 days for Wheeling and inventories of Nu. 551 million which is the inventories value as per the audited accounts 2012.
5.2.2 BEA review
The High Voltage (HV), Medium Voltage (MV) and Low Voltage (LV) billing arrears allowance has been computed by the BPC based on the assumption that a month’s consumption gets billed only after 15 days on an average with one month grace period allowed as 45 days (15+30 days). The arrears with respect to the wheeling charges from the DGPC, has been estimated by the BPC on the basis that the wheeling bills for a month is raised within 5th day of the next month. With the allowed payment grace period of 30 days after the bills have been raised, the arrears for the DGPC wheeling has been worked out as 50 days (15+5+30).
The BEA has checked some of the LV, MV, HV bills and Memorandum of Understanding (MoU) on bulk sale and purchase of electrical energy amongst Tala Hydroelectric Project Authority (THPA), Chukha Hydro Power Corporation Limited (CHPC), Basochhu Hydro Power Corporation Limited (BHPC) and Bhutan Power Corporation Limited (BPC) signed on 31st July 2006 and has found that the arrears for LV, MV and HV consumers and DGPC wheeling has been correctly calculated.
Based on this review, the BEA approved the arrears as shown in Table 46.
Table 46 – BEA’s approved arrears
Arrears (No of Days) Wheeling HV MV LV Average consumption duration 15 15 15 15 Bill delivery duration 5 0 0 0 Bill payment duration 30 30 30 30 Arrears 50 45 45 45

39
The BPC proposed inventory of Nu 551 million, which is the value reported in the statutory audited balance sheet of 31st December 2012. The approved inventory during the 2010 tariff review was Nu 370 million. As the proposed inventory in 2013 tariff review is higher than approved in 2010 tariff review, the BEA requested for detail justification for the proposed inventory. Based on the justification provided by the BPC, the BEA found out that the inventory proposed by the BPC for the next tariff period is the value of the inventory on the balance sheet as on 31.12.2012. Hence, BPC expects that they will be using the proposed inventory for the next tariff period considering their past experience.
Regarding the substantial increase of inventory from 2010-2011, the BPC confirmed that it was mainly on account of the inclusion of the balance materials of Rural Electrification Project of Nu 36.792 million, and MHPA capital works of Nu 22.447 million, and ISU/Billing material worth of Nu 66.537 million as on 31.12.2011. The BEA verified the clarifications provided on the inventories by the BPC.
Based on the BEA’s review and the BPC’s confirmation, the BEA is of the view that the proposed inventories of Nu. 551 million is high since all the RE works are completing in 2013. Hence, the BEA calculated the inventory of Nu. 527 million, which is the average inventories for 2010-2012 deducted for MHPA balance materials and adjusted for inflation as shown in the table below. However, with the completion of the RE works by 2014, the inventories will decrease.
Table 47 – BEA reviewed Inventories
(Nu. mill) 2010 2011 2012 Average BPC proposal 365 579 551 498 deductions 22 Inventories (nominal) 365 557 551 Inventories (2012) 425 606 551 527
Based on the review, the BEA approved the inventories of Nu. 500 million.
5.3 Non Tariff Revenues The Non-Tariff Revenue is the revenue collected from customers that does not arise from the sale of electricity, such as application fees, connection fees and meter test fees etc. According to the TDR Section 9.5.2 non-tariff revenues (REV) shall be deducted from the cost of supply before calculating the tariffs.
5.3.1 BPC proposal
The BPC proposes non-tariff revenue for each of the forthcoming tariff period based on the average historical non-tariff revenue for the past three years excluding income from fixed deposits and deposit works and has been allocated to each customer category based on the number of customers. The BPC states that the BPC has not forecasted tariff revenue for each year of the forthcoming tariff period as percentage of the forecasted tariff revenue because the amount of non-tariff revenue has no relationship with the amount of tariff revenue earned and vice versa. The BPC also states that the BPC has allocated the forecasted non-tariff revenue for each year of the forthcoming tariff period to each customer category in the ratio of number of customers in each category as it is difficult to maintain customer category-wise non-tariff revenue record.
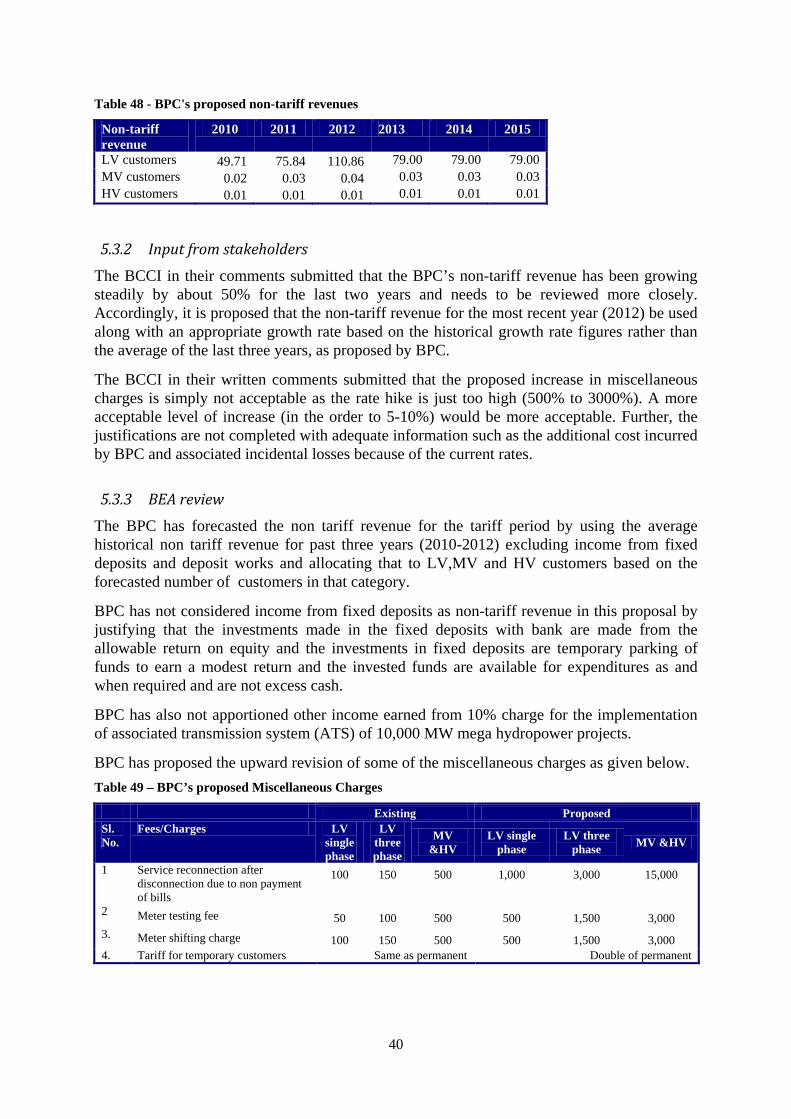
40
Table 48 - BPC's proposed non-tariff revenues
Non-tariff revenue
2010 2011 2012 2013 2014 2015
LV customers 49.71 75.84 110.86 79.00 79.00 79.00 MV customers 0.02 0.03 0.04 0.03 0.03 0.03 HV customers 0.01 0.01 0.01 0.01 0.01 0.01
5.3.2 Input from stakeholders
The BCCI in their comments submitted that the BPC’s non-tariff revenue has been growing steadily by about 50% for the last two years and needs to be reviewed more closely. Accordingly, it is proposed that the non-tariff revenue for the most recent year (2012) be used along with an appropriate growth rate based on the historical growth rate figures rather than the average of the last three years, as proposed by BPC.
The BCCI in their written comments submitted that the proposed increase in miscellaneous charges is simply not acceptable as the rate hike is just too high (500% to 3000%). A more acceptable level of increase (in the order to 5-10%) would be more acceptable. Further, the justifications are not completed with adequate information such as the additional cost incurred by BPC and associated incidental losses because of the current rates.
5.3.3 BEA review
The BPC has forecasted the non tariff revenue for the tariff period by using the average historical non tariff revenue for past three years (2010-2012) excluding income from fixed deposits and deposit works and allocating that to LV,MV and HV customers based on the forecasted number of customers in that category.
BPC has not considered income from fixed deposits as non-tariff revenue in this proposal by justifying that the investments made in the fixed deposits with bank are made from the allowable return on equity and the investments in fixed deposits are temporary parking of funds to earn a modest return and the invested funds are available for expenditures as and when required and are not excess cash.
BPC has also not apportioned other income earned from 10% charge for the implementation of associated transmission system (ATS) of 10,000 MW mega hydropower projects.
BPC has proposed the upward revision of some of the miscellaneous charges as given below. Table 49 – BPC’s proposed Miscellaneous Charges
Existing Proposed Sl. No.
Fees/Charges LV single phase
LV three phase
MV &HV
LV single phase
LV three phase MV &HV
1 Service reconnection after disconnection due to non payment of bills
100 150 500 1,000 3,000 15,000
2 Meter testing fee 50 100 500 500 1,500 3,000 3. Meter shifting charge 100 150 500 500 1,500 3,000 4. Tariff for temporary customers Same as permanent Double of permanent

41
BEA while reviewing the proposed miscellaneous charges found no reason to increase the charges from the existing rates. Considering the number of customers who will be added in 2013 and 2014 and contribute to the non tariff revenue, Nu. 110 million for LV and Nu. 0.04 million for MV and Nu. 0.01 million for HV has been taken into consideration as non tariff revenue for the tariff period.
5.4 Total cost of supply The BPC has calculated the cost of supply for the tariff period 2013 - 2015 and is shown in Table 50.
Table 50 –BPC’s proposed total cost of supply in Nu. Million
2013 2014 2015 Energy cost (unsubsidized) 2,436 2,606 2,698 Network cost 3,571 4,217 4,800
Return on assets (RoA) 1,924 2,314 2,647 Depreciation (DEP) 702 847 990 O&M (OM) 926 1,036 1,143 Fees 20 21 21
Return on working capital (WC) 125 141 157 Other revenue (REV) (79) (79) (79) Total 6,053 6,886 7,577
These cost projections are based on the factors described above, and are especially affected by the generation tariff, the investment forecast which has an impact on depreciation, the return allowance, and the growth in O&M costs.
BPC’s overall costs of supply increase during the period 2013-2015 by 8 % per annum and the overall network costs increase over the period by 11 %.
6 Cost allocation and subsidies The costs of supply for each customer group have to be determined. Asset, O&M, and import costs, as well as fees and inventories, must be allocated across customer groups. According to the TDR, this shall be done using allocation factors. The allocation factors are listed in the TDR Schedule F, except for the import cost allocation which is found in Section 9.5.2. The import allocation factor for the HV customer group equals one (1), and for other customer groups equals zero. The TDR allows the allocation factors in Schedule F to be updated from time to time.
6.1 BPC’s proposal The BPC has proposed O&M, fees, inventory and asset allocation factors as specified in Schedule F of the TDR.
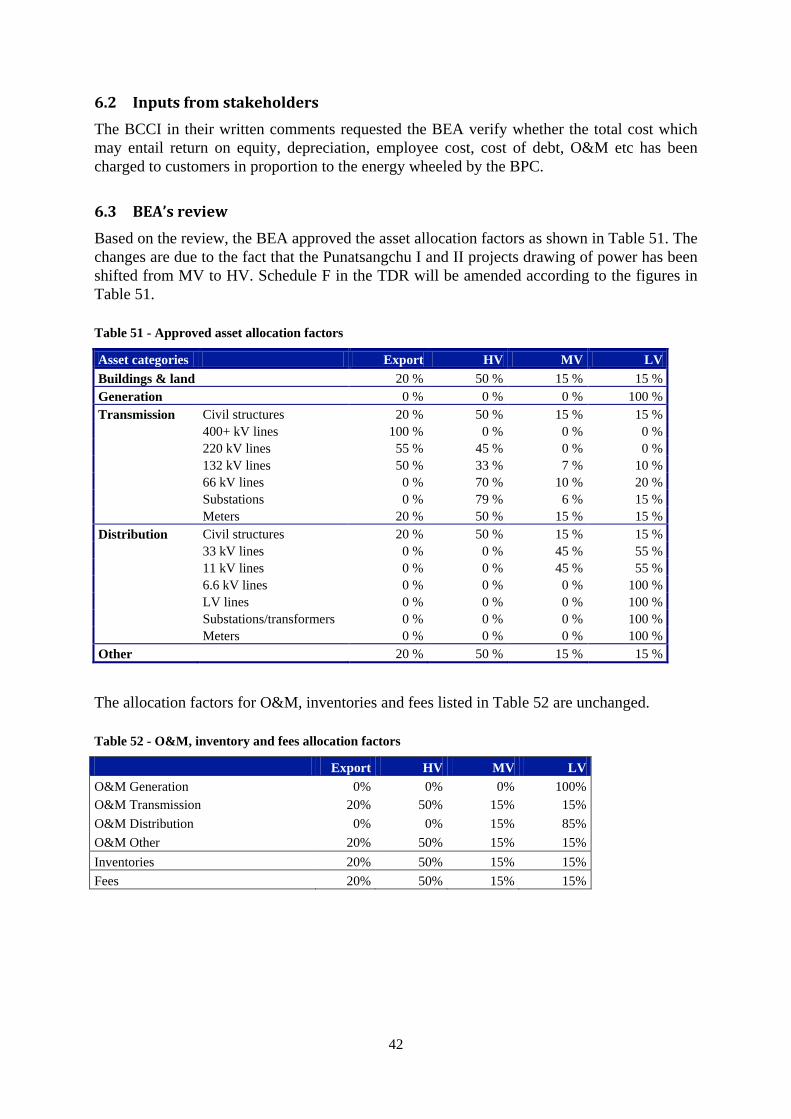
42
6.2 Inputs from stakeholders The BCCI in their written comments requested the BEA verify whether the total cost which may entail return on equity, depreciation, employee cost, cost of debt, O&M etc has been charged to customers in proportion to the energy wheeled by the BPC.
6.3 BEA’s review Based on the review, the BEA approved the asset allocation factors as shown in Table 51. The changes are due to the fact that the Punatsangchu I and II projects drawing of power has been shifted from MV to HV. Schedule F in the TDR will be amended according to the figures in Table 51.
Table 51 - Approved asset allocation factors
Asset categories Export HV MV LV Buildings & land 20 % 50 % 15 % 15 % Generation 0 % 0 % 0 % 100 % Transmission Civil structures 20 % 50 % 15 % 15 % 400+ kV lines 100 % 0 % 0 % 0 % 220 kV lines 55 % 45 % 0 % 0 % 132 kV lines 50 % 33 % 7 % 10 % 66 kV lines 0 % 70 % 10 % 20 % Substations 0 % 79 % 6 % 15 % Meters 20 % 50 % 15 % 15 % Distribution Civil structures 20 % 50 % 15 % 15 % 33 kV lines 0 % 0 % 45 % 55 % 11 kV lines 0 % 0 % 45 % 55 % 6.6 kV lines 0 % 0 % 0 % 100 % LV lines 0 % 0 % 0 % 100 % Substations/transformers 0 % 0 % 0 % 100 % Meters 0 % 0 % 0 % 100 % Other 20 % 50 % 15 % 15 %
The allocation factors for O&M, inventories and fees listed in Table 52 are unchanged.
Table 52 - O&M, inventory and fees allocation factors
Export HV MV LV O&M Generation 0% 0% 0% 100% O&M Transmission 20% 50% 15% 15% O&M Distribution 0% 0% 15% 85% O&M Other 20% 50% 15% 15% Inventories 20% 50% 15% 15% Fees 20% 50% 15% 15%
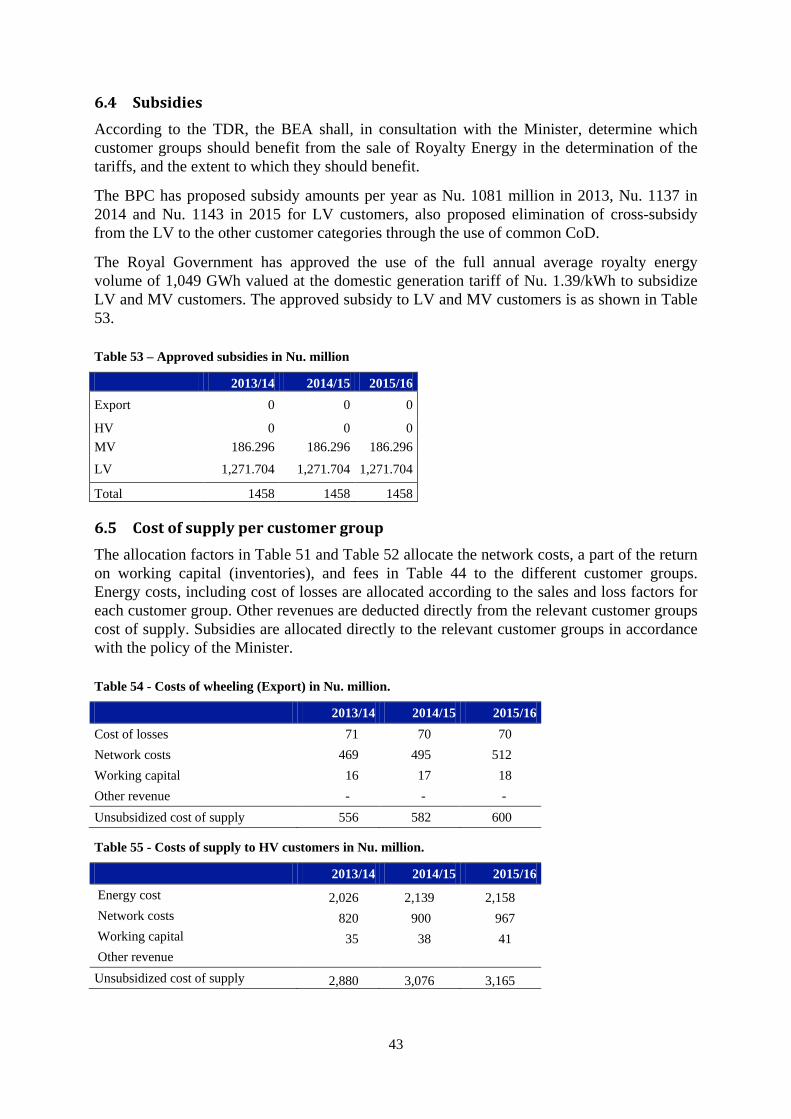
43
6.4 Subsidies According to the TDR, the BEA shall, in consultation with the Minister, determine which customer groups should benefit from the sale of Royalty Energy in the determination of the tariffs, and the extent to which they should benefit.
The BPC has proposed subsidy amounts per year as Nu. 1081 million in 2013, Nu. 1137 in 2014 and Nu. 1143 in 2015 for LV customers, also proposed elimination of cross-subsidy from the LV to the other customer categories through the use of common CoD.
The Royal Government has approved the use of the full annual average royalty energy volume of 1,049 GWh valued at the domestic generation tariff of Nu. 1.39/kWh to subsidize LV and MV customers. The approved subsidy to LV and MV customers is as shown in Table 53.
Table 53 – Approved subsidies in Nu. million
2013/14 2014/15 2015/16 Export 0 0 0
HV 0 0 0 MV 186.296 186.296 186.296
LV 1,271.704 1,271.704 1,271.704
Total 1458 1458 1458
6.5 Cost of supply per customer group The allocation factors in Table 51 and Table 52 allocate the network costs, a part of the return on working capital (inventories), and fees in Table 44 to the different customer groups. Energy costs, including cost of losses are allocated according to the sales and loss factors for each customer group. Other revenues are deducted directly from the relevant customer groups cost of supply. Subsidies are allocated directly to the relevant customer groups in accordance with the policy of the Minister.
Table 54 - Costs of wheeling (Export) in Nu. million.
2013/14 2014/15 2015/16 Cost of losses 71 70 70 Network costs 469 495 512 Working capital 16 17 18 Other revenue - - - Unsubsidized cost of supply 556 582 600
Table 55 - Costs of supply to HV customers in Nu. million.
2013/14 2014/15 2015/16 Energy cost 2,026 2,139 2,158 Network costs 820 900 967 Working capital 35 38 41 Other revenue Unsubsidized cost of supply 2,880 3,076 3,165
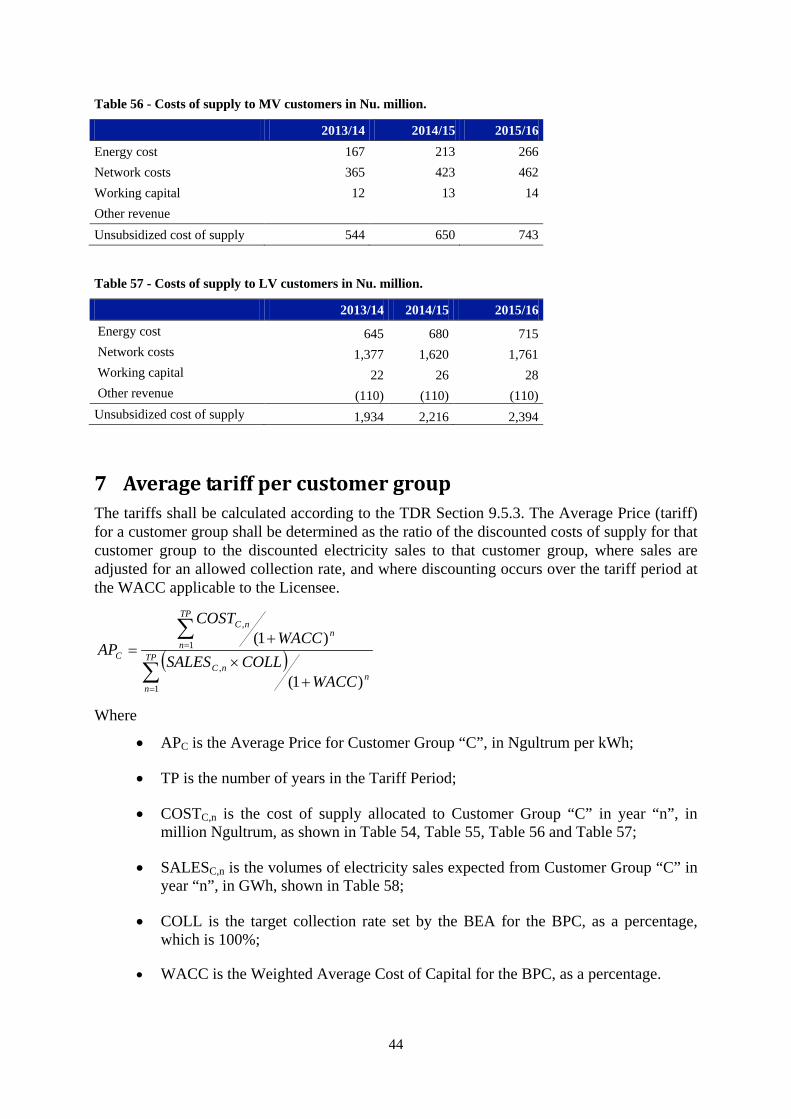
44
Table 56 - Costs of supply to MV customers in Nu. million.
2013/14 2014/15 2015/16 Energy cost 167 213 266 Network costs 365 423 462 Working capital 12 13 14 Other revenue Unsubsidized cost of supply 544 650 743
Table 57 - Costs of supply to LV customers in Nu. million.
2013/14 2014/15 2015/16 Energy cost 645 680 715 Network costs 1,377 1,620 1,761 Working capital 22 26 28 Other revenue (110) (110) (110) Unsubsidized cost of supply 1,934 2,216 2,394
7 Average tariff per customer group The tariffs shall be calculated according to the TDR Section 9.5.3. The Average Price (tariff) for a customer group shall be determined as the ratio of the discounted costs of supply for that customer group to the discounted electricity sales to that customer group, where sales are adjusted for an allowed collection rate, and where discounting occurs over the tariff period at the WACC applicable to the Licensee.
( )∑
∑
=
=
+×
+= TP
nn
nC
TP
nn
nC
C
WACCCOLLSALES
WACCCOST
AP
1
,
1
,
)1(
)1(
Where
• APC is the Average Price for Customer Group “C”, in Ngultrum per kWh;
• TP is the number of years in the Tariff Period;
• COSTC,n is the cost of supply allocated to Customer Group “C” in year “n”, in million Ngultrum, as shown in Table 54, Table 55, Table 56 and Table 57;
• SALESC,n is the volumes of electricity sales expected from Customer Group “C” in year “n”, in GWh, shown in Table 58;
• COLL is the target collection rate set by the BEA for the BPC, as a percentage, which is 100%;
• WACC is the Weighted Average Cost of Capital for the BPC, as a percentage.
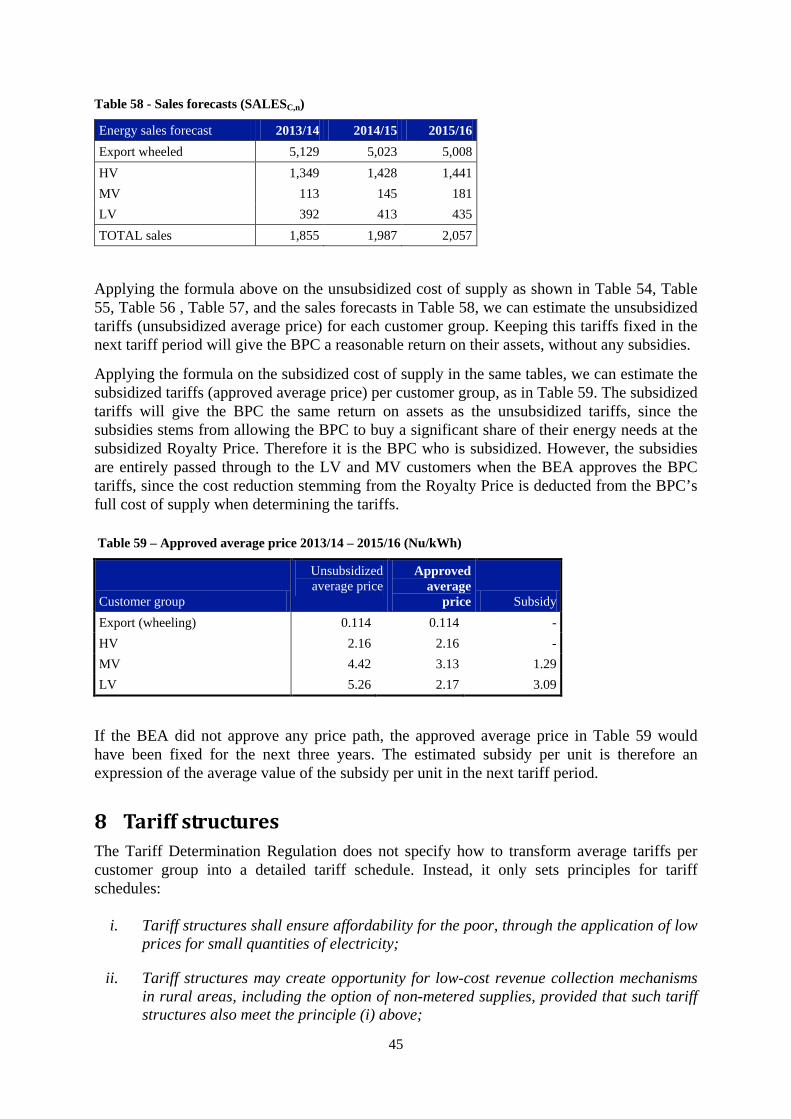
45
Table 58 - Sales forecasts (SALESC,n)
Energy sales forecast 2013/14 2014/15 2015/16 Export wheeled 5,129 5,023 5,008 HV 1,349 1,428 1,441 MV 113 145 181 LV 392 413 435 TOTAL sales 1,855 1,987 2,057
Applying the formula above on the unsubsidized cost of supply as shown in Table 54, Table 55, Table 56 , Table 57, and the sales forecasts in Table 58, we can estimate the unsubsidized tariffs (unsubsidized average price) for each customer group. Keeping this tariffs fixed in the next tariff period will give the BPC a reasonable return on their assets, without any subsidies.
Applying the formula on the subsidized cost of supply in the same tables, we can estimate the subsidized tariffs (approved average price) per customer group, as in Table 59. The subsidized tariffs will give the BPC the same return on assets as the unsubsidized tariffs, since the subsidies stems from allowing the BPC to buy a significant share of their energy needs at the subsidized Royalty Price. Therefore it is the BPC who is subsidized. However, the subsidies are entirely passed through to the LV and MV customers when the BEA approves the BPC tariffs, since the cost reduction stemming from the Royalty Price is deducted from the BPC’s full cost of supply when determining the tariffs.
Table 59 – Approved average price 2013/14 – 2015/16 (Nu/kWh)
Customer group
Unsubsidized average price
Approved average
price Subsidy Export (wheeling) 0.114 0.114 - HV 2.16 2.16 - MV 4.42 3.13 1.29 LV 5.26 2.17 3.09
If the BEA did not approve any price path, the approved average price in Table 59 would have been fixed for the next three years. The estimated subsidy per unit is therefore an expression of the average value of the subsidy per unit in the next tariff period.
8 Tariff structures The Tariff Determination Regulation does not specify how to transform average tariffs per customer group into a detailed tariff schedule. Instead, it only sets principles for tariff schedules:
i. Tariff structures shall ensure affordability for the poor, through the application of low prices for small quantities of electricity;
ii. Tariff structures may create opportunity for low-cost revenue collection mechanisms in rural areas, including the option of non-metered supplies, provided that such tariff structures also meet the principle (i) above;
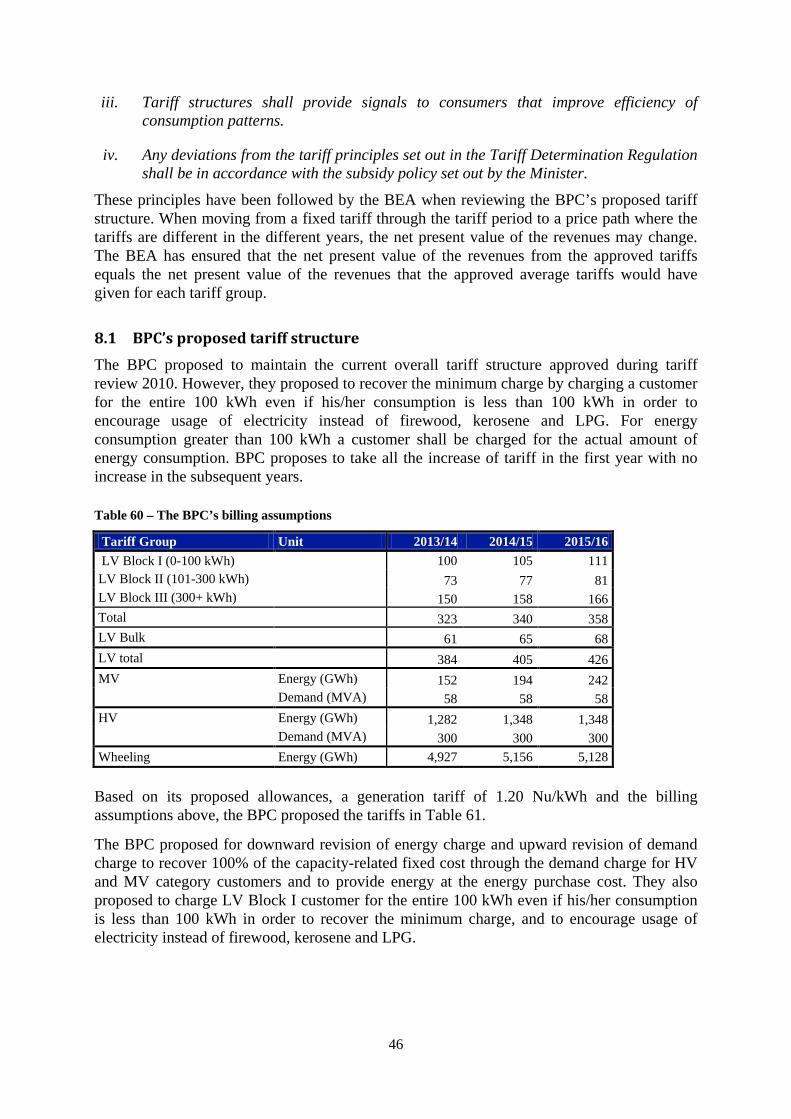
46
iii. Tariff structures shall provide signals to consumers that improve efficiency of consumption patterns.
iv. Any deviations from the tariff principles set out in the Tariff Determination Regulation shall be in accordance with the subsidy policy set out by the Minister.
These principles have been followed by the BEA when reviewing the BPC’s proposed tariff structure. When moving from a fixed tariff through the tariff period to a price path where the tariffs are different in the different years, the net present value of the revenues may change. The BEA has ensured that the net present value of the revenues from the approved tariffs equals the net present value of the revenues that the approved average tariffs would have given for each tariff group.
8.1 BPC’s proposed tariff structure The BPC proposed to maintain the current overall tariff structure approved during tariff review 2010. However, they proposed to recover the minimum charge by charging a customer for the entire 100 kWh even if his/her consumption is less than 100 kWh in order to encourage usage of electricity instead of firewood, kerosene and LPG. For energy consumption greater than 100 kWh a customer shall be charged for the actual amount of energy consumption. BPC proposes to take all the increase of tariff in the first year with no increase in the subsequent years.
Table 60 – The BPC’s billing assumptions
Tariff Group Unit 2013/14 2014/15 2015/16 LV Block I (0-100 kWh) 100 105 111 LV Block II (101-300 kWh) 73 77 81 LV Block III (300+ kWh) 150 158 166 Total 323 340 358 LV Bulk 61 65 68 LV total 384 405 426 MV Energy (GWh) 152 194 242 Demand (MVA) 58 58 58 HV Energy (GWh) 1,282 1,348 1,348 Demand (MVA) 300 300 300 Wheeling Energy (GWh) 4,927 5,156 5,128
Based on its proposed allowances, a generation tariff of 1.20 Nu/kWh and the billing assumptions above, the BPC proposed the tariffs in Table 61.
The BPC proposed for downward revision of energy charge and upward revision of demand charge to recover 100% of the capacity-related fixed cost through the demand charge for HV and MV category customers and to provide energy at the energy purchase cost. They also proposed to charge LV Block I customer for the entire 100 kWh even if his/her consumption is less than 100 kWh in order to recover the minimum charge, and to encourage usage of electricity instead of firewood, kerosene and LPG.

47
Table 61 – The BPC’s tariff proposal, based on the approved DGPC tariff of 1.20 Nu/kWh
Tariff Group Charge 2012/13 2013/14 2014/15 2015/16 LV Block I (0-100 kWh) Energy charge (Nu/kWh) 0.85 1.00 1.00 1.00 Block II (101-300 kWh) Energy charge (Nu/kWh) 1.62 4.10 4.10 4.10 Block III (300+ kWh) Energy charge (Nu/kWh) 2.14 4.10 4.10 4.10 LV Bulk Energy charge (Nu/kWh) 2.14 4.10 4.10 4.10
MV Demand charge (Nu/MVA/kW) 115 856 856 856
Energy charge (Nu/kWh) 1.79 1.20 1.20 1.20
HV Demand charge (Nu/MVA/kW) 105 441 441 441
Energy charge (Nu/kWh) 1.54 1.20 1.20 1.20
8.2 Inputs from stakeholders During the public hearing, some of the industrial customers expressed that if the BPC is going to charge for 100 units of power whether the customer consumes it or not, there will be unnecessary usage of electricity, wasting energy and misuse of the power. So, BPC should think how to prevent this misuse of power by the rural households. Some also expressed that if the revenue is to be increased, how about increase from the bulk customers instead of increasing tariff for the rural customers, which contain only minimal customers in this block.
The BCCI in their written comments submitted that the people who use less than 100 kWh of electricity per month are already among the most economically disadvantaged and a lifeline block with the least tariff rate currently exists precisely for the benefit of this group of customers. Adopting this proposal (charging entire 100 kWh even if the customer’s monthly electricity usage is less than 100 kWh) would be highly unfair to the customer and especially to those in the low-income bracket and lead to more wastage of scarce resources rather than promotion of effective utilization.
During the public hearing, some of the industrial customers expressed that there is a substantial increase in demand charge and this has to be reasonable. Some also expressed that if the customers are blocked and penalized for not using the contracted demand by substantial increase in demand charge, then the customer who is efficient in using the contracted demand is also penalized.
The BCCI in their written comments submitted that the current threshold value which is 70%, 37% and 50% of the contract demand for HV, MV and MV (hydropower construction respectively, be retained for levying of demand charges.
The BCCI also stated that before moving from a kW based to kVA based demand charges, the MV and HV customers should be allowed a grace period of one or two years for making changes in their equipment and manufacturing processes. And to convince HV and MV customers of the positive impacts of such a new system, a very strong case needs to be made by BPC. The BCCI also recommended that if BPC could work very closely with the industry fraternity to educate the industries for the transition from benefits of kW based to kVA based demand charges..
The BPC in their written comments submitted that the maximum demand of an individual customer is the maximum driver of network costs irrespective of his/her actual energy consumption and other directly associated fixed costs such as operational and maintenance costs. Therefore, recovery of 100% of the fixed network capacity costs through demand

48
charge will not only allow BPC to recover its investments, but also convey clear price signal to the consumers thus discouraging over reservation of capacity by an individual consumer. Accordingly, BPC proposed to recover 100% of the fixed network capacity costs through demand charge.
8.3 The approved tariff structure The BEA has approved the overall tariff structure, but has amended the proposed sizes of LV Block I and II. Further, the BEA viewed that fixing the energy charge at the current level and take all tariff increases for MV and HV customers through the demand charge was not desirable.
The different size of the LV Block I and II groups, and the new estimates on wheeling and the MV demand and consumption results in other billing assumptions than the ones submitted by the BPC. Further, the LV Block III has been adjusted to ensure that the total annual billed to LV customers equals the total sales.
Table 62 – The BEA’s billing assumptions – Number of units billed in each tariff group
Tariff Group Unit 2013/14 2014/15 2015/16 LV Block I (0-100 kWh) Energy (GWh) 99 104 109 Block II (101-300 kWh) Energy (GWh) 73 76 80 Block III (300+ kWh) Energy (GWh) 149 156 163 LV Bulk Energy (GWh) 71 77 82 MV Energy (GWh) 113 145 181 Demand (MW) 52 56 62 HV Energy (GWh) 1,349 1,428 1,441 Demand (MW) 264 267 270 Wheeling Energy (GWh) 5,129 5,023 5,008
Based on the approved allowances and subsidies, a generation tariff of 1.39 Nu/kWh, the billing assumptions in Table 62 and the decision of the RGoB to provide up to 100 units free electricity to the rural domestic customers, the BEA approved the tariffs in Table 63.
The fact that the BEA has approved higher energy charges for MV and HV is a consequence of approving demand charges far below the ones proposed by the BPC. The introduction of demand charges did not generate extra revenues to the BPC, but is another way of recovering the approved cost of supply from the customers. An increase in the demand charges will automatically reduce the energy charges to ensure that BPC’s collected revenues are unchanged. If the demand charges are decreased, the energy charges will automatically have to be increased to ensure that the BPC’s revenues are the same. Based on the billing data in Table 62, the BEA has estimated the average tariff per unit per year in Table 64. The figures show that the average tariffs for HV and MV are lower when estimated using the tariffs approved by the BEA than the ones proposed by the BPC.
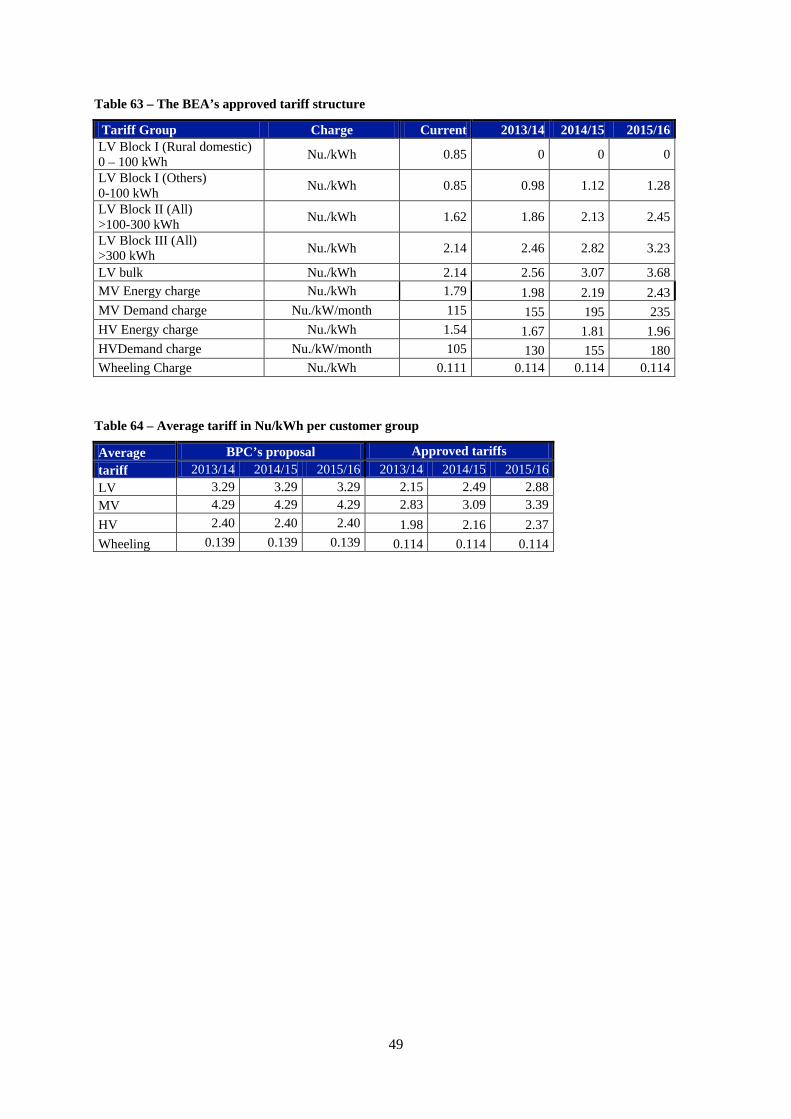
49
Table 63 – The BEA’s approved tariff structure
Tariff Group Charge Current 2013/14 2014/15 2015/16 LV Block I (Rural domestic) 0 – 100 kWh Nu./kWh 0.85 0 0 0
LV Block I (Others) 0-100 kWh Nu./kWh 0.85 0.98 1.12 1.28
LV Block II (All) >100-300 kWh Nu./kWh 1.62 1.86 2.13 2.45
LV Block III (All) >300 kWh Nu./kWh 2.14 2.46 2.82 3.23
LV bulk Nu./kWh 2.14 2.56 3.07 3.68 MV Energy charge Nu./kWh 1.79 1.98 2.19 2.43 MV Demand charge Nu./kW/month 115 155 195 235 HV Energy charge Nu./kWh 1.54 1.67 1.81 1.96 HVDemand charge Nu./kW/month 105 130 155 180 Wheeling Charge Nu./kWh 0.111 0.114 0.114 0.114
Table 64 – Average tariff in Nu/kWh per customer group
Average BPC’s proposal Approved tariffs tariff 2013/14 2014/15 2015/16 2013/14 2014/15 2015/16 LV 3.29 3.29 3.29 2.15 2.49 2.88 MV 4.29 4.29 4.29 2.83 3.09 3.39 HV 2.40 2.40 2.40 1.98 2.16 2.37 Wheeling 0.139 0.139 0.139 0.114 0.114 0.114