bhutan economic update - world...
TRANSCRIPT

September 2011
Poverty Reduction and Economic Management, South Asia Region
The World Bank
Bhutan Economic Update

1
Bhutan Economic Update September 2011
Summary
Real GDP grew at an impressive rate, but there are signs of overheating
In FY2010/11, real GDP grew by 8.1 percent, up from 5.7 percent in FY2008/09.1 The construction of hydropower projects mainly drove growth. The tourism sector also rebounded from a downturn in FY2009/10 caused by the global economic crisis.
As of end June 2011, inflation rose to reach 8.3 percent, in line with price developments in India. Food prices rose by 10.6 percent while non-food prices rose by 7.1 percent.
The fiscal deficit widened significantly in FY2010/11 to reach 4.8 percent of GDP, compared to a surplus of about 1.7 percent a year earlier. This was mainly because of a rise in capital spending on infrastructure coupled with sluggish growth in revenues.
The current account deficit widened in the last two years because of increased imports for hydropower projects, and is estimated to be around 7.9 percent of GDP in FY2010/11. However, grant and loan disbursements have offset these large current account deficits, resulting in a positive overall balance of payments and a comfortable reserves position.
Growth is expected to remain strong in FY11/12, but risks arise from high spending, electricity-and grant-dependent revenues, and higher public debt
The construction of a larger hydropower export capacity will be the main source of growth in the short-to-medium term. Bhutan is expected to grow at 8-9 percent per year from FY2011/12-FY2013/14, with the construction sector growing at 20-25 percent.
The fiscal deficit is expected to rise significantly in the next few years. While capital expenditures are likely to remain high because of the infrastructure development plans, grants from development partners are projected to decline slightly. Electricity and grants will account for about 55 percent of aggregate revenues between FY2010/11 and FY2012/13. As in the past, fiscal policy is likely to focus on keeping current expenditures in line with domestic revenues.
The current account deficit is projected to deteriorate during the next few years because of rising imports for the hydropower sector and declining external grants. Near-term projections are for an average deficit of 14 percent of GDP between FY2010/11 and FY2012/13. The overall balance of payments, however, will continue to show a surplus over the period due to robust capital inflows.
Bhutan’s public debt stock, currently at 66 percent of GDP, is projected to increase to over 70 percent in FY2012/13 due to finance of hydropower development. Risks to sustainability are mitigated by the commercial viability of these projects and Bhutan’s good track record of project implementation.
1 Prepared by Lalita Moorty, Monika Sharma, Aphichoke Kotikula, Ananya Basu, (SASEP) with contributions from Cecile Thioro Niang and Manju Haththotuwa (SASFP); Somil Nagpal (SASHN) and Bekzod Shamsiev (SASDA). Sapna John formatted the document.

2
Recent Developments
Gross Domestic Product 1. Real economic growth is estimated to have recovered from 5.7 percent in FY2008/09 to 8.1 percent in FY2010/11.2 This robust performance came mainly from a 10 percent growth in the industrial sector, spurred by construction activities related to the hydropower projects. The services sector also grew at an impressive 8 percent, with tourism rebounding from the decline seen just two years earlier. By contrast, the agricultural sector performed less well, growing only at around 1.8 percent. The healthy growth rates in FY2010/11 closely track the averages for the past decade (figures 1 and 2).
Figure 1: Trends in Real Gross Domestic Product Components
Source: Royal Government of Bhutan, National Statistical Bureau. Data per fiscal year.
2. The robust growth in the industrial sector in FY2010/11 kept pace with the average rate recorded in the past decade, but contribution of individual subsectors varied across the years (figure 2). In FY2006/07 and FY2007/08, when the Tala hydropower project went into production, the electricity sector grew at 63 percent and 39 percent respectively. More recently, it was the construction sub-sector that grew at over 20 percent as a result of the new hydropower projects. The manufacturing subsector has grown steadily at over 10 percent during the period.
2 Real GDP grew at an average rate of 8 percent during the past decade.
0.00
9.00
18.00
27.00
36.00
45.00
2004/05
2005/06
2006/07
2007/08
2008/09
2009/10
2010/11
Billion of Nu(2000 prices)
Services Industry Agriculture, livestock, and forestry
0.0
5.0
10.0
15.0
20.0
25.0
30.0
2004/05
2005/06
2006/07
2007/08
2008/09
2009/10
2010/11
Percent Annual Growth Rate
Agriculture, livestock, and forestry Industry Services Overall
Figure 2: Contributors to Overall Annual Growth
Source: Macroeconomic Framework Coordination Committee, January 2011.
‐20%
0%
20%
40%
60%
80%
100%
120%
2004/05
2005/06
2006/07
2007/08
2008/09
2009/10
2010/11Percentage Contribution to
Annual Growth
Construction Electricity, Gas, and Water All Other Sectors

3
3. The services sector in FY2010/11 also grew at the healthy average growth rate of around 8 percent in the past decade, with all subsectors growing strongly. While tourism contributes less than 1 percent of GDP, it is a key source of foreign exchange earnings. Although Bhutan was largely insulated from the global economic crisis, annual revenues from convertible-currency tourism3 fell to US$31.8 million in 2009, from US$38.8 million in 2008. Data from 2010 indicates sector recovery (Figure 3). The number of
tourists to Bhutan in 2010 was 15 percent higher than in 2009. Tourism revenue recovered to US$35 million in 2010 due to improved global economic conditions. In the period Jan-April of 2011, the number of tourist arrivals and the revenues indicate a continued improvement in the tourism sector.4
4. The lackluster growth in agriculture in FY2010/11 was also in line with the average for the decade at around 2 percent. As in most countries, the sector’s share in GDP continued to decline over time from 25 percent in FY2002/03 to 14 percent in FY2010/11. Agriculture is characterized by low productivity for several reasons – low levels of technology adoption, predominance of subsistence agriculture, small domestic market, inaccessibility to markets for agricultural products, and large tracts of fallow land. Reasons for fallow land include inability of farmers to protect crops from wildlife damage, distance of land from their homes, and lack of irrigation. In FY2008/09, the cereal yield per hectare in Bhutan was 1,947.1kgs, compared to 2,746.1kgs in South Asia.5
3 Refers to tourism earnings in convertible currency such as dollars. Bhutan also has tourism earnings in Rupees – but these are not convertible. 4 RMA Monthly Statistical Bulletin, May 2011. 5 Source: World Development Indicators. Also see World Bank, FAO (2011). “The agriculture sector in Bhutan: issues, institutions, and policies.”
Figure 3: Trends in Tourist Arrivals and Revenues
Source: Tourism Council of Bhutan, for convertible-currency paying tourists.
0
5
10
15
20
25
30
35
40
45
0
5000
10000
15000
20000
25000
30000
2007 2008 2009 2010 2011 (Jan‐August)
Number of Tourists
Annual Revenue RHS (millions of dollar)
Figure 4: Consumer Price Index (% increase)
Source: National Statistics Bureau of Bhutan.
0.0
1.0
2.0
3.0
4.0
5.0
6.0
7.0
8.0
9.0
10.0
2007
Q1
2007
Q2
2007
Q3
2007
Q4
2008
Q1
2008
Q2
2008
Q3
2008
Q4
2009
Q1
2009
Q2
2009
Q3
2009
Q4
2010
Q1
2010
Q2
2010
Q3
2010
Q4
2011
Q1
2011
Q2
Percen
t YoY Inflatio
n

4
Inflation 5. Inflation has surged since mid-2009, and now exceeds 8 percent in FY2010/11. Bhutan’s inflation peaked at 8-9 percent in the summer of 2008, when food and fuel prices were high (Figure 4). With the easing of global prices, Bhutan’s inflation rate fell to 3 percent in the second quarter of 2009. However, there has been a steady increase in overall inflation since, largely initiated by supply shocks from India, the source of three-quarters of commodity imports. In the fourth quarter of FY2010/11, food prices increased by 10.5 percent (YoY) while non-food prices rose by 7.1 percent (YoY). 6. Price developments in Bhutan closely track those in India. The Bhutanese ngultrum is pegged to the Indian rupee, and India is Bhutan’s key trading partner. Food prices rose through 2009 in both countries (Figure 5). As food prices in India declined in 2010, they also moderated in Bhutan. Meanwhile, the recent fuel price hike in India has contributed to rising non-food prices in Bhutan because of possible feed-through effects. Since the poor have a high ratio of food spending in total expenditure, it is possible that this affects poor households disproportionately.6
Figure 5: Inflation Trends in India and Bhutan
Note: India Core WPI excludes food and fuel component from overall WPI index Source: National Statistical Bureau of Bhutan, Consumer Price Index (2003 = 100), and CEIC India database, Wholesale Price Index (2004-05 = 100).
7. The government has limited mechanisms to influence food prices. A bilateral free-trade agreement with India allows duty-free imports of all food and agricultural commodities. India supplies approximately 50 percent of Bhutan’s requirements for rice. Indian rice is sold at much lower prices than Bhutanese rice, due to the lower production costs and higher productivity in India, and the strong preference of Bhutanese consumers for locally-produced rice. Market prices are not much influenced by the activities of the Bhutan Food Corporation (BFC), which helps in the (a) the acquisition, management, and disposal of small public reserves of rice, wheat, vegetable oil, and sugar; and (b) the purchase of selected food commodities from India for sale at controlled prices in district-level retail shops. The BFC receives no direct budget allocation from the government for its operations and is expected to use the
6 The 2007 Bhutan Living Standard Survey shows that 61 percent of total consumption expenditure by poor households is on food, while the comparable figure for non-poor households is 47 percent.
0.0
2.0
4.0
6.0
8.0
10.0
12.0
14.0
16.0
18.0
20.0
2007 Q1
2007Q2
2007Q3
2007Q4
2008Q1
2008Q2
2008Q3
2008Q4
2009Q1
2009Q2
2009Q3
2009Q4
2010Q1
2010Q2
2010Q3
2010Q4
2011Q1
2011Q2
Year on Year inflation (percent) Bhutan Food CPI India Food CPI
‐4.0
‐2.0
0.0
2.0
4.0
6.0
8.0
10.0
12.0
2007 Q1
2007Q2
2007Q3
2007Q4
2008Q1
2008Q2
2008Q3
2008Q4
2009Q1
2009Q2
2009Q3
2009Q4
2010Q1
2010Q2
2010Q3
2010Q4
2011Q1
2011Q2
Year on Year Inflation (percent) Bhutan Non Food CPI India ‐Core WPI

5
profits from parallel commercial activities7 to cover the costs of its public service activities. As a corporate enterprise, it also is expected to pay all taxes and dividend on profits to the government. The BFC’s strategic food stocks – consisting of rice, wheat, vegetable oil, and sugar – are turned over every 3-4 months through retail sales. These stocks are considered too small to have any major impact on market behavior. There are no market or trade restrictions. The Government provides certain direct and indirect subsidies to the agricultural sector, in the form of subsidized inputs. Social protection measures are limited to a school-feeding program operated by the World Food Program. The Government complements the WFP program and is planning on sustaining the program on its own if the WFP phases out its support as planned by 2012.
Monetary Indicators 8. The rising inflation in Bhutan not only reflects price developments in India, but also accommodative domestic policies. Broad money rose by 16.2 percent by April 2011 and reserve money by 32.5 percent (YoY) in December 2010. Most of the increase in broad money was due to an increase in domestic credit which grew by 33.1 percent. Private sector credit growth has accelerated to nearly 32.4 percent (yoy), driven by housing and construction sectors as well as personal loans. There is considerable excess liquidity in the banking system at 48.5 percent of reserve money (or Nu24.1billion) by December 2010. Although it declined considerably by May 2011 (to Nu.5.7 billion), excess liquidity weakens the monetary transmission mechanism. Short-term interest rates have declined since end-2009 to 2 percent in early 2011 as compared to 8 percent for India. Rapid credit growth and monetary conditions need to be closely monitored for its transmission into higher demand and inflationary pressures.
9. With weak links to the global markets, Bhutan’s financial sector remained unaffected by the global financial crisis. The system is well capitalized. The risk-weighted Capital Adequacy Ratio (CAR) and Tier 1 CAR remained strong, at 14.4 percent and 11.4 percent respectively in June 2011. The Non-Performing Loans (NPL) ratio remained constant at 8.5 percent in June 2011. Loan provisions (as a percent of NPL) increased to 56.1 percent in March 2011 as compared to 40.1 percent in March 2010. 10. The government has undertaken several reforms to modernize the financial sector and strengthen the institutional framework for financial management. These include: (i) issue of new banking/insurance licenses to increase the number of financial institutions in FY2009/10; (ii) establishment of a Credit Information Bureau fully operational since January 2011 to help make the financial system more reliable by increasing the efficiency of credit-risk assessment of borrowers, reducing the extraordinary amounts of collateral, lowering the default risk, and enabling the expansion of credit-based lending; (iii) establishment of payment systems infrastructure with the launch of an Electronic Funds Transfer Clearing System in June 2010; (iv) development of a national switch system and (v) steps to increase the autonomy of the Royal Monetary Authority (RMA). This included a new RMA Act in June 2010 that declared the RMA to be an autonomous body supporting the government’s economic policies, and empowering it to regulate electronic payment systems.
Fiscal Indicators
7 Such as the operation of the auction system and the provision of services to the World Food Program.

6
11. Bhutan is expected to run a budget deficit of almost 4.8 percent of GDP in FY2010/11, following several years of small budget surpluses. Strong fiscal discipline and donor assistance resulted in small fiscal surpluses since FY2006/07 (Figure 6). The overall budget framework has been consistently underpinned by the sound principle of covering current expenditure by domestic revenues (Figure 6). Grants and electricity revenues together accounted for almost two-thirds of total government revenue during this period. However, the recent widening of the fiscal deficit in FY2010/11 is primarily on account of 6 percent of GDP increase in capital expenditure in FY2010/11 as compared to FY 2009-10 and 6 percent of GDP decline in total revenues.
Figure 6: Recent Developments in Fiscal Balances
Source: Macroeconomic Framework Coordination Committee. June 2011.
12. The stock of government debt is high, but the risks to sustainability are mitigated by several factors. In FY2010/11, India accounted for 43 percent of the total government debt, while among multilaterals the Asian Development Bank (21 percent) and the World Bank (16 percent) were the largest creditors. About 98 percent of total government debt is foreign. All external debt is public or publicly guaranteed and long term in maturity. Domestic debt, which is about 2.0 percent of total debt, is raised through government bonds. The recent debt sustainability analysis shows a moderate risk of distress, with public debt is projected to exceed 110 percent of GDP in 2014/15. However, risks to sustainability are mitigated because of the commercial viability of the hydropower projects, which account for about half of total debt and benefit from India’s strong energy demand.
‐8.00
‐6.00
‐4.00
‐2.00
0.00
2.00
4.00
2004/05
2005/06
2006/07
2007/08
2008/09
2009/10
2010/11
Percentage
of G
DP
Fiscal deficit to GDP
0.00
5.00
10.00
15.00
20.00
25.00
30.00
2004/05
2005/06
2006/07
2007/08
2008/09
2009/10
2010/11
Percentage
of G
DP
Domestic Revenues
Current Expenditure
Figure 7: Government Debt
Source: Macroeconomic Framework Coordination Committee. June 2011.
0.0
10.0
20.0
30.0
40.0
50.0
60.0
70.0
80.0
90.0
2004
/05
2005
/06
2006
/07
2007
/08
2008
/09
2009
/10
2010
/11
Hydropower Debt
Non Hydropower Debt

7
Bhutan’s strong project implementation record, as well as a comfortable reserves position, also mitigates risks. External Indicators 13. The current account deficit has widened in the last two years, mainly because of increasing imports for construction work on hydropower projects. The current account deficit deteriorated to around 13 percent of GDP in FY2009/10 and is estimated to have improved slightly to reach 7.9 percent in FY2010/11 (Figure 8). This marked widening of the current account deficit in the past two years – compared to the years earlier – is because of increased government imports for hydropower projects, the resumption of interest payments for Tala power project, and a decline in commodity exports (particularly manufactured and mineral-based products) during the global economic crisis. A worsening trade balance is partly offset by higher grants. 14. Meanwhile, the capital account surplus improved in FY2009/10 and FY2010/11, assisted by higher capital transfers and foreign loans. This has resulted in positive overall balance of payments (Figure 8). Foreign reserves have grown at about 13 percent annually since FY2002/03, and stand at about 13.6 months of import cover at present (Figure 8). 15. Bhutan’s exchange rate is pegged to the Indian rupee. The peg to Indian rupee has contributed to trade integration between the two countries and has helped in macroeconomic stability in Bhutan. The real effective exchange rate has been stable and close to its ten-year average.
Figure 8: Recent Developments in External Balances
Source: Macroeconomic Framework Coordination Committee. June 2011.
Development Prospects Growth 16. The construction of hydropower projects is expected to be the major source of growth in the medium term and once on stream, electricity generation will drive growth. Bhutan is expected to grow at 9-10 percent per annum from FY2010/11 to FY2015/16, with the construction sector growing at
‐40.00
‐30.00
‐20.00
‐10.00
0.00
10.00
20.00
2004/05
2005/06
2006/07
2007/08
2008/09
2009/10
2010/11
Percentage
of G
DP
Current Account Balance
Overall balance
0.00
200.00
400.00
600.00
800.00
1000.00
1200.00
2004/05
2005/06
2006/07
2007/08
2008/09
2009/10
2010/11
Millions of USD
International Reserves
8
rates of about 20-25 percent. Bhutan has the potential to develop a generating capacity of 23,760MW, of which only 5 percent has been tapped so far. The Royal Government proposes to add 10,000MW capacity by 2020, largely with financial assistance from India. The Basochu, Chukha, Kurichu, and Tala hydropower projects are currently in production. In the next few years, construction of the 720MW Dagachu and the 1000MW Punachu II will be the key drivers of growth. By FY2015/16, Dagachu is expected to come online and contribute to growth through generation of electricity. More than 90 percent of power production is exported to India at pre-negotiated prices, and revenues are in Indian rupees.8
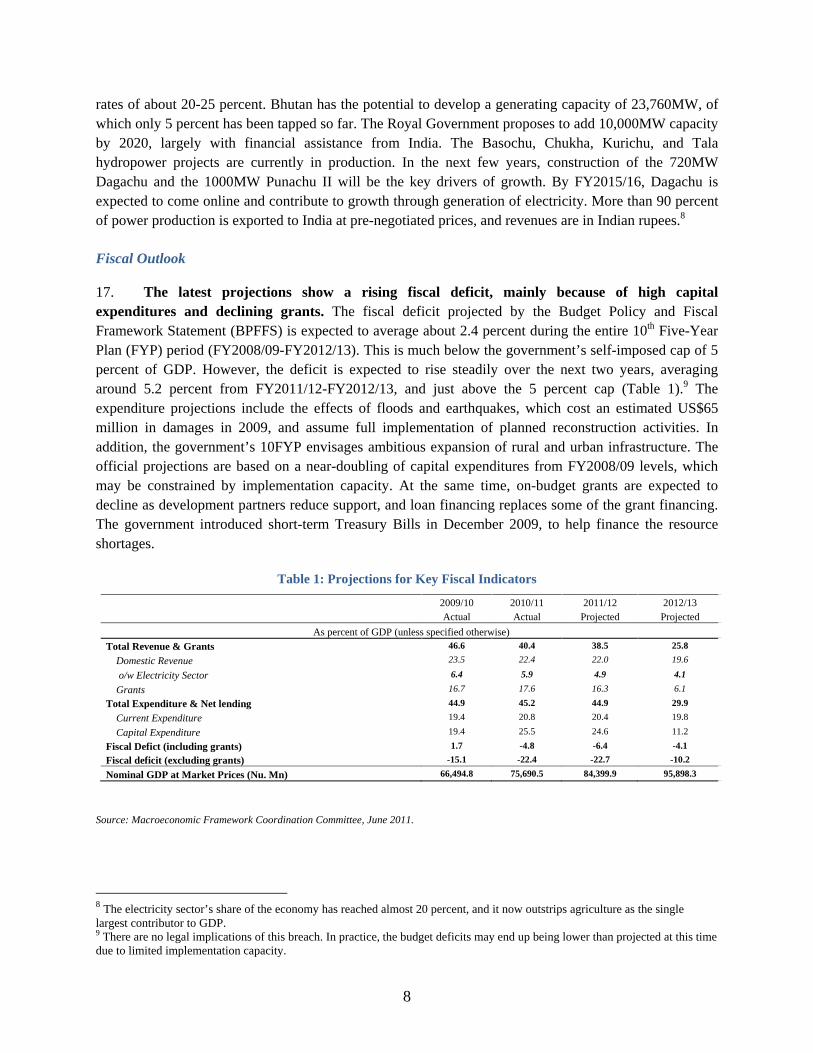
Fiscal Outlook 17. The latest projections show a rising fiscal deficit, mainly because of high capital expenditures and declining grants. The fiscal deficit projected by the Budget Policy and Fiscal Framework Statement (BPFFS) is expected to average about 2.4 percent during the entire 10th Five-Year Plan (FYP) period (FY2008/09-FY2012/13). This is much below the government’s self-imposed cap of 5 percent of GDP. However, the deficit is expected to rise steadily over the next two years, averaging around 5.2 percent from FY2011/12-FY2012/13, and just above the 5 percent cap (Table 1).9 The expenditure projections include the effects of floods and earthquakes, which cost an estimated US$65 million in damages in 2009, and assume full implementation of planned reconstruction activities. In addition, the government’s 10FYP envisages ambitious expansion of rural and urban infrastructure. The official projections are based on a near-doubling of capital expenditures from FY2008/09 levels, which may be constrained by implementation capacity. At the same time, on-budget grants are expected to decline as development partners reduce support, and loan financing replaces some of the grant financing. The government introduced short-term Treasury Bills in December 2009, to help finance the resource shortages.
Table 1: Projections for Key Fiscal Indicators
Source: Macroeconomic Framework Coordination Committee, June 2011.
8 The electricity sector’s share of the economy has reached almost 20 percent, and it now outstrips agriculture as the single largest contributor to GDP. 9 There are no legal implications of this breach. In practice, the budget deficits may end up being lower than projected at this time due to limited implementation capacity.
2009/10 2010/11 2011/12 2012/13 Actual Actual Projected Projected
As percent of GDP (unless specified otherwise)
Total Revenue & Grants 46.6 40.4 38.5 25.8
Domestic Revenue 23.5 22.4 22.0 19.6
o/w Electricity Sector 6.4 5.9 4.9 4.1
Grants 16.7 17.6 16.3 6.1
Total Expenditure & Net lending 44.9 45.2 44.9 29.9
Current Expenditure 19.4 20.8 20.4 19.8
Capital Expenditure 19.4 25.5 24.6 11.2
Fiscal Defict (including grants) 1.7 -4.8 -6.4 -4.1
Fiscal deficit (excluding grants) -15.1 -22.4 -22.7 -10.2
Nominal GDP at Market Prices (Nu. Mn) 66,494.8 75,690.5 84,399.9 95,898.3

9
18. Taxes and dividends from the electricity sector and on-budget grants are important sources of revenue during the 10FYP period. The average share of electricity in aggregate revenue is expected to remain high in the remainder of the Plan period (Table 1). Grants account for another 35 percent of Bhutan’s projected aggregate revenues. About 81 percent of these grants are expected to be tied to specific projects. India accounts for almost 65 percent of expected grants through FY2012/13. However, grants are expected to decline in importance with economic growth, as development partners gradually reduce such support to Bhutan (Table 1). Tax and non-tax revenues from various sources (excluding electricity) are expected to contribute almost 40 percent of aggregate revenues till FY2012/13. 19. Bhutan’s fiscal framework will continue to be underpinned by the principle of covering current expenditures by the domestic revenue stream. According to the Constitution of Bhutan, the government has to ensure that the cost of recurrent expenditures is met from the country’s internal resources. The government has prudently maintained its current expenditures below domestic revenues over the previous decade – except in FY2003/04 and FY2004/05, where current expenditures were only 2 percent higher than domestic revenues. Accordingly, the government seeks to ensure that even if grants were to decline, the stream of domestic revenues would finance current expenditures, and enable the delivery of basic services (Table 1). 20. Bhutan’s debt stock is projected to increase during the 10FYP period, due to hydropower development loans. The debt burden, which is presently 66 percent of GDP is likely to rise over the next few years, as hydropower projects are launched to meet the government’s ambitious vision (Table 2). At the same time, hydropower projects bring strong dividends, boosting the average real GDP growth and exports in the longer term. The Present Value of debt-to-GDP ratio is expected to rise to about 120 percent in FY2014/15, before declining to less than 15 percent by FY2029/30.10 The external debt service ratio as a share of exports of goods and services is expected to remain in the range of 12.5-13.5 percent for the remainder of the 10FYP. Domestic debt as a share of GDP is projected to fall from 1.2 percent at present to 0.5 percent by FY2012/13.
Table 2: Projections for Key Debt Indicators
Source: Macroeconomic Framework Coordination Committee. June 2011.
Balance of Payments 21. The current account deficit is projected to deteriorate during the next few years due to imports for construction on hydropower plants and declining external grants. In the short term, imports of goods and services are expected to grow faster than exports, leading to a rising trade deficit
10 As per the Joint IMF/World Bank Debt Sustainability Analysis, undertaken in May 2011.
2009/10 Actual
2010/11 Actual
2011/12 Projected
2012/13 Projected
As percent of GDP (unless specified otherwise)
Total Government Debt 55.3 56.7 66.0 70.6
Foreign Debt 53.7 55.5 65.2 70.1 o/w Hydropower Debt 33.5 33.5 39.5 44.6
External Debt Service (in percent of GNFS exports) 13.1 13.6 13.4 13.9

10
(Table 3). Moreover, current transfers – including grants from development partners – which offset part of the trade deficit, will show a declining trend as budgetary grants taper off (Table 3). Interest payments on hydropower loans will rise steadily. 22. Exports of goods and services are projected to grow at about 20 percent per year till FY2012/13. India accounts for about 93 percent of Bhutan’s aggregate exports, and is the sole buyer of electricity exports from Bhutan. Electricity is expected to remain the dominant export commodity, accounting for about 45 percent of the total. In addition, minerals and mineral-based products, including base metals and related articles, will likely account for another 40 percent of exports.11 More than 95 percent of exports, even in this category, are to India. This category of exports has been growing steadily during the decade (except for a decline in 2008, when copper exports were adversely affected by volatile global prices), and this is expected to be sustained in the near term. Export diversification prospects are limited. Bangladesh and Hong Kong are Bhutan’s next-biggest export clients, but each accounting for only about 3 percent of exports.12
23. Imports of goods will grow at about 10 percent annually in the short term, primarily due to construction work on hydropower projects. India accounts for more 77 percent of Bhutan’s imports, followed by Bangladesh, Nepal, and Hong Kong, each providing another 3-5 percent. Imports of capital goods, including machinery and mechanical/electrical appliances, and transportation equipment, are expected to constitute about 30 percent of aggregate imports – although India’s share of this will be relatively low, at around two-thirds. Intermediate commodities, including mineral oils and fuels, and articles of base metals, used mainly in the construction and manufacturing sectors, will account for another 40 percent of aggregate imports – in line with economic activities related to construction and manufacturing. More than 85 percent of imports in this category will be from India. The share of consumption goods, such as food products, animal products, and products of chemicals and allied industries, will show a marginally declining trend as a share of aggregate imports. However, imports of cereals from India, accounting for about 5 percent of total imports, are expected to rise. 24. The overall external balance is expected to continue to show a surplus between FY2010/11 and FY2012/13 due to robust capital inflows. These will likely take the form of capital transfers from India, and loans from development partners (Table 3). These inflows are expected to finance the current account deficit and enable an increase in gross international reserves. In fact, gross official reserves should largely cover Bhutan’s total debt stock during the period, mitigating the likelihood of debt distress. The import cover is also projected to remain at a healthy 13.6 months during the period.
Table 3: Projections for Key External Sector Indicators
11 Mineral and mineral-based commodity exports from Bhutan include salt, sulphur, earths and stone, plastering materials, lime and cement, ores, slag and ash, mineral fuels, mineral oils, and bituminous substances. 12 According to 2009 data, Bangladesh has a 3.2 percent share (oranges, apples, cardamom, fruit juices and processed foods and beverages, and mineral products, including dolomite, gypsum and limestone), and Hong Kong has a 2.8 percent share (cordyceps (medicinal fungi) and furniture) in Bhutanese exports.

11
1/ - Net RGOB loans Source: Macroeconomic Framework Coordination Committee, June 2011. Negative numbers denote deficits.
Risks to Outlook 25. Bhutan’s overall macroeconomic outlook remains bright. Real GDP growth for the remainder of the 10FYP period is projected to be around 8 percent. The hydropower sector remains the key driver, given the planned expansion in electricity generation capacity. In the construction phase, projects will boost growth via the construction sector; once onstream, they will contribute through power generation. The current account deficit is estimated to widen significantly as new hydropower projects are under construction. However, adequate external financing is likely to result in overall surpluses and adequate international reserve cover. 26. Despite the positive macroeconomic outlook, implementation of Bhutan’s development agenda is subject to several risks:
a) With high growth and elevated inflation, recent accommodative fiscal and monetary policies have contributed to the risks of overheating. Fiscal policy could be tightened to address this by saving revenue over performance and cutting non-priority expenditures. Similarly, monetary conditions could be tightened such that credit creation does not stoke excess demand and further increase the trade deficit. Such fiscal and monetary tightening will help contain balance of payments pressures.
b) Dealing with revenue volatility and expenditure pressures would require deepening of
public financial management reforms. This would include more robust implementation of the multi-year rolling budget framework and the strengthening of public finance oversight institutions. Efforts are also needed to broaden the tax base and improve revenue administration – thus countering declines in foreign aid inflows and fluctuating hydropower revenues.
c) While the hydropower sector will continue to drive growth for the foreseeable future, it is
also important for Bhutan to promote diversification of the economy to create sufficient jobs to absorb the labor force productively. As such, as outlined in the Economic Development Policy, activities that foster private enterprise, attract foreign direct
2009/10 2010/11 2011/12 2012/13Actual Revised Projected Projected
Current Account Balance -13.2 -7.9 -11.9 -22.2
o/w Current transfers 13.3 12.7 13.1 4.3
o/w Trade Balance -21.0 -14.5 -18.8 -20.9
Capital Account Balance 10.5 16.5 23.1 26.3
o/w Capital transfers 5.6 8.2 8.1 9.1
o/w Foreign aid (Disbursements less Repayments) 1/ 3.3 7.6 14.3 16.6
Gross official Reserves
Milions of USD 856.3 1018.3 1162.9 1190.1
Months of GNFS imports 11.0 13.6 14.4 13.8
As percent of GDP (unless specified otherwise)

12
investment, and have job-generating potential need to be encouraged. Addressing investment climate challenges will help create an enabling environment to foster private sector development and attract foreign direct investment. It is important for growth to be pro-poor so that wider sections of the population have the opportunity to contribute to and benefit from the country’s growth.
World Bank Assistance 27. The World Bank will continue to support Bhutan’s development agenda through lending, and technical and advisory services.
a) The 2010 Investment Climate Assessment (ICA) is the basis of further advisory services on reforms for private sector development. A roadmap for reforms based on the ICA findings was prepared and some of these recommendations adopted by the national Private Sector Development Committee in January 2011. New work is being initiated to support reforms linked to Doing Business, improve the capacity of the Royal Government to implement public-private partnerships and to strengthen corporate governance among state-owned enterprises, specifically focused on improvement of transparency, accountability, and effectiveness in the governance structure.
b) In the area of e-governance, technical assistance is being provided to help establish a
first generation e-governance platform, building on the e-governance roadmap that was prepared with Bank assistance in FY2009/10. Implementation assistance during FY11 focused mainly on: program management models, the design of the Government’s national enterprise architecture and implementation strategies including Public Private Partnerships.
c) The Bank team is also facilitating the preparation of a Japan Social Development Fund
(JSDF) program to pioneer the delivery of public and business services through community owned and managed, ICT enabled centers. These will also function as livelihood training centers in partnership with the private sector.
d) An Analysis of Public Expenditure for Human Development has been initiated to help
the social-sector ministries identify reforms to improve efficiency of public spending. In line with sectoral priorities identified by the Ministry of Health, three areas for focus during the first phase of the analysis were identified as National Health Accounts, Costing of public health services, and a GIS-based study on health infrastructure, and studies on all three focus areas were undertaken during FY 2010-11. Similarly, in line with the priorities expressed by the Ministry of Education, analytical studies are being undertaken in the Education sector on fiscal space analysis and the estimation of unit costs on a per capita basis.
e) The recently-completed Public Expenditure and Financial Accountability Assessment
and the Use of Country Systems in Procurement have important recommendations in the areas of public financial management and procurement, and will form the basis of further reforms and technical support, as already under discussion with the government.
f) On poverty monitoring and analysis, the Bank is providing a TA to develop a Map
Portal that enables central and local governments to overlay the poverty and other local
13
development indicators with location of infrastructure such as road, schools, and health facilities. The portal can help Government link development input and resources with outcome and therefore inform their decisions.
g) Statistical Capacity Building project will improve, among other things, the capacity of
the Government to track inflation. By using mobile devices to collect and submit data, it is expected to improve frequency of CPI-from quarterly to monthly.
h) The revised Debt Sustainability Analysis has been completed, and approved by the
Board in May 2011. i) The government requested budget support from the World Bank to deepen its ongoing
program of institutional reforms and provide resources for its development agenda. Accordingly, the World Bank prepared the First Development Policy Credit (DPC1), which was presented to the Board of Executive Directors in late 2010. The operation supports the government’s program of strengthening institutions to: (i) promote efficiency and effectiveness through sound fiscal and public financial management and procurement, and strong public administration; (ii) foster private-sector development by improving the policy environment and facilitating productive employment opportunities; and (iii) expand access to infrastructure in a sustainable manner. The operation provided US$25 million to the government in FY2010/11 to finance its development agenda. Official estimates projected a shortfall in resources required to finance the development program for FY2010/11 at about US$57 million. Therefore, DPC1 financed about 45 percent of this resource shortfall. Another Credit is under preparation for FY12/13.
j) Activities support by the Private Sector Development Project include supporting job
creation for the youth through the development of IT-enabled services (ITES) and the launching of the first IT Park in Bhutan under a public-private partnership. The project also supports the training and accreditation of a cadre of ITES workers and the development of local technology SMEs and entrepreneurs. The Project is also contributing to the Government’s vision of ensuring that the Bhutanese can access basic financial services including (i) assisting the establishment and drafting of the Financial Inclusion policy; (ii) creating an enabling regulatory and supervisory framework for microfinance institutions and branchless banking; and (iii) promoting financial literary through workshops, education and the media.

14
Rural Poverty Headcount Rate by Gewog
Maize Yields in Tonnes / Acre by Gewog
Rice Yields in Tonnes / Acre by Gewog
Box 2: Poverty and Agricultural Productivity in Bhutan The Gross National Happiness Commission (GNHC), the National Statistical Bureau (NSB), and the World Bank have worked together to produce statistically reliable poverty estimates at the gewog level. The “small area estimation” methodology, which produces these estimates by exploiting the strengths of both the Population Census 2005 and the Bhutan Living Standard Survey 2007, has been adopted for this purpose. Darker areas in the Rural Poverty Map, alongside, show where higher poverty headcount rates occur. It shows a concentration of poverty in the south-western and eastern regions of Bhutan. These estimates have helped to refine resource-allocation formulas for block grants to enhance equity in the FY2009/10 and FY2010/11 budgets. Agriculture is a major source of income and livelihoods in rural areas. The relationship between rural poverty and agricultural productivity is examined in the maps of agricultural productivity. Areas with higher yields – particularly in Paro, Thimphu, Bumthang, and Trashiyangse – tend to be better off, while areas with low agricultural yields in Samtse and Zhemgang have much higher poverty rates. However, the correlation is not unambiguous. There are exceptions in north-eastern Bhutan, where factors such as difficult access to markets and infrastructure contribute to poverty in spite of reasonable agricultural productivity.
Source: Poverty Maps of Bhutan, 2010. Estimations based on Bhutan Living Standards Survey 2007, Population and Housing Census of Bhutan 2005, and road network data from NSB. Median yields of rice and maize from Ministry of Agriculture, for 1999-2009.