bhutan development bank limited
TRANSCRIPT
AnnuAl RepoRt
2018
BHUTAN DEVELOPMENT BANK LIMITED
| 10 | BDB Annual Report 2017
sl # Particulars 2009 2013 2014 2015 2016 2017X No.of Depositors 15,879 85,864 109,005 133,366 159,576 178,386
Main Branch 657 4821 6,322 8,436 11,186 15,101 BranchOffice 15,222 81,043 102,683 124,930 148,390 163,285
XI Number of Employess 221 357 385 416 452 563HeadOffice 66 110 125 117 144 152Main Branch 29 28 30 31 39 45BranchOffice 126 219 230 268 269 366
XII ActiveClients/EmployeeRatioMain Branch 90 112 111 120 107 101BranchOffice 137 172 187 181 193 144
XII Loans/EmployeeRatio 13 24 28 33 37 33Main Branch 62 142 153 169 153 152BranchOffice 8 21 27 32 39 33

Mission
Core Values
Vision
To be strong, dependable, customer focused bank that contributes towards achievement of GnH.
a premier development bank with focus on rural prosperity through prompt, efficient and effective financial services on a sustainable basis.
Professionalism - Give your Bestexcellence - aim for higher idealsownership - own your Bank and care for
your customersPartnership - Work together for growthloyalty - Be true to oneself and
stakeholdersefficiency - Deliver prompt services
01. organizational structure 4
02. General information 5
03. Board of Directors 7
04. Management Team 8
05. Chairman’s/Directors report 9
06. operational Highlights 16
07. auditors’ report 18
08. annual accounts/Financial statements
i. notes to Consolidated Financial statements (notes 1 to 2) 30
ii. income statement 55
iii. statement of other Comprehensive income 56
iV. statement of Financial Position 57
V. statement of Changes in equity 58
Vi. statement of Cash Flows 59
Vii. notes to Consolidated Financial statements (notes 3 to 48) 63
09. rMa Disclosures 90
10. Performance indicators 100
TaBle oF ConTenTssl. Particulars Page #
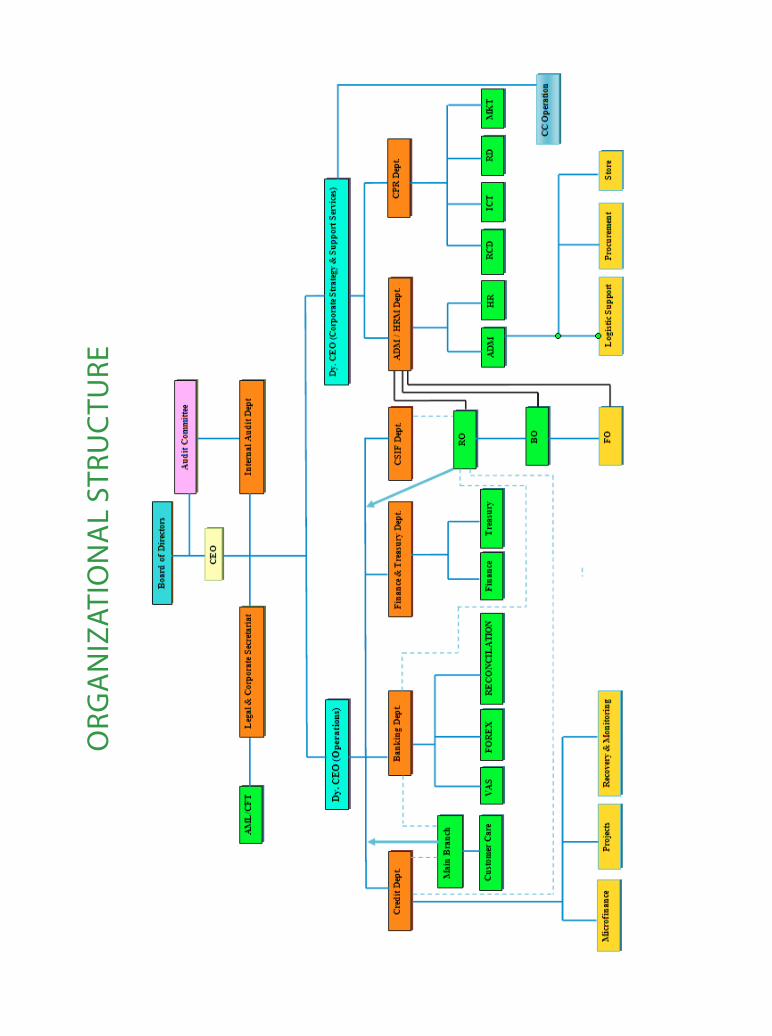
orG
an
izaT
ion
al
sTru
CTu
re
| 10 | BDB Annual Report 2017
sl # Particulars 2009 2013 2014 2015 2016 2017X No.of Depositors 15,879 85,864 109,005 133,366 159,576 178,386
Main Branch 657 4821 6,322 8,436 11,186 15,101 BranchOffice 15,222 81,043 102,683 124,930 148,390 163,285
XI Number of Employess 221 357 385 416 452 563HeadOffice 66 110 125 117 144 152Main Branch 29 28 30 31 39 45BranchOffice 126 219 230 268 269 366
XII ActiveClients/EmployeeRatioMain Branch 90 112 111 120 107 101BranchOffice 137 172 187 181 193 144
XII Loans/EmployeeRatio 13 24 28 33 37 33Main Branch 62 142 153 169 153 152BranchOffice 8 21 27 32 39 33
ANNUAL REPORT 2018 | 5
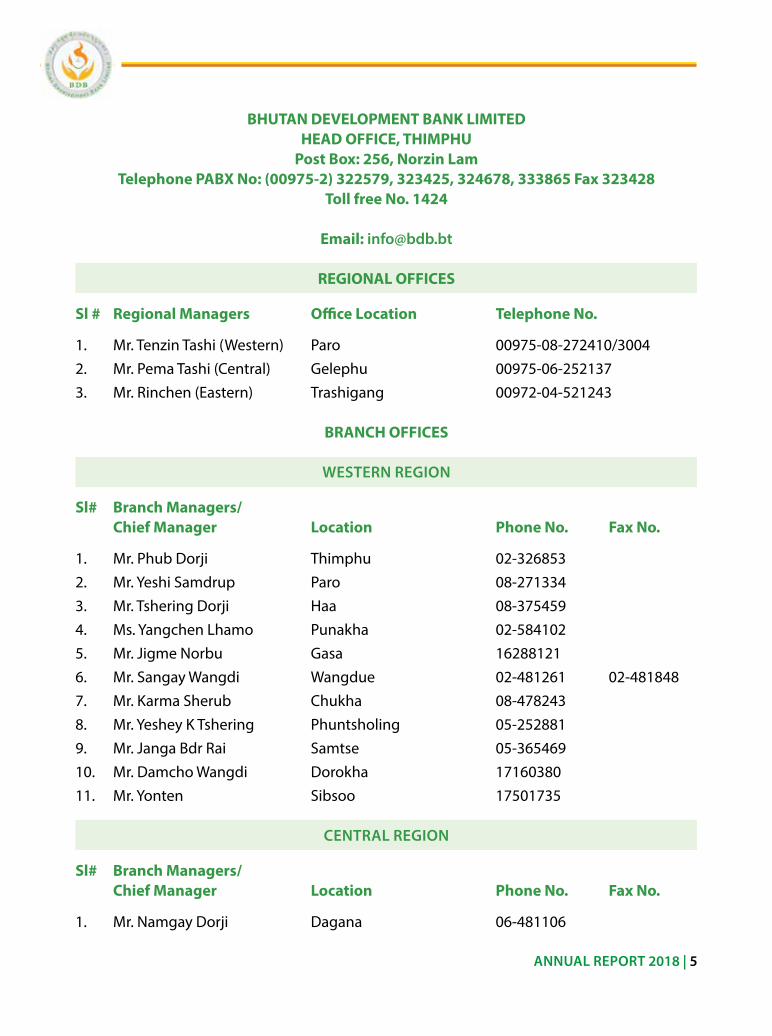
BHUTAN DEVELOPMENT BANK LIMITEDHEAD OFFICE, THIMPHU
Post Box: 256, Norzin LamTelephone PABX No: (00975-2) 322579, 323425, 324678, 333865 Fax 323428
Toll free No. 1424
Email: [email protected]
REGIONAL OFFICES
Sl # Regional Managers Office Location Telephone No.
1. Mr. Tenzin Tashi (Western) Paro 00975-08-272410/30042. Mr. Pema Tashi (Central) Gelephu 00975-06-2521373. Mr. rinchen (eastern) Trashigang 00972-04-521243
BRANCH OFFICES
WEsTERN REgION
Sl# Branch Managers/ Chief Manager Location Phone No. Fax No.
1. Mr. Phub Dorji Thimphu 02-326853 2. Mr. Yeshi samdrup Paro 08-271334 3. Mr. Tshering Dorji Haa 08-375459 4. Ms. Yangchen lhamo Punakha 02-584102 5. Mr. Jigme norbu Gasa 16288121 6. Mr. sangay Wangdi Wangdue 02-481261 02-4818487. Mr. Karma sherub Chukha 08-478243 8. Mr. Yeshey K Tshering Phuntsholing 05-252881 9. Mr. Janga Bdr rai samtse 05-365469 10. Mr. Damcho Wangdi Dorokha 1716038011. Mr. Yonten sibsoo 17501735
CENTRAL REgION
Sl# Branch Managers/ Chief Manager Location Phone No. Fax No.
1. Mr. namgay Dorji Dagana 06-481106
| 10 | BDB Annual Report 2017
sl # Particulars 2009 2013 2014 2015 2016 2017X No.of Depositors 15,879 85,864 109,005 133,366 159,576 178,386
Main Branch 657 4821 6,322 8,436 11,186 15,101 BranchOffice 15,222 81,043 102,683 124,930 148,390 163,285
XI Number of Employess 221 357 385 416 452 563HeadOffice 66 110 125 117 144 152Main Branch 29 28 30 31 39 45BranchOffice 126 219 230 268 269 366
XII ActiveClients/EmployeeRatioMain Branch 90 112 111 120 107 101BranchOffice 137 172 187 181 193 144
XII Loans/EmployeeRatio 13 24 28 33 37 33Main Branch 62 142 153 169 153 152BranchOffice 8 21 27 32 39 33
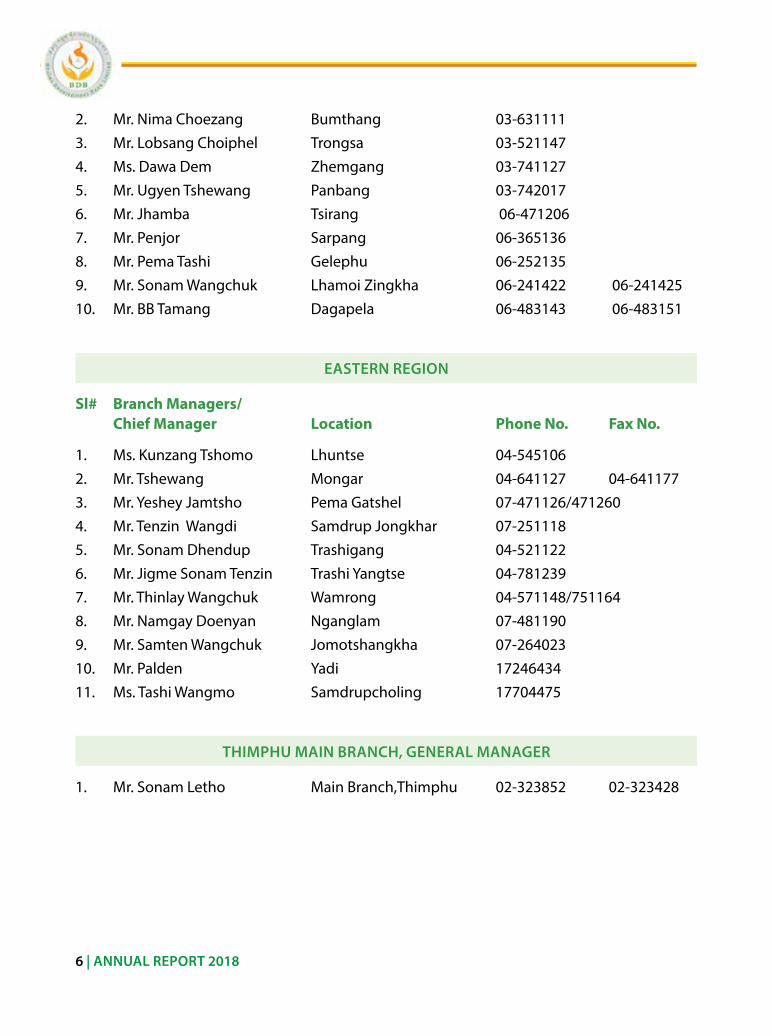
6 | ANNUAL REPORT 2018
2. Mr. nima Choezang Bumthang 03-631111 3. Mr. lobsang Choiphel Trongsa 03-521147 4. Ms. Dawa Dem zhemgang 03-741127 5. Mr. ugyen Tshewang Panbang 03-742017 6. Mr. Jhamba Tsirang 06-471206 7. Mr. Penjor sarpang 06-365136 8. Mr. Pema Tashi Gelephu 06-252135 9. Mr. sonam Wangchuk lhamoi zingkha 06-241422 06-24142510. Mr. BB Tamang Dagapela 06-483143 06-483151
EAsTERN REgION
Sl# Branch Managers/ Chief Manager Location Phone No. Fax No.
1. Ms. Kunzang Tshomo lhuntse 04-545106 2. Mr. Tshewang Mongar 04-641127 04-6411773. Mr. Yeshey Jamtsho Pema Gatshel 07-471126/471260 4. Mr. Tenzin Wangdi samdrup Jongkhar 07-251118 5. Mr. sonam Dhendup Trashigang 04-521122 6. Mr. Jigme sonam Tenzin Trashi Yangtse 04-7812397. Mr. Thinlay Wangchuk Wamrong 04-571148/751164 8. Mr. namgay Doenyan nganglam 07-481190 9. Mr. samten Wangchuk Jomotshangkha 07-264023 10. Mr. Palden Yadi 17246434 11. Ms. Tashi Wangmo samdrupcholing 17704475
THIMPHU MAIN BRANCH, gENERAL MANAgER
1. Mr. sonam letho Main Branch,Thimphu 02-323852 02-323428

| 10 | BDB Annual Report 2017
sl # Particulars 2009 2013 2014 2015 2016 2017X No.of Depositors 15,879 85,864 109,005 133,366 159,576 178,386
Main Branch 657 4821 6,322 8,436 11,186 15,101 BranchOffice 15,222 81,043 102,683 124,930 148,390 163,285
XI Number of Employess 221 357 385 416 452 563HeadOffice 66 110 125 117 144 152Main Branch 29 28 30 31 39 45BranchOffice 126 219 230 268 269 366
XII ActiveClients/EmployeeRatioMain Branch 90 112 111 120 107 101BranchOffice 137 172 187 181 193 144
XII Loans/EmployeeRatio 13 24 28 33 37 33Main Branch 62 142 153 169 153 152BranchOffice 8 21 27 32 39 33
ANNUAL REPORT 2018 | 7
CHAIRMANMr. lekzang DorjiDirector General
Department of Macro economic affairsMinistry of Finance
DIRECTORMr. nima Wangdi
Former Health secretaryGadhen Khangzang
DIRECTORMr. Pema Wangdi
Chief executive officerreDCl
DIRECTORMr. ugyen PenjorDirector General
Department of agricultural Marketing and Cooperatives
DIRECTORMr. Dhak Tshering
DirectorDos, MoWHs
DIRECTORMr. Phub Tshering
Former secretary GeneralBCCi
MEMBER sECRETARyMr. Phub Dorji
Chief executive officerBDB
BoarD oF DireCTors
| 10 | BDB Annual Report 2017
sl # Particulars 2009 2013 2014 2015 2016 2017X No.of Depositors 15,879 85,864 109,005 133,366 159,576 178,386
Main Branch 657 4821 6,322 8,436 11,186 15,101 BranchOffice 15,222 81,043 102,683 124,930 148,390 163,285
XI Number of Employess 221 357 385 416 452 563HeadOffice 66 110 125 117 144 152Main Branch 29 28 30 31 39 45BranchOffice 126 219 230 268 269 366
XII ActiveClients/EmployeeRatioMain Branch 90 112 111 120 107 101BranchOffice 137 172 187 181 193 144
XII Loans/EmployeeRatio 13 24 28 33 37 33Main Branch 62 142 153 169 153 152BranchOffice 8 21 27 32 39 33
8 | ANNUAL REPORT 2018
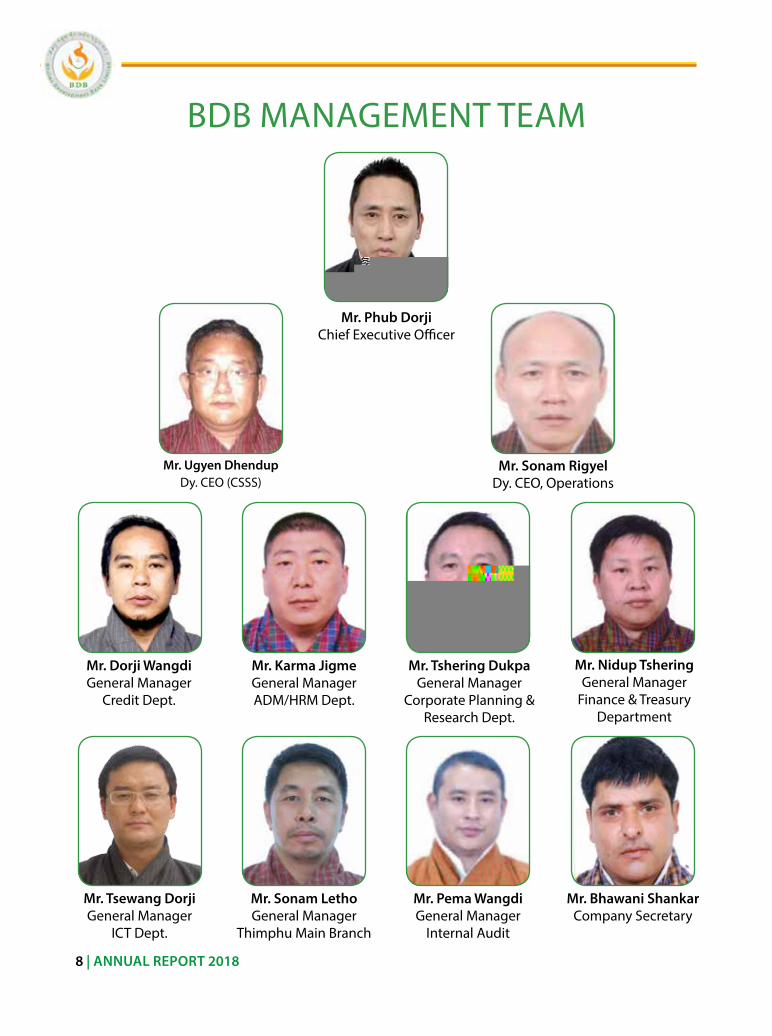
BDB ManaGeMenT TeaM
Mr. Phub DorjiChief executive officer
Mr. Ugyen DhendupDy. Ceo (Csss)
Mr. sonam RigyelDy. Ceo, operations
Mr. Dorji WangdiGeneral Manager
Credit Dept.
Mr. Tsewang DorjiGeneral Manager
iCT Dept.
Mr. Karma JigmeGeneral ManageraDM/HrM Dept.
Mr. Tshering Dukpa General Manager
Corporate Planning & research Dept.
Mr. Nidup Tshering General Manager
Finance & Treasury Department
Mr. sonam Letho General Manager
Thimphu Main Branch
Mr. Pema Wangdi General Manager
internal audit
Mr. Bhawani shankar Company secretary

| 10 | BDB Annual Report 2017
sl # Particulars 2009 2013 2014 2015 2016 2017X No.of Depositors 15,879 85,864 109,005 133,366 159,576 178,386
Main Branch 657 4821 6,322 8,436 11,186 15,101 BranchOffice 15,222 81,043 102,683 124,930 148,390 163,285
XI Number of Employess 221 357 385 416 452 563HeadOffice 66 110 125 117 144 152Main Branch 29 28 30 31 39 45BranchOffice 126 219 230 268 269 366
XII ActiveClients/EmployeeRatioMain Branch 90 112 111 120 107 101BranchOffice 137 172 187 181 193 144
XII Loans/EmployeeRatio 13 24 28 33 37 33Main Branch 62 142 153 169 153 152BranchOffice 8 21 27 32 39 33
ANNUAL REPORT 2018 | 9
I would like to extend a warm welcome to the esteemed shareholders for attending the 27thannual General Meeting of Bhutan Development Bank ltd. (BDB). it has been a little over one year since i was appointed as a Chairman of Bhutan Development Bank in December 2017. With the constant support and cooperation of the Board of Directors
and the shareholders we have been able to guide the bank in fulfilling their social mandate of taking financial services to the nuke and corners of country. it is also worth mentioning the bank was able to recover from the huge loss suffered in 2017 to a very successful financial year in 2018. on behalf of the Board of Directors and the shareholders i would like to congratulate the Management and staff for their success and urge them to keep working with the same enthusiasm and commitment.
on behalf of the Board of Directors and the Management of BDB, i am pleased to present herewith the 27thannual report for the year ended December 31, 2018.
1. Governance:
The seven Board of Directors of the Board, including the Ceo, are directly appointed by the royal Government. During 2018, 4 Board Meetings and 1 annual General Meeting were conducted.
The Board of Directors have been supported by 3 Board sub-committees covering the areas of Governance andrisk Management, audit and Credit, after the implementation of the new Corporate Governance regulation (CGr)issued by royal Monetary authority (rMa) of Bhutan. Prior to implementation of the CGr there were 4 Board sub-committees. The Board sub-committees held their quarterly or biannual meeting as per the statutory requirement to review, discuss and amend important policies, priorities and plans to facilitate decision making by the Board.
in 2018 the Board set the approved a realistic and set the following major targets; stabilization of the Finacle - Core Banking solution (CBs), start construction of Trashiyangtse office building,
CHairMan’s rePorT
| 10 | BDB Annual Report 2017
sl # Particulars 2009 2013 2014 2015 2016 2017X No.of Depositors 15,879 85,864 109,005 133,366 159,576 178,386
Main Branch 657 4821 6,322 8,436 11,186 15,101 BranchOffice 15,222 81,043 102,683 124,930 148,390 163,285
XI Number of Employess 221 357 385 416 452 563HeadOffice 66 110 125 117 144 152Main Branch 29 28 30 31 39 45BranchOffice 126 219 230 268 269 366
XII ActiveClients/EmployeeRatioMain Branch 90 112 111 120 107 101BranchOffice 137 172 187 181 193 144
XII Loans/EmployeeRatio 13 24 28 33 37 33Main Branch 62 142 153 169 153 152BranchOffice 8 21 27 32 39 33
10 | ANNUAL REPORT 2018
upgradation of two Community Centers (CCs) to Gewog Field office (GFos), install five additional aTMs and reduce the nPl/Par to make nu. 304 million profit.
1.1 Supervision by Regulators, Governing bodies and Auditors:
The statutory auditors M/s Gianender and associates, Chartered accountants, new Delhi audited the Bank for the financial year 2018. This is their last year of audit engagement with BDB.
i am pleased to share the auditors’ opinion on activities undertaken by the bank. The Bank has complied with the applicable laws, rules and regulations while discharging its responsibilities while making a decent profit of nu. 322millioncompared to the loss of nu. 762million in 2017as per the final audited accounts.
2. Financial Highlights
2.1 Equity
The capital and reserves (Total equity) witnessed a growth of 5% from nu. 2.19 billion to nu. 2.59 billion. The growth in equity was mainly due to profit appropriations and injection of nu. 93 million additional capital by the Ministry of Finance (major shareholder) during the period.
2.2. Bank’s Financial Position and Performance:
as per the finalized accounts the Bank’s total assets grew by 5% to nu. 25.22 billion from the previous year of nu. 24.03 billion. The growth was possible mainly due to increase in loans and short term investments.
The Bank’s liabilities increased by 4% from nu. 21.84 billion to nu. 22.63 billion due to increase in deposits and borrowings. The Bank earned a profit of nu. 322million in 2018 against the target of nu.304 million, compared to loss of nu. 762million during the same period in 2017. The total interest and similar income grew by 6% from nu. 1.97 billion to nu. 2.09 billion. other operating income also increased substantially from nu. 13 million to nu. 31 million. on the other hand, the interest expenses increased by 5% from nu. 1.34 billion to nu. 1.41 billion on year to year comparisons due to growth in deposit.
The personnel expenses increased by 19% from nu. 227 million to nu. 269 million due to increase in staff strength while other operating expenses also increased by 8 % from nu. 173 million to nu. 187 million.
The loan impairment charges, decreased significantly from nu. 971 million in 2017 to nu. 107
| 10 | BDB Annual Report 2017
sl # Particulars 2009 2013 2014 2015 2016 2017X No.of Depositors 15,879 85,864 109,005 133,366 159,576 178,386
Main Branch 657 4821 6,322 8,436 11,186 15,101 BranchOffice 15,222 81,043 102,683 124,930 148,390 163,285
XI Number of Employess 221 357 385 416 452 563HeadOffice 66 110 125 117 144 152Main Branch 29 28 30 31 39 45BranchOffice 126 219 230 268 269 366
XII ActiveClients/EmployeeRatioMain Branch 90 112 111 120 107 101BranchOffice 137 172 187 181 193 144
XII Loans/EmployeeRatio 13 24 28 33 37 33Main Branch 62 142 153 169 153 152BranchOffice 8 21 27 32 39 33
ANNUAL REPORT 2018 | 11
million resulting in a write-back due to improvement in non-Performing loans (nPl) from 22.72% (2017) to 20.73% in 2018. The bank was also able to achieve most of the non-financial targets with an overall performance measurement system (PMs) rating of 96.27%. The statutory requirement of 10% Cash reserve ratio (Crr) and 20% of statutory liquidity ratio (slr) were all fully complied with. it is worth noting that through a prudent control measures put in place, the Bank has been able to maintain its operating expenses ratio at 23.20% which is below the 26% ceiling set by the Board.
3. Operational Highlights:
3.1 Credit Distribution:
• Inkeepingwiththemandates,BDBastheonlydevelopmentbankcontinuestoassumethe lead role in offering financial and other allied services in the rural areas of the country. The Bank, with 35 branch offices, 2- Gewog Field offices (GFo) and 198 Gewog Banking services (GBs) is able to provide financial services across all 20 Dzongkhags and 14 Dungkhags. additionally, through the Farmers outreach Banking (FoB) BDB is able to take financial services to the doorstep of the people despite high establishment and operational costs.
• Loans to needy farmers continue to increase its penetration in the far-flung andunbanked areas taking the total clientele base to 54,441 as of December 31, 2018 with an outstanding loan balance of nu.18.923 billion. agriculture being the mainstay of the rural economy continues to dominate other sectors in terms of credit portfolio, which conforms to the Bank’s mandate of empowering farmers through extension of credit. agriculture portfolio of 26% of the total loan amount is not only highest in the Bank but also in the whole banking sector, which is a testimony of the Bank’s unwavering support for agriculture development.
• Thefinalauditedaccountsin2018showsanoverallcreditgrowthof0.67%withloanoutstanding of nu.18.923 billion which grew from nu. 18.83 billion in 2017.The Credit growth from 2013 to 2018 has increased by 122.62% from nu. 8.50 billion to nu. 18.923 billion.
1.2 Banking Activities
• TheBankiscontinuouslyimplementingallpossiblemeanstotakebankingservicestothedoorstepsofthefarflungareasasanintegralpartofBank’sefforttopromotefinancial inclusion. The Farmer outreach Banking (FoB), a very popular program at the Gewog level, requires the bank’s staff to visit designated places on preset date and time every month besides their regular follow-up with the clients.
| 10 | BDB Annual Report 2017
sl # Particulars 2009 2013 2014 2015 2016 2017X No.of Depositors 15,879 85,864 109,005 133,366 159,576 178,386
Main Branch 657 4821 6,322 8,436 11,186 15,101 BranchOffice 15,222 81,043 102,683 124,930 148,390 163,285
XI Number of Employess 221 357 385 416 452 563HeadOffice 66 110 125 117 144 152Main Branch 29 28 30 31 39 45BranchOffice 126 219 230 268 269 366
XII ActiveClients/EmployeeRatioMain Branch 90 112 111 120 107 101BranchOffice 137 172 187 181 193 144
XII Loans/EmployeeRatio 13 24 28 33 37 33Main Branch 62 142 153 169 153 152BranchOffice 8 21 27 32 39 33
12 | ANNUAL REPORT 2018
• The Bank startedmobilizing deposits from 2010 onwards as a reliable source offund. With concerted efforts the bank has managed to raise the deposit to nu. 20.08 billion with a total of 203,000 deposit accounts compared to nu. 19.689billion with a total of 178,386 deposit accounts in 2017. The Bank’s corporate to retail deposit ratio improved to 48:52 in 2018. The retail deposits increased by 29% from nu. 8,083 million to nu. 10,395 million as of December 31, 2018.
• During2018,toincreasetheretaildepositbase,metalsavingboxesweredistributedto religious bodies (Dratshang and shedras). This effort resulted in an addition enrollment of 243 accounts on the first day of introduction of the new scheme for religious bodies.
• The Bank also startedYE1 - Banking in collaboration with rMa in arekha Middle secondary school under Chukha Dzongkhag where 592 saving accounts opened by students with a total deposit of nu.4.6 million.
3.3 Investments
• WhilemajorityoftheBank’sinvestmentsareintheformofloansandadvances,effortsare made to diversify investments to mitigate risk whenever there is opportunity. as of date, the Bank has invested in bonds and shares with reputable commercial entities in the country. as of 2018 end nu.435.9 million have been invested in bonds with three institutions, namely riCBl, DCCl and rsa for the period ranging from seven to ten years as compared to nu. 421.2 million in 2017 end.
• The Bank has also invested in shares worth Nu.53.8 million in 2018 with eightdifferent companies in the country as compared to 44 million in 2017.
• Further,theBankhasbeenregularlybiddingforGovernmenttreasurybillstousethe slr funds to supplement its regular income of the bank.
3.4. Human Resources Management
• The Bank had an allocated budget of Nu.24million for capacity building of theemployees. During the year, a total of 273 employees were trained in various fields such as Corporate Governance, Credit appraisal, Delinquency Management and loan recovery, Customer Care, Development bank practices, international study visit program, Finacle core technical training, institutional Visit, loan impairment, Branch monitoring and supervisions, leadership Program, both within and outside country. a total of 160 staff attended trainings outside the country and 113 staffs
1 Youth ethics (Ye)
| 10 | BDB Annual Report 2017
sl # Particulars 2009 2013 2014 2015 2016 2017X No.of Depositors 15,879 85,864 109,005 133,366 159,576 178,386
Main Branch 657 4821 6,322 8,436 11,186 15,101 BranchOffice 15,222 81,043 102,683 124,930 148,390 163,285
XI Number of Employess 221 357 385 416 452 563HeadOffice 66 110 125 117 144 152Main Branch 29 28 30 31 39 45BranchOffice 126 219 230 268 269 366
XII ActiveClients/EmployeeRatioMain Branch 90 112 111 120 107 101BranchOffice 137 172 187 181 193 144
XII Loans/EmployeeRatio 13 24 28 33 37 33Main Branch 62 142 153 169 153 152BranchOffice 8 21 27 32 39 33
ANNUAL REPORT 2018 | 13
were trained within the country. The board fully supported the plans to enhance the capacity of staff and instill a culture of professionalism in the Bank.
• Duringtheyearanadditionalof82newemployeeswererecruitedincreasingthetotal regular employee strength to 572 as of December 31, 2018. in addition, there are 231 Community Center (CC) operators including 11 regular CC management team. The overall staff strength of the Bank is 814 employees who are scattered across the country.
4. Key achievements during the year 2018
• The standard operating Procedure (soP) for the iCT Department, revision of Credit and Banking manuals, internal audit operational Guidelines and Board audit Charter have been completed successfully. The revision of these manuals, operational Guidelines, and soP will facilitate the provision of transparent and efficient financial services.
• With the new switch, the Bank also procured and installed 5 new aTMs in various locations around the country. The Bank now has 50 aTMs to enable our customers to carry out banking services at their convenience.
• To provide more financial products and services, two Gewog Banking services (GBs) within the Community Centers, were up graded to Gewog Field offices (GFo)at Betaykha under Branch office, Paro Dzongkhag and Dungna under Gedu Branch
• office, Chukha Dzongkhag where loans can also be sanctioned and disbursed unlike the GBs.
• The Customer satisfaction survey for the Bank was conducted by Corporate Planning and research Department (CPrD) by hiring students from Gedu Business College and royal Thimphu College. The overall score improved to 85.57% from 83.57% in 2014.
5. Corporate Social Responsibilities
• BDB as the only development bank with strong social mandate always attach due importance in upholding values, preservation of culture and tradition that binds the society. Towards this end, the bank participated in the blood donation.
• The bank has been making modest donations to institutions such as schools, health agencies, sporting firms, religious bodies including individuals. The bank donated a total of nu. 1,087,550in 2018 as compared to nu. 830,000in 2017
| 10 | BDB Annual Report 2017
sl # Particulars 2009 2013 2014 2015 2016 2017X No.of Depositors 15,879 85,864 109,005 133,366 159,576 178,386
Main Branch 657 4821 6,322 8,436 11,186 15,101 BranchOffice 15,222 81,043 102,683 124,930 148,390 163,285
XI Number of Employess 221 357 385 416 452 563HeadOffice 66 110 125 117 144 152Main Branch 29 28 30 31 39 45BranchOffice 126 219 230 268 269 366
XII ActiveClients/EmployeeRatioMain Branch 90 112 111 120 107 101BranchOffice 137 172 187 181 193 144
XII Loans/EmployeeRatio 13 24 28 33 37 33Main Branch 62 142 153 169 153 152BranchOffice 8 21 27 32 39 33
14 | ANNUAL REPORT 2018
6. Challenges and risks facing the bank
• The Finacle CBs has been stabilized by recruiting a Finacle expert from india on contract and upgrading the iCT Division to a Department by strengthen the capacity and capabilities of the iT team. However, reduction in nPl/Par remains one of the biggest challenges.
• implementation of the Minimum lending rate (Mlr) for a development bank which has very high operation cost poses significant challenge.
• The commercial banks with bigger loan amount and less clientele have the luxury of time to plan and provide better services attracting good clients while our social mandate requires us to serve clients with small loan amounts but very high number of clientele.
• recovery is becoming extremely challenging as the rural land offered as collateral does not attract bidders when the assets are taken over and auction conducted.
• The huge overhead costs of CCs with minimal returns affects the profit of the Bank. Further, the penetration of smart phones in the rural areas has rendered many G2C services redundant. With the CC operators mostly on contract, attrition rate is very high and complains against disruptions of services from all quarters is another challenge.
7. Way forward
• unlike the preceding years, the Bank’s theme for this year was decided as “Growth with Quality”.The bank has set a modest credit growth target of 3% for 2019. The bank will continue to be the preferred choice for the farmers but the focus will be on reducing the nPl.
• With the launch of BDB ePay, clients can make the utility bill payment, mobile top up and transfer funds by leveraging on the new CBs and switch.
• The frequencies of the visits to the branches by the regional Managers and the internal auditors will be increased for the surprise visits to curb the misuse cases.
• Thimphu Main Branch (TMB) has 37% of the loan portfolio and also very high nPl. To improve the nPl situations, the recovery Division of the TMB will be strengthened by providing adequate and senior staff.
• The legal Division will be restructured into nPa and litigation units to clean the loan portfolios. The Write off manual will be implemented to write off all the old cases which
| 10 | BDB Annual Report 2017
sl # Particulars 2009 2013 2014 2015 2016 2017X No.of Depositors 15,879 85,864 109,005 133,366 159,576 178,386
Main Branch 657 4821 6,322 8,436 11,186 15,101 BranchOffice 15,222 81,043 102,683 124,930 148,390 163,285
XI Number of Employess 221 357 385 416 452 563HeadOffice 66 110 125 117 144 152Main Branch 29 28 30 31 39 45BranchOffice 126 219 230 268 269 366
XII ActiveClients/EmployeeRatioMain Branch 90 112 111 120 107 101BranchOffice 137 172 187 181 193 144
XII Loans/EmployeeRatio 13 24 28 33 37 33Main Branch 62 142 153 169 153 152BranchOffice 8 21 27 32 39 33
ANNUAL REPORT 2018 | 15
contribute to the high nPl.
• The recovery officers will identify high risk area, identify serious defaulters and devise and implement recovery strategies.
• During the annual Workshop many strategies have been planned to improve profits, reduce nPl, build human resource capacities, and minimize frauds in keeping with the overall theme to achieve “growth with quality”.
• The Bank has developed a Penalty clause which will be implemented in 2019 to improve loan documentation, reduce loan denial and multiple loan disbursement.
• The bank will continue to expand the Group Guaranteed lending scheme (GGls) for people who do not have collateral. as part of the ongoing financial inclusion the bank will expand the saving scheme for the religious and monastic bodies.
8. Conclusion
in conclusion, the Bank commits to remain a dominant player in providing financial services to the farmers who comprise close to 56% of Bhutan’s working population. our financial services will not only improve the livelihoods of the farmers but contribute to the overarching goal of self reliance. The Board will continue to provide the required support, guidance and direction to the management to improve the performance of the Bank in each successive year. it goes without saying the importance of the reassurance of the Government, Ministry of Finance, donors and other stakeholders in the ultimate delivery of the financial services to the Bhutanese for many years to come.
[ Lekzang Dorji ]Chairman
Bhutan Development Bank Ltd.
| 10 | BDB Annual Report 2017
sl # Particulars 2009 2013 2014 2015 2016 2017X No.of Depositors 15,879 85,864 109,005 133,366 159,576 178,386
Main Branch 657 4821 6,322 8,436 11,186 15,101 BranchOffice 15,222 81,043 102,683 124,930 148,390 163,285
XI Number of Employess 221 357 385 416 452 563HeadOffice 66 110 125 117 144 152Main Branch 29 28 30 31 39 45BranchOffice 126 219 230 268 269 366
XII ActiveClients/EmployeeRatioMain Branch 90 112 111 120 107 101BranchOffice 137 172 187 181 193 144
XII Loans/EmployeeRatio 13 24 28 33 37 33Main Branch 62 142 153 169 153 152BranchOffice 8 21 27 32 39 33
16 | ANNUAL REPORT 2018
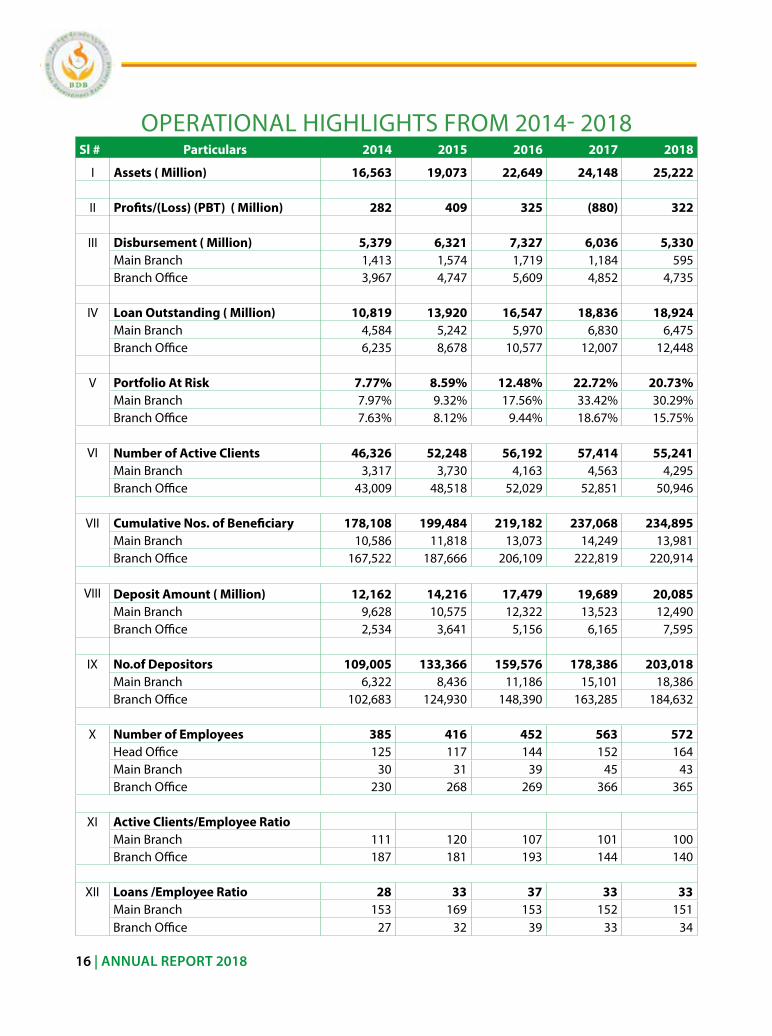
oPeraTional HiGHliGHTs FroM 2014- 2018Sl # Particulars 2014 2015 2016 2017 2018
i Assets ( Million) 16,563 19,073 22,649 24,148 25,222
ii Profits/(Loss) (PBT) ( Million) 282 409 325 (880) 322
iii Disbursement ( Million) 5,379 6,321 7,327 6,036 5,330 Main Branch 1,413 1,574 1,719 1,184 595 Branch office 3,967 4,747 5,609 4,852 4,735
iV Loan Outstanding ( Million) 10,819 13,920 16,547 18,836 18,924
Main Branch 4,584 5,242 5,970 6,830 6,475 Branch office 6,235 8,678 10,577 12,007 12,448
V Portfolio At Risk 7.77% 8.59% 12.48% 22.72% 20.73%
Main Branch 7.97% 9.32% 17.56% 33.42% 30.29%Branch office 7.63% 8.12% 9.44% 18.67% 15.75%
Vi Number of Active Clients 46,326 52,248 56,192 57,414 55,241
Main Branch 3,317 3,730 4,163 4,563 4,295 Branch office 43,009 48,518 52,029 52,851 50,946
Vii Cumulative Nos. of Beneficiary 178,108 199,484 219,182 237,068 234,895
Main Branch 10,586 11,818 13,073 14,249 13,981 Branch office 167,522 187,666 206,109 222,819 220,914
Viii Deposit Amount ( Million) 12,162 14,216 17,479 19,689 20,085
Main Branch 9,628 10,575 12,322 13,523 12,490 Branch office 2,534 3,641 5,156 6,165 7,595
iX No.of Depositors 109,005 133,366 159,576 178,386 203,018
Main Branch 6,322 8,436 11,186 15,101 18,386 Branch office 102,683 124,930 148,390 163,285 184,632
X Number of Employees 385 416 452 563 572
Head office 125 117 144 152 164Main Branch 30 31 39 45 43Branch office 230 268 269 366 365
Xi Active Clients/Employee Ratio
Main Branch 111 120 107 101 100Branch office 187 181 193 144 140
Xii Loans /Employee Ratio 28 33 37 33 33
Main Branch 153 169 153 152 151Branch office 27 32 39 33 34
| 10 | BDB Annual Report 2017
sl # Particulars 2009 2013 2014 2015 2016 2017X No.of Depositors 15,879 85,864 109,005 133,366 159,576 178,386
Main Branch 657 4821 6,322 8,436 11,186 15,101 BranchOffice 15,222 81,043 102,683 124,930 148,390 163,285
XI Number of Employess 221 357 385 416 452 563HeadOffice 66 110 125 117 144 152Main Branch 29 28 30 31 39 45BranchOffice 126 219 230 268 269 366
XII ActiveClients/EmployeeRatioMain Branch 90 112 111 120 107 101BranchOffice 137 172 187 181 193 144
XII Loans/EmployeeRatio 13 24 28 33 37 33Main Branch 62 142 153 169 153 152BranchOffice 8 21 27 32 39 33
ANNUAL REPORT 2018 | 17
| 10 | BDB Annual Report 2017
sl # Particulars 2009 2013 2014 2015 2016 2017X No.of Depositors 15,879 85,864 109,005 133,366 159,576 178,386
Main Branch 657 4821 6,322 8,436 11,186 15,101 BranchOffice 15,222 81,043 102,683 124,930 148,390 163,285
XI Number of Employess 221 357 385 416 452 563HeadOffice 66 110 125 117 144 152Main Branch 29 28 30 31 39 45BranchOffice 126 219 230 268 269 366
XII ActiveClients/EmployeeRatioMain Branch 90 112 111 120 107 101BranchOffice 137 172 187 181 193 144
XII Loans/EmployeeRatio 13 24 28 33 37 33Main Branch 62 142 153 169 153 152BranchOffice 8 21 27 32 39 33
BHUTAN DEVELOPMENT BANK LIMITED
AUDITORs’ REPORT2018
gianender & AssociatesChartered Accountants
New DelhiIndia
| 10 | BDB Annual Report 2017
sl # Particulars 2009 2013 2014 2015 2016 2017X No.of Depositors 15,879 85,864 109,005 133,366 159,576 178,386
Main Branch 657 4821 6,322 8,436 11,186 15,101 BranchOffice 15,222 81,043 102,683 124,930 148,390 163,285
XI Number of Employess 221 357 385 416 452 563HeadOffice 66 110 125 117 144 152Main Branch 29 28 30 31 39 45BranchOffice 126 219 230 268 269 366
XII ActiveClients/EmployeeRatioMain Branch 90 112 111 120 107 101BranchOffice 137 172 187 181 193 144
XII Loans/EmployeeRatio 13 24 28 33 37 33Main Branch 62 142 153 169 153 152BranchOffice 8 21 27 32 39 33
18 | ANNUAL REPORT 2018
Gianender& Associates Phone: 011- 28743942; 42412008Chartered Accountants Telefax : 01142412008Plot no 6, siteno 21 email-id:gka_ma@ yahoo.comGeetaMandir Marg,new rajinder nagarnew Delhi -110060
INDEPENDENT AUDITORS’ REPORT
Report on the Financial Statements
Opinion
We have audited the financial statements of Bhutan Development Bank Limited, which comprise the statement of Financial Position as at December 31, 2018, and the statement of Comprehensive income, statement of Changes in equity and statement of Cash Flows for the year then ended, and notes to the financial statements, including a summary of significant accounting policies.
in our opinion, the accompanying financials present fairly, in all material respects, the financial position of the Company as at December 31, 2018 of its financial performance and its cash flowsfortheyearthenendedinaccordancewiththeBhutaneseAccountingStandards(BAS).
Basis for Opinion
We conducted our audit in accordance with international standards on auditing (isas). our responsibilities under those standards are further described in the auditor’s responsibilities for the audit of the Financial statements section of our report. We are independent of the Company in accordance with the international ethics standards Board for accountants ‘Code of Ethics for Professional Accountants (IESBA Code) together with the ethical requirements that are relevant to our audit of the financial statements in Bhutan, and we have fulfilled our other ethical responsibilities in accordance with these requirements and the iesBa Code.
auDiTor’s rePorT
| 10 | BDB Annual Report 2017
sl # Particulars 2009 2013 2014 2015 2016 2017X No.of Depositors 15,879 85,864 109,005 133,366 159,576 178,386
Main Branch 657 4821 6,322 8,436 11,186 15,101 BranchOffice 15,222 81,043 102,683 124,930 148,390 163,285
XI Number of Employess 221 357 385 416 452 563HeadOffice 66 110 125 117 144 152Main Branch 29 28 30 31 39 45BranchOffice 126 219 230 268 269 366
XII ActiveClients/EmployeeRatioMain Branch 90 112 111 120 107 101BranchOffice 137 172 187 181 193 144
XII Loans/EmployeeRatio 13 24 28 33 37 33Main Branch 62 142 153 169 153 152BranchOffice 8 21 27 32 39 33
ANNUAL REPORT 2018 | 19
We believe that the audit evidence we have obtained is sufficient and appropriate to provide a basis for our opinion.
Emphasis of Matter:Without qualifying our opinion we draw attention to the following:
a) i) Current account with Royal Monetary Authority is under reconciliation, as on 31.12.2018. An amount of Nu. 3,245,520.19 mentioned as “prior period adjustments” are pending for identification and reconciliation since 2016.
ii) BFS account with Royal Monetary Authority is under reconciliation, as on 31.12.2018. An amount of Nu. 9,103,150 mentioned as “Any other adjustments” are pending for identification and reconciliation.
b) In view of the various cases of misappropriation/ Embezzlements and unauthorized sanctions & disbursements acts involving employees of the bank, overwriting of field receipts, back date errors in field receipts, non-updating of field collections of funds collected by PSOs in various branches, internal control systems and procedures of the bank relating to credit management need to be strengthened.
our opinion is not modified due to above matter.
OtherMatterBank has 35 branches, out of which 12 branches were audited by us, and for remaining 23 branches, accounts as prepared by the management have been incorporated in the financial statements.
Management’s Responsibility for the Financial Statements Management is responsible for the preparation and fair presentation of the financial statements in accordance with Bas) and for such internal controls as management determines is necessary to enable the preparation of financial statements that are free from material misstatement, whether due to fraud or error.
in preparing the financial statements, management is responsible for assessing the Company’s ability to continue as a going concern, disclosing, as applicable, matters relating to going concern and using the going concern basis of accounting unless management either intends to liquidate the company or to ceases operations, or has no realistic alternative but to do so.
Those charged with governance are responsible for overseeing the Company’s financial reporting process.
Auditor’s Responsibility our objective are to obtain reasonable assurance about whether the financial statements as a whole are free from material misstatement, whether due to fraud or error and to issue an
| 10 | BDB Annual Report 2017
sl # Particulars 2009 2013 2014 2015 2016 2017X No.of Depositors 15,879 85,864 109,005 133,366 159,576 178,386
Main Branch 657 4821 6,322 8,436 11,186 15,101 BranchOffice 15,222 81,043 102,683 124,930 148,390 163,285
XI Number of Employess 221 357 385 416 452 563HeadOffice 66 110 125 117 144 152Main Branch 29 28 30 31 39 45BranchOffice 126 219 230 268 269 366
XII ActiveClients/EmployeeRatioMain Branch 90 112 111 120 107 101BranchOffice 137 172 187 181 193 144
XII Loans/EmployeeRatio 13 24 28 33 37 33Main Branch 62 142 153 169 153 152BranchOffice 8 21 27 32 39 33
20 | ANNUAL REPORT 2018
auditor’s report that included our opinion. reasonable assurance is a high level assurance, but is not a guarantee that an audit conducted in accordance with isas will always detect a material misstatement when it exists. Misstatements can arise from fraud or error and are considered materialif,individuallyorintheaggregate,theycouldreasonablybeexpectedtoinfluencetheeconomic decisions of users taken on the basis of these financial statements.
our additional responsibilities are provided in exhibit i.
Report on Other Legal and Regulatory Requirements as required by section 266 of the Companies act of Bhutan, 2016, we enclose Minimum audit examination&reporting requirement. (refer exhibit ii)
Further, as required by section 265 of the act, we report that:
a) We have obtained all the information and explanations which to the best of our knowledge and belief were necessary for the purposes of our audit.
b) in our opinion, proper books of account as required by law have been kept by the Company so far as appears from our examination of the books.
c) The statement of Financial Position, the statement of Comprehensive income, the statement of Changes in equity and the statement of Cash Flows dealt with by this report have been prepared in accordance with Bhutanese accounting standards and are in agreement with the books of accounts.
d) the company has complied with other legal and regulatory requirements.
For Gianender& Associates Chartered Accountants ICAI registration Number: 004661N
Place: new Delhi, india G.K AgrawalDate: Partner
Membership no. 081603
| 10 | BDB Annual Report 2017
sl # Particulars 2009 2013 2014 2015 2016 2017X No.of Depositors 15,879 85,864 109,005 133,366 159,576 178,386
Main Branch 657 4821 6,322 8,436 11,186 15,101 BranchOffice 15,222 81,043 102,683 124,930 148,390 163,285
XI Number of Employess 221 357 385 416 452 563HeadOffice 66 110 125 117 144 152Main Branch 29 28 30 31 39 45BranchOffice 126 219 230 268 269 366
XII ActiveClients/EmployeeRatioMain Branch 90 112 111 120 107 101BranchOffice 137 172 187 181 193 144
XII Loans/EmployeeRatio 13 24 28 33 37 33Main Branch 62 142 153 169 153 152BranchOffice 8 21 27 32 39 33
ANNUAL REPORT 2018 | 21
Exhibit I
as part of an audit in accordance with isas, we exercise professional judgment and maintain professional skepticism throughout the audit. We also:
• Identifyandassesstherisksofmaterialmisstatementofthefinancialstatements,whetherdue to fraud or error, design and perform audit procedures responsive to those risks, and obtain audit evidence that is sufficient and appropriate to provide a basis for our opinion. The risk of not detecting a material misstatement resulting from fraud is higher than for one resulting from error, as fraud may involve collusion, forgery, intentional omissions, misrepresentations, or the override of internal control.
• Obtainanunderstandingofinternalcontrolrelevanttotheauditinordertodesignauditprocedures that are appropriate in the circumstances, but not for the purpose of expressing an opinion on the effectiveness of the Company’s internal control.
• Evaluate the appropriateness of accounting policies used and the reasonableness ofaccounting estimates and related disclosures made by management
• Conclude on the appropriateness of management’s use of the going concern basis ofaccounting and, based on the audit evidence obtained, whether a material uncertainty exists related to events or conditions that may cast significant doubt on the Company’s ability to continue as a going concern. if we conclude that a material uncertainty exists, we are required to draw attention in our auditor’s report to the related disclosures in the financial statements or, if such disclosures are inadequate, to modify our opinion. our conclusions are based on the audit evidence obtained up to the date of our auditor’s report. However, future events or conditions may cause the Company to cease to continue as a going concern.
• Evaluate the overall presentation, structure and content of the financial statements,including the disclosures, and whether the financial statements represent the underlying transactions and events in a manner that achieves fair presentation.
We communicate with those charged with governance regarding, among other matters, the planned scope and timing of the audit and significant audit findings, including any significant deficiencies in internal control that we identify during our audit.
We also provide those charged with governance with a statement that we have complied with relevant ethical requirements regarding independence, and to communicate with them all

| 10 | BDB Annual Report 2017
sl # Particulars 2009 2013 2014 2015 2016 2017X No.of Depositors 15,879 85,864 109,005 133,366 159,576 178,386
Main Branch 657 4821 6,322 8,436 11,186 15,101 BranchOffice 15,222 81,043 102,683 124,930 148,390 163,285
XI Number of Employess 221 357 385 416 452 563HeadOffice 66 110 125 117 144 152Main Branch 29 28 30 31 39 45BranchOffice 126 219 230 268 269 366
XII ActiveClients/EmployeeRatioMain Branch 90 112 111 120 107 101BranchOffice 137 172 187 181 193 144
XII Loans/EmployeeRatio 13 24 28 33 37 33Main Branch 62 142 153 169 153 152BranchOffice 8 21 27 32 39 33
22 | ANNUAL REPORT 2018
relationships and other matters that may reasonably be thought to bear on our independence, and where applicable, related safeguards.
From the matters communicated with those charged with governance, we determine those matters that were of most significance in the audit of the financial statements of the current period and are therefore the key audit matters. We describe these matters in our auditor’s report unless law or regulation precludes public disclosure about the matter or when, in extremely rare circumstances, we determine that a matter should not be communicated in our report because the adverse consequences of doing so would reasonably be expected to outweigh the public interest benefits of such communication.
| 10 | BDB Annual Report 2017
sl # Particulars 2009 2013 2014 2015 2016 2017X No.of Depositors 15,879 85,864 109,005 133,366 159,576 178,386
Main Branch 657 4821 6,322 8,436 11,186 15,101 BranchOffice 15,222 81,043 102,683 124,930 148,390 163,285
XI Number of Employess 221 357 385 416 452 563HeadOffice 66 110 125 117 144 152Main Branch 29 28 30 31 39 45BranchOffice 126 219 230 268 269 366
XII ActiveClients/EmployeeRatioMain Branch 90 112 111 120 107 101BranchOffice 137 172 187 181 193 144
XII Loans/EmployeeRatio 13 24 28 33 37 33Main Branch 62 142 153 169 153 152BranchOffice 8 21 27 32 39 33
ANNUAL REPORT 2018 | 23
Exhibit II
MINIMUM AUDIT EXAMINATION AND REPORTING REQUIREMENTS
1. The Bank is maintaining records showing full particulars including quantitative details of fixed assets. Situation of fixed assets and descriptions thereof are maintained by Accounts department. Physical verification of fixed assets of some of the branches were carried out by the Bank during the year 2018. Disrepancies noticed on such verification as compared to book records have not been dealt with in the books of accounts.
2. Fixed assets have not been re-valued during the year and therefore, there is no profits/loss on revaluation.
3. Physical verification of various stores items were carried out by the internal audit during the year. Discrepancies noticed on such verification as compared to book records have not been dealt with in the books of account.
4. in our opinion, rate of interest and other terms and conditions of secured/unsecured loans availed by the Bank from banks, financial institutions or other parties are prima facie not prejudicial to the interest of the Bank.
5. according to the information and explanations given to us, no loan, secured or unsecured, has been granted to other companies, firms or other parties under the same management. The loans granted by the Bank are prima facie not prejudicial to its interest. The advances granted to officers/staffs are in keeping with the provisions of service rule and no excessive and frequent advances are granted and accumulation of large advances against particular individual is avoided except in some of the cases unauthorized loans have been granted by the branch officials to cover misappropriation /embezzlement of cash.
6. internal controls of the bank relating to credit management need to be strengthened as on review of reports of internal audit Department, it was observed that there were many cases of embezzlement/ misappropriation, unauthorized sanctions &disbursements,irregularities in field receipts etc.
7. There is a system of competitive bidding, commensurate with the size of the Bank and the nature of its business for the purchase of goods and services including stores, equipment and other assets. The Bank is not engaged in manufacturing or trading activities.
8. Fund based or non-fund based facilities provided to the directors or to companies or firms in which any director was directly or indirectly interested, were under similar terms and conditions as were applied to other parties and were not prima facie prejudicial to the interest of the Bank.
| 10 | BDB Annual Report 2017
sl # Particulars 2009 2013 2014 2015 2016 2017X No.of Depositors 15,879 85,864 109,005 133,366 159,576 178,386
Main Branch 657 4821 6,322 8,436 11,186 15,101 BranchOffice 15,222 81,043 102,683 124,930 148,390 163,285
XI Number of Employess 221 357 385 416 452 563HeadOffice 66 110 125 117 144 152Main Branch 29 28 30 31 39 45BranchOffice 126 219 230 268 269 366
XII ActiveClients/EmployeeRatioMain Branch 90 112 111 120 107 101BranchOffice 137 172 187 181 193 144
XII Loans/EmployeeRatio 13 24 28 33 37 33Main Branch 62 142 153 169 153 152BranchOffice 8 21 27 32 39 33
24 | ANNUAL REPORT 2018
9. unserviceable or damaged stores have been determined on the basis of verification conducted at periodic intervals.
10. The Bank is maintaining reasonable records for sale and disposal of scrap.
11. according to the records, the Bank has been regular in depositing rates and taxes, duties etc. and other statutory dues with the appropriate authorities during the year.
12. There are no undisputed amounts payable in respect of rates, taxes, duties, provident funds and other statutory deductions payable at the last day of the financial year 31.12.2018.
13. according to the information and explanations given to us, no personal expenses have been debited to the income statement other than those payable under contractual obligations/service rules of the Bank.
14. The Bank has a reasonable system of recording receipts, issues and consumption of stores items commensurate with the nature and size of its business.
15. The Bank has a reasonable system for follow-up with various parties for recovery/adjustment of outstanding amounts.
16. Cash has been held time and again by the branches over and above their cash retention limits sanctioned by the Head office. This results in holding of idle cash with the defaulting branches.
17. according to the information and explanations given to us and on the basis of examination of books and records on test check basis, the activities carried out by the Bank are, in our opinion, lawful and intra-vires to the articles of incorporation of the Bank.
18. The Bank has a system of approval of the Board for all capital investment decision and investments in new projects and investment in new projects are made only after ascertaining the technical and economic feasibility of such new ventures.
19. The Bank has established an effective budgetary control system.
20. The details of remuneration to the Directors and Ceo have been disclosed in notes to financial statements.
21. The directives of the Board have generally been complied with.
22. according to the information and explanations given to us, the officials of the Bank have not transmitted any price sensitive information, which is not made publicly available to their relatives/ friends/associates, or close persons, which would directly or indirectly benefit themselves.
| 10 | BDB Annual Report 2017
sl # Particulars 2009 2013 2014 2015 2016 2017X No.of Depositors 15,879 85,864 109,005 133,366 159,576 178,386
Main Branch 657 4821 6,322 8,436 11,186 15,101 BranchOffice 15,222 81,043 102,683 124,930 148,390 163,285
XI Number of Employess 221 357 385 416 452 563HeadOffice 66 110 125 117 144 152Main Branch 29 28 30 31 39 45BranchOffice 126 219 230 268 269 366
XII ActiveClients/EmployeeRatioMain Branch 90 112 111 120 107 101BranchOffice 137 172 187 181 193 144
XII Loans/EmployeeRatio 13 24 28 33 37 33Main Branch 62 142 153 169 153 152BranchOffice 8 21 27 32 39 33
ANNUAL REPORT 2018 | 25
In Case of Finance and Investment Bank
1. There are lapses on the documentation part of loans granted by the Bank and this area requires further improvement.
2. Proper records of the transactions and contracts have been maintained and timely entries have been made for the investments made.
3. The Bank has maintained reasonable records for funds collected from depositors and for interest payment.
4. investments made by the Bank and outstanding in its books as on 31.12.2018 have not undergone any permanent diminution in value as per information and explanations given to us.
5. The Bank has complied with the requirements of the Financial services act of Bhutan, 2011 and any other applicable laws, rules and regulations and guidelines issued by the appropriate authorities as explained by the management except otherwise mentioned elsewhere in the report or notes to the accounts.
6. Provisioning for non– performing assets including loans and advances has been carried out as per accounting policy of the Bank.
7. interest on non- performing loans has not been recognized as interest income as per accounting policy of the Bank.
8. as stated by the management, except for few cases, assets hypothecated against loans and advances have been physically verified and properly valued by management and mortgage deeds have been executed and it has been ensured that the assets are free of any prior lien or charges.
9. The Bank has a system of monitoring of projects for which loans have been provided to ensure that loan amounts are used for the specified purposes and project activities are progressing satisfactorily.
10. Taking over of assets for repayment defaults are made through open / sealed bids.
11. The Bank has complied with the guidelines for Prudential regulations as issued by rMa for re-phasing / rescheduling of loan accounts.
12. There is a system to ensure that additional loans are not granted to those who have defaulted payments of previous advances except for some instances.
| 10 | BDB Annual Report 2017
sl # Particulars 2009 2013 2014 2015 2016 2017X No.of Depositors 15,879 85,864 109,005 133,366 159,576 178,386
Main Branch 657 4821 6,322 8,436 11,186 15,101 BranchOffice 15,222 81,043 102,683 124,930 148,390 163,285
XI Number of Employess 221 357 385 416 452 563HeadOffice 66 110 125 117 144 152Main Branch 29 28 30 31 39 45BranchOffice 126 219 230 268 269 366
XII ActiveClients/EmployeeRatioMain Branch 90 112 111 120 107 101BranchOffice 137 172 187 181 193 144
XII Loans/EmployeeRatio 13 24 28 33 37 33Main Branch 62 142 153 169 153 152BranchOffice 8 21 27 32 39 33
26 | ANNUAL REPORT 2018
Computerized Accounting Environment
1. It was informed to us that Migration audit was conducted by the Royal Audit Authority for which no report was available. In some of the branches, unidentified differences are lying as “Migration account” which requires proper identification and reconciliation of related accounts.
2. adequate safeguard measures and back up facilities exist.
3. Back up facilities and disaster recovery measures include keeping files in different and remote locations.
4. operational controls are adequate to ensure correctness and validity of input data and output information.
5. There are adequate preventive measures to prevent unauthorized access over the computer installation and files.
General1. Going Concern Presumption
Based on the Bank’s financial statements for the year ended 31st December, 2018, we are of the opinion that the going concern assumption is appropriate.
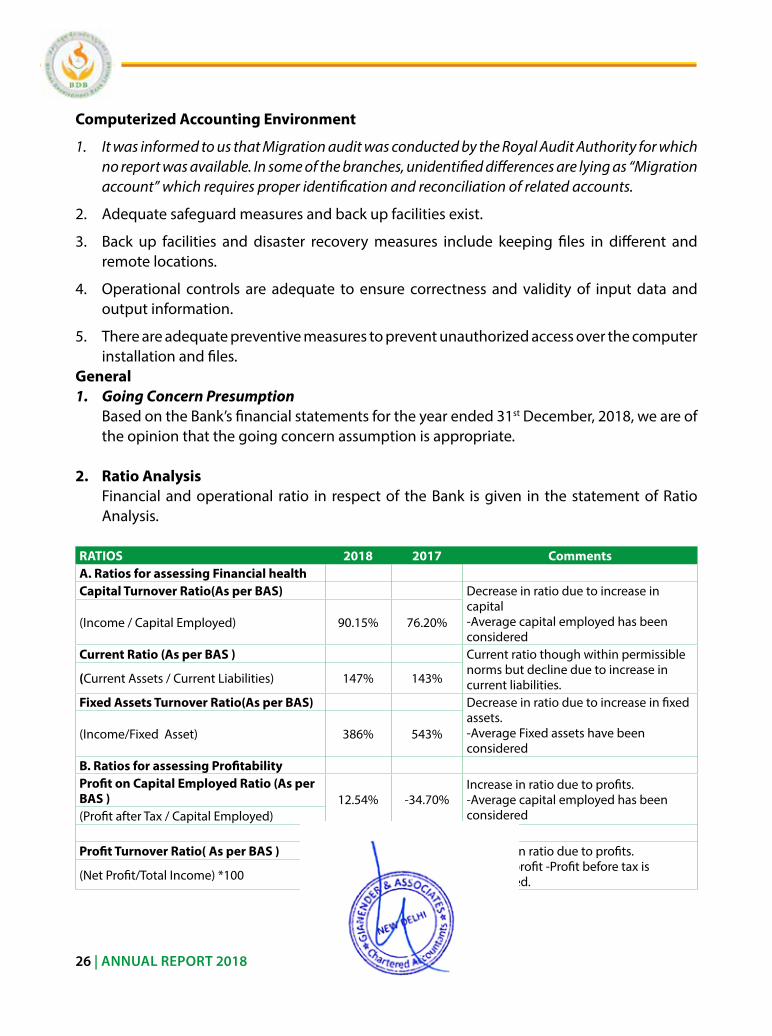
2. Ratio Analysis Financial and operational ratio in respect of the Bank is given in the statement of ratio
analysis.
RATIOS 2018 2017 CommentsA. Ratios for assessing Financial health Capital Turnover Ratio(As per BAS) Decrease in ratio due to increase in
capital -average capital employed has been considered
(income / Capital employed) 90.15% 76.20%
Current Ratio (As per BAS ) Current ratio though within permissible norms but decline due to increase in current liabilities.(Current assets / Current liabilities) 147% 143%
Fixed Assets Turnover Ratio(As per BAS) Decrease in ratio due to increase in fixed assets. -average Fixed assets have been considered
(income/Fixed asset) 386% 543%
B. Ratios for assessing Profitability Profit on Capital Employed Ratio (As per BAS ) 12.54% -34.70%
increase in ratio due to profits. -average capital employed has been considered(Profit after Tax / Capital employed)
Profit Turnover Ratio( As per BAS )
13.66% -39.11%increase in ratio due to profits. -For net profit -Profit before tax is considered.(net Profit/Total income) *100
| 10 | BDB Annual Report 2017
sl # Particulars 2009 2013 2014 2015 2016 2017X No.of Depositors 15,879 85,864 109,005 133,366 159,576 178,386
Main Branch 657 4821 6,322 8,436 11,186 15,101 BranchOffice 15,222 81,043 102,683 124,930 148,390 163,285
XI Number of Employess 221 357 385 416 452 563HeadOffice 66 110 125 117 144 152Main Branch 29 28 30 31 39 45BranchOffice 126 219 230 268 269 366
XII ActiveClients/EmployeeRatioMain Branch 90 112 111 120 107 101BranchOffice 137 172 187 181 193 144
XII Loans/EmployeeRatio 13 24 28 33 37 33Main Branch 62 142 153 169 153 152BranchOffice 8 21 27 32 39 33
ANNUAL REPORT 2018 | 27
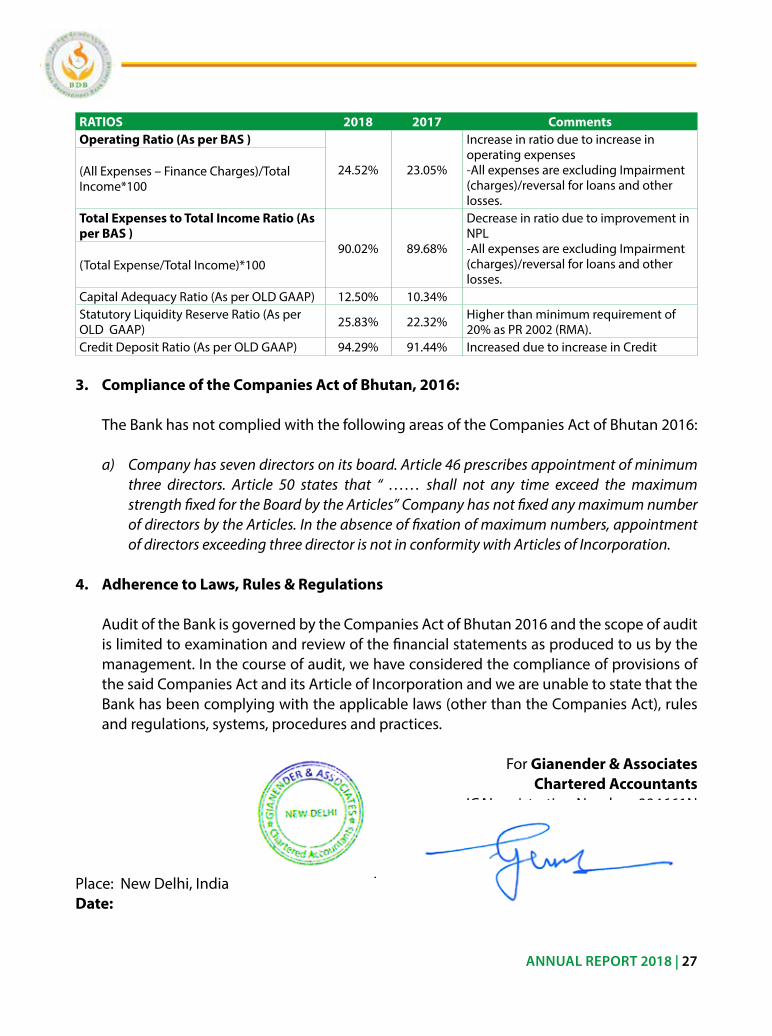
RATIOS 2018 2017 CommentsOperating Ratio (As per BAS )
24.52% 23.05%
increase in ratio due to increase in operating expenses -all expenses are excluding impairment (charges)/reversal for loans and other losses.
(all expenses – Finance Charges)/Total income*100
Total Expenses to Total Income Ratio (As per BAS )
90.02% 89.68%
Decrease in ratio due to improvement in nPl -all expenses are excluding impairment (charges)/reversal for loans and other losses.
(Total expense/Total income)*100
Capital adequacy ratio (as per olD GaaP) 12.50% 10.34%statutory liquidity reserve ratio (as per olD GaaP) 25.83% 22.32% Higher than minimum requirement of
20% as Pr 2002 (rMa).Credit Deposit ratio (as per olD GaaP) 94.29% 91.44% increased due to increase in Credit
3. Compliance of the Companies Act of Bhutan, 2016: The Bank has not complied with the following areas of the Companies act of Bhutan 2016:
a) Company has seven directors on its board. Article 46 prescribes appointment of minimum three directors. Article 50 states that “ …… shall not any time exceed the maximum strength fixed for the Board by the Articles” Company has not fixed any maximum number of directors by the Articles. In the absence of fixation of maximum numbers, appointment of directors exceeding three director is not in conformity with Articles of Incorporation.
4. Adherence to Laws, Rules & Regulations
audit of the Bank is governed by the Companies act of Bhutan 2016 and the scope of audit is limited to examination and review of the financial statements as produced to us by the management. in the course of audit, we have considered the compliance of provisions of the said Companies act and its article of incorporation and we are unable to state that the Bank has been complying with the applicable laws (other than the Companies act), rules and regulations, systems, procedures and practices.
For Gianender & AssociatesChartered Accountants
iCai registration number :004661n
Place: new Delhi, india G.K AgrawalDate: Partner
Membership no. 081603

| 10 | BDB Annual Report 2017
sl # Particulars 2009 2013 2014 2015 2016 2017X No.of Depositors 15,879 85,864 109,005 133,366 159,576 178,386
Main Branch 657 4821 6,322 8,436 11,186 15,101 BranchOffice 15,222 81,043 102,683 124,930 148,390 163,285
XI Number of Employess 221 357 385 416 452 563HeadOffice 66 110 125 117 144 152Main Branch 29 28 30 31 39 45BranchOffice 126 219 230 268 269 366
XII ActiveClients/EmployeeRatioMain Branch 90 112 111 120 107 101BranchOffice 137 172 187 181 193 144
XII Loans/EmployeeRatio 13 24 28 33 37 33Main Branch 62 142 153 169 153 152BranchOffice 8 21 27 32 39 33
28 | ANNUAL REPORT 2018
| 10 | BDB Annual Report 2017
sl # Particulars 2009 2013 2014 2015 2016 2017X No.of Depositors 15,879 85,864 109,005 133,366 159,576 178,386
Main Branch 657 4821 6,322 8,436 11,186 15,101 BranchOffice 15,222 81,043 102,683 124,930 148,390 163,285
XI Number of Employess 221 357 385 416 452 563HeadOffice 66 110 125 117 144 152Main Branch 29 28 30 31 39 45BranchOffice 126 219 230 268 269 366
XII ActiveClients/EmployeeRatioMain Branch 90 112 111 120 107 101BranchOffice 137 172 187 181 193 144
XII Loans/EmployeeRatio 13 24 28 33 37 33Main Branch 62 142 153 169 153 152BranchOffice 8 21 27 32 39 33
ANNUAL REPORT 2018 | 29
| 10 | BDB Annual Report 2017
sl # Particulars 2009 2013 2014 2015 2016 2017X No.of Depositors 15,879 85,864 109,005 133,366 159,576 178,386
Main Branch 657 4821 6,322 8,436 11,186 15,101 BranchOffice 15,222 81,043 102,683 124,930 148,390 163,285
XI Number of Employess 221 357 385 416 452 563HeadOffice 66 110 125 117 144 152Main Branch 29 28 30 31 39 45BranchOffice 126 219 230 268 269 366
XII ActiveClients/EmployeeRatioMain Branch 90 112 111 120 107 101BranchOffice 137 172 187 181 193 144
XII Loans/EmployeeRatio 13 24 28 33 37 33Main Branch 62 142 153 169 153 152BranchOffice 8 21 27 32 39 33
BHUTAN DEVELOPMENT BANK LIMITED
ANNUAL ACCOUNTs2018
gianender & AssociatesChartered Accountants
New DelhiIndia
| 10 | BDB Annual Report 2017
sl # Particulars 2009 2013 2014 2015 2016 2017X No.of Depositors 15,879 85,864 109,005 133,366 159,576 178,386
Main Branch 657 4821 6,322 8,436 11,186 15,101 BranchOffice 15,222 81,043 102,683 124,930 148,390 163,285
XI Number of Employess 221 357 385 416 452 563HeadOffice 66 110 125 117 144 152Main Branch 29 28 30 31 39 45BranchOffice 126 219 230 268 269 366
XII ActiveClients/EmployeeRatioMain Branch 90 112 111 120 107 101BranchOffice 137 172 187 181 193 144
XII Loans/EmployeeRatio 13 24 28 33 37 33Main Branch 62 142 153 169 153 152BranchOffice 8 21 27 32 39 33
30 | ANNUAL REPORT 2018
FINANCIAL STATEMENTS
31st DECEMBER 2018
1. CORPORATE INFORMATION
Bhutan Development Bank limited provides services to small and Medium enterprises (sMe) and farmers’ outreach in various parts of the Kingdom of Bhutan
Bhutan Development Bank limited is a domestic development bank incorporated and domiciled in the Kingdom of Bhutan. its registered office is at P.o. Box 256, norzin lam, Thimphu, Bhutan.
The financial statements for the year ended 31 December 2018 were authorised for issue in accordance with a resolution of the Directors on February 16, 2019.
2.1 BASIS OF PREPARATION
The financial statements have been prepared on a historical cost basis, except for available – for sale investments. The financial statements are presented in Bhutan ngultrum rounded (nu.)
Statement of compliance
The financial statements of the Bank have been prepared in accordance with Bhutanese accounting standards /Bhutan Financial reporting standards (Bas/BFrs) and international Financial reporting standards (iFrs).
Presentation of financial statements
The Bank presents its statement of financial position in order of liquidity. an analysis regarding recovery or settlement within 12 months after the reporting date (current) and more than 12 months after the reporting date (non–current) is considered when preparing the statement of Financial Position.
Financial assets and financial liabilities are offset and the net amount is reported in the statement of financial position only when there is a legally enforceable right to offset the recognised amounts and there is an intention to settle on a net basis, or to realise the assets and settle the liability simultaneously. income and expenses are not offset in the income statement unless required or permitted by any accounting standard or interpretation, and as specifically disclosed in the accounting policies of the Bank. | 10 | BDB Annual Report 2017
sl # Particulars 2009 2013 2014 2015 2016 2017X No.of Depositors 15,879 85,864 109,005 133,366 159,576 178,386
Main Branch 657 4821 6,322 8,436 11,186 15,101 BranchOffice 15,222 81,043 102,683 124,930 148,390 163,285
XI Number of Employess 221 357 385 416 452 563HeadOffice 66 110 125 117 144 152Main Branch 29 28 30 31 39 45BranchOffice 126 219 230 268 269 366
XII ActiveClients/EmployeeRatioMain Branch 90 112 111 120 107 101BranchOffice 137 172 187 181 193 144
XII Loans/EmployeeRatio 13 24 28 33 37 33Main Branch 62 142 153 169 153 152BranchOffice 8 21 27 32 39 33
BHUTAN DEVELOPMENT BANK LIMITED
NOTEs TO THE fINANCIAL sTATEMENT
| 10 | BDB Annual Report 2017
sl # Particulars 2009 2013 2014 2015 2016 2017X No.of Depositors 15,879 85,864 109,005 133,366 159,576 178,386
Main Branch 657 4821 6,322 8,436 11,186 15,101 BranchOffice 15,222 81,043 102,683 124,930 148,390 163,285
XI Number of Employess 221 357 385 416 452 563HeadOffice 66 110 125 117 144 152Main Branch 29 28 30 31 39 45BranchOffice 126 219 230 268 269 366
XII ActiveClients/EmployeeRatioMain Branch 90 112 111 120 107 101BranchOffice 137 172 187 181 193 144
XII Loans/EmployeeRatio 13 24 28 33 37 33Main Branch 62 142 153 169 153 152BranchOffice 8 21 27 32 39 33
ANNUAL REPORT 2018 | 31
audited Financial statements for 31.12.2017 are prepared in accordance with Bas 1 on presentation of financial statements in line with Bas/BFrs and iFrs.
2.2 SIGNIFICANT ACCOUNTING JUDGEMENTS, ESTIMATES AND ASSUMPTIONS
The preparation of the financial statements requires management to make judgements, estimates and assumptions that affect the reported amount of revenues, expenses, assets and liabilities, and the accompanying disclosures, as well as the disclosure of contingent liabilities. uncertainty about these assumptions and estimates could result in outcomes that require a material adjustment to the carrying amount of assets or liabilities affected in future periods.
Judgements
in the process of applying the Bank’s accounting policies, management has made the following judgements, which have the most significant effect on the amounts recognised in the financial statements
Estimates and assumptionsThe key assumptions concerning the future and other key sources of estimation of uncertainty at the reporting date, that have a significant risk of causing a material adjustment to the carrying amounts of assets and liabilities within the next financial year, are described below. The Bank based its assumptions and estimates on parameters available when the consolidated financial statements were prepared. existing circumstances and assumptions about future developments, however, may change due to market changes or circumstances beyond the controloftheBank.Suchchangesarereflectedintheassumptionswhentheyoccur.
Going concern
The Bank’s management has made an assessment of its ability to continue as a going concern and is satisfied that it has the resources to continue in business for the foreseeable future. Furthermore, management is not aware of any material uncertainties that may cast significant doubt upon the Bank’s ability to continue as a going concern. Therefore, the financial statements continue to be prepared on the going concern basis.
Fair value of financial instruments
Where the fair values of financial assets and financial liabilities recorded on the statement of financial position cannot be derived from active markets, they are determined using a variety of valuation techniques that include the use of mathematical models.
For the purpose of valuation of quoted equity the Bank considers dividend growth model.
| 10 | BDB Annual Report 2017
sl # Particulars 2009 2013 2014 2015 2016 2017X No.of Depositors 15,879 85,864 109,005 133,366 159,576 178,386
Main Branch 657 4821 6,322 8,436 11,186 15,101 BranchOffice 15,222 81,043 102,683 124,930 148,390 163,285
XI Number of Employess 221 357 385 416 452 563HeadOffice 66 110 125 117 144 152Main Branch 29 28 30 31 39 45BranchOffice 126 219 230 268 269 366
XII ActiveClients/EmployeeRatioMain Branch 90 112 111 120 107 101BranchOffice 137 172 187 181 193 144
XII Loans/EmployeeRatio 13 24 28 33 37 33Main Branch 62 142 153 169 153 152BranchOffice 8 21 27 32 39 33
BHUTAN DEVELOPMENT BANK LIMITED
NOTEs TO THE fINANCIAL sTATEMENT
| 10 | BDB Annual Report 2017
sl # Particulars 2009 2013 2014 2015 2016 2017X No.of Depositors 15,879 85,864 109,005 133,366 159,576 178,386
Main Branch 657 4821 6,322 8,436 11,186 15,101 BranchOffice 15,222 81,043 102,683 124,930 148,390 163,285
XI Number of Employess 221 357 385 416 452 563HeadOffice 66 110 125 117 144 152Main Branch 29 28 30 31 39 45BranchOffice 126 219 230 268 269 366
XII ActiveClients/EmployeeRatioMain Branch 90 112 111 120 107 101BranchOffice 137 172 187 181 193 144
XII Loans/EmployeeRatio 13 24 28 33 37 33Main Branch 62 142 153 169 153 152BranchOffice 8 21 27 32 39 33
32 | ANNUAL REPORT 2018
Wherever the growth cannot be estimated reasonably Bank assumes a positive correlation on growth at par with the sector/GDP growth.
2.3 SUMMARY OF SIGNIFICANT ACCOUNTING POLICIES
2.3.1 foreign currency translation
The financial statements are presented in Bhutan ngultrum (nu) which is the functional currency of the Bank
Transactions and balances
Transactions in foreign currencies are initially recorded at the spot rate of exchange ruling at the date of the transaction.
Monetary assets and liabilities denominated in foreign currencies are retranslated at the spot rate of exchange at the reporting date. all differences arising on non–trading activities are taken to other operating income in the income statement.
non–monetary items that are measured in terms of historical cost in a foreign currency are translated using the spot exchange rates as at the date of recognition. non–monetary items measured at fair value in a foreign currency are translated using the spot exchange rates at the date when the fair value was determined.
2.3.2 Determination of fair value
The fair value for financial instruments traded in active markets at the reporting date is based on their quoted market price or dealer price quotations (bid price for long positions and ask price for short positions), without any deduction for transaction costs.
For all other financial instruments not traded in an active market, the fair value is determined by using appropriate valuation techniques.
an active Market is defined as a market in which transactions for the asset or liability take place with sufficient frequency and volume to provide pricing information on an ongoing basis
2.3.3 Offsetting financial instruments
Financial assets and financial liabilities are offset and the net amount reported in
| 10 | BDB Annual Report 2017
sl # Particulars 2009 2013 2014 2015 2016 2017X No.of Depositors 15,879 85,864 109,005 133,366 159,576 178,386
Main Branch 657 4821 6,322 8,436 11,186 15,101 BranchOffice 15,222 81,043 102,683 124,930 148,390 163,285
XI Number of Employess 221 357 385 416 452 563HeadOffice 66 110 125 117 144 152Main Branch 29 28 30 31 39 45BranchOffice 126 219 230 268 269 366
XII ActiveClients/EmployeeRatioMain Branch 90 112 111 120 107 101BranchOffice 137 172 187 181 193 144
XII Loans/EmployeeRatio 13 24 28 33 37 33Main Branch 62 142 153 169 153 152BranchOffice 8 21 27 32 39 33
BHUTAN DEVELOPMENT BANK LIMITED
NOTEs TO THE fINANCIAL sTATEMENT
| 10 | BDB Annual Report 2017
sl # Particulars 2009 2013 2014 2015 2016 2017X No.of Depositors 15,879 85,864 109,005 133,366 159,576 178,386
Main Branch 657 4821 6,322 8,436 11,186 15,101 BranchOffice 15,222 81,043 102,683 124,930 148,390 163,285
XI Number of Employess 221 357 385 416 452 563HeadOffice 66 110 125 117 144 152Main Branch 29 28 30 31 39 45BranchOffice 126 219 230 268 269 366
XII ActiveClients/EmployeeRatioMain Branch 90 112 111 120 107 101BranchOffice 137 172 187 181 193 144
XII Loans/EmployeeRatio 13 24 28 33 37 33Main Branch 62 142 153 169 153 152BranchOffice 8 21 27 32 39 33
ANNUAL REPORT 2018 | 33
the statement of financial position if, and only if, there is a currently enforceable legal right to offset the recognised amounts and there is an intention to settle on a net basis, or to realise the asset and settle the liability simultaneously. This is not generally the case with master netting agreements, therefore, the related assets and liabilities are presented gross in the statement of financial position.
2.3.4 Leasing
The determination of whether an arrangement is a lease, or contains a lease, is based on the substance of the arrangement and requires an assessment of whether the fulfilment of the arrangement is dependent on the use of a specific asset or assets and the arrangement conveys a right to use the asset.
group as a lessee
leases that do not transfer to the Bank substantially all the risks and benefits incidental to ownership of the leased items are operating leases. operating lease payments are recognised as an expense in the income statement on a straight-line basis over the lease term. Contingent rental payable is recognised as an expense in the period in which they are incurred.
2.3.5 Recognition of income and expenses
revenue is recognised to the extent that it is probable that the economic benefits willflowtotheBankandtherevenuecanbereliablymeasured.Thefollowingspecificrecognition criteria must also be met before revenue is recognised.
(i) fee and commission income
The Bank earns fee and commission income from a diverse range of services it provides to its customers.
Fee income can be divided into the following two categories:
fee income earned from services that are provided over a certain period of time
Fees earned for the provision of services over a period of time are accrued over that period. These fees include commission income and asset management, custody and other management and advisory fees.
| 10 | BDB Annual Report 2017
sl # Particulars 2009 2013 2014 2015 2016 2017X No.of Depositors 15,879 85,864 109,005 133,366 159,576 178,386
Main Branch 657 4821 6,322 8,436 11,186 15,101 BranchOffice 15,222 8 20164821Office
�%�u�D�Q�F�K���2�i�À�F�H2016482120164821 20144821
| 10 | BDB Annual Report 2017
sl # Particulars 2009 2013 2014 2015 2016 2017X No.of Depositors 15,879 85,864 109,005 133,366 159,576 178,386
Main Branch 657 4821 6,322 8,436 11,186 15,101 BranchOffice 15,222 81,043 102,683 124,930 148,390 163,285
XI Number of Employess 221 357 385 416 452 563HeadOffice 66 110 125 117 144 152Main Branch 29 28 30 31 39 45BranchOffice 126 219 230 268 269 366
XII ActiveClients/EmployeeRatioMain Branch 90 112 111 120 107 101BranchOffice 137 172 187 181 193 144
XII Loans/EmployeeRatio 13 24 28 33 37 33Main Branch 62 142 153 169 153 152BranchOffice 8 21 27 32 39 33
34 | ANNUAL REPORT 2018
fee income from providing transaction services
Fees arising from negotiating or participating in the negotiation of a transaction for a third party, such as the arrangement of the acquisition of shares or other securities or the purchase or sale of businesses, are recognised on completion of the underlying transaction. Fees or components of fees that are linked to a certain performance are recognised after fulfilling the corresponding criteria.
(ii) Dividend income
revenue is recognised when the Bank’s right to receive the payment is established, which is generally when the shareholders approve the dividend.
(iii) Net trading income
results arising from trading activities include all gains and losses from changes in fair value and related interest income or expense and dividends for financial assets and financial liabilities held for trading. This includes any ineffectiveness recorded in hedging transactions.
2.3.6 Cash and cash equivalents
Cashandcashequivalentsasreferredtointhecashflowstatementcomprisescashon hand, non–restricted current accounts with central banks and amounts due from banks on demand or with an original maturity of three months or less.
2.3.7 Property, Plant and Equipment
Property, Plant and equipment (including equipment under operating leases where the Bank is the lessor) is stated at cost excluding the costs of day–to–day servicing, less accumulated depreciation and accumulated impairment in value. Changes in the expected useful life are accounted for by changing the amortisation period or method, as appropriate, and treated as changes in accounting estimates.
Depreciation is calculated using the straight–line method to write down the cost of property and equipment to their residual values over their estimated useful lives. land is not depreciated. The estimated useful lives are as follows:
Asset Type Useful LifeBuildings 20-50 yearsFurniture & Fitting 10 years
| 10 | BDB Annual Report 2017
sl # Particulars 2009 2013 2014 2015 2016 2017X No.of Depositors 15,879 85,864 109,005 133,366 159,576 178,386
Main Branch 657 4821 6,322 8,436 11,186 15,101 BranchOffice 15,222 81,043 102,683 124,930 148,390 163,285
XI Number of Employess 221 357 385 416 452 563HeadOffice 66 110 125 117 144 152Main Branch 29 28 30 31 39 45BranchOffice 126 219 230 268 269 366
XII ActiveClients/EmployeeRatioMain Branch 90 112 111 120 107 101BranchOffice 137 172 187 181 193 144
XII Loans/EmployeeRatio 13 24 28 33 37 33Main Branch 62 142 153 169 153 152BranchOffice 8 21 27 32 39 33
BHUTAN DEVELOPMENT BANK LIMITED
NOTEs TO THE fINANCIAL sTATEMENT
| 10 | BDB Annual Report 2017
sl # Particulars 2009 2013 2014 2015 2016 2017X No.of Depositors 15,879 85,864 109,005 133,366 159,576 178,386
Main Branch 657 4821 6,322 8,436 11,186 15,101 BranchOffice 15,222 81,043 102,683 124,930 148,390 163,285
XI Number of Employess 221 357 385 416 452 563HeadOffice 66 110 125 117 144 152Main Branch 29 28 30 31 39 45BranchOffice 126 219 230 268 269 366
XII ActiveClients/EmployeeRatioMain Branch 90 112 111 120 107 101BranchOffice 137 172 187 181 193 144
XII Loans/EmployeeRatio 13 24 28 33 37 33Main Branch 62 142 153 169 153 152BranchOffice 8 21 27 32 39 33
ANNUAL REPORT 2018 | 35
office equipment 5 yearselectrical equipment 10 yearsnetwork equipment 5 yearsComputer Hardware 5 yearsMotor Vehicle 10 yearssecurity equipment 5 years
Property and equipment is derecognised on disposal or when no future economic benefits are expected from its use. any gain or loss arising on de-recognition of the asset (calculated as the difference between the net disposal proceeds and the carrying amount of the asset) is recognised in other operating income in the income statement in the year the asset is derecognised.
2.3.8 Intangible assets
The Bank’s other intangible assets include the value of computer software.
an intangible asset is recognised only when its cost can be measured reliably and it is probable that the expected future economic benefits that are attributable to it will flowtotheBank.
intangible assets acquired separately are measured on initial recognition at cost. Following initial recognition, intangible assets are carried at cost less any accumulated amortisation and any accumulated impairment losses.
The useful lives of intangible assets are assessed to be either finite or indefinite. intangible assets with finite lives are amortised over the useful economic life. The amortisation expense on intangible assets with finite lives is presented as a separate line item in the income statement.amortisation is calculated using the straight–line method to write down the cost of intangible assets to their residual values over their estimated useful lives as follows:
• Computersoftware 6-7years
2.3.9 Provisions
Provisions are recognised when the Bank has a present obligation (legal or constructive)asaresultofapastevent,anditisprobablethatanoutflowofresourcesembodying economic benefits will be required to settle the obligation and a reliable estimate can be made of the amount of the obligation. The expense relating to any provision is presented in the income statement net of any reimbursement.
| 10 | BDB Annual Report 2017
sl # Particulars 2009 2013 2014 2015 2016 2017X No.of Depositors 15,879 85,864 109,005 133,366 159,576 178,386
Main Branch 657 4821 6,322 8,436 11,186 15,101 BranchOffice 15,222 81,043 102,683 124,930 148,390 163,285
XI Number of Employess 221 357 385 416 452 563HeadOffice 66 110 125 117 144 152Main Branch 29 28 30 31 39 45BranchOffice 126 219 230 268 269 366
XII ActiveClients/EmployeeRatioMain Branch 90 112 111 120 107 101BranchOffice 137 172 187 181 193 144
XII Loans/EmployeeRatio 13 24 28 33 37 33Main Branch 62 142 153 169 153 152BranchOffice 8 21 27 32 39 33
BHUTAN DEVELOPMENT BANK LIMITED
NOTEs TO THE fINANCIAL sTATEMENT
| 10 | BDB Annual Report 2017
sl # Particulars 2009 2013 2014 2015 2016 2017X No.of Depositors 15,879 85,864 109,005 133,366 159,576 178,386
Main Branch 657 4821 6,322 8,436 11,186 15,101 BranchOffice 15,222 81,043 102,683 124,930 148,390 163,285
XI Number of Employess 221 357 385 416 452 563HeadOffice 66 110 125 117 144 152Main Branch 29 28 30 31 39 45BranchOffice 126 219 230 268 269 366
XII ActiveClients/EmployeeRatioMain Branch 90 112 111 120 107 101BranchOffice 137 172 187 181 193 144
XII Loans/EmployeeRatio 13 24 28 33 37 33Main Branch 62 142 153 169 153 152BranchOffice 8 21 27 32 39 33
36 | ANNUAL REPORT 2018
2.3.10 Dividends on ordinary shares
Dividends on ordinary shares are recognised as a liability and deducted from equity when they are approved by the Bank’s shareholders. interim dividends are deducted from equity when they are declared and no longer at the discretion of the Bank.
Dividends for the year that are approved after the reporting date are disclosed as an event after the reporting date.
2.3.11 Equity reserves
The reserves recorded in equity (other comprehensive income) on the Bank’s statement of financial position include:
available-for-sale reserve, which comprises changes in fair value of available-for-sale investments.
2.3.12 Changes in Accounting Policies
1. New Amended standards and interpretations
in these financial statements, the Bank has applied BFrs 9 and BFrs 7r, effective for annual periods beginning on or after 1 January 2018, for the first time. The Bank has not adopted early any other standard, interpretation or amendment that has been issued but is not yet effective. The Bank have restated comparative information for 2017 for financial instruments in the scope of BFrs 9.
Changes to classification and measurementTo determine their classification and measurement category, BFrs 9 requires all financial assets, except equity instruments and derivatives, to be assessed based on a combination of theentity’sbusinessmodelformanagingtheassetsandtheinstruments’contractualcashflowcharacteristics.
The Bas 39 measurement categories of financial assets (fair value through profit or loss (FVPl), available for sale (aFs), held-to-maturity and amortised cost) have been replaced by:
• Debtinstrumentsatamortisedcost
• Debtinstrumentsatfairvaluethroughothercomprehensiveincome(FVOCI),withgainsorlosses recycled to profit or loss on de recognition
• Equity instruments at FVOCI,withno recyclingofgainsor lossesoprofitor lossonDerecognition
| 10 | BDB Annual Report 2017
sl # Particulars 2009 2013 2014 2015 2016 2017X No.of Depositors 15,879 85,864 109,005 133,366 159,576 178,386
Main Branch 657 4821 6,322 8,436 11,186 15,101 BranchOffice 15,222 81,043 102,683 124,930 148,390 163,285
XI Number of Employess 221 357 385 416 452 563HeadOffice 66 110 125 117 144 152Main Branch 29 28 30 31 39 45BranchOffice 126 219 230 268 269 366
XII ActiveClients/EmployeeRatioMain Branch 90 112 111 120 107 101BranchOffice 137 172 187 181 193 144
XII Loans/EmployeeRatio 13 24 28 33 37 33Main Branch 62 142 153 169 153 152BranchOffice 8 21 27 32 39 33
BHUTAN DEVELOPMENT BANK LIMITED
NOTEs TO THE fINANCIAL sTATEMENT
| 10 | BDB Annual Report 2017
sl # Particulars 2009 2013 2014 2015 2016 2017X No.of Depositors 15,879 85,864 109,005 133,366 159,576 178,386
Main Branch 657 4821 6,322 8,436 11,186 15,101 BranchOffice 15,222 81,043 102,683 124,930 148,390 163,285
XI Number of Employess 221 357 385 416 452 563HeadOffice 66 110 125 117 144 152Main Branch 29 28 30 31 39 45BranchOffice 126 219 230 268 269 366
XII ActiveClients/EmployeeRatioMain Branch 90 112 111 120 107 101BranchOffice 137 172 187 181 193 144
XII Loans/EmployeeRatio 13 24 28 33 37 33Main Branch 62 142 153 169 153 152BranchOffice 8 21 27 32 39 33
ANNUAL REPORT 2018 | 37
• FinancialassetsFVPL
The accounting for financial liabilities remains largely the same as it was under Bas 39, except for the treatment of gains or losses arising from an entity’s own credit risk relating to liabilities designated at FVPl. such movements are presented in oCi with no subsequent reclassification to the income statement.
Changes to impairment calculation
The adoption of BFrs 9 has fundamentally changed the Bank’s accounting for loan loss impairments by replacing Bas 39’s incurred loss approach with a forward-looking expected credit loss (eCl) approach. BFrs 9 requires the Bank to record an allowance for eCls for all loans and other debt financial assets not held at FVPl, together with loan commitments and financial guarantee contracts. The allowance is based on the eCls associated with the probability of default in the next twelve months unless there has been a significant increase in credit risk since origination. if the financial asset meets the definition of purchased or originated credit impaired (PoCi), the allowance is based on the change in the eCls over the life of the asset.
Details of the Bank’s impairment method are disclosed in note 29 and 30. The quantitative impact of applying BFrs 9 as at 1 January 2018 is disclosed in note 36.
BFRS 7R
ToreflectthedifferencesbetweenBFRS9andBAS39,BFRS7FinancialInstruments:Disclosureswas updated and the Bank has adopted it, together with BFrs 9, for the year beginning 1 January 2018. Changes include transition disclosures as shown in note 4, detailed qualitative and quantitative information about the eCl calculations such as the assumptions and inputs used are set out in note 12.3.4
Summary of significant accounting policies
2.1. Recognition of interest income2.1.1. The Effective Interest rate method
under both BFrs 9 and Bas 39, interest income is recorded using the effective interest rate (eir) method for all financial instruments measured at amortized cost, financial instruments designated at FVPl. interest income on interest bearing financial assets measured at FVoCi under BFrs 9, similarly to interest bearing financial assets classified as available-for-sale or held to maturity under Bas 39 are also recorded by using the eir method. The eir is the rate that exactly discounts estimated future cash receipts through the expected life of the financial instrument or, when appropriate, a shorter period, to the net carrying amount of the financial
| 10 | BDB Annual Report 2017
sl # Particulars 2009 2013 2014 2015 2016 2017X No.of Depositors 15,879 85,864 109,005 133,366 159,576 178,386
Main Branch 657 4821 6,322 8,436 11,186 15,101 BranchOffice 15,222 81,043 102,683 124,930 148,390 163,285
XI Number of Employess 221 357 385 416 452 563HeadOffice 66 110 125 117 144 152Main Branch 29 28 30 31 39 45BranchOffice 126 219 230 268 269 366
XII ActiveClients/EmployeeRatioMain Branch 90 112 111 120 107 101BranchOffice 137 172 187 181 193 144
XII Loans/EmployeeRatio 13 24 28 33 37 33Main Branch 62 142 153 169 153 152BranchOffice 8 21 27 32 39 33
BHUTAN DEVELOPMENT BANK LIMITED
NOTEs TO THE fINANCIAL sTATEMENT
| 10 | BDB Annual Report 2017
sl # Particulars 2009 2013 2014 2015 2016 2017X No.of Depositors 15,879 85,864 109,005 133,366 159,576 178,386
Main Branch 657 4821 6,322 8,436 11,186 15,101 BranchOffice 15,222 81,043 102,683 124,930 148,390 163,285
XI Number of Employess 221 357 385 416 452 563HeadOffice 66 110 125 117 144 152Main Branch 29 28 30 31 39 45BranchOffice 126 219 230 268 269 366
XII ActiveClients/EmployeeRatioMain Branch 90 112 111 120 107 101BranchOffice 137 172 187 181 193 144
XII Loans/EmployeeRatio 13 24 28 33 37 33Main Branch 62 142 153 169 153 152BranchOffice 8 21 27 32 39 33
38 | ANNUAL REPORT 2018
asset.
The eir (and therefore, the amortized cost of the asset) is calculated by taking into account any discount or premium on acquisition, fees and costs that are an integral part of the eir. The Bank recognizes interest income using a rate of return that represents the best estimate of a constant rate of return over the expected life of the loan. Hence, it recognizes the effect of potentially different interest rates charged at various stages, and other characteristics of the product life cycle (including prepayments, penalty interest and charges).
Ifexpectations regarding thecashflowson thefinancialassetare revised for reasonsotherthan credit risk. The adjustment is booked as a positive or negative adjustment to the carrying amount of the asset in the balance sheet with an increase or reduction in interest income. The adjustment is subsequently amortized through interest and similar income in the income statement.
2.1.2. Interest & Similar Income
The Bank calculates interest income by applying the eir to the gross carrying amount of financial assets other than credit-impaired assets
When a financial asset becomes credit-impaired (as set out in note 30 to 35) and is, therefore, regarded as ‘stage 3’, the Bank calculates interest income by applying the effective interest rate to the net amortised cost of the financial asset. if the financial assets cures and is no longer credit-impaired, the Bank reverts to calculating interest income on a gross basis.
interest income on all trading assets and financial assets mandatorily required to be measured at FVPl is recognised using the contractual interest rate in net trading income and net gains/(losses) on financial assets at fair value through profit or loss, respectively.
2.2. Financial Instrument - Initial Recognition2.2.1 Date of recognition
Financial assets and liabilities, with the exception of loans and advances to customers and balances due to customers, are initially recognised on the trade date, i.e., the date that the Bank becomes a party to the contractual provisions of the instrument. This includes regular way trades: purchases or sales of financial assets that require delivery of assets within the time frame generally established by regulation or convention in the market place. loans and advances to customers are recognised when funds are transferred to the customers’ accounts. The Bank recognises balances due to customers when funds are transferred to the Bank.| 10 | BDB Annual Report 2017
sl # Particulars 2009 2013 2014 2015 2016 2017X No.of Depositors 15,879 85,864 109,005 133,366 159,576 178,386
Main Branch 657 4821 6,322 8,436 11,186 15,101 BranchOffice 15,222 81,043 102,683 124,930 148,390 163,285
XI Number of Employess 221 357 385 416 452 563HeadOffice 66 110 125 117 144 152Main Branch 29 28 30 31 39 45BranchOffice 126 219 230 268 269 366
XII ActiveClients/EmployeeRatioMain Branch 90 112 111 120 107 101BranchOffice 137 172 187 181 193 144
XII Loans/EmployeeRatio 13 24 28 33 37 33Main Branch 62 142 153 169 153 152BranchOffice 8 21 27 32 39 33
BHUTAN DEVELOPMENT BANK LIMITED
NOTEs TO THE fINANCIAL sTATEMENT
| 10 | BDB Annual Report 2017
sl # Particulars 2009 2013 2014 2015 2016 2017X No.of Depositors 15,879 85,864 109,005 133,366 159,576 178,386
Main Branch 657 4821 6,322 8,436 11,186 15,101 BranchOffice 15,222 81,043 102,683 124,930 148,390 163,285
XI Number of Employess 221 357 385 416 452 563HeadOffice 66 110 125 117 144 152Main Branch 29 28 30 31 39 45BranchOffice 126 219 230 268 269 366
XII ActiveClients/EmployeeRatioMain Branch 90 112 111 120 107 101BranchOffice 137 172 187 181 193 144
XII Loans/EmployeeRatio 13 24 28 33 37 33Main Branch 62 142 153 169 153 152BranchOffice 8 21 27 32 39 33
ANNUAL REPORT 2018 | 39
2.2.2. Initial measurement of financial instruments
The classification of financial instruments at initial recognition depends on their contractual terms and the business model for managing the instruments, as described in notes 2.3.2.Financial instruments are initially measured at their fair value (as defined in note 2.2), except in the case of financial assets and financial liabilities recorded at FVPl, transaction costs are added to, or subtracted from, this amount. Trade receivables are measured at the transaction price. When the fair value of financial instruments at initial recognition differs from the transaction price, the Bank accounts for the Day 1 profit or loss, as described below
2.2.3. Day 1 Profit & Loss
When the transaction price of the instrument differs from the fair value at origination and the fair value is based on a valuation technique using only inputs observable in market transactions, the Bank recognises the difference between the transaction price and fair value in net trading income. in those case where fair value is based on models for which some of the inputs are not observable, the difference between the transaction price and the fair value is deferred and is only recognised in profit or loss when the inputs become observable, or when the instrument is derecognised.
2.2.4. Measurement categories of financial assets and liabilities
From 1 January 2018, the Bank classifies all of its financial assets based on the business model for managing the assets and the asset’s contractual terms, measured at either:
• AmortizedCost,asexplainedinNote2.3.1.2• FVOCI,asexplainedinNote2.3.4• FVPL,asexplainedinNote2.3.2
Before 1 January 2018, the Bank 2018, l ofBank its finan018, the as0(ed )as0(ed lotr)n018, nd5(ade )0.5(r)10(ec)6(eiv)4(able6( )0. obsec)-se added
| 10 | BDB Annual Report 2017
sl # Particulars 2009 2013 2014 2015 2016 2017X No.of Depositors 15,879 85,864 109,005 133,366 159,576 178,386
Main Branch 657 4821 6,322 8,436 11,186 15,101 BranchOffice 15,222 81,043 102,683 124,930 148,390 163,285
XI Number of Employess 221 357 385 416 452 563HeadOffice 66 110 125 117 144 152Main Branch 29 28 30 31 39 45BranchOffice 126 219 230 268 269 366
XII ActiveClients/EmployeeRatioMain Branch 90 112 111 120 107 101BranchOffice 137 172 187 181 193 144
XII Loans/EmployeeRatio 13 24 28 33 37 33Main Branch 62 142 153 169 153 152BranchOffice 8 21 27 32 39 33
40 | ANNUAL REPORT 2018
The financial asset is held within a business model with the objective to hold financial assets in ordertocollectcontractualcashflowsThecontractualtermsofthefinancialassetgiveriseonspecifieddatestocashflowsthataresolely payments of principal and interest (sPPi) on the principal amount outstanding.
The details of these conditions are outlined below:
2.3.1.1 Business model assessment
TheBankdeterminesitsbusinessmodelatthelevelthatbestreflectshowitmanagesgroupsoffinancial assets to achieve its business objective. The Bank’s business model is not assessed on an instrument-by-instrument basis, but at a higher level of aggregated portfolios and is based on observable factors such as:
How the performance of the business model and the financial assets held within that business model are evaluated and reported to the entity’s key management personnel.
The risks that affect the performance of the business model (and the financial assets held within that business model) and, in particular, the way those risks are managed.
How managers of the business are compensated (for example, whether the compensation is basedonthefairvalueoftheassetsmanagedoronthecontractualcashflowscollected)
The expected frequency, value and timing of sales are also important aspects of the Bank’s assessment.
The business model assessment is based on reasonably expected scenarios without taking ‘worst case’ or ‘stress case’ scenarios into account. If cash flows after initial recognition arerealised in a way that is different from the Bank’s original expectations, the Bank does not change the classification of the remaining financial assets held in that business model, but incorporates such information when assessing newly originated or newly purchased financial assets going forward.
2.3.1.2. The SPPI test
as a second step of its classification process the Bank assesses the contractual terms of financial to identify whether they meet the sPPi test.
‘Principal’ for the purpose of this test is defined as the fair value of the financial asset at initial recognition and may change over the life of the financial asset (for example, if there are repayments of principal or amortization of the premium/discount).
| 10 | BDB Annual Report 2017
sl # Particulars 2009 2013 2014 2015 2016 2017X No.of Depositors 15,879 85,864 109,005 133,366 159,576 178,386
Main Branch 657 4821 6,322 8,436 11,186 15,101 BranchOffice 15,222 81,043 102,683 124,930 148,390 163,285
XI Number of Employess 221 357 385 416 452 563HeadOffice 66 110 125 117 144 152Main Branch 29 28 30 31 39 45BranchOffice 126 219 230 268 269 366
XII ActiveClients/EmployeeRatioMain Branch 90 112 111 120 107 101BranchOffice 137 172 187 181 193 144
XII Loans/EmployeeRatio 13 24 28 33 37 33Main Branch 62 142 153 169 153 152BranchOffice 8 21 27 32 39 33
BHUTAN DEVELOPMENT BANK LIMITED
NOTEs TO THE fINANCIAL sTATEMENT
| 10 | BDB Annual Report 2017
sl # Particulars 2009 2013 2014 2015 2016 2017X No.of Depositors 15,879 85,864 109,005 133,366 159,576 178,386
Main Branch 657 4821 6,322 8,436 11,186 15,101 BranchOffice 15,222 81,043 102,683 124,930 148,390 163,285
XI Number of Employess 221 357 385 416 452 563HeadOffice 66 110 125 117 144 152Main Branch 29 28 30 31 39 45BranchOffice 126 219 230 268 269 366
XII ActiveClients/EmployeeRatioMain Branch 90 112 111 120 107 101BranchOffice 137 172 187 181 193 144
XII Loans/EmployeeRatio 13 24 28 33 37 33Main Branch 62 142 153 169 153 152BranchOffice 8 21 27 32 39 33
ANNUAL REPORT 2018 | 41
The most significant elements of interest within a lending arrangement are typically the consideration for the time value of money and credit risk. To make the sPPi assessment, the Bank applies judgement and considers relevant factors such as the currency in which the financial asset is denominated, and the period for which the interest rate is set.
in contrast, contractual terms that introduce a more than de minimum exposure to risks or volatility inthecontractualcashflowsthatareunrelatedtoabasic lendingarrangementdonotgiverisetocontractualcashflowsthataresolelypaymentsofprincipalandinterestontheamount outstanding. in such cases, the financial asset is required to be measured at FVPl
2.3.4. Debt instruments at FVOCI (Policy applicable from 1 January 2018)
The Bank applies the new category under BFrs 9 of debt instruments measured at FVoCi when both of the following conditions are met:
• Theinstrumentisheldwithinabusinessmodel,theobjectiveofwhichisachievedbybothcollectingcontractualcashflowsandsellingfinancialassets.
• ThecontractualtermsofthefinancialassetmeettheSPPItest
These instruments largely comprise assets that had previously been classified as financial investments available for-sale under Bas 39.
FVoCi debt instruments are subsequently measured at fair value with gains and losses arising due to changes in fair value recognised in oCi. interest income and foreign exchange gains and losses are recognised in profit or loss in the same manner as for financial assets measured at amortised cost.
Where the Bank holds more than one investment in the same security, they are deemed to be disposed of on a first–in first–out basis. on de recognition, cumulative gains or losses previously recognised in oCi are reclassified from oCi to profit or loss.
2.3.5. Equity instruments at FVOCI (Policy applicable from 1 January 2018)
upon initial recognition, the Bank occasionally elects to classify irrevocably some of its equity investments as equity instruments at FVoCi when they meet the definition of definition of equity under Bas 32 Financial instruments: Presentation and are not held for trading. such classification is determined on an instrument- by instrument basis.
Gains and losses on these equity instruments are never recycled to profit. Dividends are recognised in profit or loss as other operating income when the right of the payment has been established, except when the Bank benefits from such proceeds as a recovery of part of the cost of the instrument, in which case, such gains are recorded in oCi. equity instruments at FVoCi
| 10 | BDB Annual Report 2017
sl # Particulars 2009 2013 2014 2015 2016 2017X No.of Depositors 15,879 85,864 109,005 133,366 159,576 178,386
Main Branch 657 4821 6,322 8,436 11,186 15,101 BranchOffice 15,222 81,043 102,683 124,930 148,390 163,285
XI Number of Employess 221 357 385 416 452 563HeadOffice 66 110 125 117 144 152Main Branch 29 28 30 31 39 45BranchOffice 126 219 230 268 269 366
XII ActiveClients/EmployeeRatioMain Branch 90 112 111 120 107 101BranchOffice 137 172 187 181 193 144
XII Loans/EmployeeRatio 13 24 28 33 37 33Main Branch 62 142 153 169 153 152BranchOffice 8 21 27 32 39 33
BHUTAN DEVELOPMENT BANK LIMITED
NOTEs TO THE fINANCIAL sTATEMENT
| 10 | BDB Annual Report 2017
sl # Particulars 2009 2013 2014 2015 2016 2017X No.of Depositors 15,879 85,864 109,005 133,366 159,576 178,386
Main Branch 657 4821 6,322 8,436 11,186 15,101 BranchOffice 15,222 81,043 102,683 124,930 148,390 163,285
XI Number of Employess 221 357 385 416 452 563HeadOffice 66 110 125 117 144 152Main Branch 29 28 30 31 39 45BranchOffice 126 219 230 268 269 366
XII ActiveClients/EmployeeRatioMain Branch 90 112 111 120 107 101BranchOffice 137 172 187 181 193 144
XII Loans/EmployeeRatio 13 24 28 33 37 33Main Branch 62 142 153 169 153 152BranchOffice 8 21 27 32 39 33
42 | ANNUAL REPORT 2018
are not subject to an impairment assessment.
2.3.6. Debt issued and other borrowed funds
after initial measurement, debt issued and other borrowed funds are subsequently measured at amortised cost. amortised cost is calculated by taking into account any discount or premium on issue funds, and costs that are an integral part of the eir. a compound financial instrument which contains both a liability and an equity component is separated at the issue date.
2.3.7. Financial assets and financial liabilities at fair value through profit or loss
Financial assets and financial liabilities in this category are those that are not held for trading and have been either designated by management upon initial recognition or are mandatorily required to be measured at fair value under BFrs 9. Management only designates an instrument at FVPl upon initial recognition when one of the following criteria are met. such designation is determined on an instrument-by-instrument basis:
The designation eliminates, or significantly reduces, the inconsistent treatment that would otherwise arise from measuring the assets or liabilities or recognising gains or losses on them on a different basis or,
The liabilities (and assets until 1 January 2018 under Bas 39) are part of a group of financial liabilities (or financial assets, or both under Bas 39), which are managed and their performance evaluated on a fair value basis, in accordance with a documented risk management or investment strategy or,
The liabilities (and assets until 1 January 2018 under Bas 39) containing one or more embedded derivatives,unless theydonot significantlymodify thecashflows thatwouldotherwiseberequired by the contract, or it is clear with little or no analysis when a similar instrument is first considered that separation of the embedded derivative(s) is prohibited.
Financial assets and financial liabilities at FVPl are recorded in the statement of financial position at fair value. Changes in fair value are recorded in profit and loss with the exception of movements in fair value of liabilities designated at FVPl due to changes in the Bank’s own credit risk. such changes in fair value are recorded in the own credit reserve through oCi and do not get recycled to the profit or loss. interest earned or incurred on instruments designated at FVPl is accrued in interest income or interest expense, respectively, using the eir, taking into account any discount/ premium and qualifying transaction costs being an integral part of instrument. interest earned on assets mandatorily required to be measured at FVPl is recorded using contractual interest rate.
| 10 | BDB Annual Report 2017
sl # Particulars 2009 2013 2014 2015 2016 2017X No.of Depositors 15,879 85,864 109,005 133,366 159,576 178,386
Main Branch 657 4821 6,322 8,436 11,186 15,101 BranchOffice 15,222 81,043 102,683 124,930 148,390 163,285
XI Number of Employess 221 357 385 416 452 563HeadOffice 66 110 125 117 144 152Main Branch 29 28 30 31 39 45BranchOffice 126 219 230 268 269 366
XII ActiveClients/EmployeeRatioMain Branch 90 112 111 120 107 101BranchOffice 137 172 187 181 193 144
XII Loans/EmployeeRatio 13 24 28 33 37 33Main Branch 62 142 153 169 153 152BranchOffice 8 21 27 32 39 33
BHUTAN DEVELOPMENT BANK LIMITED
NOTEs TO THE fINANCIAL sTATEMENT
| 10 | BDB Annual Report 2017
sl # Particulars 2009 2013 2014 2015 2016 2017X No.of Depositors 15,879 85,864 109,005 133,366 159,576 178,386
Main Branch 657 4821 6,322 8,436 11,186 15,101 BranchOffice 15,222 81,043 102,683 124,930 148,390 163,285
XI Number of Employess 221 357 385 416 452 563HeadOffice 66 110 125 117 144 152Main Branch 29 28 30 31 39 45BranchOffice 126 219 230 268 269 366
XII ActiveClients/EmployeeRatioMain Branch 90 112 111 120 107 101BranchOffice 137 172 187 181 193 144
XII Loans/EmployeeRatio 13 24 28 33 37 33Main Branch 62 142 153 169 153 152BranchOffice 8 21 27 32 39 33
ANNUAL REPORT 2018 | 43
Dividend income from equity instruments measured at FVPl is recorded in profit or loss as other operating income when the right to the payment has been established.
2.3.8. Financial guarantees, letters of credit and undrawn loan commitments
The Bank issues financial guarantees, letters of credit and loan commitments.Financial guarantees are initially recognised in the financial statements (within Provisions) at fair value, being the premium received. subsequent to initial recognition, the Bank’s liability under each guarantee is measured at the higher of the amount initially recognised less cumulative amortisation recognised in the income statement, and – under Bas 39 – the best estimate of expenditure required to settle any financial obligation arising as a result of the guarantee, or – under BFrs 9 – an eCl provision as set out in note 2.6.2.
The premium received is recognised in the income statement in net fees and commission income on a straight line basis over the life of the guarantee.
undrawn loan commitments and letters of credits are commitments under which, over the duration of the commitment, the Bank is required to provide a loan with pre-specified terms to the customer. similar to financial guarantee contracts, under Bas 39, a provision was made if they were an onerous contract but, from 1 January 2018, these contracts are in the scope of the eCl requirements.
The nominal contractual value of financial guarantees, letters of credit and undrawn loan commitments, where the loan agreed to be provided is on market terms, are not recorded on in the statement of financial position. The nominal values of these instruments together with the corresponding eCls are disclosed.
2.4. Reclassification of financial assets and liabilities
From 1 January 2018, the Bank does not reclassify its financial assets subsequent to their initial recognition, apart from the exceptional circumstances in which the Bank acquires, disposes of, or terminates a business line. Financial liabilities are never reclassified.
The Bank did not reclassify any of its financial assets or liabilities in 2017 & 2018.
2.5. De recognition of financial assets and liabilities
2.5.1. De recognition due to substantial modification of terms and conditionsThe Bank derecognises a financial asset, such as a loan to a customer, when the terms and conditions have been renegotiated to the extent that, substantially, it becomes a new loan, with the difference recognised as a de recognition gain or loss, to the extent that an impairment
| 10 | BDB Annual Report 2017
sl # Particulars 2009 2013 2014 2015 2016 2017X No.of Depositors 15,879 85,864 109,005 133,366 159,576 178,386
Main Branch 657 4821 6,322 8,436 11,186 15,101 BranchOffice 15,222 81,043 102,683 124,930 148,390 163,285
XI Number of Employess 221 357 385 416 452 563HeadOffice 66 110 125 117 144 152Main Branch 29 28 30 31 39 45BranchOffice 126 219 230 268 269 366
XII ActiveClients/EmployeeRatioMain Branch 90 112 111 120 107 101BranchOffice 137 172 187 181 193 144
XII Loans/EmployeeRatio 13 24 28 33 37 33Main Branch 62 142 153 169 153 152BranchOffice 8 21 27 32 39 33
BHUTAN DEVELOPMENT BANK LIMITED
NOTEs TO THE fINANCIAL sTATEMENT
| 10 | BDB Annual Report 2017
sl # Particulars 2009 2013 2014 2015 2016 2017X No.of Depositors 15,879 85,864 109,005 133,366 159,576 178,386
Main Branch 657 4821 6,322 8,436 11,186 15,101 BranchOffice 15,222 81,043 102,683 124,930 148,390 163,285
XI Number of Employess 221 357 385 416 452 563HeadOffice 66 110 125 117 144 152Main Branch 29 28 30 31 39 45BranchOffice 126 219 230 268 269 366
XII ActiveClients/EmployeeRatioMain Branch 90 112 111 120 107 101BranchOffice 137 172 187 181 193 144
XII Loans/EmployeeRatio 13 24 28 33 37 33Main Branch 62 142 153 169 153 152BranchOffice 8 21 27 32 39 33
44 | ANNUAL REPORT 2018
loss has not already been recorded. The newly recognised loans are classified as stage 1 for eCl measurement purposes, unless the new loan is deemed to be PoCi.
When assessing whether or not to derecognise a loan to a customer, amongst others, theBank considers the following factors:
• Changeincurrencyoftheloan
• Introductionofanequityfeature
• Changeincounterparty
• IfthemodificationissuchthattheinstrumentwouldnolongermeettheSPPIcriterion
Ifthemodificationdoesnotresultincashflowsthataresubstantiallydifferent,themodificationdoesnotresultinderecognition.Basedonthechangeincashflowsdiscountedattheoriginaleir, the Bank record a modification gains or loss, to the extent that an impairment loss has not already been recorded.
2.5.2. De recognition other than for substantial modification
2.5.2.1. Financial assets
a financial asset (or, where applicable, a part of a financial asset or part of a group of similar financialassets)isderecognisedwhentherightstoreceivecashflowsfromthefinancialassethave expired. The Bank also derecognises the financial asset if it has both transferred the financial asset and the transfer qualifies for de recognition.
The Bank has transferred the financial asset if, and only if, either:
• TheBankhastransferreditscontractualrightstoreceivecashflowsfromthefinancialassetor
• Itretainstherightstothecashflows,buthasassumedanobligationtopaythereceivedcashflowsinfullwithoutmaterialdelaytoathirdpartyundera‘pass-through’arrangementor
• Pass-througharrangementsaretransactionswherebytheBankretainsthecontractual
• rightstoreceivethecashflowsofafinancialasset(the‘originalasset’),butassumesa
• contractualobligationtopaythosecashflowstooneormoreentities(the‘eventual
• recipients’),whenallofthefollowingthreeconditionsaremet:
• TheBankhasnoobligationtopayamountstotheeventualrecipientsunlessithascollectedequivalent amounts from the original asset, excluding short-term advances with the right to full recovery of the amount lent plus accrued interest at market rates
| 10 | BDB Annual Report 2017
sl # Particulars 2009 2013 2014 2015 2016 2017X No.of Depositors 15,879 85,864 109,005 133,366 159,576 178,386
Main Branch 657 4821 6,322 8,436 11,186 15,101 BranchOffice 15,222 81,043 102,683 124,930 148,390 163,285
XI Number of Employess 221 357 385 416 452 563HeadOffice 66 110 125 117 144 152Main Branch 29 28 30 31 39 45BranchOffice 126 219 230 268 269 366
XII ActiveClients/EmployeeRatioMain Branch 90 112 111 120 107 101BranchOffice 137 172 187 181 193 144
XII Loans/EmployeeRatio 13 24 28 33 37 33Main Branch 62 142 153 169 153 152BranchOffice 8 21 27 32 39 33
BHUTAN DEVELOPMENT BANK LIMITED
NOTEs TO THE fINANCIAL sTATEMENT
| 10 | BDB Annual Report 2017
sl # Particulars 2009 2013 2014 2015 2016 2017X No.of Depositors 15,879 85,864 109,005 133,366 159,576 178,386
Main Branch 657 4821 6,322 8,436 11,186 15,101 BranchOffice 15,222 81,043 102,683 124,930 148,390 163,285
XI Number of Employess 221 357 385 416 452 563HeadOffice 66 110 125 117 144 152Main Branch 29 28 30 31 39 45BranchOffice 126 219 230 268 269 366
XII ActiveClients/EmployeeRatioMain Branch 90 112 111 120 107 101BranchOffice 137 172 187 181 193 144
XII Loans/EmployeeRatio 13 24 28 33 37 33Main Branch 62 142 153 169 153 152BranchOffice 8 21 27 32 39 33
ANNUAL REPORT 2018 | 45
• TheBankcannotsellorpledgetheoriginalassetother thanassecurity to theeventualrecipients without material delay.
• In addition, theBank isnotentitled to reinvest suchcashflows, except for investmentsin cash or cash equivalents including interest earned, during the period between the collection date and the date of required remittance to the eventual recipients.
2.5.2.1. Financial assets continued
a transfer only qualifies for de recognition if either:
• TheBankhastransferredsubstantiallyalltherisksandrewardsoftheasset
or
• TheBankhasneithertransferrednorretainedsubstantiallyalltherisksandrewardsoftheasset, but has transferred control of the asset.
The Bank considers control to be transferred if and only if, the transferee has the practical ability to sell the asset in its entirety to an unrelated third party and is able to exercise that ability unilaterally and without imposing additional restrictions on the transfer.
When the Bank has neither transferred nor retained substantially all the risks and rewards and has retained control of the asset, the asset continues to be recognised only to the extent of the Bank’s continuing involvement, in which case, the Bank also recognises an associated liability. Thetransferredassetandtheassociatedliabilityaremeasuredonabasisthatreflectstherightsand obligations that the Bank has retained.
Continuing involvement that takes the form of a guarantee over the transferred asset is measured at the lower of the original carrying amount of the asset and the maximum amount of consideration the Bank could be required to pay.
if continuing involvement takes the form of a written or purchased option (or both) on the transferred asset, the continuing involvement is measured at the value the Bank would be required to pay upon repurchase. in the case of a written put option on an asset that is measured at fair value, the extent of the entity’s continuing involvement is limited to the lower of the fair value of the transferred asset and the option exercise price.
2.5.2.2. Financial liabilities
a financial liability is derecognised when the obligation under the liability is discharged, cancelled or expires. Where an existing financial liability is replaced by another from the same
| 10 | BDB Annual Report 2017
sl # Particulars 2009 2013 2014 2015 2016 2017X No.of Depositors 15,879 85,864 109,005 133,366 159,576 178,386
Main Branch 657 4821 6,322 8,436 11,186 15,101 BranchOffice 15,222 81,043 102,683 124,930 148,390 163,285
XI Number of Employess 221 357 385 416 452 563HeadOffice 66 110 125 117 144 152Main Branch 29 28 30 31 39 45BranchOffice 126 219 230 268 269 366
XII ActiveClients/EmployeeRatioMain Branch 90 112 111 120 107 101BranchOffice 137 172 187 181 193 144
XII Loans/EmployeeRatio 13 24 28 33 37 33Main Branch 62 142 153 169 153 152BranchOffice 8 21 27 32 39 33
BHUTAN DEVELOPMENT BANK LIMITED
NOTEs TO THE fINANCIAL sTATEMENT
| 10 | BDB Annual Report 2017
sl # Particulars 2009 2013 2014 2015 2016 2017X No.of Depositors 15,879 85,864 109,005 133,366 159,576 178,386
Main Branch 657 4821 6,322 8,436 11,186 15,101 BranchOffice 15,222 81,043 102,683 124,930 148,390 163,285
XI Number of Employess 221 357 385 416 452 563HeadOffice 66 110 125 117 144 152Main Branch 29 28 30 31 39 45BranchOffice 126 219 230 268 269 366
XII ActiveClients/EmployeeRatioMain Branch 90 112 111 120 107 101BranchOffice 137 172 187 181 193 144
XII Loans/EmployeeRatio 13 24 28 33 37 33Main Branch 62 142 153 169 153 152BranchOffice 8 21 27 32 39 33
46 | ANNUAL REPORT 2018
lender on substantially different terms, or the terms of an existing liability are substantially modified, such an exchange or modification is treated as a derecognition of the original liability and the recognition of a new liability. The difference between the carrying value of the original financial liability and the consideration paid is recognised in profit or loss.
2.6. Impairment of financial assets (Policy applicable from 1 January 2018)
2.6.1. Overview of the ECL principles
as described in note 1.1.1, the adoption of BFrs 9 has fundamentally changed the Bank’s loan loss impairment method by replacing Bas 39’s incurred loss approach with a forward-looking eCl approach. From 1 January 2018, the Bank has been recording the allowance for expected credit losses for all loans and other debt financial assets not held at FVPl, together with loan commitments and financial guarantee contracts, in this section all referred to as ‘financial instruments’. equity instruments are not subject to impairment under BFrs 9.
The 12m eCl is the portion of lTeCls that represent the eCls that result from default events on a financial instrument that are possible within the 12 months after the reporting date.
Both lTeCls and 12meCls are calculated on either an individual basis or a collective basis, depending on the nature of the underlying portfolio of financial instruments. The Bank’s policy for grouping financial assets measured on a collective basis is explained in note 29 to 35.
The Bank has established a policy to perform an assessment, at the end of each reporting period, of whether a financial instrument’s credit risk has increased significantly since initial recognition, by considering the change in the risk of default occurring over the remaining life of the financial instrument.
Based on the above process, the Bank groups its loans into stage 1, stage 2, stage 3 and PoCi, as described below:
• Stage1:When loans are first recognised, the Bank recognises an allowance based on 12meCls. stage 1 loans also include facilities where the credit risk has improved and the loan has been reclassified from stage 2.
• Stage2:When a loan has shown a significant increase in credit risk since origination, the Bank records an allowance for the lTeCls. stage 2 loans also include facilities, where the credit risk has improved and the loan has been reclassified from stage 3.
| 10 | BDB Annual Report 2017
sl # Particulars 2009 2013 2014 2015 2016 2017X No.of Depositors 15,879 85,864 109,005 133,366 159,576 178,386
Main Branch 657 4821 6,322 8,436 11,186 15,101 BranchOffice 15,222 81,043 102,683 124,930 148,390 163,285
XI Number of Employess 221 357 385 416 452 563HeadOffice 66 110 125 117 144 152Main Branch 29 28 30 31 39 45BranchOffice 126 219 230 268 269 366
XII ActiveClients/EmployeeRatioMain Branch 90 112 111 120 107 101BranchOffice 137 172 187 181 193 144
XII Loans/EmployeeRatio 13 24 28 33 37 33Main Branch 62 142 153 169 153 152BranchOffice 8 21 27 32 39 33
BHUTAN DEVELOPMENT BANK LIMITED
NOTEs TO THE fINANCIAL sTATEMENT
| 10 | BDB Annual Report 2017
sl # Particulars 2009 2013 2014 2015 2016 2017X No.of Depositors 15,879 85,864 109,005 133,366 159,576 178,386
Main Branch 657 4821 6,322 8,436 11,186 15,101 BranchOffice 15,222 81,043 102,683 124,930 148,390 163,285
XI Number of Employess 221 357 385 416 452 563HeadOffice 66 110 125 117 144 152Main Branch 29 28 30 31 39 45BranchOffice 126 219 230 268 269 366
XII ActiveClients/EmployeeRatioMain Branch 90 112 111 120 107 101BranchOffice 137 172 187 181 193 144
XII Loans/EmployeeRatio 13 24 28 33 37 33Main Branch 62 142 153 169 153 152BranchOffice 8 21 27 32 39 33
ANNUAL REPORT 2018 | 47
• Stage3:loans considered credit-impaired. The bank records an allowance for the lTeCls.
• POCI:Purchased or originated credit impaired (PoCi) assets are financial assets that are credit impaired on initial recognition. PoCi assets are recorded at fair value at original recognition and interest income is subsequently recognised based on a credit-adjusted eir. eCls are only recognised or released to the extent that there is a subsequent change in the expected credit losses.
For financial assets for which the Bank has no reasonable expectations of recovering either the entire outstanding amount, or a proportion thereof, the gross carrying amount of the financial asset is reduced. This is considered a (partial) derecognition of the financial asset.
2.6.2. The calculation of ECLs
The Bank calculates eCls based on a four probability-weighted scenarios to measure the expected cash shortfalls, discounted at an approximation to the eir. a cash shortfall is the differencebetweenthecashflowsthatareduetoanentity inaccordancewiththecontractandthecashflowsthattheentityexpectstoreceive.
The mechanics of the eCl calculations are outlined below and the key elements are, as follows:
• PDThe Probability of Default is an estimate of the likelihood of default over a given time horizon. a default may only happen at a certain time over the assessed period, if the facility has not been previously recognised and is still in the portfolio.
• EADThe exposure at Default is an estimate of the exposure at a future default date, taking into account expected changes in the exposure after the reporting date, including repayments of principal and interest, hether scheduled by contract or otherwise, expected drawdowns on committed facilities, and accrued interest from missed payments.
The exposure at default (eaD) represents the gross carrying amount of the financial instruments subject to the impairment calculation, addressing both the client’s ability to increase its exposure while approaching default and potential early repayments too.
To calculate the eaD for a stage 1 loan, the Bank assesses the possible default events within 12 months for the calculation of the 12meCl. However, if a stage 1 loan that is expected to default in the 12 months from the balance sheet date and is also expected to cure and
| 10 | BDB Annual Report 2017
sl # Particulars 2009 2013 2014 2015 2016 2017X No.of Depositors 15,879 85,864 109,005 133,366 159,576 178,386
Main Branch 657 4821 6,322 8,436 11,186 15,101 BranchOffice 15,222 81,043 102,683 124,930 148,390 163,285
XI Number of Employess 221 357 385 416 452 563HeadOffice 66 110 125 117 144 152Main Branch 29 28 30 31 39 45BranchOffice 126 219 230 268 269 366
XII ActiveClients/EmployeeRatioMain Branch 90 112 111 120 107 101BranchOffice 137 172 187 181 193 144
XII Loans/EmployeeRatio 13 24 28 33 37 33Main Branch 62 142 153 169 153 152BranchOffice 8 21 27 32 39 33
BHUTAN DEVELOPMENT BANK LIMITED
NOTEs TO THE fINANCIAL sTATEMENT
| 10 | BDB Annual Report 2017
sl # Particulars 2009 2013 2014 2015 2016 2017X No.of Depositors 15,879 85,864 109,005 133,366 159,576 178,386
Main Branch 657 4821 6,322 8,436 11,186 15,101 BranchOffice 15,222 81,043 102,683 124,930 148,390 163,285
XI Number of Employess 221 357 385 416 452 563HeadOffice 66 110 125 117 144 152Main Branch 29 28 30 31 39 45BranchOffice 126 219 230 268 269 366
XII ActiveClients/EmployeeRatioMain Branch 90 112 111 120 107 101BranchOffice 137 172 187 181 193 144
XII Loans/EmployeeRatio 13 24 28 33 37 33Main Branch 62 142 153 169 153 152BranchOffice 8 21 27 32 39 33
48 | ANNUAL REPORT 2018
subsequently default again, then all linked default events are taken into account. For stage 2, stage 3 and PoCi financial assets, the exposure at default is considered for events over the lifetime of the instruments.
The Bank determines eaDs by modelling the range of possible exposure outcomes at various points in time, corresponding the multiple scenarios. The BFrs 9 PDs are then assigned to each economic scenario based on the outcome of Bank’s models.
• LGDThe loss Given Default is an estimate of the loss arising in the case where a default occurs at agiventime.Itisbasedonthedifferencebetweenthecontractualcashflowsdueandthosethat the lender would expect to receive, including from the realisation of any collateral. it is usually expressed as a percentage of the eaD.
When estimating the eCls, the Bank considers three scenarios base case, worst case, and worst case. each of these is associated with different PDs, eaDs and lGDs, as set out in note 31. When relevant, the assessment of multiple scenarios also incorporates how defaulted loans are expected to be recovered, including the probability that the loans will cure and the value of collateral or the amount that might be received for selling the asset.
With the exception of credit cards and other revolving facilities, for which the treatment is separately set out in n
| 10 | BDB Annual Report 2017
sl # Particulars 2009 2013 2014 2015 2016 2017X No.of Depositors 15,879 85,864 109,005 133,366 159,576 178,386
Main Branch 657 4821 6,322 8,436 11,186 15,101 BranchOffice 15,222 81,043 102,683 124,930 148,390 163,285
XI Number of Employess 221 357 385 416 452 563HeadOffice 66 110 125 117 144 152Main Branch 29 28 30 31 39 45BranchOffice 126 219 230 268 269 366
XII ActiveClients/EmployeeRatioMain Branch 90 112 111 120 107 101BranchOffice 137 172 187 181 193 144
XII Loans/EmployeeRatio 13 24 28 33 37 33Main Branch 62 142 153 169 153 152BranchOffice 8 21 27 32 39 33
ANNUAL REPORT 2018 | 49
of the instrument. The expected cash shortfalls are discounted by an approximation to the original eir.
• Stage3:For loans considered credit-impaired , the Bank recognises the lifetime expected credit losses for these loans. The method is similar to that for stage 2 assets, with the PD set at 100%.
• POCI:PoCi assets are financial assets that are credit impaired on initial recognition. The Bank only recognises the cumulative changes in lifetime eCls since initial recognition, based on a probability-weighting of the four scenarios, discounted by the credit adjusted eir.
• LoanCommitmentsandlettersofcredit:When estimating lTeCls for undrawn loan commitments, the Bank estimates the expected portion of the loan commitment that will be drawn down over its expected life. The eCl is thenbasedonthepresentvalueoftheexpectedshortfallsincashflowsiftheloanisdrawndown, based on a probability-weighting of the four scenarios. The expected cash shortfalls are discounted at an approximation to the expected eir on the loan.
• FinancialGuaranteecontracts:For credit cards and revolving facilities that include both a loan and an undrawn commitment, eCls are calculated and presented together with the loan. For loan commitments and letters of credit, the eCl is recognised within Provisions.
The measurement of impairment losses both under BFrs 9 and ias 39 across all categories of financial assets requires judgement, in particular, the estimation of the amount and timing of future cash flows and collateral values when determining impairment losses and theassessment of a significant increase in credit risk. These estimates are driven by a number of factors, changes in which can result in different levels of allowances.
The Bank’s eCl calculations are outputs of complex models with a number of underlying assumptions regarding the choice of variable inputs and their interdependencies. elements of the eCl models that are considered accounting judgements and estimates include:
• TheBanks forcriteriaassessing if therehasbeenasignificant increase incredit riskandso allowance for financial asset should be measured on a lTeCl basis and qualitative assessment.
• ThesegmentationoffinancialassetswhentheirECLisassessedonacollectivebasis
• DevelopmentofECLmodels,includingthevariousformulasandthechoiceofinputs.
• Determinationofassociationsbetweenmacroeconomicscenariosand,economicinputs,
| 10 | BDB Annual Report 2017
sl # Particulars 2009 2013 2014 2015 2016 2017X No.of Depositors 15,879 85,864 109,005 133,366 159,576 178,386
Main Branch 657 4821 6,322 8,436 11,186 15,101 BranchOffice 15,222 81,043 102,683 124,930 148,390 163,285
XI Number of Employess 221 357 385 416 452 563HeadOffice 66 110 125 117 144 152Main Branch 29 28 30 31 39 45BranchOffice 126 219 230 268 269 366
XII ActiveClients/EmployeeRatioMain Branch 90 112 111 120 107 101BranchOffice 137 172 187 181 193 144
XII Loans/EmployeeRatio 13 24 28 33 37 33Main Branch 62 142 153 169 153 152BranchOffice 8 21 27 32 39 33
BHUTAN DEVELOPMENT BANK LIMITED
NOTEs TO THE fINANCIAL sTATEMENT
| 10 | BDB Annual Report 2017
sl # Particulars 2009 2013 2014 2015 2016 2017X No.of Depositors 15,879 85,864 109,005 133,366 159,576 178,386
Main Branch 657 4821 6,322 8,436 11,186 15,101 BranchOffice 15,222 81,043 102,683 124,930 148,390 163,285
XI Number of Employess 221 357 385 416 452 563HeadOffice 66 110 125 117 144 152Main Branch 29 28 30 31 39 45BranchOffice 126 219 230 268 269 366
XII ActiveClients/EmployeeRatioMain Branch 90 112 111 120 107 101BranchOffice 137 172 187 181 193 144
XII Loans/EmployeeRatio 13 24 28 33 37 33Main Branch 62 142 153 169 153 152BranchOffice 8 21 27 32 39 33
50 | ANNUAL REPORT 2018
such as unemployment levels and collateral values, and the effect on PDs, eaDs and lGDs
Determination of associations between macroeconomic scenarios and, economic inputs, such as unemployment levels and collateral values, and the effect on PDs, eaDs and lGDs
• Selectionofforward-lookingmacroeconomicscenariosandtheirprobabilityweightings,to derive the economic inputs into eCl model.
2.6.3. Debt instruments measured at fair value through OCI
The eCls for debt instruments measured at FVoCi do not reduce the carrying amount of these financial assets in the statement of financial position, which remains at fair value. instead, an amount equal to the allowance that would arise if the assets were measured at amortised cost is recognised in oCi as an accumulated impairment amount, with a corresponding charge to profit or loss. The accumulated loss recognised in oCi is recycled to the profit and loss upon derecognition of the assets.
2.6.4. Purchased or originated credit impaired financial assets (POCI)
For PoCi financial assets, the Bank only recognises the cumulative changes in lTeCl since initial recognition in the loss allowance.
2.6.5. Credit cards and other revolving facilities
The Bank’s product offering includes a variety of corporate and retail overdraft and credit cards facilities, in which the Bank has the right to cancel and/or reduce the facilities with one day’s notice. The Bank does not limit its exposure to credit losses to the contractual notice period, but,insteadcalculatesECLoveraperiodthatreflectstheBank’sexpectationsofthecustomerbehaviour, its likelihood of default and the Bank’s future risk mitigation procedures, which could include reducing or cancelling the facilities. Based on past experience and the Bank’s expectations, the period over which the Bank calculates eCls for these products, is one year due to the credit mitigating actions bank have enforced on a continuous basis.
2.6.6. Forward looking information
in its eCl models, the Bank relies on a broad range of forward looking information as economic inputs, such as:
• GDPgrowth
• Unemploymentrates
• CentralBankbaserates
• Inflation
| 10 | BDB Annual Report 2017
sl # Particulars 2009 2013 2014 2015 2016 2017X No.of Depositors 15,879 85,864 109,005 133,366 159,576 178,386
Main Branch 657 4821 6,322 8,436 11,186 15,101 BranchOffice 15,222 81,043 102,683 124,930 148,390 163,285
XI Number of Employess 221 357 385 416 452 563HeadOffice 66 110 125 117 144 152Main Branch 29 28 30 31 39 45BranchOffice 126 219 230 268 269 366
XII ActiveClients/EmployeeRatioMain Branch 90 112 111 120 107 101BranchOffice 137 172 187 181 193 144
XII Loans/EmployeeRatio 13 24 28 33 37 33Main Branch 62 142 153 169 153 152BranchOffice 8 21 27 32 39 33
BHUTAN DEVELOPMENT BANK LIMITED
NOTEs TO THE fINANCIAL sTATEMENT
| 10 | BDB Annual Report 2017
sl # Particulars 2009 2013 2014 2015 2016 2017X No.of Depositors 15,879 85,864 109,005 133,366 159,576 178,386
Main Branch 657 4821 6,322 8,436 11,186 15,101 BranchOffice 15,222 81,043 102,683 124,930 148,390 163,285
XI Number of Employess 221 357 385 416 452 563HeadOffice 66 110 125 117 144 152Main Branch 29 28 30 31 39 45BranchOffice 126 219 230 268 269 366
XII ActiveClients/EmployeeRatioMain Branch 90 112 111 120 107 101BranchOffice 137 172 187 181 193 144
XII Loans/EmployeeRatio 13 24 28 33 37 33Main Branch 62 142 153 169 153 152BranchOffice 8 21 27 32 39 33
ANNUAL REPORT 2018 | 51
• ExchangeRate
The inputs and models used for calculating eCls may not always capture all characteristics ofthemarketat thedateof thefinancialstatements.Toreflectthis,qualitativeadjustmentsor overlays are occasionally made as temporary adjustments when such differences are significantly material. Therefore, bank also considers the following qualitative factors
• GovernmentPolicies
• IndustryBusinesscycle
• Regulatoryimpact
2.7. Collateral valuation
To mitigate its credit risks on financial assets, the Bank seeks to use collateral, where possible. The collateral comes in various forms, such as cash, securities, letters of credit/guarantees, real estate, receivables, inventories, other non-financial assets and credit enhancements such as netting agreements. The Bank’s accounting policy for collateral assigned to it through its lending arrangements under BFrs 9 is the same is it was under Bas 39.
2.8. Collateral repossessed
The Bank’s accounting policy under BFrs 9 remains the same as it was under Bas 39. The Bank’s policy is to determine whether a repossessed asset can be best used for its internal operations or should be sold. assets determined to be useful for the internal operations are transferred to their relevant asset category at the lower of their repossessed value or the carrying value of the original secured asset. assets for which selling is determined to be a better option are transferred to assets held for sale at their fair value (if financial assets) and fair value less cost to sell for non-financial assets at the repossession date in, line with the Bank’s policy.
in its normal course of business, the Bank does not physically repossess properties or other assets in its retail portfolio, but engages external agents to recover funds, generally at auction, to settle outstanding debt. any surplus funds are returned to the customers/obligors. as a result of this practice, the residential properties under legal repossession processes are not recorded on the balance sheet.
2.9. Write-offs
The Bank’s accounting policy under BFrs 9 remains the same as it was under Bas 39. Financial assets are written off either partially or in their entirety only when the Bank has stopped pursuing the recovery. if the amount to be written off is greater than the accumulated loss allowance, the difference is first treated as an addition to the allowance that is then applied against the gross
| 10 | BDB Annual Report 2017
sl # Particulars 2009 2013 2014 2015 2016 2017X No.of Depositors 15,879 85,864 109,005 133,366 159,576 178,386
Main Branch 657 4821 6,322 8,436 11,186 15,101 BranchOffice 15,222 81,043 102,683 124,930 148,390 163,285
XI Number of Employess 221 357 385 416 452 563HeadOffice 66 110 125 117 144 152Main Branch 29 28 30 31 39 45BranchOffice 126 219 230 268 269 366
XII ActiveClients/EmployeeRatioMain Branch 90 112 111 120 107 101BranchOffice 137 172 187 181 193 144
XII Loans/EmployeeRatio 13 24 28 33 37 33Main Branch 62 142 153 169 153 152BranchOffice 8 21 27 32 39 33
BHUTAN DEVELOPMENT BANK LIMITED
NOTEs TO THE fINANCIAL sTATEMENT
| 10 | BDB Annual Report 2017
sl # Particulars 2009 2013 2014 2015 2016 2017X No.of Depositors 15,879 85,864 109,005 133,366 159,576 178,386
Main Branch 657 4821 6,322 8,436 11,186 15,101 BranchOffice 15,222 81,043 102,683 124,930 148,390 163,285
XI Number of Employess 221 357 385 416 452 563HeadOffice 66 110 125 117 144 152Main Branch 29 28 30 31 39 45BranchOffice 126 219 230 268 269 366
XII ActiveClients/EmployeeRatioMain Branch 90 112 111 120 107 101BranchOffice 137 172 187 181 193 144
XII Loans/EmployeeRatio 13 24 28 33 37 33Main Branch 62 142 153 169 153 152BranchOffice 8 21 27 32 39 33
52 | ANNUAL REPORT 2018
carrying amount. any subsequent recoveries are credited to credit loss expense.
2.10. Forborne and modified loans
The Bank sometimes makes concessions or modifications to the original terms of loans as a response to the borrower’s financial difficulties, rather than taking possession or to otherwise enforce collection of collateral. The Bank considers a loan forborne when such concessions or modifications are provided as a result of the borrower’s present or expected financial difficulties and the Bank would not have agreed to them if the borrower had been financially healthy. indicators of financial difficulties include defaults on covenants, or significant concerns raised by the Credit risk Department. Forbearance may involve extending the payment arrangements and the agreement of new loan conditions. once the terms have been renegotiated, any impairment is measured using the original eir as calculated before the modification of terms. it is the Bank’s policy to monitor forborne loans to help ensure that future payments continue to be likely to occur. Derecognition decisions and classification between stage 2 and stage 3 are determined on a case-by-case basis. if these procedures identify a loss in relation to a loan, it is disclosed and managed as an impaired stage 3 forborne asset until it is collected or written off.From 1 January 2018, when the loan has been renegotiated or modified but not derecognised, the Bank also reassesses whether there has been a significant increase in credit risk. The Bank also considers whether the assets should be classified as stage 3.
2.11 Grouping financial assets measured on a collective basis
as explained in note 2.6.1 dependant on the factors below, the Bank calculates eCls either on a collective or an individual basis.
asset classes where the Bank calculates eCl on an individual basis all customers above the individually significant threshold
asset classes where the Bank calculates eCl on a collective basis include:
• CustomersbelowtheIndividuallySignificantthreshhold
The Bank groups these exposures into smaller homogeneous portfolios, based on a combination of internal and external characteristics of the loans, as described below:
For retail mortgages these are:
• Producttype(buytolet/owneroccupied)
• Propertytype(prime,standardgrade,lowgrade)
• Geographiclocation
• Loan-to-valueratios
| 10 | BDB Annual Report 2017
sl # Particulars 2009 2013 2014 2015 2016 2017X No.of Depositors 15,879 85,864 109,005 133,366 159,576 178,386
Main Branch 657 4821 6,322 8,436 11,186 15,101 BranchOffice 15,222 81,043 102,683 124,930 148,390 163,285
XI Number of Employess 221 357 385 416 452 563HeadOffice 66 110 125 117 144 152Main Branch 29 28 30 31 39 45BranchOffice 126 219 230 268 269 366
XII ActiveClients/EmployeeRatioMain Branch 90 112 111 120 107 101BranchOffice 137 172 187 181 193 144
XII Loans/EmployeeRatio 13 24 28 33 37 33Main Branch 62 142 153 169 153 152BranchOffice 8 21 27 32 39 33
BHUTAN DEVELOPMENT BANK LIMITED
NOTEs TO THE fINANCIAL sTATEMENT
| 10 | BDB Annual Report 2017
sl # Particulars 2009 2013 2014 2015 2016 2017X No.of Depositors 15,879 85,864 109,005 133,366 159,576 178,386
Main Branch 657 4821 6,322 8,436 11,186 15,101 BranchOffice 15,222 81,043 102,683 124,930 148,390 163,285
XI Number of Employess 221 357 385 416 452 563HeadOffice 66 110 125 117 144 152Main Branch 29 28 30 31 39 45BranchOffice 126 219 230 268 269 366
XII ActiveClients/EmployeeRatioMain Branch 90 112 111 120 107 101BranchOffice 137 172 187 181 193 144
XII Loans/EmployeeRatio 13 24 28 33 37 33Main Branch 62 142 153 169 153 152BranchOffice 8 21 27 32 39 33
ANNUAL REPORT 2018 | 53
• Internalgrade
• Exposurevalue
For consumer lending these are:
• Producttype(overdraft,unsecuredpersonalloan,creditcard,etc.)
• Internalgrade
• Geographiclocation/residenceoftheborrower
• Utilisation
• In the case of credit cards,whether or not borrowers repay their balances in full everymonth
• Exposurevalue
For small business lending these are:
• Borrower’sindustry
• Internalcreditgrade
• Geographiclocation
• Exposurevalue
• Collateraltype
3.1. Analysis of inputs to the ECL model under multiple economic scenarios per geographic regions
an overview of the approach to estimating eCls is set out in note 2.1 summary of significant accounting policies and in note 3.1 significant accounting judgements, estimates and assumptions. To ensure completeness and accuracy, the Bank obtains the data used from third party sources (rMa Published data, iMF & World Bank.) and a team of economists within its Credit risk Department verifies the accuracy of inputs to the Bank’ eCl models including determining the weights attributable to the multiple scenarios. The following tables set out the key drivers of expected loss and the assumptions used for the Bank’s base case estimate, eCls based on the base case, plus the effect of the use of multiple economic scenarios for each of the four geographical segments, as at 31 December 2017 and 2018.
The tables show the values of the key forward looking economic variables/assumptions used in each of the economic scenarios for the eCl calculations. The figures for “subsequent years” represent a long-term average and so are the same for each scenario.
| 10 | BDB Annual Report 2017
sl # Particulars 2009 2013 2014 2015 2016 2017X No.of Depositors 15,879 85,864 109,005 133,366 159,576 178,386
Main Branch 657 4821 6,322 8,436 11,186 15,101 BranchOffice 15,222 81,043 102,683 124,930 148,390 163,285
XI Number of Employess 221 357 385 416 452 563HeadOffice 66 110 125 117 144 152Main Branch 29 28 30 31 39 45BranchOffice 126 219 230 268 269 366
XII Activ BranchOf 230
XII� 2014 2831357
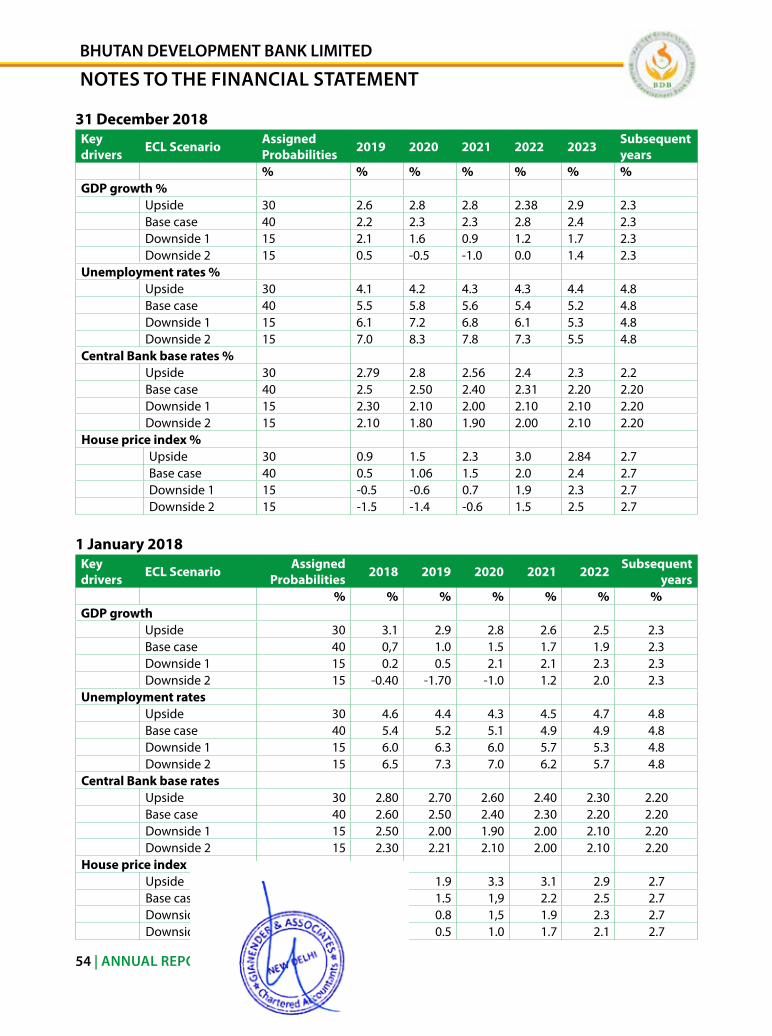
| 10 | BDB Annual Report 2017
sl # Particulars 2009 2013 2014 2015 2016 2017X No.of Depositors 15,879 85,864 109,005 133,366 159,576 178,386
Main Branch 657 4821 6,322 8,436 11,186 15,101 BranchOffice 15,222 81,043 102,683 124,930 148,390 163,285
XI Number of Employess 221 357 385 416 452 563HeadOffice 66 110 125 117 144 152Main Branch 29 28 30 31 39 45BranchOffice 126 219 230 268 269 366
XII ActiveClients/EmployeeRatioMain Branch 90 112 111 120 107 101BranchOffice 137 172 187 181 193 144
XII Loans/EmployeeRatio 13 24 28 33 37 33Main Branch 62 142 153 169 153 152BranchOffice 8 21 27 32 39 33
54 | ANNUAL REPORT 2018
31 December 2018Key drivers ECL Scenario Assigned
Probabilities 2019 2020 2021 2022 2023 Subsequent years
% % % % % % %GDP growth %
upside 30 2.6 2.8 2.8 2.38 2.9 2.3Base case 40 2.2 2.3 2.3 2.8 2.4 2.3Downside 1 15 2.1 1.6 0.9 1.2 1.7 2.3Downside 2 15 0.5 -0.5 -1.0 0.0 1.4 2.3
Unemployment rates %upside 30 4.1 4.2 4.3 4.3 4.4 4.8Base case 40 5.5 5.8 5.6 5.4 5.2 4.8Downside 1 15 6.1 7.2 6.8 6.1 5.3 4.8Downside 2 15 7.0 8.3 7.8 7.3 5.5 4.8
Central Bank base rates %upside 30 2.79 2.8 2.56 2.4 2.3 2.2Base case 40 2.5 2.50 2.40 2.31 2.20 2.20Downside 1 15 2.30 2.10 2.00 2.10 2.10 2.20Downside 2 15 2.10 1.80 1.90 2.00 2.10 2.20
House price index %upside 30 0.9 1.5 2.3 3.0 2.84 2.7Base case 40 0.5 1.06 1.5 2.0 2.4 2.7Downside 1 15 -0.5 -0.6 0.7 1.9 2.3 2.7Downside 2 15 -1.5 -1.4 -0.6 1.5 2.5 2.7
1 January 2018Key drivers ECL Scenario Assigned
Probabilities 2018 2019 2020 2021 2022 Subsequent years
% % % % % % %GDP growth
upside 30 3.1 2.9 2.8 2.6 2.5 2.3Base case 40 0,7 1.0 1.5 1.7 1.9 2.3Downside 1 15 0.2 0.5 2.1 2.1 2.3 2.3Downside 2 15 -0.40 -1.70 -1.0 1.2 2.0 2.3
Unemployment ratesupside 30 4.6 4.4 4.3 4.5 4.7 4.8Base case 40 5.4 5.2 5.1 4.9 4.9 4.8Downside 1 15 6.0 6.3 6.0 5.7 5.3 4.8Downside 2 15 6.5 7.3 7.0 6.2 5.7 4.8
Central Bank base ratesupside 30 2.80 2.70 2.60 2.40 2.30 2.20Base case 40 2.60 2.50 2.40 2.30 2.20 2.20Downside 1 15 2.50 2.00 1.90 2.00 2.10 2.20Downside 2 15 2.30 2.21 2.10 2.00 2.10 2.20
House price indexupside 30 1.4 1.9 3.3 3.1 2.9 2.7Base case 40 1.0 1.5 1,9 2.2 2.5 2.7Downside 1 15 0.0 0.8 1,5 1.9 2.3 2.7Downside 2 15 -0.5 0.5 1.0 1.7 2.1 2.7
| 10 | BDB Annual Report 2017
sl # Particulars 2009 2013 2014 2015 2016 2017X No.of Depositors 15,879 85,864 109,005 133,366 159,576 178,386
Main Branch 657 4821 6,322 8,436 11,186 15,101 BranchOffice 15,222 81,043 102,683 124,930 148,390 163,285
XI Number of Employess 221 357 385 416 452 563HeadOffice 66 110 125 117 144 152Main Branch 29 28 30 31 39 45BranchOffice 126 219 230 268 269 366
XII ActiveClients/EmployeeRatioMain Branch 90 112 111 120 107 101BranchOffice 137 172 187 181 193 144
XII Loans/EmployeeRatio 13 24 28 33 37 33Main Branch 62 142 153 169 153 152BranchOffice 8 21 27 32 39 33
BHUTAN DEVELOPMENT BANK LIMITED
NOTEs TO THE fINANCIAL sTATEMENT
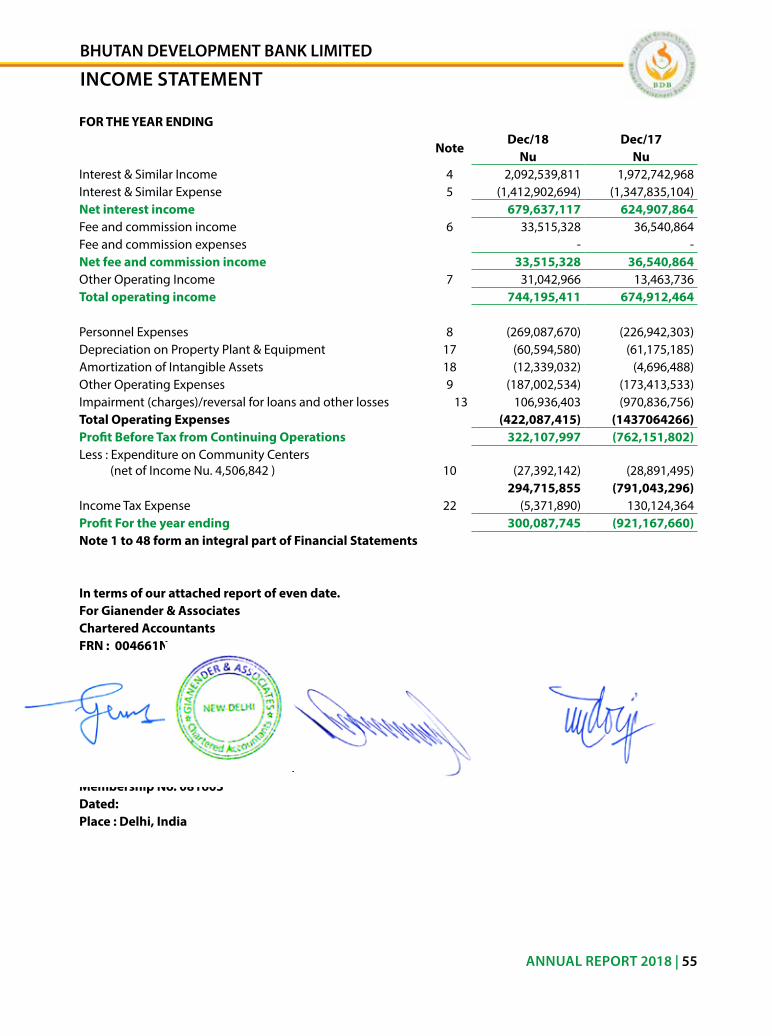
| 10 | BDB Annual Report 2017
sl # Particulars 2009 2013 2014 2015 2016 2017X No.of Depositors 15,879 85,864 109,005 133,366 159,576 178,386
Main Branch 657 4821 6,322 8,436 11,186 15,101 BranchOffice 15,222 81,043 102,683 124,930 148,390 163,285
XI Number of Employess 221 357 385 416 452 563HeadOffice 66 110 125 117 144 152Main Branch 29 28 30 31 39 45BranchOffice 126 219 230 268 269 366
XII ActiveClients/EmployeeRatioMain Branch 90 112 111 120 107 101BranchOffice 137 172 187 181 193 144
XII Loans/EmployeeRatio 13 24 28 33 37 33Main Branch 62 142 153 169 153 152BranchOffice 8 21 27 32 39 33
ANNUAL REPORT 2018 | 55
FOR THE YEAR ENDING
NoteDec/18 Dec/17
Nu Nuinterest & similar income 4 2,092,539,811 1,972,742,968 interest & similar expense 5 (1,412,902,694) (1,347,835,104)Net interest income 679,637,117 624,907,864 Fee and commission income 6 33,515,328 36,540,864 Fee and commission expenses - - Net fee and commission income 33,515,328 36,540,864 other operating income 7 31,042,966 13,463,736 Total operating income 744,195,411 674,912,464
Personnel expenses 8 (269,087,670) (226,942,303)Depreciation on Property Plant & equipment 17 (60,594,580) (61,175,185)amortization of intangible assets 18 (12,339,032) (4,696,488)other operating expenses 9 (187,002,534) (173,413,533)impairment (charges)/reversal for loans and other losses 13 106,936,403 (970,836,756)Total Operating Expenses (422,087,415) (1437064266)Profit Before Tax from Continuing Operations 322,107,997 (762,151,802)less : expenditure on Community Centers (net of income nu. 4,506,842 ) 10 (27,392,142) (28,891,495)
294,715,855 (791,043,296)income Tax expense 22 (5,371,890) 130,124,364 Profit For the year ending 300,087,745 (921,167,660)Note 1 to 48 form an integral part of Financial Statements
In terms of our attached report of even date.For Gianender & AssociatesChartered AccountantsFRN : 004661N
G.K. Agrawal Chief Executive Officer ChairmanPartnerMembership No. 081603Dated:Place : Delhi, India
| 10 | BDB Annual Report 2017
sl # Particulars 2009 2013 2014 2015 2016 2017X No.of Depositors 15,879 85,864 109,005 133,366 159,576 178,386
Main Branch 657 4821 6,322 8,436 11,186 15,101 BranchOffice 15,222 81,043 102,683 124,930 148,390 163,285
XI Number of Employess 221 357 385 416 452 563HeadOffice 66 110 125 117 144 152Main Branch 29 28 30 31 39 45BranchOffice 126 219 230 268 269 366
XII ActiveClients/EmployeeRatioMain Branch 90 112 111 120 107 101BranchOffice 137 172 187 181 193 144
XII Loans/EmployeeRatio 13 24 28 33 37 33Main Branch 62 142 153 169 153 152BranchOffice 8 21 27 32 39 33
BHUTAN DEVELOPMENT BANK LIMITED
INCOME sTATEMENT
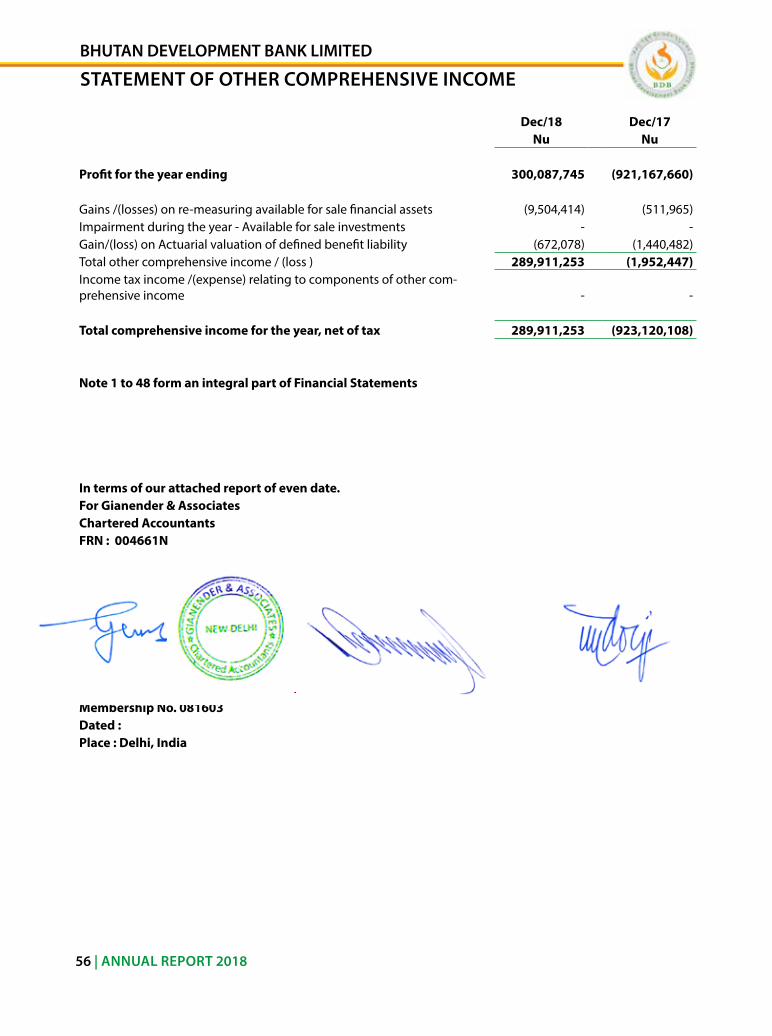
| 10 | BDB Annual Report 2017
sl # Particulars 2009 2013 2014 2015 2016 2017X No.of Depositors 15,879 85,864 109,005 133,366 159,576 178,386
Main Branch 657 4821 6,322 8,436 11,186 15,101 BranchOffice 15,222 81,043 102,683 124,930 148,390 163,285
XI Number of Employess 221 357 385 416 452 563HeadOffice 66 110 125 117 144 152Main Branch 29 28 30 31 39 45BranchOffice 126 219 230 268 269 366
XII ActiveClients/EmployeeRatioMain Branch 90 112 111 120 107 101BranchOffice 137 172 187 181 193 144
XII Loans/EmployeeRatio 13 24 28 33 37 33Main Branch 62 142 153 169 153 152BranchOffice 8 21 27 32 39 33
56 | ANNUAL REPORT 2018
Dec/18 Dec/17Nu Nu
Profit for the year ending 300,087,745 (921,167,660)
Gains /(losses) on re-measuring available for sale financial assets (9,504,414) (511,965)impairment during the year - available for sale investments - - Gain/(loss) on actuarial valuation of defined benefit liability (672,078) (1,440,482)Total other comprehensive income / (loss ) 289,911,253 (1,952,447)income tax income /(expense) relating to components of other com-prehensive income - -
Total comprehensive income for the year, net of tax 289,911,253 (923,120,108)
Note 1 to 48 form an integral part of Financial Statements
In terms of our attached report of even date.For Gianender & AssociatesChartered AccountantsFRN : 004661N
G.K.Aggrawal Chief Executive Officer ChairmanPartnerMembership No. 081603Dated :Place : Delhi, India
| 10 | BDB Annual Report 2017
sl # Particulars 2009 2013 2014 2015 2016 2017X No.of Depositors 15,879 85,864 109,005 133,366 159,576 178,386
Main Branch 657 4821 6,322 8,436 11,186 15,101 BranchOffice 15,222 81,043 102,683 124,930 148,390 163,285
XI Number of Employess 221 357 385 416 452 563HeadOffice 66 110 125 117 144 152Main Branch 29 28 30 31 39 45BranchOffice 126 219 230 268 269 366
XII ActiveClients/EmployeeRatioMain Branch 90 112 111 120 107 101BranchOffice 137 172 187 181 193 144
XII Loans/EmployeeRatio 13 24 28 33 37 33Main Branch 62 142 153 169 153 152BranchOffice 8 21 27 32 39 33
BHUTAN DEVELOPMENT BANK LIMITED
sTATEMENT Of OTHER COMPREHENsIVE INCOME
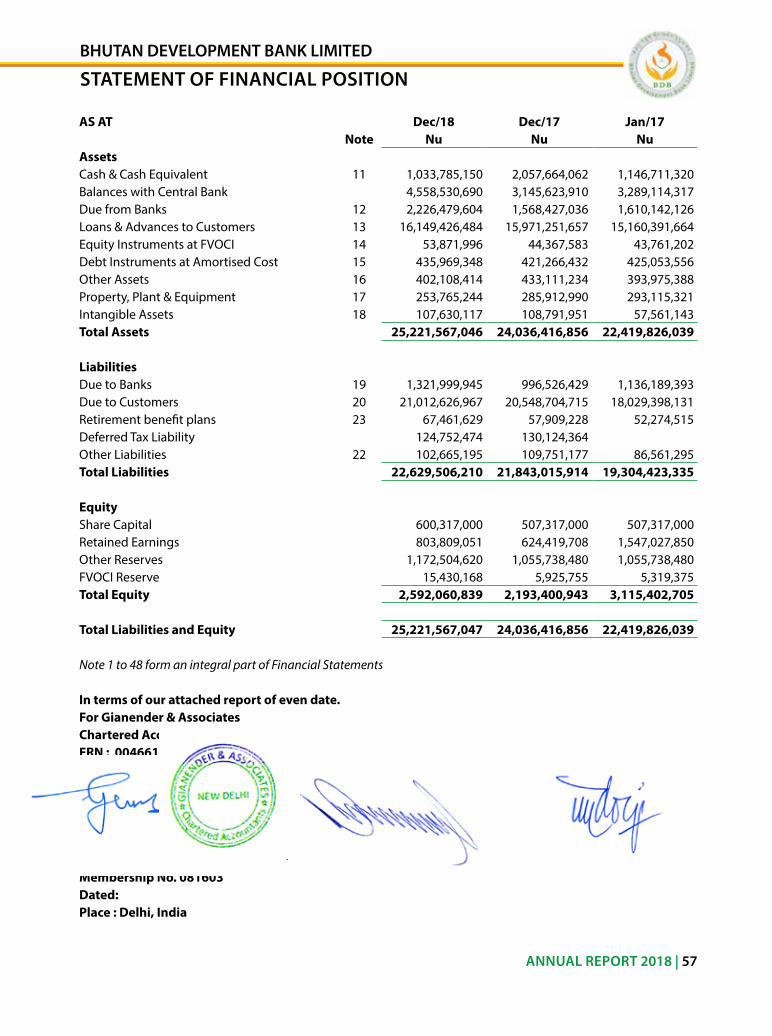
| 10 | BDB Annual Report 2017
sl # Particulars 2009 2013 2014 2015 2016 2017X No.of Depositors 15,879 85,864 109,005 133,366 159,576 178,386
Main Branch 657 4821 6,322 8,436 11,186 15,101 BranchOffice 15,222 81,043 102,683 124,930 148,390 163,285
XI Number of Employess 221 357 385 416 452 563HeadOffice 66 110 125 117 144 152Main Branch 29 28 30 31 39 45BranchOffice 126 219 230 268 269 366
XII ActiveClients/EmployeeRatioMain Branch 90 112 111 120 107 101BranchOffice 137 172 187 181 193 144
XII Loans/EmployeeRatio 13 24 28 33 37 33Main Branch 62 142 153 169 153 152BranchOffice 8 21 27 32 39 33
ANNUAL REPORT 2018 | 57
AS AT Dec/18 Dec/17 Jan/17Note Nu Nu Nu
AssetsCash & Cash equivalent 11 1,033,785,150 2,057,664,062 1,146,711,320 Balances with Central Bank 4,558,530,690 3,145,623,910 3,289,114,317 Due from Banks 12 2,226,479,604 1,568,427,036 1,610,142,126 loans & advances to Customers 13 16,149,426,484 15,971,251,657 15,160,391,664 equity instruments at FVoCi 14 53,871,996 44,367,583 43,761,202 Debt instruments at amortised Cost 15 435,969,348 421,266,432 425,053,556 other assets 16 402,108,414 433,111,234 393,975,388 Property, Plant & equipment 17 253,765,244 285,912,990 293,115,321 intangible assets 18 107,630,117 108,791,951 57,561,143 Total Assets 25,221,567,046 24,036,416,856 22,419,826,039
LiabilitiesDue to Banks 19 1,321,999,945 996,526,429 1,136,189,393 Due to Customers 20 21,012,626,967 20,548,704,715 18,029,398,131 retirement benefit plans 23 67,461,629 57,909,228 52,274,515 Deferred Tax liability 124,752,474 130,124,364 other liabilities 22 102,665,195 109,751,177 86,561,295 Total Liabilities 22,629,506,210 21,843,015,914 19,304,423,335
Equity share Capital 600,317,000 507,317,000 507,317,000 retained earnings 803,809,051 624,419,708 1,547,027,850 other reserves 1,172,504,620 1,055,738,480 1,055,738,480 FVoCi reserve 15,430,168 5,925,755 5,319,375 Total Equity 2,592,060,839 2,193,400,943 3,115,402,705
Total Liabilities and Equity 25,221,567,047 24,036,416,856 22,419,826,039
Note 1 to 48 form an integral part of Financial Statements
In terms of our attached report of even date.For Gianender & AssociatesChartered AccountantsFRN : 004661N
G.K. Agrawal Chief Executive Officer ChairmanPartnerMembership No. 081603Dated:Place : Delhi, India
| 10 | BDB Annual Report 2017
sl # Particulars 2009 2013 2014 2015 2016 2017X No.of Depositors 15,879 85,864 109,005 133,366 159,576 178,386
Main Branch 657 4821 6,322 8,436 11,186 15,101 BranchOffice 15,222 81,043 102,683 124,930 148,390 163,285
XI Number of Employess 221 357 385 416 452 563HeadOffice 66 110 125 117 144 152Main Branch 29 28 30 31 39 45BranchOffice 126 219 230 268 269 366
XII ActiveClients/EmployeeRatioMain Branch 90 112 111 120 107 101BranchOffice 137 172 187 181 193 144
XII Loans/EmployeeRatio 13 24 28 33 37 33Main Branch 62 142 153 169 153 152BranchOffice 8 21 27 32 39 33
BHUTAN DEVELOPMENT BANK LIMITED
sTATEMENT Of fINANCIAL POsITION
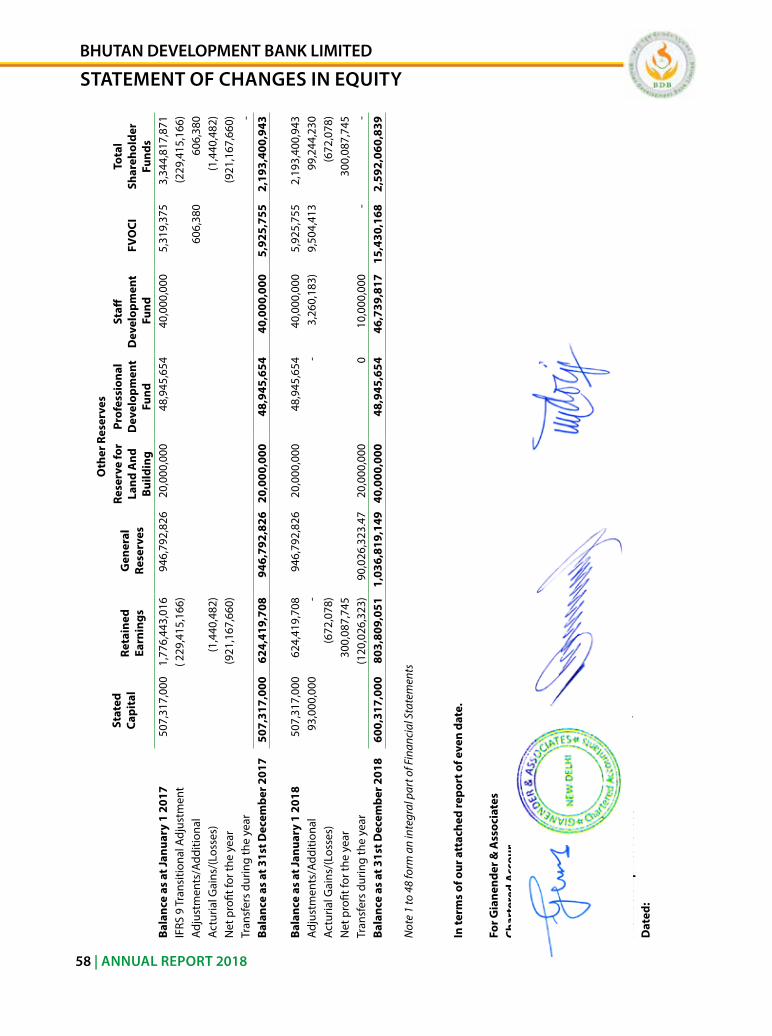
| 10 | BDB Annual Report 2017
sl # Particulars 2009 2013 2014 2015 2016 2017X No.of Depositors 15,879 85,864 109,005 133,366 159,576 178,386
Main Branch 657 4821 6,322 8,436 11,186 15,101 BranchOffice 15,222 81,043 102,683 124,930 148,390 163,285
XI Number of Employess 221 357 385 416 452 563HeadOffice 66 110 125 117 144 152Main Branch 29 28 30 31 39 45BranchOffice 126 219 230 268 269 366
XII ActiveClients/EmployeeRatioMain Branch 90 112 111 120 107 101BranchOffice 137 172 187 181 193 144
XII Loans/EmployeeRatio 13 24 28 33 37 33Main Branch 62 142 153 169 153 152BranchOffice 8 21 27 32 39 33
58 | ANNUAL REPORT 2018
Stat
ed
Capi
tal
Oth
er R
eser
ves
Reta
ined
Ea
rnin
gsG
ener
al
Rese
rves
Rese
rve
for
Land
And
Bu
ildin
g
Prof
essi
onal
D
evel
opm
ent
Fund
Staff
D
evel
opm
ent
Fun
dFV
OCI
Tota
l Sh
areh
olde
r Fu
nds
Bala
nce
as a
t Jan
uary
1 2
017
507,
317,
000
1,77
6,44
3,01
6 94
6,79
2,82
6 20
,000
,000
48
,945
,654
40
,000
,000
5,
319,
375
3,34
4,81
7,87
1 iF
rs 9
Tra
nsiti
onal
adj
ustm
ent
( 22
9,41
5,16
6)(2
29,4
15,1
66)
adju
stm
ents
/add
ition
al60
6,38
0
606,
380
actu
rial G
ains
/(lo
sses
)(1
,440
,482
)(1
,440
,482
)n
et p
rofit
for t
he y
ear
(921
,167
,660
)(9
21,1
67,6
60)
Tran
sfer
s du
ring
the
year
-
Ba
lanc
e as
at 3
1st D
ecem
ber 2
017
507,
317,
000
624,
419,
708
946,
792,
826
20,0
00,0
00
48,9
45,6
54
40,0
00,0
00
5,92
5,75
5 2,
193,
400,
943
Bala
nce
as a
t Jan
uary
1 2
018
507,
317,
000
624
,419
,708
94
6,79
2,82
6 20
,000
,000
48
,945
,654
40
,000
,000
5,
925,
755
2,19
3,40
0,94
3 ad
just
men
ts/a
dditi
onal
93,0
00,0
00
-
- 3,
260,
183)
9,50
4,41
3
99
,244
,230
ac
turia
l Gai
ns/(
loss
es)
(672
,078
)(6
72,0
78)
net
pro
fit fo
r the
yea
r30
0,08
7,74
5 3
00,0
87,7
45
Tran
sfer
s du
ring
the
year
(120
,026
,323
)90
,026
,323
.47
20,0
00,0
00
010
,000
,000
-
-
Ba
lanc
e as
at 3
1st D
ecem
ber 2
018
600,
317,
000
803
,809
,051
1
,036
,819
,149
40
,000
,000
48
,945
,654
46
,739
,817
15
,430
,168
2,
592,
060,
839
Not
e 1
to 4
8 fo
rm a
n in
tegr
al p
art o
f Fin
anci
al S
tate
men
ts
In te
rms
of o
ur a
ttac
hed
repo
rt o
f eve
n da
te.
For G
iane
nder
& A
ssoc
iate
sCh
arte
red
Acc
ount
ants
FRN
: 0
0466
1N
G.K
. Agr
awal
Chie
f Exe
cuti
ve O
ffice
rCh
airm
anPa
rtne
rM
embe
rshi
p N
o. 0
8160
3D
ated
:
| 10 | BDB Annual Report 2017
sl # Particulars 2009 2013 2014 2015 2016 2017X No.of Depositors 15,879 85,864 109,005 133,366 159,576 178,386
Main Branch 657 4821 6,322 8,436 11,186 15,101 BranchOffice 15,222 81,043 102,683 124,930 148,390 163,285
XI Number of Employess 221 357 385 416 452 563HeadOffice 66 110 125 117 144 152Main Branch 29 28 30 31 39 45BranchOffice 126 219 230 268 269 366
XII ActiveClients/EmployeeRatioMain Branch 90 112 111 120 107 101BranchOffice 137 172 187 181 193 144
XII Loans/EmployeeRatio 13 24 28 33 37 33Main Branch 62 142 153 169 153 152BranchOffice 8 21 27 32 39 33
BHUTAN DEVELOPMENT BANK LIMITED
sTATEMENT Of CHANgEs IN EQUITy
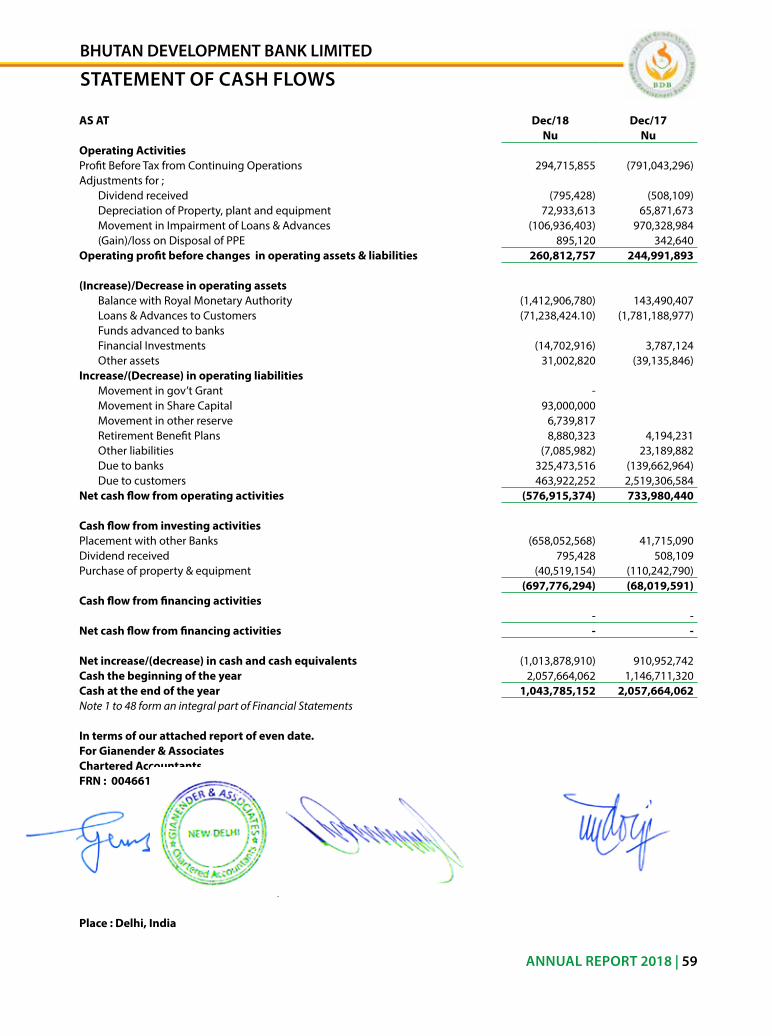
| 10 | BDB Annual Report 2017
sl # Particulars 2009 2013 2014 2015 2016 2017X No.of Depositors 15,879 85,864 109,005 133,366 159,576 178,386
Main Branch 657 4821 6,322 8,436 11,186 15,101 BranchOffice 15,222 81,043 102,683 124,930 148,390 163,285
XI Number of Employess 221 357 385 416 452 563HeadOffice 66 110 125 117 144 152Main Branch 29 28 30 31 39 45BranchOffice 126 219 230 268 269 366
XII ActiveClients/EmployeeRatioMain Branch 90 112 111 120 107 101BranchOffice 137 172 187 181 193 144
XII Loans/EmployeeRatio 13 24 28 33 37 33Main Branch 62 142 153 169 153 152BranchOffice 8 21 27 32 39 33
ANNUAL REPORT 2018 | 59
AS AT Dec/18 Dec/17Nu Nu
Operating ActivitiesProfit Before Tax from Continuing operations 294,715,855 (791,043,296)adjustments for ;
Dividend received (795,428) (508,109)Depreciation of Property, plant and equipment 72,933,613 65,871,673 Movement in impairment of loans & advances (106,936,403) 970,328,984 (Gain)/loss on Disposal of PPe 895,120 342,640
Operating profit before changes in operating assets & liabilities 260,812,757 244,991,893
(Increase)/Decrease in operating assetsBalance with royal Monetary authority (1,412,906,780) 143,490,407 loans & advances to Customers (71,238,424.10) (1,781,188,977)Funds advanced to banksFinancial investments (14,702,916) 3,787,124 other assets 31,002,820 (39,135,846)
Increase/(Decrease) in operating liabilitiesMovement in gov’t Grant - Movement in share Capital 93,000,000 Movement in other reserve 6,739,817 retirement Benefit Plans 8,880,323 4,194,231 other liabilities (7,085,982) 23,189,882 Due to banks 325,473,516 (139,662,964)Due to customers 463,922,252 2,519,306,584
Net cash flow from operating activities (576,915,374) 733,980,440
Cash flow from investing activitiesPlacement with other Banks (658,052,568) 41,715,090 Dividend received 795,428 508,109 Purchase of property & equipment (40,519,154) (110,242,790)
(697,776,294) (68,019,591)Cash flow from financing activities
- -Net cash flow from financing activities - -
Net increase/(decrease) in cash and cash equivalents (1,013,878,910) 910,952,742 Cash the beginning of the year 2,057,664,062 1,146,711,320 Cash at the end of the year 1,043,785,152 2,057,664,062 Note 1 to 48 form an integral part of Financial Statements
In terms of our attached report of even date.For Gianender & AssociatesChartered AccountantsFRN : 004661N
G.K.Agrawal Chief Executive Officer ChairmanPartnerMembership No. 081603Dated:Place : Delhi, India
| 10 | BDB Annual Report 2017
sl # Particulars 2009 2013 2014 2015 2016 2017X No.of Depositors 15,879 85,864 109,005 133,366 159,576 178,386
Main Branch 657 4821 6,322 8,436 11,186 15,101 BranchOffice 15,222 81,043 102,683 124,930 148,390 163,285
XI Number of Employess 221 357 385 416 452 563HeadOffice 66 110 125 117 144 152Main Branch 29 28 30 31 39 45BranchOffice 126 219 230 268 269 366
XII ActiveClients/EmployeeRatioMain Branch 90 112 111 120 107 101BranchOffice 137 172 187 181 193 144
XII Loans/EmployeeRatio 13 24 28 33 37 33Main Branch 62 142 153 169 153 152BranchOffice 8 21 27 32 39 33
BHUTAN DEVELOPMENT BANK LIMITED
sTATEMENT Of CAsH fLOWs
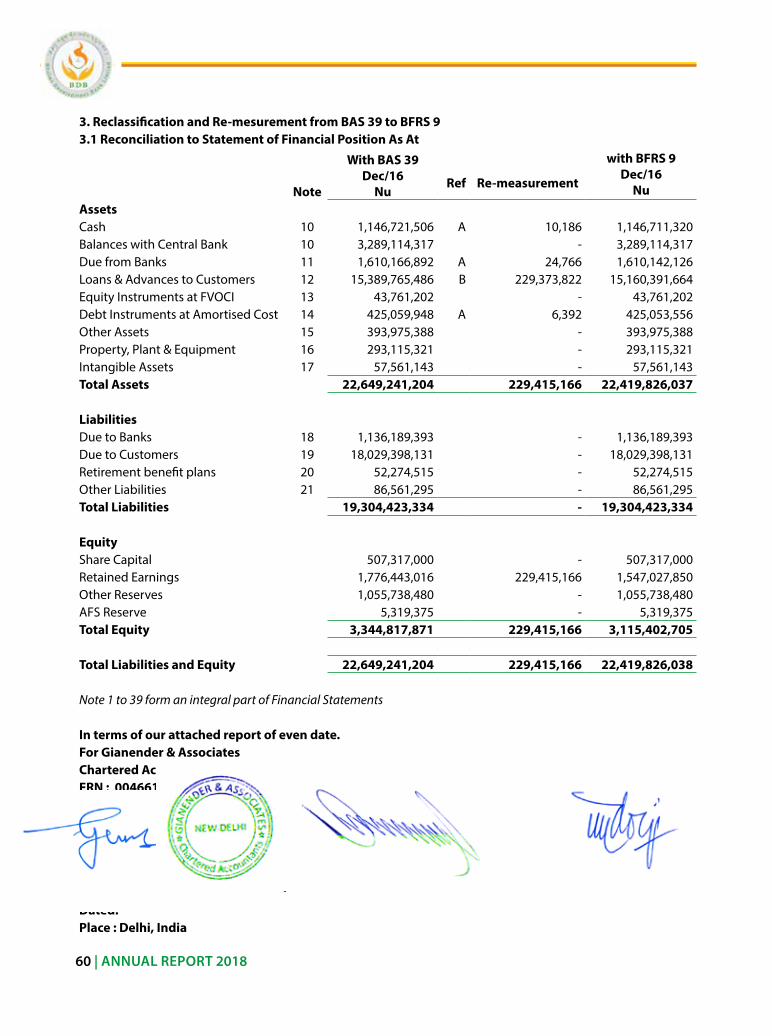
| 10 | BDB Annual Report 2017
sl # Particulars 2009 2013 2014 2015 2016 2017X No.of Depositors 15,879 85,864 109,005 133,366 159,576 178,386
Main Branch 657 4821 6,322 8,436 11,186 15,101 BranchOffice 15,222 81,043 102,683 124,930 148,390 163,285
XI Number of Employess 221 357 385 416 452 563HeadOffice 66 110 125 117 144 152Main Branch 29 28 30 31 39 45BranchOffice 126 219 230 268 269 366
XII ActiveClients/EmployeeRatioMain Branch 90 112 111 120 107 101BranchOffice 137 172 187 181 193 144
XII Loans/EmployeeRatio 13 24 28 33 37 33Main Branch 62 142 153 169 153 152BranchOffice 8 21 27 32 39 33
60 | ANNUAL REPORT 2018
3. Reclassification and Re-mesurement from BAS 39 to BFRS 93.1 Reconciliation to Statement of Financial Position As At
With BAS 39Dec/16
Nu
with BFRS 9Dec/16
NuRef Re-measurementNote
AssetsCash 10 1,146,721,506 a 10,186 1,146,711,320 Balances with Central Bank 10 3,289,114,317 - 3,289,114,317 Due from Banks 11 1,610,166,892 a 24,766 1,610,142,126 loans & advances to Customers 12 15,389,765,486 B 229,373,822 15,160,391,664 equity instruments at FVoCi 13 43,761,202 - 43,761,202 Debt instruments at amortised Cost 14 425,059,948 a 6,392 425,053,556 other assets 15 393,975,388 - 393,975,388 Property, Plant & equipment 16 293,115,321 - 293,115,321 intangible assets 17 57,561,143 - 57,561,143 Total Assets 22,649,241,204 229,415,166 22,419,826,037
LiabilitiesDue to Banks 18 1,136,189,393 - 1,136,189,393 Due to Customers 19 18,029,398,131 - 18,029,398,131 retirement benefit plans 20 52,274,515 - 52,274,515 other liabilities 21 86,561,295 - 86,561,295 Total Liabilities 19,304,423,334 - 19,304,423,334
Equity share Capital 507,317,000 - 507,317,000 retained earnings 1,776,443,016 229,415,166 1,547,027,850 other reserves 1,055,738,480 - 1,055,738,480 aFs reserve 5,319,375 - 5,319,375 Total Equity 3,344,817,871 229,415,166 3,115,402,705
Total Liabilities and Equity 22,649,241,204 229,415,166 22,419,826,038
Note 1 to 39 form an integral part of Financial Statements
In terms of our attached report of even date.For Gianender & AssociatesChartered AccountantsFRN : 004661N
G.K. Agrawal Chief Executive Officer ChairmanPartnerMembership No. 081603Dated:Place : Delhi, India
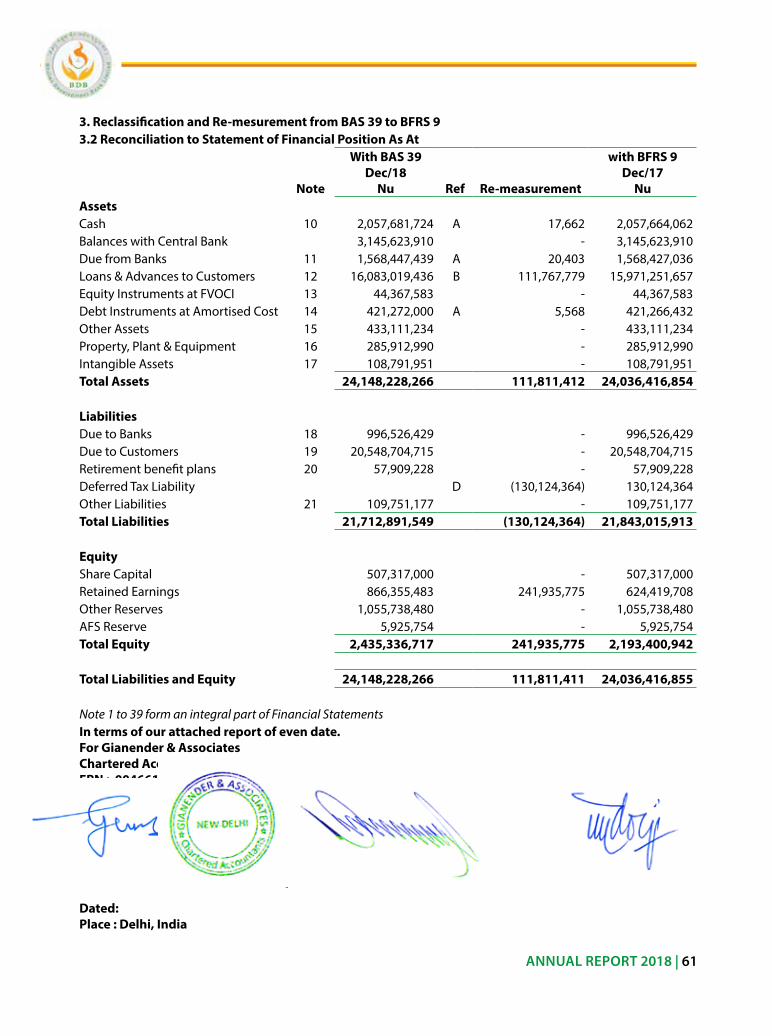
| 10 | BDB Annual Report 2017
sl # Particulars 2009 2013 2014 2015 2016 2017X No.of Depositors 15,879 85,864 109,005 133,366 159,576 178,386
Main Branch 657 4821 6,322 8,436 11,186 15,101 BranchOffice 15,222 81,043 102,683 124,930 148,390 163,285
XI Number of Employess 221 357 385 416 452 563HeadOffice 66 110 125 117 144 152Main Branch 29 28 30 31 39 45BranchOffice 126 219 230 268 269 366
XII ActiveClients/EmployeeRatioMain Branch 90 112 111 120 107 101BranchOffice 137 172 187 181 193 144
XII Loans/EmployeeRatio 13 24 28 33 37 33Main Branch 62 142 153 169 153 152BranchOffice 8 21 27 32 39 33
ANNUAL REPORT 2018 | 61
3. Reclassification and Re-mesurement from BAS 39 to BFRS 93.2 Reconciliation to Statement of Financial Position As At
Note
With BAS 39Dec/18
Nu Ref Re-measurement
with BFRS 9Dec/17
NuAssetsCash 10 2,057,681,724 a 17,662 2,057,664,062 Balances with Central Bank 3,145,623,910 - 3,145,623,910 Due from Banks 11 1,568,447,439 a 20,403 1,568,427,036 loans & advances to Customers 12 16,083,019,436 B 111,767,779 15,971,251,657 equity instruments at FVoCi 13 44,367,583 - 44,367,583 Debt instruments at amortised Cost 14 421,272,000 a 5,568 421,266,432 other assets 15 433,111,234 - 433,111,234 Property, Plant & equipment 16 285,912,990 - 285,912,990 intangible assets 17 108,791,951 - 108,791,951 Total Assets 24,148,228,266 111,811,412 24,036,416,854
LiabilitiesDue to Banks 18 996,526,429 - 996,526,429 Due to Customers 19 20,548,704,715 - 20,548,704,715 retirement benefit plans 20 57,909,228 - 57,909,228 Deferred Tax liability D (130,124,364) 130,124,364 other liabilities 21 109,751,177 - 109,751,177 Total Liabilities 21,712,891,549 (130,124,364) 21,843,015,913
Equity share Capital 507,317,000 - 507,317,000 retained earnings 866,355,483 241,935,775 624,419,708 other reserves 1,055,738,480 - 1,055,738,480 aFs reserve 5,925,754 - 5,925,754 Total Equity 2,435,336,717 241,935,775 2,193,400,942
Total Liabilities and Equity 24,148,228,266 111,811,411 24,036,416,855
Note 1 to 39 form an integral part of Financial StatementsIn terms of our attached report of even date.For Gianender & AssociatesChartered AccountantsFRN : 004661N
G.K. Agrawal Chief Executive Officer ChairmanPartnerMembership No. 081603Dated:Place : Delhi, India
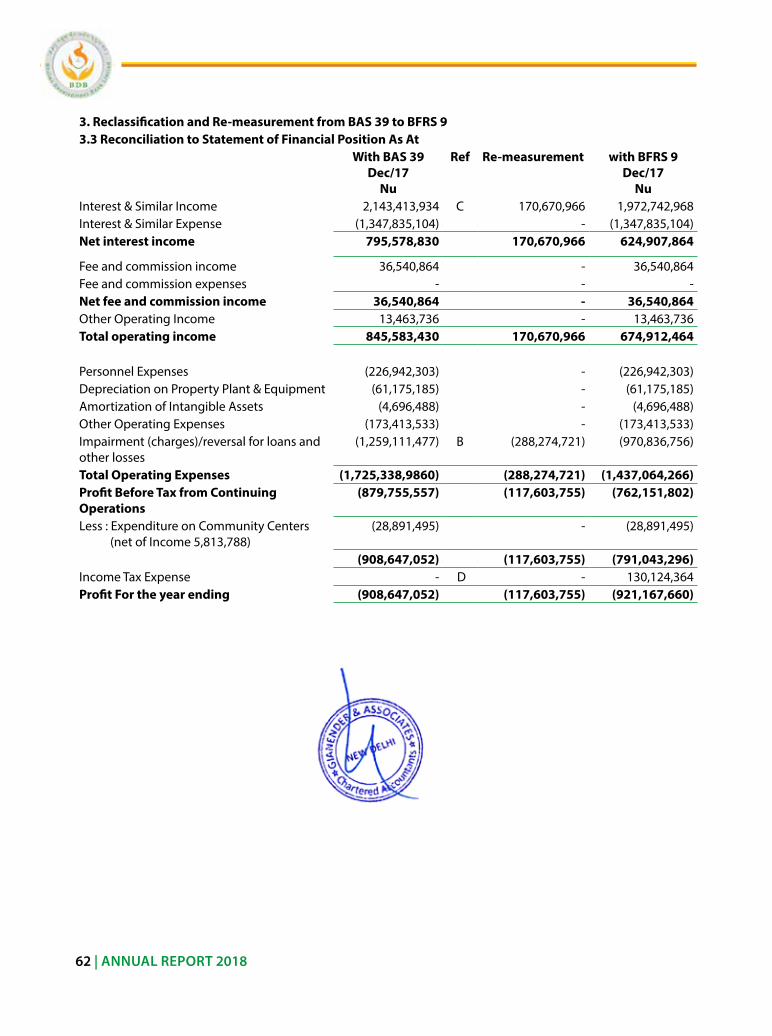
| 10 | BDB Annual Report 2017
sl # Particulars 2009 2013 2014 2015 2016 2017X No.of Depositors 15,879 85,864 109,005 133,366 159,576 178,386
Main Branch 657 4821 6,322 8,436 11,186 15,101 BranchOffice 15,222 81,043 102,683 124,930 148,390 163,285
XI Number of Employess 221 357 385 416 452 563HeadOffice 66 110 125 117 144 152Main Branch 29 28 30 31 39 45BranchOffice 126 219 230 268 269 366
XII ActiveClients/EmployeeRatioMain Branch 90 112 111 120 107 101BranchOffice 137 172 187 181 193 144
XII Loans/EmployeeRatio 13 24 28 33 37 33Main Branch 62 142 153 169 153 152BranchOffice 8 21 27 32 39 33
62 | ANNUAL REPORT 2018
3. Reclassification and Re-measurement from BAS 39 to BFRS 93.3 Reconciliation to Statement of Financial Position As At
With BAS 39Dec/17
Nu
Ref Re-measurement with BFRS 9Dec/17
Nuinterest & similar income 2,143,413,934 C 170,670,966 1,972,742,968 interest & similar expense (1,347,835,104) - (1,347,835,104)Net interest income 795,578,830 170,670,966 624,907,864
Fee and commission income 36,540,864 - 36,540,864 Fee and commission expenses - - - Net fee and commission income 36,540,864 - 36,540,864 other operating income 13,463,736 - 13,463,736 Total operating income 845,583,430 170,670,966 674,912,464
Personnel expenses (226,942,303) - (226,942,303)Depreciation on Property Plant & equipment (61,175,185) - (61,175,185)amortization of intangible assets (4,696,488) - (4,696,488)other operating expenses (173,413,533) - (173,413,533)impairment (charges)/reversal for loans and other losses
(1,259,111,477) B (288,274,721) (970,836,756)
Total Operating Expenses (1,725,338,9860) (288,274,721) (1,437,064,266)Profit Before Tax from Continuing Operations
(879,755,557) (117,603,755) (762,151,802)
less : expenditure on Community Centers (net of income 5,813,788)
(28,891,495) - (28,891,495)
(908,647,052) (117,603,755) (791,043,296)income Tax expense - D - 130,124,364 Profit For the year ending (908,647,052) (117,603,755) (921,167,660)
| 10 | BDB Annual Report 2017
sl # Particulars 2009 2013 2014 2015 2016 2017X No.of Depositors 15,879 85,864 109,005 133,366 159,576 178,386
Main Branch 657 4821 6,322 8,436 11,186 15,101 BranchOffice 15,222 81,043 102,683 124,930 148,390 163,285
XI Number of Employess 221 357 385 416 452 563HeadOffice 66 110 125 117 144 152Main Branch 29 28 30 31 39 45BranchOffice 126 219 230 268 269 366
XII ActiveClients/EmployeeRatioMain Branch 90 112 111 120 107 101BranchOffice 137 172 187 181 193 144
XII Loans/EmployeeRatio 13 24 28 33 37 33Main Branch 62 142 153 169 153 152BranchOffice 8 21 27 32 39 33
ANNUAL REPORT 2018 | 63
Notes to the Reconciliation of Statement of Financial Position as at 31st December, 2016 &2017 and Statement of Comprehensive income as on 31st December, 2017.
a. all the Financial assets measured at Fair value through other Comprehensive income (except investment in equity share) & amortized cost shall be subjected to impairment assessment under BFrs 9 Financial instrument.
b. The adoption of BFrs 9 has fundamentally changed the Bank’s accounting for loan loss impairment by replacing Bas 39’s incurred loss approach with a forward- looking expected credit loss (eCl) approach. BFrs requires the Bank to record all impairment allowances for eCls for all loans together with loan commitments and financial guarantee contracts.
c. under BFrs 9, unlike Bas 39, when the financial asset becomes credit impaired and categorize as stage 3, the interest accrual ceases. if the financial assets cure and is no longer under stage 3, then the Bank reverts to calculate income.
d. The various transitional adjustments lead to different temporary differences. according to the accounting policies the Bank has to account for such differences. Deferred tax adjustments are recognized in correlation to the underlying transaction either in retained earnings or a separate component of equity as per Bas 12 income.
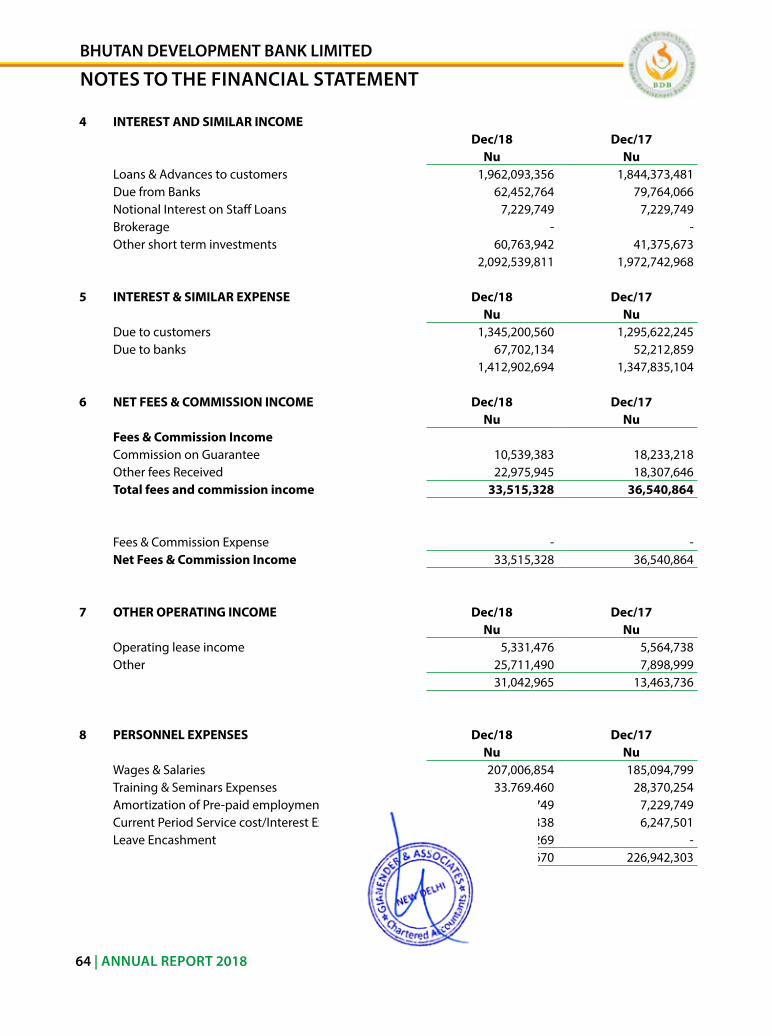
| 10 | BDB Annual Report 2017
sl # Particulars 2009 2013 2014 2015 2016 2017X No.of Depositors 15,879 85,864 109,005 133,366 159,576 178,386
Main Branch 657 4821 6,322 8,436 11,186 15,101 BranchOffice 15,222 81,043 102,683 124,930 148,390 163,285
XI Number of Employess 221 357 385 416 452 563HeadOffice 66 110 125 117 144 152Main Branch 29 28 30 31 39 45BranchOffice 126 219 230 268 269 366
XII ActiveClients/EmployeeRatioMain Branch 90 112 111 120 107 101BranchOffice 137 172 187 181 193 144
XII Loans/EmployeeRatio 13 24 28 33 37 33Main Branch 62 142 153 169 153 152BranchOffice 8 21 27 32 39 33
64 | ANNUAL REPORT 2018
4 INTEREST AND SIMILAR INCOMEDec/18 Dec/17
Nu Nuloans & advances to customers 1,962,093,356 1,844,373,481 Due from Banks 62,452,764 79,764,066 notional interest on staff loans 7,229,749 7,229,749 Brokerage - - other short term investments 60,763,942 41,375,673
2,092,539,811 1,972,742,968
5 INTEREST & SIMILAR EXPENSE Dec/18 Dec/17Nu Nu
Due to customers 1,345,200,560 1,295,622,245 Due to banks 67,702,134 52,212,859
1,412,902,694 1,347,835,104
6 NET FEES & COMMISSION INCOME Dec/18 Dec/17Nu Nu
Fees & Commission IncomeCommission on Guarantee 10,539,383 18,233,218 other fees received 22,975,945 18,307,646 Total fees and commission income 33,515,328 36,540,864
Fees & Commission expense - - Net Fees & Commission Income 33,515,328 36,540,864
7 OTHER OPERATING INCOME Dec/18 Dec/17Nu Nu
operating lease income 5,331,476 5,564,738 other 25,711,490 7,898,999
31,042,965 13,463,736
8 PERSONNEL EXPENSES Dec/18 Dec/17Nu Nu
Wages & salaries 207,006,854 185,094,799 Training & seminars expenses 33,769,460 28,370,254 amortization of Pre-paid employment benefits 7,229,749 7,229,749 Current Period service cost/interest expense 5,198,338 6,247,501 leave encashment 15,883,269 -
269,087,670 226,942,303 | 10 | BDB Annual Report 2017
sl # Particulars 2009 2013 2014 2015 2016 2017X No.of Depositors 15,879 85,864 109,005 133,366 159,576 178,386
Main Branch 657 4821 6,322 8,436 11,186 15,101 BranchOffice 15,222 81,043 102,683 124,930 148,390 163,285
XI Number of Employess 221 357 385 416 452 563HeadOffice 66 110 125 117 144 152Main Branch 29 28 30 31 39 45BranchOffice 126 219 230 268 269 366
XII ActiveClients/EmployeeRatioMain Branch 90 112 111 120 107 101BranchOffice 137 172 187 181 193 144
XII Loans/EmployeeRatio 13 24 28 33 37 33Main Branch 62 142 153 169 153 152BranchOffice 8 21 27 32 39 33
BHUTAN DEVELOPMENT BANK LIMITED
NOTEs TO THE fINANCIAL sTATEMENT
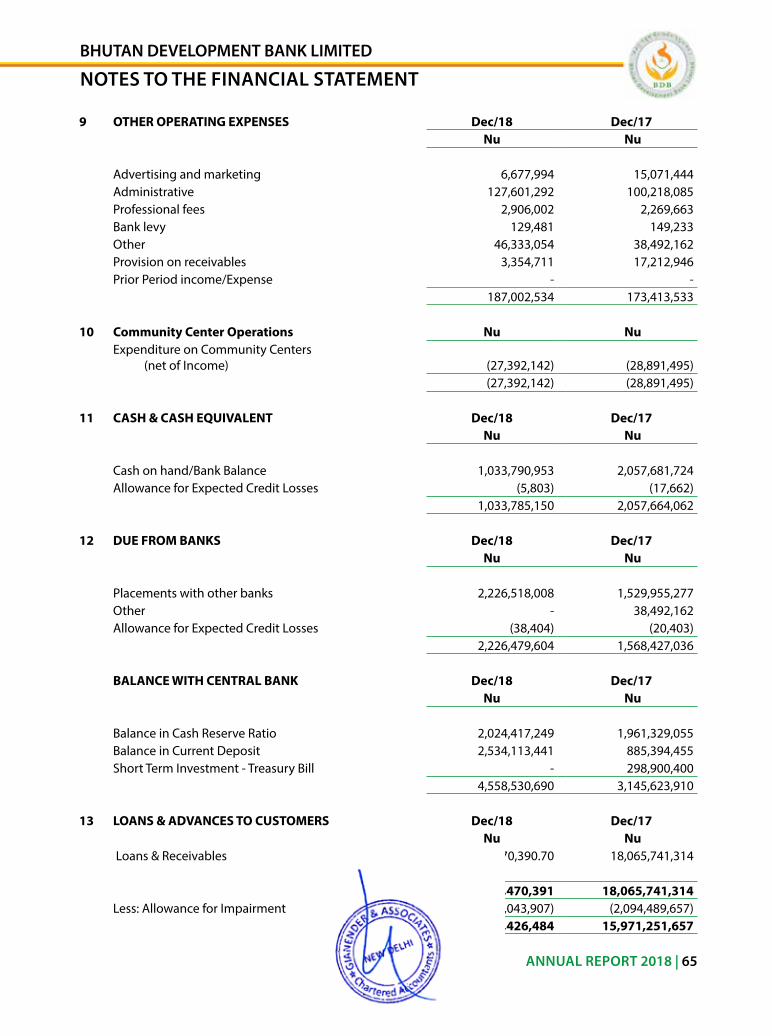
| 10 | BDB Annual Report 2017
sl # Particulars 2009 2013 2014 2015 2016 2017X No.of Depositors 15,879 85,864 109,005 133,366 159,576 178,386
Main Branch 657 4821 6,322 8,436 11,186 15,101 BranchOffice 15,222 81,043 102,683 124,930 148,390 163,285
XI Number of Employess 221 357 385 416 452 563HeadOffice 66 110 125 117 144 152Main Branch 29 28 30 31 39 45BranchOffice 126 219 230 268 269 366
XII ActiveClients/EmployeeRatioMain Branch 90 112 111 120 107 101BranchOffice 137 172 187 181 193 144
XII Loans/EmployeeRatio 13 24 28 33 37 33Main Branch 62 142 153 169 153 152BranchOffice 8 21 27 32 39 33
ANNUAL REPORT 2018 | 65
9 OTHER OPERATING EXPENSES Dec/18 Dec/17Nu Nu
advertising and marketing 6,677,994 15,071,444 administrative 127,601,292 100,218,085 Professional fees 2,906,002 2,269,663 Bank levy 129,481 149,233 other 46,333,054 38,492,162 Provision on receivables 3,354,711 17,212,946 Prior Period income/expense - -
187,002,534 173,413,533
10 Community Center Operations Nu Nu expenditure on Community Centers (net of income) (27,392,142) (28,891,495)
(27,392,142) (28,891,495)
11 CASH & CASH EQUIVALENT Dec/18 Dec/17Nu Nu
Cash on hand/Bank Balance 1,033,790,953 2,057,681,724 allowance for expected Credit losses (5,803) (17,662)
1,033,785,150 2,057,664,062
12 DUE FROM BANKS Dec/18 Dec/17Nu Nu
Placements with other banks 2,226,518,008 1,529,955,277 other - 38,492,162 allowance for expected Credit losses (38,404) (20,403)
2,226,479,604 1,568,427,036
BALANCE WITH CENTRAL BANK Dec/18 Dec/17Nu Nu
Balance in Cash reserve ratio 2,024,417,249 1,961,329,055 Balance in Current Deposit 2,534,113,441 885,394,455 short Term investment - Treasury Bill - 298,900,400
4,558,530,690 3,145,623,910
13 LOANS & ADVANCES TO CUSTOMERS Dec/18 Dec/17Nu Nu
loans & receivables 18,132,470,390.70 18,065,741,314
18,132,470,391 18,065,741,314 less: allowance for impairment (Collective) (1,983,043,907) (2,094,489,657)
16,149,426,484 15,971,251,657
| 10 | BDB Annual Report 2017
sl # Particulars 2009 2013 2014 2015 2016 2017X No.of Depositors 15,879 85,864 109,005 133,366 159,576 178,386
Main Branch 657 4821 6,322 8,436 11,186 15,101 BranchOffice 15,222 81,043 102,683 124,930 148,390 163,285
XI Number of Employess 221 357 385 416 452 563HeadOffice 66 110 125 117 144 152Main Branch 29 28 30 31 39 45BranchOffice 126 219 230 268 269 366
XII ActiveClients/EmployeeRatioMain Branch 90 112 111 120 107 101BranchOffice 137 172 187 181 193 144
XII Loans/EmployeeRatio 13 24 28 33 37 33Main Branch 62 142 153 169 153 152BranchOffice 8 21 27 32 39 33
BHUTAN DEVELOPMENT BANK LIMITED
NOTEs TO THE fINANCIAL sTATEMENT
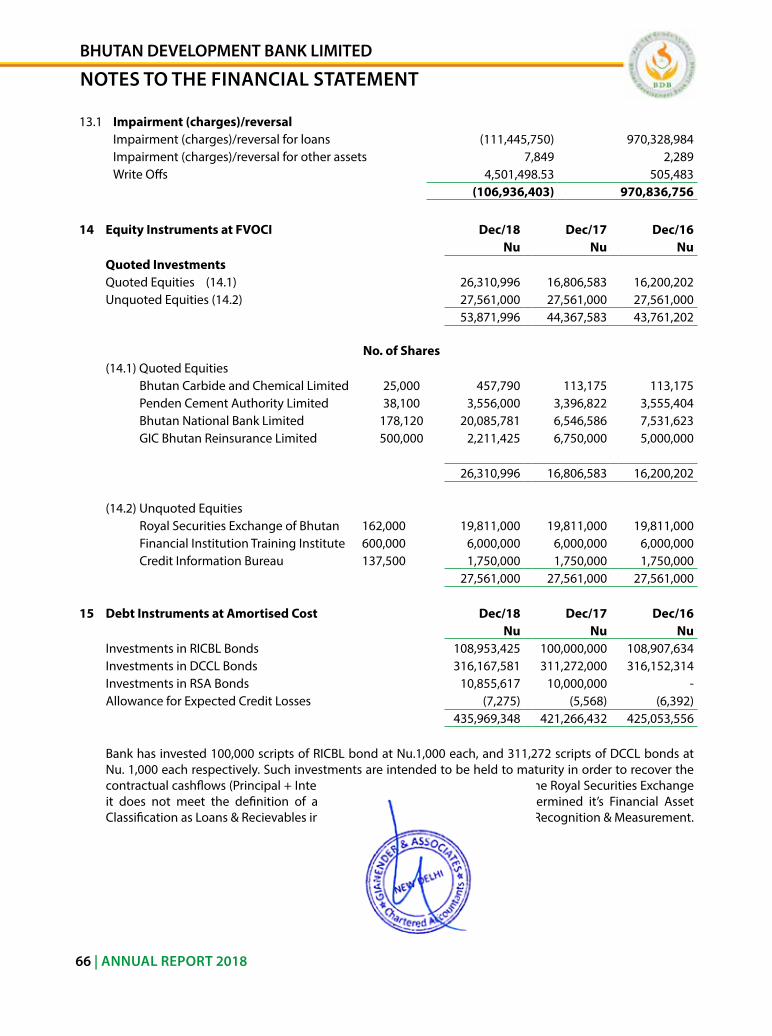
| 10 | BDB Annual Report 2017
sl # Particulars 2009 2013 2014 2015 2016 2017X No.of Depositors 15,879 85,864 109,005 133,366 159,576 178,386
Main Branch 657 4821 6,322 8,436 11,186 15,101 BranchOffice 15,222 81,043 102,683 124,930 148,390 163,285
XI Number of Employess 221 357 385 416 452 563HeadOffice 66 110 125 117 144 152Main Branch 29 28 30 31 39 45BranchOffice 126 219 230 268 269 366
XII ActiveClients/EmployeeRatioMain Branch 90 112 111 120 107 101BranchOffice 137 172 187 181 193 144
XII Loans/EmployeeRatio 13 24 28 33 37 33Main Branch 62 142 153 169 153 152BranchOffice 8 21 27 32 39 33
66 | ANNUAL REPORT 2018
13.1 Impairment (charges)/reversalimpairment (charges)/reversal for loans (111,445,750) 970,328,984 impairment (charges)/reversal for other assets 7,849 2,289 Write offs 4,501,498.53 505,483
(106,936,403) 970,836,756
14 Equity Instruments at FVOCI Dec/18 Dec/17 Dec/16Nu Nu Nu
Quoted InvestmentsQuoted equities (14.1) 26,310,996 16,806,583 16,200,202 unquoted equities (14.2) 27,561,000 27,561,000 27,561,000
53,871,996 44,367,583 43,761,202
No. of Shares(14.1) Quoted equities Bhutan Carbide and Chemical limited 25,000 457,790 113,175 113,175 Penden Cement authority limited 38,100 3,556,000 3,396,822 3,555,404 Bhutan national Bank limited 178,120 20,085,781 6,546,586 7,531,623 GiC Bhutan reinsurance limited 500,000 2,211,425 6,750,000 5,000,000
26,310,996 16,806,583 16,200,202
(14.2) unquoted equities royal securities exchange of Bhutan 162,000 19,811,000 19,811,000 19,811,000 Financial institution Training institute 600,000 6,000,000 6,000,000 6,000,000 Credit information Bureau 137,500 1,750,000 1,750,000 1,750,000
27,561,000 27,561,000 27,561,000
15 Debt Instruments at Amortised Cost Dec/18 Dec/17 Dec/16Nu Nu Nu
investments in riCBl Bonds 108,953,425 100,000,000 108,907,634 investments in DCCl Bonds 316,167,581 311,272,000 316,152,314 investments in rsa Bonds 10,855,617 10,000,000 - allowance for expected Credit losses (7,275) (5,568) (6,392)
435,969,348 421,266,432 425,053,556
Bank has invested 100,000 scripts of riCBl bond at nu.1,000 each, and 311,272 scripts of DCCl bonds at nu. 1,000 each respectively. such investments are intended to be held to maturity in order to recover the contractualcashflows(Principal+Interest).AlthoughthebondsarelistedintheRoyalSecuritiesExchangeit does not meet the definition of an active Market. Hence bank has determined it’s Financial asset Classification as loans & recievables in line with Bas 39 Financial instrument recognition & Measurement.
| 10 | BDB Annual Report 2017
sl # Particulars 2009 2013 2014 2015 2016 2017X No.of Depositors 15,879 85,864 109,005 133,366 159,576 178,386
Main Branch 657 4821 6,322 8,436 11,186 15,101 BranchOffice 15,222 81,043 102,683 124,930 148,390 163,285
XI Number of Employess 221 357 385 416 452 563HeadOffice 66 110 125 117 144 152Main Branch 29 28 30 31 39 45BranchOffice 126 219 230 268 269 366
XII ActiveClients/EmployeeRatioMain Branch 90 112 111 120 107 101BranchOffice 137 172 187 181 193 144
XII Loans/EmployeeRatio 13 24 28 33 37 33Main Branch 62 142 153 169 153 152BranchOffice 8 21 27 32 39 33
BHUTAN DEVELOPMENT BANK LIMITED
NOTEs TO THE fINANCIAL sTATEMENT
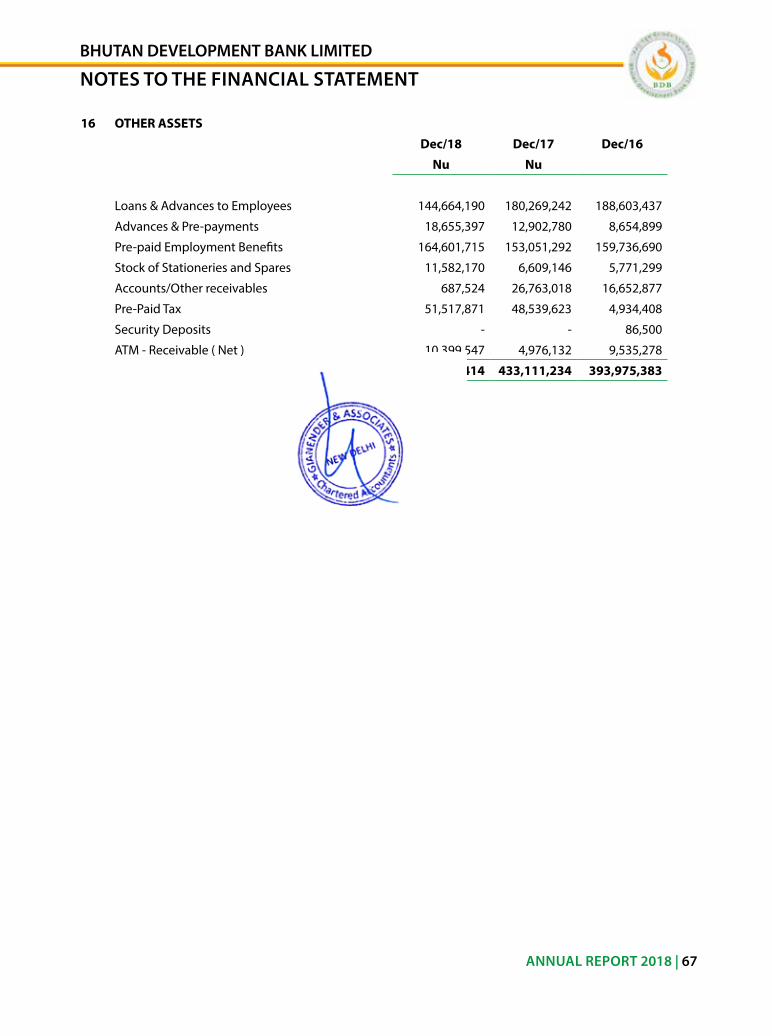
| 10 | BDB Annual Report 2017
sl # Particulars 2009 2013 2014 2015 2016 2017X No.of Depositors 15,879 85,864 109,005 133,366 159,576 178,386
Main Branch 657 4821 6,322 8,436 11,186 15,101 BranchOffice 15,222 81,043 102,683 124,930 148,390 163,285
XI Number of Employess 221 357 385 416 452 563HeadOffice 66 110 125 117 144 152Main Branch 29 28 30 31 39 45BranchOffice 126 219 230 268 269 366
XII ActiveClients/EmployeeRatioMain Branch 90 112 111 120 107 101BranchOffice 137 172 187 181 193 144
XII Loans/EmployeeRatio 13 24 28 33 37 33Main Branch 62 142 153 169 153 152BranchOffice 8 21 27 32 39 33
ANNUAL REPORT 2018 | 67
16 OTHER ASSETS
Dec/18 Dec/17 Dec/16
Nu Nu
loans & advances to employees 144,664,190 180,269,242 188,603,437
advances & Pre-payments 18,655,397 12,902,780 8,654,899
Pre-paid employment Benefits 164,601,715 153,051,292 159,736,690
stock of stationeries and spares 11,582,170 6,609,146 5,771,299
accounts/other receivables 687,524 26,763,018 16,652,877
Pre-Paid Tax 51,517,871 48,539,623 4,934,408
security Deposits - - 86,500
aTM - receivable ( net ) 10,399,547 4,976,132 9,535,278
402,108,414 433,111,234 393,975,383
| 10 | BDB Annual Report 2017
sl # Particulars 2009 2013 2014 2015 2016 2017X No.of Depositors 15,879 85,864 109,005 133,366 159,576 178,386
Main Branch 657 4821 6,322 8,436 11,186 15,101 BranchOffice 15,222 81,043 102,683 124,930 148,390 163,285
XI Number of Employess 221 357 385 416 452 563HeadOffice 66 110 125 117 144 152Main Branch 29 28 30 31 39 45BranchOffice 126 219 230 268 269 366
XII ActiveClients/EmployeeRatioMain Branch 90 112 111 120 107 101BranchOffice 137 172 187 181 193 144
XII Loans/EmployeeRatio 13 24 28 33 37 33Main Branch 62 142 153 169 153 152BranchOffice 8 21 27 32 39 33
BHUTAN DEVELOPMENT BANK LIMITED
NOTEs TO THE fINANCIAL sTATEMENT
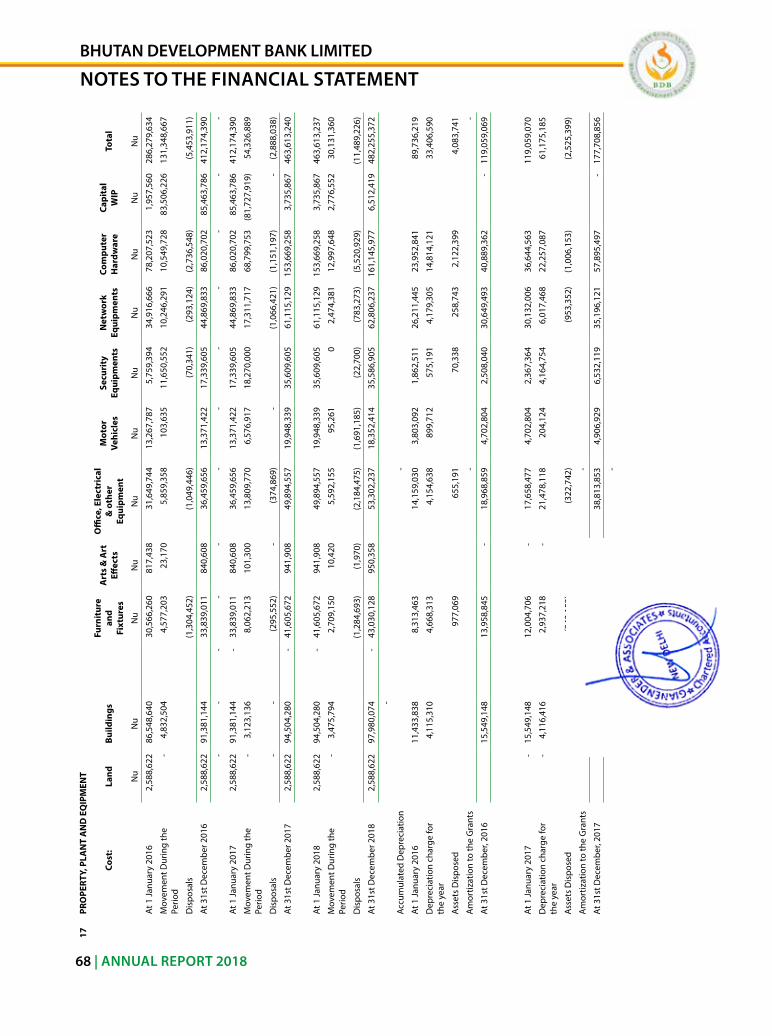
| 10 | BDB Annual Report 2017
sl # Particulars 2009 2013 2014 2015 2016 2017X No.of Depositors 15,879 85,864 109,005 133,366 159,576 178,386
Main Branch 657 4821 6,322 8,436 11,186 15,101 BranchOffice 15,222 81,043 102,683 124,930 148,390 163,285
XI Number of Employess 221 357 385 416 452 563HeadOffice 66 110 125 117 144 152Main Branch 29 28 30 31 39 45BranchOffice 126 219 230 268 269 366
XII ActiveClients/EmployeeRatioMain Branch 90 112 111 120 107 101BranchOffice 137 172 187 181 193 144
XII Loans/EmployeeRatio 13 24 28 33 37 33Main Branch 62 142 153 169 153 152BranchOffice 8 21 27 32 39 33
68 | ANNUAL REPORT 2018
17PR
OPE
RTY,
PLA
NT
AN
D E
QIP
MEN
T
Cost
:La
nd
Build
ings
Furn
itur
e an
d Fi
xtur
es
Art
s &
Art
Eff
ects
Offi
ce, E
lect
rica
l &
oth
er
Equi
pmen
t
Mot
or
Vehi
cles
Secu
rity
Eq
uipm
ents
Net
wor
k Eq
uipm
ents
Com
pute
r H
ardw
are
Capi
tal
WIP
Tota
l
nu
nu
nu
nu
nu
nu
nu
nu
nu
nu
nu
at 1
Janu
ary
2016
2,5
88,6
22
86,
548,
640
30,
566,
260
817
,438
3
1,64
9,74
4 1
3,26
7,78
7 5
,759
,394
3
4,91
6,66
6 7
8,20
7,52
3 1
,957
,560
2
86,2
79,6
34
Mov
emen
t Dur
ing
the
Perio
d -
4,8
32,5
04
4,5
77,2
03
23,
170
5,8
59,3
58
103
,635
1
1,65
0,55
2 1
0,24
6,29
1 1
0,54
9,72
8 8
3,50
6,22
6 1
31,3
48,6
67
Dis
posa
ls (1
,304
,452
) (1
,049
,446
) (7
0,34
1) (2
93,1
24)
(2,7
36,5
48)
(5,4
53,9
11)
at 3
1st D
ecem
ber 2
016
2,5
88,6
22
91,
381,
144
33,
839,
011
840
,608
3
6,45
9,65
6 1
3,37
1,42
2 1
7,33
9,60
5 4
4,86
9,83
3 8
6,02
0,70
2 8
5,46
3,78
6 4
12,1
74,3
90
- -
- -
- -
- -
- -
- -
at 1
Janu
ary
2017
2,5
88,6
22
91,
381,
144
- 3
3,83
9,01
1 8
40,6
08
36,
459,
656
13,
371,
422
17,
339,
605
44,
869,
833
86,
020,
702
85,
463,
786
412
,174
,390
Mov
emen
t Dur
ing
the
Perio
d -
3,1
23,1
36
8,0
62,2
13
101
,300
1
3,80
9,77
0 6
,576
,917
1
8,27
0,00
0 1
7,31
1,71
7 6
8,79
9,75
3 (8
1,72
7,91
9) 5
4,32
6,88
9
Dis
posa
ls -
- (2
95,5
52)
- (3
74,8
69)
- (1
,066
,421
) (1
,151
,197
) -
(2,8
88,0
38)
at 3
1st D
ecem
ber 2
017
2,5
88,6
22
94,
504,
280
- 4
1,60
5,67
2 9
41,9
08
49,
894,
557
19,
948,
339
35,
609,
605
61,
115,
129
153
,669
,258
3
,735
,867
4
63,6
13,2
40
at 1
Janu
ary
2018
2,5
88,6
22
94,
504,
280
- 4
1,60
5,67
2 9
41,9
08
49,
894,
557
19,
948,
339
35,
609,
605
61,
115,
129
153
,669
,258
3
,735
,867
4
63,6
13,2
37
Mov
emen
t Dur
ing
the
Perio
d -
3,4
75,7
94
2,7
09,1
50
10,
420
5,5
92,1
55
95,
261
0
2,4
74,3
81
12,
997,
648
2,7
76,5
52
30,
131,
360
Dis
posa
ls (1
,284
,693
) (1
,970
) (2
,184
,475
) (1
,691
,185
) (2
2,70
0) (7
83,2
73)
(5,5
20,9
29)
(11,
489,
226)
at 3
1st D
ecem
ber 2
018
2,5
88,6
22
97,
980,
074
- 4
3,03
0,12
8 9
50,3
58
53,
302,
237
18,
352,
414
35,
586,
905
62,
806,
237
161
,145
,977
6
,512
,419
4
82,2
55,3
72
-
accu
mul
ated
Dep
reci
atio
n -
at 1
Janu
ary
2016
11,
433,
838
8,3
13,4
63
14,
159,
030
3,8
03,0
92
1,8
62,5
11
26,
211,
445
23,
952,
841
89,
736,
219
Dep
reci
atio
n ch
arge
for
the
year
4,1
15,3
10
4,6
68,3
13
4,1
54,6
38
899
,712
5
75,1
91
4,1
79,3
05
14,
814,
121
33,
406,
590
ass
ets
Dis
pose
d 9
77,0
69
655
,191
7
0,33
8 2
58,7
43
2,1
22,3
99
4,0
83,7
41
am
ortiz
atio
n to
the
Gra
nts
- -
at 3
1st D
ecem
ber,
2016
15,
549,
148
13,
958,
845
- 1
8,96
8,85
9 4
,702
,804
2
,508
,040
3
0,64
9,49
3 4
0,88
9,36
2 -
119
,059
,069
at 1
Janu
ary
2017
- 1
5,54
9,14
8 1
2,00
4,70
6 -
17,
658,
477
4,7
02,8
04
2,3
67,3
64
30,
132,
006
36,
644,
563
119
,059
,070
Dep
reci
atio
n ch
arge
for
the
year
- 4
,116
,416
2
,937
,218
-
21,
478,
118
204
,124
4
,164
,754
6
,017
,468
2
2,25
7,08
7 6
1,17
5,18
5
ass
ets
Dis
pose
d (2
43,1
52)
(322
,742
) (9
53,3
52)
(1,0
06,1
53)
(2,5
25,3
99)
am
ortiz
atio
n to
the
Gra
nts
-
at 3
1st D
ecem
ber,
2017
- 1
9,66
5,56
4 -
14,
698,
773
- 3
8,81
3,85
3 4
,906
,929
6
,532
,119
3
5,19
6,12
1 5
7,89
5,49
7 -
177
,708
,856
-
| 10 | BDB Annual Report 2017
sl # Particulars 2009 2013 2014 2015 2016 2017X No.of Depositors 15,879 85,864 109,005 133,366 159,576 178,386
Main Branch 657 4821 6,322 8,436 11,186 15,101 BranchOffice 15,222 81,043 102,683 124,930 148,390 163,285
XI Number of Employess 221 357 385 416 452 563HeadOffice 66 110 125 117 144 152Main Branch 29 28 30 31 39 45BranchOffice 126 219 230 268 269 366
XII ActiveClients/EmployeeRatioMain Branch 90 112 111 120 107 101BranchOffice 137 172 187 181 193 144
XII Loans/EmployeeRatio 13 24 28 33 37 33Main Branch 62 142 153 169 153 152BranchOffice 8 21 27 32 39 33
BHUTAN DEVELOPMENT BANK LIMITED
NOTEs TO THE fINANCIAL sTATEMENT
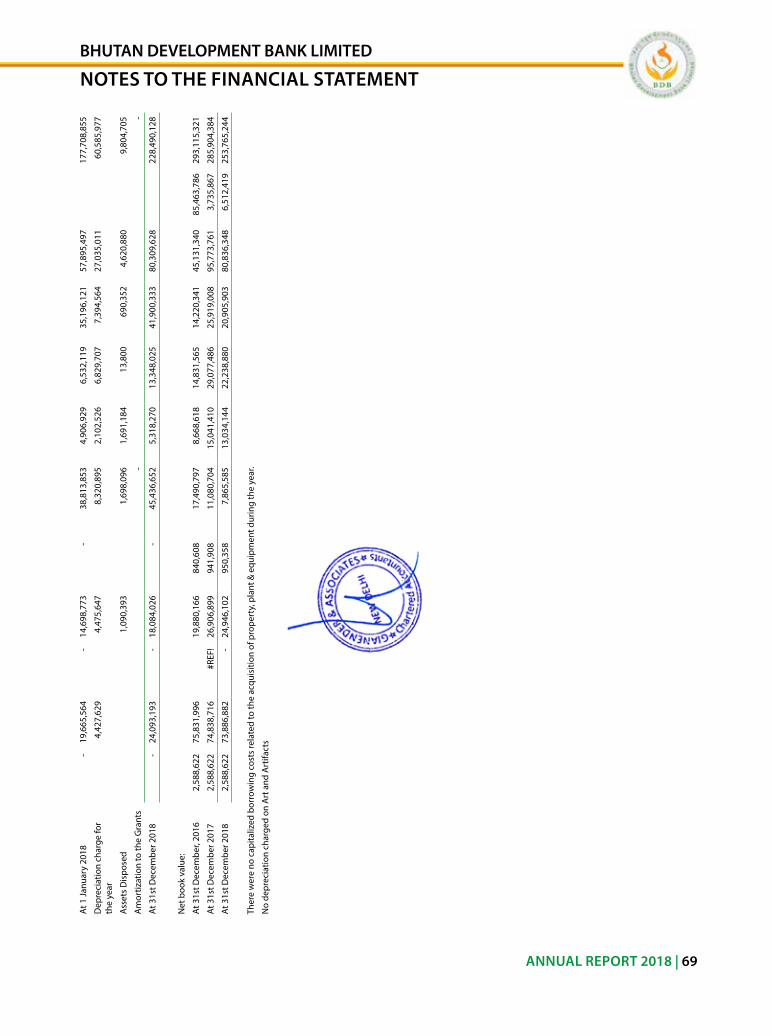
| 10 | BDB Annual Report 2017
sl # Particulars 2009 2013 2014 2015 2016 2017X No.of Depositors 15,879 85,864 109,005 133,366 159,576 178,386
Main Branch 657 4821 6,322 8,436 11,186 15,101 BranchOffice 15,222 81,043 102,683 124,930 148,390 163,285
XI Number of Employess 221 357 385 416 452 563HeadOffice 66 110 125 117 144 152Main Branch 29 28 30 31 39 45BranchOffice 126 219 230 268 269 366
XII ActiveClients/EmployeeRatioMain Branch 90 112 111 120 107 101BranchOffice 137 172 187 181 193 144
XII Loans/EmployeeRatio 13 24 28 33 37 33Main Branch 62 142 153 169 153 152BranchOffice 8 21 27 32 39 33
ANNUAL REPORT 2018 | 69
at 1
Janu
ary
2018
- 1
9,66
5,56
4 -
14,
698,
773
- 3
8,81
3,85
3 4
,906
,929
6
,532
,119
3
5,19
6,12
1 5
7,89
5,49
7 1
77,7
08,8
55
Dep
reci
atio
n ch
arge
for
the
year
4,4
27,6
29
4,4
75,6
47
8,3
20,8
95
2,1
02,5
26
6,8
29,7
07
7,3
94,5
64
27,
035,
011
60,
585,
977
ass
ets
Dis
pose
d 1
,090
,393
1
,698
,096
1
,691
,184
1
3,80
0 6
90,3
52
4,6
20,8
80
9,8
04,7
05
am
ortiz
atio
n to
the
Gra
nts
- -
at 3
1st D
ecem
ber 2
018
- 2
4,09
3,19
3 -
18,
084,
026
- 4
5,43
6,65
2 5
,318
,270
1
3,34
8,02
5 4
1,90
0,33
3 8
0,30
9,62
8 2
28,4
90,1
28
net
boo
k va
lue:
at 3
1st D
ecem
ber,
2016
2,5
88,6
22
75,
831,
996
19,
880,
166
840
,608
1
7,49
0,79
7 8
,668
,618
1
4,83
1,56
5 1
4,22
0,34
1 4
5,13
1,34
0 8
5,46
3,78
6 2
93,1
15,3
21
at 3
1st D
ecem
ber 2
017
2,5
88,6
22
74,
838,
716
#reF
! 2
6,90
6,89
9 9
41,9
08
11,
080,
704
15,
041,
410
29,
077,
486
25,
919,
008
95,
773,
761
3,7
35,8
67
285
,904
,384
at 3
1st D
ecem
ber 2
018
2,5
88,6
22
73,
886,
882
- 2
4,94
6,10
2 9
50,3
58
7,8
65,5
85
13,
034,
144
22,
238,
880
20,
905,
903
80,
836,
348
6,5
12,4
19
253
,765
,244
Ther
e w
ere
no c
apita
lized
bor
row
ing
cost
s re
late
d to
the
acqu
isiti
on o
f pro
pert
y, p
lant
& e
quip
men
t dur
ing
the
year
.
no
depr
ecia
tion
char
ged
on a
rt a
nd a
rtifa
cts
| 10 | BDB Annual Report 2017
sl # Particulars 2009 2013 2014 2015 2016 2017X No.of Depositors 15,879 85,864 109,005 133,366 159,576 178,386
Main Branch 657 4821 6,322 8,436 11,186 15,101 BranchOffice 15,222 81,043 102,683 124,930 148,390 163,285
XI Number of Employess 221 357 385 416 452 563HeadOffice 66 110 125 117 144 152Main Branch 29 28 30 31 39 45BranchOffice 126 219 230 268 269 366
XII ActiveClients/EmployeeRatioMain Branch 90 112 111 120 107 101BranchOffice 137 172 187 181 193 144
XII Loans/EmployeeRatio 13 24 28 33 37 33Main Branch 62 142 153 169 153 152BranchOffice 8 21 27 32 39 33
BHUTAN DEVELOPMENT BANK LIMITED
NOTEs TO THE fINANCIAL sTATEMENT
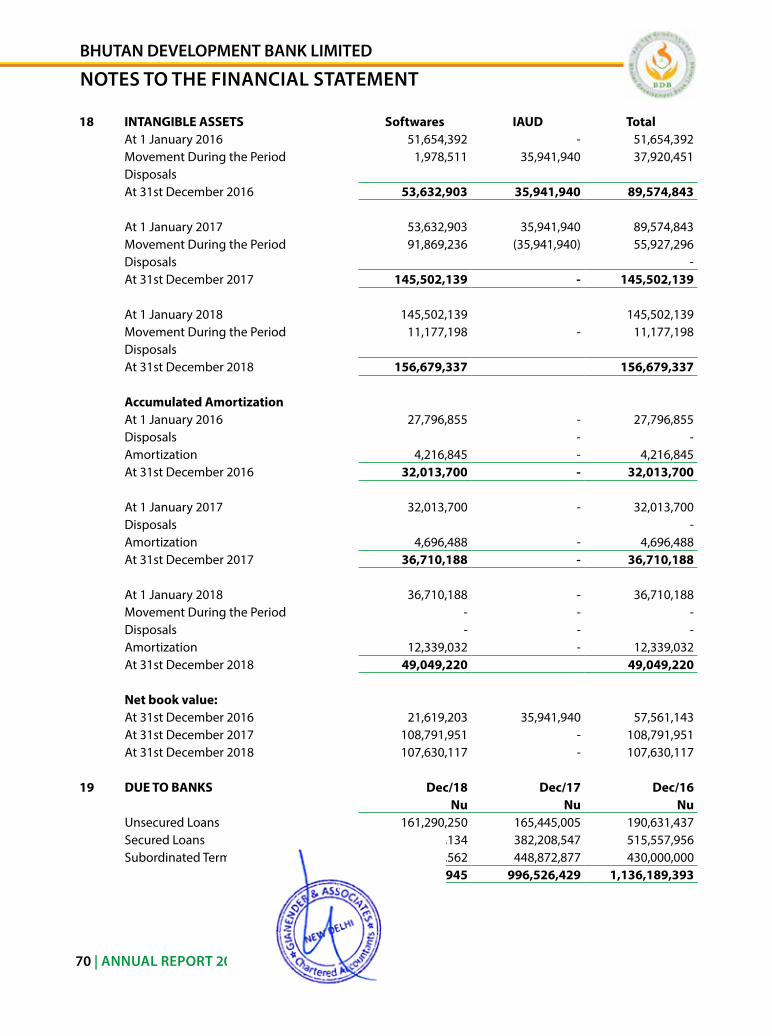
| 10 | BDB Annual Report 2017
sl # Particulars 2009 2013 2014 2015 2016 2017X No.of Depositors 15,879 85,864 109,005 133,366 159,576 178,386
Main Branch 657 4821 6,322 8,436 11,186 15,101 BranchOffice 15,222 81,043 102,683 124,930 148,390 163,285
XI Number of Employess 221 357 385 416 452 563HeadOffice 66 110 125 117 144 152Main Branch 29 28 30 31 39 45BranchOffice 126 219 230 268 269 366
XII ActiveClients/EmployeeRatioMain Branch 90 112 111 120 107 101BranchOffice 137 172 187 181 193 144
XII Loans/EmployeeRatio 13 24 28 33 37 33Main Branch 62 142 153 169 153 152BranchOffice 8 21 27 32 39 33
70 | ANNUAL REPORT 2018
18 INTANGIBLE ASSETS Softwares IAUD Totalat 1 January 2016 51,654,392 - 51,654,392 Movement During the Period 1,978,511 35,941,940 37,920,451 Disposalsat 31st December 2016 53,632,903 35,941,940 89,574,843
at 1 January 2017 53,632,903 35,941,940 89,574,843 Movement During the Period 91,869,236 (35,941,940) 55,927,296 Disposals - at 31st December 2017 145,502,139 - 145,502,139
at 1 January 2018 145,502,139 145,502,139 Movement During the Period 11,177,198 - 11,177,198 Disposalsat 31st December 2018 156,679,337 156,679,337
Accumulated Amortizationat 1 January 2016 27,796,855 - 27,796,855 Disposals - - amortization 4,216,845 - 4,216,845 at 31st December 2016 32,013,700 - 32,013,700
at 1 January 2017 32,013,700 - 32,013,700 Disposals - amortization 4,696,488 - 4,696,488 at 31st December 2017 36,710,188 - 36,710,188
at 1 January 2018 36,710,188 - 36,710,188 Movement During the Period - - - Disposals - - - amortization 12,339,032 - 12,339,032 at 31st December 2018 49,049,220 49,049,220
Net book value:at 31st December 2016 21,619,203 35,941,940 57,561,143 at 31st December 2017 108,791,951 - 108,791,951 at 31st December 2018 107,630,117 - 107,630,117
19 DUE TO BANKS Dec/18 Dec/17 Dec/16Nu Nu Nu
unsecured loans 161,290,250 165,445,005 190,631,437 secured loans 711,766,134 382,208,547 515,557,956 subordinated Term Debt 448,943,562 448,872,877 430,000,000
1,321,999,945 996,526,429 1,136,189,393 | 10 | BDB Annual Report 2017
sl # Particulars 2009 2013 2014 2015 2016 2017X No.of Depositors 15,879 85,864 109,005 133,366 159,576 178,386
Main Branch 657 4821 6,322 8,436 11,186 15,101 BranchOffice 15,222 81,043 102,683 124,930 148,390 163,285
XI Number of Employess 221 357 385 416 452 563HeadOffice 66 110 125 117 144 152Main Branch 29 28 30 31 39 45BranchOffice 126 219 230 268 269 366
XII ActiveClients/EmployeeRatioMain Branch 90 112 111 120 107 101BranchOffice 137 172 187 181 193 144
XII Loans/EmployeeRatio 13 24 28 33 37 33Main Branch 62 142 153 169 153 152BranchOffice 8 21 27 32 39 33
BHUTAN DEVELOPMENT BANK LIMITED
NOTEs TO THE fINANCIAL sTATEMENT
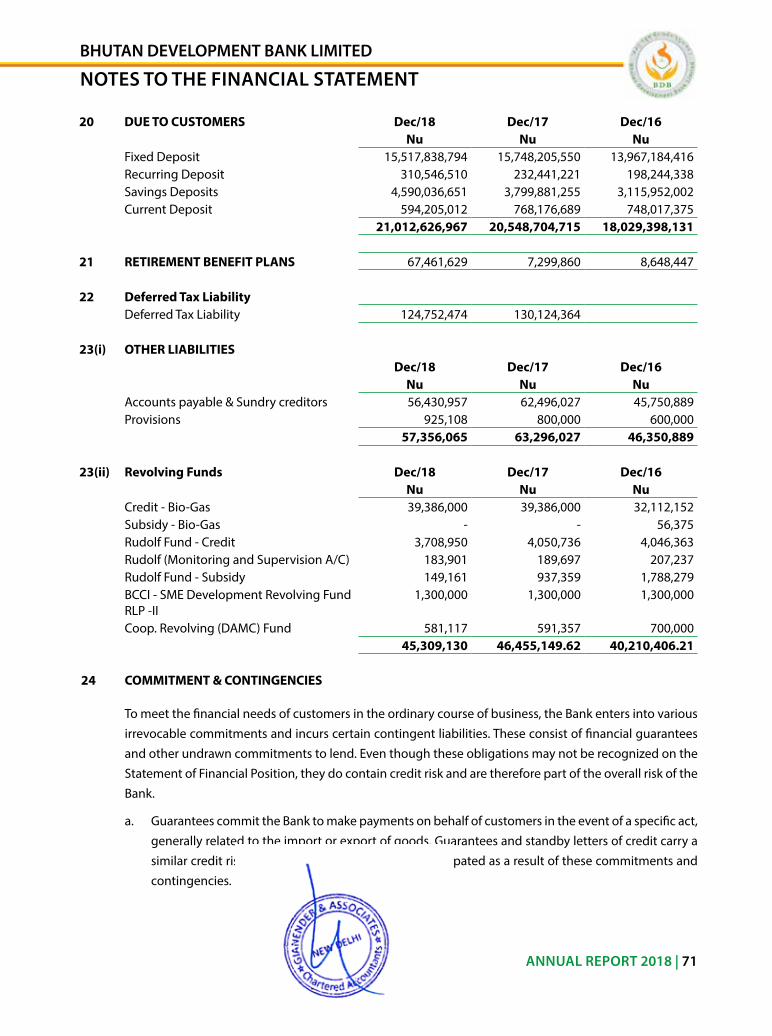
| 10 | BDB Annual Report 2017
sl # Particulars 2009 2013 2014 2015 2016 2017X No.of Depositors 15,879 85,864 109,005 133,366 159,576 178,386
Main Branch 657 4821 6,322 8,436 11,186 15,101 BranchOffice 15,222 81,043 102,683 124,930 148,390 163,285
XI Number of Employess 221 357 385 416 452 563HeadOffice 66 110 125 117 144 152Main Branch 29 28 30 31 39 45BranchOffice 126 219 230 268 269 366
XII ActiveClients/EmployeeRatioMain Branch 90 112 111 120 107 101BranchOffice 137 172 187 181 193 144
XII Loans/EmployeeRatio 13 24 28 33 37 33Main Branch 62 142 153 169 153 152BranchOffice 8 21 27 32 39 33
ANNUAL REPORT 2018 | 71
20 DUE TO CUSTOMERS Dec/18 Dec/17 Dec/16Nu Nu Nu
Fixed Deposit 15,517,838,794 15,748,205,550 13,967,184,416 recurring Deposit 310,546,510 232,441,221 198,244,338 savings Deposits 4,590,036,651 3,799,881,255 3,115,952,002 Current Deposit 594,205,012 768,176,689 748,017,375
21,012,626,967 20,548,704,715 18,029,398,131
21 RETIREMENT BENEFIT PLANS 67,461,629 7,299,860 8,648,447
22 Deferred Tax LiabilityDeferred Tax liability 124,752,474 130,124,364
23(i) OTHER LIABILITIESDec/18 Dec/17 Dec/16
Nu Nu Nuaccounts payable & sundry creditors 56,430,957 62,496,027 45,750,889 Provisions 925,108 800,000 600,000
57,356,065 63,296,027 46,350,889
23(ii) Revolving Funds Dec/18 Dec/17 Dec/16Nu Nu Nu
Credit - Bio-Gas 39,386,000 39,386,000 32,112,152 subsidy - Bio-Gas - - 56,375 rudolf Fund - Credit 3,708,950 4,050,736 4,046,363 rudolf (Monitoring and supervision a/C) 183,901 189,697 207,237 rudolf Fund - subsidy 149,161 937,359 1,788,279 BCCi - sMe Development revolving Fund rlP -ii
1,300,000 1,300,000 1,300,000
Coop. revolving (DaMC) Fund 581,117 591,357 700,000 45,309,130 46,455,149.62 40,210,406.21
24 COMMITMENT & CONTINGENCIES
To meet the financial needs of customers in the ordinary course of business, the Bank enters into various irrevocable commitments and incurs certain contingent liabilities. These consist of financial guarantees and other undrawn commitments to lend. even though these obligations may not be recognized on the statement of Financial Position, they do contain credit risk and are therefore part of the overall risk of the Bank.
a. Guarantees commit the Bank to make payments on behalf of customers in the event of a specific act, generally related to the import or export of goods. Guarantees and standby letters of credit carry a similar credit risk to loans. no material losses are anticipated as a result of these commitments and contingencies. | 10 | BDB Annual Report 2017
sl # Particulars 2009 2013 2014 2015 2016 2017X No.of Depositors 15,879 85,864 109,005 133,366 159,576 178,386
Main Branch 657 4821 6,322 8,436 11,186 15,101 BranchOffice 15,222 81,043 102,683 124,930 148,390 163,285
XI Number of Employess 221 357 385 416 452 563HeadOffice 66 110 125 117 144 152Main Branch 29 28 30 31 39 45BranchOffice 126 219 230 268 269 366
XII ActiveClients/EmployeeRatioMain Branch 90 112 111 120 107 101BranchOffice 137 172 187 181 193 144
XII Loans/EmployeeRatio 13 24 28 33 37 33Main Branch 62 142 153 169 153 152BranchOffice 8 21 27 32 39 33
BHUTAN DEVELOPMENT BANK LIMITED
NOTEs TO THE fINANCIAL sTATEMENT
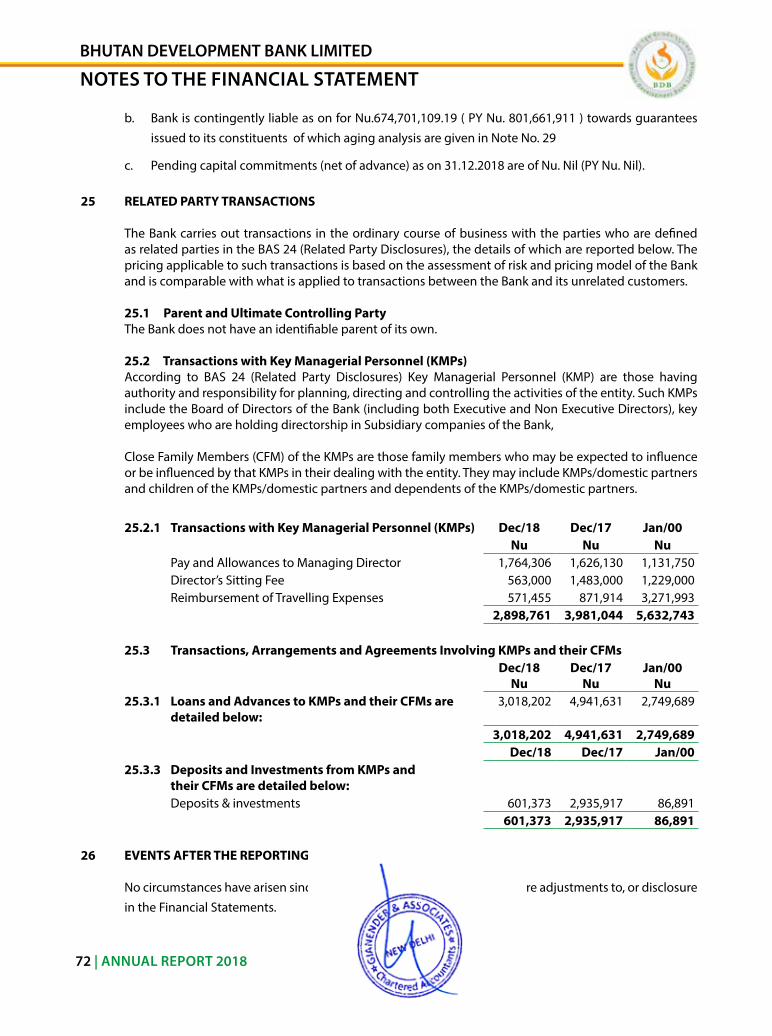
| 10 | BDB Annual Report 2017
sl # Particulars 2009 2013 2014 2015 2016 2017X No.of Depositors 15,879 85,864 109,005 133,366 159,576 178,386
Main Branch 657 4821 6,322 8,436 11,186 15,101 BranchOffice 15,222 81,043 102,683 124,930 148,390 163,285
XI Number of Employess 221 357 385 416 452 563HeadOffice 66 110 125 117 144 152Main Branch 29 28 30 31 39 45BranchOffice 126 219 230 268 269 366
XII ActiveClients/EmployeeRatioMain Branch 90 112 111 120 107 101BranchOffice 137 172 187 181 193 144
XII Loans/EmployeeRatio 13 24 28 33 37 33Main Branch 62 142 153 169 153 152BranchOffice 8 21 27 32 39 33
72 | ANNUAL REPORT 2018
b. Bank is contingently liable as on for nu.674,701,109.19 ( PY nu. 801,661,911 ) towards guarantees issued to its constituents of which aging analysis are given in note no. 29
c. Pending capital commitments (net of advance) as on 31.12.2018 are of nu. nil (PY nu. nil).
25 RELATED PARTY TRANSACTIONS
The Bank carries out transactions in the ordinary course of business with the parties who are defined as related parties in the Bas 24 (related Party Disclosures), the details of which are reported below. The pricing applicable to such transactions is based on the assessment of risk and pricing model of the Bank and is comparable with what is applied to transactions between the Bank and its unrelated customers.
25.1 Parent and Ultimate Controlling PartyThe Bank does not have an identifiable parent of its own.
25.2 Transactions with Key Managerial Personnel (KMPs)according to Bas 24 (related Party Disclosures) Key Managerial Personnel (KMP) are those having authority and responsibility for planning, directing and controlling the activities of the entity. such KMPs include the Board of Directors of the Bank (including both executive and non executive Directors), key employees who are holding directorship in subsidiary companies of the Bank,
CloseFamilyMembers(CFM)oftheKMPsarethosefamilymemberswhomaybeexpectedtoinfluenceorbeinfluencedbythatKMPsintheirdealingwiththeentity.TheymayincludeKMPs/domesticpartnersand children of the KMPs/domestic partners and dependents of the KMPs/domestic partners.
25.2.1 Transactions with Key Managerial Personnel (KMPs) Dec/18 Dec/17 Jan/00Nu Nu Nu
Pay and allowances to Managing Director 1,764,306 1,626,130 1,131,750 Director’s sitting Fee 563,000 1,483,000 1,229,000 reimbursement of Travelling expenses 571,455 871,914 3,271,993
2,898,761 3,981,044 5,632,743
25.3 Transactions, Arrangements and Agreements Involving KMPs and their CFMsDec/18
NuDec/17
NuJan/00
Nu25.3.1 Loans and Advances to KMPs and their CFMs are
detailed below:3,018,202 4,941,631 2,749,689
3,018,202 4,941,631 2,749,689 Dec/18 Dec/17 Jan/00
25.3.3 Deposits and Investments from KMPs and their CFMs are detailed below:Deposits & investments 601,373 2,935,917 86,891
601,373 2,935,917 86,891
26 EVENTS AFTER THE REPORTING DATE
no circumstances have arisen since the reporting date which would require adjustments to, or disclosure in the Financial statements.
| 10 | BDB Annual Report 2017
sl # Particulars 2009 2013 2014 2015 2016 2017X No.of Depositors 15,879 85,864 109,005 133,366 159,576 178,386
Main Branch 657 4821 6,322 8,436 11,186 15,101 BranchOffice 15,222 81,043 102,683 124,930 148,390 163,285
XI Number of Employess 221 357 385 416 452 563HeadOffice 66 110 125 117 144 152Main Branch 29 28 30 31 39 45BranchOffice 126 219 230 268 269 366
XII ActiveClients/EmployeeRatioMain Branch 90 112 111 120 107 101BranchOffice 137 172 187 181 193 144
XII Loans/EmployeeRatio 13 24 28 33 37 33Main Branch 62 142 153 169 153 152BranchOffice 8 21 27 32 39 33
BHUTAN DEVELOPMENT BANK LIMITED
NOTEs TO THE fINANCIAL sTATEMENT
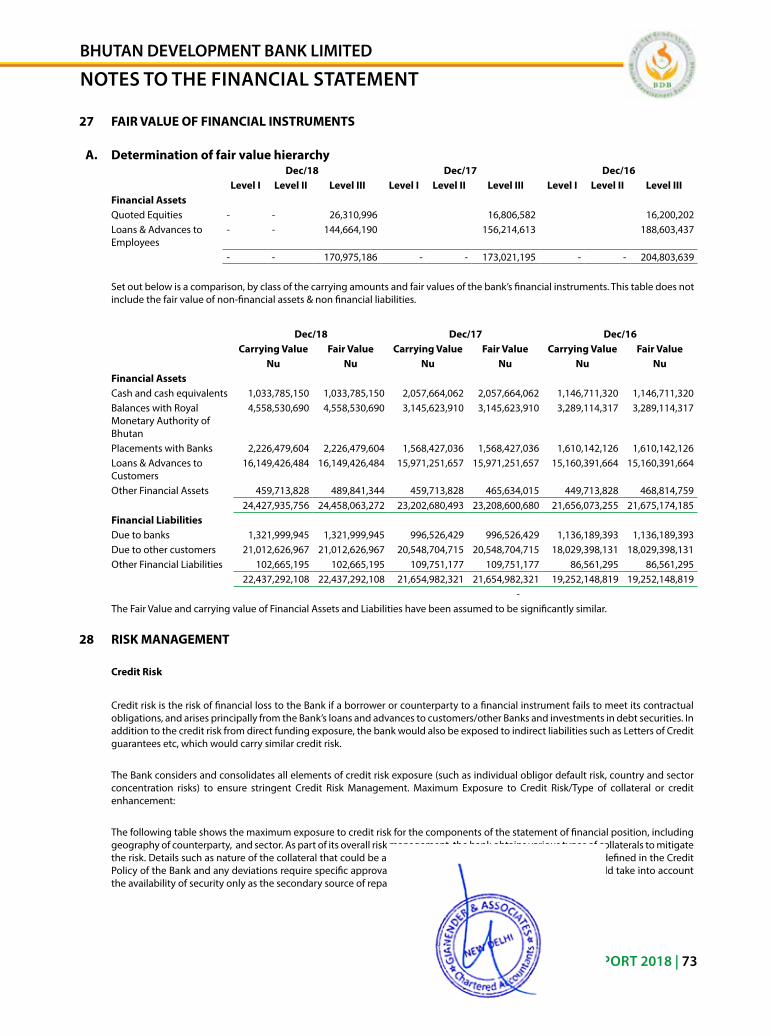
| 10 | BDB Annual Report 2017
sl # Particulars 2009 2013 2014 2015 2016 2017X No.of Depositors 15,879 85,864 109,005 133,366 159,576 178,386
Main Branch 657 4821 6,322 8,436 11,186 15,101 BranchOffice 15,222 81,043 102,683 124,930 148,390 163,285
XI Number of Employess 221 357 385 416 452 563HeadOffice 66 110 125 117 144 152Main Branch 29 28 30 31 39 45BranchOffice 126 219 230 268 269 366
XII ActiveClients/EmployeeRatioMain Branch 90 112 111 120 107 101BranchOffice 137 172 187 181 193 144
XII Loans/EmployeeRatio 13 24 28 33 37 33Main Branch 62 142 153 169 153 152BranchOffice 8 21 27 32 39 33
ANNUAL REPORT 2018 | 73
27 FAIR VALUE OF FINANCIAL INSTRUMENTS
A. Determination of fair value hierarchyDec/18 Dec/17 Dec/16
Level I Level II Level III Level I Level II Level III Level I Level II Level IIIFinancial AssetsQuoted equities - - 26,310,996 16,806,582 16,200,202 loans & advances to employees
- - 144,664,190 156,214,613 188,603,437
- - 170,975,186 - - 173,021,195 - - 204,803,639
set out below is a comparison, by class of the carrying amounts and fair values of the bank’s financial instruments. This table does not include the fair value of non-financial assets & non financial liabilities.
Dec/18 Dec/17 Dec/16Carrying Value Fair Value Carrying Value Fair Value Carrying Value Fair Value
Nu Nu Nu Nu Nu NuFinancial AssetsCash and cash equivalents 1,033,785,150 1,033,785,150 2,057,664,062 2,057,664,062 1,146,711,320 1,146,711,320 Balances with royal Monetary authority of Bhutan
4,558,530,690 4,558,530,690 3,145,623,910 3,145,623,910 3,289,114,317 3,289,114,317
Placements with Banks 2,226,479,604 2,226,479,604 1,568,427,036 1,568,427,036 1,610,142,126 1,610,142,126 loans & advances to Customers
16,149,426,484 16,149,426,484 15,971,251,657 15,971,251,657 15,160,391,664 15,160,391,664
other Financial assets 459,713,828 489,841,344 459,713,828 465,634,015 449,713,828 468,814,759 24,427,935,756 24,458,063,272 23,202,680,493 23,208,600,680 21,656,073,255 21,675,174,185
Financial LiabilitiesDue to banks 1,321,999,945 1,321,999,945 996,526,429 996,526,429 1,136,189,393 1,136,189,393 Due to other customers 21,012,626,967 21,012,626,967 20,548,704,715 20,548,704,715 18,029,398,131 18,029,398,131 other Financial liabilities 102,665,195 102,665,195 109,751,177 109,751,177 86,561,295 86,561,295
22,437,292,108 22,437,292,108 21,654,982,321 21,654,982,321 19,252,148,819 19,252,148,819 -
The Fair Value and carrying value of Financial assets and liabilities have been assumed to be significantly similar.
28 RISK MANAGEMENT
Credit Risk
Credit risk is the risk of financial loss to the Bank if a borrower or counterparty to a financial instrument fails to meet its contractual obligations, and arises principally from the Bank’s loans and advances to customers/other Banks and investments in debt securities. in addition to the credit risk from direct funding exposure, the bank would also be exposed to indirect liabilities such as letters of Credit guarantees etc, which would carry similar credit risk.
The Bank considers and consolidates all elements of credit risk exposure (such as individual obligor default risk, country and sector concentration risks) to ensure stringent Credit risk Management. Maximum exposure to Credit risk/Type of collateral or credit enhancement:
The following table shows the maximum exposure to credit risk for the components of the statement of financial position, including geography of counterparty, and sector. as part of its overall risk management, the bank obtains various types of collaterals to mitigate the risk. Details such as nature of the collateral that could be accepted, required security margin etc are clearly defined in the Credit Policy of the Bank and any deviations require specific approval. However, respective approving authorities would take into account the availability of security only as the secondary source of repayment.
| 10 | BDB Annual Report 2017
sl # Particulars 2009 2013 2014 2015 2016 2017X No.of Depositors 15,879 85,864 109,005 133,366 159,576 178,386
Main Branch 657 4821 6,322 8,436 11,186 15,101 BranchOffice 15,222 81,043 102,683 124,930 148,390 163,285
XI Number of Employess 221 357 385 416 452 563HeadOffice 66 110 125 117 144 152Main Branch 29 28 30 31 39 45BranchOffice 126 219 230 268 269 366
XII ActiveClients/EmployeeRatioMain Branch 90 112 111 120 107 101BranchOffice 137 172 187 181 193 144
XII Loans/EmployeeRatio 13 24 28 33 37 33Main Branch 62 142 153 169 153 152BranchOffice 8 21 27 32 39 33
BHUTAN DEVELOPMENT BANK LIMITED
NOTEs TO THE fINANCIAL sTATEMENT
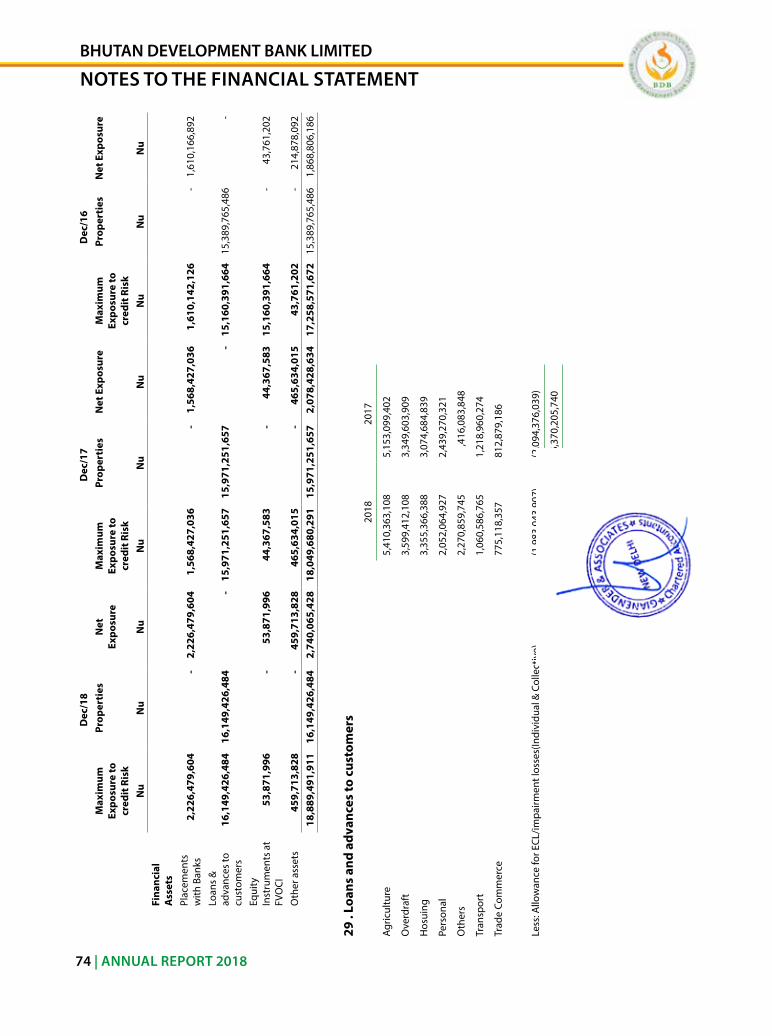
| 10 | BDB Annual Report 2017
sl # Particulars 2009 2013 2014 2015 2016 2017X No.of Depositors 15,879 85,864 109,005 133,366 159,576 178,386
Main Branch 657 4821 6,322 8,436 11,186 15,101 BranchOffice 15,222 81,043 102,683 124,930 148,390 163,285
XI Number of Employess 221 357 385 416 452 563HeadOffice 66 110 125 117 144 152Main Branch 29 28 30 31 39 45BranchOffice 126 219 230 268 269 366
XII ActiveClients/EmployeeRatioMain Branch 90 112 111 120 107 101BranchOffice 137 172 187 181 193 144
XII Loans/EmployeeRatio 13 24 28 33 37 33Main Branch 62 142 153 169 153 152BranchOffice 8 21 27 32 39 33
74 | ANNUAL REPORT 2018
Dec
/18
Dec
/17
Dec
/16
Max
imum
Ex
posu
re to
cr
edit
Ris
k
Prop
erti
esN
et
Expo
sure
Max
imum
Ex
posu
re to
cr
edit
Ris
k
Prop
erti
esN
et E
xpos
ure
Max
imum
Ex
posu
re to
cr
edit
Ris
k
Prop
erti
esN
et E
xpos
ure
Nu
Nu
Nu
Nu
Nu
Nu
Nu
Nu
Nu
Fina
ncia
l A
sset
sPl
acem
ents
w
ith B
anks
2,
226,
479,
604
-
2,22
6,47
9,60
4
1,56
8,42
7,03
6
-
1,56
8,42
7,03
6 1,
610,
142,
126
-
1,61
0,16
6,89
2
loan
s &
ad
vanc
es to
cu
stom
ers
16,1
49,4
26,4
84
16,1
49,4
26,4
84
- 15
,971
,251
,657
15
,971
,251
,657
- 15
,160
,391
,664
15
,389
,765
,486
-
equi
ty
inst
rum
ents
at
FVo
Ci
53
,871
,996
- 53
,871
,996
44
,367
,583
-
44,3
67,5
83
15,1
60,3
91,6
64
-
43,7
61,2
02
oth
er a
sset
s
459
,713
,828
- 45
9,71
3,82
8
465
,634
,015
-
465,
634,
015
43,7
61,2
02
-
2
14,8
78,0
92
18,8
89,4
91,9
11
16,1
49,4
26,4
84
2,74
0,06
5,42
8 18
,049
,680
,291
15
,971
,251
,657
2,
078,
428,
634
17,2
58,5
71,6
72
15,3
89,7
65,4
86
1,86
8,80
6,18
6
29 .
Loan
s an
d ad
vanc
es to
cus
tom
ers
2018
2017
agric
ultu
re5,
410,
363,
108
5,15
3,09
9,40
2
ove
rdra
ft3,
599,
412,
108
3,34
9,60
3,90
9
Hos
uing
3,35
5,36
6,38
8 3,
074,
684,
839
Pers
onal
2,05
2,06
4,92
7 2,
439,
270,
321
oth
ers
2,27
0,85
9,74
5
,41
6,08
3,84
8
Tran
spor
t1,
060,
586,
765
1,21
8,96
0,27
4
Trad
e Co
mm
erce
775,
118,
357
812,
879,
186
less
: allo
wan
ce fo
r eCl
/impa
irmen
t los
ses(
indi
vidu
al &
Col
lect
ive)
(1,9
83,0
43,9
07)
(2,0
94,3
76,0
39)
16,5
40,7
27,4
92
16,3
70,2
05,7
40
| 10 | BDB Annual Report 2017
sl # Particulars 2009 2013 2014 2015 2016 2017X No.of Depositors 15,879 85,864 109,005 133,366 159,576 178,386
Main Branch 657 4821 6,322 8,436 11,186 15,101 BranchOffice 15,222 81,043 102,683 124,930 148,390 163,285
XI Number of Employess 221 357 385 416 452 563HeadOffice 66 110 125 117 144 152Main Branch 29 28 30 31 39 45BranchOffice 126 219 230 268 269 366
XII ActiveClients/EmployeeRatioMain Branch 90 112 111 120 107 101BranchOffice 137 172 187 181 193 144
XII Loans/EmployeeRatio 13 24 28 33 37 33Main Branch 62 142 153 169 153 152BranchOffice 8 21 27 32 39 33
BHUTAN DEVELOPMENT BANK LIMITED
NOTEs TO THE fINANCIAL sTATEMENT
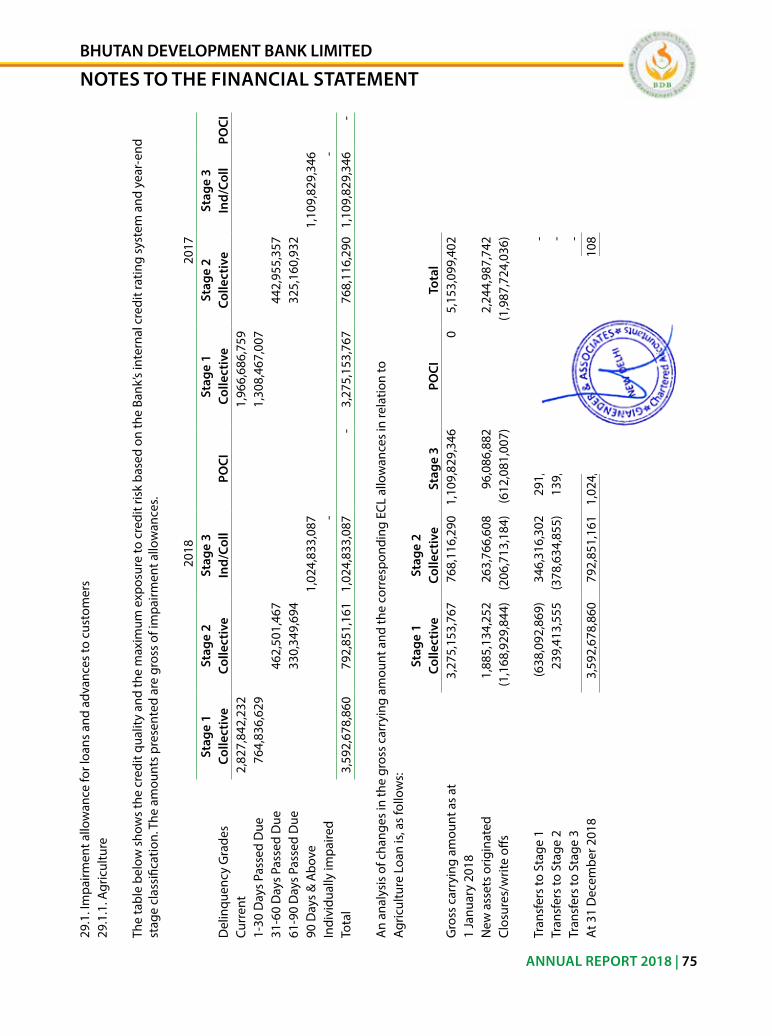
| 10 | BDB Annual Report 2017
sl # Particulars 2009 2013 2014 2015 2016 2017X No.of Depositors 15,879 85,864 109,005 133,366 159,576 178,386
Main Branch 657 4821 6,322 8,436 11,186 15,101 BranchOffice 15,222 81,043 102,683 124,930 148,390 163,285
XI Number of Employess 221 357 385 416 452 563HeadOffice 66 110 125 117 144 152Main Branch 29 28 30 31 39 45BranchOffice 126 219 230 268 269 366
XII ActiveClients/EmployeeRatioMain Branch 90 112 111 120 107 101BranchOffice 137 172 187 181 193 144
XII Loans/EmployeeRatio 13 24 28 33 37 33Main Branch 62 142 153 169 153 152BranchOffice 8 21 27 32 39 33
ANNUAL REPORT 2018 | 75
29.1
. im
pairm
ent a
llow
ance
for l
oans
and
adv
ance
s to
cus
tom
ers
29.1
.1. a
gric
ultu
re
The
tabl
e be
low
sho
ws
the
cred
it qu
ality
and
the
max
imum
exp
osur
e to
cre
dit r
isk
base
d on
the
Bank
’s in
tern
al c
redi
t rat
ing
syst
em a
nd y
ear-
end
stag
e cl
assi
ficat
ion.
The
am
ount
s pr
esen
ted
are
gros
s of
impa
irmen
t allo
wan
ces.
2018
2017
stag
e 1
stag
e 2
stag
e 3
st
age
1st
age
2st
age
3
Del
inqu
ency
Gra
des
Colle
ctiv
eCo
llect
ive
Ind/
Coll
POCI
Colle
ctiv
eCo
llect
ive
Ind/
Coll
POCI
Curr
ent
2,82
7,84
2,23
2 1,
966,
686,
759
1-30
Day
s Pa
ssed
Due
764,
836,
629
1,30
8,46
7,00
7 31
-60
Day
s Pa
ssed
Due
462,
501,
467
442,
955,
357
61-9
0 D
ays
Pass
ed D
ue33
0,34
9,69
4 32
5,16
0,93
2 90
Day
s &
abo
ve1,
024,
833,
087
1,10
9,82
9,34
6 in
divi
dual
ly im
paire
d-
-
To
tal
3,59
2,67
8,86
0 79
2,85
1,16
1 1,
024,
833,
087
- 3,
275,
153,
767
768,
116,
290
1,10
9,82
9,34
6 -
an
anal
ysis
of c
hang
es in
the
gros
s ca
rryi
ng a
mou
nt a
nd th
e co
rres
pond
ing
eCl
allo
wan
ces
in re
latio
n to
agric
ultu
re l
oan
is, a
s fo
llow
s:st
age
1st
age
2Co
llect
ive
Colle
ctiv
est
age
3PO
CITo
tal
Gro
ss c
arry
ing
amou
nt a
s at
3,27
5,15
3,76
7 76
8,11
6,29
0 1,
109,
829,
346
05,
153,
099,
402
1 Ja
nuar
y 20
18n
ew a
sset
s or
igin
ated
1,88
5,13
4,25
2 26
3,76
6,60
8 96
,086
,882
2,
244,
987,
742
Clos
ures
/writ
e off
s(1
,168
,929
,844
)(2
06,7
13,1
84)
(612
,081
,007
)(1
,987
,724
,036
)
Tran
sfer
s to
sta
ge 1
(638
,092
,869
)34
6,31
6,30
2 29
1,77
6,56
7 -
Tran
sfer
s to
sta
ge 2
239,
413,
555
(378
,634
,855
)13
9,22
1,29
9 -
Tran
sfer
s to
sta
ge 3
- a
t 31
Dec
embe
r 201
83,
592,
678,
860
792,
851,
161
1,02
4,83
3,08
7
5,41
0,36
3,10
8
| 10 | BDB Annual Report 2017
sl # Particulars 2009 2013 2014 2015 2016 2017X No.of Depositors 15,879 85,864 109,005 133,366 159,576 178,386
Main Branch 657 4821 6,322 8,436 11,186 15,101 BranchOffice 15,222 81,043 102,683 124,930 148,390 163,285
XI Number of Employess 221 357 385 416 452 563HeadOffice 66 110 125 117 144 152Main Branch 29 28 30 31 39 45BranchOffice 126 219 230 268 269 366
XII ActiveClients/EmployeeRatioMain Branch 90 112 111 120 107 101BranchOffice 137 172 187 181 193 144
XII Loans/EmployeeRatio 13 24 28 33 37 33Main Branch 62 142 153 169 153 152BranchOffice 8 21 27 32 39 33
BHUTAN DEVELOPMENT BANK LIMITED
NOTEs TO THE fINANCIAL sTATEMENT
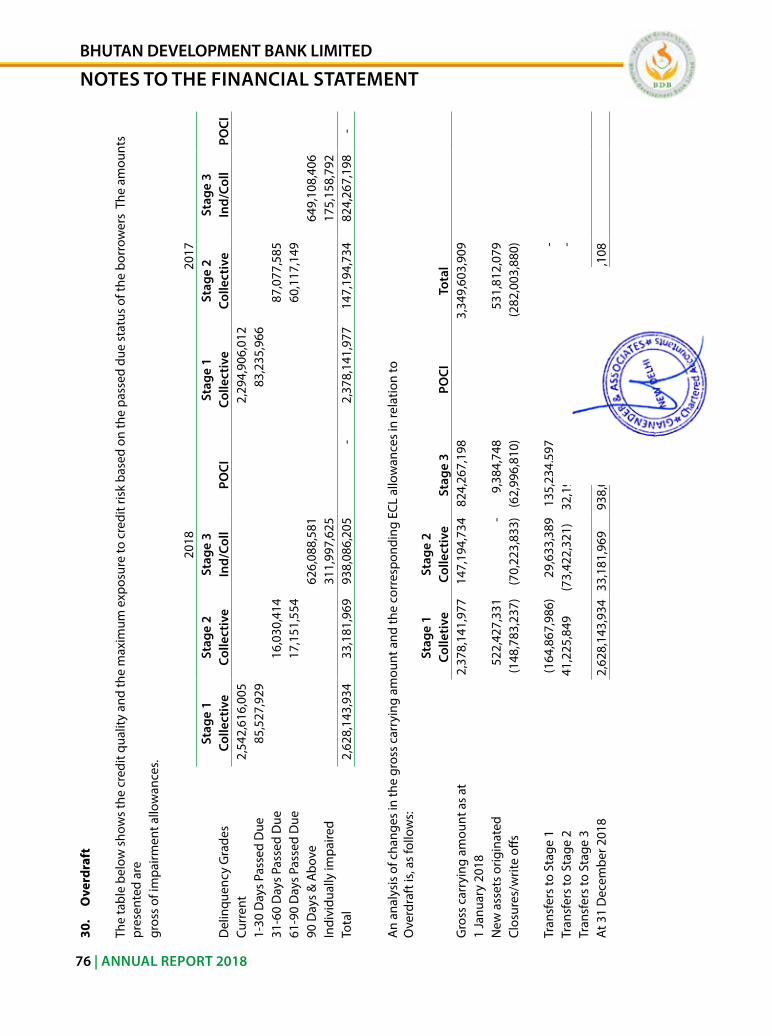
| 10 | BDB Annual Report 2017
sl # Particulars 2009 2013 2014 2015 2016 2017X No.of Depositors 15,879 85,864 109,005 133,366 159,576 178,386
Main Branch 657 4821 6,322 8,436 11,186 15,101 BranchOffice 15,222 81,043 102,683 124,930 148,390 163,285
XI Number of Employess 221 357 385 416 452 563HeadOffice 66 110 125 117 144 152Main Branch 29 28 30 31 39 45BranchOffice 126 219 230 268 269 366
XII ActiveClients/EmployeeRatioMain Branch 90 112 111 120 107 101BranchOffice 137 172 187 181 193 144
XII Loans/EmployeeRatio 13 24 28 33 37 33Main Branch 62 142 153 169 153 152BranchOffice 8 21 27 32 39 33
76 | ANNUAL REPORT 2018
30.
Ove
rdra
ft
The
tabl
e be
low
sho
ws
the
cred
it qu
ality
and
the
max
imum
exp
osur
e to
cre
dit r
isk
base
d on
the
pass
ed d
ue s
tatu
s of
the
borr
ower
s T
he a
mou
nts
pres
ente
d ar
e gr
oss
of im
pairm
ent a
llow
ance
s.
2018
2017
stag
e 1
stag
e 2
stag
e 3
st
age
1st
age
2st
age
3
Del
inqu
ency
Gra
des
Colle
ctiv
eCo
llect
ive
Ind/
Coll
POCI
Colle
ctiv
eCo
llect
ive
Ind/
Coll
POCI
Curr
ent
2,54
2,61
6,00
5
2
,294
,906
,012
1-
30 D
ays
Pass
ed D
ue85
,527
,929
8
3,23
5,96
6 31
-60
Day
s Pa
ssed
Due
16,0
30,4
14
87,0
77,5
85
61-9
0 D
ays
Pass
ed D
ue17
,151
,554
60
,117
,149
90
Day
s &
abo
ve62
6,08
8,58
1 64
9,10
8,40
6 in
divi
dual
ly im
paire
d31
1,99
7,62
5 17
5,15
8,79
2 To
tal
2,62
8,14
3,93
4 33
,181
,969
93
8,08
6,20
5 -
2,37
8,14
1,97
7 14
7,19
4,73
4 82
4,26
7,19
8
-
an
anal
ysis
of c
hang
es in
the
gros
s ca
rryi
ng a
mou
nt a
nd th
e co
rres
pond
ing
eCl
allo
wan
ces
in re
latio
n to
ove
rdra
ft is
, as
follo
ws:
stag
e 1
stag
e 2
Colle
tive
Colle
ctiv
est
age
3PO
CITo
tal
Gro
ss c
arry
ing
amou
nt a
s at
2,37
8,14
1,97
7 14
7,19
4,73
4 82
4,26
7,19
8
3,34
9,60
3,90
91
Janu
ary
2018
new
ass
ets
orig
inat
ed52
2,42
7,33
1
- 9,
384,
748
531,
812,
079
Clos
ures
/writ
e off
s(1
48,7
83,2
37)
(70,
223,
833)
(62,
996,
810)
(282
,003
,880
)
Tran
sfer
s to
sta
ge 1
(164
,867
,986
)29
,633
,389
13
5,23
4,59
7
-
Tr
ansf
ers
to s
tage
241
,225
,849
(7
3,42
2,32
1)32
,196
,472
-
Tr
ansf
ers
to s
tage
3a
t 31
Dec
embe
r 201
82,
628,
143,
934
33,1
81,9
69
938,
086,
205
3,
599,
412,
108
| 10 | BDB Annual Report 2017
sl # Particulars 2009 2013 2014 2015 2016 2017X No.of Depositors 15,879 85,864 109,005 133,366 159,576 178,386
Main Branch 657 4821 6,322 8,436 11,186 15,101 BranchOffice 15,222 81,043 102,683 124,930 148,390 163,285
XI Number of Employess 221 357 385 416 452 563HeadOffice 66 110 125 117 144 152Main Branch 29 28 30 31 39 45BranchOffice 126 219 230 268 269 366
XII ActiveClients/EmployeeRatioMain Branch 90 112 111 120 107 101BranchOffice 137 172 187 181 193 144
XII Loans/EmployeeRatio 13 24 28 33 37 33Main Branch 62 142 153 169 153 152BranchOffice 8 21 27 32 39 33
BHUTAN DEVELOPMENT BANK LIMITED
NOTEs TO THE fINANCIAL sTATEMENT
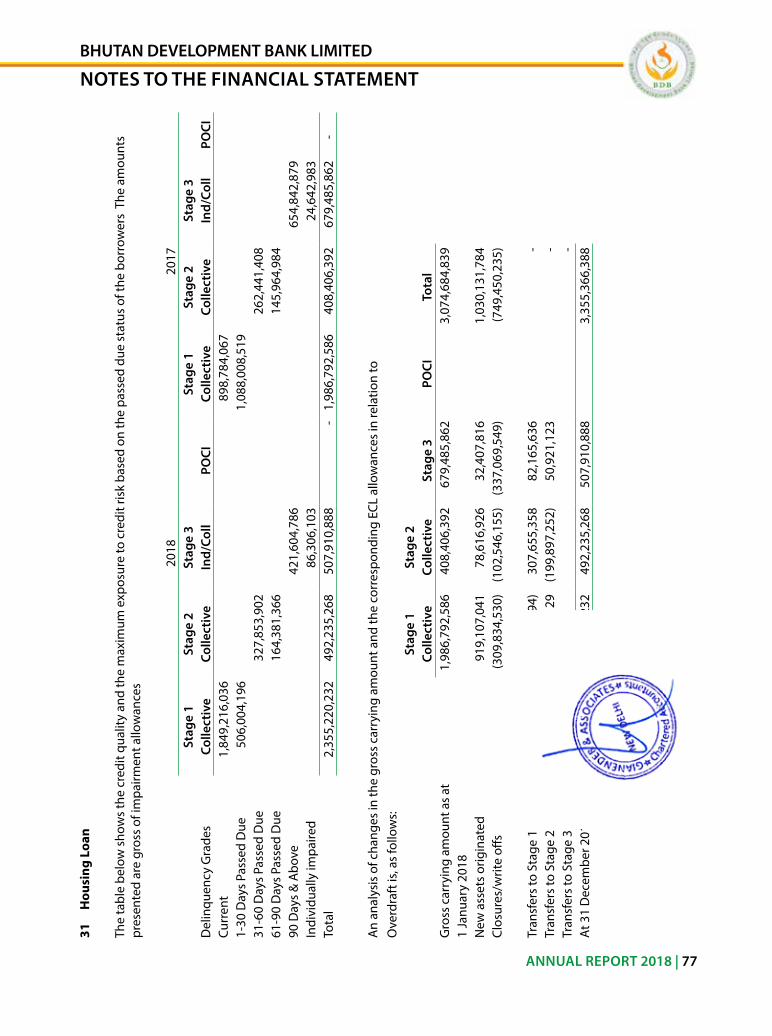
| 10 | BDB Annual Report 2017
sl # Particulars 2009 2013 2014 2015 2016 2017X No.of Depositors 15,879 85,864 109,005 133,366 159,576 178,386
Main Branch 657 4821 6,322 8,436 11,186 15,101 BranchOffice 15,222 81,043 102,683 124,930 148,390 163,285
XI Number of Employess 221 357 385 416 452 563HeadOffice 66 110 125 117 144 152Main Branch 29 28 30 31 39 45BranchOffice 126 219 230 268 269 366
XII ActiveClients/EmployeeRatioMain Branch 90 112 111 120 107 101BranchOffice 137 172 187 181 193 144
XII Loans/EmployeeRatio 13 24 28 33 37 33Main Branch 62 142 153 169 153 152BranchOffice 8 21 27 32 39 33
ANNUAL REPORT 2018 | 77
31
Hou
sing
Loa
n
The
tabl
e be
low
sho
ws
the
cred
it qu
ality
and
the
max
imum
exp
osur
e to
cre
dit r
isk
base
d on
the
pass
ed d
ue s
tatu
s of
the
borr
ower
s T
he a
mou
nts
pres
ente
d ar
e gr
oss
of im
pairm
ent a
llow
ance
s
2018
2017
stag
e 1
stag
e 2
stag
e 3
st
age
1st
age
2st
age
3
Del
inqu
ency
Gra
des
Colle
ctiv
eCo
llect
ive
Ind/
Coll
POCI
Colle
ctiv
eCo
llect
ive
Ind/
Coll
POCI
Curr
ent
1,84
9,21
6,03
6 89
8,78
4,06
7 1-
30 D
ays
Pass
ed D
ue50
6,00
4,19
6 1,
088,
008,
519
31-6
0 D
ays
Pass
ed D
ue32
7,85
3,90
2 26
2,44
1,40
8 61
-90
Day
s Pa
ssed
Due
164,
381,
366
145,
964,
984
90 D
ays
& a
bove
42
1,60
4,78
6 65
4,84
2,87
9 in
divi
dual
ly im
paire
d
86
,306
,103
24
,642
,983
To
tal
2,
355,
220,
232
492,
235,
268
50
7,91
0,88
8
-
1,98
6,79
2,58
6 40
8,40
6,39
2 67
9,48
5,86
2
-
an
anal
ysis
of c
hang
es in
the
gros
s ca
rryi
ng a
mou
nt a
nd th
e co
rres
pond
ing
eCl
allo
wan
ces
in re
latio
n to
ove
rdra
ft is
, as
follo
ws:
stag
e 1
stag
e 2
Colle
ctiv
eCo
llect
ive
stag
e 3
POCI
Tota
lG
ross
car
ryin
g am
ount
as
at1,
986,
792,
586
408,
406,
392
67
9,48
5,86
2
3,07
4,68
4,83
9 1
Janu
ary
2018
new
ass
ets
orig
inat
ed91
9,10
7,04
1 78
,616
,926
32
,407
,816
1,
030,
131,
784
Clos
ures
/writ
e off
s(3
09,8
34,5
30)
(102
,546
,155
)(3
37,0
69,5
49)
(749
,450
,235
)
Tran
sfer
s to
sta
ge 1
(389
,820
,994
)30
7,65
5,35
8 82
,165
,636
-
Tran
sfer
s to
sta
ge 2
148,
976,
129
(199
,897
,252
)50
,921
,123
-
Tran
sfer
s to
sta
ge 3
- a
t 31
Dec
embe
r 201
82,
355,
220,
232
492,
235,
268
507,
910,
888
3,
355,
366,
388
| 10 | BDB Annual Report 2017
sl # Particulars 2009 2013 2014 2015 2016 2017X No.of Depositors 15,879 85,864 109,005 133,366 159,576 178,386
Main Branch 657 4821 6,322 8,436 11,186 15,101 BranchOffice 15,222 81,043 102,683 124,930 148,390 163,285
XI Number of Employess 221 357 385 416 452 563HeadOffice 66 110 125 117 144 152Main Branch 29 28 30 31 39 45BranchOffice 126 219 230 268 269 366
XII ActiveClients/EmployeeRatioMain Branch 90 112 111 120 107 101BranchOffice 137 172 187 181 193 144
XII Loans/EmployeeRatio 13 24 28 33 37 33Main Branch 62 142 153 169 153 152BranchOffice 8 21 27 32 39 33
BHUTAN DEVELOPMENT BANK LIMITED
NOTEs TO THE fINANCIAL sTATEMENT
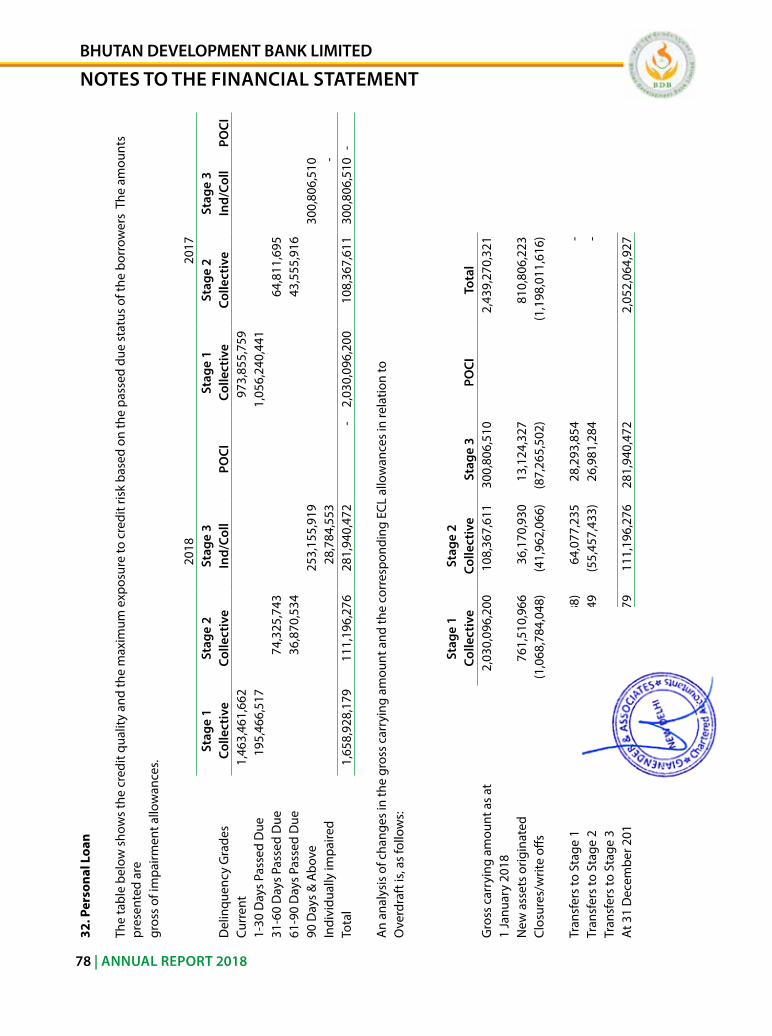
| 10 | BDB Annual Report 2017
sl # Particulars 2009 2013 2014 2015 2016 2017X No.of Depositors 15,879 85,864 109,005 133,366 159,576 178,386
Main Branch 657 4821 6,322 8,436 11,186 15,101 BranchOffice 15,222 81,043 102,683 124,930 148,390 163,285
XI Number of Employess 221 357 385 416 452 563HeadOffice 66 110 125 117 144 152Main Branch 29 28 30 31 39 45BranchOffice 126 219 230 268 269 366
XII ActiveClients/EmployeeRatioMain Branch 90 112 111 120 107 101BranchOffice 137 172 187 181 193 144
XII Loans/EmployeeRatio 13 24 28 33 37 33Main Branch 62 142 153 169 153 152BranchOffice 8 21 27 32 39 33
78 | ANNUAL REPORT 2018
32. P
erso
nal L
oan
The
tabl
e be
low
sho
ws
the
cred
it qu
ality
and
the
max
imum
exp
osur
e to
cre
dit r
isk
base
d on
the
pass
ed d
ue s
tatu
s of
the
borr
ower
s T
he a
mou
nts
pres
ente
d ar
e gr
oss
of im
pairm
ent a
llow
ance
s.
2018
2017
stag
e 1
stag
e 2
stag
e 3
st
age
1st
age
2st
age
3
Del
inqu
ency
Gra
des
Colle
ctiv
eCo
llect
ive
Ind/
Coll
POCI
Colle
ctiv
eCo
llect
ive
Ind/
Coll
POCI
Curr
ent
1,46
3,46
1,66
2
973
,855
,759
1-
30 D
ays
Pass
ed D
ue19
5,46
6,51
7 1
,056
,240
,441
31
-60
Day
s Pa
ssed
Due
74,3
25,7
43
64,8
11,6
95
61-9
0 D
ays
Pass
ed D
ue36
,870
,534
43
,555
,916
90
Day
s &
abo
ve25
3,15
5,91
9 30
0,80
6,51
0 in
divi
dual
ly im
paire
d28
,784
,553
- To
tal
1,65
8,92
8,17
9 11
1,19
6,27
6 28
1,94
0,47
2
- 2
,030
,096
,200
10
8,36
7,61
1 30
0,80
6,51
0 -
an
anal
ysis
of c
hang
es in
the
gros
s ca
rryi
ng a
mou
nt a
nd th
e co
rres
pond
ing
eCl
allo
wan
ces
in re
latio
n to
ove
rdra
ft is
, as
follo
ws:
stag
e 1
stag
e 2
Colle
ctiv
eCo
llect
ive
stag
e 3
POCI
Tota
lG
ross
car
ryin
g am
ount
as
at2,
030,
096,
200
108
,367
,611
3
00,8
06,5
10
2,
439,
270,
321
1 Ja
nuar
y 20
18n
ew a
sset
s or
igin
ated
761
,510
,966
36,
170,
930
1
3,12
4,32
7 81
0,80
6,22
3 Cl
osur
es/w
rite
offs
(1,0
68,7
84,0
48)
(4
1,96
2,06
6) (
87,2
65,5
02)
(1,1
98,0
11,6
16)
Tran
sfer
s to
sta
ge 1
(92,
371,
088)
6
4,07
7,23
5
28,
293,
854
- Tr
ansf
ers
to s
tage
2
28,4
76,1
49
(5
5,45
7,43
3)
26,
981,
284
- Tr
ansf
ers
to s
tage
3a
t 31
Dec
embe
r 201
81,
658,
928,
179
111
,196
,276
2
81,9
40,4
72
2,
052,
064,
927
| 10 | BDB Annual Report 2017
sl # Particulars 2009 2013 2014 2015 2016 2017X No.of Depositors 15,879 85,864 109,005 133,366 159,576 178,386
Main Branch 657 4821 6,322 8,436 11,186 15,101 BranchOffice 15,222 81,043 102,683 124,930 148,390 163,285
XI Number of Employess 221 357 385 416 452 563HeadOffice 66 110 125 117 144 152Main Branch 29 28 30 31 39 45BranchOffice 126 219 230 268 269 366
XII ActiveClients/EmployeeRatioMain Branch 90 112 111 120 107 101BranchOffice 137 172 187 181 193 144
XII Loans/EmployeeRatio 13 24 28 33 37 33Main Branch 62 142 153 169 153 152BranchOffice 8 21 27 32 39 33
BHUTAN DEVELOPMENT BANK LIMITED
NOTEs TO THE fINANCIAL sTATEMENT
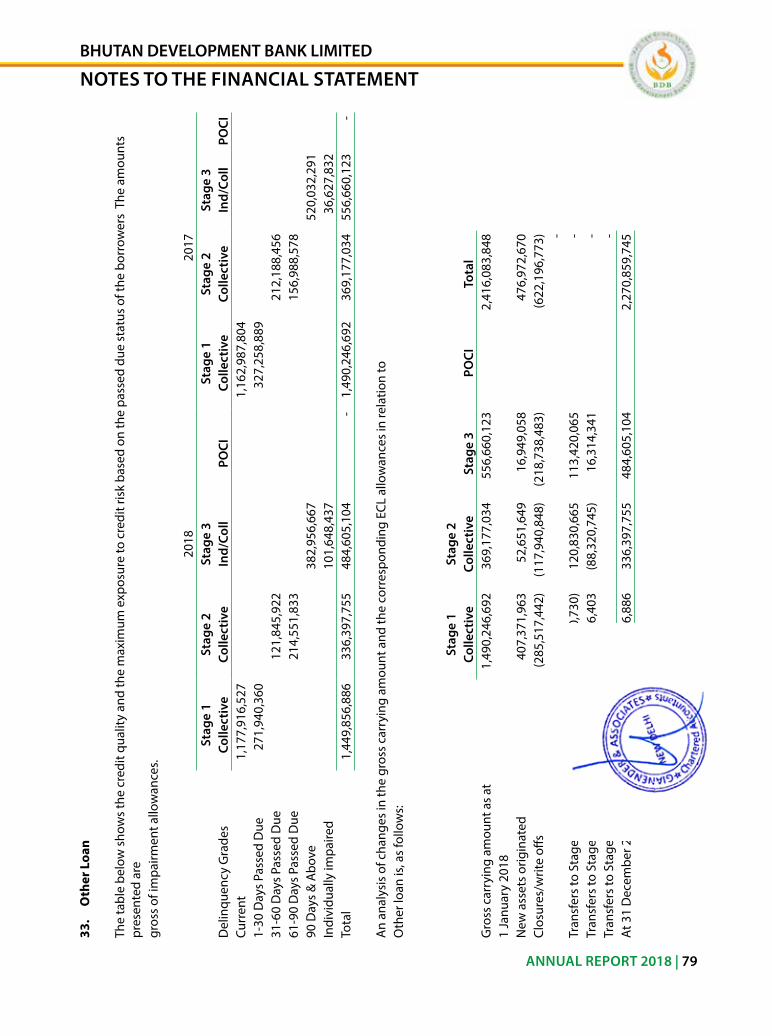
| 10 | BDB Annual Report 2017
sl # Particulars 2009 2013 2014 2015 2016 2017X No.of Depositors 15,879 85,864 109,005 133,366 159,576 178,386
Main Branch 657 4821 6,322 8,436 11,186 15,101 BranchOffice 15,222 81,043 102,683 124,930 148,390 163,285
XI Number of Employess 221 357 385 416 452 563HeadOffice 66 110 125 117 144 152Main Branch 29 28 30 31 39 45BranchOffice 126 219 230 268 269 366
XII ActiveClients/EmployeeRatioMain Branch 90 112 111 120 107 101BranchOffice 137 172 187 181 193 144
XII Loans/EmployeeRatio 13 24 28 33 37 33Main Branch 62 142 153 169 153 152BranchOffice 8 21 27 32 39 33
ANNUAL REPORT 2018 | 79
33.
Oth
er L
oan
The
tabl
e be
low
sho
ws
the
cred
it qu
ality
and
the
max
imum
exp
osur
e to
cre
dit r
isk
base
d on
the
pass
ed d
ue s
tatu
s of
the
borr
ower
s T
he a
mou
nts
pres
ente
d ar
e gr
oss
of im
pairm
ent a
llow
ance
s.
2018
2017
stag
e 1
stag
e 2
stag
e 3
st
age
1st
age
2st
age
3
Del
inqu
ency
Gra
des
Colle
ctiv
eCo
llect
ive
Ind/
Coll
POCI
Colle
ctiv
eCo
llect
ive
Ind/
Coll
POCI
Curr
ent
1,1
77,9
16,5
27
1,1
62,9
87,8
04
1-30
Day
s Pa
ssed
Due
271,
940,
360
327,
258,
889
31-6
0 D
ays
Pass
ed D
ue12
1,84
5,92
2 21
2,18
8,45
6 61
-90
Day
s Pa
ssed
Due
214,
551,
833
156,
988,
578
90 D
ays
& a
bove
3
82,9
56,6
67
520
,032
,291
in
divi
dual
ly im
paire
d
101
,648
,437
36,
627,
832
Tota
l1,
449,
856,
886
336,
397,
755
4
84,6
05,1
04
-
1,49
0,24
6,69
2 36
9,17
7,03
4 55
6,66
0,12
3
-
an
anal
ysis
of c
hang
es in
the
gros
s ca
rryi
ng a
mou
nt a
nd th
e co
rres
pond
ing
eCl
allo
wan
ces
in re
latio
n to
oth
er lo
an is
, as
follo
ws:
stag
e 1
stag
e 2
Colle
ctiv
eCo
llect
ive
stag
e 3
POCI
Tota
lG
ross
car
ryin
g am
ount
as
at 1
,490
,246
,692
369
,177
,034
55
6,66
0,12
3
2,41
6,08
3,84
81
Janu
ary
2018
new
ass
ets
orig
inat
ed40
7,37
1,96
3
5
2,65
1,64
9 16
,949
,058
47
6,97
2,67
0 Cl
osur
es/w
rite
offs
(285
,517
,442
)
(117
,940
,848
)(2
18,7
38,4
83)
(622
,196
,773
) - Tr
ansf
ers
to s
tage
1(2
34,2
50,7
30)
1
20,8
30,6
65
113,
420,
065
- Tr
ansf
ers
to s
tage
2
7
2,00
6,40
3 (8
8,32
0,74
5)16
,314
,341
-
Tran
sfer
s to
sta
ge 3
- a
t 31
Dec
embe
r 201
8 1
,449
,856
,886
336
,397
,755
48
4,60
5,10
4
2,27
0,85
9,74
5
| 10 | BDB Annual Report 2017
sl # Particulars 2009 2013 2014 2015 2016 2017X No.of Depositors 15,879 85,864 109,005 133,366 159,576 178,386
Main Branch 657 4821 6,322 8,436 11,186 15,101 BranchOffice 15,222 81,043 102,683 124,930 148,390 163,285
XI Number of Employess 221 357 385 416 452 563HeadOffice 66 110 125 117 144 152Main Branch 29 28 30 31 39 45BranchOffice 126 219 230 268 269 366
XII ActiveClients/EmployeeRatioMain Branch 90 112 111 120 107 101BranchOffice 137 172 187 181 193 144
XII Loans/EmployeeRatio 13 24 28 33 37 33Main Branch 62 142 153 169 153 152BranchOffice 8 21 27 32 39 33
BHUTAN DEVELOPMENT BANK LIMITED
NOTEs TO THE fINANCIAL sTATEMENT
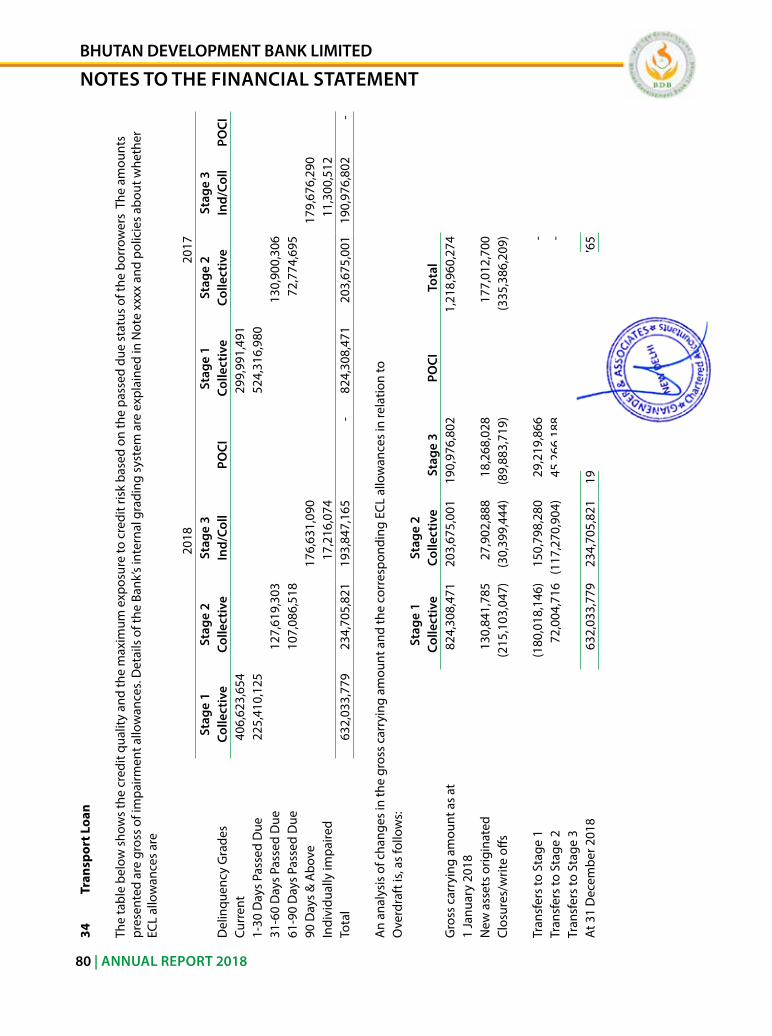
| 10 | BDB Annual Report 2017
sl # Particulars 2009 2013 2014 2015 2016 2017X No.of Depositors 15,879 85,864 109,005 133,366 159,576 178,386
Main Branch 657 4821 6,322 8,436 11,186 15,101 BranchOffice 15,222 81,043 102,683 124,930 148,390 163,285
XI Number of Employess 221 357 385 416 452 563HeadOffice 66 110 125 117 144 152Main Branch 29 28 30 31 39 45BranchOffice 126 219 230 268 269 366
XII ActiveClients/EmployeeRatioMain Branch 90 112 111 120 107 101BranchOffice 137 172 187 181 193 144
XII Loans/EmployeeRatio 13 24 28 33 37 33Main Branch 62 142 153 169 153 152BranchOffice 8 21 27 32 39 33
80 | ANNUAL REPORT 2018
34
T
rans
port
Loa
n
The
tabl
e be
low
sho
ws
the
cred
it qu
ality
and
the
max
imum
exp
osur
e to
cre
dit r
isk
base
d on
the
pass
ed d
ue s
tatu
s of
the
borr
ower
s T
he a
mou
nts
pres
ente
d ar
e gr
oss
of im
pairm
ent a
llow
ance
s. D
etai
ls o
f the
Ban
k’s
inte
rnal
gra
ding
sys
tem
are
exp
lain
ed in
not
e xx
xx a
nd p
olic
ies
abou
t whe
ther
eC
l al
low
ance
s ar
e
2018
2017
stag
e 1
stag
e 2
stag
e 3
st
age
1st
age
2st
age
3
Del
inqu
ency
Gra
des
Colle
ctiv
eCo
llect
ive
Ind/
Coll
POCI
Colle
ctiv
eCo
llect
ive
Ind/
Coll
POCI
Curr
ent
406
,623
,654
29
9,99
1,49
1 1-
30 D
ays
Pass
ed D
ue
225,
410,
125
524,
316,
980
31-6
0 D
ays
Pass
ed D
ue
127,
619,
303
130,
900,
306
61-9
0 D
ays
Pass
ed D
ue
107,
086,
518
72,7
74,6
95
90 D
ays
& a
bove
17
6,63
1,09
0 17
9,67
6,29
0 in
divi
dual
ly im
paire
d17
,216
,074
11
,300
,512
To
tal
63
2,03
3,77
9
234,
705,
821
19
3,84
7,16
5
- 82
4,30
8,47
1 20
3,67
5,00
1 19
0,97
6,80
2 -
an
anal
ysis
of c
hang
es in
the
gros
s ca
rryi
ng a
mou
nt a
nd th
e co
rres
pond
ing
eCl
allo
wan
ces
in re
latio
n to
ove
rdra
ft is
, as
follo
ws:
stag
e 1
stag
e 2
Colle
ctiv
eCo
llect
ive
stag
e 3
POCI
Tota
lG
ross
car
ryin
g am
ount
as
at
824,
308,
471
20
3,67
5,00
1 1
90,9
76,8
02
1,
218,
960,
274
1 Ja
nuar
y 20
18n
ew a
sset
s or
igin
ated
13
0,84
1,78
5 27
,902
,888
18,
268,
028
177,
012,
700
Clos
ures
/writ
e off
s (
215,
103,
047)
(30,
399,
444)
(89
,883
,719
)(3
35,3
86,2
09)
Tran
sfer
s to
sta
ge 1
(18
0,01
8,14
6)
150,
798,
280
2
9,21
9,86
6 -
Tran
sfer
s to
sta
ge 2
72,0
04,7
16
(117
,270
,904
)
45,
266,
188
- Tr
ansf
ers
to s
tage
3a
t 31
Dec
embe
r 201
8
632,
033,
779
23
4,70
5,82
1 1
93,8
47,1
65
1,
060,
586,
765
| 10 | BDB Annual Report 2017
sl # Particulars 2009 2013 2014 2015 2016 2017X No.of Depositors 15,879 85,864 109,005 133,366 159,576 178,386
Main Branch 657 4821 6,322 8,436 11,186 15,101 BranchOffice 15,222 81,043 102,683 124,930 148,390 163,285
XI Number of Employess 221 357 385 416 452 563HeadOffice 66 110 125 117 144 152Main Branch 29 28 30 31 39 45BranchOffice 126 219 230 268 269 366
XII ActiveClients/EmployeeRatioMain Branch 90 112 111 120 107 101BranchOffice 137 172 187 181 193 144
XII Loans/EmployeeRatio 13 24 28 33 37 33Main Branch 62 142 153 169 153 152BranchOffice 8 21 27 32 39 33
BHUTAN DEVELOPMENT BANK LIMITED
NOTEs TO THE fINANCIAL sTATEMENT
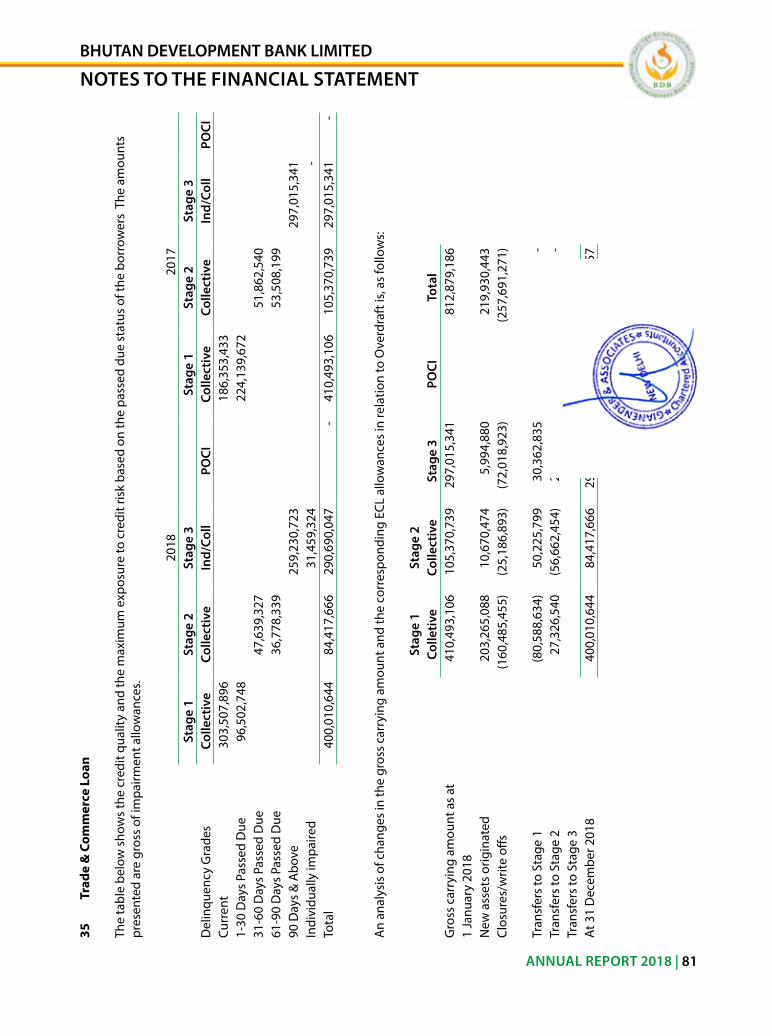
| 10 | BDB Annual Report 2017
sl # Particulars 2009 2013 2014 2015 2016 2017X No.of Depositors 15,879 85,864 109,005 133,366 159,576 178,386
Main Branch 657 4821 6,322 8,436 11,186 15,101 BranchOffice 15,222 81,043 102,683 124,930 148,390 163,285
XI Number of Employess 221 357 385 416 452 563HeadOffice 66 110 125 117 144 152Main Branch 29 28 30 31 39 45BranchOffice 126 219 230 268 269 366
XII ActiveClients/EmployeeRatioMain Branch 90 112 111 120 107 101BranchOffice 137 172 187 181 193 144
XII Loans/EmployeeRatio 13 24 28 33 37 33Main Branch 62 142 153 169 153 152BranchOffice 8 21 27 32 39 33
ANNUAL REPORT 2018 | 81
35
T
rade
& C
omm
erce
Loa
n
The
tabl
e be
low
sho
ws
the
cred
it qu
ality
and
the
max
imum
exp
osur
e to
cre
dit r
isk
base
d on
the
pass
ed d
ue s
tatu
s of
the
borr
ower
s T
he a
mou
nts
pres
ente
d ar
e gr
oss
of im
pairm
ent a
llow
ance
s.
2018
2017
stag
e 1
stag
e 2
stag
e 3
st
age
1st
age
2st
age
3
Del
inqu
ency
Gra
des
Colle
ctiv
eCo
llect
ive
Ind/
Coll
POCI
Colle
ctiv
eCo
llect
ive
Ind/
Coll
POCI
Curr
ent
303
,507
,896
1
86,3
53,4
33
1-30
Day
s Pa
ssed
Due
9
6,50
2,74
8
224,
139,
672
31-6
0 D
ays
Pass
ed D
ue
47
,639
,327
5
1,86
2,54
0 61
-90
Day
s Pa
ssed
Due
36,7
78,3
39
53,
508,
199
90 D
ays
& a
bove
259
,230
,723
2
97,0
15,3
41
indi
vidu
ally
impa
ired
3
1,45
9,32
4
- To
tal
40
0,01
0,64
4
84
,417
,666
2
90,6
90,0
47
-
41
0,49
3,10
6 10
5,37
0,73
9
297,
015,
341
-
an
anal
ysis
of c
hang
es in
the
gros
s ca
rryi
ng a
mou
nt a
nd th
e co
rres
pond
ing
eCl
allo
wan
ces
in re
latio
n to
ove
rdra
ft is
, as
follo
ws:
stag
e 1
stag
e 2
Colle
tive
Colle
ctiv
est
age
3PO
CITo
tal
Gro
ss c
arry
ing
amou
nt a
s at
41
0,49
3,10
6 1
05,3
70,7
39
297
,015
,341
812,
879,
186
1 Ja
nuar
y 20
18n
ew a
sset
s or
igin
ated
20
3,26
5,08
8
10,
670,
474
5,9
94,8
80
219,
930,
443
Clos
ures
/writ
e off
s(1
60,4
85,4
55)
(2
5,18
6,89
3)
(72,
018,
923)
(257
,691
,271
)
Tran
sfer
s to
sta
ge 1
(8
0,58
8,63
4)
50,
225,
799
3
0,36
2,83
5
-
Tran
sfer
s to
sta
ge 2
27,3
26,5
40
(5
6,66
2,45
4)
29,
335,
914
- Tr
ansf
ers
to s
tage
3a
t 31
Dec
embe
r 201
8
400,
010,
644
8
4,41
7,66
6 2
90,6
90,0
47
77
5,11
8,35
7
| 10 | BDB Annual Report 2017
sl # Particulars 2009 2013 2014 2015 2016 2017X No.of Depositors 15,879 85,864 109,005 133,366 159,576 178,386
Main Branch 657 4821 6,322 8,436 11,186 15,101 BranchOffice 15,222 81,043 102,683 124,930 148,390 163,285
XI Number of Employess 221 357 385 416 452 563HeadOffice 66 110 125 117 144 152Main Branch 29 28 30 31 39 45BranchOffice 126 219 230 268 269 366
XII ActiveClients/EmployeeRatioMain Branch 90 112 111 120 107 101BranchOffice 137 172 187 181 193 144
XII Loans/EmployeeRatio 13 24 28 33 37 33Main Branch 62 142 153 169 153 152BranchOffice 8 21 27 32 39 33
BHUTAN DEVELOPMENT BANK LIMITED
NOTEs TO THE fINANCIAL sTATEMENT
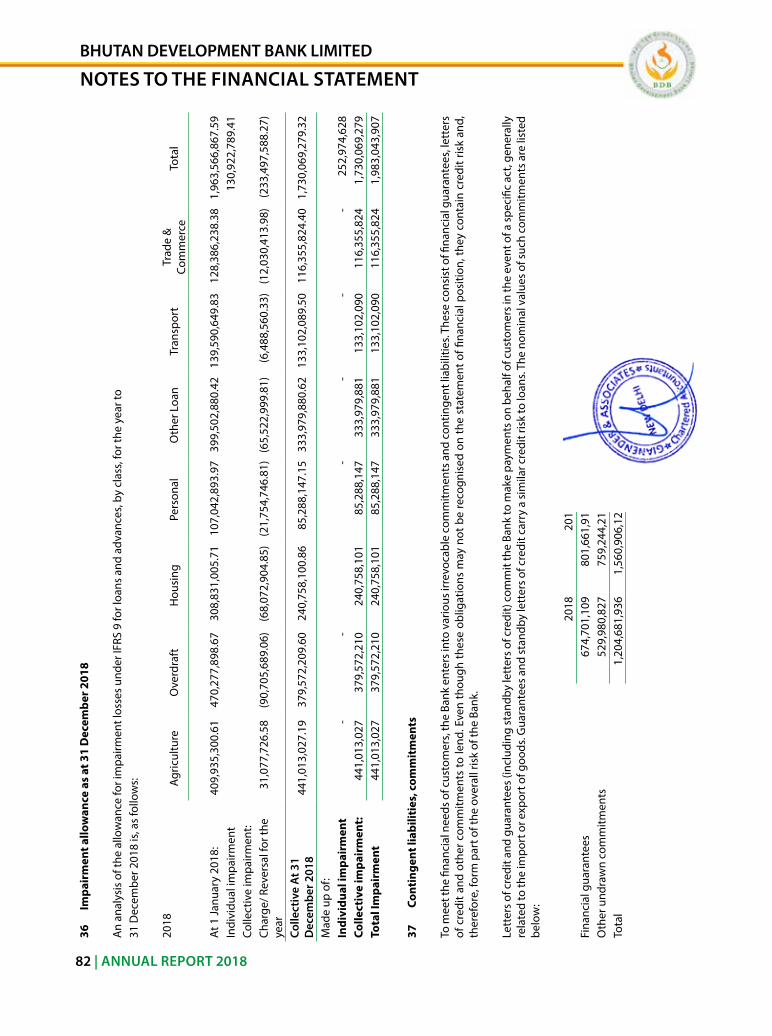
| 10 | BDB Annual Report 2017
sl # Particulars 2009 2013 2014 2015 2016 2017X No.of Depositors 15,879 85,864 109,005 133,366 159,576 178,386
Main Branch 657 4821 6,322 8,436 11,186 15,101 BranchOffice 15,222 81,043 102,683 124,930 148,390 163,285
XI Number of Employess 221 357 385 416 452 563HeadOffice 66 110 125 117 144 152Main Branch 29 28 30 31 39 45BranchOffice 126 219 230 268 269 366
XII ActiveClients/EmployeeRatioMain Branch 90 112 111 120 107 101BranchOffice 137 172 187 181 193 144
XII Loans/EmployeeRatio 13 24 28 33 37 33Main Branch 62 142 153 169 153 152BranchOffice 8 21 27 32 39 33
82 | ANNUAL REPORT 2018
36
Im
pair
men
t allo
wan
ce a
s at
31
Dec
embe
r 201
8
an
anal
ysis
of t
he a
llow
ance
for i
mpa
irmen
t los
ses
unde
r iFr
s 9
for l
oans
and
adv
ance
s, by
cla
ss, f
or th
e ye
ar to
31 D
ecem
ber 2
018
is, a
s fo
llow
s:
2018
agric
ultu
reo
verd
raft
Hou
sing
Pers
onal
oth
er l
oan
Tran
spor
tTr
ade
&
Com
mer
ceTo
tal
at 1
Janu
ary
2018
:40
9,93
5,30
0.61
4
70,2
77,8
98.6
7 30
8,83
1,00
5.71
10
7,04
2,89
3.97
39
9,50
2,88
0.42
13
9,59
0,64
9.83
12
8,38
6,23
8.38
1,
963,
566,
867.
59
indi
vidu
al im
pairm
ent
130,
922,
789.
41
Colle
ctiv
e im
pairm
ent:
Char
ge/ r
ever
sal f
or th
e ye
ar31
,077
,726
.58
(90,
705,
689.
06)
(68,
072,
904.
85)
(21,
754,
746.
81)
(65,
522,
999.
81)
(6,4
88,5
60.3
3)(1
2,03
0,41
3.98
)(2
33,4
97,5
88.2
7)
Colle
ctiv
e A
t 31
Dec
embe
r 201
844
1,01
3,02
7.19
3
79,5
72,2
09.6
0 24
0,75
8,10
0.86
85
,288
,147
.15
333,
979,
880.
62
133,
102,
089.
50
116,
355,
824.
40
1,73
0,06
9,27
9.32
Mad
e up
of:
Indi
vidu
al im
pair
men
t-
-
-
-
-
-
252,
974,
628
Colle
ctiv
e im
pair
men
t:44
1,01
3,02
7
3
79,5
72,2
10
240
,758
,101
85
,288
,147
33
3,97
9,88
1 13
3,10
2,09
0
1
16,3
55,8
24
1,73
0,06
9,27
9 To
tal I
mpa
irm
ent
441,
013,
027
379
,572
,210
24
0,75
8,10
1 85
,288
,147
33
3,97
9,88
1 13
3,10
2,09
0 11
6,35
5,82
4 1,
983,
043,
907
37
Con
ting
ent l
iabi
litie
s, c
omm
itm
ents
To m
eet t
he fi
nanc
ial n
eeds
of c
usto
mer
s, th
e Ba
nk e
nter
s int
o va
rious
irre
voca
ble
com
mitm
ents
and
con
tinge
nt li
abili
ties.
Thes
e co
nsis
t of fi
nanc
ial g
uara
ntee
s, le
tter
s of
cre
dit a
nd o
ther
com
mitm
ents
to le
nd. e
ven
thou
gh th
ese
oblig
atio
ns m
ay n
ot b
e re
cogn
ised
on
the
stat
emen
t of fi
nanc
ial p
ositi
on, t
hey
cont
ain
cred
it ris
k an
d,
ther
efor
e, fo
rm p
art o
f the
ove
rall
risk
of th
e Ba
nk.
lett
ers o
f cre
dit a
nd g
uara
ntee
s (in
clud
ing
stan
dby
lett
ers o
f cre
dit)
com
mit
the
Bank
to m
ake
paym
ents
on
beha
lf of
cus
tom
ers i
n th
e ev
ent o
f a sp
ecifi
c ac
t, ge
nera
lly
rela
ted
to th
e im
port
or e
xpor
t of g
oods
. Gua
rant
ees a
nd st
andb
y le
tter
s of c
redi
t car
ry a
sim
ilar c
redi
t ris
k to
loan
s. Th
e no
min
al v
alue
s of s
uch
com
mitm
ents
are
list
ed
belo
w:
2018
2017
Fina
ncia
l gua
rant
ees
674,
701,
109
801,
661,
911
oth
er u
ndra
wn
com
mitm
ents
529,
980,
827
759,
244,
212
Tota
l1,
204,
681,
936
1,56
0,90
6,12
3
| 10 | BDB Annual Report 2017
sl # Particulars 2009 2013 2014 2015 2016 2017X No.of Depositors 15,879 85,864 109,005 133,366 159,576 178,386
Main Branch 657 4821 6,322 8,436 11,186 15,101 BranchOffice 15,222 81,043 102,683 124,930 148,390 163,285
XI Number of Employess 221 357 385 416 452 563HeadOffice 66 110 125 117 144 152Main Branch 29 28 30 31 39 45BranchOffice 126 219 230 268 269 366
XII ActiveClients/EmployeeRatioMain Branch 90 112 111 120 107 101BranchOffice 137 172 187 181 193 144
XII Loans/EmployeeRatio 13 24 28 33 37 33Main Branch 62 142 153 169 153 152BranchOffice 8 21 27 32 39 33
BHUTAN DEVELOPMENT BANK LIMITED
NOTEs TO THE fINANCIAL sTATEMENT
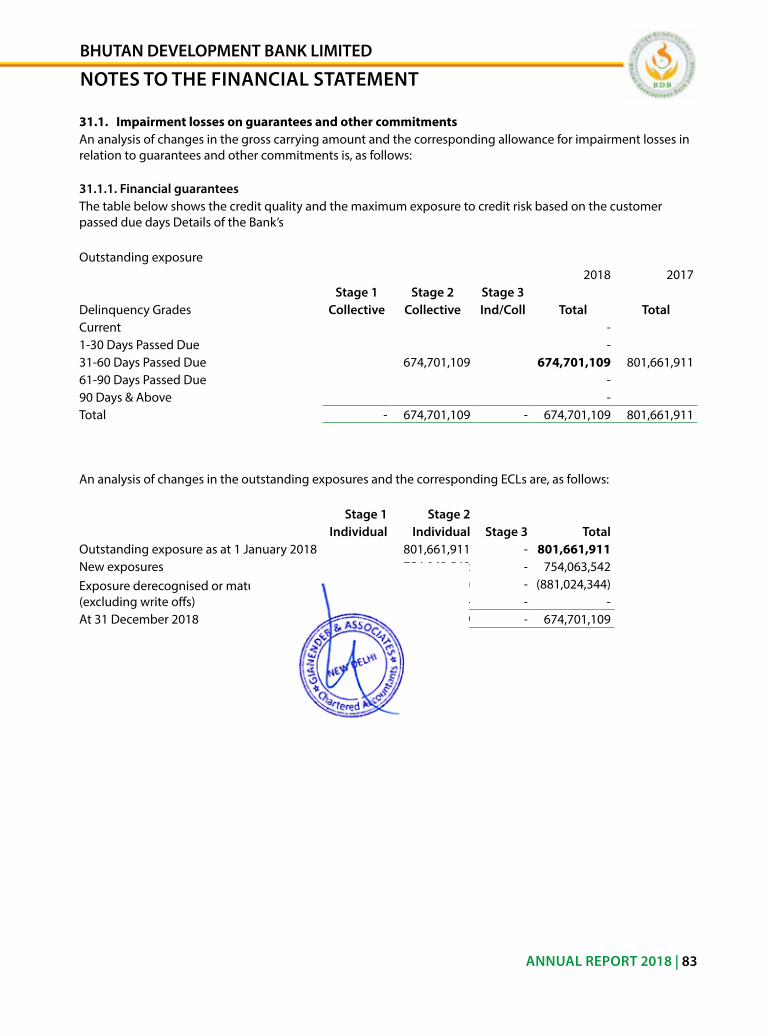
| 10 | BDB Annual Report 2017
sl # Particulars 2009 2013 2014 2015 2016 2017X No.of Depositors 15,879 85,864 109,005 133,366 159,576 178,386
Main Branch 657 4821 6,322 8,436 11,186 15,101 BranchOffice 15,222 81,043 102,683 124,930 148,390 163,285
XI Number of Employess 221 357 385 416 452 563HeadOffice 66 110 125 117 144 152Main Branch 29 28 30 31 39 45BranchOffice 126 219 230 268 269 366
XII ActiveClients/EmployeeRatioMain Branch 90 112 111 120 107 101BranchOffice 137 172 187 181 193 144
XII Loans/EmployeeRatio 13 24 28 33 37 33Main Branch 62 142 153 169 153 152BranchOffice 8 21 27 32 39 33
ANNUAL REPORT 2018 | 83
31.1. Impairment losses on guarantees and other commitmentsan analysis of changes in the gross carrying amount and the corresponding allowance for impairment losses in relation to guarantees and other commitments is, as follows:
31.1.1. financial guaranteesThe table below shows the credit quality and the maximum exposure to credit risk based on the customer passed due days Details of the Bank’s
outstanding exposure2018 2017
stage 1 stage 2 stage 3 Delinquency Grades Collective Collective Ind/Coll Total TotalCurrent - 1-30 Days Passed Due - 31-60 Days Passed Due 674,701,109 674,701,109 801,661,911 61-90 Days Passed Due - 90 Days & above - Total - 674,701,109 - 674,701,109 801,661,911
an analysis of changes in the outstanding exposures and the corresponding eCls are, as follows:
stage 1 stage 2Individual Individual stage 3 Total
outstanding exposure as at 1 January 2018 801,661,911 - 801,661,911 new exposures 754,063,542 - 754,063,542 exposure derecognised or matured/lapsed (excluding write offs)
(881,024,344) - (881,024,344)- - - -
at 31 December 2018 - 674,701,109 - 674,701,109
| 10 | BDB Annual Report 2017
sl # Particulars 2009 2013 2014 2015 2016 2017X No.of Depositors 15,879 85,864 109,005 133,366 159,576 178,386
Main Branch 657 4821 6,322 8,436 11,186 15,101 BranchOffice 15,222 81,043 102,683 124,930 148,390 163,285
XI Number of Employess 221 357 385 416 452 563HeadOffice 66 110 125 117 144 152Main Branch 29 28 30 31 39 45BranchOffice 126 219 230 268 269 366
XII ActiveClients/EmployeeRatioMain Branch 90 112 111 120 107 101BranchOffice 137 172 187 181 193 144
XII Loans/EmployeeRatio 13 24 28 33 37 33Main Branch 62 142 153 169 153 152BranchOffice 8 21 27 32 39 33
BHUTAN DEVELOPMENT BANK LIMITED
NOTEs TO THE fINANCIAL sTATEMENT
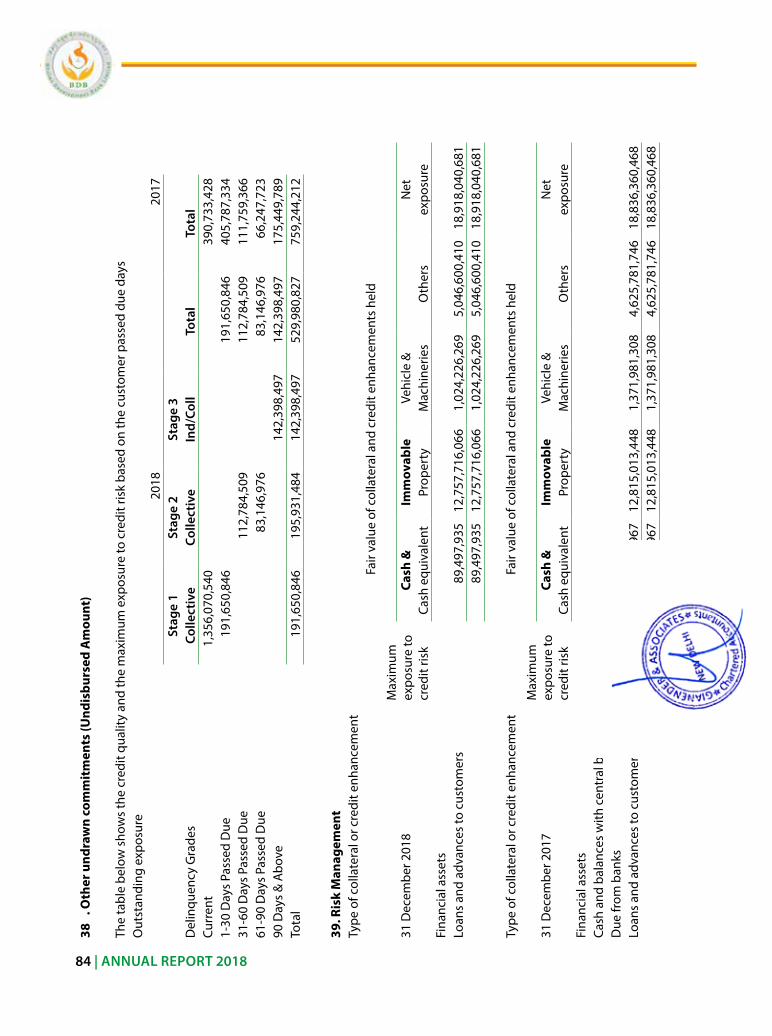
| 10 | BDB Annual Report 2017
sl # Particulars 2009 2013 2014 2015 2016 2017X No.of Depositors 15,879 85,864 109,005 133,366 159,576 178,386
Main Branch 657 4821 6,322 8,436 11,186 15,101 BranchOffice 15,222 81,043 102,683 124,930 148,390 163,285
XI Number of Employess 221 357 385 416 452 563HeadOffice 66 110 125 117 144 152Main Branch 29 28 30 31 39 45BranchOffice 126 219 230 268 269 366
XII ActiveClients/EmployeeRatioMain Branch 90 112 111 120 107 101BranchOffice 137 172 187 181 193 144
XII Loans/EmployeeRatio 13 24 28 33 37 33Main Branch 62 142 153 169 153 152BranchOffice 8 21 27 32 39 33
84 | ANNUAL REPORT 2018
38 .
Oth
er u
ndra
wn
com
mit
men
ts (U
ndis
burs
ed A
mou
nt)
The
tabl
e be
low
sho
ws
the
cred
it qu
ality
and
the
max
imum
exp
osur
e to
cre
dit r
isk
base
d on
the
cust
omer
pas
sed
due
days
out
stan
ding
exp
osur
e20
1820
17st
age
1st
age
2st
age
3
D
elin
quen
cy G
rade
sCo
llect
ive
Colle
ctiv
eIn
d/Co
llTo
tal
Tota
lCu
rren
t1,
356,
070,
540
390,
733,
428
1-30
Day
s Pa
ssed
Due
191,
650,
846
191,
650,
846
405,
787,
334
31-6
0 D
ays
Pass
ed D
ue11
2,78
4,50
9 11
2,78
4,50
9 11
1,75
9,36
6 61
-90
Day
s Pa
ssed
Due
8
3,14
6,97
6 83
,146
,976
66
,247
,723
90
Day
s &
abo
ve14
2,39
8,49
7 14
2,39
8,49
7 17
5,44
9,78
9 To
tal
191,
650,
846
195,
931,
484
142,
398,
497
529,
980,
827
759,
244,
212
39. R
isk
Man
agem
ent
Type
of c
olla
tera
l or c
redi
t enh
ance
men
tFa
ir va
lue
of c
olla
tera
l and
cre
dit e
nhan
cem
ents
hel
d
Max
imum
ex
posu
re to
cr
edit
risk
31 D
ecem
ber 2
018
Cash
&Im
mov
able
Ve
hicl
e &
net
Cash
equ
ival
ent
Prop
erty
Mac
hine
ries
oth
ers
expo
sure
Fina
ncia
l ass
ets
loan
s an
d ad
vanc
es to
cus
tom
ers
89,4
97,9
35
12,7
57,7
16,0
66
1,02
4,22
6,26
9 5,
046,
600,
410
18,9
18,0
40,6
81
89,
497,
935
12,7
57,7
16,0
66
1,02
4,22
6,26
9 5,
046,
600,
410
18,9
18,0
40,6
81
Type
of c
olla
tera
l or c
redi
t enh
ance
men
tFa
ir va
lue
of c
olla
tera
l and
cre
dit e
nhan
cem
ents
hel
d
Max
imum
ex
posu
re to
cr
edit
risk
31 D
ecem
ber 2
017
Cash
&Im
mov
able
Ve
hicl
e &
net
Cash
equ
ival
ent
Prop
erty
Mac
hine
ries
oth
ers
expo
sure
Fina
ncia
l ass
ets
Cash
and
bal
ance
s w
ith c
entr
al b
anks
Due
from
ban
kslo
ans
and
adva
nces
to c
usto
mer
s23
,583
,967
12
,815
,013
,448
1,
371,
981,
308
4,62
5,78
1,74
6 18
,836
,360
,468
2
3,58
3,96
7 12
,815
,013
,448
1,
371,
981,
308
4,62
5,78
1,74
6 18
,836
,360
,468
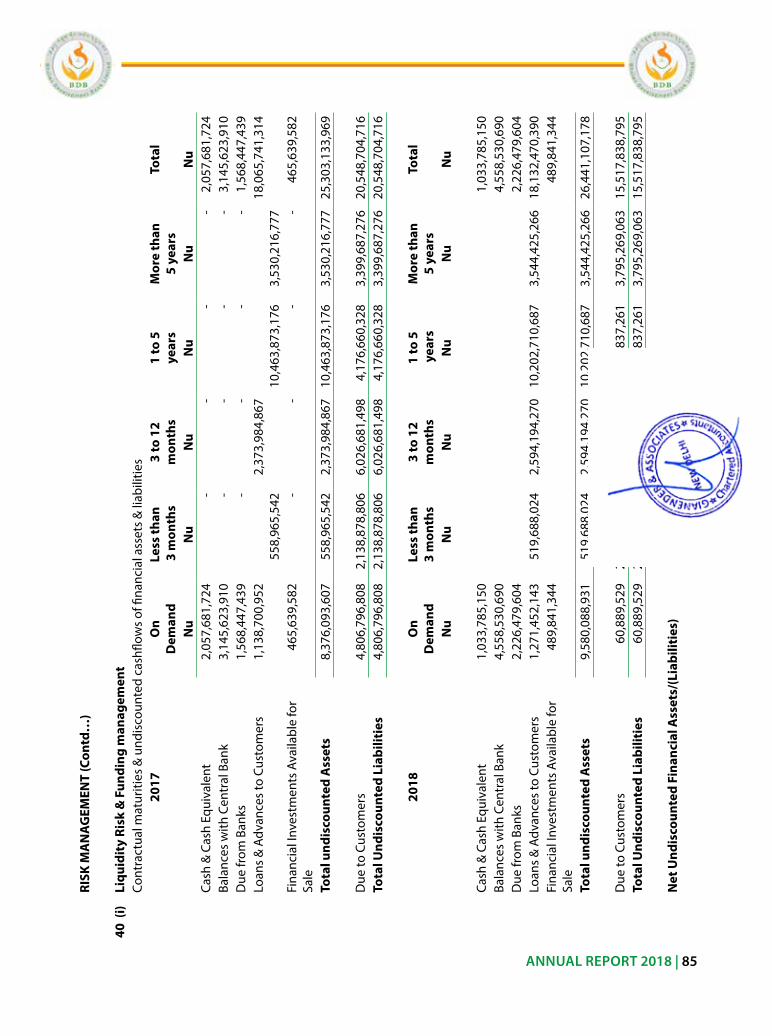
| 10 | BDB Annual Report 2017
sl # Particulars 2009 2013 2014 2015 2016 2017X No.of Depositors 15,879 85,864 109,005 133,366 159,576 178,386
Main Branch 657 4821 6,322 8,436 11,186 15,101 BranchOffice 15,222 81,043 102,683 124,930 148,390 163,285
XI Number of Employess 221 357 385 416 452 563HeadOffice 66 110 125 117 144 152Main Branch 29 28 30 31 39 45BranchOffice 126 219 230 268 269 366
XII ActiveClients/EmployeeRatioMain Branch 90 112 111 120 107 101BranchOffice 137 172 187 181 193 144
XII Loans/EmployeeRatio 13 24 28 33 37 33Main Branch 62 142 153 169 153 152BranchOffice 8 21 27 32 39 33
ANNUAL REPORT 2018 | 85
RISK
MA
NA
GEM
ENT
(Con
td…
)
40 (
i)Li
quid
ity
Risk
& F
undi
ng m
anag
emen
tCo
ntractua
lmaturities&und
iscoun
tedcashflo
wsoffina
ncialassets&liab
ilitie
s20
17O
n
Dem
and
Less
than
3
mon
ths
3 to
12
m
onth
s1
to 5
ye
ars
Mor
e th
an
5 ye
ars
Tota
l
Nu
Nu
Nu
Nu
Nu
Nu
Cash
& C
ash
equi
vale
nt
2,0
57,6
81,7
24
-
-
-
-
2,
057,
681,
724
Bala
nces
with
Cen
tral
Ban
k
3,1
45,6
23,9
10
-
-
-
-
3,
145,
623,
910
Due
from
Ban
ks
1,5
68,4
47,4
39
-
-
-
-
1,
568,
447,
439
loan
s &
adv
ance
s to
Cus
tom
ers
1
,138
,700
,952
55
8,96
5,54
2 2
,373
,984
,867
10,4
63,8
73,1
76
3,53
0,21
6,77
7 18
,065
,741
,314
Fina
ncia
l inv
estm
ents
ava
ilabl
e fo
r sa
le
46
5,63
9,58
2
-
-
-
-
465,
639,
582
Tota
l und
isco
unte
d A
sset
s
8,3
76,0
93,6
07
558,
965,
542
2,3
73,9
84,8
67
10,4
63,8
73,1
76
3,53
0,21
6,77
7 25
,303
,133
,969
Due
to C
usto
mer
s4,
806,
796,
808
2,13
8,87
8,80
66,
026,
681,
498
4,17
6,66
0,32
83,
399,
687,
276
20,5
48,7
04,7
16To
tal U
ndis
coun
ted
Liab
iliti
es4,
806,
796,
808
2,13
8,87
8,80
66,
026,
681,
498
4,17
6,66
0,32
83,
399,
687,
276
20,5
48,7
04,7
16
2018
On
D
eman
dLe
ss th
an
3 m
onth
s3
to 1
2
mon
ths
1 to
5
yea
rsM
ore
than
5
year
sTo
tal
Nu
Nu
Nu
Nu
Nu
Nu
Cash
& C
ash
equi
vale
nt
1,0
33,7
85,1
50
1,03
3,78
5,15
0 Ba
lanc
es w
ith C
entr
al B
ank
4
,558
,530
,690
4,
558,
530,
690
Due
from
Ban
ks
2,2
26,4
79,6
04
2,22
6,47
9,60
4 lo
ans
& a
dvan
ces
to C
usto
mer
s
1,2
71,4
52,1
43
519,
688,
024
2,5
94,1
94,2
70
10,2
02,7
10,6
87
3,54
4,42
5,26
6 18
,132
,470
,390
Fi
nanc
ial i
nves
tmen
ts a
vaila
ble
for
sale
489,
841,
344
489,
841,
344
Tota
l und
isco
unte
d A
sset
s9,
580,
088,
931
519,
688,
024
2,5
94,1
94,2
70
10,2
02,7
10,6
87
3,54
4,42
5,26
6 26
,441
,107
,178
Due
to C
usto
mer
s60
,889
,529
2,
005,
547,
619
5,7
67,2
95,3
22
3,88
8,83
7,26
1 3,
795,
269,
063
15,5
17,8
38,7
95
Tota
l Und
isco
unte
d Li
abili
ties
60,8
89,5
29
2,00
5,54
7,61
9 5
,767
,295
,322
3,
888,
837,
261
3,79
5,26
9,06
3 15
,517
,838
,795
Net
Und
isco
unte
d Fi
nanc
ial A
sset
s/(L
iabi
litie
s)
| 10 | BDB Annual Report 2017
sl # Particulars 2009 2013 2014 2015 2016 2017X No.of Depositors 15,879 85,864 109,005 133,366 159,576 178,386
Main Branch 657 4821 6,322 8,436 11,186 15,101 BranchOffice 15,222 81,043 102,683 124,930 148,390 163,285
XI Number of Employess 221 357 385 416 452 563HeadOffice 66 110 125 117 144 152Main Branch 29 28 30 31 39 45BranchOffice 126 219 230 268 269 366
XII ActiveClients/EmployeeRatioMain Branch 90 112 111 120 107 101BranchOffice 137 172 187 181 193 144
XII Loans/EmployeeRatio 13 24 28 33 37 33Main Branch 62 142 153 169 153 152BranchOffice 8 21 27 32 39 33
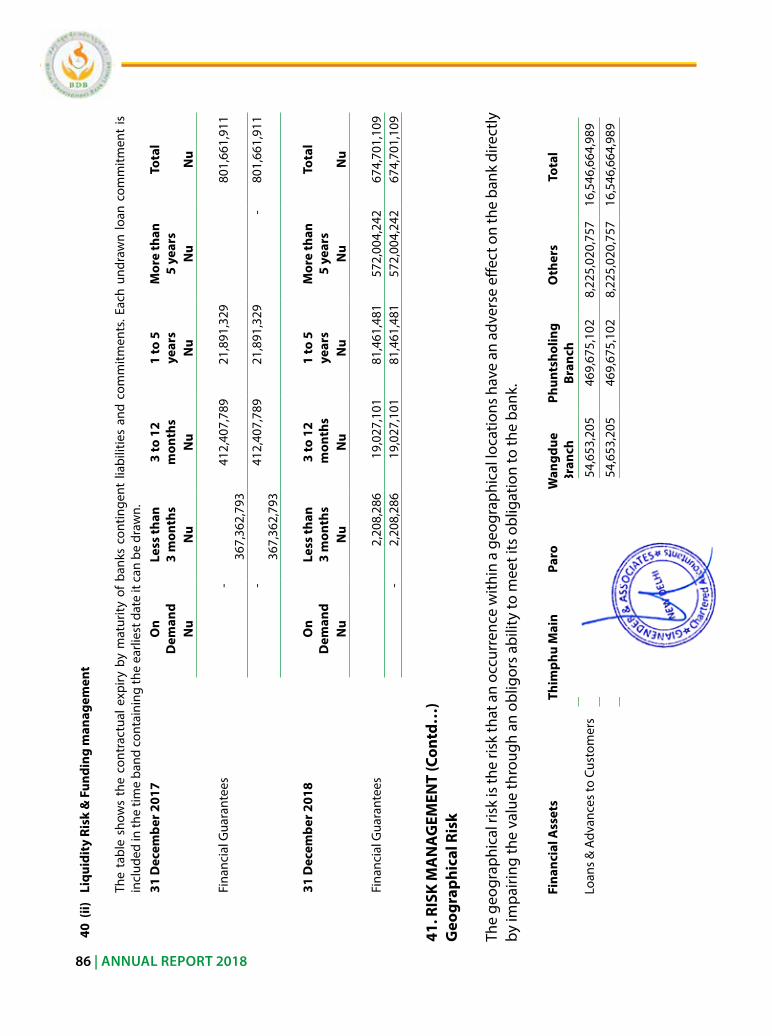
86 | ANNUAL REPORT 2018
40 (
ii)Li
quid
ity
Risk
& F
undi
ng m
anag
emen
t
The
tabl
e sh
ows
the
cont
ract
ual e
xpiry
by
mat
urity
of
bank
s co
ntin
gent
liab
ilitie
s an
d co
mm
itmen
ts. e
ach
undr
awn
loan
com
mitm
ent
is
incl
uded
in th
e tim
e ba
nd c
onta
inin
g th
e ea
rlies
t dat
e it
can
be d
raw
n.31
Dec
embe
r 201
7O
n
Dem
and
Less
than
3
mon
ths
3 to
12
m
onth
s1
to 5
ye
ars
Mor
e th
an
5 ye
ars
Tota
l
Nu
Nu
Nu
Nu
Nu
Nu
Fina
ncia
l Gua
rant
ees
-
367,
362,
793
4
12,4
07,7
89
21,
891,
329
801,
661,
911
-
367,
362,
793
4
12,4
07,7
89
21,
891,
329
-
801,
661,
911
31 D
ecem
ber 2
018
On
D
eman
dLe
ss th
an
3 m
onth
s3
to 1
2 m
onth
s1
to 5
ye
ars
Mor
e th
an
5 ye
ars
Tota
l
Nu
Nu
Nu
Nu
Nu
Nu
Fina
ncia
l Gua
rant
ees
2
,208
,286
19
,027
,101
8
1,46
1,48
1
57
2,00
4,24
2 67
4,70
1,10
9
-
2,2
08,2
86
19,0
27,1
01
81,
461,
481
572,
004,
242
674,
701,
109
41. R
ISK
MA
NA
GEM
ENT
(Con
td…
)G
eogr
aphi
cal R
isk
The
geog
raph
ical
risk
is th
e ris
k th
at a
n oc
curr
ence
with
in a
geo
grap
hica
l loc
atio
ns h
ave
an a
dver
se e
ffect
on
the
bank
dire
ctly
by
impa
iring
the
valu
e th
roug
h an
obl
igor
s ab
ility
to m
eet i
ts o
blig
atio
n to
the
bank
.
Fina
ncia
l Ass
ets
Thim
phu
Mai
n Br
anch
Paro
Br
anch
Wan
gdue
Br
anch
Phun
tsho
ling
Bran
chO
ther
sTo
tal
loan
s &
adv
ance
s to
Cus
tom
ers
6,31
8,19
1,50
087
9,12
4,42
465
4,65
3,20
546
9,67
5,10
28,
225,
020,
757
16,5
46,6
64,9
89
6,31
8,19
1,50
087
9,12
4,42
465
4,65
3,20
546
9,67
5,10
28,
225,
020,
757
16,5
46,6
64,9
89
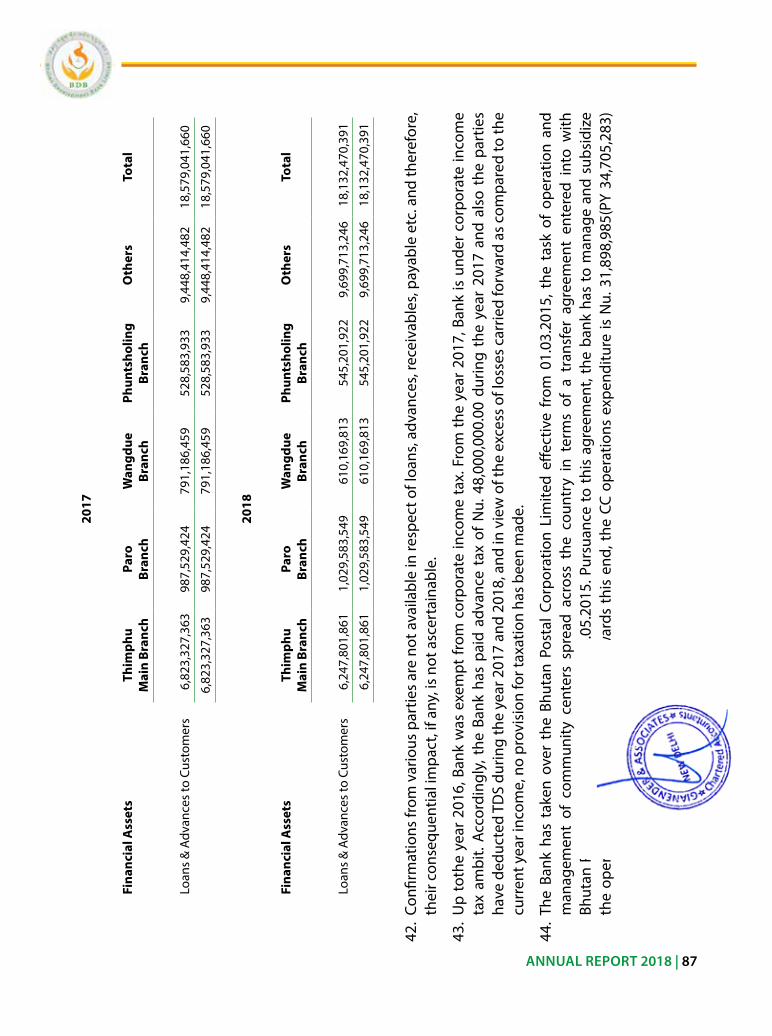
| 10 | BDB Annual Report 2017
sl # Particulars 2009 2013 2014 2015 2016 2017X No.of Depositors 15,879 85,864 109,005 133,366 159,576 178,386
Main Branch 657 4821 6,322 8,436 11,186 15,101 BranchOffice 15,222 81,043 102,683 124,930 148,390 163,285
XI Number of Employess 221 357 385 416 452 563HeadOffice 66 110 125 117 144 152Main Branch 29 28 30 31 39 45BranchOffice 126 219 230 268 269 366
XII ActiveClients/EmployeeRatioMain Branch 90 112 111 120 107 101BranchOffice 137 172 187 181 193 144
XII Loans/EmployeeRatio 13 24 28 33 37 33Main Branch 62 142 153 169 153 152BranchOffice 8 21 27 32 39 33
ANNUAL REPORT 2018 | 87
2017
Fina
ncia
l Ass
ets
Thim
phu
Mai
n Br
anch
Paro
Br
anch
Wan
gdue
Br
anch
Phun
tsho
ling
Bran
chO
ther
sTo
tal
loan
s &
adv
ance
s to
Cus
tom
ers
6,82
3,32
7,36
398
7,52
9,42
4 79
1,18
6,45
9 52
8,58
3,93
3 9,
448,
414,
482
18,5
79,0
41,6
60
6,82
3,32
7,36
3 98
7,52
9,42
4 79
1,18
6,45
9 52
8,58
3,93
3 9,
448,
414,
482
18,5
79,0
41,6
60
2018
Fina
ncia
l Ass
ets
Thim
phu
Mai
n Br
anch
Paro
Br
anch
Wan
gdue
Br
anch
Phun
tsho
ling
Bran
chO
ther
sTo
tal
loan
s &
adv
ance
s to
Cus
tom
ers
6,24
7,80
1,86
11,
029,
583,
549
610,
169,
813
545,
201,
922
9,69
9,71
3,24
6 18
,132
,470
,391
6,24
7,80
1,86
1 1,
029,
583,
549
610,
169,
813
545,
201,
922
9,69
9,71
3,24
6 18
,132
,470
,391
42.
Confi
rmat
ions
from
var
ious
par
ties
are
not a
vaila
ble
in re
spec
t of l
oans
, adv
ance
s, re
ceiv
able
s, pa
yabl
e et
c. a
nd th
eref
ore,
th
eir c
onse
quen
tial i
mpa
ct, i
f any
, is
not a
scer
tain
able
.
43.
up
toth
e ye
ar 2
016,
Ban
k w
as e
xem
pt fr
om c
orpo
rate
inco
me
tax.
Fro
m t
he y
ear
2017
, Ban
k is
und
er c
orpo
rate
inco
me
tax
ambi
t. ac
cord
ingl
y, t
he B
ank
has
paid
adv
ance
tax
of
nu.
48,
000,
000.
00 d
urin
g th
e ye
ar 2
017
and
also
the
par
ties
have
ded
ucte
d TD
s du
ring
the
year
201
7 an
d 20
18, a
nd in
vie
w o
f the
exc
ess
of lo
sses
car
ried
forw
ard
as c
ompa
red
to th
e cu
rren
t yea
r inc
ome,
no
prov
isio
n fo
r tax
atio
n ha
s be
en m
ade.
44.
The
Bank
has
tak
en o
ver
the
Bhut
an P
osta
l Cor
pora
tion
lim
ited
effec
tive
from
01.
03.2
015,
the
tas
k of
ope
ratio
n an
d m
anag
emen
t of
com
mun
ity c
ente
rs s
prea
d ac
ross
the
cou
ntry
in
term
s of
a t
rans
fer
agre
emen
t en
tere
d in
to w
ith
Bhut
an P
osta
l Cor
pora
tion
lim
ited
on 0
6.05
.201
5. P
ursu
ance
to
this
agr
eem
ent,
the
bank
has
to
man
age
and
subs
idiz
e th
e op
erat
ions
of t
he C
C o
pera
tions
. Tow
ards
thi
s en
d, t
he C
C op
erat
ions
exp
endi
ture
is n
u. 3
1,89
8,98
5(PY
34,
705,
283)
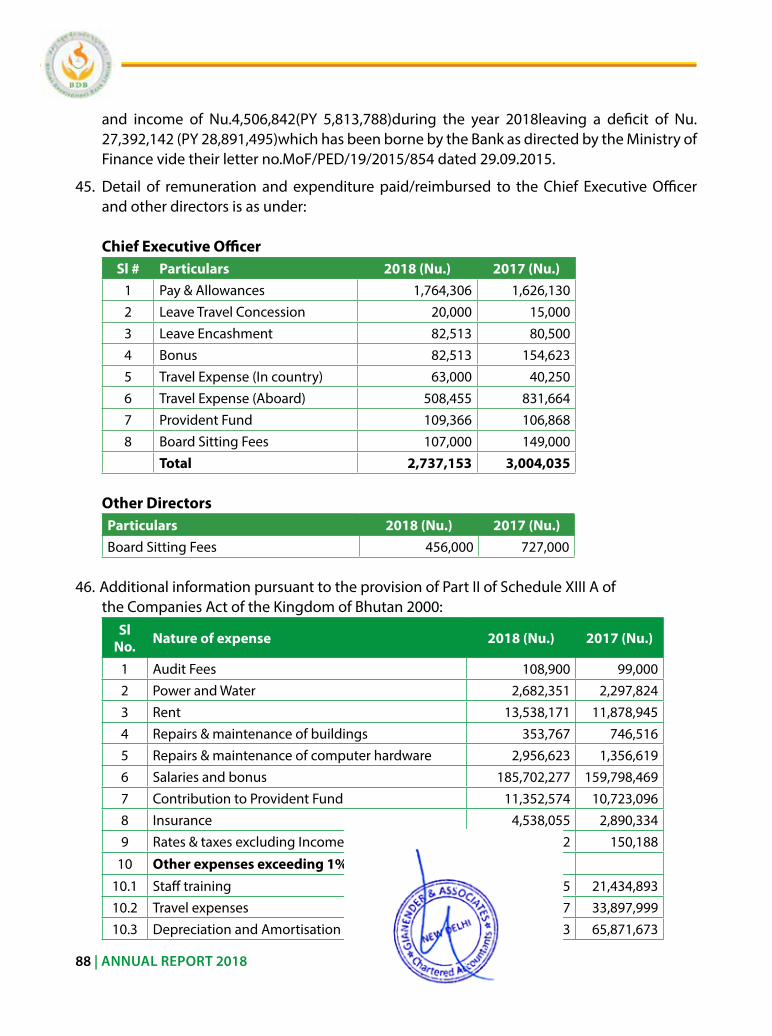
| 10 | BDB Annual Report 2017
sl # Particulars 2009 2013 2014 2015 2016 2017X No.of Depositors 15,879 85,864 109,005 133,366 159,576 178,386
Main Branch 657 4821 6,322 8,436 11,186 15,101 BranchOffice 15,222 81,043 102,683 124,930 148,390 163,285
XI Number of Employess 221 357 385 416 452 563HeadOffice 66 110 125 117 144 152Main Branch 29 28 30 31 39 45BranchOffice 126 219 230 268 269 366
XII ActiveClients/EmployeeRatioMain Branch 90 112 111 120 107 101BranchOffice 137 172 187 181 193 144
XII Loans/EmployeeRatio 13 24 28 33 37 33Main Branch 62 142 153 169 153 152BranchOffice 8 21 27 32 39 33
88 | ANNUAL REPORT 2018
and income of nu.4,506,842(PY 5,813,788)during the year 2018leaving a deficit of nu. 27,392,142 (PY 28,891,495)which has been borne by the Bank as directed by the Ministry of Finance vide their letter no.MoF/PeD/19/2015/854 dated 29.09.2015.
45. Detail of remuneration and expenditure paid/reimbursed to the Chief executive officer and other directors is as under:
Chief Executive OfficerSl # Particulars 2018 (Nu.) 2017 (Nu.)
1 Pay & allowances 1,764,306 1,626,130 2 leave Travel Concession 20,000 15,000 3 leave encashment 82,513 80,500 4 Bonus 82,513 154,623 5 Travel expense (in country) 63,000 40,250 6 Travel expense (aboard) 508,455 831,664 7 Provident Fund 109,366 106,868 8 Board sitting Fees 107,000 149,000
Total 2,737,153 3,004,035
Other DirectorsParticulars 2018 (Nu.) 2017 (Nu.)Board sitting Fees 456,000 727,000
46. additional information pursuant to the provision of Part ii of schedule Xiii a of the Companies act of the Kingdom of Bhutan 2000:
Sl No. Nature of expense 2018 (Nu.) 2017 (Nu.)
1 audit Fees 108,900 99,0002 Power and Water 2,682,351 2,297,8243 rent 13,538,171 11,878,9454 repairs & maintenance of buildings 353,767 746,5165 repairs & maintenance of computer hardware 2,956,623 1,356,6196 salaries and bonus 185,702,277 159,798,4697 Contribution to Provident Fund 11,352,574 10,723,0968 insurance 4,538,055 2,890,3349 rates & taxes excluding income tax 128,142 150,188
10 Other expenses exceeding 1% of total revenue:10.1 staff training 24,569,165 21,434,89310.2 Travel expenses 54,691,617 33,897,99910.3 Depreciation and amortisation 72,933,613 65,871,673
| 10 | BDB Annual Report 2017
sl # Particulars 2009 2013 2014 2015 2016 2017X No.of Depositors 15,879 85,864 109,005 133,366 159,576 178,386
Main Branch 657 4821 6,322 8,436 11,186 15,101 BranchOffice 15,222 81,043 102,683 124,930 148,390 163,285
XI Number of Employess 221 357 385 416 452 563HeadOffice 66 110 125 117 144 152Main Branch 29 28 30 31 39 45BranchOffice 126 219 230 268 269 366
XII ActiveClients/EmployeeRatioMain Branch 90 112 111 120 107 101BranchOffice 137 172 187 181 193 144
XII Loans/EmployeeRatio 13 24 28 33 37 33Main Branch 62 142 153 169 153 152BranchOffice 8 21 27 32 39 33
ANNUAL REPORT 2018 | 89
47. Chetrums have been rounded to the nearest ngultrum.
48. Previous year’s figures have been rearranged / regrouped wherever necessary to make them comparable with the current year’s figures.
For Gianender& AssociatesChartered AccountantsFRN : 004661N
G.K Agrawal Chief Executive Officer ChairmanPartnerMembership No. 081603Date:Place: New Delhi, India
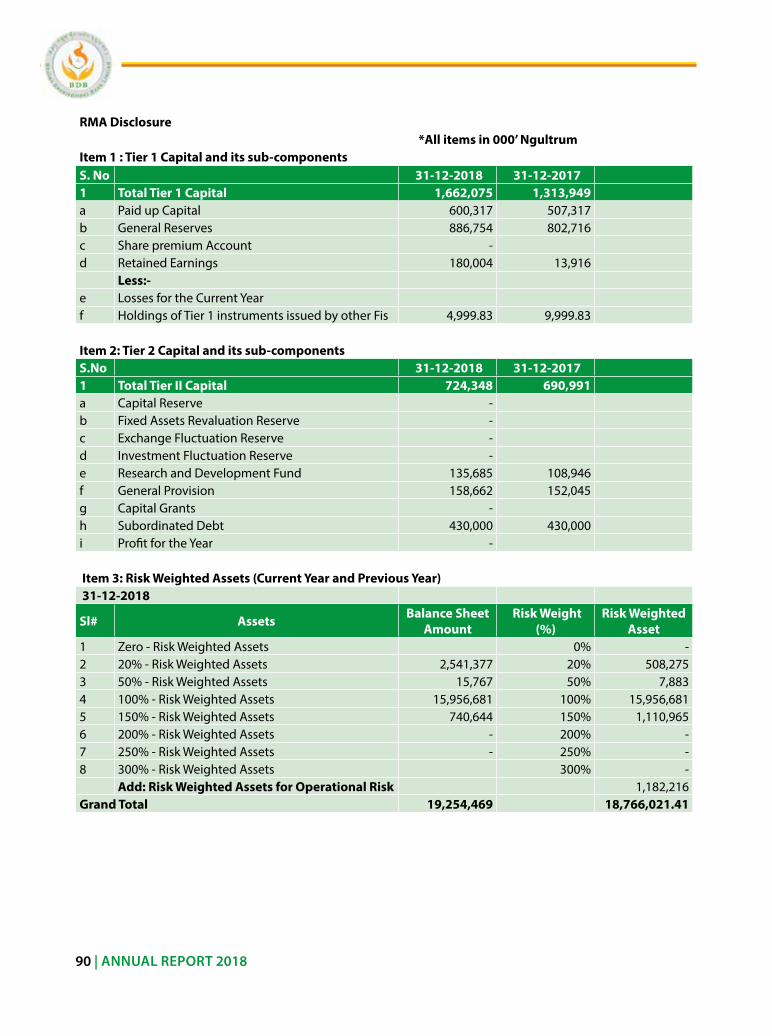
| 10 | BDB Annual Report 2017
sl # Particulars 2009 2013 2014 2015 2016 2017X No.of Depositors 15,879 85,864 109,005 133,366 159,576 178,386
Main Branch 657 4821 6,322 8,436 11,186 15,101 BranchOffice 15,222 81,043 102,683 124,930 148,390 163,285
XI Number of Employess 221 357 385 416 452 563HeadOffice 66 110 125 117 144 152Main Branch 29 28 30 31 39 45BranchOffice 126 219 230 268 269 366
XII ActiveClients/EmployeeRatioMain Branch 90 112 111 120 107 101BranchOffice 137 172 187 181 193 144
XII Loans/EmployeeRatio 13 24 28 33 37 33Main Branch 62 142 153 169 153 152BranchOffice 8 21 27 32 39 33
90 | ANNUAL REPORT 2018
RMA Disclosure *All items in 000’ Ngultrum Item 1 : Tier 1 Capital and its sub-componentsS. No 31-12-2018 31-12-2017 1 Total Tier 1 Capital 1,662,075 1,313,949 a Paid up Capital 600,317 507,317 b General reserves 886,754 802,716 c share premium account - d retained earnings 180,004 13,916 Less:- e losses for the Current Year f Holdings of Tier 1 instruments issued by other Fis 4,999.83 9,999.83 Item 2: Tier 2 Capital and its sub-componentsS.No 31-12-2018 31-12-2017 1 Total Tier II Capital 724,348 690,991 a Capital reserve - b Fixed assets revaluation reserve - c exchange Fluctuation reserve - d investment Fluctuation reserve - e research and Development Fund 135,685 108,946 f General Provision 158,662 152,045 g Capital Grants - h subordinated Debt 430,000 430,000 i Profit for the Year - Item 3: Risk Weighted Assets (Current Year and Previous Year) 31-12-2018
Sl# Assets Balance Sheet Amount
Risk Weight (%)
Risk Weighted Asset
1 zero - risk Weighted assets 0% - 2 20% - risk Weighted assets 2,541,377 20% 508,275 3 50% - risk Weighted assets 15,767 50% 7,883 4 100% - risk Weighted assets 15,956,681 100% 15,956,681 5 150% - risk Weighted assets 740,644 150% 1,110,965 6 200% - risk Weighted assets - 200% - 7 250% - risk Weighted assets - 250% - 8 300% - risk Weighted assets 300% - Add: Risk Weighted Assets for Operational Risk 1,182,216 Grand Total 19,254,469 18,766,021.41
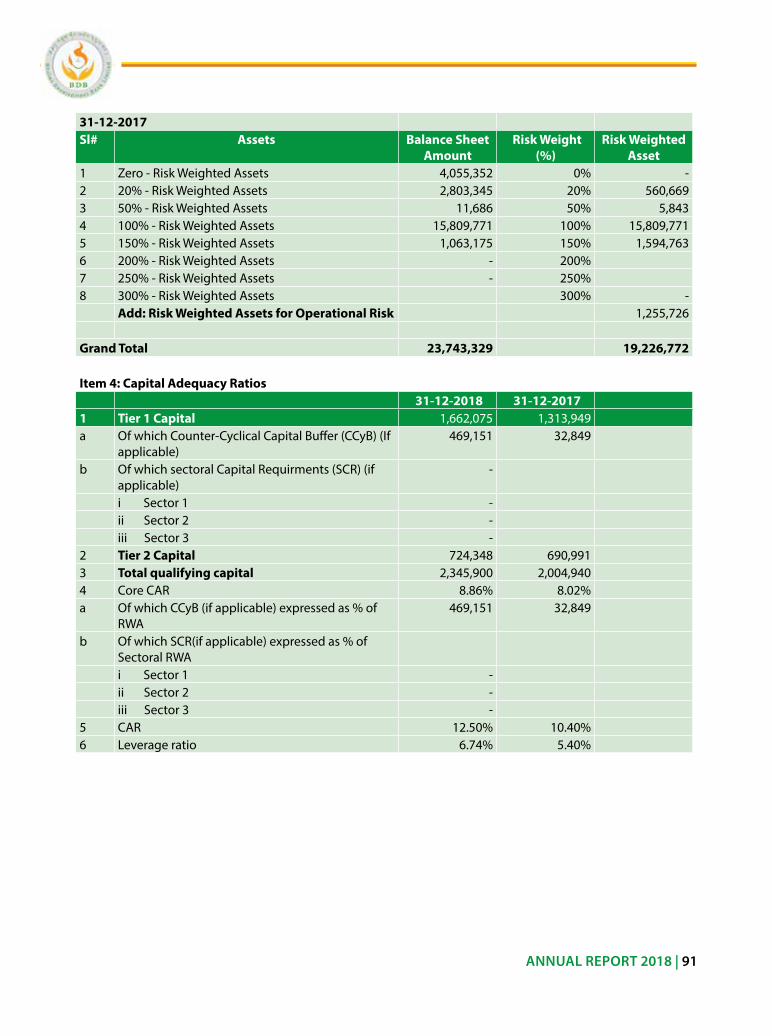
| 10 | BDB Annual Report 2017
sl # Particulars 2009 2013 2014 2015 2016 2017X No.of Depositors 15,879 85,864 109,005 133,366 159,576 178,386
Main Branch 657 4821 6,322 8,436 11,186 15,101 BranchOffice 15,222 81,043 102,683 124,930 148,390 163,285
XI Number of Employess 221 357 385 416 452 563HeadOffice 66 110 125 117 144 152Main Branch 29 28 30 31 39 45BranchOffice 126 219 230 268 269 366
XII ActiveClients/EmployeeRatioMain Branch 90 112 111 120 107 101BranchOffice 137 172 187 181 193 144
XII Loans/EmployeeRatio 13 24 28 33 37 33Main Branch 62 142 153 169 153 152BranchOffice 8 21 27 32 39 33
ANNUAL REPORT 2018 | 91
31-12-2017 Sl# Assets Balance Sheet
Amount Risk Weight
(%) Risk Weighted
Asset1 zero - risk Weighted assets 4,055,352 0% - 2 20% - risk Weighted assets 2,803,345 20% 560,669 3 50% - risk Weighted assets 11,686 50% 5,843 4 100% - risk Weighted assets 15,809,771 100% 15,809,771 5 150% - risk Weighted assets 1,063,175 150% 1,594,763 6 200% - risk Weighted assets - 200%7 250% - risk Weighted assets - 250%8 300% - risk Weighted assets 300% - Add: Risk Weighted Assets for Operational Risk 1,255,726 Grand Total 23,743,329 19,226,772 Item 4: Capital Adequacy Ratios 31-12-2018 31-12-2017 1 Tier 1 Capital 1,662,075 1,313,949 a of which Counter-Cyclical Capital Buffer (CCyB) (if
applicable)469,151 32,849
b of which sectoral Capital requirments (sCr) (if applicable)
-
i sector 1 - ii sector 2 - iii sector 3 - 2 Tier 2 Capital 724,348 690,991 3 Total qualifying capital 2,345,900 2,004,940 4 Core Car 8.86% 8.02% a of which CCyB (if applicable) expressed as % of
rWa469,151 32,849
b of which sCr(if applicable) expressed as % of sectoral rWa
i sector 1 - ii sector 2 - iii sector 3 - 5 Car 12.50% 10.40% 6 leverage ratio 6.74% 5.40%
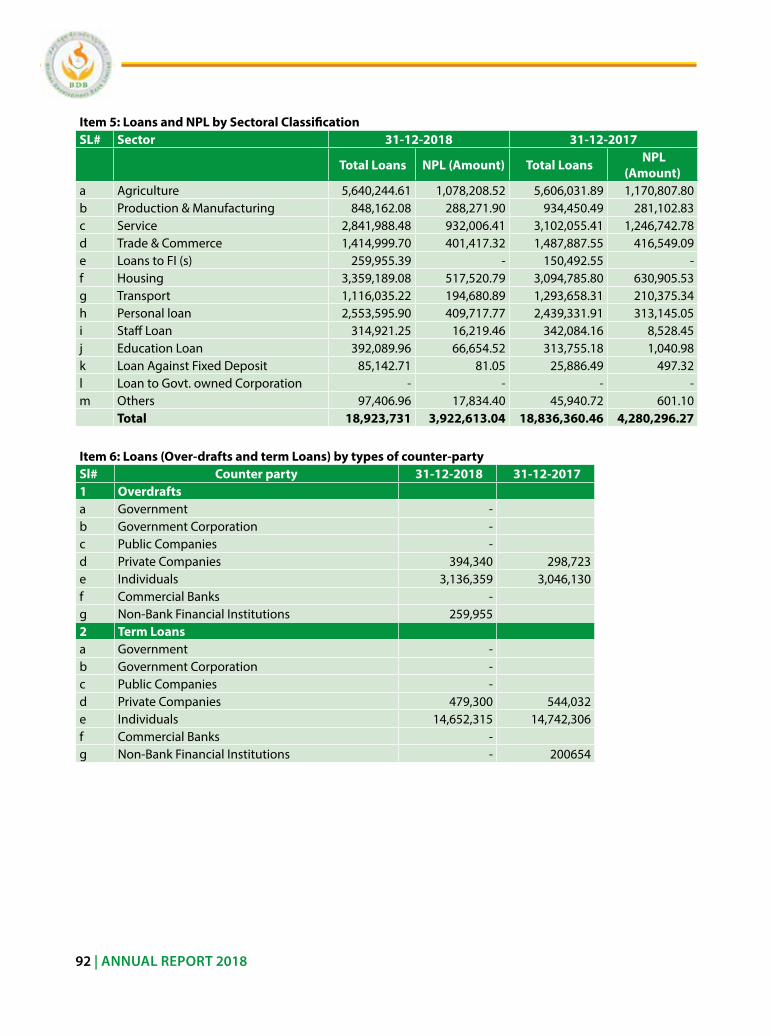
| 10 | BDB Annual Report 2017
sl # Particulars 2009 2013 2014 2015 2016 2017X No.of Depositors 15,879 85,864 109,005 133,366 159,576 178,386
Main Branch 657 4821 6,322 8,436 11,186 15,101 BranchOffice 15,222 81,043 102,683 124,930 148,390 163,285
XI Number of Employess 221 357 385 416 452 563HeadOffice 66 110 125 117 144 152Main Branch 29 28 30 31 39 45BranchOffice 126 219 230 268 269 366
XII ActiveClients/EmployeeRatioMain Branch 90 112 111 120 107 101BranchOffice 137 172 187 181 193 144
XII Loans/EmployeeRatio 13 24 28 33 37 33Main Branch 62 142 153 169 153 152BranchOffice 8 21 27 32 39 33
92 | ANNUAL REPORT 2018
Item 5: Loans and NPL by Sectoral ClassificationSL# Sector 31-12-2018 31-12-2017
Total Loans NPL (Amount) Total Loans NPL (Amount)
a agriculture 5,640,244.61 1,078,208.52 5,606,031.89 1,170,807.80 b Production & Manufacturing 848,162.08 288,271.90 934,450.49 281,102.83 c service 2,841,988.48 932,006.41 3,102,055.41 1,246,742.78 d Trade & Commerce 1,414,999.70 401,417.32 1,487,887.55 416,549.09 e loans to Fi (s) 259,955.39 - 150,492.55 - f Housing 3,359,189.08 517,520.79 3,094,785.80 630,905.53 g Transport 1,116,035.22 194,680.89 1,293,658.31 210,375.34 h Personal loan 2,553,595.90 409,717.77 2,439,331.91 313,145.05 i staff loan 314,921.25 16,219.46 342,084.16 8,528.45 j education loan 392,089.96 66,654.52 313,755.18 1,040.98 k loan against Fixed Deposit 85,142.71 81.05 25,886.49 497.32 l loan to Govt. owned Corporation - - - - m others 97,406.96 17,834.40 45,940.72 601.10 Total 18,923,731 3,922,613.04 18,836,360.46 4,280,296.27
Item 6: Loans (Over-drafts and term Loans) by types of counter-partySl# Counter party 31-12-2018 31-12-2017 1 Overdrafts a Government - b Government Corporation - c Public Companies - d Private Companies 394,340 298,723 e individuals 3,136,359 3,046,130 f Commercial Banks - g non-Bank Financial institutions 259,955 2 Term Loans a Government - b Government Corporation - c Public Companies - d Private Companies 479,300 544,032 e individuals 14,652,315 14,742,306 f Commercial Banks - g non-Bank Financial institutions - 200654
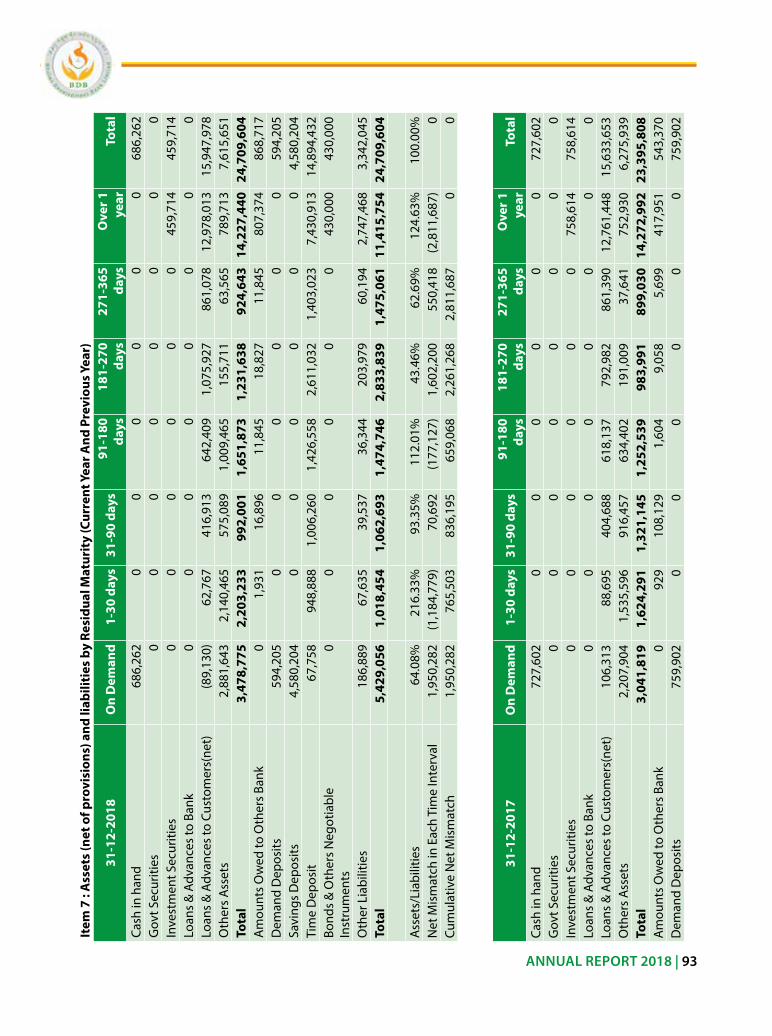
| 10 | BDB Annual Report 2017
sl # Particulars 2009 2013 2014 2015 2016 2017X No.of Depositors 15,879 85,864 109,005 133,366 159,576 178,386
Main Branch 657 4821 6,322 8,436 11,186 15,101 BranchOffice 15,222 81,043 102,683 124,930 148,390 163,285
XI Number of Employess 221 357 385 416 452 563HeadOffice 66 110 125 117 144 152Main Branch 29 28 30 31 39 45BranchOffice 126 219 230 268 269 366
XII ActiveClients/EmployeeRatioMain Branch 90 112 111 120 107 101BranchOffice 137 172 187 181 193 144
XII Loans/EmployeeRatio 13 24 28 33 37 33Main Branch 62 142 153 169 153 152BranchOffice 8 21 27 32 39 33
ANNUAL REPORT 2018 | 93
Item
7 :
Ass
ets
(net
of p
rovi
sion
s) a
nd li
abili
ties
by
Resi
dual
Mat
urit
y (C
urre
nt Y
ear A
nd P
revi
ous Y
ear)
31-1
2-20
18 O
n D
eman
d 1
-30
days
3
1-90
day
s 9
1-18
0 da
ys
181
-270
da
ys
271
-365
da
ys
Ove
r 1
year
To
tal
Cash
in h
and
686,
262
0 0
0 0
0 0
686,
262
Gov
t sec
uriti
es0
0 0
0 0
0 0
0 in
vest
men
t sec
uriti
es0
0 0
0 0
0 45
9,71
4 45
9,71
4 lo
ans
& a
dvan
ces
to B
ank
0 0
0 0
0 0
0 0
loan
s &
adv
ance
s to
Cus
tom
ers(
net)
(89,
130)
62,7
67
416,
913
642,
409
1,07
5,92
7 86
1,07
8 12
,978
,013
15
,947
,978
o
ther
s a
sset
s2,
881,
643
2,14
0,46
5 57
5,08
9 1,
009,
465
155,
711
63,5
65
789,
713
7,61
5,65
1 To
tal
3,47
8,77
5 2,
203,
233
992,
001
1,65
1,87
3 1,
231,
638
924,
643
14,2
27,4
40
24,7
09,6
04
am
ount
s o
wed
to o
ther
s Ba
nk0
1,93
1 16
,896
11
,845
18
,827
11
,845
80
7,37
4 86
8,71
7 D
eman
d D
epos
its59
4,20
5 0
0 0
0 0
0 59
4,20
5 sa
ving
s D
epos
its4,
580,
204
0 0
0 0
0 0
4,58
0,20
4 Ti
me
Dep
osit
67,7
58
948,
888
1,00
6,26
0 1,
426,
558
2,61
1,03
2 1,
403,
023
7,43
0,91
3 14
,894
,432
Bo
nds
& o
ther
s n
egot
iabl
e in
stru
men
ts0
0 0
0 0
0 43
0,00
0 43
0,00
0
oth
er l
iabi
litie
s18
6,88
9 67
,635
39
,537
36
,344
20
3,97
9 60
,194
2,
747,
468
3,34
2,04
5 To
tal
5,42
9,05
6 1,
018,
454
1,06
2,69
3 1,
474,
746
2,83
3,83
9 1,
475,
061
11,4
15,7
54
24,7
09,6
04
a
sset
s/li
abili
ties
64.0
8%21
6.33
%93
.35%
112.
01%
43.4
6%62
.69%
124.
63%
100.
00%
net
Mis
mat
ch in
eac
h Ti
me
inte
rval
1,95
0,28
2 (1
,184
,779
)70
,692
(1
77,1
27)
1,60
2,20
0 55
0,41
8 (2
,811
,687
)0
Cum
ulat
ive
net
Mis
mat
ch1,
950,
282
765,
503
836,
195
659,
068
2,26
1,26
8 2,
811,
687
0 0
31-1
2-20
17 O
n D
eman
d 1
-30
days
3
1-90
day
s 9
1-18
0 da
ys
181
-270
da
ys
271
-365
da
ys
Ove
r 1
year
To
tal
Cash
in h
and
727,
602
0 0
0 0
0 0
727,
602
Gov
t sec
uriti
es0
0 0
0 0
0 0
0 in
vest
men
t sec
uriti
es0
0 0
0 0
0 75
8,61
4 75
8,61
4 lo
ans
& a
dvan
ces
to B
ank
0 0
0 0
0 0
0 0
loan
s &
adv
ance
s to
Cus
tom
ers(
net)
106,
313
88,6
95
404,
688
618,
137
792,
982
861,
390
12,7
61,4
48
15,6
33,6
53
oth
ers
ass
ets
2,20
7,90
4 1,
535,
596
916,
457
634,
402
191,
009
37,6
41
752,
930
6,27
5,93
9 To
tal
3,04
1,81
9 1,
624,
291
1,32
1,14
5 1,
252,
539
983,
991
899,
030
14,2
72,9
92
23,3
95,8
08
am
ount
s o
wed
to o
ther
s Ba
nk0
929
108,
129
1,60
4 9,
058
5,69
9 41
7,95
1 54
3,37
0 D
eman
d D
epos
its75
9,90
2 0
0 0
0 0
0 75
9,90
2
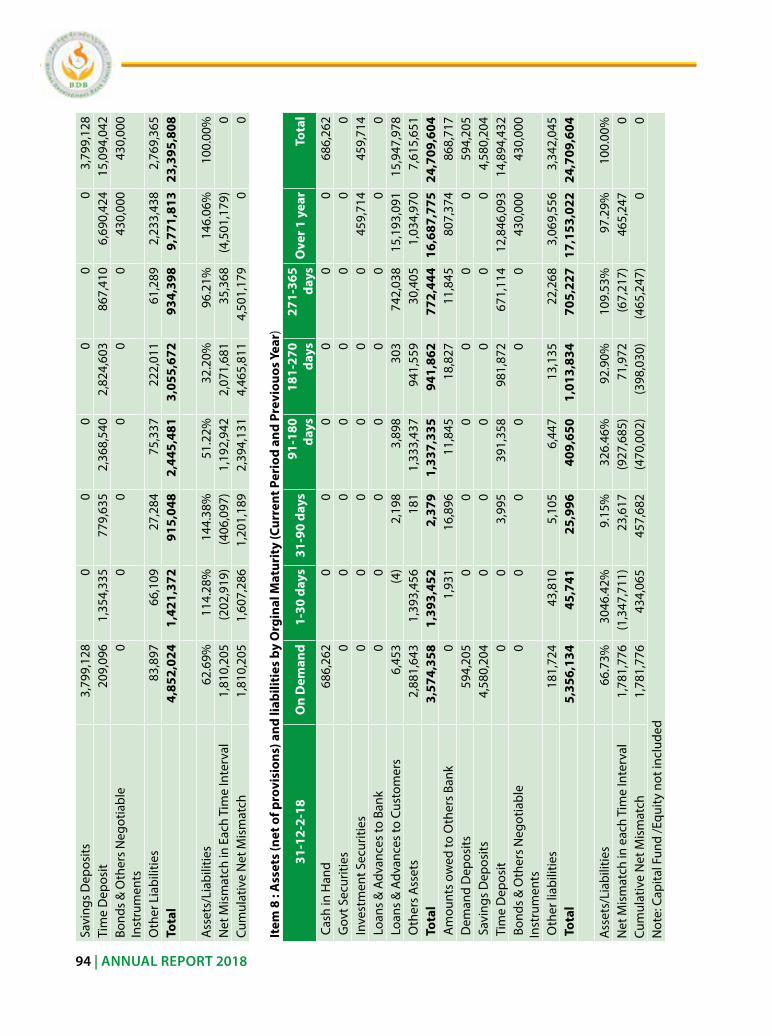
| 10 | BDB Annual Report 2017
sl # Particulars 2009 2013 2014 2015 2016 2017X No.of Depositors 15,879 85,864 109,005 133,366 159,576 178,386
Main Branch 657 4821 6,322 8,436 11,186 15,101 BranchOffice 15,222 81,043 102,683 124,930 148,390 163,285
XI Number of Employess 221 357 385 416 452 563HeadOffice 66 110 125 117 144 152Main Branch 29 28 30 31 39 45BranchOffice 126 219 230 268 269 366
XII ActiveClients/EmployeeRatioMain Branch 90 112 111 120 107 101BranchOffice 137 172 187 181 193 144
XII Loans/EmployeeRatio 13 24 28 33 37 33Main Branch 62 142 153 169 153 152BranchOffice 8 21 27 32 39 33
94 | ANNUAL REPORT 2018
savi
ngs
Dep
osits
3,79
9,12
8 0
0 0
0 0
0 3,
799,
128
Tim
e D
epos
it20
9,09
6 1,
354,
335
779,
635
2,36
8,54
0 2,
824,
603
867,
410
6,69
0,42
4 15
,094
,042
Bo
nds
& o
ther
s n
egot
iabl
e in
stru
men
ts0
0 0
0 0
0 43
0,00
0 43
0,00
0
oth
er l
iabi
litie
s83
,897
66
,109
27
,284
75
,337
22
2,01
1 61
,289
2,
233,
438
2,76
9,36
5 To
tal
4,85
2,02
4 1,
421,
372
915,
048
2,44
5,48
1 3,
055,
672
934,
398
9,77
1,81
3 23
,395
,808
ass
ets/
liab
ilitie
s62
.69%
114.
28%
144.
38%
51.2
2%32
.20%
96.2
1%14
6.06
%10
0.00
%n
et M
ism
atch
in e
ach
Tim
e in
terv
al1,
810,
205
(202
,919
)(4
06,0
97)
1,19
2,94
2 2,
071,
681
35,3
68
(4,5
01,1
79)
0 Cu
mul
ativ
e n
et M
ism
atch
1,81
0,20
5 1,
607,
286
1,20
1,18
9 2,
394,
131
4,46
5,81
1 4,
501,
179
0 0
Item
8 :
Ass
ets
(net
of p
rovi
sion
s) a
nd li
abili
ties
by
Org
inal
Mat
urit
y (C
urre
nt P
erio
d an
d Pr
evio
uos Y
ear)
31-
12-2
-18
On
Dem
and
1-30
day
s31
-90
days
91-1
80
days
181-
270
days
271-
365
days
Ove
r 1 y
ear
Tota
l
Cas
h in
Han
d 68
6,26
2 0
0 0
0 0
0 68
6,26
2 G
ovt s
ecur
ities
0
0 0
0 0
0 0
0 in
vest
men
t sec
uriti
es
0 0
0 0
0 0
459,
714
459,
714
loa
ns &
adv
ance
s to
Ban
k 0
0 0
0 0
0 0
0 l
oans
& a
dvan
ces
to C
usto
mer
s 6,
453
(4)
2,19
8 3,
898
303
742,
038
15,1
93,0
91
15,9
47,9
78
oth
ers
ass
ets
2,88
1,64
3 1,
393,
456
181
1,33
3,43
7 94
1,55
9 30
,405
1,
034,
970
7,61
5,65
1 T
otal
3,
574,
358
1,39
3,45
2 2,
379
1,33
7,33
5 94
1,86
2 77
2,44
4 16
,687
,775
24
,709
,604
a
mou
nts
owed
to o
ther
s Ba
nk
0 1,
931
16,8
96
11,8
45
18,8
27
11,8
45
807,
374
868,
717
Dem
and
Dep
osits
59
4,20
5 0
0 0
0 0
0 59
4,20
5 s
avin
gs D
epos
its
4,58
0,20
4 0
0 0
0 0
0 4,
580,
204
Tim
e D
epos
it 0
0 3,
995
391,
358
981,
872
671,
114
12,8
46,0
93
14,8
94,4
32
Bon
ds &
oth
ers
neg
otia
ble
inst
rum
ents
0
0 0
0 0
0 43
0,00
0 43
0,00
0
oth
er li
abili
ties
181,
724
43,8
10
5,10
5 6,
447
13,1
35
22,2
68
3,06
9,55
6 3,
342,
045
Tot
al
5,35
6,13
4 45
,741
25
,996
40
9,65
0 1,
013,
834
705,
227
17,1
53,0
22
24,7
09,6
04
a
sset
s/li
abili
ties
66.7
3%30
46.4
2%9.
15%
326.
46%
92.9
0%10
9.53
%97
.29%
100.
00%
net
Mis
mat
ch in
eac
h Ti
me
inte
rval
1,78
1,77
6 (1
,347
,711
)23
,617
(9
27,6
85)
71,9
72
(67,
217)
465,
247
0 Cu
mul
ativ
e n
et M
ism
atch
1,78
1,77
6 43
4,06
5 45
7,68
2 (4
70,0
02)
(398
,030
)(4
65,2
47)
0 0
not
e: C
apita
l Fun
d /e
quity
not
incl
uded
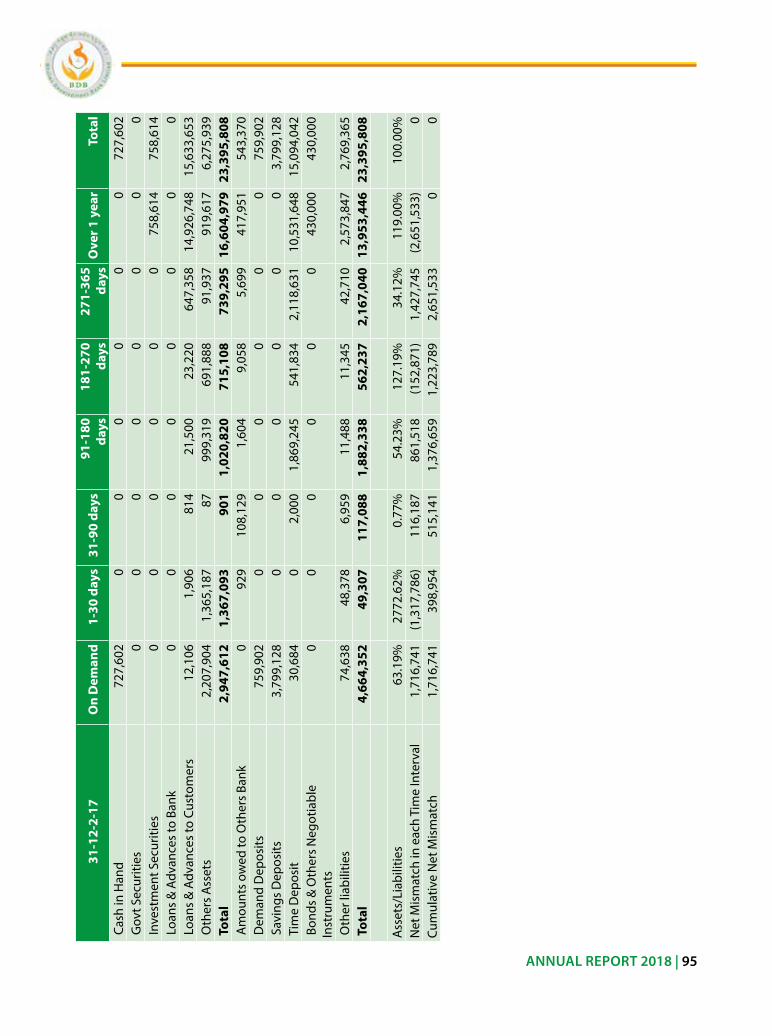
| 10 | BDB Annual Report 2017
sl # Particulars 2009 2013 2014 2015 2016 2017X No.of Depositors 15,879 85,864 109,005 133,366 159,576 178,386
Main Branch 657 4821 6,322 8,436 11,186 15,101 BranchOffice 15,222 81,043 102,683 124,930 148,390 163,285
XI Number of Employess 221 357 385 416 452 563HeadOffice 66 110 125 117 144 152Main Branch 29 28 30 31 39 45BranchOffice 126 219 230 268 269 366
XII ActiveClients/EmployeeRatioMain Branch 90 112 111 120 107 101BranchOffice 137 172 187 181 193 144
XII Loans/EmployeeRatio 13 24 28 33 37 33Main Branch 62 142 153 169 153 152BranchOffice 8 21 27 32 39 33
ANNUAL REPORT 2018 | 95
31-
12-2
-17
On
Dem
and
1-30
day
s31
-90
days
91-1
80
days
181-
270
days
271-
365
days
Ove
r 1 y
ear
Tota
l
Cas
h in
Han
d 72
7,60
2 0
0 0
0 0
0 72
7,60
2 G
ovt s
ecur
ities
0
0 0
0 0
0 0
0 in
vest
men
t sec
uriti
es
0 0
0 0
0 0
758,
614
758,
614
loa
ns &
adv
ance
s to
Ban
k 0
0 0
0 0
0 0
0 l
oans
& a
dvan
ces
to C
usto
mer
s 12
,106
1,
906
814
21,5
00
23,2
20
647,
358
14,9
26,7
48
15,6
33,6
53
oth
ers
ass
ets
2,20
7,90
4 1,
365,
187
87
999,
319
691,
888
91,9
37
919,
617
6,27
5,93
9 T
otal
2,
947,
612
1,36
7,09
3 90
1 1,
020,
820
715,
108
739,
295
16,6
04,9
79
23,3
95,8
08
am
ount
s ow
ed to
oth
ers
Bank
0
929
108,
129
1,60
4 9,
058
5,69
9 41
7,95
1 54
3,37
0 D
eman
d D
epos
its
759,
902
0 0
0 0
0 0
759,
902
sav
ings
Dep
osits
3,
799,
128
0 0
0 0
0 0
3,79
9,12
8 T
ime
Dep
osit
30,6
84
0 2,
000
1,86
9,24
5 54
1,83
4 2,
118,
631
10,5
31,6
48
15,0
94,0
42
Bon
ds &
oth
ers
neg
otia
ble
inst
rum
ents
0
0 0
0 0
0 43
0,00
0 43
0,00
0
oth
er li
abili
ties
74,6
38
48,3
78
6,95
9 11
,488
11
,345
42
,710
2,
573,
847
2,76
9,36
5 T
otal
4,
664,
352
49,3
07
117,
088
1,88
2,33
8 56
2,23
7 2,
167,
040
13,9
53,4
46
23,3
95,8
08
a
sset
s/li
abili
ties
63.1
9%27
72.6
2%0.
77%
54.2
3%12
7.19
%34
.12%
119.
00%
100.
00%
net
Mis
mat
ch in
eac
h Ti
me
inte
rval
1,71
6,74
1 (1
,317
,786
)11
6,18
7 86
1,51
8 (1
52,8
71)
1,42
7,74
5 (2
,651
,533
)0
Cum
ulat
ive
net
Mis
mat
ch1,
716,
741
398,
954
515,
141
1,37
6,65
9 1,
223,
789
2,65
1,53
3 0
0
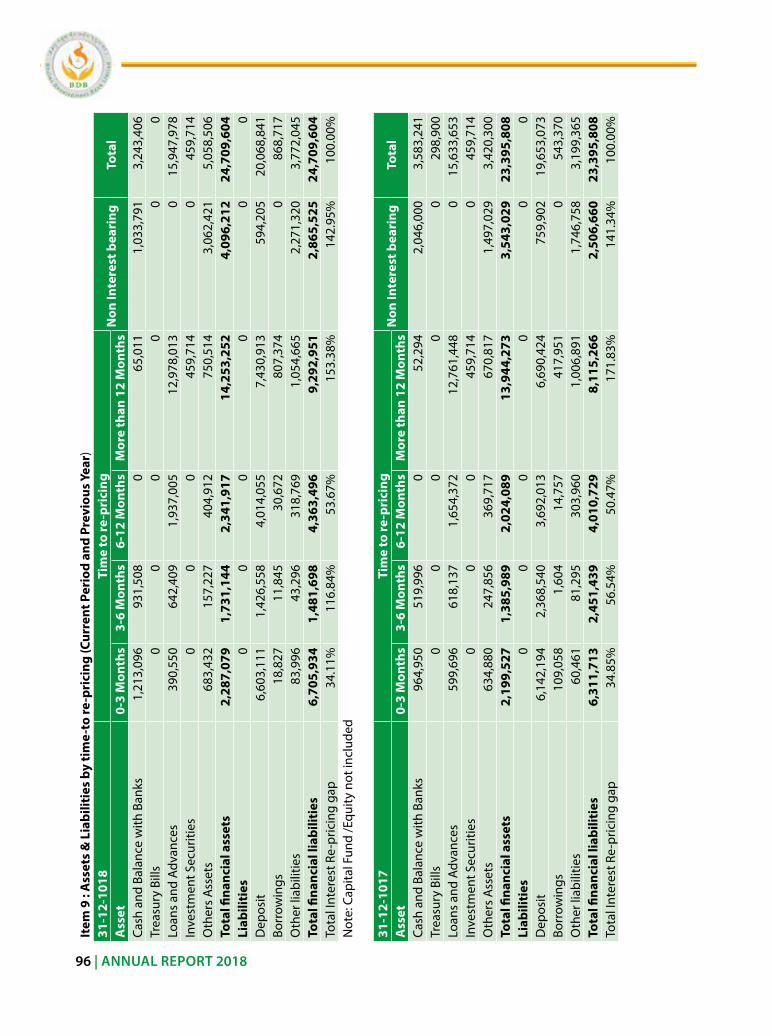
| 10 | BDB Annual Report 2017
sl # Particulars 2009 2013 2014 2015 2016 2017X No.of Depositors 15,879 85,864 109,005 133,366 159,576 178,386
Main Branch 657 4821 6,322 8,436 11,186 15,101 BranchOffice 15,222 81,043 102,683 124,930 148,390 163,285
XI Number of Employess 221 357 385 416 452 563HeadOffice 66 110 125 117 144 152Main Branch 29 28 30 31 39 45BranchOffice 126 219 230 268 269 366
XII ActiveClients/EmployeeRatioMain Branch 90 112 111 120 107 101BranchOffice 137 172 187 181 193 144
XII Loans/EmployeeRatio 13 24 28 33 37 33Main Branch 62 142 153 169 153 152BranchOffice 8 21 27 32 39 33
96 | ANNUAL REPORT 2018
Item
9 :
Ass
ets
& L
iabi
litie
s by
tim
e-to
re-p
rici
ng (C
urre
nt P
erio
d an
d Pr
evio
us Y
ear)
31-1
2-10
18Ti
me
to re
-pri
cing
Non
Inte
rest
bea
ring
To
tal
Ass
et0-
3 M
onth
s3-
6 M
onth
s6-
12 M
onth
sM
ore
than
12
Mon
ths
Cash
and
Bal
ance
with
Ban
ks1,
213,
096
931,
508
0 65
,011
1,
033,
791
3,24
3,40
6 Tr
easu
ry B
ills
0 0
0 0
0 0
loan
s an
d ad
vanc
es39
0,55
0 64
2,40
9 1,
937,
005
12,9
78,0
13
0 15
,947
,978
in
vest
men
t sec
uriti
es0
0 0
459,
714
0 45
9,71
4 o
ther
s a
sset
s68
3,43
2 15
7,22
7 40
4,91
2 75
0,51
4 3,
062,
421
5,05
8,50
6 To
tal fi
nanc
ial a
sset
s2,
287,
079
1,73
1,14
4 2,
341,
917
14,2
53,2
52
4,09
6,21
2 24
,709
,604
Li
abili
ties
0 0
0 0
0 0
Dep
osit
6,60
3,11
1 1,
426,
558
4,01
4,05
5 7,
430,
913
594,
205
20,0
68,8
41
Borr
owin
gs18
,827
11
,845
30
,672
80
7,37
4 0
868,
717
oth
er li
abili
ties
83,9
96
43,2
96
318,
769
1,05
4,66
5 2,
271,
320
3,77
2,04
5 To
tal fi
nanc
ial l
iabi
litie
s6,
705,
934
1,48
1,69
8 4,
363,
496
9,29
2,95
1 2,
865,
525
24,7
09,6
04
Tota
l int
eres
t re-
pric
ing
gap
34.1
1%11
6.84
%53
.67%
153.
38%
142.
95%
100.
00%
not
e: C
apita
l Fun
d /e
quity
not
incl
uded
31
-12-
1017
Tim
e to
re-p
rici
ngN
on In
tere
st b
eari
ng
Tota
lA
sset
0-3
Mon
ths
3-6
Mon
ths
6-12
Mon
ths
Mor
e th
an 1
2 M
onth
sCa
sh a
nd B
alan
ce w
ith B
anks
964,
950
519,
996
0 52
,294
2,
046,
000
3,58
3,24
1 Tr
easu
ry B
ills
0 0
0 0
0 29
8,90
0 lo
ans
and
adva
nces
599,
696
618,
137
1,65
4,37
2 12
,761
,448
0
15,6
33,6
53
inve
stm
ent s
ecur
ities
0 0
0 45
9,71
4 0
459,
714
oth
ers
ass
ets
634,
880
247,
856
369,
717
670,
817
1,49
7,02
9 3,
420,
300
Tota
l fina
ncia
l ass
ets
2,19
9,52
7 1,
385,
989
2,02
4,08
9 13
,944
,273
3,
543,
029
23,3
95,8
08
Liab
iliti
es0
0 0
0 0
0 D
epos
it6,
142,
194
2,36
8,54
0 3,
692,
013
6,69
0,42
4 75
9,90
2 19
,653
,073
Bo
rrow
ings
109,
058
1,60
4 14
,757
41
7,95
1 0
543,
370
oth
er li
abili
ties
60,4
61
81,2
95
303,
960
1,00
6,89
1 1,
746,
758
3,19
9,36
5 To
tal fi
nanc
ial l
iabi
litie
s6,
311,
713
2,45
1,43
9 4,
010,
729
8,11
5,26
6 2,
506,
660
23,3
95,8
08
Tota
l int
eres
t re-
pric
ing
gap
34.8
5%56
.54%
50.4
7%17
1.83
%14
1.34
%10
0.00
%
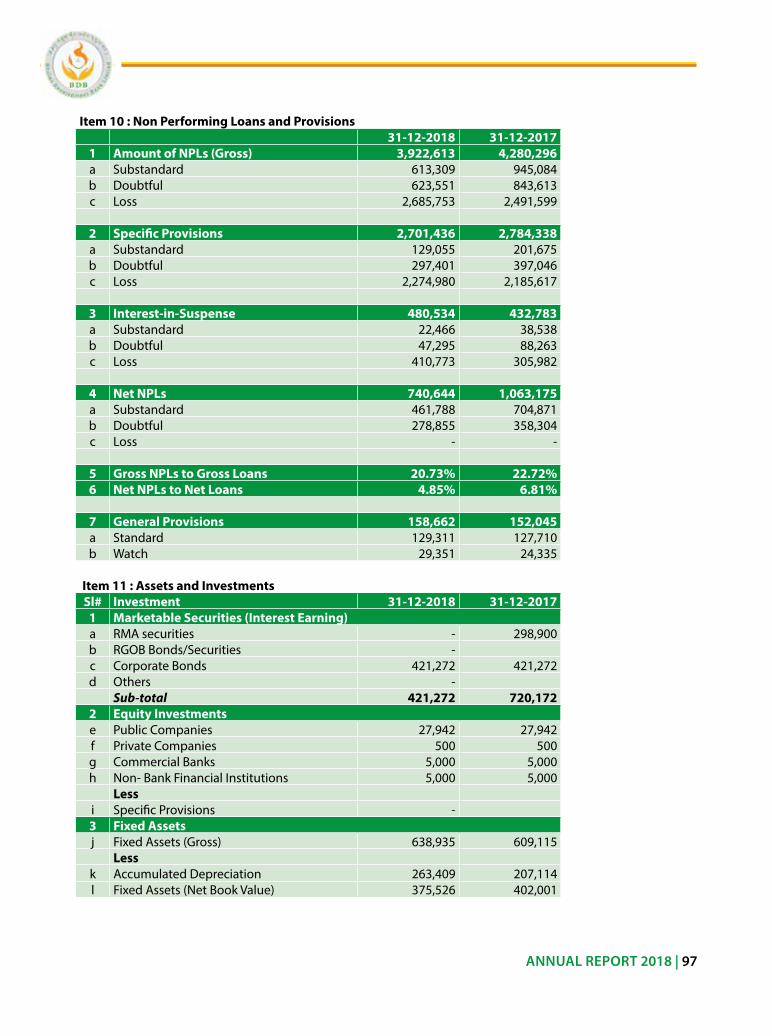
| 10 | BDB Annual Report 2017
sl # Particulars 2009 2013 2014 2015 2016 2017X No.of Depositors 15,879 85,864 109,005 133,366 159,576 178,386
Main Branch 657 4821 6,322 8,436 11,186 15,101 BranchOffice 15,222 81,043 102,683 124,930 148,390 163,285
XI Number of Employess 221 357 385 416 452 563HeadOffice 66 110 125 117 144 152Main Branch 29 28 30 31 39 45BranchOffice 126 219 230 268 269 366
XII ActiveClients/EmployeeRatioMain Branch 90 112 111 120 107 101BranchOffice 137 172 187 181 193 144
XII Loans/EmployeeRatio 13 24 28 33 37 33Main Branch 62 142 153 169 153 152BranchOffice 8 21 27 32 39 33
ANNUAL REPORT 2018 | 97
Item 10 : Non Performing Loans and Provisions 31-12-2018 31-12-2017 1 Amount of NPLs (Gross) 3,922,613 4,280,296 a substandard 613,309 945,084 b Doubtful 623,551 843,613 c loss 2,685,753 2,491,599 2 Specific Provisions 2,701,436 2,784,338 a substandard 129,055 201,675 b Doubtful 297,401 397,046 c loss 2,274,980 2,185,617 3 Interest-in-Suspense 480,534 432,783 a substandard 22,466 38,538 b Doubtful 47,295 88,263 c loss 410,773 305,982 4 Net NPLs 740,644 1,063,175 a substandard 461,788 704,871 b Doubtful 278,855 358,304 c loss - - 5 Gross NPLs to Gross Loans 20.73% 22.72%6 Net NPLs to Net Loans 4.85% 6.81% 7 General Provisions 158,662 152,045 a standard 129,311 127,710 b Watch 29,351 24,335
Item 11 : Assets and Investments Sl# Investment 31-12-2018 31-12-2017 1 Marketable Securities (Interest Earning) a rMa securities - 298,900 b rGoB Bonds/securities - c Corporate Bonds 421,272 421,272 d others - Sub-total 421,272 720,172 2 Equity Investments e Public Companies 27,942 27,942 f Private Companies 500 500 g Commercial Banks 5,000 5,000 h non- Bank Financial institutions 5,000 5,000 Less i specific Provisions - 3 Fixed Assets j Fixed assets (Gross) 638,935 609,115 Less k accumulated Depreciation 263,409 207,114 l Fixed assets (net Book Value) 375,526 402,001
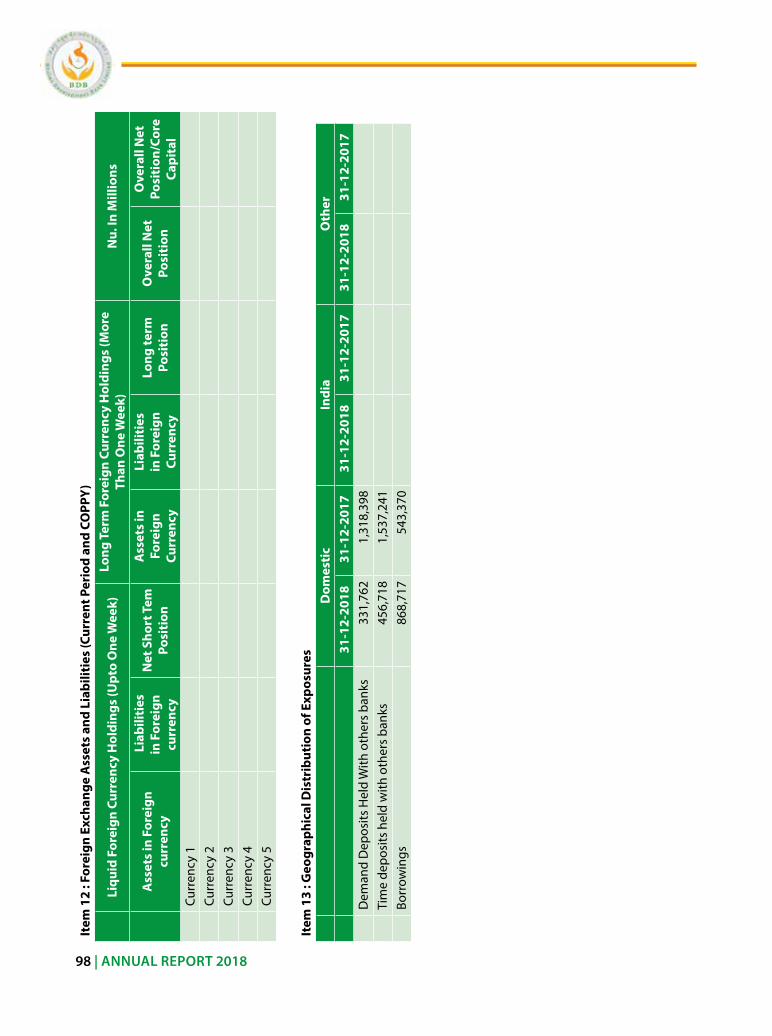
| 10 | BDB Annual Report 2017
sl # Particulars 2009 2013 2014 2015 2016 2017X No.of Depositors 15,879 85,864 109,005 133,366 159,576 178,386
Main Branch 657 4821 6,322 8,436 11,186 15,101 BranchOffice 15,222 81,043 102,683 124,930 148,390 163,285
XI Number of Employess 221 357 385 416 452 563HeadOffice 66 110 125 117 144 152Main Branch 29 28 30 31 39 45BranchOffice 126 219 230 268 269 366
XII ActiveClients/EmployeeRatioMain Branch 90 112 111 120 107 101BranchOffice 137 172 187 181 193 144
XII Loans/EmployeeRatio 13 24 28 33 37 33Main Branch 62 142 153 169 153 152BranchOffice 8 21 27 32 39 33
98 | ANNUAL REPORT 2018
Item
12
: For
eign
Exc
hang
e A
sset
s an
d Li
abili
ties
(Cur
rent
Per
iod
and
COPP
Y)
Li
quid
For
eign
Cur
renc
y H
oldi
ngs
(Upt
o O
ne W
eek)
Long
Ter
m F
orei
gn C
urre
ncy
Hol
ding
s (M
ore
Than
One
Wee
k)N
u. In
Mill
ions
A
sset
s in
For
eign
cu
rren
cy
Lia
bilit
ies
in F
orei
gn
curr
ency
Net
Sho
rt T
em
Posi
tion
Ass
ets
in
Fore
ign
Curr
ency
Liab
iliti
es
in F
orei
gn
Curr
ency
Long
term
Po
siti
onO
vera
ll N
et
Posi
tion
Ove
rall
Net
Po
siti
on/C
ore
Capi
tal
Cu
rren
cy 1
Curr
ency
2
Cu
rren
cy 3
Curr
ency
4
Cu
rren
cy 5
Item
13
: Geo
grap
hica
l Dis
trib
utio
n of
Exp
osur
es
D
omes
tic
Indi
aO
ther
31-
12-2
018
31-
12-2
017
31-
12-2
018
31-
12-2
017
31-
12-2
018
31-
12-2
017
D
eman
d D
epos
its H
eld
With
oth
ers
bank
s33
1,76
2 1,
318,
398
Ti
me
depo
sits
hel
d w
ith o
ther
s ba
nks
456,
718
1,53
7,24
1
Borr
owin
gs86
8,71
754
3,37
0
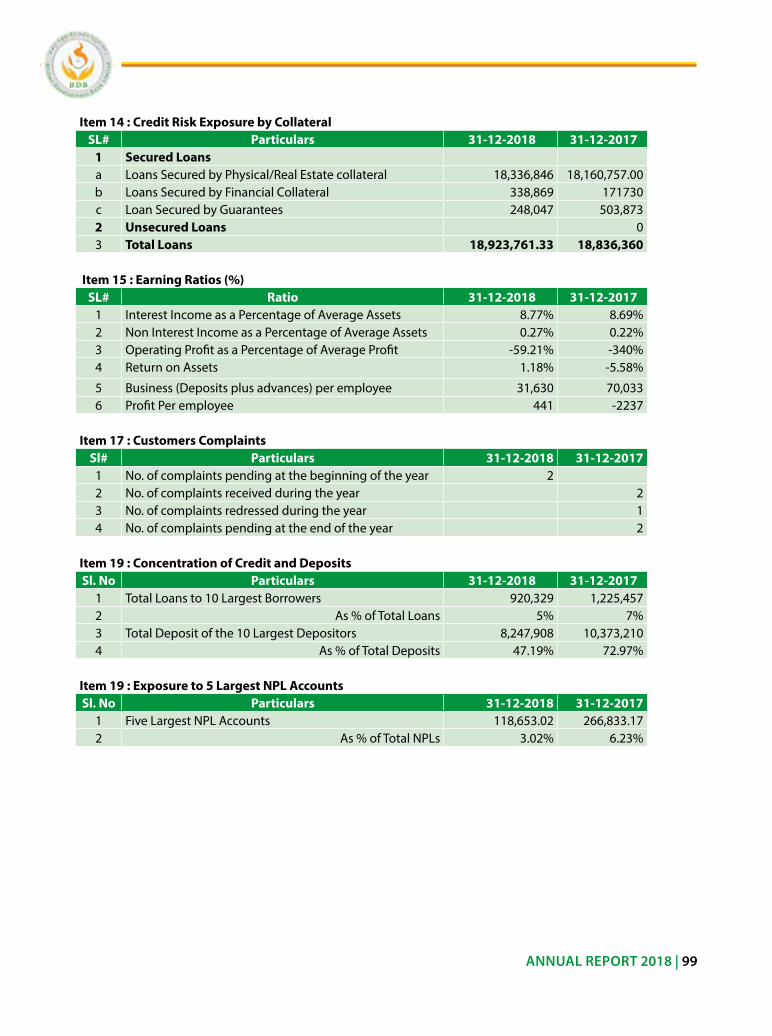
| 10 | BDB Annual Report 2017
sl # Particulars 2009 2013 2014 2015 2016 2017X No.of Depositors 15,879 85,864 109,005 133,366 159,576 178,386
Main Branch 657 4821 6,322 8,436 11,186 15,101 BranchOffice 15,222 81,043 102,683 124,930 148,390 163,285
XI Number of Employess 221 357 385 416 452 563HeadOffice 66 110 125 117 144 152Main Branch 29 28 30 31 39 45BranchOffice 126 219 230 268 269 366
XII ActiveClients/EmployeeRatioMain Branch 90 112 111 120 107 101BranchOffice 137 172 187 181 193 144
XII Loans/EmployeeRatio 13 24 28 33 37 33Main Branch 62 142 153 169 153 152BranchOffice 8 21 27 32 39 33
ANNUAL REPORT 2018 | 99
Item 14 : Credit Risk Exposure by CollateralSL# Particulars 31-12-2018 31-12-2017
1 Secured Loans a loans secured by Physical/real estate collateral 18,336,846 18,160,757.00 b loans secured by Financial Collateral 338,869 171730c loan secured by Guarantees 248,047 503,873 2 Unsecured Loans 03 Total Loans 18,923,761.33 18,836,360
Item 15 : Earning Ratios (%) SL# Ratio 31-12-2018 31-12-2017
1 interest income as a Percentage of average assets 8.77% 8.69%2 non interest income as a Percentage of average assets 0.27% 0.22%3 operating Profit as a Percentage of average Profit -59.21% -340%4 return on assets 1.18% -5.58%
5 Business (Deposits plus advances) per employee 31,630 70,033 6 Profit Per employee 441 -2237
Item 17 : Customers Complaints Sl# Particulars 31-12-2018 31-12-2017 1 no. of complaints pending at the beginning of the year 2 2 no. of complaints received during the year 23 no. of complaints redressed during the year 14 no. of complaints pending at the end of the year 2
Item 19 : Concentration of Credit and Deposits Sl. No Particulars 31-12-2018 31-12-2017
1 Total loans to 10 largest Borrowers 920,329 1,225,457 2 as % of Total loans 5% 7%3 Total Deposit of the 10 largest Depositors 8,247,908 10,373,210 4 as % of Total Deposits 47.19% 72.97%
Item 19 : Exposure to 5 Largest NPL Accounts Sl. No Particulars 31-12-2018 31-12-2017
1 Five largest nPl accounts 118,653.02 266,833.17 2 as % of Total nPls 3.02% 6.23%
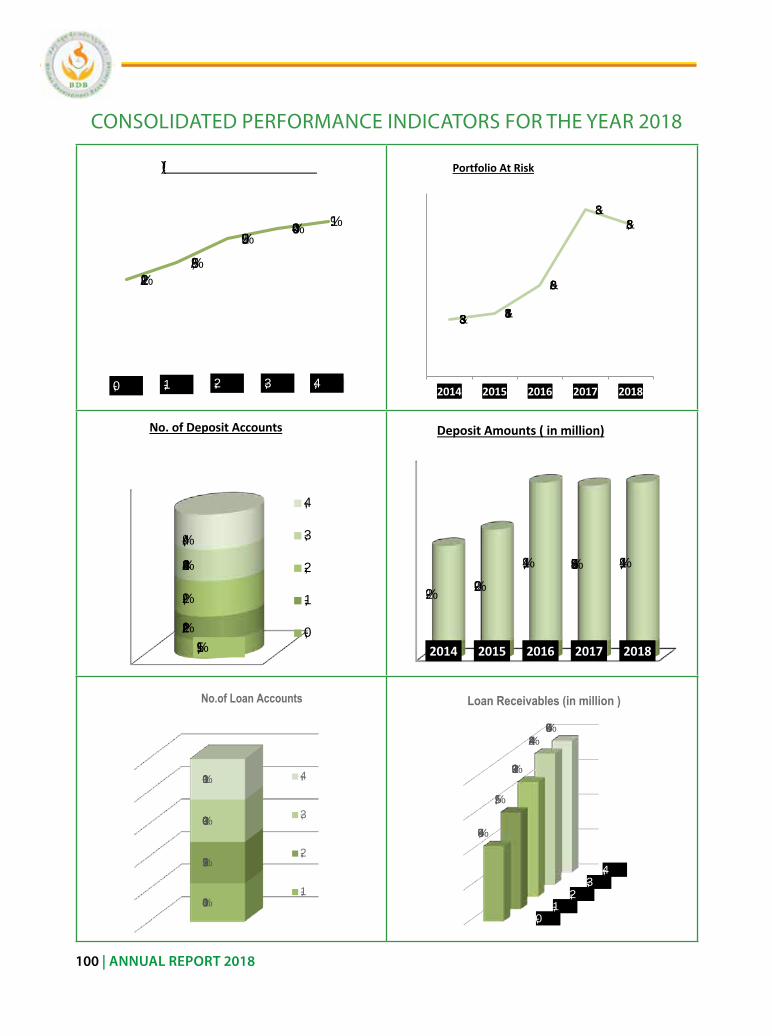
| 10 | BDB Annual Report 2017
sl # Particulars 2009 2013 2014 2015 2016 2017X No.of Depositors 15,879 85,864 109,005 133,366 159,576 178,386
Main Branch 657 4821 6,322 8,436 11,186 15,101 BranchOffice 15,222 81,043 102,683 124,930 148,390 163,285
XI Number of Employess 221 357 385 416 452 563HeadOffice 66 110 125 117 144 152Main Branch 29 28 30 31 39 45BranchOffice 126 219 230 268 269 366
XII ActiveClients/EmployeeRatioMain Branch 90 112 111 120 107 101BranchOffice 137 172 187 181 193 144
XII Loans/EmployeeRatio 13 24 28 33 37 33Main Branch 62 142 153 169 153 152BranchOffice 8 21 27 32 39 33
100 | ANNUAL REPORT 2018
ConsoliDaTeD PerForManCe inDiCaTors For THe Year 2018Consolidated Performance Indicators for the year 2018
2014 2015 2016 2017 2018
16,563 19,073
22,649 24,148 25,222
Assets Position ( in million )
20142015
20162017
2018
10,819
13,920
16,547
18,836 18,924
Loan Receivables (in million )
2014 2015 2016 2017 2018
12,162 14,216
20,085 19,689 20,085
Deposit Amounts ( in million)
109,005133,366
203,016
178,386
203,018
No. of Deposit Accounts
2018
2017
2016
2015
2014
7.77% 8.59%
12.43%
22.72%20.73%
2014 2015 2016 2017 2018
Portfolio At Risk
52,248
56,192
57,414
55,241
No.of Loan Accounts
2018
2017
2016
2015Consolidated Performance Indicators for the year 2018
2014 2015 2016 2017 2018
16,563 19,073
22,649 24,148 25,222
Assets Position ( in million )
20142015
20162017
2018
10,819
13,920
16,547
18,836 18,924
Loan Receivables (in million )
2014 2015 2016 2017 2018
12,162 14,216
20,085 19,689 20,085
Deposit Amounts ( in million)
109,005133,366
203,016
178,386
203,018
No. of Deposit Accounts
2018
2017
2016
2015
2014
7.77% 8.59%
12.43%
22.72%20.73%
2014 2015 2016 2017 2018
Portfolio At Risk
52,248
56,192
57,414
55,241
No.of Loan Accounts
2018
2017
2016
2015
Consolidated Performance Indicators for the year 2018
2014 2015 2016 2017 2018
16,563 19,073
22,649 24,148 25,222
Assets Position ( in million )
20142015
20162017
2018
10,819
13,920
16,547
18,836 18,924
Loan Receivables (in million )
2014 2015 2016 2017 2018
12,162 14,216
20,085 19,689 20,085
Deposit Amounts ( in million)
109,005133,366
203,016
178,386
203,018
No. of Deposit Accounts
2018
2017
2016
2015
2014
7.77% 8.59%
12.43%
22.72%20.73%
2014 2015 2016 2017 2018
Portfolio At Risk
52,248
56,192
57,414
55,241
No.of Loan Accounts
2018
2017
2016
2015
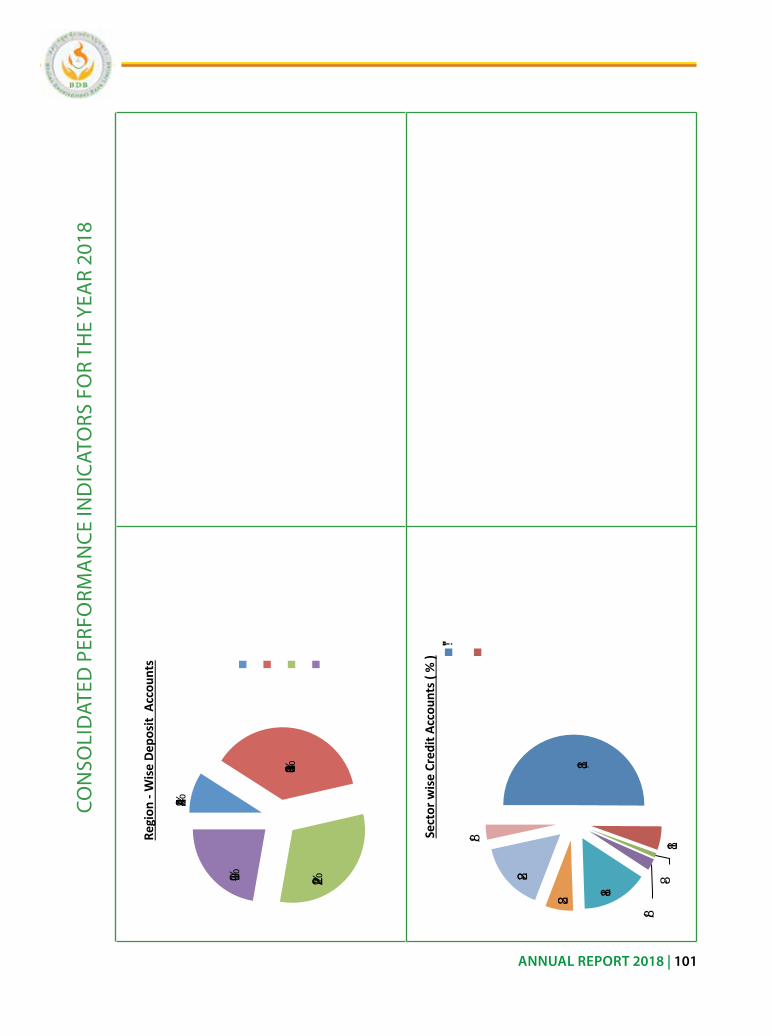
| 10 | BDB Annual Report 2017
sl # Particulars 2009 2013 2014 2015 2016 2017X No.of Depositors 15,879 85,864 109,005 133,366 159,576 178,386
Main Branch 657 4821 6,322 8,436 11,186 15,101 BranchOffice 15,222 81,043 102,683 124,930 148,390 163,285
XI Number of Employess 221 357 385 416 452 563HeadOffice 66 110 125 117 144 152Main Branch 29 28 30 31 39 45BranchOffice 126 219 230 268 269 366
XII ActiveClients/EmployeeRatioMain Branch 90 112 111 120 107 101BranchOffice 137 172 187 181 193 144
XII Loans/EmployeeRatio 13 24 28 33 37 33Main Branch 62 142 153 169 153 152BranchOffice 8 21 27 32 39 33
ANNUAL REPORT 2018 | 101
Con
soli
DaT
eD P
erFo
rMa
nCe
inD
iCaT
ors
Fo
r TH
e Ye
ar
2018
Con
solid
date
d Pe
rfor
man
ce In
dica
tors
for t
he y
ear 2
018
18,3
86 75
,847
63,6
62
45,1
21 R
egio
n -W
ise
Dep
osit
Acc
ount
s
MAI
N BR
ANCH
WES
TERN
REG
ION
EAST
ERN
REGI
ON
CENT
RAL R
EGIO
N
30% 7% 4%
15%
18%
6%
14%
6%Sect
or w
ise
Cred
it O
utst
andi
ng (
%) Ag
ricul
ture
Trad
e/Co
mm
erce
Man
ufac
turin
g/In
dust
rySe
rvice
s
Hous
ing
Tran
spor
t
Pers
onal
Loan
50%
5%1%
3%
15%
6%
16%
3%Sect
or w
ise
Cred
it A
ccou
nts
( % )
Agric
ultu
re
Trad
e/Co
mm
erce
Man
ufac
turin
g/In
dust
rySe
rvice
s
Hous
ing
Tran
spor
t
Pers
onal
Loan
Othe
rs
12,4
90
3,88
9 2,27
2 1,43
4 Reg
ion
-Wis
e D
epos
it A
mou
nt
MAI
N BR
ANCH
WES
TERN
REG
ION
EAST
ERN
REGI
ON
CENT
RAL R
EGIO
N
Con
solid
date
d Pe
rfor
man
ce In
dica
tors
for t
he y
ear 2
018
18,3
86 75
,847
63,6
62
45,1
21 R
egio
n -W
ise
Dep
osit
Acc
ount
s
MAI
N BR
ANCH
WES
TERN
REG
ION
EAST
ERN
REGI
ON
CENT
RAL R
EGIO
N
30% 7% 4%
15%
18%
6%
14%
6%Sect
or w
ise
Cred
it O
utst
andi
ng (
%) Ag
ricul
ture
Trad
e/Co
mm
erce
Man
ufac
turin
g/In
dust
rySe
rvice
s
Hous
ing
Tran
spor
t
Pers
onal
Loan
50%
5%1%
3%
15%
6%
16%
3%Sect
or w
ise
Cred
it A
ccou
nts
( % )
Agric
ultu
re