bhp billiton results for the half year ended 31 …
TRANSCRIPT

1
Release Time IMMEDIATE
Date 21 February 2017
Number 5/17
BHP BILLITON RESULTS FOR THE HALF YEAR ENDED 31 DECEMBER 2016
Despite improvements in our safety performance indicators, tragically there was a fatality at Escondida.
Attributable profit of US$3.2 billion, Underlying EBITDA(1) of US$9.9 billion and an Underlying EBITDA margin(2) of 54% for the December 2016 half year.
Productivity gains(3) of US$1.2 billion achieved for the period, including the benefit from the increase in estimated recoverable copper contained in the Escondida sulphide leach pad. We remain on track for US$1.8 billion of gains for the 2017 financial year, excluding any impact of industrial action at Escondida.
Unit cash costs(4) declined at our major assets compared to the December 2015 half year. Full year unit cost guidance has been adjusted to reflect unfavourable exchange rate movements.
Capital and exploration expenditure(5) decreased by 38% to US$2.7 billion. We now expect to invest US$5.6 billion in the 2017 financial year and US$6.3 billion in the 2018 financial year, reflecting an increase in exploration spend in both years following the successful bid for Trion in Mexico and positive drilling results at LeClerc and Caicos.
Strong operating performance and improving capital productivity supported free cash flow(2) of US$5.8 billion.
We strengthened our balance sheet, with net debt(2) of US$20.1 billion significantly reduced from US$26.1 billion at 30 June 2016 reflecting strong free cash flow generation and a favourable fair value adjustment of US$2.0 billion related to interest rate and exchange rate movements.
The Board has determined to pay an interim dividend of 40 US cents per share which is covered by free
cash flow. This comprises the minimum payout of 30 US cents per share and an additional amount of
10 US cents per share.
Total copper production guidance for the 2017 financial year is under review as a result of ongoing
industrial action at Escondida.
At Samarco, substantial progress is being made on the social and environmental remediation programs. A Preliminary Agreement has been entered into with the Federal Prosecutors’ Office. Restart of operations remains a focus but will only occur if it is safe, economically viable and has community support.
Half year ended 31 December 2016 US$M
2015US$M
Change%
Profit/(loss) from operations 6,057 (7,030) n/a
Attributable profit/(loss) 3,204 (5,669) n/a
Basic earnings/(loss) per share (cents) 60.2 (106.5) n/a
Dividend per share (cents) 40.0 16.0 150%
Net operating cash flow 7,697 5,260 46%
Underlying EBITDA(1) 9,896 5,994 65%
Underlying EBIT(1) 5,982 1,342 346%
Underlying attributable profit(1) 3,244 412 687%
Underlying basic earnings per share (cents)(2) 61.0 7.7 692%
Capital and exploration expenditure(5) 2,727 4,368 (38%)
Net debt(2) 20,057 25,921 (23%)
News Release
2
Results for the half year ended 31 December 2016
BHP Billiton Chief Executive Officer, Andrew Mackenzie, said: “This is a strong result that follows several years of a
considered and deliberate approach to improve productivity and redesign our portfolio and operating model. Our
steadfast commitment to this plan has positioned us to take full advantage in a period of higher prices with Underlying
EBITDA up 65 per cent to US$9.9 billion.
The demerger of South32 and over US$7 billion of asset sales have shaped a portfolio that is now true to its strategy.
Our assets are large, long-life and low-cost and provide exposure to a diverse mix of commodities with an attractive
outlook. Our new operating model has sharpened the focus of our operations on the things that matter most: safety,
volume and cost. A decline in unit costs at our major assets supported US$1.2 billion of productivity gains in the half,
which follows the US$11 billion of annualised gains embedded over the last four years.
Greater productivity and increased capital efficiency supported strong free cash flow generation of US$5.8 billion.
Strict adherence to our capital allocation framework has maximised the use of this cash. We have strengthened our
balance sheet, with net debt falling sharply to close the period at US$20.1 billion. As we further strengthen the balance
sheet our ability to invest counter-cyclically will only be enhanced. Our minimum 50 per cent dividend payout policy
equates to 30 US cents per share. In recognition of the importance of shareholder returns and confidence in the
Company’s performance, the Board has determined to pay an additional amount of 10 US cents per share, taking
the overall interim dividend to 40 US cents per share.
We are confident in the long-term outlook for our commodities, particularly oil, with markets expected to rebalance in
the near-term, and copper where we expect a deficit to emerge in the early 2020s. We have the right settings in place
to substantially grow shareholder value.
The health and safety of our people and the communities in which we operate always come first
Health and safety are core to our values and we are committed to providing a safe workplace. BHP Billiton reported
a record low Total Recordable Injury Frequency of 3.9 per million hours worked in the December 2016 half year.
Despite the improvement in safety performance indicators, tragically one of our colleagues died at Escondida in
October 2016.
We remain committed to supporting Samarco with the recovery of the communities and environment
Providing our support for the long-term recovery of the communities and environment affected by the Samarco
tragedy on 5 November 2015 remains a priority for BHP Billiton. Substantial progress has been made on community
resettlement, community health and environment restoration. The Renova Foundation has been operational since
August 2016. Relocation of the communities most severely affected by the dam failure is progressing well. The
program of works designed to contain tailings during the wet season was completed, as were improvements to water
treatment plants along the Rio Doce.
On 18 January 2017, Samarco and its shareholders, Vale and BHP Billiton Brasil, entered into a Preliminary
Agreement with the Federal Prosecutors in Brazil. This outlines the process and timeline for negotiation of a
settlement of the R$155 billion (approximately US$47.5 billion) Civil Claim relating to the Fundão tailings dam failure.
Under the timeframe established in the Preliminary Agreement, negotiations in relation to a final settlement
arrangement with the Federal Prosecutors are expected to occur before the end of June 2017.
Restart of Samarco’s operations remains a focus but is subject to separate negotiations with relevant parties and will
occur only if it is safe, economically viable and has the support of the community. Resuming operations requires
government approvals, the granting of licenses by state authorities, the restructure of Samarco’s debt and the
completion of commercial arrangements with Vale regarding the use of its Timbopeba pit.
In the December 2016 half year, BHP Billiton recorded an exceptional item of US$155 million (after tax) in relation to
the Samarco dam failure. Additional commentary is included on page 35.

BHP Billiton Results for the half year ended 31 December 2016
3
Our diversified portfolio and simplified structure deliver strong financial performance
Earnings and margins
Attributable profit of US$3.2 billion includes an exceptional loss of US$40 million (after tax). That loss related to
the Samarco dam failure (US$155 million), which was partially offset by US$115 million related to the cancellation
of the Caroona exploration licence.
Underlying attributable profit of US$3.2 billion.
Underlying EBITDA of US$9.9 billion, with higher prices, operating cash cost improvements and other net
movements (in total US$4.3 billion) more than offsetting the negative impact of currency and inflation movements
(in total US$0.4 billion).
Underlying EBITDA margin of 54 per cent, compared with 40 per cent in the prior period.
Productivity and costs
US$1.2 billion of additional productivity gains compared to the December 2015 half year, with annualised
productivity gains of more than US$11 billion already embedded over the last four years.
On track to deliver approximately US$1.8 billion of productivity gains during the 2017 financial year, excluding
any impact of industrial action at Escondida.
Unit cash costs declined at our major assets when compared to the December 2015 half year.
Escondida, Conventional petroleum, Queensland Coal, and Western Australia Iron Ore (WAIO) unit cash costs(4)
decreased by 37 per cent, 10 per cent, four per cent and one per cent, respectively, compared to the December
2015 half year. Lower Escondida unit cash costs reflected the benefit related to a change in estimated
recoverable copper contained in the sulphide leach pad and favourable inventory movements. In local currency
terms, Queensland Coal and WAIO unit costs declined by eight per cent and five per cent respectively.
Historical costs and updated guidance for the 2017 financial year (reflecting unfavourable exchange rate
movements) are summarised below:
H1 FY17 H1 FY16
FY16
Current FY17(i)
guidance
PreviousFY17(i)
guidance
FY17e vs
FY16
Conventional petroleum unit cost(ii) (US$ per barrel of oil equivalent) 8.42 9.38 8.63 10 10 16%
Escondida unit cost (US$ per pound) 0.91 1.45 1.12 1.00(iii) 1.00 (11%)
Western Australia Iron Ore unit cost (US$ per tonne) 15.05 15.21 15.06 <15 14 (0%)
Queensland Coal unit cost (US$ per tonne) 56.43 58.69 55.25 54 52 (2%)
(i) Current 2017 financial year guidance is based on exchange rates of AUD/USD 0.75 and USD/CLP 663. Previous guidance was based on exchange rates of AUD/USD 0.71 and USD/CLP 698.
(ii) Excludes impact from revaluation of embedded derivatives in the Trinidad and Tobago gas contract: H1 FY17 US$46 million loss; H1 FY16 US$106 million gain; FY16 US$14 million gain.
(iii) Guidance unchanged pending the outcome of industrial action.
Cash flow and balance sheet
Delivered net operating cash flows of US$7.7 billion, reflecting higher commodity prices and further cash cost
efficiencies.
Generated free cash flow of US$5.8 billion. Our Onshore US assets are now free cash flow positive, reflecting
continued improvements in both operating and capital efficiency.
We continued to strengthen our balance sheet, finishing the period with net debt(2) of US$20.1 billion (30 June
2016: US$26.1 billion; 31 December 2015: US$25.9 billion). This reduction reflects strong free cash flow
generation during the period as well as a non-cash fair value adjustment of US$2.0 billion related to interest rate
and exchange rate movements, partially offset by the recognition of the Kelar finance lease of US$591 million.
Gearing ratio(2) of 24.3 per cent (30 June 2016: 30.3 per cent; 31 December 2015: 29.7 per cent).

News Release
4
Dividends
The dividend policy provides for a minimum 50 per cent payout of Underlying attributable profit at every reporting
period. The minimum dividend payment for the period is 30 US cents per share.
Recognising the importance of cash returns to shareholders, the Board has determined to pay an additional
amount of 10 US cents per share, taking the overall interim dividend to 40 US cents per share.
Projects and exploration
Capital and exploration expenditure of US$2.7 billion, down 38 per cent in the December 2016 half year, included
maintenance spend of US$0.6 billion(6).
Following the successful bid for Trion in Mexico and positive drilling results at LeClerc and Caicos, a
US$820 million exploration program is now planned for the current financial year.
All major projects under development are tracking to plan.
On 9 February 2017, BHP Billiton’s Board approved an investment of US$2.2 billion (BHP Billiton share) for the
development of the Mad Dog Phase 2 project in the deepwater Green Canyon area of the Gulf of Mexico.
Capital and exploration expenditure is now expected to be US$5.6 billion for the 2017 financial year and
US$6.3 billion in the 2018 financial year, reflecting an increase in exploration spend in both years.
Disciplined capital allocation is maximising shareholder value
Strict adherence to our capital allocation framework balances value creation, cash returns to shareholders and
balance sheet strength in a transparent and consistent manner. This framework continues to provide valuable
flexibility.
Our priorities for capital are to:
first, maintain safe and stable operations;
second, maintain a strong balance sheet through the cycle;
third, pay shareholders a minimum of 50 per cent of Underlying attributable profit as dividends; and
fourth, direct remaining cash to the value-maximising outcome, with debt reduction, investing in growth projects,
buying back shares, paying additional dividend amounts and acquiring assets, all competing for capital.
With several of our commodity exposures currently trading above our long-term forecasts and with considerable
economic and political uncertainty ahead, our bias for lowering debt remains. While the balance sheet is strong, our
ongoing focus on debt reduction during this period of elevated commodity prices will protect the Company through
periods of higher volatility and support counter cyclical investments as we move through the cycle. We will continue
to invest in releasing near-term latent production capacity and progressing our broad suite of medium and long-term
growth options which, while timed to meet identified market windows, are progressing well.
Outlook - near-term uncertainty, attractive long-term fundamentals
Economic outlook
World economic growth is likely to remain within the range of three to three and a half per cent in the 2017 calendar
year. A move above this range will be delayed by rising political uncertainty which has the potential to weigh on
international trade and business confidence.
Our view on China remains unchanged. China’s economic growth is expected to moderate in the coming year. The
growth rate will remain consistent with official guidance. We anticipate a cooling of growth rates in the housing and
automobile markets in combination with a continuation of strength in infrastructure. Manufacturing investment should
stabilise, however exports may be challenged by the rising threat of protectionism.
BHP Billiton Results for the half year ended 31 December 2016
5
China’s policymakers will continue to seek a balance between the pursuit of reform and the maintenance of
macroeconomic and financial stability. We expect a continuation of efforts to address excess capacity and improve
balance sheet health in over-indebted sectors. Longer term, our view remains that China’s economic growth rate will
decelerate as the working age population falls and the capital stock matures. China’s economic structure will continue
to rebalance from industry to services and growth drivers will shift from investment and exports towards consumption.
The outlook for the US economy is uncertain. The policy platform of the new administration points to a higher inflation
environment than previously envisaged. The medium-term impact on growth is unclear, notwithstanding infrastructure
related announcements, especially in the context of tighter financial conditions. In Europe and Japan, where the limits
of monetary policy effectiveness may have been reached, any upside on growth will have to come from external
demand sources. India’s economy should return to a healthy growth trajectory once the demonetisation shock
recedes. The stabilisation of commodity prices should help put a floor under growth in resource-exporting emerging
markets.
Commodities outlook
Crude oil prices trended higher in the first half of the 2017 financial year, particularly in the second quarter. OPEC
reversed course on 30 November 2016 by agreeing to its first production cut since 2008 and the first cooperative
deal with non-OPEC producers since 2001. These developments, and improving fundamentals, led to the price
recovery. The market is expected to rebalance in the short-term, supporting prices as inventory levels normalise.
However, political uncertainty, OPEC compliance rates and rising US output may offer some headwinds. The long-
term outlook remains positive, underpinned by rising demand from the developing world and natural field decline.
The domestic gas price in the US strengthened on a combination of winter heating demand, rising exports, and
declining production. At the end of the reporting period, natural gas inventories were below the five-year average.
This reduction in inventory levels is likely to offer price support in the near-term, notwithstanding the usual seasonal
influences. The abundance of lower-cost supply is likely to moderate significant price inflation longer term, however,
natural field decline and robust demand growth are forecast to incentivise development of incrementally higher-cost
resources.
Copper prices improved towards the end of the first half of the 2017 financial year due to a combination of mine
supply disruptions, stronger than expected Chinese demand and an improvement in investor sentiment. In the short-
to medium-term, new and expanded production is expected to keep pace with demand and maintain a well-supplied
market in balance. In the long-term, the copper outlook remains positive, as demand is supported by China’s shift
towards consumption and the scope for substantial growth in emerging markets. A deficit is expected to emerge by
the early 2020s as grade decline, water availability and limited high-quality development opportunities constrain the industry’s ability to cheaply meet growing demand.
Global steel production growth gained momentum in the first half of the 2017 financial year, led by a recovery in
China. In the short-term, Chinese steel production growth is expected to moderate as the rate of growth in the housing
market eases amidst escalating supply-side measures. Steel production in the rest of the world is likely to improve
marginally, led by India. In the long-term, the global steel market will grow modestly, supported mainly by incremental
demand from India and other populous emerging markets.
Iron ore prices have been highly volatile, starting the 2016 calendar year at low levels before recovering strongly in
the Chinese spring. The price reached a two year high in December 2016, on the back of higher-than-expected steel
production in China and tight supply of high grade ores. The market is likely to come under pressure in the short-
term from moderating Chinese steel demand growth, high port inventories and incremental low cost supply.
Metallurgical coal prices surged in the first half of the 2017 financial year, driven by pronounced shortages in both
domestic Chinese and seaborne supply and reflected the impact of China’s 276-working day reform policy and
adverse weather conditions in China and Queensland. Prices are expected to return to industry marginal cost once
seaborne and Chinese supply constraints are eased. The application of China’s coal supply reform policy is a source
of short-term uncertainty. We expect emerging markets such as India will provide long-term seaborne demand
growth, while high-quality metallurgical coals will continue to offer steel makers value-in-use benefits.

News Release
6
Capital and exploration
Historical capital and exploration expenditure and updated guidance for the 2017 and 2018 financial years (reflecting
an increase in exploration spend in both years) are summarised in the following table:
FY18e US$B
FY17e US$B
H1 FY17 US$M
H1 FY16US$M
FY16US$M
Capital expenditure (purchases of property, plant and equipment)(i) 5.4 4.6 2,288 3,958 6,946
Add: exploration expenditure 0.9 1.0 439 410 765
Capital and exploration expenditure (cash basis) 6.3 5.6 2,727 4,368 7,711
(i) Includes capitalised deferred stripping of US$200 million for H1 FY17; US$394 million for FY17 and US$878 million for FY18 (H1 FY16: US$391 million; FY16 US$750 million).
All major projects under development remain on time and on budget. During the December 2016 half year, the Bass
Strait Longford Gas Conditioning Plant project achieved initial gas sales and the Escondida Water Supply project
achieved mechanical completion, with first water expected to be delivered in the March 2017 quarter.
At Jansen, excavation and lining of the shafts are steadily progressing. Both shafts have been safely excavated and
lined through the Blairmore aquifer. The engineering contract for feasibility studies of Jansen Stage 1 has been
awarded.
On 9 February 2017, BHP Billiton’s Board approved an investment of US$2.2 billion (BHP Billiton share) for the development of the Mad Dog Phase 2 project in the deepwater Green Canyon area of the Gulf of Mexico.
Business Project and ownership
Capacity(i) Capital expenditure(i)
US$M
Date of initial production
Progress
Budget Actual Target
Projects completed during the December 2016 half year
Petroleum Bass Strait Longford Gas Conditioning Plant (Australia) 50% (non-operator)
Designed to process approximately 400 MMcf/d of high CO2 gas.
520 Q4 CY16 CY16 Initial sales achieved
Projects in execution at 31 December 2016
Copper Escondida Water Supply (Chile) 57.5%
New desalination facility to ensure continued water supply to Escondida.
3,430 Q1 CY17 Mechanical completion
achieved99% complete
Petroleum North West Shelf Greater Western Flank-B (Australia) 16.67% (non-operator)
To maintain LNG plant throughput from the North West Shelf operations.
314
CY19 27% complete
Other projects in progress at 31 December 2016
Potash(ii) Jansen Potash (Canada) 100%
Investment to finish the excavation and lining of the production and service shafts, and to continue the installation of essential surface infrastructure and utilities.
2,600
64% complete
(i) Unless noted otherwise, references to capacity are on a 100 per cent basis, references to capital expenditure from subsidiaries are reported on a 100 per cent basis and references to capital expenditure from joint operations reflects BHP Billiton’s share.
(ii) Total potash expenditure of approximately US$300 million, including capital expenditure of less than US$200 million, is expected for the 2017 financial year.

BHP Billiton Results for the half year ended 31 December 2016
7
Income statement
Underlying attributable profit and Underlying EBITDA are presented below. We believe focusing on Underlying
EBITDA more closely reflects operating cash generative capacity and hence the underlying performance of our
business.
Half year ended 31 December 2016US$M
2015US$M
Underlying attributable profit 3,244 412
Exceptional items (after taxation) – refer to pages 9 and 35 (40) (6,132)
Minority interest in exceptional items − 51
Attributable profit/(loss) 3,204 (5,669)
Half year ended 31 December 2016US$M
2015US$M
Underlying EBITDA 9,896 5,994
Depreciation, amortisation and impairments (3,914) (4,652)
Exceptional items (before net finance costs and taxation)(i) – refer to pages 9 and 35 75 (8,372)
Profit/(loss) from operations 6,057 (7,030)
Net finance costs (577) (429)
Total taxation (expense)/benefit (2,028) 1,726
Profit/(loss) after tax 3,452 (5,733)
(i) Exceptional items of US$75 million excludes net finance costs of US$(66) million included in the total US$(155) million related to the Samarco dam failure. Total exceptional items before tax inclusive of the US$(66) million net finance costs are US$9 million.
Underlying EBITDA
The following table and commentary describe the impact of the principal factors that affected Underlying EBITDA for
the December 2016 half year compared with the December 2015 half year:
US$M
Half year ended 31 December 2015 5,994
Net price impact: Change in sales prices 3,852 Higher average realised prices for all our major commodities. Price-linked costs (345) Increased royalties reflect higher realised prices.
3,507 Change in volumes:
Productivity 74 Productivity improvements across WAIO’s integrated supply chain offset by lower volumes at Pampa Norte due to maintenance and lower copper grade as expected.
Growth (199) Deferral of development activity in Onshore US and expected natural field decline. (125)
Change in controllable cash costs(2): Operating cash costs 1,142 Lower costs across the Group reflected a decrease in labour and contractor costs, favourable
impacts from a change in estimated recoverable copper in the Escondida sulphide leach pad and inventory movements, partially offset by additional WAIO rail maintenance costs.
Exploration and business development
(81) Higher petroleum exploration expense reflecting expensing of the Burrokeet wells.
1,061 Change in other costs:
Exchange rates (282) Impact of the stronger Australian dollar and Chilean peso against the US dollar. Inflation (148) Impact of inflation on the Group’s cost base. Fuel and energy 25 Lower diesel prices at minerals assets offset higher electricity costs at Olympic Dam. Non-cash (189) Increased depletion of stripping capitalised in prior periods and lower strip ratio consistent with
the Escondida mine plan. One-off items 13 Reflects power outage at Olympic Dam, royalty and other matters.
(581) Asset sales 163 Divestment of 50 per cent interest in Scarborough and non-core asset sales in Onshore US. Ceased and sold operations (64) Divestment of San Juan and Navajo energy coal assets. Other items (59) Higher average realised prices received by our equity accounted investments offset by the
suspension of Samarco operations and unfavourable fair value movements in Trinidad and Tobago gas contract.
Half year ended 31 December 2016 9,896

News Release
8
The following table reconciles relevant factors with changes in the Group’s productivity:
Half year ended 31 December 2016 US$M
Change in controllable cash costs 1,061
Change in volumes attributed to productivity 74
Change in productivity in Underlying EBITDA 1,135
Change in capitalised exploration 64
Change attributable to productivity initiatives 1,199
Prices and exchange rates
The average realised prices achieved for our major commodities are summarised in the following table:
Average realised prices(i) H1 FY17 H1 FY16 H2 FY16 FY16
H1 FY17vs
H1 FY16
H1 FY17vs
H2 FY16
H1 FY17vs
FY16
Oil (crude and condensate) (US$/bbl) 45 42 37 39 7% 22% 15%
Natural gas (US$/Mscf)(ii) 3.21 2.91 2.74 2.83 10% 17% 13%
US natural gas (US$/Mscf) 2.79 2.35 1.96 2.16 19% 42% 29%
LNG (US$/Mscf) 6.35 8.24 7.12 7.71 (23%) (11%) (18%)
Copper (US$/lb)(iii) 2.41 2.12 2.16 2.14 14% 12% 13%
Iron ore (US$/wmt, FOB) 55 43 44 44 28% 25% 25%
Hard coking coal (HCC) (US$/t) 179 82 83 83 118% 116% 116%
Weak coking coal (WCC) (US$/t) 122 67 70 69 82% 74% 77%
Thermal coal (US$/t)(iv) 74 49 46 48 51% 61% 54%
Nickel metal (US$/t) 10,581 9,926 8,792 9,264 7% 20% 14%
(i) Based on provisional, unaudited estimates. Prices exclude third party product and internal sales, and represent the weighted average of various sales terms (for example: FOB, CIF and CFR), unless otherwise noted.
(ii) Includes internal sales.
(iii) Includes the impact of provisional pricing and finalisation adjustments which increased Underlying EBITDA by US$37 million in the December 2016 half year.
(iv) Export sales only; excludes Cerrejón. Includes thermal coal sales from metallurgical coal mines.
The following exchange rates relative to the US dollar have been applied in the financial information:
Currency
AverageHalf year ended
31 December 2016
AverageHalf year ended
31 December 2015
As at31 December
2016
As at 31 December
2015
As at30 June
2016
Australian dollar(i) 0.75 0.72 0.72 0.73 0.75
Chilean peso 663 687 667 707 661
(i) Displayed as US$ to A$1 based on common convention.
Depreciation, amortisation and impairments
Depreciation, amortisation and impairments declined by US$738 million to US$3.9 billion, and reflected lower
production and a reduction in the depreciable asset base resulting from previously recorded impairment charges in
Onshore US.
Net finance costs
Net finance costs increased by US$148 million to US$577 million due to higher benchmark interest rates.

BHP Billiton Results for the half year ended 31 December 2016
9
Taxation expense
The Group’s adjusted effective tax rate(2), which excludes the influence of exchange rate movements and exceptional
items, was 34.7 per cent (31 December 2015: 33.5 per cent). The adjusted effective tax rate is expected to be in the
range of approximately 35 to 40 per cent for the 2017 financial year.
Half year ended 31 December 2016 2015
Profit/(loss)
before taxation US$M
Income tax(expense)/benefit
US$M %
Profit/(loss) before taxation
US$M
Income tax(expense)/benefit
US$M %
Statutory effective tax rate 5,480 (2,028) 37.0% (7,459) 1,726 –
Adjusted for:
Exchange rate movements – 82 – 208
Exceptional items (9) 49 8,372 (2,240)
Adjusted effective tax rate 5,471 (1,897) 34.7% 913 (306) 33.5%
Other royalty and excise arrangements which are not profit based are recognised as operating costs within Profit/
(loss) before taxation. These amounted to US$963 million during the period (31 December 2015: US$755 million).
Exceptional items
The following table sets out the exceptional items in the December 2016 half year. Additional commentary is included
on page 35.
Half year ended 31 December 2016 GrossUS$M
Tax US$M
NetUS$M
Exceptional items by category
Samarco dam failure(i) (155) – (155)
Cancellation of the Caroona exploration licence 164 (49) 115
Total 9 (49) (40)
(i) Financial impacts of US$(155) million from the Samarco dam failure relates to US$(61) million share of loss from US$(61) million funding provided during the period, US$(41) million direct costs incurred by BHP Billiton Brasil Ltda and other BHP Billiton entities, US$(66) million net finance costs offset by US$13 million other movements in the Samarco dam failure provision including foreign exchange.
Dividend
Our Board today determined to pay an interim dividend of 40 US cents per share. The interim dividend to be paid by
BHP Billiton Limited will be fully franked for Australian taxation purposes.
Events in respect of the interim dividend Date
Currency conversion into rand 3 March 2017
Last day to trade cum dividend on JSE Limited (JSE) 7 March 2017
Ex-dividend Date JSE and New York Stock Exchange (NYSE) 8 March 2017
Ex-dividend Date Australian Securities Exchange (ASX) and London Stock Exchange (LSE) 9 March 2017
Record Date (including currency conversion and currency election dates for ASX and LSE) 10 March 2017
Payment Date 28 March 2017
BHP Billiton Plc shareholders registered on the South African section of the register will not be able to dematerialise
or rematerialise their shareholdings between 8 and 10 March 2017 (inclusive), nor will transfers between the UK
register and the South African register be permitted between 3 and 10 March 2017 (inclusive). American Depositary
Shares (ADSs) each represent two fully paid ordinary shares and receive dividends accordingly.
Details of the currency exchange rates applicable to the dividend will be announced to the relevant stock exchanges
following conversion and will appear on the Group’s website.

News Release
10
Debt management and liquidity
During the December 2016 half year, Escondida issued US$1.2 billion of new long-term debt to refinance
US$0.8 billion of short-term debt. At the Group level, no new debt was issued and US$1.3 billion of senior debt was
repaid at maturity. This is consistent with the Group’s continued focus on debt reduction.
The Group has a US$6.0 billion commercial paper program backed by a US$6.0 billion revolving credit facility. The
revolving credit facility expires in May 2021, after the one-year extension option was exercised in May 2016. As at
31 December 2016, the Group had US$ nil outstanding in the US commercial paper market, US$ nil drawn under
the revolving credit facility and US$14.0 billion in cash and cash equivalents.

BHP Billiton Results for the half year ended 31 December 2016
11
Segment summary(i)
A summary of the performance for the December 2016 and December 2015 half years is presented below.
Half year ended 31 December 2016 US$M Revenue(ii)
Underlying EBITDA
Underlying EBIT
Exceptional items(vii)
Profit/(loss) from operations
Net operating
assetsCapital
expenditure Exploration
gross(iii)Exploration
to profit(iv)
Petroleum 3,302 2,000 360 − 360 24,331 845 364 260
Copper 4,209 1,744 914 − 914 24,743 830 17 17
Iron Ore 6,930 4,162 3,230 (55) 3,175 20,312 415 50 50
Coal 3,927 2,011 1,628 164 1,792 10,335 103 3 3
Group and unallocated items(v)
482 (21) (150) (34) (184) 2,747 95 5 5
Inter-segment adjustment(vi)
(54) − − − − − − − −
BHP Billiton Group 18,796 9,896 5,982 75 6,057 82,468 2,288 439 335
Half year ended 31 December 2015 US$M Revenue(ii)
Underlying EBITDA
Underlying EBIT
Exceptional items
Profit/(loss) from operations
Net operating
assetsCapital
expenditure Exploration
gross(iii)Exploration
to profit(iv)
Petroleum 3,800 2,215 (199) (7,184) (7,383) 25,950 1,455 321 126
Copper 3,893 829 101 − 101 23,636 1,596 33 33
Iron Ore 5,349 2,823 1,927 (1,180) 747 22,264 553 46 30
Coal 2,337 155 (342) − (342) 11,225 185 9 9
Group and unallocated items(v)
404 (28) (145) (8) (153) 3,038 169 1 1
Inter-segment adjustment(vi)
(71) − − − − − − − −
BHP Billiton Group 15,712 5,994 1,342 (8,372) (7,030) 86,113 3,958 410 199
(i) Group and segment level information is reported on a statutory basis which, in relation to Underlying EBITDA, includes depreciation, amortisation and impairments, net finance costs and taxation (expense)/benefit of US$267 million (2015: US$274 million) related to equity accounted investments. It excludes exceptional items of US$61 million (2015: US$655 million) related to share of loss from equity accounted investments. Group profit/(loss) before taxation comprised Underlying EBITDA, exceptional items, depreciation, amortisation and impairments of US$3,914 million (2015: US$4,652 million) and net finance costs of US$577 million (2015: US$429 million).
(ii) Revenue is based on Group realised prices and includes third party products. Sale of third party products by the Group contributed revenue of US$567 million and Underlying EBITDA of US$49 million (2015: US$555 million and US$(27) million).
(iii) Includes US$147 million capitalised exploration (2015: US$211 million).
(iv) Includes US$43 million of exploration expenditure previously capitalised, written off as impaired (included in depreciation and amortisation) (2015: US$ nil).
(v) Group and unallocated items includes Functions, other unallocated operations including Potash, Nickel West and consolidation adjustments. Revenue not attributable to reportable segments comprises the sale of freight and fuel to third parties. Exploration and technology activities are recognised within the relevant segments.
Half year ended 31 December 2016 US$M
Revenue
UnderlyingEBITDA D&A
Underlying EBIT
Net operating
assets
Capital
expenditure Exploration
grossExploration
to profit
Potash − (52) 6 (58) 2,983 68 − −Nickel West 472 37 43 (6) (193) 22 5 5
Half year ended 31 December 2015 US$M
Revenue
UnderlyingEBITDA D&A
Underlying EBIT
Netoperating
assetsCapital
expenditureExploration
grossExploration
to profit
Potash − (84) 3 (87) 2,775 113 − −Nickel West 387 (109) 33 (142) (123) 49 1 1
(vi) Comprises revenue of US$43 million generated by Petroleum (2015: US$60 million) and US$11 million generated by Iron Ore (2015: US$11 million).
(vii) Exceptional items of US$75 million excludes net finance costs of US$(66) million included in the total US$(155) million related to the Samarco dam failure. Total exceptional items before tax inclusive of the US$(66) million net finance costs are US$9 million. Refer to note 2 Exceptional items for further information.

News Release
12
Petroleum
Underlying EBITDA for Petroleum decreased by US$215 million to US$2.0 billion in the December 2016 half year.
US$M
Underlying EBITDA for the half year ended 31 December 2015 2,215
Net price impact(i) 27
Change in volumes: growth (199)
Change in controllable cash costs (100)
Profit on sale of assets 196
Other(ii) (139)
Underlying EBITDA for the half year ended 31 December 2016 2,000
(i) Average realised price: crude and condensate oil US$45/bbl (2015: US$42/bbl); natural gas US$3.21/Mscf (2015: US$2.91/Mscf); LNG US$6.35/Mscf (2015: US$8.24/Mscf).
(ii) Other includes: exchange rate; inflation; ceased and sold operations; other items. Other items includes Onshore US rig termination charges of US$6 million (2015: US$65 million) and impact from revaluation of embedded derivatives in Trinidad and Tobago gas contract of US$46 million loss (2015: US$106 million gain).
Total petroleum production for the December 2016 half year decreased by 15 per cent to 105.9 MMboe.
Conventional production was broadly unchanged at 66 MMboe as higher production at Bass Strait and North
West Shelf offset natural field decline across the portfolio and the divestment of our gas business in Pakistan.
Onshore US production declined by 31 per cent to 40 MMboe as a result of the decision to defer development
activity for value and natural field decline.
Total petroleum production guidance for the 2017 financial year remains unchanged at between 200 and 210 MMboe,
comprising Conventional volumes between 123 and 127 MMboe and Onshore US volumes between 77 and
83 MMboe.
The increase in controllable cash costs reflects an increase in exploration expense, primarily attributable to expensing
of the Burrokeet wells. Conventional unit costs declined by 10 per cent to US$8.42 per barrel during the December
2016 half year as a result of a decrease in workovers. Conventional unit cost guidance for the 2017 financial year is
unchanged at approximately US$10 per barrel reflecting expected lower volumes as a result of seasonal demand in
the second half of the year and timing of maintenance costs.
In the December 2016 half year, gains on asset divestments of US$196 million were recognised, with the majority
related to the sale of 50 per cent of BHP Billiton’s interest in the undeveloped Scarborough area gas fields to
Woodside Energy Limited as well as some non-core asset sales in Onshore US as we continue to optimise our
acreage.
Petroleum capital expenditure declined by 42 per cent to US$845 million in the December 2016 half year. This
included US$273 million of Onshore US drilling and development expenditure. Despite longer and more complex
laterals and trials of new wells, our overall drilling and completion costs are now 25 per cent lower than the December
2015 half year, reflecting optimised well designs, operational efficiencies and procurement savings. Our Onshore US
assets are now free cash flow positive reflecting these improvements in both operating and capital efficiency.
Cost per well (US$M) H1 FY17 H2 FY16 H1 FY16 FY16
Black Hawk: Drilling cost 1.8 1.9 2.6 2.3
Black Hawk: Completion cost 2.7 2.7 3.2 3.1
Permian: Drilling cost 2.9 2.9 3.9 3.4
Permian: Completion cost 2.2 2.5 3.1 2.9
Haynesville: Drilling cost 3.5 n/a n/a n/a
Haynesville: Completion cost 2.7 n/a n/a n/a
Petroleum capital expenditure guidance of approximately US$1.4 billion (excluding US$0.2 billion from capital
creditor movements) for the 2017 financial year remains unchanged. This includes Conventional capital expenditure
of US$0.8 billion which is focused on life extension projects at Bass Strait and North West Shelf. Onshore US capital
expenditure is expected to be US$0.6 billion with development activity tailored to market conditions.

BHP Billiton Results for the half year ended 31 December 2016
13
On 9 February 2017, BHP Billiton’s Board approved the development of the Mad Dog Phase 2 project in the deepwater Green Canyon area of the Gulf of Mexico. The project includes a new floating production facility with the
capacity to produce up to 140,000 gross barrels of crude oil per day from up to 14 production wells, and is expected
to begin production in the 2022 financial year. The project cost has more than halved since 2013 with a revised field
development concept leading to significant cost reductions and is now estimated to be US$9 billion on a 100 per cent
basis (US$2.2 billion BHP Billiton share). This decision follows BP’s (the operator) sanction of the Mad Dog Phase 2
project in December 2016.
During the December 2016 half year, our Onshore US operated rig count was reduced from four to three. The current
rig count includes the deployment of a rig in the Haynesville field in October 2016, following the successful execution
of our hedging pilot. Additional hedge activity during the December 2016 quarter has led to approval of a second rig
in the Haynesville with operations expected to commence in March 2017. We maintain the flexibility to add additional
rigs in the Haynesville if market conditions are supportive. Completions activity in the Black Hawk was accelerated
in the December 2016 quarter to drawdown drilled and uncompleted well inventory as market conditions improved.
We have further optimised our acreage through trades and swaps in the Permian, and we continue to talk to
neighbouring operators about mutually value accretive swaps to enable us to drill longer wells.
We are currently progressing trials in the Black Hawk, testing the potential for staggered wells to increase recovery,
larger frac jobs to improve productivity and the potential of the Upper Eagle Ford horizon. We expect early results of
these trials to be known during the September 2017 quarter. These trials, combined with our improved productivity,
are significantly adding to our economic well inventory that can generate a minimum 15 per cent internal rate of return
at US$50 per barrel and US$3 per MMbtu.
December 2016 half year Liquids focused areas Gas focused areas (December 2015 half year) Eagle Ford Permian Haynesville Fayetteville Total
Capital expenditure(i) US$ billion 0.1 (0.6) 0.1 (0.2) 0.0 (0.0) 0.0 (0.0) 0.3 (0.9)
Rig allocation At period end 1 (5) 1 (2) 1 (0) 0 (0) 3 (7)
Net wells drilled and completed(ii) Period total 43 (74) 15 (19) 0 (4) 2 (10) 60 (107)
Net productive wells At period end 942 (912) 118 (94) 394 (409) 1,042 (1,085) 2,496 (2,500)
(i) Includes land acquisition, site preparation, drilling, completions, well site facilities, mid-stream infrastructure and pipelines.
(ii) Can vary between periods based on changes in rig activity and the inventory of wells drilled but not yet completed at period end.
Petroleum exploration expenditure for the December 2016 half year was US$364 million, of which US$217 million
was expensed. Activity for the period was largely focused in the deepwater Gulf of Mexico and the Caribbean.
During the period, positive drilling results were announced at the Caicos well in the Gulf of Mexico, with oil
encountered in multiple horizons, and at the LeClerc well in Trinidad and Tobago, with gas encountered in multiple
horizons. The Wildling appraisal well has been accelerated to establish the resource scale and potential for
commerciality of the oil discovered at Caicos. Studies have also commenced on the volume and potential market for
the gas discovered at LeClerc to assess commerciality. Non-commercial hydrocarbons were encountered at the
Burrokeet-2 well, concluding Phase 1 of the Trinidad and Tobago deepwater drilling campaign. The Invictus rig was
mobilised to the Gulf of Mexico to drill the Wildling appraisal well, which spud on 8 January 2017.
During the December 2016 half year, BHP Billiton won the bid to acquire a 60 per cent participating interest in and
operatorship of blocks AE-0092 and AE-0093, containing the Trion discovered resource, in Mexico. Subject to
satisfaction of conditions, BHP Billiton anticipates signing the relevant agreements in the March 2017 quarter. Trion
provides us with a first mover advantage and an opportunity to further appraise and potentially develop this area of
the deepwater Gulf of Mexico.
Following the successful bid for Trion in Mexico and positive drilling results at the Caicos well in the Gulf of Mexico
and the LeClerc well in Trinidad and Tobago, an US$820 million exploration program is now planned for the 2017
financial year, an increase of US$120 million from prior guidance.

News Release
14
Financial information for Petroleum for the December 2016 and December 2015 half years is presented below.
Half year ended 31 December 2016 US$M Revenue(i)
UnderlyingEBITDA D&A
Underlying EBIT
Net operating
assets
Capital
expenditure Exploration
gross(ii)Exploration
to profit(iii)
Australia Production Unit(iv) 308 263 142 121 1,025 15
Bass Strait 543 410 95 315 3,073 85
North West Shelf 604 581 102 479 1,529 109
Atlantis 288 230 206 24 1,641 76
Shenzi 244 183 100 83 1,085 35
Mad Dog 90 70 27 43 685 35
Eagle Ford 562 336 567 (231) 6,820 135
Permian 165 56 155 (99) 1,036 120
Haynesville 148 11 75 (64) 2,889 13
Fayetteville 136 45 37 8 919 5
Trinidad/Tobago 46 (21) 13 (34) 822 136
Algeria 104 76 18 58 99 10
Exploration − (217) 72 (289) 693 −
Other(v)(vi) 57 (32) 33 (65) 2,855 71
Total Petroleum from Group production
3,295 1,991 1,642 349 25,171 845 364 260
Closed mines(vii) − 8 − 8 (840) − − −
Third party products 14 3 − 3 − −
Total Petroleum 3,309 2,002 1,642 360 24,331 845 364 260
Adjustment for equity accounted investments(viii)
(7) (2) (2) − − − − −
Total Petroleum statutory result
3,302 2,000 1,640 360 24,331 845 364 260
Half year ended 31 December 2015 US$M Revenue(i)
UnderlyingEBITDA D&A
Underlying EBIT
Net operating
assetsCapital
expenditure Exploration
gross(ii)Exploration
to profit(iii)
Australia Production Unit(iv) 374 299 174 125 1,349 132
Bass Strait 454 328 74 254 3,052 134
North West Shelf 653 478 102 376 1,386 75
Atlantis 347 249 238 11 2,039 133
Shenzi 282 237 128 109 1,190 59
Mad Dog 52 41 14 27 635 61
Eagle Ford 884 440 1,079 (639) 7,574 586
Permian 140 23 140 (117) 1,110 201
Haynesville 170 (11) 204 (215) 3,158 26
Fayetteville 140 23 125 (102) 962 38
Trinidad/Tobago 71 153 11 142 884 5
Algeria 73 52 17 35 81 10
Exploration − (126) 43 (169) 897 −
Other(v)(vi)(ix) 79 (9) 67 (76) 2,495 (5)
Total Petroleum from Group production
3,719 2,177 2,416 (239) 26,812 1,455 321 126
Closed mines(vii) − 36 − 36 (862) − − −
Third party products 88 4 − 4 − −
Total Petroleum 3,807 2,217 2,416 (199) 25,950 1,455 321 126
Adjustment for equity accounted investments(viii)
(7) (2) (2) − − − − −
Total Petroleum statutory result
3,800 2,215 2,414 (199) 25,950 1,455 321 126

BHP Billiton Results for the half year ended 31 December 2016
15
(i) Petroleum revenue from Group production includes: crude oil US$1,701 million (2015: US$2,003 million), natural gas US$892 million (2015: US$933 million), LNG US$419 million (2015: US$481 million), NGL US$208 million (2015: US$206 million) and other US$68 million (2015: US$89 million).
(ii) Includes US$147 million of capitalised exploration (2015: US$195 million).
(iii) Includes US$43 million of exploration expenditure previously capitalised, written off as impaired (included in depreciation and amortisation) (2015: US$ nil).
(iv) Australia Production Unit includes Macedon, Pyrenees, Minerva and Stybarrow (ceased production June 2015).
(v) Predominantly divisional activities, business development, Pakistan (divested in December 2015), UK, Neptune, Genesis. Also includes the Caesar oil pipeline and the Cleopatra gas pipeline which are equity accounted investments and their financial information presented above with the exception of net operating assets reflects BHP Billiton’s share.
(vi) Goodwill associated with Onshore US of US$3,026 million is included in Other net operating assets (2015: US$3,026 million).
(vii) Comprises closed mining and smelting operations in Canada and the United States. In October 2014, the management of the closed mine sites was transitioned to Petroleum due to their geographic location.
(viii) Total Petroleum segment Revenue excludes US$7 million (2015: US$7 million) revenue related to the Caesar oil pipeline and the Cleopatra gas pipeline. Total Petroleum segment Underlying EBITDA includes US$2 million (2015: US$2 million) D&A related to the Caesar oil pipeline and the Cleopatra gas pipeline.
(ix) Negative capital expenditure reflects movements in capital creditors.

News Release
16
Copper
Underlying EBITDA for the December 2016 half year increased by US$915 million to US$1.7 billion.
US$M
Underlying EBITDA for the half year ended 31 December 2015 829
Net price impact(i) 479
Change in volumes: productivity 10
Change in controllable cash costs 801
Change in other costs:
Exchange rates (93)
Inflation (72)
Non-cash(ii) (202)
One-off items(iii) (105)
Other(iv) 97
Underlying EBITDA for the half year ended 31 December 2016 1,744
(i) Average realised price: copper US$2.41/lb (2015: US$2.12/lb).
(ii) Non-cash includes: development stripping capitalisation and depletion.
(iii) One-off items reflects power outage at Olympic Dam.
(iv) Other includes: fuel and energy; asset sales; other items (including profit from equity accounted investments).
Total copper production for the December 2016 half year decreased by seven per cent to 712 kt due to reduced
volumes at Olympic Dam, maintenance at Pampa Norte and lower copper grades, as planned, at Antamina.
Total copper production guidance for the 2017 financial year is under review as a result of ongoing industrial action
at Escondida.
The ramp-up of the Escondida Water Supply (EWS) and the Los Colorados Extension (LCE) projects late in the 2017
financial year will enable utilisation of three concentrators during the 2018 financial year. At Olympic Dam,
development into the Southern Mining Area is progressing well and, following the major smelter maintenance
campaign planned for the September 2017 quarter, is expected to support a gradual increase in copper production
to 230 kt in the 2021 financial year.
The decrease in controllable cash costs included a US$275 million benefit related to the increase in estimated
recoverable copper contained in the Escondida sulphide leach pad following commissioning of the Escondida
Bioleach Pad Extension project and a US$120 million planned build of mined ore ahead of the commissioning of the
LCE project. In addition, the December 2015 half year was negatively impacted by a drawdown of lower-grade
stockpiled inventory and reduced recoveries from the ramp-up of Organic Growth Project 1.
As a result, unit cash costs at our operated copper assets decreased by 24 per cent to US$1.09 per pound during
the December 2016 half year and included a 37 per cent reduction at Escondida, to US$0.91 per pound. In the 2017
financial year, unit costs at our operated copper assets are now expected to be US$1.15 per pound, higher than
previous guidance of US$1.05 per pound, reflecting the impact of the power outage and unplanned refinery
maintenance at Olympic Dam and a stronger Chilean peso and Australian dollar. Escondida unit cost guidance of
approximately US$1.00 per pound remains unchanged for the 2017 financial year, pending the outcome of industrial
action.

BHP Billiton Results for the half year ended 31 December 2016
17
Escondida unit costs (US$M) H1 FY17 H2 FY16 H1 FY16 FY16
Revenue 2,467 2,684 2,197 4,881
Underlying EBITDA 1,257 1,315 428 1,743
Cash costs (gross) 1,210 1,369 1,769 3,138
Less: by-product credits 122 148 74 222
Less: freight 31 38 37 75
Less: treatment and refining charges 185 203 153 356
Cash costs (net) 872 980 1,505 2,485
Sales (kt, equity share)(i) 437 532 470 1,002
Sales (Mlb, equity share)(i) 963 1,172 1,037 2,209
Cash cost per pound (US$) 0.91 0.84 1.45 1.12
(i) Sales volumes adjusted to exclude intercompany sales and purchases.
Underlying EBITDA was impacted by a US$196 million increase in non-cash costs and reflects lower capitalised
development stripping at Escondida and Pampa Norte consistent with the mine plans, and higher depletion at
Escondida due to increased ore movement.
The state-wide power outage and resultant shutdown at Olympic Dam reduced Underlying EBITDA by
US$105 million in the December 2016 half year, with that reduction being reflected in one-off items.

News Release
18
Financial information for Copper for the December 2016 and December 2015 half years is presented below.
Half year ended 31 December 2016 US$M Revenue
UnderlyingEBITDA D&A
Underlying EBIT
Net operating
assetsCapital
expenditure Exploration
grossExploration
to profit
Escondida(i) 2,467 1,257 546 711 15,362 592
Pampa Norte(ii) 624 255 174 81 1,812 128
Antamina(iii) 517 296 59 237 1,261 109
Olympic Dam 611 123 107 16 6,400 110
Other(iii)(iv) − (61) 4 (65) (92) −
Total Copper from Group production
4,219 1,870 890 980 24,743 939
Third party products 507 33 − 33 − −
Total Copper 4,726 1,903 890 1,013 24,743 939 17 17
Adjustment for equity accounted investments(v)
(517) (159) (60) (99) − (109) − −
Total Copper statutory result
4,209 1,744 830 914 24,743 830 17 17
Half year ended 31 December 2015 US$M Revenue
UnderlyingEBITDA D&A
Underlying EBIT
Netoperating
assetsCapital
expenditure Exploration
grossExploration
to profit
Escondida(i) 2,197 428 416 12 14,106 1,334
Pampa Norte(ii) 506 211 189 22 1,879 155
Antamina(iii) 453 203 56 147 1,352 106
Olympic Dam 770 190 118 72 6,424 107
Other(iii)(iv) − (72) 6 (78) (125) −
Total Copper from Group production
3,926 960 785 175 23,636 1,702
Third party products 420 (22) − (22) − −
Total Copper 4,346 938 785 153 23,636 1,702 34 34
Adjustment for equity accounted investments(v)
(453) (109) (57) (52) − (106) (1) (1)
Total Copper statutory result
3,893 829 728 101 23,636 1,596 33 33
(i) Escondida is consolidated under IFRS 10 and reported on a 100 per cent basis.
(ii) Includes Spence and Cerro Colorado.
(iii) Antamina and Resolution are equity accounted investments and their financial information presented above with the exception of net operating assets reflects BHP Billiton’s share.
(iv) Predominantly comprises divisional activities, greenfield exploration and business development. Includes Resolution.
(v) Total Copper segment Revenue excludes US$517 million (2015: US$453 million) revenue related to Antamina. Total Copper segment Underlying EBITDA includes US$60 million (2015: US$57 million) D&A and US$99 million (2015: US$52 million) net finance costs and taxation (expense)/benefit related to Antamina and Resolution that are also included in Underlying EBIT. Copper segment Capital expenditure excludes US$109 million (2015: US$106 million) and US$ nil (2015: US$1 million) Exploration expenditure related to Antamina.

BHP Billiton Results for the half year ended 31 December 2016
19
Iron Ore
Underlying EBITDA for the December 2016 half year increased by US$1.3 billion to US$4.2 billion.
US$M
Underlying EBITDA for the half year ended 31 December 2015 2,823
Net price impact(i) 1,318
Change in volumes: productivity 77
Change in controllable cash costs 106
Change in other costs:
Exchange rates (76)
Inflation (28)
Other(ii) (58)
Underlying EBITDA for the half year ended 31 December 2016 4,162
(i) Average realised price: iron ore US$55/wmt, FOB (2015: US$43/wmt, FOB).
(ii) Other includes: fuel and energy; non-cash; asset sales; other items. Other items includes profit/(loss) from the equity accounted investment in Samarco, but does not include any financial impacts following the Samarco dam failure which has been treated as an exceptional item.
Total iron ore production for the December 2016 half year increased by four per cent to 118 Mt(7).
Western Australia Iron Ore (WAIO) production increased by four per cent to a record 136 Mt (100 per cent basis),
as a result of the continued ramp-up of additional capacity at Jimblebar and improved rail track reliability.
Mining and processing operations at Samarco remain suspended following the dam failure.
Total iron ore production guidance for the 2017 financial year remains unchanged at between 228 and 237 Mt(7), or
between 265 and 275 Mt(7) on a 100 per cent basis.
The new primary crusher and additional conveying capacity at Jimblebar were commissioned in December 2016
quarter. The ramp-up of additional capacity at the Jimblebar mining hub, completion of the rail renewal and
maintenance program and further productivity improvements are expected to deliver an increase in system capacity
to 290 Mtpa in the 2019 financial year.
WAIO unit cash costs declined by one per cent to US$15.05 per tonne, supported by continued reductions in labour
and contractor costs and inventory stock build-up. This was partially offset by a stronger Australian dollar, a stock
write-off at Yandi of US$0.29 per tonne and additional costs related to the rail renewal and maintenance programme
of US$0.35 per tonne, which is ahead of schedule and now expected to be completed in the June 2017 quarter. Unit
costs for the 2017 financial year are now expected to be less than US$15 per tonne as a result of unfavourable
exchange rate movements.
WAIO unit costs (US$M) H1 FY17 H2 FY16 H1 FY16 FY16
Revenue 6,808 5,086 5,247 10,333
Underlying EBITDA 4,117 2,789 2,703 5,492
Cash costs (gross) 2,691 2,297 2,544 4,841
Less: freight 466 295 469 764
Less: royalties 479 374 366 740
Cash costs (net) 1,746 1,628 1,709 3,337
Sales (kt, equity share) 116,008 109,185 112,393 221,578
Cash cost per tonne (US$) 15.05 14.91 15.21 15.06

News Release
20
Financial information for Iron Ore for the December 2016 and December 2015 half years is presented below.
Half year ended 31 December 2016 US$M Revenue
UnderlyingEBITDA D&A
Underlying EBIT
Net operating
assetsCapital
expenditure Exploration
gross Exploration
to profit
Western Australia Iron Ore 6,808 4,117 929 3,188 21,246 357
Samarco(i) − − − − (1,094) −
Other(ii) 75 31 3 28 160 58
Total Iron Ore from Group production
6,883 4,148 932 3,216 20,312 415
Third party products(iii) 47 14 − 14 − −
Total Iron Ore 6,930 4,162 932 3,230 20,312 415 50 50
Adjustment for equity accounted investments(iv)
− − − − − − − −
Total Iron Ore statutory result
6,930 4,162 932 3,230 20,312 415 50 50
Half year ended 31 December 2015 US$M Revenue
UnderlyingEBITDA D&A
Underlying EBIT
Netoperating
assetsCapital
expenditure Exploration
gross Exploration
to profit
Western Australia Iron Ore 5,247 2,703 894 1,809 22,137 497
Samarco(i) 442 196 46 150 9 34
Other(ii) 60 (5) 2 (7) 118 56
Total Iron Ore from Group production
5,749 2,894 942 1,952 22,264 587
Third party products(iii) 42 (9) − (9) − −
Total Iron Ore 5,791 2,885 942 1,943 22,264 587 46 30
Adjustment for equity accounted investments(iv)
(442) (62) (46) (16) − (34) − −
Total Iron Ore statutory result
5,349 2,823 896 1,927 22,264 553 46 30
(i) Samarco is an equity accounted investment and its financial information presented above with the exception of net operating assets reflects BHP Billiton Brasil Ltda’s share.
(ii) Predominantly comprises divisional activities, towage services, business development and ceased operations.
(iii) Includes inter-segment and external sales of contracted gas purchases.
(iv) Total Iron Ore segment Revenue excludes US$ nil (2015: US$442 million) revenue related to Samarco. Total Iron Ore segment Underlying EBITDA includes US$ nil (2015: US$46 million) D&A and US$ nil (2015: US$16 million) net finance costs and taxation (expense)/benefit related to Samarco that are also included in Underlying EBIT. Iron Ore segment Capital expenditure excludes US$ nil (2015: US$34 million) related to Samarco.

BHP Billiton Results for the half year ended 31 December 2016
21
Coal
Underlying EBITDA for the December 2016 half year increased by US$1.9 billion to US$2.0 billion.
US$M
Underlying EBITDA for the half year ended 31 December 2015 155
Net price impact(i) 1,691
Change in volumes: productivity (6)
Change in controllable cash costs 93
Change in other costs:
Exchange rates (39)
Inflation (22)
One-off items(ii) 118
Ceased and sold operations (74)
Other(iii) 95
Underlying EBITDA for the half year ended 31 December 2016 2,011
(i) Average realised price: hard coking coal US$179/t (2015: US$82/t); weak coking coal US$122/t (2015: US$67/t); thermal coal US$74/t (2015: US$49/t).
(ii) One-off items reflects royalty and other matters.
(iii) Other includes: fuel and energy; asset sales; other items (including profit from equity accounted investments).
Metallurgical coal production increased by one per cent to 21 Mt(7), and energy coal production decreased by four
per cent to 14 Mt(7), in the December 2016 half year.
Strong metallurgical coal production at four Queensland Coal mines offset the cessation of production at Crinum.
Excluding Crinum, production increased by eight per cent.
Energy coal production decreased at New South Wales Energy Coal (NSWEC), reflecting in-pit and run-of-mine
inventory drawdowns in the prior period, and was partially offset by a stronger performance at Cerrejón.
Metallurgical coal and energy coal production guidance remains unchanged at 44 Mt(7) and 30 Mt(7) respectively for
the 2017 financial year.
Queensland Coal unit cash costs declined by four per cent to US$56 per tonne, underpinned by a reduction in labour
and contractor costs, favourable inventory movements and increased equipment and wash-plant utilisation. This was
partially offset by a stronger Australian dollar over the half year. Unit costs for the 2017 financial year are now
expected to be US$54 per tonne as a result of unfavourable exchange rate movements. NSWEC unit costs increased
by nine per cent to US$46 per tonne due to lower volumes and a stronger Australian dollar which more than offset a
reduction in labour costs and favourable inventory movements. Unit costs for the 2017 financial year are now
expected to be US$40 per tonne, an increase from US$38 per tonne, as a result of unfavourable exchange rate
movements.
Queensland Coal unit costs (US$M) H1 FY17 H2 FY16 H1 FY16 FY16
Revenue 3,381 1,728 1,623 3,351
Underlying EBITDA 1,823 462 122 584
Cash costs (gross) 1,558 1,266 1,501 2,767
Less: freight 54 34 52 86
Less: royalties 335 98 218 316
Cash costs (net) 1,169 1,134 1,231 2,365
Sales (kt, equity share) 20,716 21,835 20,974 42,809
Cash cost per tonne (US$) 56.43 51.93 58.69 55.25

News Release
22
Financial information for Coal for the December 2016 and December 2015 half years is presented below.
Half year ended 31 December 2016 US$M Revenue
UnderlyingEBITDA D&A
Underlying EBIT
Net operating
assetsCapital
expenditure Exploration
grossExploration
to profit
Queensland Coal 3,381 1,823 315 1,508 8,360 80
New Mexico(i) 3 (6) 3 (9) − 1
New South Wales Energy Coal(ii) 584 187 77 110 1,120 5
Colombia(ii) 364 180 49 131 875 19
Other(iii) 8 (29) 4 (33) (20) 18
Total Coal from Group production
4,340 2,155 448 1,707 10,335 123
Third party products − − − − − −
Total Coal 4,340 2,155 448 1,707 10,335 123 3 3
Adjustment for equity accounted investments(iv)
(413) (144) (65) (79) − (20) − −
Total Coal statutory result
3,927 2,011 383 1,628 10,335 103 3 3
Half year ended 31 December 2015 US$M Revenue
UnderlyingEBITDA D&A
Underlying EBIT
Net operating
assetsCapital
expenditure Exploration
grossExploration
to profit
Queensland Coal 1,623 122 410 (288) 8,788 155
New Mexico(i) 251 75 22 53 160 3
New South Wales Energy Coal(ii) 511 68 77 (9) 1,229 11
Colombia(ii) 283 80 49 31 840 17
Other(iii) − (53) 4 (57) 208 19
Total Coal from Group production
2,668 292 562 (270) 11,225 205
Third party products − − − − − −
Total Coal 2,668 292 562 (270) 11,225 205 9 9
Adjustment for equity accounted investments(iv)
(331) (137) (65) (72) − (20) − −
Total Coal statutory result
2,337 155 497 (342) 11,225 185 9 9
(i) Includes the Navajo mine (divested in July 2016).
(ii) Newcastle Coal Infrastructure Group and Cerrejón are equity accounted investments and their financial information presented above with the exception of net operating assets reflects BHP Billiton’s share.
(iii) Predominantly comprises divisional activities and IndoMet Coal (divested in October 2016).
(iv) Total Coal segment Revenue excludes US$413 million (2015: US$331 million) revenue related to Newcastle Coal Infrastructure Group and Cerrejón. Total Coal segment Underlying EBITDA includes US$49 million (2015: US$50 million) D&A and US$57 million (2015: US$51 million) net finance costs and taxation (expense)/benefit related to Cerrejón, that are also included in Underlying EBIT. Total Coal segment Underlying EBITDA excludes US$16 million (2015: US$15 million) D&A and US$22 million (2015: US$21 million) total EBIT related to Newcastle Coal Infrastructure Group, that is excluded from Underlying EBIT. Coal segment Capital expenditure excludes US$20 million (2015: US$20 million) related to Newcastle Coal Infrastructure Group and Cerrejón.

BHP Billiton Results for the half year ended 31 December 2016
23
Group and unallocated items
Underlying EBITDA loss decreased by US$7 million to US$21 million in the December 2016 half year. The reduction
reflected productivity improvements at Nickel West as a result of ongoing debottlenecking activities. This more than
offset an unfavourable exchange rate impact on corporate provision balances.

News Release
24
The financial information on pages 27 to 48 has been prepared in accordance with IFRS. This news release including the financial information is unaudited. Variance analysis relates to the relative financial and/or production performance of BHP Billiton and/or its operations during the December 2016 half year compared with the December 2015 half year, unless otherwise noted.
The following abbreviations may have been used throughout this report: barrels (bbl); billion cubic feet (bcf); barrels of oil equivalent (boe); cost and freight (CFR); cost, insurance and freight (CIF), dry metric tonne unit (dmtu); free on board (FOB); grams per tonne (g/t); kilograms per tonne (kg/t); kilometre (km); metre (m); million barrels of oil equivalent (MMboe); million barrels of oil equivalent per day (MMboe/d); thousand cubic feet equivalent (Mcfe); million cubic feet per day (MMcf/d); million pounds (Mlb); million tonnes (Mt); million tonnes per annum (Mtpa); ounces (oz); pounds (lb); thousand barrels of oil equivalent (Mboe); thousand ounces (koz); thousand standard cubic feet (Mscf); thousand tonnes (kt); thousand tonnes per annum (ktpa); thousand tonnes per day (ktpd); tonnes (t); and wet metric tonnes (wmt).
The following footnotes apply to this Results Announcement:
(1) Underlying attributable profit, Underlying EBIT and Underlying EBITDA are used to reflect the underlying performance of BHP Billiton. We believe that these non-IFRS measures provide useful information, but should not be considered as an indication of, or as an alternative to, Attributable profit/(loss) as an indicator of actual operating performance or as an alternative to cash flow as a measure of liquidity. We believe focusing on Underlying EBITDA more closely reflects the operating cash generative capacity and hence the underlying performance of our business. Underlying EBITDA is the key measure that management uses internally to assess the performance of our segments and make decisions on the allocation of resources and is more relevant to capital intensive industries with long-life assets.
Underlying attributable profit is Attributable profit/(loss) excluding any exceptional items and non-controlling interest in exceptional items.
Underlying EBIT is earnings before net finance costs, taxation and any exceptional items. Underlying EBIT is reported net of net finance costs and taxation (expense)/benefit of US$156 million (2015: US$119 million) related to equity accounted investments and excludes exceptional items of US$61 million (2015: US$655 million) related to the share of loss from equity accounted investments.
Underlying EBITDA is Underlying EBIT before depreciation, amortisation and impairments of US$3,914 million for the half year ended 31 December 2016 (2015: US$4,652 million). Underlying EBITDA is reported before net finance costs and taxation (expense)/benefit, depreciation, amortisation and impairments related to equity accounted investments of US$267 million (2015: US$274 million) and excludes exceptional items of US$61 million (2015: US$655 million) related to share of loss from equity accounted investments.
(2) Further non-IFRS measures are defined as follows:
Adjusted effective tax rate – comprises Total taxation (expense)/benefit excluding exceptional items and exchange rate movements included in taxation (expense)/benefit divided by Profit/(loss) before taxation and exceptional items.
Net operating assets – represents operating assets net of operating liabilities including the carrying value of equity accounted investments and predominantly excludes cash balances, loan to associates, interest bearing liabilities and deferred tax balances. The carrying value of investments accounted for using the equity accounted method represents the balance of the Group’s investment in equity accounted investments, with no adjustment for any cash balances, interest bearing liabilities and deferred tax balances of the equity accounted investment.
Underlying basic earnings per share – represents underlying attributable profit per basic share.
Underlying EBITDA margin – comprises Underlying EBITDA excluding third party product EBITDA, divided by revenue excluding third party product revenue.
Controllable cash costs - comprises operating cash costs and exploration and business development costs. Management believes this measure provides useful information regarding the Group’s financial performance because it considers these expenses to be the principal operating and overhead expenses that are most directly under the Group’s control.
Underlying return on capital – represents annualised attributable profit after tax excluding exceptional items and net finance costs (after tax) divided by average capital employed. Capital employed is net assets before net debt.
We use a number of other financial measures (each of which is calculated with reference to IFRS measures) to assess our performance. Such other financial measures are defined as follows:
Free cash flow – comprises net operating cash flows less net investing cash flows.
Gearing ratio – represents the ratio of net debt to net debt plus net assets.
Net debt – comprises Interest bearing liabilities less Cash and cash equivalents for the total operations within the Group at the reporting date.
(3) Represents productivity-led volume efficiencies, operating cash cost efficiencies and exploration and business development savings. Productivity-led volume efficiencies refer to volume increases, excluding volume increases from major capital projects, multiplied by the prior period Underlying EBITDA margin. Operating cash cost efficiencies refer to the reduction in costs, excluding the impact of volume, price-linked costs, exchange rates, inflation, fuel and energy, non-cash costs, one-off items, asset sales, ceased and sold operations and other items. Exploration and business development savings refers to the reduction in total exploration and business development costs including capitalised exploration.
(4) Conventional petroleum unit cash costs exclude inventory movements, embedded derivatives movements, freight, third party and exploration expense; WAIO, Queensland Coal and NSWEC unit cash costs exclude freight and royalties; Escondida unit cash costs exclude freight and treatment and refining charges and are net of by-product credits. 2017 financial year unit cost guidance is based on exchange rates of AUD/USD 0.75 and USD/CLP 663. Other forward-looking guidance is based on internal exchange rate assumptions.
(5) Capital and exploration expenditure represents purchases of property, plant and equipment plus exploration expenditure from the Consolidated Cash Flow Statement.
(6) Maintenance capital includes non-discretionary spend for the following purposes: deferred development and production stripping; risk reduction, compliance and asset integrity.
(7) Iron ore production and guidance excludes production from Samarco; Energy Coal production and guidance excludes production from New Mexico Coal following divestments; Metallurgical coal production and guidance excludes production from Haju following the divestment of IndoMet Coal.

BHP Billiton Results for the half year ended 31 December 2016
25
Forward-looking statements
This release contains forward-looking statements, including statements regarding: trends in commodity prices and currency exchange rates; demand for commodities; plans, strategies and objectives of management; closure or divestment of certain operations or facilities (including associated costs); anticipated production or construction commencement dates; capital costs and scheduling; operating costs and shortages of materials and skilled employees; anticipated productive lives of projects, mines and facilities; provisions and contingent liabilities; tax and regulatory developments.
Forward-looking statements can be identified by the use of terminology such as ‘intend’, ‘aim’, ‘project’, ‘anticipate’, ‘estimate’, ‘plan’, ‘believe’, ‘expect’, ‘may’, ‘should’, ‘will’, ‘continue’, ‘annualised’ or similar words. These statements discuss future expectations concerning the results of operations or financial condition, or provide other forward-looking statements.
These forward-looking statements are not guarantees or predictions of future performance, and involve known and unknown risks, uncertainties and other factors, many of which are beyond our control, and which may cause actual results to differ materially from those expressed in the statements contained in this release. Readers are cautioned not to put undue reliance on forward-looking statements.
For example, our future revenues from our operations, projects or mines described in this release will be based, in part, upon the market price of the minerals, metals or petroleum produced, which may vary significantly from current levels. These variations, if materially adverse, may affect the timing or the feasibility of the development of a particular project, the expansion of certain facilities or mines, or the continuation of existing operations.
Other factors that may affect the actual construction or production commencement dates, costs or production output and anticipated lives of operations, mines or facilities include our ability to profitably produce and transport the minerals, petroleum and/or metals extracted to applicable markets; the impact of foreign currency exchange rates on the market prices of the minerals, petroleum or metals we produce; activities of government authorities in some of the countries where we are exploring or developing these projects, facilities or mines, including increases in taxes, changes in environmental and other regulations and political uncertainty; labour unrest; and other factors identified in the risk factors discussed in BHP Billiton’s filings with the U.S. Securities and Exchange Commission (the “SEC”) (including in Annual Reports on Form 20-F) which are available on the SEC’s website at www.sec.gov.
Except as required by applicable regulations or by law, the Group does not undertake any obligation to publicly update or review any forward-looking statements, whether as a result of new information or future events.
Past performance cannot be relied on as a guide to future performance.
Non-IFRS and other financial information
BHP Billiton results are reported under International Financial Reporting Standards (IFRS). This release may also include certain non-IFRS and other measures including Underlying EBIT, Underlying EBITDA, Adjusted effective tax rate, Free cash flow, Gearing ratio, Controllable cash costs, Net debt, Net operating assets, Underlying return on capital, Underlying attributable profit, Underlying basic earnings per share and Underlying EBITDA margin. These measures are used internally by management to assess the performance of our business and segments, make decisions on the allocation of our resources and assess operational management. Non-IFRS and other measures have not been subject to audit or review and should not be considered as an indication of or alternative to an IFRS measure of profitability, financial performance or liquidity.
No offer of securities
Nothing in this release should be construed as either an offer, or a solicitation of an offer, to buy or sell BHP Billiton securities in any jurisdiction, or be treated or relied upon as a recommendation or advice by BHP Billiton.
Reliance on third party information
The views expressed in this release contain information that has been derived from publicly available sources that have not been independently verified. No representation or warranty is made as to the accuracy, completeness or reliability of the information. This release should not be relied upon as a recommendation or forecast by BHP Billiton.
No financial or investment advice – South Africa
BHP Billiton does not provide any financial or investment 'advice' as that term is defined in the South African Financial Advisory and Intermediary Services Act, 37 of 2002, and we strongly recommend that you seek professional advice.

News Release
26
Further information on BHP Billiton can be found at: bhpbilliton.com
Media Relations
Investor Relations
Australia and Asia Matthew Martyn-Jones Tel: +61 3 9609 2360 Mobile +61 419 418 394 Email: [email protected] Paul Hitchins Tel: +61 3 9609 2592 Mobile +61 419 315 001 Email: [email protected] Fiona Hadley Tel: +61 3 9609 2211 Mobile +61 427 777 908 Email: [email protected] Amanda Saunders Tel: +61 3 9609 3935 Mobile +61 417 487 973 Email: [email protected] United Kingdom and South Africa Ruban Yogarajah Tel: +44 207 802 4033 Mobile +44 7827 082 022 Email: [email protected] North America Bronwyn Wilkinson Mobile: +1 604 340 8753 Email: [email protected]
Australia and Asia Tara Dines Tel: +61 3 9609 2222 Mobile: +61 499 249 005 Email: [email protected] Andrew Gunn Tel: +61 3 9609 3575 Mobile: +61 402 087 354 Email: [email protected] United Kingdom and South Africa Rob Clifford Tel: +44 20 7802 4131 Mobile: +44 7788 308 844 Email: [email protected] Elisa Morniroli Tel: +44 20 7802 7611 Mobile: +44 7825 926 646 Email: [email protected] Americas James Wear Tel: +1 713 993 3737 Mobile: +1 347 882 3011 Email: [email protected]
BHP Billiton Limited ABN 49 004 028 077 LEI WZE1WSENV6JSZFK0JC28
Registered in Australia Registered Office: Level 18, 171 Collins Street Melbourne Victoria 3000 Australia Tel +61 1300 55 4757 Fax +61 3 9609 3015
BHP Billiton Plc Registration number 3196209 LEI 549300C116EOWV835768
Registered in England and Wales Registered Office: Neathouse Place London SW1V 1LH United Kingdom Tel +44 20 7802 4000 Fax +44 20 7802 4111
Members of the BHP Billiton Group which is headquartered in Australia
Follow us on social media

27
BHP Billiton Group Financial Report Half year ended 31 December 2016

Financial Report
28
Contents
Half Year Financial Statements Page
Consolidated Income Statement for the half year ended 31 December 2016 29
Consolidated Statement of Comprehensive Income for the half year ended 31 December 2016 30
Consolidated Balance Sheet as at 31 December 2016 31
Consolidated Cash Flow Statement for the half year ended 31 December 2016 32
Consolidated Statement of Changes in Equity for the half year ended 31 December 2016 33
Notes to the Financial Information 34
1. Accounting policies 34
2. Exceptional items 35
3. Interests in associates and joint venture entities 36
4. Net finance costs 36
5. Earnings per share 37
6. Dividends 37
7. Financial risk management – Fair values 38
8. Significant events – Samarco dam failure 42
9. Subsequent events 48
Directors’ Report 49
Directors’ Declaration of Responsibility 51
Lead Auditor’s Independence Declaration under Section 307C of the Corporations Act 2001 52
Independent Review Report 53

BHP Billiton Results for the half year ended 31 December 2016
29
Consolidated Income Statement for the half year ended 31 December 2016
Notes Half year ended
31 Dec 2016 US$M
Half year ended
31 Dec 2015US$M
Yearended
30 June 2016US$M
Revenue 18,796 15,712 30,912Other income 510 251 444Expenses excluding net finance costs (13,387) (21,998) (35,487)Profit/(loss) from equity accounted investments, related impairments and expenses
3 138 (995) (2,104)
Profit/(loss) from operations 6,057 (7,030) (6,235) Financial expenses (639) (492) (1,161)Financial income 62 63 137Net finance costs 4 (577) (429) (1,024)Profit/(loss) before taxation 5,480 (7,459) (7,259)Income tax (expense)/benefit (1,902) 1,816 1,297Royalty-related taxation (net of income tax benefit) (126) (90) (245)Total taxation (expense)/benefit (2,028) 1,726 1,052Profit/(loss) after taxation 3,452 (5,733) (6,207)
Attributable to non-controlling interests 248 (64) 178Attributable to owners of BHP Billiton Group 3,204 (5,669) (6,385)
Basic earnings/(loss) per ordinary share (cents) 5 60.2 (106.5) (120.0)Diluted earnings/(loss) per ordinary share (cents) 5 60.0 (106.5) (120.0) Dividends per ordinary share – paid during the period (cents) 6 14.0 62.0 78.0Dividends per ordinary share – determined in respect of the period (cents) 6 40.0 16.0 30.0
The accompanying notes form part of this financial information.

Financial Report
30
Consolidated Statement of Comprehensive Income for the half year ended 31 December 2016
Half year ended
31 Dec 2016US$M
Half year ended
31 Dec 2015US$M
Yearended
30 June 2016US$M
Profit/(loss) after taxation 3,452 (5,733) (6,207) Other comprehensive income Items that may be reclassified subsequently to the income statement:
Available for sale investments:
Net valuation gains/(losses) taken to equity 1 (3) 2
Net valuation losses transferred to the income statement − − 1
Cash flow hedges:
Losses taken to equity (666) (666) (566)
Losses transferred to the income statement 586 646 664
Exchange fluctuations on translation of foreign operations taken to equity 1 − (1)
Exchange fluctuations on translation of foreign operations transferred to income statement
− − (10)
Tax recognised within other comprehensive income 21 7 (30)
Total items that may be reclassified subsequently to the income statement (57) (16) 60
Items that will not be reclassified to the income statement:
Remeasurement (losses)/gains on pension and medical schemes (18) 5 (20)
Tax recognised within other comprehensive income (12) (11) (17)
Total items that will not be reclassified to the income statement (30) (6) (37)
Total other comprehensive (loss)/income (87) (22) 23
Total comprehensive income/(loss) 3,365 (5,755) (6,184)
Attributable to non-controlling interests 246 (64) 176
Attributable to owners of BHP Billiton Group 3,119 (5,691) (6,360)
The accompanying notes form part of this financial information.

BHP Billiton Results for the half year ended 31 December 2016
31
Consolidated Balance Sheet as at 31 December 2016
31 Dec 2016 US$M
30 June 2016US$M
ASSETS Current assets Cash and cash equivalents 13,987 10,319Trade and other receivables 3,594 3,155Other financial assets 103 121Inventories 3,499 3,411Current tax assets 187 567Other 131 141Total current assets 21,501 17,714Non-current assets Trade and other receivables 974 867Other financial assets 1,035 2,680Inventories 1,095 764Property, plant and equipment 82,170 83,975Intangible assets 4,030 4,119Investments accounted for using the equity method 2,451 2,575Deferred tax assets 6,158 6,147Other 121 112Total non-current assets 98,034 101,239Total assets 119,535 118,953 LIABILITIES Current liabilities Trade and other payables 5,128 5,389Interest bearing liabilities 3,374 4,653Other financial liabilities 307 5Current tax payable 1,335 451Provisions 1,702 1,765Deferred income 153 77Total current liabilities 11,999 12,340Non-current liabilities Trade and other payables 4 13Interest bearing liabilities 30,670 31,768Other financial liabilities 1,809 1,778Deferred tax liabilities 4,337 4,324Provisions 8,081 8,381Deferred income 210 278Total non-current liabilities 45,111 46,542Total liabilities 57,110 58,882Net assets 62,425 60,071 EQUITY Share capital – BHP Billiton Limited 1,186 1,186Share capital – BHP Billiton Plc 1,057 1,057Treasury shares (11) (33)Reserves 2,396 2,538Retained earnings 52,021 49,542Total equity attributable to owners of BHP Billiton Group 56,649 54,290Non-controlling interests 5,776 5,781Total equity 62,425 60,071
The accompanying notes form part of this financial information.

Financial Report
32
Consolidated Cash Flow Statement for the half year ended 31 December 2016
Half year ended 31 Dec 2016
US$M
Half year ended 31 Dec 2015
US$M
Year ended 30 June 2016
US$M
Operating activities Profit/(loss) before taxation 5,480 (7,459) (7,259)Adjustments for:
Non-cash or non-operating exceptional items (48) 8,369 9,645Depreciation and amortisation expense 3,800 4,602 8,661Impairments of property, plant and equipment, financial assets and intangibles 114 50 210Net finance costs 511 429 1,024Share of operating profit of equity accounted investments (186) (185) (276)Other 67 250 459
Changes in assets and liabilities: Trade and other receivables (638) 1,611 1,714Inventories (505) 446 527Trade and other payables 28 (1,262) (1,661)Provisions and other assets and liabilities (138) (557) (373)
Cash generated from operations 8,485 6,294 12,671Dividends received 340 171 301Interest received 77 60 128Interest paid (534) (342) (830)Net income tax and royalty-related taxation refunded 353 452 641Net income tax and royalty-related taxation paid (1,024) (1,375) (2,286)Net operating cash flows 7,697 5,260 10,625Investing activities Purchases of property, plant and equipment (2,288) (3,958) (6,946)Exploration expenditure (439) (410) (765)Exploration expenditure expensed and included in operating cash flows 292 199 430Net investment and funding of equity accounted investments (168) 63 40Proceeds from sale of assets 541 76 107Proceeds from divestment of subsidiaries, operations and joint operations, net of their cash 189 48 166Other investing (49) (56) (277)Net investing cash flows (1,922) (4,038) (7,245)Financing activities Proceeds from interest bearing liabilities 1,200 7,019 7,239Proceeds from debt related instruments − 129 156Repayment of interest bearing liabilities (2,200) (1,006) (2,788)(Distributions)/contributions to/from non-controlling interests (8) 2 −Purchase of shares by Employee Share Ownership Plan (ESOP) Trusts (68) (69) (106)Dividends paid (748) (3,266) (4,130)Dividends paid to non-controlling interests (300) (71) (87)Net financing cash flows (2,124) 2,738 284Net increase in cash and cash equivalents 3,651 3,960 3,664Cash and cash equivalents, net of overdrafts, at beginning of period 10,276 6,613 6,613Foreign currency exchange rate changes on cash and cash equivalents 1 9 (1)Cash and cash equivalents, net of overdrafts, at end of period 13,928 10,582 10,276
The accompanying notes form part of this financial information.

BHP Billiton Results for the half year ended 31 December 2016
33
Consolidated Statement of Changes in Equity for the half year ended 31 December 2016
US$M Attributable to owners of BHP Billiton Group
Share capital Treasury shares
ReservesRetainedearnings
Total equity attributable to
owners of BHP Billiton Group
Non-controlling
interestsTotal
equity
BHPBillitonLimited
BHPBilliton
Plc
BHP Billiton Limited
BHPBilliton
Plc
Balance as at 1 July 2016 1,186 1,057 (7) (26) 2,538 49,542 54,290 5,781 60,071
Total comprehensive income − − − − (57) 3,176 3,119 246 3,365
Transactions with owners:
Purchase of shares by ESOP Trusts − − (66) (2) − − (68) − (68)
Employee share awards exercised net of employee contributions and other adjustments
− − 69 21 (119) 29 − − −
Employee share awards forfeited − − − − (17) 17 − − −
Accrued employee entitlement for unexercised awards
− − − − 51 − 51 − 51
Distribution to non-controlling interests − − − − − − − (8) (8)
Dividends − − − − − (743) (743) (215) (958)
Divestment of subsidiaries, operations and joint operations
− − − − − − − (28) (28)
Equity contributed − − − − − − − − −
Balance as at 31 December 2016 1,186 1,057 (4) (7) 2,396 52,021 56,649 5,776 62,425 Balance as at 1 July 2015 1,186 1,057 (19) (57) 2,557 60,044 64,768 5,777 70,545
Total comprehensive loss − − − − (16) (5,675) (5,691) (64) (5,755)
Transactions with owners:
Purchase of shares by ESOP Trusts − − (69) − − − (69) − (69)
Employee share awards exercised net of employee contributions and other adjustments
− − 80 23 (124) 21 − − −
Employee share awards forfeited − − − − (20) 20 − − −
Accrued employee entitlement for unexercised awards
− − − − 77 − 77 − 77
Distribution to non-controlling interests − − − − − − − − −
Dividends − − − − − (3,299) (3,299) (71) (3,370)
Divestment of subsidiaries, operations and joint operations
− − − − − − − − −
Equity contributed − − − − − − − 2 2
Balance as at 31 December 2015 1,186 1,057 (8) (34) 2,474 51,111 55,786 5,644 61,430
The accompanying notes form part of this financial information.

Financial Report
34
Notes to the Financial Information
1. Accounting policies
This general purpose financial report for the half year ended 31 December 2016 is unaudited and has been prepared in
accordance with IAS 34 “Interim Financial Reporting” as issued by the International Accounting Standards Board (IASB),
IAS 34 “Interim Financial Reporting” as adopted by the EU, AASB 134 “Interim Financial Reporting” as issued by the
Australian Accounting Standards Board (AASB) and the Disclosure and Transparency Rules of the Financial Conduct
Authority in the United Kingdom and the Australian Corporations Act 2001 as applicable to interim financial reporting.
The half year financial statements represent a “condensed set of financial statements” as referred to in the UK Disclosure
and Transparency Rules issued by the Financial Conduct Authority. Accordingly, they do not include all of the information
required for a full annual report and are to be read in conjunction with the most recent annual financial report. The
comparative figures for the financial year ended 30 June 2016 are not the statutory accounts of the BHP Billiton Group
for that financial year. Those accounts, which were prepared under IFRS, have been reported on by the Company's
auditor and delivered to the registrar of companies. The auditor has reported on those accounts; the report was
unqualified, did not include a reference to any matters to which the auditors drew attention by way of emphasis without
qualifying their report and did not contain statements under Section 498 (2) or (3) of the UK Companies Act 2006.
The half year financial statements have been prepared on the basis of the accounting policies and methods of
computation consistent with those applied in the 30 June 2016 annual financial statements contained within the Annual
Report of the BHP Billiton Group.
Rounding of amounts
Amounts in this financial report have, unless otherwise indicated, been rounded to the nearest million dollars.
Comparatives
Where applicable, comparative periods have been adjusted to disclose them on the same basis as the current period
figures.
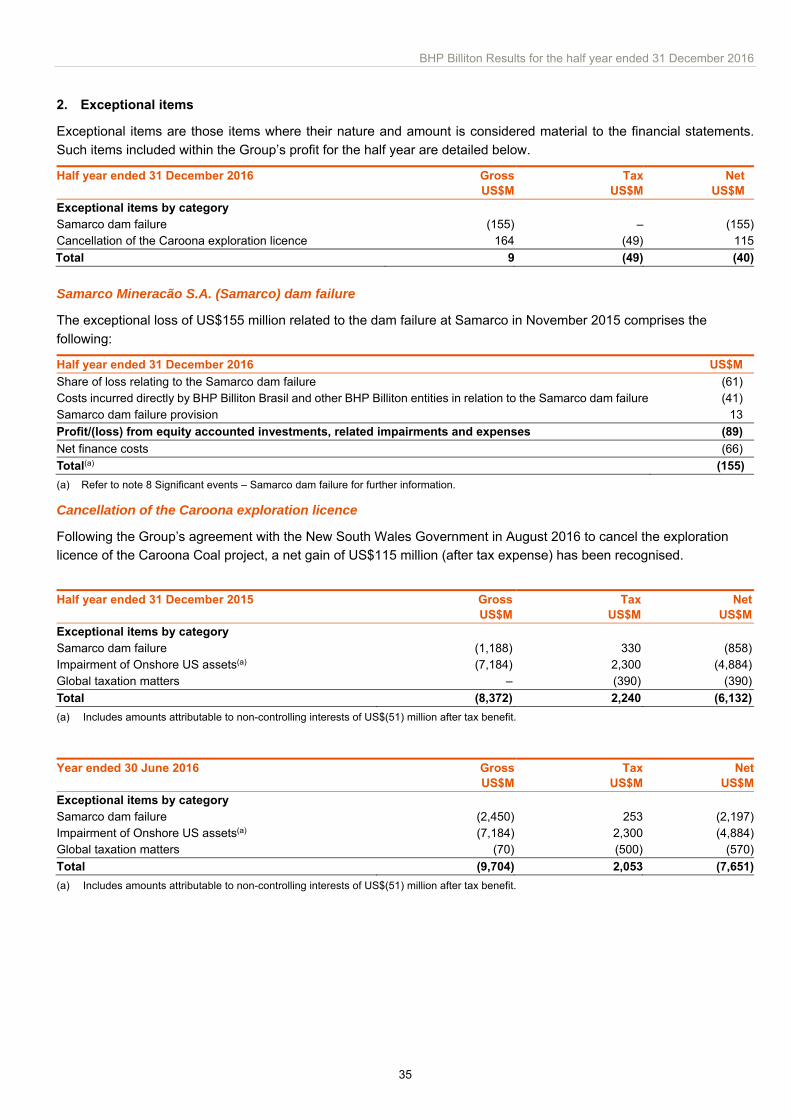
BHP Billiton Results for the half year ended 31 December 2016
35
2. Exceptional items
Exceptional items are those items where their nature and amount is considered material to the financial statements.
Such items included within the Group’s profit for the half year are detailed below.
Half year ended 31 December 2016 GrossUS$M
TaxUS$M
Net US$M
Exceptional items by category Samarco dam failure (155) – (155)Cancellation of the Caroona exploration licence 164 (49) 115
Total 9 (49) (40)
Samarco Mineracão S.A. (Samarco) dam failure
The exceptional loss of US$155 million related to the dam failure at Samarco in November 2015 comprises the
following:
Half year ended 31 December 2016 US$M
Share of loss relating to the Samarco dam failure (61) Costs incurred directly by BHP Billiton Brasil and other BHP Billiton entities in relation to the Samarco dam failure (41) Samarco dam failure provision 13
Profit/(loss) from equity accounted investments, related impairments and expenses (89)
Net finance costs (66)
Total(a) (155)
(a) Refer to note 8 Significant events – Samarco dam failure for further information.
Cancellation of the Caroona exploration licence
Following the Group’s agreement with the New South Wales Government in August 2016 to cancel the exploration
licence of the Caroona Coal project, a net gain of US$115 million (after tax expense) has been recognised.
Half year ended 31 December 2015 GrossUS$M
Tax US$M
NetUS$M
Exceptional items by category Samarco dam failure (1,188) 330 (858)Impairment of Onshore US assets(a) (7,184) 2,300 (4,884)Global taxation matters – (390) (390)
Total (8,372) 2,240 (6,132)
(a) Includes amounts attributable to non-controlling interests of US$(51) million after tax benefit.
Year ended 30 June 2016 GrossUS$M
TaxUS$M
NetUS$M
Exceptional items by category Samarco dam failure (2,450) 253 (2,197)Impairment of Onshore US assets(a) (7,184) 2,300 (4,884)Global taxation matters (70) (500) (570)
Total (9,704) 2,053 (7,651)
(a) Includes amounts attributable to non-controlling interests of US$(51) million after tax benefit.

Financial Report
36
3. Interests in associates and joint venture entities
The Group’s major shareholdings in associates and joint venture entities, including their profit/(loss), are listed below:
Ownership interest at BHP Billiton Group
reporting date(a)
Profit/(loss) from equity accounted investments, related impairments and
expenses
31 Dec2016
%
31 Dec2015
%
30 June 2016
%
Half year ended31 Dec 2016
US$M
Half year ended31 Dec 2015
US$M
Year ended30 June 2016
US$MShare of operating profit/(loss) of equity accounted investments:
Carbones del Cerrejόn LLC 33.33 33.33 33.33 64 (29) (24) Compañia Minera Antamina SA 33.75 33.75 33.75 138 94 203 Samarco Mineração SA(b)(c)(d) 50.00 50.00 50.00 (61) (519) (1,091) Other (16) (16) (39)
Share of operating profit/(loss) of equity accounted investments 125 (470) (951)Samarco dam failure provision release/(expense)(b)(e) 13 – (628)Impairment of Samarco Mineração SA(e) – (525) (525)Profit/(loss) from equity accounted investments, related impairments and expenses
138 (995) (2,104)
(a) The ownership interest at the Group’s and the associates and joint venture entities’ reporting dates are the same.
(b) Refer to note 8 Significant events – Samarco dam failure for further information. Financial impacts of US$(155) million from the Samarco dam failure relates to US$(61) million share of loss from US$(61) million funding provided during the period, US$(41) million direct costs incurred by BHP Billiton Brasil Ltda and other BHP Billiton entities, US$(66) million amortisation of discounting impacting net finance costs offset by US$13 million other movements in the Samarco dam failure provision including foreign exchange.
(c) As the carrying value has been previously written down to US$ nil, any additional share of Samarco’s losses are only recognised to the extent BHP Billiton Brasil Ltda has an obligation to fund the losses or investment funding is provided. BHP Billiton Brasil Ltda has provided US$(61) million funding during the period and recognised additional share of losses of US$(61) million.
(d) Both 31 December 2015 and 30 June 2016 include US$136 million share of operating profit prior to the Samarco dam failure.
(e) At 31 December 2015, BHP Billiton Brasil Ltda adjusted its investment in Samarco to US$ nil (resulting from US$(655) million share of loss from Samarco and US$(525) million impairment) and at 30 June 2016 recognised a provision of US$(1,200) million for potential obligations under the Framework Agreement. US$(572) million of the US$(1,200) million provision represented an additional share of loss from Samarco with the remaining US$(628) million recognised as provision expense.
4. Net finance costs
Half year ended31 Dec 2016
US$M
Half year ended31 Dec 2015
US$M
Year ended30 June 2016
US$MFinancial expenses Interest on bank loans and overdrafts and all other borrowings 558 437 971Interest capitalised(a) (53) (56) (123)Discounting on provisions and other liabilities 238 168 313Fair value change on hedged loans (1,133) 82 1,444Fair value change on hedging derivatives 1,020 (127) (1,448)Exchange variations on net debt (4) (27) (24)Other financial expenses 13 15 28
639 492 1,161
Financial income Interest income (62) (63) (137)
Net finance costs 577 429 1,024
(a) Interest has been capitalised at the rate of interest applicable to the specific borrowings financing the assets under construction or, where financed through general borrowings, at a capitalisation rate representing the average interest rate on such borrowings. For the half year ended 31 December 2016, the capitalisation rate was 3.08 per cent (31 December 2015: 2.36 per cent; 30 June 2016: 2.61 per cent).

BHP Billiton Results for the half year ended 31 December 2016
37
5. Earnings per share
Half year ended31 Dec 2016
Half year ended31 Dec 2015
Year ended30 June 2016
Earnings/(loss) attributable to owners of BHP Billiton Group (US$M) - Total 3,204 (5,669) (6,385)
Weighted average number of shares (Million) - Basic(a) 5,322 5,322 5,322- Diluted(b) 5,336 5,322 5,322
Basic earnings/(loss) per ordinary share (US cents)(c) - Total 60.2 (106.5) (120.0)
Diluted earnings/(loss) per ordinary share (US cents)(c) - Total 60.0 (106.5) (120.0)
(a) The calculation of the number of ordinary shares used in the computation of basic earnings per share is the aggregate of the weighted average number of ordinary shares of BHP Billiton Limited and BHP Billiton Plc outstanding during the period after deduction of the number of shares held by the Billiton Employee Share Ownership Plan Trust and the BHP Billiton Employee Equity Trust.
(b) For the purposes of calculating diluted earnings per share, the effect of 14 million dilutive securities has been taken into account for the half year ended 31 December 2016. The Group’s only potential dilutive instruments are share awards granted under employee share ownership plans. The conversion of options and share rights would have decreased the loss per share for the half year ended 31 December 2015 and year ended 30 June 2016 and therefore its impact has been excluded from the diluted earnings per share calculated for those periods.
(c) Each American Depositary Share represents twice the earnings for BHP Billiton ordinary shares.
6. Dividends
Half year ended 31 Dec 2016
Half year ended 31 Dec 2015
Year ended 30 June 2016
US cents US$M US cents US$M US cents US$M
Dividends paid during the period (per share)(a) Prior year final dividend 14.0 749 62.0 3,299 62.0 3,299Interim dividend N/A – N/A – 16.0 855
14.0 749 62.0 3,299 78.0 4,154
(a) 5.5 per cent dividend on 50,000 preference shares of £1 each determined and paid annually (31 December 2015: 5.5 per cent; 30 June 2016: 5.5 per cent).
Subsequent to the half year ended 31 December 2016, on 21 February 2017 BHP Billiton determined an interim dividend
of 40.0 US cents per share (US$2,129 million), which will be paid on 28 March 2017.
At 31 December 2016, BHP Billiton Limited had 3,211 million ordinary shares on issue and held by the public and BHP
Billiton Plc had 2,112 million ordinary shares on issue and held by the public. No shares in BHP Billiton Limited were
held by BHP Billiton Plc at 31 December 2016 (30 June 2016: nil).
The Dual Listed Company merger terms require that ordinary shareholders of BHP Billiton Limited and BHP Billiton Plc
are paid equal cash dividends on a per share basis. Each American Depositary Share (ADS) represents two ordinary
shares of BHP Billiton Limited or BHP Billiton Plc. Dividends determined on each ADS represent twice the dividend
determined on BHP Billiton ordinary shares.
BHP Billiton Limited dividends for all periods presented are, or will be, fully franked based on a tax rate of 30 per cent.

Financial Report
38
7. Financial risk management – Fair values
All financial assets and financial liabilities, other than derivatives, are initially recognised at the fair value of consideration
paid or received, net of transaction costs as appropriate, and subsequently carried at fair value or amortised cost, as
indicated in the tables below. Derivatives are initially recognised at fair value on the date the contract is entered into and
are subsequently remeasured at their fair value.
The carrying amount of financial assets and liabilities measured at fair value is principally calculated based on inputs
other than quoted prices that are observable for these financial assets or liabilities, either directly (i.e. as unquoted
prices) or indirectly (i.e. derived from prices). Where no price information is available from a quoted market source,
alternative market mechanisms or recent comparable transactions, fair value is estimated based on the Group’s views
on relevant future prices, net of valuation allowances to accommodate liquidity, modelling and other risks implicit in such
estimates.
The inputs used in fair value calculations are determined by the relevant segment or function. The functions support the
assets and operate under a defined set of accountabilities authorised by the Executive Leadership Team. Movements
in the fair value of financial assets and liabilities may be recognised through the income statement or in other
comprehensive income.
For financial assets and liabilities carried at fair value, the Group uses the following to categorise the method used:
Fair value hierarchy Level 1 Level 2 Level 3
Valuation method Based on quoted
prices (unadjusted) in
active markets for
identical financial
assets and liabilities.
Based on inputs other than quoted
prices included within Level 1 that
are observable for the financial asset
or liability, either directly (i.e. as
unquoted prices) or indirectly (i.e.
derived from prices).
Based on inputs not
observable in the market
using appropriate valuation
models, including
discounted cash flow
modelling.
The financial assets and liabilities are presented by class in the tables below at their carrying values, which generally
approximate to fair value. In the case of US$3,019 million (30 June 2016: US$3,020 million) of fixed rate debt not
swapped to floating rate, the fair value at 31 December 2016 was US$3,421 million (30 June 2016: US$3,539 million).
For financial instruments that are carried at fair value on a recurring basis, the Group determines whether transfers have
occurred between levels in the hierarchy by reassessing categorisation (based on the lowest level input that is significant
to the fair value measurement as a whole) at the end of each reporting period. There were no transfers between
categories during the period.
For financial instruments not valued at fair value on a recurring basis, the Group uses a method that is categorised as
Level 2.

BHP Billiton Results for the half year ended 31 December 2016
39
7. Financial risk management – Fair values (continued)
Financial assets and liabilities
31 December 2016
Loans and receivables
US$M
Available for sale
securitiesUS$M
Held at fairvalue throughprofit or loss
US$M
Cash flow hedges
US$M
Other financial assets and
liabilities at amortised
costUS$M
TotalUS$M
Fair value hierarchy(a) Level 3 Levels 1,2 & 3 Level 2
Current cross currency and interest rate swaps − − 19 − − 19
Current other derivative contracts(b) − − 37 − − 37
Current available for sale shares and other investments(c) − − 47 − − 47
Non-current cross currency and interest rate swaps − − 525 − − 525
Non-current other derivative contracts(b) − − 183 − − 183
Non-current available for sale shares and other investments(c) (d)
− 72 255 − − 327
Total other financial assets − 72 1,066 − − 1,138
Cash and cash equivalents 13,987 − − − − 13,987
Trade and other receivables(e) 1,922 − 1,519 − − 3,441
Loans to equity accounted investments 829 − − − − 829
Total financial assets 16,738 72 2,585 − − 19,395
Non-financial assets 100,140
Total assets 119,535
Current cross currency and interest rate swaps − − (8) 300 − 292
Current other derivative contracts(b) − − 15 − − 15
Non-current cross currency and interest rate swaps − − (267) 2,064 − 1,797
Non-current other derivative contracts(b) − − 12 − − 12
Total other financial liabilities − − (248) 2,364 − 2,116
Trade and other payables(f) − − 272 − 4,635 4,907
Bank overdrafts and short-term borrowings(g) − − − − 59 59
Bank loans(g) − − − − 2,339 2,339
Notes and debentures(g) − − − − 30,567 30,567
Finance leases(g) − − − − 901 901
Other(g) − − − − 178 178
Total financial liabilities − − 24 2,364 38,679 41,067
Non-financial liabilities 16,043
Total liabilities 57,110

Financial Report
40
7. Financial risk management – Fair values (continued)
Financial assets and liabilities
30 June 2016
Loans and receivables
US$M
Available for sale
securitiesUS$M
Held at fairvalue throughprofit or loss
US$M
Cash flow hedges
US$M
Other financial assets and
liabilities at amortised
costUS$M
TotalUS$M
Fair value hierarchy(a) Level 3 Levels 1,2 & 3 Level 2
Current cross currency and interest rate swaps − − 43 − − 43
Current other derivative contracts(b) − − 42 − − 42
Current available for sale shares and other investments(c) − − 36 − − 36
Non-current cross currency and interest rate swaps − − 2,291 (54) − 2,237
Non-current other derivative contracts(b) − − 202 − − 202
Non-current available for sale shares and other investments(c) (d)
− 25 216 − − 241
Total other financial assets − 25 2,830 (54) − 2,801
Cash and cash equivalents 10,319 − − − − 10,319
Trade and other receivables(e) 1,978 − 835 − − 2,813
Loans to equity accounted investments 897 − − − − 897
Total financial assets 13,194 25 3,665 (54) − 16,830
Non-financial assets 102,123
Total assets 118,953
Current cross currency and interest rate swaps − − − − − −
Current other derivative contracts(b) − − 5 − − 5
Non-current cross currency and interest rate swaps − − 166 1,602 − 1,768
Non-current other derivative contracts(b) − − 10 − − 10
Total other financial liabilities − − 181 1,602 − 1,783
Trade and other payables(f) − − 256 − 4,882 5,138
Bank overdrafts and short-term borrowings(g) − − − − 43 43
Bank loans(g) − − − − 2,036 2,036
Notes and debentures(g) − − − − 33,795 33,795
Finance leases(g) − − − − 346 346
Other(g) − − − − 201 201
Total financial liabilities − − 437 1,602 41,303 43,342
Non-financial liabilities 15,540
Total liabilities 58,882
(a) All of the Group’s financial assets and financial liabilities recognised at fair value were valued using market observable inputs categorised as Level 2 with the exception of the specified items in the following footnotes.
(b) Includes other derivative contracts of US$209 million (30 June 2016: US$236 million) categorised as Level 3.
(c) Includes other investments held at fair value through profit or loss (US Treasury Notes) of US$97 million categorised as Level 1 (30 June 2016: US$54 million).
(d) Includes shares and other investments available for sale of US$72 million (30 June 2016: US$25 million) categorised as Level 3.
(e) Excludes input taxes of US$298 million (30 June 2016: US$312 million) included in other receivables.
(f) Excludes input taxes of US$225 million (30 June 2016: US$264 million) included in other payables.
(g) All interest bearing liabilities, excluding finance leases, are unsecured.

BHP Billiton Results for the half year ended 31 December 2016
41
7. Financial risk management – Fair values (continued)
Sensitivity of level 3 financial assets and liabilities
Financial instruments categorised as level 3 are shares and other investments available for sale and other derivative
contracts with a carrying net amount of US$281 million (30 June 2016: US$261 million). Significant items are derivatives
embedded in physical commodity purchase and sales contracts of gas in Trinidad and Tobago with a net assets fair
value of US$174 million (30 June 2016: US$220 million).
The potential effect of using reasonably possible alternative assumptions in these models, based on a change in the
most significant input, such as commodity prices, by an increase/(decrease) of 10 per cent while holding all other
variables constant will increase/(decrease) profit after taxation by US$28 million (30 June 2016: US$34 million).

Financial Report
42
8. Significant events – Samarco dam failure
On 5 November 2015, the Samarco Mineração S.A. (Samarco) iron ore operation in Minas Gerais, Brazil experienced
a tailings dam failure that resulted in a release of mine tailings, flooding the community of Bento Rodrigues and impacting
other communities downstream (the Samarco dam failure).
Samarco is jointly owned by BHP Billiton Brasil Limitada (BHP Billiton Brasil) and Vale S.A. (Vale). BHP Billiton Brasil’s
50 per cent interest is accounted for as an equity accounted joint venture investment. BHP Billiton Brasil does not
separately recognise its share of the underlying assets and liabilities of Samarco, but instead records the investment as
one line on the balance sheet. Each period, BHP Billiton Brasil recognises its 50 per cent share of Samarco’s profit or
loss and adjusts the carrying value of the investment in Samarco accordingly. Such adjustment continues until the
investment carrying value is reduced to US$ nil, with any additional share of Samarco losses only recognised to the
extent that BHP Billiton Brasil has an obligation to fund the losses, or when future investment funding is provided. After
applying equity accounting, any remaining carrying value of the investment is tested for impairment.
Any charges incurred directly by BHP Billiton Brasil or other BHP Billiton entities are recognised 100 per cent in the
Group’s results.
The financial impacts of the Samarco dam failure on the Group’s income statement, balance sheet and cash flow
statement are shown in the table below and have been treated as an exceptional item. These do not include BHP Billiton
Brasil’s share of the results of Samarco prior to the Samarco dam failure, which is disclosed in the note 3 Interests in
associates and joint venture entities.
Half year ended 31 Dec 2016
US$M
Half year ended31 Dec 2015
US$M
Year ended30 June 2016
US$M
Income statement Expenses excluding net finance costs:
Costs incurred directly by BHP Billiton Brasil and other BHP Billiton entities in relation to the Samarco dam failure(a)(b)
(41) (8) (70)
Profit/(loss) from equity accounted investments and related impairments and expenses: Share of loss relating to the Samarco dam failure(b)(c) (61) (655) (655)Impairment of the carrying value of the investment in Samarco(c) − (525) (525)Samarco dam failure provision(b)(c) 13 − (1,200)
Profit/(loss) from operations (89) (1,188) (2,450)Net finance costs (66) − −
Profit/(loss) before taxation (155) (1,188) (2,450)Income tax (expense)/benefit − 330 253
Profit/(loss) after taxation (155) (858) (2,197)
Balance sheet movement Trade and other payables (2) (5) (11)Investments accounted for using the equity method − (1,180) (1,180)Deferred tax assets − − (158)Provisions 97 − (1,200)Deferred tax liabilities − 330 411
Net assets/(liabilities) 95 (855) (2,138)

BHP Billiton Results for the half year ended 31 December 2016
43
8. Significant events – Samarco dam failure (continued)
Half year ended 31 Dec 2016
US$M
Half year ended31 Dec 2015
US$M
Year ended30 June 2016
US$M
Cash flow statement Profit/(loss) before taxation (155) (1,188) (2,450)Comprising: Costs incurred directly by BHP Billiton Brasil and other BHP Billiton entities in relation to the Samarco dam failure(a)(b)
(41) (8) (70)
Share of loss relating to the Samarco dam failure(b)(c) (61) (655) (655) Impairment of the carrying value of the investment in Samarco(c) − (525) (525) Samarco dam failure provision(b)(c) 13 − (1,200) Net finance costs (66) − −
Non-cash or non-operating exceptional items 116 1,185 2,391
Net operating cash flows (39) (3) (59)
Net investment and funding of equity accounted investments(d) (211) − −
Net investing cash flows (211) − −
Net decrease in cash and cash equivalents (250) (3) (59)
(a) Includes legal and advisor costs incurred.
(b) Financial impacts of US$(155) million from the Samarco dam failure relates to US$(61) million share of loss from US$(61) million funding provided during the period, US$(41) million direct costs incurred by BHP Billiton Brasil Ltda and other BHP Billiton entities, US$(66) million amortisation of discounting impacting net finance costs offset by US$13 million other movements in the Samarco dam failure provision including foreign exchange.
(c) At 31 December 2015, BHP Billiton Brasil Ltda adjusted its investment in Samarco to US$ nil (resulting from US$(655) million share of loss from Samarco and US$(525) million impairment) and at 30 June 2016 recognised a provision of US$(1,200) million for potential obligations under the Framework Agreement. US$(572) million of the US$(1,200) million provision represented an additional share of loss from Samarco with the remaining US$(628) million recognised as provision expense.
(d) Includes US$(61) million funding provided during the period and US$(150) million utilisation of the Samarco dam failure provision, of which US$(139) million allowed for the continuation of reparatory and compensatory programs in relation to the Framework Agreement and a further US$(11) million for dam stabilisation.
Equity accounted investment in Samarco
BHP Billiton Brasil’s investment in Samarco remains at US$ nil. BHP Billiton Brasil provided US$61 million funding under
a working capital facility during the period and recognised additional share of losses of US$61 million. No dividends
have been received by BHP Billiton from Samarco during the period. Samarco currently does not have profits available
for distribution and is legally prevented from paying previously declared and unpaid dividends.
Provision for Samarco dam failure
Half year ended 31 December 2016 US$M
At the beginning of the reporting period 1,200Movement in provision (97)Comprising: Utilised (150)Adjustments charged to the income statement:
Amortisation of discounting impacting net finance costs 66Other(a) (13)
At the end of reporting period 1,103
Current 305Non-current 798
At the end of the reporting period 1,103
(a) US$13 million relates to other movements in the Samarco dam failure provision including foreign exchange.

Financial Report
44
8. Significant events – Samarco dam failure (continued)
Dam failure provisions and contingencies
As at 31 December 2016, provisions and contingent liabilities for BHP Billiton Brasil are not materially different from
those disclosed in note 3 ‘Significant events – Samarco dam failure’ in the 30 June 2016 Annual Report, subject to the
updates set out below:
Environment and socio-economic rehabilitation
Preliminary Agreement
On 18 January 2017, Samarco, Vale and BHP Billiton Brasil entered into a Preliminary Agreement with the Federal
Prosecutors’ Office in Brazil, which outlines the process and timeline for further negotiations towards a settlement
regarding the R$20 billion (approximately US$6 billion) Public Civil Claim and R$155 billion (approximately
US$47.5 billion) Federal Public Prosecution Office claim relating to the dam failure.
The Preliminary Agreement provides for the appointment of experts to advise the Federal Prosecutors in relation to
social and environmental remediation and the assessment and monitoring of programs under the Framework
Agreement. The expert advisors’ conclusions will be considered in the negotiation of a final settlement arrangement with
the Federal Prosecutors. The parties will use best efforts to achieve a final settlement arrangement by 30 June 2017
under the timeframe established in the Preliminary Agreement.
Under the Preliminary Agreement, Samarco, Vale and BHP Billiton Brasil agreed interim security (Interim Security)
comprising R$1.3 billion (approximately US$400 million) in insurance bonds, R$100 million (approximately
US$30 million) in liquid assets, a charge of R$800 million (approximately US$245 million) over Samarco’s assets, and
R$200 million (approximately US$60 million) to be allocated within the next four years through existing Framework
Agreement programs in the Municipalities of Barra Longa, Rio Doce, Santa Cruz do Escalvado and Ponte Nova by
30 April 2017.
On 24 January 2017, Samarco, Vale and BHP Billiton Brasil provided the Interim Security to the Court which, subject to
Court approval, will remain in place until the earlier of 30 June 2017 and the date that a final settlement arrangement is
agreed between the Federal Prosecutors, and Samarco, Vale and BHP Billiton Brasil.
Framework Agreement
Mining and processing operations remain suspended following the dam failure. Samarco is currently progressing plans
to resume operations, however, significant uncertainties surrounding the nature and timing of ongoing future operations
remain. In light of these uncertainties and based on currently available information, at 31 December 2016, BHP Billiton
Brasil has recognised a provision of US$1.1 billion before tax and after discounting (30 June 2016: US$1.2 billion), in
respect of its potential obligations under the Framework Agreement.
The measurement of the provision requires the use of estimates and assumptions and may be affected by, among other
factors, potential changes in scope of work required under the Framework Agreement including further technical
analysis, costs incurred in respect of programs delivered, resolution of uncertainty in respect of operational restart,
updates to discount and foreign exchange rates, resolution of existing and potential legal claims and the status of the
Framework Agreement. As a result, future actual expenditures may differ from the amounts currently provided and
changes to key assumptions and estimates could result in a material impact to the amount of the provision in future
reporting periods.
As at 31 December 2016, BHP Billiton Brasil has paid US$139 million to allow for the continuation of reparatory and
compensatory programs in relation to the Framework Agreement and a further US$11 million for dam stabilisation,
with the total US$150 million offset against the provision for the Samarco dam failure.
On 25 November 2016, BHP Billiton Brasil approved a further US$181 million to support the Foundation, in the event
Samarco does not meet its funding obligations under the Framework Agreement. Any support to the Foundation provided
by BHP Billiton Brasil will be offset against the provision for the Samarco dam failure.

BHP Billiton Results for the half year ended 31 December 2016
45
8. Significant events – Samarco dam failure (continued)
Legal
The following matters are disclosed as contingent liabilities:
Public Civil Claim
While a final decision by the Court on the issue of ratification of the Framework Agreement is pending, the Preliminary
Agreement suspends a R$1.2 billion (approximately US$370 million) injunction order under the Public Civil Claim. The
Preliminary Agreement also requests suspension of the Public Civil Claim with a decision from the Court pending.
The R$1.2 billion (approximately US$370 million) injunction order could be reinstated if the Preliminary Agreement is
not approved by the Court or a final settlement arrangement is not agreed by 30 June 2017.
These proceedings do not affect compliance with the Framework Agreement.
Given the status of these proceedings, it is not possible at this time to provide a range of possible outcomes or a reliable
estimate of potential future exposures for BHP Billiton Brasil.
Federal Public Prosecution Office claim
The Preliminary Agreement suspends the Federal Public Prosecution Office claim, including a R$7.7 billion
(approximately US$2.4 billion) injunction request. However, proceedings may be resumed if the Preliminary Agreement
is not approved by the Court. Given the status of these proceedings it is not possible at this time to provide a range of
possible outcomes or a reliable estimate of potential future exposures for BHP Billiton Brasil.
Criminal Charges
The Federal Prosecutors’ Office has filed criminal charges against BHP Billiton Brasil, Samarco and Vale and certain
employees and former employees of BHP Billiton Brasil (Affected Individuals) in the Federal Court of Ponte Nova, Minas
Gerais. BHP Billiton Brasil rejects outright the charges against the company and the Affected Individuals and will defend
the charges and fully support each of the Affected Individuals in their defence of the charges.
Under the criminal charges against Samarco, Vale and BHP Billiton Brasil and certain individuals, a R$20 billion
(approximately US$6 billion) asset freezing order application was made by the Federal Prosecutors. The Preliminary
Agreement requests suspension of the asset freezing order application with a decision from the Court pending.
Given the status of this matter it is not possible at this time to provide a range of possible outcomes or a reliable estimate
of potential future exposures for BHP Billiton Brasil.
Other claims
Additional lawsuits and government investigations relating to the Samarco dam failure may be brought against BHP
Billiton Brasil and possibly other BHP Billiton entities in Brazil or other jurisdictions.
BHP Billiton’s potential liabilities, if any, resulting from other pending and future claims, lawsuits and enforcement actions
relating to the Samarco dam failure, together with the potential cost of implementing remedies sought in the various
proceedings, cannot be reliably estimated at this time and therefore a provision has not been recognised and nor has
any contingent liability been quantified for such matters.
Ultimately, all the legal matters disclosed as contingent liabilities could have a material adverse impact on BHP Billiton’s
business, competitive position, cash flows, prospects, liquidity and shareholder returns.
BHP Billiton Insurance
BHP Billiton has third party liability insurance for claims related to the Samarco dam failure made directly against BHP
Billiton Brasil or other BHP Billiton entities. Such claims may be externally insured up to US$360 million (when adjusted
for BHP Billiton Brasil’s interest in Samarco). External insurers have been advised of the Samarco dam failure and a
formal claim is being prepared. At 31 December 2016 an insurance receivable has not been recognised for any potential
recoveries under insurance arrangements.

Financial Report
46
8. Significant events – Samarco dam failure (continued)
Commitments
Under the terms of the joint venture agreement, BHP Billiton Brasil does not have an existing obligation to fund Samarco.
For the half year ended 31 December 2016, BHP Billiton Brasil has provided US$61 million funding to Samarco. On
25 November 2016, BHP Billiton Brasil made available a short-term facility of up to US$115 million to carry out
remediation and stabilisation work and support Samarco’s operations. Funds will be released to Samarco only as
required and subject to the achievement of key milestones.
Any additional requests for funding or future investment provided would be subject to a future decision, accounted for at
that time.
The following section includes disclosure required by IFRS of Samarco Mineração S.A.’s provisions, contingencies and
other matters arising from the dam failure.
Samarco
Dam failure related provisions and contingencies
As at 31 December 2016, provisions and contingent liabilities for Samarco are not materially different from those
disclosed in note 3 ‘Significant events – Samarco dam failure’ in the 30 June 2016 Annual Report, subject to the updates
set out below:
Environmental and socio-economic remediation
Preliminary Agreement
On 18 January 2017, Samarco, Vale and BHP Billiton Brasil entered into a Preliminary Agreement with the Federal
Prosecutors’ Office in Brazil, which outlines the process and timeline for further negotiations towards a settlement
regarding the R$20 billion (approximately US$6 billion) Public Civil Claim and R$155 billion (approximately
US$47.5 billion) Federal Public Prosecution Office claim relating to the dam failure.
The Preliminary Agreement provides for the appointment of experts to advise the Federal Prosecutors in relation to
social and environmental remediation and the assessment and monitoring of programs under the Framework
Agreement. The expert advisors’ conclusions will be considered in the negotiation of a final settlement arrangement with
the Federal Prosecutors. The parties will use best efforts to achieve a final settlement arrangement by 30 June 2017
under the timeframe established in the Preliminary Agreement.
Under the Preliminary Agreement, Samarco, Vale and BHP Billiton Brasil agreed interim security (Interim Security)
comprising R$1.3 billion (approximately US$400 million) in insurance bonds, R$100 million (approximately
US$30 million) in liquid assets, a charge of R$800 million (approximately US$245 million) over Samarco’s assets, and
R$200 million (approximately US$60 million) to be allocated within the next four years through existing Framework
Agreement programs in the Municipalities of Barra Longa, Rio Doce, Santa Cruz do Escalvado and Ponte Nova by
30 April 2017.
On 24 January 2017, Samarco, Vale and BHP Billiton Brasil provided the Interim Security to the Court which, if approved,
will remain in place until the earlier of 30 June 2017 and the date that a final settlement arrangement is agreed between
the Federal Prosecutors, and Samarco, Vale and BHP Billiton Brasil.

BHP Billiton Results for the half year ended 31 December 2016
47
8. Significant events – Samarco dam failure (continued)
Framework Agreement
Samarco has recognised a provision of US$2.2 billion before tax and after discounting at 31 December 2016 (30 June
2016: US$2.4 billion), in respect of its obligations under the Framework Agreement based on currently available
information.
The measurement of the provision requires the use of estimates and assumptions and may be affected by, amongst
other factors, potential changes in scope of work required under the Framework Agreement including further technical
analysis, costs incurred in respect of programs delivered, resolution of uncertainty in respect of operational restart,
updates to discount and foreign exchange rates, resolution of existing and potential legal claims and the status of the
Framework Agreement. As a result, future actual expenditures may differ from the amounts currently provided and
changes to key assumptions and estimates could result in a material impact to the amount of the provision in future
reporting periods.
Other
As at 31 December 2016, Samarco has recognised provisions of US$0.2 billion (30 June 2016: US$0.2 billion), in
addition to its obligations under the Framework Agreement, based on currently available information. The magnitude,
scope and timing of these additional costs are subject to a high degree of uncertainty and Samarco has indicated that it
anticipates that it will incur future costs beyond those provided. These uncertainties are likely to continue for a significant
period and changes to key assumptions could result in a material change to the amount of the provision in future
reporting periods. Any such unrecognised obligations are therefore contingent liabilities and, at present, it is not
practicable to estimate their magnitude or possible timing of payment. Accordingly, it is also not possible to provide a
range of possible outcomes or a reliable estimate of total potential future exposures at this time.
Legal
Public Civil Claim
While a final decision by the Court on the issue of ratification of the Framework Agreement is pending, the Preliminary
Agreement suspends a R$1.2 billion (approximately US$370 million) injunction order under the Public Civil Claim. The
Preliminary Agreement also requests suspension of the Public Civil Claim with a decision from the Court pending.
The R$1.2 billion (approximately US$370 million) injunction order could be reinstated if the Preliminary Agreement is
not approved by the Court or a final settlement arrangement is not agreed by 30 June 2017.
These proceedings do not affect compliance with the Framework Agreement.
Given the status of these proceedings it is not possible at this time to provide a range of possible outcomes or a reliable
estimate of potential future exposures for Samarco.
Federal Public Prosecution Office claim
The Preliminary Agreement suspends the Federal Public Prosecution Office claim, including a R$7.7 billion
(approximately US$2.4 billion) injunction request. However, proceedings may be resumed if the Preliminary Agreement
is not approved by the Court. Given the status of these proceedings it is not possible at this time to provide a range of
possible outcomes or a reliable estimate of potential future exposures for Samarco.

Financial Report
48
8. Significant events – Samarco dam failure (continued)
Criminal Investigations
The Federal Prosecutors’ Office has filed criminal charges against Samarco, Vale and BHP Billiton Brasil and certain
employees and former employees of Samarco (Affected Individuals) in the Federal Court of Ponte Nova, Minas Gerais.
Samarco rejects outright the charges against the company and the Affected Individuals and will defend the charges.
Under the criminal charges against Samarco, Vale and BHP Billiton Brasil and certain individuals, a R$20 billion
(approximately US$6 billion) asset freezing order application was made by the Federal Prosecutors. The Preliminary
Agreement requests suspension of the asset freezing order application with a decision from the Court pending.
Given the status of these proceedings it is not possible at this time to provide a range of possible outcomes or a reliable
estimate of potential future exposures for Samarco.
Class Action Complaint – Bond holders
In November 2016, a putative class action complaint was filed in the U.S District Court for the Southern District of New
York on behalf of all purchasers of Samarco’s ten year bond notes due 2022 - 2024 between 31 October 2012 and
30 November 2015 against Samarco and the former chief executive officer of Samarco. The complaint asserts claims
under the U.S. federal securities laws and indicates that the plaintiff will seek certification to proceed as a class action.
The amount of damages sought by the plaintiffs on behalf of the putative class is unspecified. Given the preliminary
status of this matter, it is not possible at this time to provide a range of possible outcomes or a reliable estimate of
potential future exposures to Samarco.
Other claims
Other pending lawsuits and investigations are at the early stages of proceedings. Until further facts are developed; court
rulings clarify the issues in dispute, liability and damages; trial activity nears, or other actions such as possible
settlements occur, it is not possible to arrive at a range of outcomes or a reliable estimate of Samarco’s obligations
arising from these matters and therefore Samarco has not recognised a provision or quantified a contingent liability.
Additional claims may be brought against Samarco. A provision has not been made by Samarco for claims yet to be
filed. Given the significant uncertainties surrounding possible outcomes it is not possible for Samarco to arrive at a range
of outcomes or a reliable estimate of the liability for any unfiled claims.
Samarco Insurance
Samarco has standalone insurance policies in place with Brazilian and global insurers. Samarco has notified insurers
including those covering property, project and liability risks. Insurers loss adjusters and/or claims representatives
continue to investigate and assist with the claims process. An insurance receivable has not been recognised by Samarco
for any recoveries under insurance arrangements at 31 December 2016.
9. Subsequent events
On the 9th February 2017, production was suspended at Escondida as a result of ongoing industrial action. Given the
uncertainty of when production will be recommenced, it is not possible to estimate the potential financial effect.
Other than the matters outlined elsewhere in this financial information, no matters or circumstances have arisen since
the end of the half year that have significantly affected, or may significantly affect, the operations, results of operations
or state of affairs of the Group in subsequent accounting periods.

BHP Billiton Results for the half year ended 31 December 2016
49
Directors’ Report
The Directors present their report together with the half year financial statements for the half year ended 31 December
2016 and the auditor’s review report thereon.
Review of Operations
A detailed review of the Group’s operations, the results of those operations during the half year ended 31 December
2016 and likely future developments are given on pages 1 to 26. The Review of Operations has been incorporated into,
and forms part of, this Directors’ Report.
Principal Risks and Uncertainties
Due to the international scope of the Group's operations and the industries in which it is engaged, there are a number
of risk factors and uncertainties which could have an effect on the Group's results and operations over the next six
months. Material risks that could impact on the Group's performance for the remaining six months of the financial year
include those referred to in the ‘Outlook’ section as well as:
Our potential liabilities from litigation and other actions resulting from the Samarco dam failure are subject to significant uncertainty and cannot be reliably estimated at this time but they could have a material adverse effect on our business
If our liquidity and cash flow deteriorate significantly it could adversely affect our ability to fund our major capital programs
Fluctuations in commodity prices (including sustained price shifts) and impacts of ongoing global economic volatility may negatively affect our results, including cash flows and asset values
We may not fully recover our investments in mining, oil and gas assets, which may require financial write-downs
Our financial results may be negatively affected by exchange rate fluctuations
The commercial counterparties we transact with may not meet their obligations, which may negatively impact our results
Reduction in Chinese demand may negatively impact our results
Unexpected natural and operational catastrophes may adversely impact our operations
Actions by governments, additional regulation or political events in the countries in which we operate could have a negative impact on our business
Cost pressures and reduced productivity could negatively impact our operating margins and expansion plans
Failure to discover or acquire new resources, maintain reserves or develop new operations could negatively affect our future results and financial condition
Our non-operated assets and our commercial counterparties may not comply with our standards
Potential changes to our portfolio of assets through acquisitions and divestments may have a material adverse effect on our future results and financial condition
Breaches in, or failures of, our information technology may adversely impact our business activities
Increased costs and schedule delays may adversely affect our development projects
Safety, health, environmental and community impacts, incidents or accidents may adversely affect our people, operations and reputation or licence to operate
Further information on the above risks and uncertainties can be found on pages 27 to 37 of the Group's Annual Report
for the year ended 30 June 2016, a copy of which is available on the Group's website at www.bhpbilliton.com.
Dividend
Full details of dividends are given on page 9.

Financial Report
50
Board of Directors
The Directors of BHP Billiton at any time during or since the end of the half year are:
Jac Nasser – Chairman since March 2010 (a Director since June 2006)
Andrew Mackenzie – an Executive Director since May 2013
Malcolm Brinded – a Director since April 2014
Malcolm Broomhead – a Director since March 2010
Pat Davies – a Director since June 2012
Anita Frew – a Director since September 2015
Carolyn Hewson – a Director since March 2010
Ken MacKenzie – a Director since September 2016
Lindsay Maxsted – a Director since March 2011
Wayne Murdy – a Director since June 2009
John Schubert – a Director from June 2000 to November 2016
Shriti Vadera – a Director since January 2011
Auditor’s independence declaration
KPMG in Australia are the auditors of BHP Billiton Limited. Their auditor’s independence declaration under Section 307C
of the Australian Corporations Act 2001 is set out on page 52 and forms part of this Directors’ Report.
Rounding of amounts
BHP Billiton Limited is an entity of a kind referred to in Australian Securities and Investments Commission Corporations
(Rounding in Financial/ Directors’ Reports) Instrument 2016/191, dated 24 March 2016. Amounts in the Directors’ Report
and half year financial statements have been rounded to the nearest million dollars in accordance with ASIC Instrument
2016/191.
Signed in accordance with a resolution of the Board of Directors.
Jac Nasser AO – Chairman
Andrew Mackenzie – Chief Executive Officer
Dated this 21st day of February 2017

BHP Billiton Results for the half year ended 31 December 2016
51
Directors’ Declaration of Responsibility
The half year financial report is the responsibility of, and has been approved by, the Directors. In accordance with a
resolution of the Directors of BHP Billiton Limited and BHP Billiton Plc, the Directors declare that:
(a) in the Directors’ opinion and to the best of their knowledge, the half year financial statements and notes, set out on
pages 27 to 48, have been prepared in accordance with IAS 34 ‘Interim Financial Reporting’ as issued by the IASB,
IAS 34 ‘Interim Financial Reporting’ as adopted by the EU, AASB 134 ‘Interim Financial Reporting’ as issued by the
AASB, the Disclosure Guidance and Transparency Rules of the Financial Conduct Authority in the United Kingdom
and the Australian Corporations Act 2001, including:
(i) complying with applicable accounting standards and the Australian Corporations Regulations 2001; and
(ii) giving a true and fair view of the financial position of the BHP Billiton Group as at 31 December 2016 and of
its performance for the half year ended on that date;
(b) to the best of the Directors’ knowledge, the Directors’ Report, which incorporates the Review of Operations on
pages 1 to 26, includes a fair review of the information required by:
(i) DTR4.2.7R of the Disclosure Guidance and Transparency Rules in the United Kingdom, being an indication
of important events during the first six months of the current financial year and their impact on the half year
financial statements, and a description of the principal risks and uncertainties for the remaining six months of
the year; and
(ii) DTR4.2.8R of the Disclosure Guidance and Transparency Rules in the United Kingdom, being related party
transactions that have taken place in the first six months of the current financial year and that have materially
affected the financial position or performance of the BHP Billiton Group during that period, and any changes
in the related party transactions described in the last annual report that could have such a material effect;
and
(c) in the Directors’ opinion, there are reasonable grounds to believe that each of BHP Billiton Limited and BHP Billiton
Plc will be able to pay its debts as and when they become due and payable.
Signed on behalf of the Directors in accordance with a resolution of the Board of Directors.
Jac Nasser AO – Chairman
Andrew Mackenzie – Chief Executive Officer
Dated this 21st day of February 2017

Financial Report
52
Lead Auditor’s Independence Declaration under Section 307C of the Corporations Act 2001
To: the Directors of BHP Billiton Limited
I declare that, to the best of my knowledge and belief, in relation to the review for the half year ended 31 December
2016 there have been:
i. no contraventions of the auditor independence requirements as set out in the Australian Corporations Act 2001
in relation to the review; and
ii. no contraventions of any applicable code of professional conduct in relation to the review.
This declaration is in respect of BHP Billiton and the entities it controlled during the financial period.
KPMG
Anthony Young Partner Melbourne 21 February 2017
KPMG, an Australian partnership and a member firm of the KPMG network of independent member firms affiliated with KPMG International Cooperative (‘KPMG International’), a Swiss entity.
KPMG Australia’s liability limited by a scheme approved under Professional Standards Legislation.

BHP Billiton Results for the half year ended 31 December 2016
53
Independent Review Report
Independent Auditors’ review report of KPMG LLP (‘KPMG UK’) to the owners of BHP Billiton Plc and of
KPMG (‘KPMG Australia’) to the owners of BHP Billiton Limited
Introduction
For the purposes of these reports, the terms ‘we’ and ‘our’ denote KPMG UK in relation to its responsibilities under its
terms of engagement to report to BHP Billiton Plc and KPMG Australia in relation to Australian professional and
regulatory responsibilities and reporting obligations to the owners of BHP Billiton Limited.
The BHP Billiton Group (‘the Group’) consists of BHP Billiton Plc, BHP Billiton Limited and the entities they controlled
during the half year ended 31 December 2016.
We have reviewed the accompanying condensed financial statements of the Group for the half year ended 31 December
2016 (‘half year financial statements’), which comprise the Consolidated Income Statement, Consolidated Statement of
Comprehensive Income, Consolidated Balance Sheet, Consolidated Cash Flow Statement, Consolidated Statement of
Changes in Equity, notes 1 to 9 comprising a summary of significant accounting policies and other explanatory
information. KPMG Australia considers the Directors’ declaration to be part of the half year financial statements when
forming its conclusion.
Directors’ Responsibilities
The Directors are responsible for preparing the half year financial report which give a true and fair view in accordance
with:
The Disclosure and Transparency Rules (‘the DTR’) of the United Kingdom’s Financial Conduct Authority (‘the UK
FCA’), and under those rules, in accordance with IAS 34 Interim Financial Reporting as adopted by the European
Union (‘EU’); and
Australian Accounting Standards and the Australian Corporations Act 2001 and for such internal control as the
Directors determine is necessary to enable the preparation of the half year financial statements that are free from
material misstatement, whether due to fraud or error; selecting and applying appropriate accounting policies; and
making accounting estimates that are reasonable in the circumstances.
Respective Responsibilities of KPMG UK and KPMG Australia
KPMG UK’s report is made solely to BHP Billiton Plc in accordance with the terms of KPMG UK’s engagement to assist
BHP Billiton Plc in meeting the requirements of the DTR of the UK FCA. KPMG UK’s review has been undertaken so
that it might state to BHP Billiton Plc those matters it is required to state to it in this report and for no other purpose. To
the fullest extent permitted by law, KPMG UK does not accept or assume responsibility to anyone other than BHP Billiton
Plc, for KPMG UK’s review work, for this report, or for the conclusions it has reached.
KPMG Australia has performed an independent review of the half year financial statements and Directors’ declaration
in order to state whether, on the basis of the procedures described, it has become aware of any matter that makes
KPMG Australia believe that the half year financial statements and Directors’ declaration are not in accordance with the
Australian Corporations Act 2001 including: giving a true and fair view of the Group’s financial position as at 31 December
2016 and its performance for the half year ended on that date; and complying with Australian Accounting Standard
AASB 134 Interim Financial Reporting and the Australian Corporations Regulations 2001.
Our responsibility is to express a conclusion on the half year financial report based on our review.
Scope of Review
KPMG UK conducted its review in accordance with International Standard on Review Engagements (UK and Ireland)
2410 Review of Interim Financial Information Performed by the Independent Auditor of the Entity (‘ISRE 2410’) issued
by the Auditing Practices Board for use in the UK.

Financial Report
54
KPMG Australia conducted its review in accordance with Auditing Standard on Review Engagements ASRE 2410
Review of a Financial Report Performed by the Independent Auditor of the Entity (‘ASRE 2410’), as issued by the
Australian Auditing and Assurance Standards Board. As auditor of BHP Billiton Limited, ASRE 2410 requires that KPMG
Australia complies with the ethical requirements relevant to the audit of the annual financial statements.
A review of half year financial statements consists of making enquiries, primarily of persons responsible for financial and
accounting matters, and applying analytical and other review procedures. A review is substantially less in scope than an
audit conducted in accordance with auditing standards and consequently does not enable us to obtain assurance that
we would become aware of all significant matters that might be identified in an audit. Accordingly, we do not express an
audit opinion.
Independence
In conducting its review, KPMG Australia has complied with the independence requirements of the Australian
Corporations Act 2001.
Review conclusion by KPMG UK
Based on our review, nothing has come to our attention that causes us to believe that the condensed half year financial
statements for the six months ended 31 December 2016 are not prepared, in all material respects, in accordance with
IAS 34 Interim Financial Reporting, as adopted by the EU, and the DTR of the UK FCA.
Stephen Oxley Partner For and on behalf of KPMG LLP Chartered Accountants London 21 February 2017
Review conclusion by KPMG Australia
Based on our review, which is not an audit, we have not become aware of any matter that makes us believe that the
condensed half year financial statements and directors’ declaration of the Group are not in accordance with the
Australian Corporations Act 2001, including:
a) giving a true and fair view of the Group’s financial position as at 31 December 2016 and of its performance for the
half year ended on that date; and
b) complying with Australian Accounting Standard AASB 134 Interim Financial Reporting and the Australian
Corporations Regulations 2001.
KPMG
Anthony Young Partner Melbourne 21 February 2017
KPMG, an Australian partnership and KPMG LLP, a UK limited liability partnership, are member firms of the KPMG network of independent member firms affiliated with KPMG International Cooperative (‘KPMG International’), a Swiss entity.
KPMG Australia’s liability limited by a scheme approved under Professional Standards Legislation.