bfs update 2014 - silver mine project
TRANSCRIPT
Sotkamo Silver Silver Mine BANKABLE FEASIBILITY STUDY Update May 28th 2014 Report FINAL rev 03
CTS Engtec Oy KOUVOLA ESPOO OULU ST. PETERSBURG [email protected] www.ctse.fi
Bankable feasibility study update May 28th 2014 rev 03
2
ABBREVIATIONS 12
1 EXECUTIVE SUMMARY 14 1.1 Introduction 14 1.2 Environmental and Legal Rights 14 1.3 Mineralogy and Mining 14 1.4 Processing 15 1.5 Capital and Operating Cost, Economic Evaluation 16
2 INTRODUCTION 20 2.1 General 20 2.2 Terms of reference and Scope of BFS Update 20
3 PROPERTY DESCRIPTION 21
4 DEPOSIT GEOLOGY 22 4.1 Geological setting 22 4.2 Property geology 22 4.3 Deposit Geology 24 4.4 The Silver Deposit 25 4.5 Mineralogy of the Deposit 26
4.5.1 Carbonates 26 4.5.2 Ore minerals 26
4.6 Deposit type 26 4.7 Geophysical approach 27
5 EXPLORATION WORK AT SILVER MINE 29 5.1 Taivalhopea 29 5.2 Sotkamo Silver 29 5.3 2010-2011 Sotkamo Silver exploration work 29 5.4 Sotkamo Silver, Drilling Campaign 2013 29
5.4.1 Field work and assaying 29 5.4.2 Quality assurance 32 5.4.3 Description of results 32
6 MINERAL RESOURCE ESTIMATES 33 6.1 Overview 33 6.2 Sample database 33 6.3 Geological interpretation 33
6.3.1 Structural analytics 35 6.3.2 Solid (wireframe) modelling 35
6.4 Database compilation 40 6.5 Data processing 40
6.5.1 Statistical analysis 40 6.6 Top cutting 41 6.7 Missing assays 41 6.8 Compositing 41 6.9 Data processing summary 41
Bankable feasibility study update May 28th 2014 rev 03
3
6.10 Variography 42 6.10.1 Variogram parameters 42
6.11 Block modelling 43 6.12 Density 43 6.13 Grade estimation 43 6.14 Model validation 44
6.14.1 Visual assessment of grade estimation 44 6.14.2 Global grade validation 45 6.14.3 SWATH analysis 45 6.14.4 Validation summary 47
6.15 Resource classification 47 6.16 Mineral resource estimate 48
7 ORE RESERVE 49
8 MINE DESIGN AND PLANNING 51 8.1 Introduction 51 8.2 Rock stability 51
8.2.1 Rock properties and stress status 51 8.3 Stability and need for reinforcement 52
8.3.1 Open pit 52 8.3.2 Underground Mine 54 8.3.3 Risk assessment and working in risk areas 54 8.3.4 Follow-up and simulation of rock mechanics 54
8.4 Underground mining methods 54 8.4.1 Development 54 8.4.2 Stoping 56 8.4.3 Losses and dilution 62 8.4.4 Backfill 62
8.5 Surface mining 62 8.5.1 Open pit design 62 8.5.2 Losses and dilution 64
8.6 Infrastructure 64 8.6.1 Ore and barren rock extraction/transportation 64 8.6.2 Ventilation 64 8.6.3 Electricity 64 8.6.4 Pumping 65 8.6.5 Crushing and fine ore storage 65 8.6.6 Mining equipment 65 8.6.7 Technical services, personnel and contractors 65
8.7 Mining plan and schedule 65 8.7.1 Open pit 65 8.7.2 Underground 66
9 MINERAL PROCESSING AND METALLURGICAL TESTING 69 9.1 Introduction 69 9.2 GTK metallurgical testing 2009 69
9.2.1 Test sample 69 9.2.2 Bench scale test results 70
Bankable feasibility study update May 28th 2014 rev 03
4
9.3 GTK metallurgical testing 2011 70 9.3.1 Test samples 70 9.3.2 Batch flotation tests results 71 9.3.3 Lead concentrates grades and recoveries 71 9.3.4 Silver deportment to lead concentrate 71 9.3.5 Gold deportment to lead concentrate 72 9.3.6 Zinc concentrates grades and recoveries 72 9.3.7 Locked cycle flotation test results 72 9.3.8 Bench-scale tests conclusions 72
9.4 Pilot plant test programme 73 9.4.1 Test samples 73
9.5 Pilot plant gravity and flotation results 73 9.6 Flowsheet description 74
9.6.1 General 74 9.6.2 Crushing 74 9.6.3 Grinding and classification 74 9.6.4 Ag-Au-Pb flotation 75 9.6.5 Zn flotation 75 9.6.6 Pyrite flotation 76 9.6.7 Concentrate thickening and filtering 77
9.6.7.1 Lead-silver-gold concentrate 77 9.6.7.2 Zinc concentrate 77 9.6.7.3 Pyrite concentrate 77 9.6.7.4 Concentrate storage and transportation 78 9.6.7.5 Tailings disposal and water re-circulation 78
10 PROCESS INFRASTRUCTURE 79 10.1 General 79 10.2 Mine 80
10.2.1 Mine design criteria 80 10.2.2 UG and Open pit water 80 10.2.3 Heating and ventilation 80 10.2.4 Electricity and process control 81 10.2.5 Ore transportation and crusher supply 81
10.3 Crushing plant 81 10.3.1 Crushing plant design criteria 81 10.3.2 Crushing and Fine Ore Storage 82 10.3.3 Mill feed 83 10.3.4 Utilities 83
10.3.4.1 Compressed Air 83 10.3.5 Electrification 83
10.3.5.1 Variable Speed Drives for Ore storage and conveyor system 83 10.3.5.2 Cables 83 10.3.5.3 Control and instrumentation for crushed fine ore storage and conveyor
system 84 10.3.6 Process control 84
10.3.6.1 Crushing plant process control system 84 10.3.6.2 Main controllable process variables and instruments 85 10.3.6.3 Manual control 85

Bankable feasibility study update May 28th 2014 rev 03
5
10.3.7 Crushing plant balance 85 10.3.8 Crushing plant layout 87 10.3.9 Crushing plant flow sheet 87
10.4 Concentrator plant 88 10.4.1 Process description 88
10.4.1.1 General 88 10.4.1.2 Grinding and classification 88 10.4.1.3 Flotation 88 10.4.1.4 Dewatering 89 10.4.1.5 Reagents 89
10.4.2 Concentrating process flow sheet 90 10.4.3 Utilities 92
10.4.3.1 Process Water 92 10.4.3.2 Raw Water 92 10.4.3.3 Compressed Air 93 10.4.3.4 Heating and ventilation 93
10.4.4 Electricity 93 10.4.4.1 Concentrator plant Load 93 10.4.4.2 Motor Control Centres 94 10.4.4.3 Variable Speed Drives 94 10.4.4.4 Mill Starter 94 10.4.4.5 Cables 94 10.4.4.6 Control and instrumentation 94
10.4.5 Process control 95 10.4.5.1 Concentrator plant process control system 95 10.4.5.2 Main controllable process variables and instruments 96 10.4.5.3 Manual control 96 10.4.5.4 Process control system architecture 97
10.4.6 IT-Architecture 99 10.4.7 Laboratory facilities 99 10.4.8 Mobile equipment 99
11 PROJECT INFRASTRUCTURE 100 11.1 Mine area general infrastructure 100 11.2 Power supply and distribution 100
11.2.1 Total power consumption 101 11.2.2 Recommended transformer capacities 101 11.2.3 Transmission line 110 kV/45kV, main incomer 101
11.3 Electricity 101 11.3.1 Electric network layout 101 11.3.2 Protection 104 11.3.3 Earth fault protection at 20kV 104 11.3.4 Re-closing 105 11.3.5 Cables 105 11.3.6 RMU’s disconnectors 105 11.3.7 Spare feeders 105 11.3.8 Single line diagrams 105
11.4 Fuel supply 106 11.5 Heat production and distribution 106
Bankable feasibility study update May 28th 2014 rev 03
6
11.6 ICT, Communications and Video surveillance 106 11.7 Access road R1 and other roads 107 11.8 Process Plant Area Buildings 107
11.8.1 Crushed fine ore storage 107 11.8.2 Process plant building (PPB) 107 11.8.3 Office building with laboratory 108 11.8.4 Drill core storage and workshop 108 11.8.5 Explosives container 108 11.8.6 Fencing 108 11.8.7 Site safety and security 108 11.8.8 General maintenance 108
11.9 Tailings management facility (TMF) 109 11.9.1 Tailings pond (TP) 109 11.9.2 Settling pond 1 (SP1) 110 11.9.3 Settling pond 2 (SP2) 110 11.9.4 Settling pond 3 (SP3) 110 11.9.5 Settling pond 4 (SP4) 110 11.9.6 Wetland treatment 110 11.9.7 Marginal ore storage 110 11.9.8 Barren rock area 110 11.9.9 Overburden disposal area 111 11.9.10 Noise barrier 111 11.9.11 Drainage 111
11.10 Water circulation and supply 111 11.10.1 Process water 112 11.10.2 Raw water 112 11.10.3 Chemical feeding stations 112 11.10.4 Sewage disposal, bio-chemical 112 11.10.5 Water treatment and balance flow sheet 112
12 ENVIRONMENTAL STUDIES, LEGISLATION AND PERMITTING 114 12.1 Environmental Permit 114
12.1.1 General 114 12.1.2 Water supply and discharge 114 12.1.3 Tailings Management Facility 114 12.1.4 Dust generation and emissions to air 114 12.1.5 Noise and vibration 115 12.1.6 ROM and margin ore storage 115 12.1.7 Barren rock and overburden 115 12.1.8 Chemicals and fuel 115 12.1.9 Monitoring and reporting 115 12.1.10 Mine closure and rehabilitation plan 116 12.1.11 Environmental Bond 116
12.2 Land Use and Building 116 12.3 Mine Safety Permit 116 12.4 Equator Principles 117 12.5 Social Licence to Operate 117
13 PROJECT EXECUTION 118
Bankable feasibility study update May 28th 2014 rev 03
7
13.1 Execution and contract strategy 118 13.2 Preparation for execution phase 118
13.2.1 Project management 118 13.2.2 Pre-engineering 118 13.2.3 Permitting, land use plans and CSR activities 119 13.2.4 Procurement 119
13.3 Execution phase 119 13.4 Production start and ramp-up 119 13.5 Implementation schedule 120
14 MARKET STUDIES 121
15 CAPITAL AND OPERATIONAL COSTS 122 15.1 Capital cost estimate 122 15.2 Calculation basics for disciplines 123
15.2.1 Civil work 123 15.2.2 Machinery 124 15.2.3 Piping 124 15.2.4 Electrification 124 15.2.5 Automation 124 15.2.6 HVAC 124 15.2.7 Spare Parts 124
15.3 Capital cost estimate per departments 124 15.3.1 Mining 124 15.3.2 Crushing plant 125 15.3.3 Concentrator plant 125 15.3.4 Mine area and utilities 126 15.3.5 Indirect Costs 126 15.3.6 Contingency 127 15.3.7 Exclusions 127
15.4 Operation costs 128 15.4.1 Operation cost summary 128 15.4.2 Open pit and underground mine 129 15.4.3 Crushing plant 130 15.4.4 Rental buildings 130 15.4.5 Electrification 130 15.4.6 Electricity 130 15.4.7 Heat 130 15.4.8 Chemical consumptions 131 15.4.9 Beneficiation consumables 131 15.4.10 Salaries and other personnel costs 131 15.4.11 Spare parts 131 15.4.12 Maintenance 131 15.4.13 ICT and Telephone 131 15.4.14 General Maintenance 131 15.4.15 Environment monitoring 132 15.4.16 Laboratory services 132 15.4.17 Mine closure 132 15.4.18 Exclusions 132

Bankable feasibility study update May 28th 2014 rev 03
8
16 FINANCIAL ANALYSIS 133 16.1 Basis of economic evaluation 133 16.2 Sotkamo Silver base case 133 16.3 Sensitivity analysis 134 16.4 Cash flow 135 16.5 Conclusions 136
17 RISKS 137 17.1 Investment risk 137 17.2 Project risk 137

Bankable feasibility study update May 28th 2014 rev 03
9
Index of figures:
Figure 1 Annualized cash flow 18 Figure 2 Sotkamo Silver Mine location map 21 Figure 3 Regional geology of the TGB around the Silver Mine deposit by GTK 23 Figure 4 Stratigraphy of the Tipasjärvi greenstone belt (left) and the Taivaljärvi Formation (right)24 Figure 5 Surface plane and a vertical section of the Silver Mine deposit 25 Figure 6 Original interpretation of the GTK geophysical Sampo surveys by Niskanen 2011-12 27 Figure 7 Further 3D interpretations of the Sampo deep electromagnetic surveys 28 Figure 8 The Silver Mine decline and the Drilling Campaign 2013 drill holes 31 Figure 9 A block diagram of the Silver Mine deposit 34 Figure 10 3D model of the Silver Mine deposit 36 Figure 11 A block diagram of the Silver Mine deposit looking east 37 Figure 12 Stereographic diagram of planar and linear elements measured in the Decline. Local coordinate 38 Figure 13 A,B Deposit enveloping solid (Envelope.dtm, transparent blue), planar structural controls of the 38 Figure 14 Blockmodel inside the Envelope.dtm solid, front section Y=11340, horizontal section 39 Figure 15 Log-normal probability plot of silver samples inside ore solids. 41 Figure 16 Best continuity for logarithmic Ag grade values: 140/55. 42 Figure 17 Section Y = 11480 44 Figure 18 Ag Northing SWATH-diagrams 45 Figure 19 Au Northing SWATH-diagrams 46 Figure 20 Pb Northing SWATH-diagrams 46 Figure 21 Zn Northing SWATH-diagrams 47 Figure 22 The Silver Mine Deposit classified resource: 0 air, 1 measured, 2 indicated, 3 inferred 48 Figure 23 Possible caving types 53 Figure 24 Proposed Development (red) for mining in levels -180-120 55 Figure 25 Diversion Loop (green) in the Footwall between 120-160 m and 280-320 m levels 56 Figure 26 Silver Mine Stoping Method, example stope C180-1 57 Figure 27 Stope C180-1, Blasthole ring 10, Looking to NW 57 Figure 28 Section lines of Stope C180-1 (160 level coloured black), Planview 58 Figure 29 Section 4, Slot raise (coloured red) and widening blast holes 59 Figure 30 Section 10, Blast hole ring 60 Figure 31 The open pit 62 Figure 32 Open pit and Block model 63 Figure 33 Open pit mining plan 67 Figure 34 Underground mining plan 68 Figure 35 Crushing plant balance flow sheet 86 Figure 36 Crushing and mill feed, process flow sheet 87 Figure 37 Concentrating process flow sheet 91 Figure 38 Automation system architecture 98 Figure 39 Electric network lay-out 103 Figure 40 20 kV single line diagram 106 Figure 41 Water treatment and balance flow sheet 113 Figure 42 Silver Mine execution schedule 120 Figure 43 Silver price last 5 years (blue line is long-term average value) 134 Figure 44 Annualized cash flow, Base Case (after tax) 135

Bankable feasibility study update May 28th 2014 rev 03
10
Index of tables:
Table 1 Sotkamo Silver mine mineral resource estimate at 50 g/t Ag cut off grade 15 Table 2 Sotkamo Silver Mine ore reserve (mineral reserve) 15 Table 3 Project capex summary (1 000 €) 16 Table 4 Operation cost breakdown (year 4) 17 Table 5 Total incomes from products 1000 € in Base Case 17 Table 6 Financial parameters 19 Table 7 Sotkamo Silver Drilling Campaign 2013 Best Intersections 32 Table 8 Global statistics of all sample assays 40 Table 9 Statistics of all sample assays inside ore solids 40 Table 10 Statistics of 1 m composite samples inside ore solids and inside Blockmodel 2013_8e 40 Table 11 Surpac style parameters for interpolation inside ore solids 42 Table 12 Silver Mine block model parameters 43 Table 13 Estimation search parameters 44 Table 14 Mineral Resource Estimate of the Silver Mine Deposit 48 Table 15 Ore Reserve Estimate 49 Table 16 Open pit mining plan 66 Table 17 Underground mining plan 66 Table 18 Flotation reagents dosage 90 Table 19 Investment cost summary 123 Table 20 Capital cost breakdown, mining 125 Table 21 Capital cost breakdown, crushing plant 125 Table 22 Capital cost breakdown, concentrator plant 126 Table 23 Capital cost breakdown, mine area and utilities 126 Table 24 Operation cost breakdown (year 4) 129 Table 25 Operation cost per cost item (operation year 4 production 450 000 tpa) 129 Table 26 Mining unit prices op mining ore 129 Table 27 Product prices 133 Table 28 Zinc and Lead price forecast 134 Table 29 Resulting effects on NPV, IRR and payback time (tax included) 135 Table 30 Resulting effects on NPV, IRR and payback time before tax 135 Table 31 Detailed cash flow analysis, Base Case (after tax) 136
Bankable feasibility study update May 28th 2014 rev 03
11
Index of Appendices:
Appendix 1 Description of Silver Deposit with implications for further exploration Appendix 2 Exploration targets of Sotkamo Silver Oy on the Tipasjärvi Greenstone Belt Appendix 3 Summary of the methods and QAQC Appendix 4 Ore Reserve Audit Report by Outotec Appendix 5 Mine Area layout Appendix 6 Crushing and Conveyor System profile Appendix 7 Process plant layout Appendix 8 Process plant longitudinal and cross sections layout Appendix 9 Automation system architecture Appendix 10 Tailings management facility Appendix 11 Standard cross-section of TP and SP dam Appendix 12 Standard cross-section of TP dam at till slope Appendix 13 Map of Land Use Appendix 14 Map of Real Estate Appendix 15 Investment Cost Calculation (CAPEX) Appendix 16 Operation Cost Calculation (OPEX) Appendix 17 Profitability calculation, Base Case
Bankable feasibility study update May 28th 2014 rev 03
12
ABBREVIATIONS
ABA Acid base accounting ASL Above Sea Level A-lab Sample analysing laboratory AVI Regional State Administrative Agency BAT Best Available Techniques CCR Central Control Room CPU Central Processing Unit CSS Close Side Setting DCS Distributed Control System ELY Centre for Economic Development, Transport and the Environment G-lab Geological sample handling laboratory GTK Geological Survey of Finland (Geologian Tutkimuskeskus) HP High Pressure HVAC Heating, Ventilation and Air-Conditioning LP Low Pressure LPG Liquefied Petroleum Gas MCC Motor Control Cabinet MSDS Material safety data sheets NAF Non-acid forming OPC Open Process Control O/F Over flow (cyclone) O/S Over size (screen, filtering) PAF Potentially acid forming P-lab Process sample handling laboratory PPB Process plant building ROM Run of mine SRS Safety Related System TGB Tipasjärvi Greenstone Belt TMF Tailings Management Facility TUKES Finnish Safety and Chemicals Agency U/F Under flow (cyclone) U/S Under size (screen, filtering)

Bankable feasibility study update May 28th 2014 rev 03
13
PREFACE Sotkamo Silver commissioned CTS Engtec Oy in October 2013 to prepare a Bankable Feasibility Study Update for the Silver Mine Project in Sotkamo municipality Finland. This report contains the documents prepared including production and balance calcula-tions, process flow diagrams, mining schedule and Mineral Resource Estimate, site lay-outs as well as investment cost calculation, for the Silver Mine. Mineral Recourse Estimate, pit modelling and mine planning has been carried out by Sotkamo Silver. Dr Jyrki Parkkinen, Qualified Person under “The European Federation of Geologists” (EFG) has prepared Mineral Resource Estimate. Pekka Lovén, MSc (Min-ing), MAusIMM (CP) has audited the Ore reserve statement as competent person. The overall project scope has been to provide updated CAPEX/OPEX estimate with fi-nancial analysis based on updated Mineral Resource and Ore Reserve estimate in accord-ance with the guidelines of the JORC Code (2012), the mine evaluation and quotations of the main equipment, production and construction. CTS Engtec Oy is an international, independent heavy industry engineering consultancy. Most consultants used in the preparation of this report have over 20 years of adequate professional experience. CTS personnel who are responsible for this report has visited the Silver Mine site. This Bankable Feasibility Study update report was made in co-operation with Sotkamo Silver’s project team and CTS Engtec’s project team. Kouvola, March 24st, 2014 CTS Engtec Oy
Pekka Veisto Project Director

Bankable feasibility study update May 28th 2014 rev 03
14
1 EXECUTIVE SUMMARY
1.1 Introduction
Sotkamo Silver (SoSi) is in the process of developing the Silver Mine project of Sotkamo Silver in Finland. The Silver Mine is planned to be producing silver and zinc concen-trates during 8 years Life of Mine (LOM). The company has sales agreements with Eu-ropean smelters for both products. Total 700 ktn of ore is planned to be quarried out from open pit mine and 2,6 Mtn from underground mine. After crushing and beneficiation on site the concentrates are trans-ported by trucks to smelters, part of them to Gulf of Bothnia harbour and shipped to smelters. The Silver Mine is located in Eastern Finland in the municipality of Sotkamo, approxi-mately 475 km NE of Helsinki and 42 km from the municipality’s centre. Mine includes production decline and associated ventilation shaft down to 350 meters depth, thus ready for production. The site has a new 45 kV power line and part of mine area roads as exist-ing infra. The local road 9005 is in reasonable condition to handle the traffic both during construction and operation phase. The mining concession area is at an elevation of ap-proximately 220 m above sea level, and the surrounding area consists of smoothly undu-lating terrain, dominated by forest, bogs, and shallow lakes.
1.2 Environmental and Legal Rights
Based on legislation the Environmental Permit for the mine has been granted in April 2013. Mining concession application for the Sotkamo Silver Mine was submitted to the authorities in year 2010 and the Ministry of Employment and the Economy has granted the Mining Concession in April 2011, which covers total area of 371.44 hectares. In February 2014 SoSi received the Mine Safety Permit from the Finish Safety and Chemicals Agency (Tukes). The land area for the mining activities has been acquired in October 2011 and is fully owned by the company. The Building permit application has been submitted to local mu-nicipality.
1.3 Mineralogy and Mining
The Silver Mine deposit was found in 1980 and is located in the Tipasjärvi greenstone belt; southernmost part of the Tipasjärvi-Kuhmo-Suomussalmi (TKS) greenstone com-plex in eastern Finland. The deposit is lens shaped, dipping 65° to the southeast, plunging 60° degrees to the south-southwest, and extending to a depth of at least 550 m. The deposit has been first investigated by Kajaani Oy during 1980-1998, by Joint Ven-ture between Outokumpu Mining and UPM-Kymmene since 1988 and presently by SoSi since 2006.

Bankable feasibility study update May 28th 2014 rev 03
15
The Mineral Resource Estimate (MRE) is based on database which has analyse results from 402 drill holes with total length of 55 052 m, a combination of 184 surface and 218 underground holes. The Jorc code audited MRE is as follows:
Table 1 Sotkamo Silver mine mineral resource estimate at 50 g/t Ag cut off grade
Tonnage (kt) Ag Grade (g/t)
Measured 3 351.0 80.6
Indicated 2 660.0 87.0
Total 6 011.0 83.4
Inferred 1 340.0 76.0
The audited Ore Reserve Estimate is as follows:
Table 2 Sotkamo Silver Mine ore reserve (mineral reserve)
Tonnage (kt) Ag Grade (g/t)
Proven 1 800.0 98
Probable 1 536.0 106
Total 3 336.0 102
The ore reserve contains approx. 68 percentage of silver contained in the Measured and Indicated MRE. The ore reserves are mineable mineral resources and are included in total MRE. The mineable deposit is approximately 450 m long, and extends presently approximately 500 m from top to bottom. Below the known deposit exists zone of exploration potential down to at least 1400 meters, this zone with low resistivity has been defined by geo-physical deep-penetrating Sampo-survey. This depth potential will be investigated and eventually developed for mining while production in upper parts has commenced. The underground part of the deposit will be mined using mostly longitudinal bench and fill stoping, with rock fill, and will be mined upwards from the base of ore reserves. All operations is planned to be done by contractor. In first two years to production of ore is limited to 350 000 tpa due Environmental Permit (EP) limitations, but will be increased to 450 000 tpa since EP is updated. The total amount of ore processed is 3 336 000 t from which 708 000 t is taken from open pit. The total amount of waste rock from open pit is 3 149 000 t and from underground 1 050 000 t during LOM.
1.4 Processing
After the ore is quarried from the pit or UG mine it is crushed by contractor and con-veyed to beneficiation plant. The Silver Mine Pb-Ag-Zn ore type is amenable to pro-

Bankable feasibility study update May 28th 2014 rev 03
16
cessing by grinding and froth flotation, achieving saleable grades of lead and zinc con-centrates at acceptable recoveries at a grind size of approximately 80% passing 75 mi-crons. The two stage grinding incudes both rod and ball mills. The ore will be processed using silver-lead flotation consisting of rougher, scavenger and cleaning stages. The sil-ver-lead tailings will be further treated in a flotation circuit consisting of rougher, scav-enger and cleaning stages for zinc recovery. Zinc tailings will pass to a pyrite flotation section prior to final tailings disposal. The Silver-Gold-Lead and Zinc-Silver products will be thickened and filtered to suitable transportation moisture levels below 10 %. Py-rite-Silver concentrate is handled similarly. The Tailings Management Facility (TMF) will consist of the ordinary tailings pond 28 ha and three settling ponds and after this treatment the purified excess water will be dis-charged through wetland treatment back to nature. Process water is circulated back to plant. In first phase the plant is constructed to handle 350 000 tpa of ore and will be upgraded to 450 000 tpa production level for the third year. The average Silver- Gold-Lead concen-trate production is 1 944 tpa and Zinc-Silver concentrate production 5 032 tpa during LOM, but in first three years the Silver-Lead concentrate production is over 2 230 tpa due to higher Ag grade of the feed.
1.5 Capital and Operating Cost, Economic Evaluation
The total workforce employed by SoSi will be total 31 people. It’s estimated that out-sourced mining activities and crushing plant will have 10 people multiplied by 5 shifts. The BFS contains investment cost estimate calculation (CAPEX) and operation cost es-timate calculation (OPEX) with accuracy ±15%. Estimates are mainly based on inquiries. The total Initial Capital costs before start-up are 23.9 M€ as divided in table below.
Table 3 Project capex summary (1 000 €)
Discipline Initial Sustaining
Mine 3 013 650
Crushing and beneficiation 12 744 6 912
Site General, incl. TMF 4 213 2 187
State support ‐ 1 851
Contingency and owners cost 3 933 549
TOTAL 23 903 8 447
TOTAL PROJECT CAPEX 32 350 k€
The sustaining capital includes the investment costs of production increase to 450 000 tpa level in the second operation year, TFM area enlargement in the fourth operation year and mine closure costs. The centre of Economic Environment and Employment has granted financial support to the mining project. At this moment total 1.851 M€ is still unused and taken into account in financial calculations.

Bankable feasibility study update May 28th 2014 rev 03
17
A residual value of 8,058 M€ is used in financial calculations. The total accuracy of the cost calculation is approx. 15 % and the contingency of 5 % was used based on experience of similar projects. The average operating costs in Sotkamo Silver mine was estimated to be 1 930 €/t of concentrate products as presented in table 4. Operating costs pri-or to start-up are considered as capital cost.
Table 4 Operation cost breakdown (year 4)
Cost break down Total 1 000 €/y €/tn of ore €/tn of products
Mining 10 210 22.48 1 117
Beneficiation and Crusher 5 391 11,87 590
Site general, environmental and utilities 2 038 4.49 223
TOTAL 17 639 38.83 1 930
Total operation costs vary between 38…39,50 €/t of ore during main production phase. Main drivers for changes are mining costs, which vary from 18,90 to 23,50 €7t and pro-cessing costs including crushing which vary between 11,50 and 13,50 €/t of ore. In the first operation year the production cost per ore tonne are 18,91 € in mining and 13,33 €/ore tonne in processing. Site general cost per ore tonne are 5,87 €. The higher mining cost per ore tonne in year 4 are results from larger amounts of OP waste rock movement and more than doubling the drifting after first operation year. The Sotkamo Silver mine economical analyse base case is based on silver price of 21.50 $/oz, gold price of 1 380 $/oz, zinc price of 2 651 $/tn and lead price of 2 380 $/t. Eu-ro/USD exchange rate of 0.76 was used for product pricing. The total incomes from products in the Base Case are presented on yearly basis in fol-lowing table after smelter charge and penalties, as so called Net Smelter Return (NSR). The sum of smelter charges and penalties was calculated as total 20.55 M€ per LOM.
Table 5 Total incomes from products 1000 € in Base Case
Year AgPb conc Zn Conc Total €/tn of products
year 1 24 102 2 765 26 867 4 663 year 2 23 900 3 613 27 513 4 027 year 3 27 495 3 958 31 452 4 128 year 4 25 151 5 322 30 473 3 334 year 5 18 787 4 356 23 143 3 154 year 6 18 485 4 387 22 871 3 112 year 7 17 752 3 992 21 744 3 210 year 8 11 148 3 085 14 232 2 8499 TOTAL 166 820 31 476 198 296 3 3553 avg
Capital and operating cost estimates were generated and inputted to an economic model along with other economic inputs including product prices and exchange rates. Produc-tion data from the mining plan were also input.

Bankable feasibility study update May 28th 2014 rev 03
18
An annualized cash flow position is shown in figure 1 below.
Figure 1 Annualized cash flow
The key financial numbers of Sotkamo Silver project base case are presented in table below based on discount rate of 8 % (after tax).

Bankable feasibility study update May 28th 2014 rev 03
19
Table 6 Financial parameters
The updated Bankable Feasibility Study (BFS) has demonstrated both the technical and economic viability of the Sotkamo Silver mining project.
Bankable feasibility study update May 28th 2014 rev 03
20
2 INTRODUCTION
2.1 General
The Sotkamo Silver, (SoSi) commissioned CTS Engtec Oy (CTS) in October 2013 to prepare a Bankable Feasibility Study Update (BFS) for the Sotkamo Silver Mine Project (Project). SoSi is responsible for the whole BFS report covering parts of the BFS which are not included in CTS’ scope. CTS is an international, independent heavy industry engineering consultancy. Most con-sultants used in the preparation of this report have over 20 years of adequate professional experience.
2.2 Terms of reference and Scope of BFS Update
The overall project scope has been to provide updated CAPEX/OPEX estimate with fi-nancial analysis based on updated Mineral Resource and Ore Reserve estimate in accord-ance with the guidelines of the JORC Code (2012), the mine evaluation and quotations of the main equipment, production and construction. The scope commands the incorporation of process design, mine infrastructure and envi-ronmental studies, as well as associated operating costs for a 350 000 – 450 000 tpa op-eration to an accuracy of +/- 15%. Sotkamo Silver mine will have concentration capacity of 350 000 – 450 000 t/a. The run of mine will be mined from the open pit and the underground mines. The crushing plant will have capacity of 250 t/h and the concentrator plant capacity of 45-55 t/h. The silver mine concentration process will produce Ag-Au-Pb concentrate ca 1 550 t/a, Zn concentrate ca 3 850 t/a and S concentrate ca 9 150 t/a. The total investment cost is 32.4 M€.
Bankable feasibility study update May 28th 2014 rev 03
21
3 PROPERTY DESCRIPTION
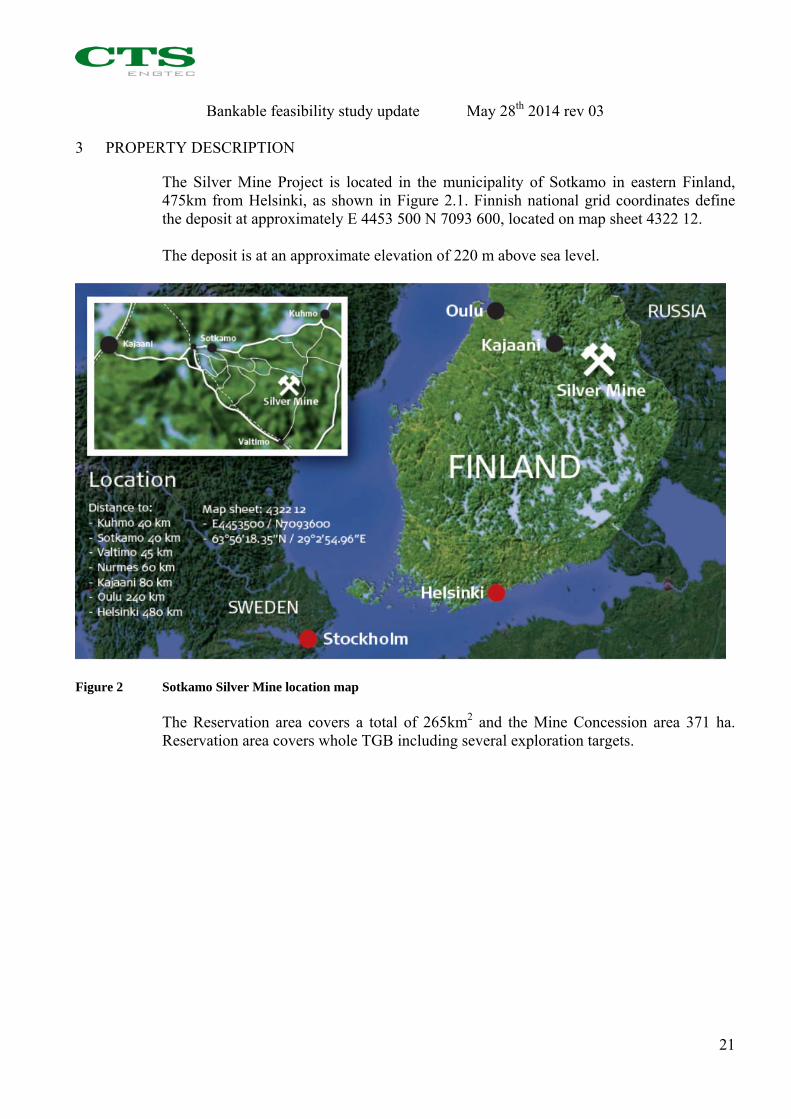
The Silver Mine Project is located in the municipality of Sotkamo in eastern Finland, 475km from Helsinki, as shown in Figure 2.1. Finnish national grid coordinates define the deposit at approximately E 4453 500 N 7093 600, located on map sheet 4322 12. The deposit is at an approximate elevation of 220 m above sea level.
Figure 2 Sotkamo Silver Mine location map The Reservation area covers a total of 265km2 and the Mine Concession area 371 ha. Reservation area covers whole TGB including several exploration targets.

Bankable feasibility study update May 28th 2014 rev 03
22
4 DEPOSIT GEOLOGY
4.1 Geological setting
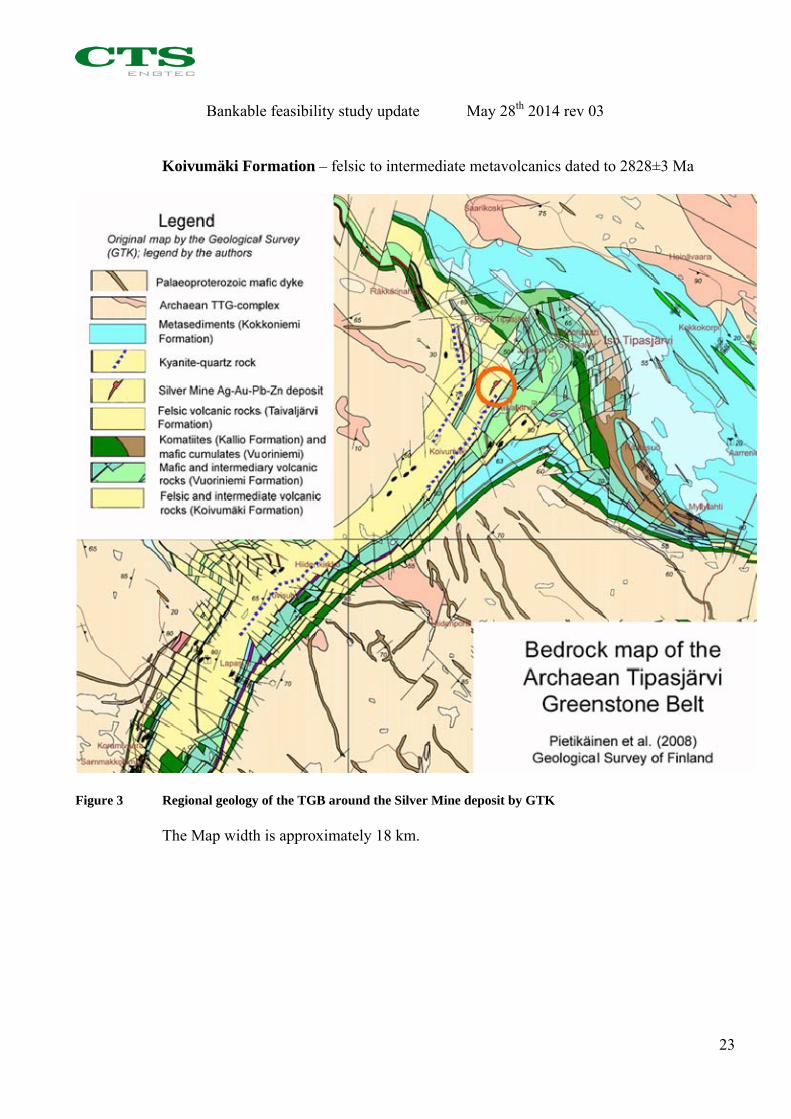
The Silver Mine deposit of Sotkamo Silver in eastern Finland is located in the Tipasjärvi Archaean greenstone belt (TGB), in the southern part of a north-south-trending about 200 km long and from 3 to 5 km wide Tipasjärvi-Kuhmo-Suomussalmi greenstone complex that is a part of the Archaean Kianta terrain. The deposit is characterized by a low content of sulphide ore minerals, 5 per cent on average, disseminated and vein-type ore textures, and the very pronounced geochemical alteration zones typical of epithermal precious metal deposits of young volcanic areas. The environment includes a few minor deposits of banded iron-formations and layers of massive pyrite, which have been targets of re-peated exploration activities by mining companies. In the 2000’s the Geological Survey of Finland (GTK) performed a thorough study on geology, geochemistry and geophysics and evaluated the prospectivity of the Tipasjärvi greenstone belt (Figure 3).
4.2 Property geology
The stratigraphic sequence in the vicinity of the Silver Mine deposit area comprises the Koivumäki Formation, as the oldest stratigraphic unit and overlying volcanic Vuo-riniemi, Kallio and Taivaljärvi Formations and the sedimentary Kokkoniemi Formation. The deposit itself is situated in the Taivaljärvi Formation. Some details of the formations from youngest to oldest units: Kokkoniemi Formation – mica schists of metasedimentary origin, maximum age 2.75 Ga. Taivaljärvi Formation – generally comprising quartz-sericite schists, interpreted as rep-resenting metamorphic equivalents of volcanic breccias, and layered tuffs and tuffites in-dicating shallow water or subaerial eruption. U-Pb isotopic ages of 2798±2 Ma indicate the termination of volcanic succession of the greenstone belt. The Silver Mine deposit is located in the middle of the Formation. An extensive 5-25 m kyanite-quartz rock layer is present approximately 100 m stratigraphically above the mineralised zone, interpreted as representing argillic alteration of a primary cap rock. The felsic rocks between the depos-it and the kyanite-quartz rock are hydrothermally altered with plagioclase replaced by K feldspar and sericite. Alteration is not recorded stratigraphically above the kyanite-quartz rock. The upper most part of the formation comprises sulphide-graphite schists and BIFs, possibly indicating a short break in volcanic activity. Overall thickness of the formation is 500m. Deformation of the formation caused the development of an antiform structure with the deposit located in the eastern limb of the antiform. The felsic pyroclastic metavolcanic rocks of the Taivaljärvi Formation are underlain by homogeneous felsic porphyry which grades transitionally into plutonic rocks of TTG series. Kallio Formation – ultramafic metavolcanics generally comprising theoleiitic basalts, thin interlayers of banded iron formations (BIF) and thin komatiitic lavas. Vuoriniemi Formation – mafic to felsic metavolcanics dominated by amphibolites, which are interpreted as representing mafic lavas, tuffs and gabbroic sills.
Bankable feasibility study update May 28th 2014 rev 03
23
Koivumäki Formation – felsic to intermediate metavolcanics dated to 2828±3 Ma
Figure 3 Regional geology of the TGB around the Silver Mine deposit by GTK The Map width is approximately 18 km.
Bankable feasibility study update May 28th 2014 rev 03
24
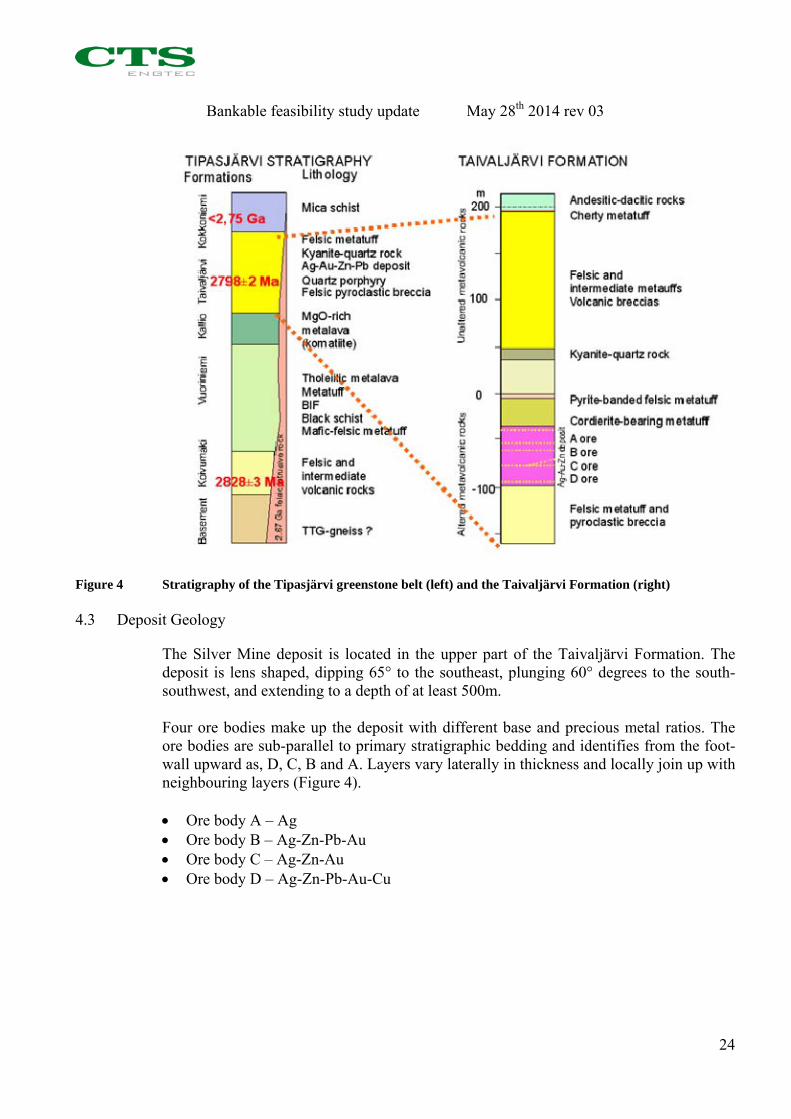
Figure 4 Stratigraphy of the Tipasjärvi greenstone belt (left) and the Taivaljärvi Formation (right)
4.3 Deposit Geology
The Silver Mine deposit is located in the upper part of the Taivaljärvi Formation. The deposit is lens shaped, dipping 65° to the southeast, plunging 60° degrees to the south-southwest, and extending to a depth of at least 500m. Four ore bodies make up the deposit with different base and precious metal ratios. The ore bodies are sub-parallel to primary stratigraphic bedding and identifies from the foot-wall upward as, D, C, B and A. Layers vary laterally in thickness and locally join up with neighbouring layers (Figure 4). Ore body A – Ag Ore body B – Ag-Zn-Pb-Au Ore body C – Ag-Zn-Au Ore body D – Ag-Zn-Pb-Au-Cu
Bankable feasibility study update May 28th 2014 rev 03
25
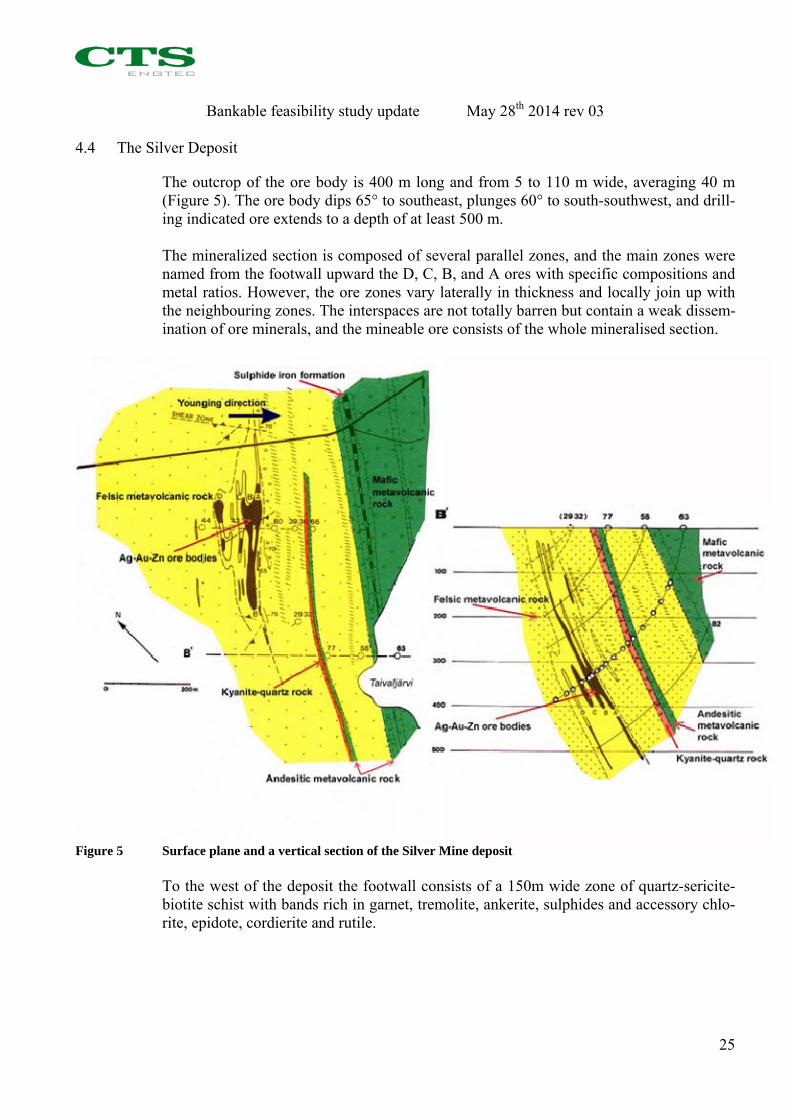
4.4 The Silver Deposit
The outcrop of the ore body is 400 m long and from 5 to 110 m wide, averaging 40 m (Figure 5). The ore body dips 65° to southeast, plunges 60° to south-southwest, and drill-ing indicated ore extends to a depth of at least 500 m. The mineralized section is composed of several parallel zones, and the main zones were named from the footwall upward the D, C, B, and A ores with specific compositions and metal ratios. However, the ore zones vary laterally in thickness and locally join up with the neighbouring zones. The interspaces are not totally barren but contain a weak dissem-ination of ore minerals, and the mineable ore consists of the whole mineralised section.
Figure 5 Surface plane and a vertical section of the Silver Mine deposit
To the west of the deposit the footwall consists of a 150m wide zone of quartz-sericite-biotite schist with bands rich in garnet, tremolite, ankerite, sulphides and accessory chlo-rite, epidote, cordierite and rutile.

Bankable feasibility study update May 28th 2014 rev 03
26
4.5 Mineralogy of the Deposit
4.5.1 Carbonates
Carbonates occur in intersecting quartz-carbonate-sulphide veins and conformable bands of the A and B ores, in calc-silicate interlayers of the D ore and in the footwall. In the A and B ores the content of carbonates varies from 6 to 8 per cent and in the C and D ores from 1 to 2 per cent. According to microprobe analyses the carbonates are commonly manganoankerites with MnO content of 3 to 6 wt per cent. The FeO content of mangano-ankerite increases from the A ore toward the footwall: in the A ore FeO is 5.27 per cent, in the D ore, 6.42 per cent, and in the footwall, 7.55 per cent; the MgO content decreases correspondingly. Mangano-calcite with 3 per cent MnO is associated with ore minerals in the quartz-carbonate veins in the B ore.
4.5.2 Ore minerals
The most important ore minerals are freibergite, dyscrasite, pyrargyrite, native silver, electrum, sphalerite, galena, and chalcopyrite. The following minerals have also been identified: pyrite, pyrrhotite, arsenopyrite, cubanite, covellite, gudmundite, acanthite, mi-argyrite, freieslebenite, bournonite, scheelite, native Sb, and native Bi. The grain size of the common sulphides varies from 0.1 to 0.5 mm and that of the Ag-bearing minerals from 0.01 to 0.1 mm. Galena and the associated Ag minerals are more abundant in the stratigraphically uppermost ore zones, where they occur in quartz-carbonate veins and bands. The sulphide content in the ore varies between 5 and 8 per cent, and more than 50 per cent of the sulphides are composed of pyrite and pyrrhotite. Silver mineralogy in the whole deposit stays basically similar, > 95% of silver occurs in sulphides and antimoni-des, galena may contain in silver-rich parts ca 0,1 % silver, in the ores with highest silver contents there exists also silver and silver-gold alloy, amount of metallic silver is small and upper cut-off 700 g/t for silver is used in our resource estimates; thus the possible nugget effect is under control. The hanging wall (to the east of the deposit) consists of quartz-sericite schists with minor cordierite and iron sulphides, and accessory sphalerite and galena.
4.6 Deposit type
Felsic volcanic breccias and coarse fragmental volcanic rocks, typical for volcanic cen-ters, characterize the Silver Mine volcanic succession. In the Silver Mine area these “Mill rocks”, acid volcanic rocks containing ejecta fragments as evidence from violent volcanic eruption, are exposed in several outcrops. These rocks containing fragments and sul-phides are often host rocks for high-value deposits of Zn-Pb-Cu-Ag and Au in Archaean Greenstone belts, thus named “mill-rocks” while one often can hear mill sound while looking at these rocks. The primary volcanic centers are high heat-flow areas, and hence probable targets for post-eruption hydrothermal activity. Although metamorphosed and deformed, the association of the ore deposit with felsic pyroclastic rocks, the stratiform setting and the compositional alteration features around the ore deposit refer to a low-sulphur epithermal deposit associated with a geothermal system.
Bankable feasibility study update May 28th 2014 rev 03
27
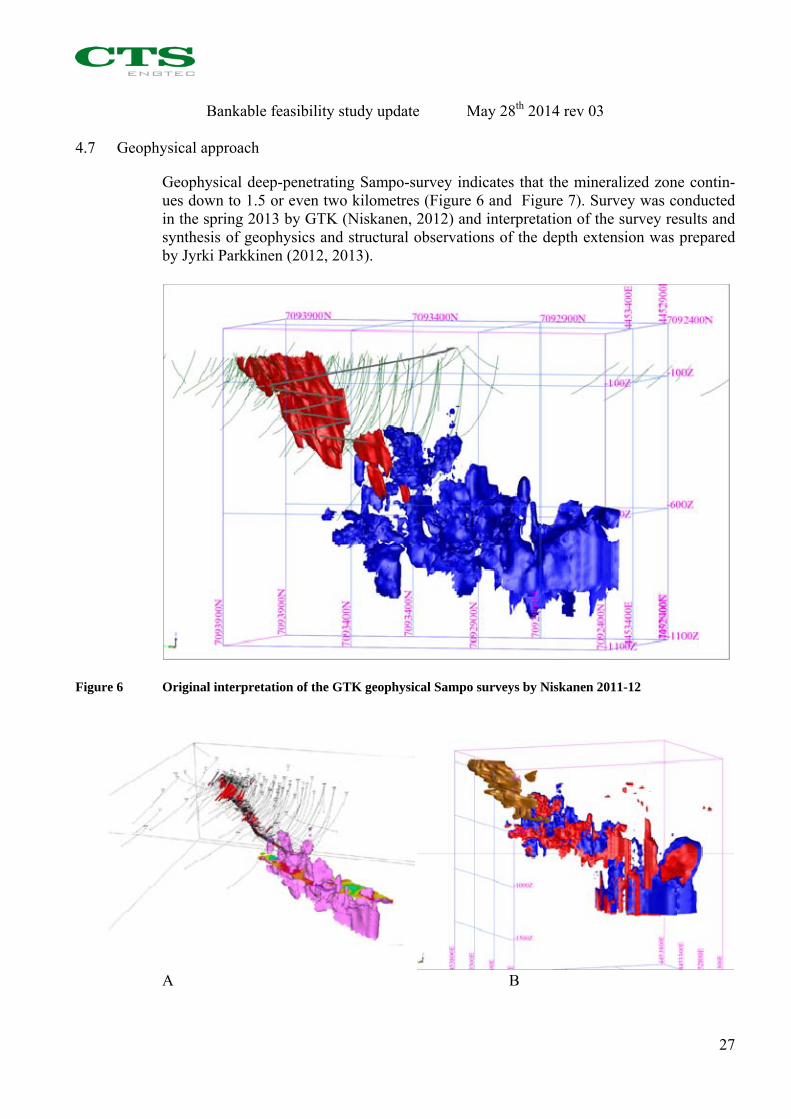
4.7 Geophysical approach
Geophysical deep-penetrating Sampo-survey indicates that the mineralized zone contin-ues down to 1.5 or even two kilometres (Figure 6 and Figure 7). Survey was conducted in the spring 2013 by GTK (Niskanen, 2012) and interpretation of the survey results and synthesis of geophysics and structural observations of the depth extension was prepared by Jyrki Parkkinen (2012, 2013).
Figure 6 Original interpretation of the GTK geophysical Sampo surveys by Niskanen 2011-12
A B

Bankable feasibility study update May 28th 2014 rev 03
28
C D
Figure 7 Further 3D interpretations of the Sampo deep electromagnetic surveys
A. 1100 Ohm’s 3D surface with –600 m grid and some mineralised zones in drill holes
B. Original anomaly interpretation by Matti Niskanen 2011. C. Adjustment of the Sampo soundings to the layered structure of the deposit by
Parkkinen 2013: with the application of geostatistics, the original depth of -1 400 m obtained by Niskanen could be extended to the depth of –2 000 m.
D. The same in horizontal projection: probable intersecting ore zones (in magenta) were recognized (shear zone)
Based on geophysical survey the depth continuation of formation containing Silver de-posit continues at least to a depth of 1 400 meters indicating huge future potential. More detailed information is presented in Appendix 1 Description of Silver Deposit with implications for further exploration.
Bankable feasibility study update May 28th 2014 rev 03
29
5 EXPLORATION WORK AT SILVER MINE
The deposit was initially discovered in 1980. Since the discovery of the deposit there have been a number of phases of exploration. Works carried out range from remote sens-ing techniques and geochemical works through to intrusive drilling investigations and development of underground drives. After discovery of the deposit Kajaani Oy, a local paper company having exploration department investigated the target by geochemical soil sampling, diamond drillings and geophysics since 1980 until 1988. Further information is presented in Appendix 2 Exploration targets of Sotkamo Silver on the Tipasjärvi Greenstone Belt
5.1 Taivalhopea
In 1988 the prospect was transferred to a joint venture between UPM-Kymmene (Kajaani Oy was merged to UPM) and Outokumpu Mining Oy, called “Taivalhopea”. It per-formed in 1988 - 1991 additional inventory drillings, concentration tests, planning of mine and concentrating plant and completed a feasibility study. In order to investigate ore quality and side rock properties the JV also constructed a 2 600 meters long produc-tion decline down to the depth level of 350 meters and opened a ventilation shaft to the level of 340 meters. Due to low metal prices in 1991 the project was put into hold.
5.2 Sotkamo Silver
In 2005 Silver Resources Oy (at present Sotkamo Silver Oy) was established. The com-pany acquired the mineral rights and all previous investigation material. The company performed additional surface and underground drillings, which presently totals to ca 53 km.
5.3 2010-2011 Sotkamo Silver exploration work
In 2010 a total of 11 surface drill holes totalling 1 750.40m was completed and followed up in 2011 by 28 underground holes (2 398.15m) and 26 surface holes totalling 2 112.80m. Surface drilling undertaken in 2010 and 2011 produced 52mm diameter core; underground drilling yielded core of 62mm diameter.
5.4 Sotkamo Silver, Drilling Campaign 2013
5.4.1 Field work and assaying
Twenty five sludge drill holes and one RC hole were run from the mine decline of the Sotkamo Silver Mine in 2013 to complement diamond drilling programs. First nine of sludge holes, numbered TS1—TS28, were drilled by Tolarock Oy with Tamrock Solo longhole-drill and with a 70 mm hole diameter. The rest of holes were drilled by Ta-pojärvi Oy with Sandvik DL 431-C longhole-drill and with a 64 mm hole diameter. The RC hole was drilled by Sotkamon Porakaivo Oy with a Casagrande C6 drill rig and with a 90 mm hole diameter. Three holes from the campaign plan remained undrilled, namely TS25-TS27.
Bankable feasibility study update May 28th 2014 rev 03
30
Sampling was undertaken by Sotkamo Silver personnel; drill sludge was led into a buck-et where sample was taken after manual homogenisation. Drilling and sampling were supervised by Mine Planner Pauli Kokkonen who has 35 years’ experience in steering underground mining operations. Sludge holes were directed according to northing vertical sections (N90E or N90W) while the RC hole was directed obliquely towards N60E. Engineer Jari Pätsi, Mitta Oy, surveyed the drilling sites and azimuthal and plunge directions of all drill holes. Sludge sampling was carried in 1.503 m long portions and RC sampling in 3 m portions. Samples were analysed by Kemian Tutkimuspalvelut Oy (Anttila & Mäkelä, 2013). Sil-ver, lead, zinc, sulphur and antimony were assayed using ICP-OES analysis. Gold was assayed by acid digestion followed by liquid-liquid extraction and AAS. Details of sam-ple preparation, analytical methods, assaying results, and quality control are described in the Appendix 3 Summary of the methods and QAQC. Four old ore samples, analysed previously by Labtium, were used as reference samples during the analytical process. The reference samples were treated and analysed among the regular test samples. Each reference sample were analysed 2-4 times during the pro-ject. Comparison of the results with those of Labtium show good correspondence. Sul-phur and antimony assays by Labtium were missing. Information about the within-batch precision was obtained by running duplicate analyses in each sample batch. In each batch 1-3 samples were analysed in duplicate. Control charts show differences from 5 % to 9 % on an average which is acceptable. Only silver charts show a few several peaks probably resulting from the nugget phenomenon causing some unpredictability in results. As shown in Section figures Campaign results were fairly good. They are in agreement with the existing models for mining with minor adjustments and they make it possible to upgrade the volume and classification of the mineral resource. Sotkamo mine decline and the Drilling Campaign 2013 drill holes are presented in Figure 8.

Bankable feasibility study update May 28th 2014 rev 03
31
Figure 8 The Silver Mine decline and the Drilling Campaign 2013 drill holes
Red intersections display mineralization with Ag-content > 50 g/t, best values are given in Table 7. Ag-content (g/t) in Figure 8 0 – 10 blue 10 – 30 green 30 – 50 yellow > 50 red

Bankable feasibility study update May 28th 2014 rev 03
32
5.4.2 Quality assurance
According to the hole survey drill hole actual azimuthal orientations differed from plan figures on an average less than +/- 5 degrees, which is acceptable. But the orientation of TS1 was 77° and the orientation of TS28 was 113.8° which means an about 13 degree difference. These holes did not reach their targets but, of course, they added a little value when ensuring already existing results. As described above, the quality control arrangements of Kemian Tutkimuspalvelut Oy were acceptable.
5.4.3 Description of results
Campaign results are given in three formats: in Best Intersections Table below, in sec-tional figures on following pages, and in assay reports by Kemian Tutkimuspalvelut (CRS) in the Appendix 3.
Table 7 Sotkamo Silver Drilling Campaign 2013 Best Intersections
Bankable feasibility study update May 28th 2014 rev 03
33
6 MINERAL RESOURCE ESTIMATES
6.1 Overview
Mineral Resource estimates have been compiled by Papunen et al. (1989), Tuokko (1991), Lappalainen (2007), and Parkkinen (2008, 2011). The latest estimate has been reviewed or audited by Lovèn (2012) and Wardell-Armstrong (2012). Present estimate is based on the database updated in 2012-2013. For more detailed information of the previous Mineral Resource Estimates is presented in the chapter 13 of the Taivaljärvi (Silver Mine) Mine Bankable Feasibility Study 2012 by Wardell-Armstrong.
6.2 Sample database
The database, Taival2013.mdb in Microsoft Access format, contains drill hole collar sur-veys, downhole surveys, assays, rock quality designation (RQD) and lithology details. Total drilling so far is 55 052 metres consisting of 402 drill holes, a combination of 184 surface and 218 underground holes. Of the latter 189 are diamond drill holes, 28 sludge holes and one RC-hole. 14 718 samples have been assayed for silver, gold, copper, lead, and zinc; 13 817 have been assayed for manganese, 3 682 for sulphur. A smaller number of samples have been assayed for arsenic, cadmium, cobalt, chromium, iron, molyb-denum, nickel and antimony.
6.3 Geological interpretation
The mineralisation at Silver Mine comprises mineralised veins and lower grade mineral-ised host rock as described by Papunen et al. (1989). The hanging wall contact is quite sharp while the footwall contact is a lot more diffuse with the mineralisation gradually zoning out. In order to wireframe the deposit, modelling was undertaken based on the distribution of silver and using the nominal cut-off grade of 50 g/t Ag. A block diagram of the Silver Mine deposit looking west is presented in Figure 9; the mineralised body is marked with red, blue indicates Ag values over 50 g/ton; local coor-dinate system.

Bankable feasibility study update May 28th 2014 rev 03
34
Figure 9 A block diagram of the Silver Mine deposit
Bankable feasibility study update May 28th 2014 rev 03
35
6.3.1 Structural analytics
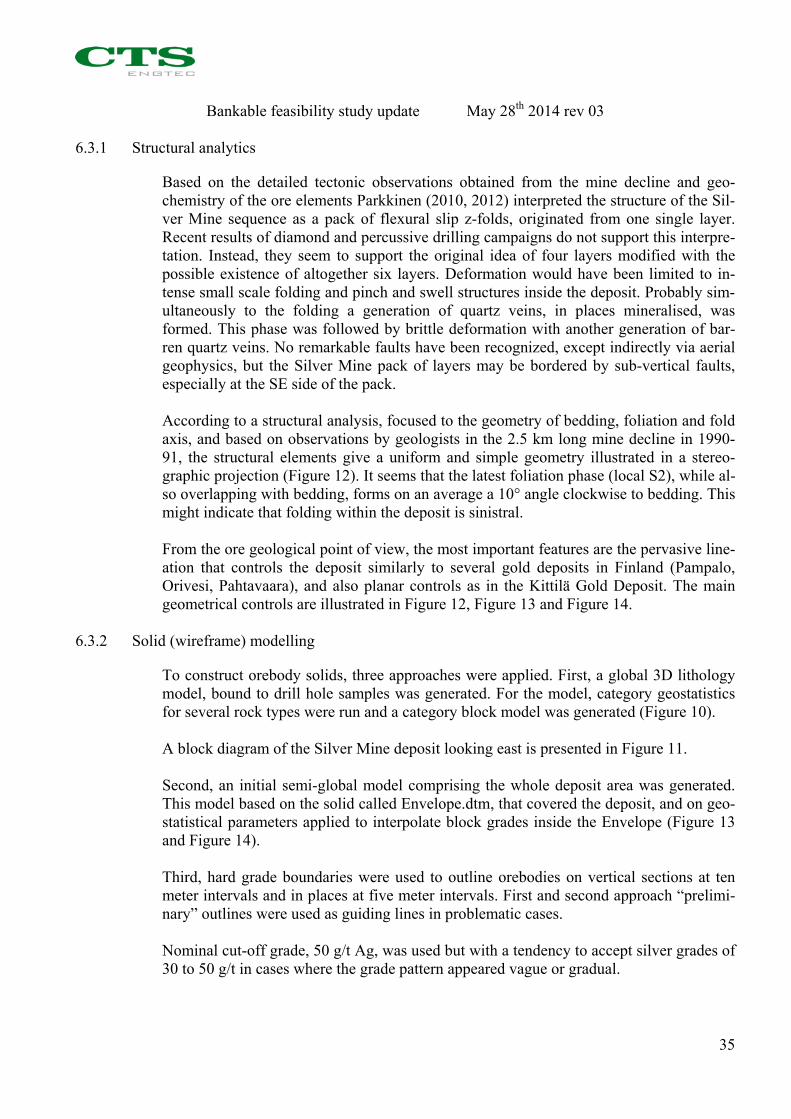
Based on the detailed tectonic observations obtained from the mine decline and geo-chemistry of the ore elements Parkkinen (2010, 2012) interpreted the structure of the Sil-ver Mine sequence as a pack of flexural slip z-folds, originated from one single layer. Recent results of diamond and percussive drilling campaigns do not support this interpre-tation. Instead, they seem to support the original idea of four layers modified with the possible existence of altogether six layers. Deformation would have been limited to in-tense small scale folding and pinch and swell structures inside the deposit. Probably sim-ultaneously to the folding a generation of quartz veins, in places mineralised, was formed. This phase was followed by brittle deformation with another generation of bar-ren quartz veins. No remarkable faults have been recognized, except indirectly via aerial geophysics, but the Silver Mine pack of layers may be bordered by sub-vertical faults, especially at the SE side of the pack. According to a structural analysis, focused to the geometry of bedding, foliation and fold axis, and based on observations by geologists in the 2.5 km long mine decline in 1990-91, the structural elements give a uniform and simple geometry illustrated in a stereo-graphic projection (Figure 12). It seems that the latest foliation phase (local S2), while al-so overlapping with bedding, forms on an average a 10° angle clockwise to bedding. This might indicate that folding within the deposit is sinistral. From the ore geological point of view, the most important features are the pervasive line-ation that controls the deposit similarly to several gold deposits in Finland (Pampalo, Orivesi, Pahtavaara), and also planar controls as in the Kittilä Gold Deposit. The main geometrical controls are illustrated in Figure 12, Figure 13 and Figure 14.
6.3.2 Solid (wireframe) modelling
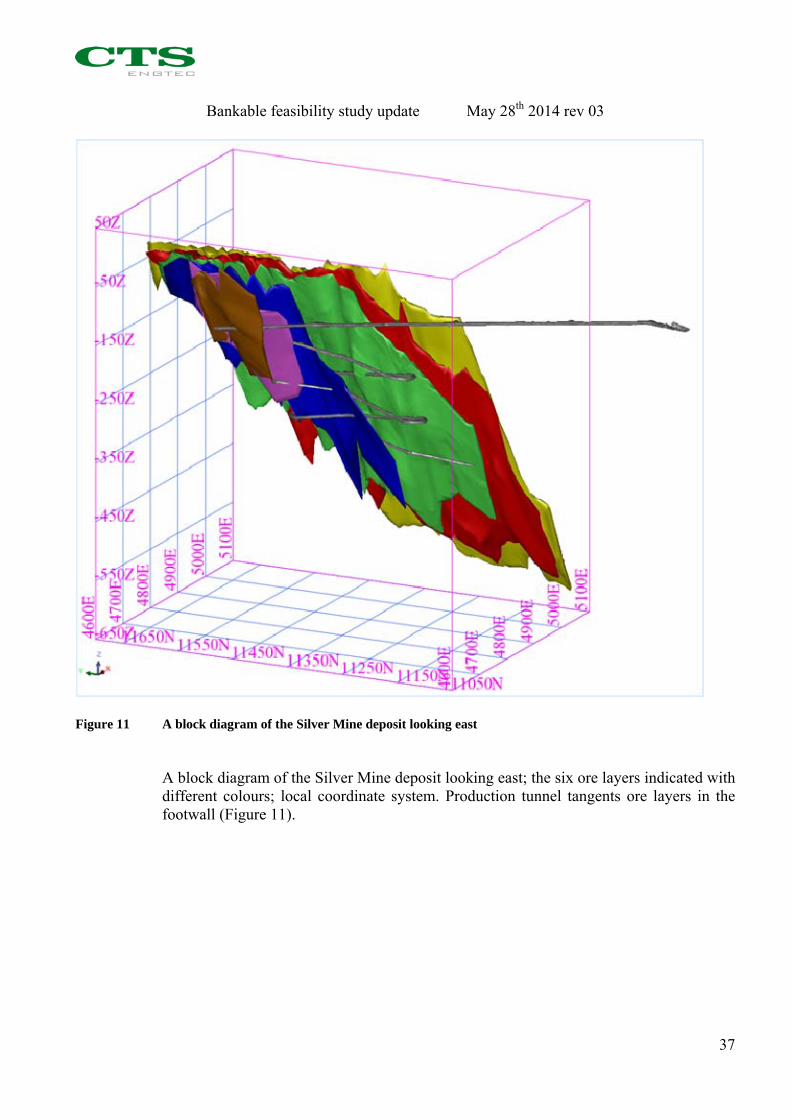
To construct orebody solids, three approaches were applied. First, a global 3D lithology model, bound to drill hole samples was generated. For the model, category geostatistics for several rock types were run and a category block model was generated (Figure 10). A block diagram of the Silver Mine deposit looking east is presented in Figure 11. Second, an initial semi-global model comprising the whole deposit area was generated. This model based on the solid called Envelope.dtm, that covered the deposit, and on geo-statistical parameters applied to interpolate block grades inside the Envelope (Figure 13 and Figure 14). Third, hard grade boundaries were used to outline orebodies on vertical sections at ten meter intervals and in places at five meter intervals. First and second approach “prelimi-nary” outlines were used as guiding lines in problematic cases. Nominal cut-off grade, 50 g/t Ag, was used but with a tendency to accept silver grades of 30 to 50 g/t in cases where the grade pattern appeared vague or gradual.

Bankable feasibility study update May 28th 2014 rev 03
36
Figure 10 3D model of the Silver Mine deposit Measured and indicated resource is red; blue is the extension of mineralization inferred with “Sampo” soundings; green lines indicate drill-holes. Production tunnel has been mined down to 350 meters level (Figure 10).
Bankable feasibility study update May 28th 2014 rev 03
37
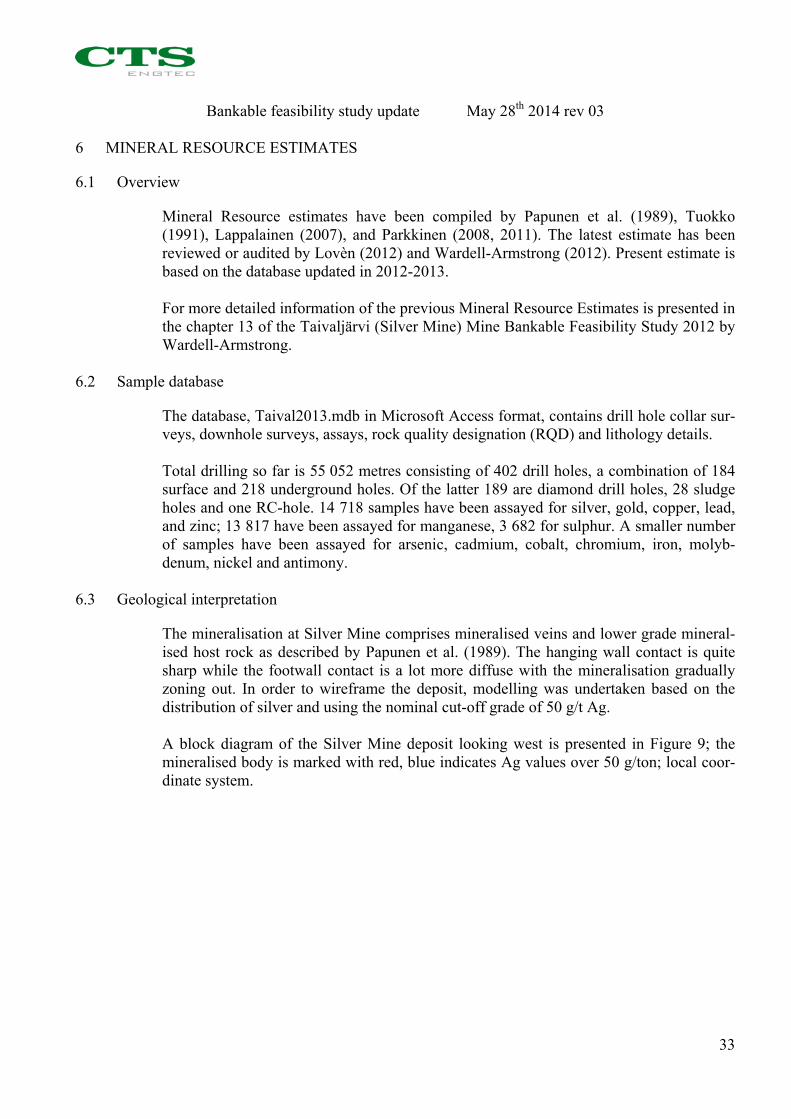
Figure 11 A block diagram of the Silver Mine deposit looking east A block diagram of the Silver Mine deposit looking east; the six ore layers indicated with different colours; local coordinate system. Production tunnel tangents ore layers in the footwall (Figure 11).
Bankable feasibility study update May 28th 2014 rev 03
38
Figure 12 Stereographic diagram of planar and linear elements measured in the Decline. Local coordinate system.
A B
Figure 13 A,B Deposit enveloping solid (Envelope.dtm, transparent blue), planar structural controls of the Deposit (green and brown), Mine Decline (brown) and drill holes (black).

Bankable feasibility study update May 28th 2014 rev 03
39
Figure 14 Blockmodel inside the Envelope.dtm solid, front section Y=11340, horizontal section Z=-100.

Bankable feasibility study update May 28th 2014 rev 03
40
6.4 Database compilation
Updated Global Database Statistics is presented in Table 2 below.
Table 8 Global statistics of all sample assays
Sotkamo Taivaljärvi Deposit: Global statistics of all samples Dec 2013Variable Ag Au Cu Mn Pb S Zn
ppm ppm ppm ppm ppm ppm ppmNumber of samples 14707 14707 14421 13816 14705 6127 14707Minimum value 0 0 0 0 0 122 0Maximum value 4700 28.62 19650 44000 99999 189000 114000Mean 34.80197 0.118044 75.24346 1653.124855 1342.187277 13555.82716 3291.644658Median 12 0.022 36 1236 499 11600 1250Variance 9 245.02 0.27 71 648.79 2 619 699.06 10 817 058.41 112 956 975.97 42 196 154.77Standard Deviation 96.15 0.52 267.67 1 618.55 3 288.93 10 628.12 6 495.86Coefficient of variatio 2.76 4.41 3.56 0.98 2.45 0.78 1.97Skewness 14.52 25.90 40.94 5.05 10.69 2.90 6.03Kurtosis 460.09 1 037.07 2 495.03 69.90 205.19 27.96 58.79
6.5 Data processing
6.5.1 Statistical analysis
Updated Mineralisation Intercept Statistics (or sample and composite statistics inside ore solids) is presented in Tables 3 and 4 below.
Table 9 Statistics of all sample assays inside ore solids
Sotkamo Taivaljärvi Deposit: statistics of sample grades inside ore solids.Cut off No upper cut off Upper cut of for Ag, Au, Pb, ZnVariable Ag Au Cu Mn Pb S Zn Ag Au Pb Zn
ppm ppm ppm ppm ppm ppm ppm ppm ppm ppm ppmNumber of samples 4301 4301 4195 4054 4299 1615 4301 4301 4301 4299 4301Minimum value 0 0 0 16 0 249 0 0 0 0 0Maximum value 4700 28.62 12800 44000 99999 189000 114000 1200 12 90000 66000Mean 85.32 0.27 122.07 2 028.28 2 865.03 17 754.48 6 275.71 83.64 0.26 2 862.24 6 199.75Median 43 0.1 57 1500 1370 15300 3140 43 0.1 1370 3140Variance 24 879.5 0.8 124 297.1 4 106 717.5 27 800 062.0 162 867 818.4 93 399 977.9 17 818.1 0.5 27 289 459.9 81 885 811.8Standard Deviation 157.7 0.9 352.6 2 026.5 5 272.6 12 762.0 9 664.4 133.5 0.7 5 223.9 9 049.1Coefficient of variatio 1.8 3.3 2.9 1.0 1.8 0.7 1.5 1.6 2.7 1.8 1.5Skewness 9.7 16.4 19.7 5.6 7.5 4.0 4.3 4.5 9.3 7.2 3.4Kurtosis 200.5 396.4 569.8 76.0 94.6 38.6 29.7 29.0 119.1 86.6 17.8 Sichel-t value 84.18
Table 10 Statistics of 1 m composite samples inside ore solids and inside Blockmodel 2013_8e
Sotkamo Taivaljärvi Deposit: statistics of 1 m composite grades inside ore solids. Sotkamo Taivaljärvi Deposit: statistics of Blockmodel_2013_8e block grades.Cut off Upper cut off for Ag, Au, Pb, Zn (1200, 12, 90 000, 66 000 g/t Upper cut off for Ag, Au, Pb, Zn (1200, 12, 90 000, 66 000 g/t)Variable Ag Au Cu Mn Pb S Zn Ag Au Cu Mn Pb S Zn
ppm ppm ppm ppm ppm ppm ppm ppm ppm ppm ppm ppm ppm ppmNumber of samples 6 628 6 628 6 473 6 202 6 627 1 788 6 628 69 116 69 116 69 116 69 116 69 116 69 116 69 116Minimum value 0 0 0 28 0 500 30 0 0 0 47 10 0 33Maximum value 1 200 12 12 800 44 000 90 000 158 864 66 000 781 8 4 372 21 144 72 938 110 240 66 000Mean 83.90 0.26 121.83 2 048.54 2 983.84 17 597.76 6 400.66 82.10 0.24 116.51 2 068.42 2 813.75 17 095.65 6 158.54Median 47.0 0.1 62.0 1 561.6 1 521.8 15 300.0 3 490.0 61.7 0.2 69.8 1 752.1 1 970.2 16 713.7 4 681.8Variance 14 504.7 0.4 88 344.3 3 500 166.0 26 394 717.0 144 367 725.1 76 253 203.7 4 374.1 0.1 37 658.1 1 633 967.1 8 468 590.8 53 996 561.1 30 937 678.8Standard Deviation 120.4 0.6 297.2 1 870.9 5 137.6 12 015.3 8 732.3 66.1 0.3 194.1 1 278.3 2 910.1 7 348.2 5 562.2Coefficient of variatio 1.4 2.4 2.4 0.9 1.7 0.7 1.4 0.8 1.3 1.7 0.6 1.0 0.4 0.9Skewness 4.3 8.9 18.4 4.9 7.4 3.2 3.3 2.5 5.9 8.2 2.5 4.9 1.2 2.8Kurtosis 28.3 118.5 602.0 63.6 93.4 27.0 17.1 12.4 68.1 95.7 16.7 56.2 10.1 16.6

Bankable feasibility study update May 28th 2014 rev 03
41
6.6 Top cutting
All sample data contained within the ore zone wireframes were selected for further data processing. This was done using the Surpac procedure, Drillhole 3DM Intersection. This data was used to determine top cut-off grade values for Ag, Au, Pb and Zn. Main emphasis was on log-normal probability plots (Figure 15), Top cut off grades are in g/t: Ag 1 200, Au 12, Pb 90 000, Zn 66 000. As to silver, two other methods for top cut off determination were checked: WAI (2012) made use of deciles and accepted the then applied top cut off value of 700 g/t for silver. This value represents the 99.6 decile of global silver samples and the 99.0 decile of silver samples inside ore solids. Respectively the presently used value, 1 200 g/t, represents the 99.9 decile of global silver samples and the 99.7 decile of silver sam-ples inside ore solids. This criterion would support a lower top cut value for silver than 1 200 g/t. On the other hand, the Sichel-t value of (non-cut) silver samples inside ore solids is higher than sample mean. This would imply that even the top cut off value of 1 200 g/t might be low.
Figure 15 Log-normal probability plot of silver samples inside ore solids.
6.7 Missing assays
Absent values were converted to zero values.
6.8 Compositing
The cоmроsitе length of 1 m was applied.
6.9 Data processing summary

Bankable feasibility study update May 28th 2014 rev 03
42
Тор cuts have bееn аррliеd of 1 200 g/t Ag, 12 g/t Au, 90 000 g/t Рb and 66 000 g/t Zn to remove outlier grades and normalise the dataset.
6.10 Variography
Variograms were produced for logarithmic grade values. Variography for silver produced parameters to be used in the grade interpolation of all elements: Ag, Au, Cu, Mn, Pb, S, and Zn (Figure 15 and Figure 16).
Figure 16 Best continuity for logarithmic Ag grade values: 140/55.
6.10.1 Variogram parameters
Parameters are shown in Table below.
Table 11 Surpac style parameters for interpolation inside ore solids
Bankable feasibility study update May 28th 2014 rev 03
43
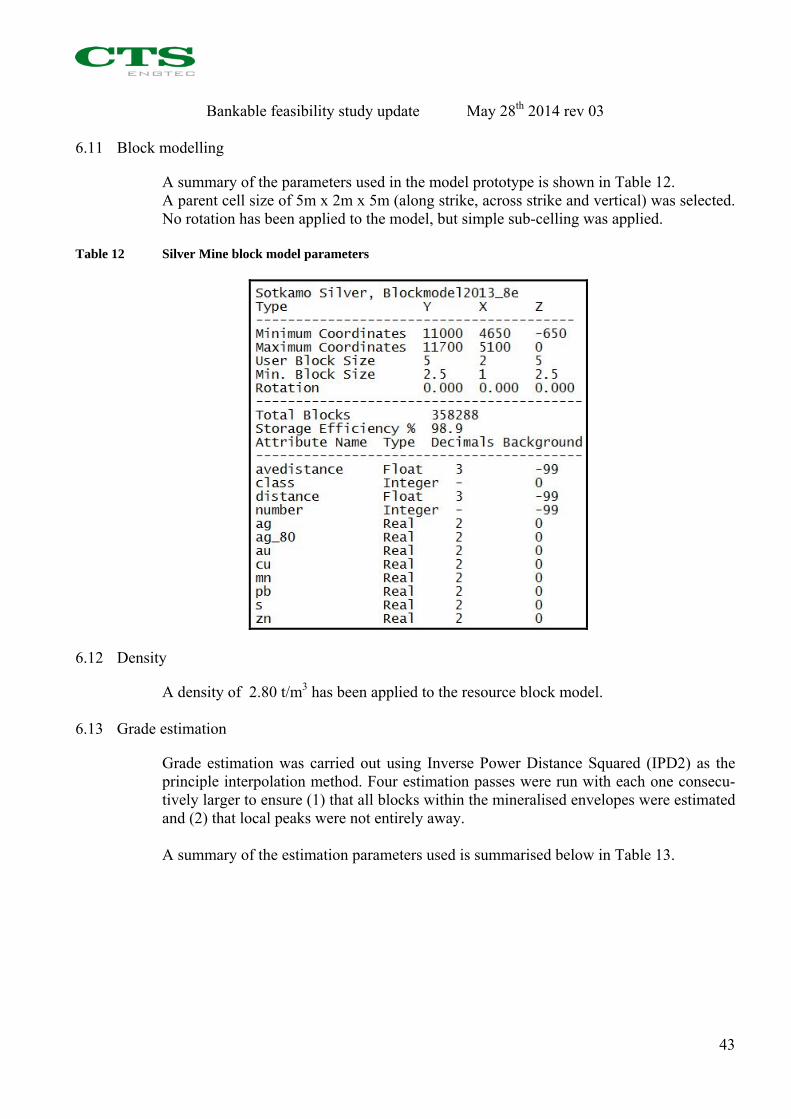
6.11 Block modelling
A summary of the parameters used in the model prototype is shown in Table 12. A parent cell size of 5m x 2m x 5m (along strike, across strike and vertical) was selected. No rotation has been applied to the model, but simple sub-celling was applied.
Table 12 Silver Mine block model parameters
6.12 Density
А density of 2.80 t/m3 has bееn аррliеd to the resource blосk model.
6.13 Grade estimation
Grade estimation was carried out using Inverse Power Distance Squared (IPD2) as the principle interpolation method. Four estimation passes were run with each one consecu-tively larger to ensure (1) that all blосks within the mineralised envelopes were estimated and (2) that local peaks were not entirely away. А summary of the estimation parameters used is summarised below in Table 13.
Bankable feasibility study update May 28th 2014 rev 03
44
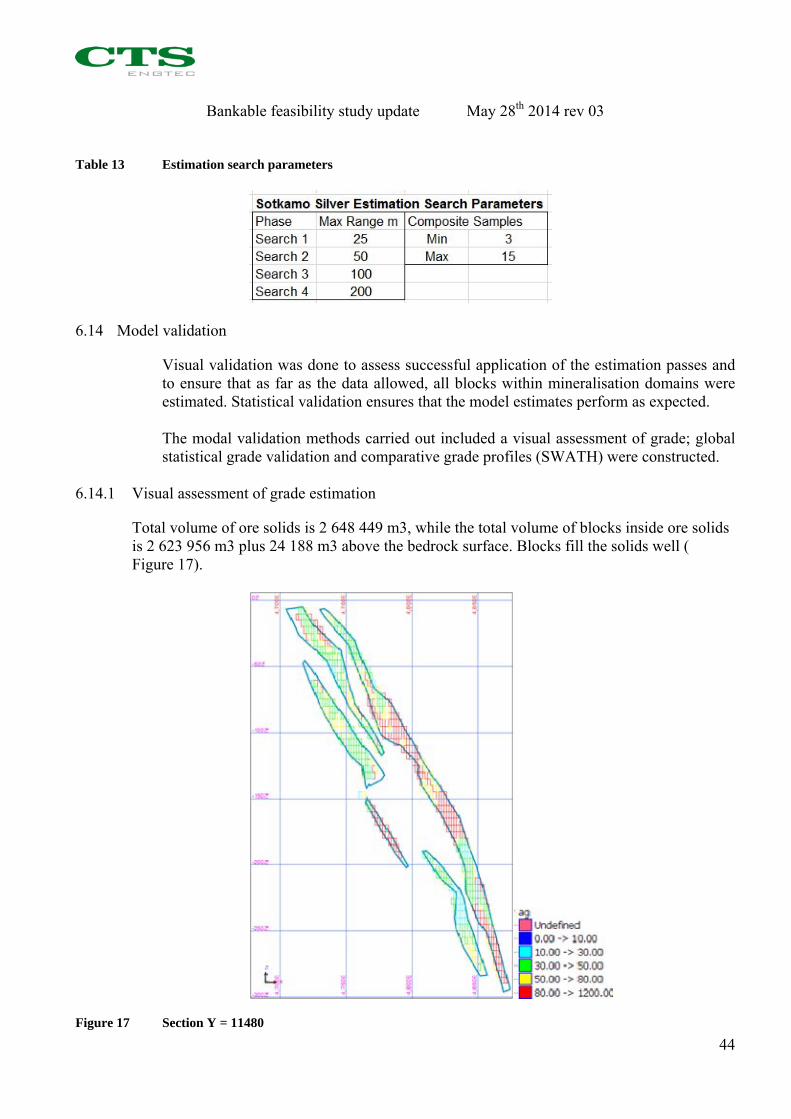
Table 13 Estimation search parameters
6.14 Model validation
Visual validation was done to assess successful application of the estimation passes and to ensure that as far as the data allowed, all blocks within mineralisation domains were estimated. Statistical validation ensures that the model estimates perform as expected. The modal validation methods carried out included a visual assessment of grade; global statistical grade validation and comparative grade profiles (SWATH) were constructed.
6.14.1 Visual assessment of grade estimation
Total volume of ore solids is 2 648 449 m3, while the total volume of blocks inside ore solids is 2 623 956 m3 plus 24 188 m3 above the bedrock surface. Blocks fill the solids well ( Figure 17).
Figure 17 Section Y = 11480

Bankable feasibility study update May 28th 2014 rev 03
45
6.14.2 Global grade validation
Tables 5 and 6 illustrate relations between mean global sample grades and sample grades inside ore solids also with top cuts for Ag, Au, Pb and Zn. Respectively, parameters compares mean composite sample grades with block grades.
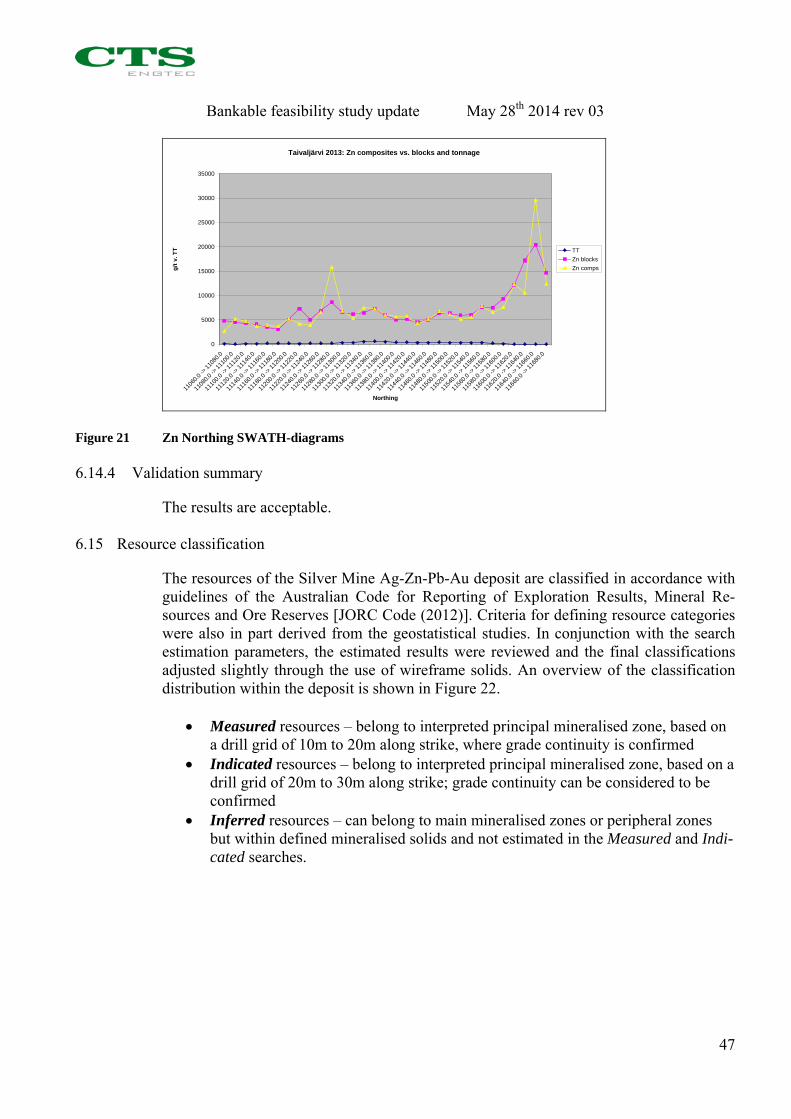
6.14.3 SWATH analysis
SWATH plots have bееn gеnеrаtеd from the model by аvеrаging both the composites and blосks along northings, eastings and vertically. The dimensions of each panel аге соntrоllеd by the dimensions of the blосk size. Each estimated grade should exhibit а сlоsе relationship to the composite data upon which the estimation is based. Examples of the SWATH plots produced аге shown in Figure 18, Figure 19, Figure 20 and Figure 21.
Taivaljärvi 2013: Ag composites vs. blocks and tonnage
0
100
200
300
400
500
600
700
1106
0.0
-> 1
1080
.0
1108
0.0
-> 1
1100
.0
1110
0.0
-> 1
1120
.0
1112
0.0
-> 1
1140
.0
1114
0.0
-> 1
1160
.0
1116
0.0
-> 1
1180
.0
1118
0.0
-> 1
1200
.0
1120
0.0
-> 1
1220
.0
1122
0.0
-> 1
1240
.0
1124
0.0
-> 1
1260
.0
1126
0.0
-> 1
1280
.0
1128
0.0
-> 1
1300
.0
1130
0.0
-> 1
1320
.0
1132
0.0
-> 1
1340
.0
1134
0.0
-> 1
1360
.0
1136
0.0
-> 1
1380
.0
1138
0.0
-> 1
1400
.0
1140
0.0
-> 1
1420
.0
1142
0.0
-> 1
1440
.0
1144
0.0
-> 1
1460
.0
1146
0.0
-> 1
1480
.0
1148
0.0
-> 1
1500
.0
1150
0.0
-> 1
1520
.0
1152
0.0
-> 1
1540
.0
1154
0.0
-> 1
1560
.0
1156
0.0
-> 1
1580
.0
1158
0.0
-> 1
1600
.0
1160
0.0
-> 1
1620
.0
1162
0.0
-> 1
1640
.0
1164
0.0
-> 1
1660
.0
1166
0.0
-> 1
1680
.0
Northing
g/t
vs.
TT TT
Ag blocks
Ag comps
Figure 18 Ag Northing SWATH-diagrams

Bankable feasibility study update May 28th 2014 rev 03
46
Taivaljärvi 2013: Au composites vs. blocks and tonnage
0
100
200
300
400
500
600
700
1106
0.0
-> 1
1080
.0
1108
0.0
-> 1
1100
.0
1110
0.0
-> 1
1120
.0
1112
0.0
-> 1
1140
.0
1114
0.0
-> 1
1160
.0
1116
0.0
-> 1
1180
.0
1118
0.0
-> 1
1200
.0
1120
0.0
-> 1
1220
.0
1122
0.0
-> 1
1240
.0
1124
0.0
-> 1
1260
.0
1126
0.0
-> 1
1280
.0
1128
0.0
-> 1
1300
.0
1130
0.0
-> 1
1320
.0
1132
0.0
-> 1
1340
.0
1134
0.0
-> 1
1360
.0
1136
0.0
-> 1
1380
.0
1138
0.0
-> 1
1400
.0
1140
0.0
-> 1
1420
.0
1142
0.0
-> 1
1440
.0
1144
0.0
-> 1
1460
.0
1146
0.0
-> 1
1480
.0
1148
0.0
-> 1
1500
.0
1150
0.0
-> 1
1520
.0
1152
0.0
-> 1
1540
.0
1154
0.0
-> 1
1560
.0
1156
0.0
-> 1
1580
.0
1158
0.0
-> 1
1600
.0
1160
0.0
-> 1
1620
.0
1162
0.0
-> 1
1640
.0
1164
0.0
-> 1
1660
.0
1166
0.0
-> 1
1680
.0
Northing
mg
/t v
s. T
T
TT
Au blocks
Au comps
Figure 19 Au Northing SWATH-diagrams
Taivaljärvi 2013: Pb composites vs. blocks and tonnage
0
2000
4000
6000
8000
10000
12000
14000
1106
0.0
-> 1
1080
.0
1108
0.0
-> 1
1100
.0
1110
0.0
-> 1
1120
.0
1112
0.0
-> 1
1140
.0
1114
0.0
-> 1
1160
.0
1116
0.0
-> 1
1180
.0
1118
0.0
-> 1
1200
.0
1120
0.0
-> 1
1220
.0
1122
0.0
-> 1
1240
.0
1124
0.0
-> 1
1260
.0
1126
0.0
-> 1
1280
.0
1128
0.0
-> 1
1300
.0
1130
0.0
-> 1
1320
.0
1132
0.0
-> 1
1340
.0
1134
0.0
-> 1
1360
.0
1136
0.0
-> 1
1380
.0
1138
0.0
-> 1
1400
.0
1140
0.0
-> 1
1420
.0
1142
0.0
-> 1
1440
.0
1144
0.0
-> 1
1460
.0
1146
0.0
-> 1
1480
.0
1148
0.0
-> 1
1500
.0
1150
0.0
-> 1
1520
.0
1152
0.0
-> 1
1540
.0
1154
0.0
-> 1
1560
.0
1156
0.0
-> 1
1580
.0
1158
0.0
-> 1
1600
.0
1160
0.0
-> 1
1620
.0
1162
0.0
-> 1
1640
.0
1164
0.0
-> 1
1660
.0
1166
0.0
-> 1
1680
.0
Northing
g/t
vs.
TT TT
Pb blocks
Pb comps
Figure 20 Pb Northing SWATH-diagrams
Bankable feasibility study update May 28th 2014 rev 03
47
Taivaljärvi 2013: Zn composites vs. blocks and tonnage
0
5000
10000
15000
20000
25000
30000
35000
1106
0.0
-> 1
1080
.0
1108
0.0
-> 1
1100
.0
1110
0.0
-> 1
1120
.0
1112
0.0
-> 1
1140
.0
1114
0.0
-> 1
1160
.0
1116
0.0
-> 1
1180
.0
1118
0.0
-> 1
1200
.0
1120
0.0
-> 1
1220
.0
1122
0.0
-> 1
1240
.0
1124
0.0
-> 1
1260
.0
1126
0.0
-> 1
1280
.0
1128
0.0
-> 1
1300
.0
1130
0.0
-> 1
1320
.0
1132
0.0
-> 1
1340
.0
1134
0.0
-> 1
1360
.0
1136
0.0
-> 1
1380
.0
1138
0.0
-> 1
1400
.0
1140
0.0
-> 1
1420
.0
1142
0.0
-> 1
1440
.0
1144
0.0
-> 1
1460
.0
1146
0.0
-> 1
1480
.0
1148
0.0
-> 1
1500
.0
1150
0.0
-> 1
1520
.0
1152
0.0
-> 1
1540
.0
1154
0.0
-> 1
1560
.0
1156
0.0
-> 1
1580
.0
1158
0.0
-> 1
1600
.0
1160
0.0
-> 1
1620
.0
1162
0.0
-> 1
1640
.0
1164
0.0
-> 1
1660
.0
1166
0.0
-> 1
1680
.0
Northing
g/t
v. T
T TT
Zn blocks
Zn comps
Figure 21 Zn Northing SWATH-diagrams
6.14.4 Validation summary
The results are acceptable.
6.15 Resource classification
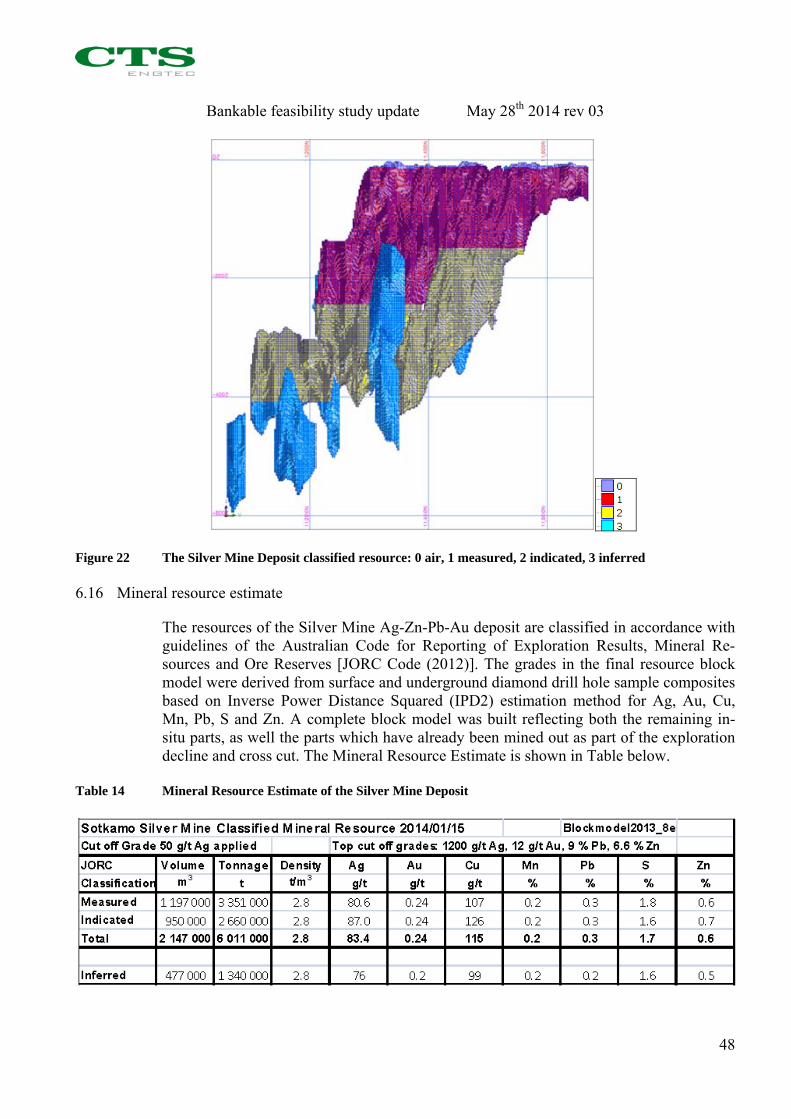
The resources of the Silver Mine Ag-Zn-Pb-Au deposit are classified in accordance with guidelines of the Australian Code for Reporting of Exploration Results, Mineral Re-sources and Ore Reserves [JORC Code (2012)]. Criteria for defining resource categories were also in part derived from the geostatistical studies. In conjunction with the search estimation parameters, the estimated results were reviewed and the final classifications adjusted slightly through the use of wireframe solids. An overview of the classification distribution within the deposit is shown in Figure 22.
Measured resources – belong to interpreted principal mineralised zone, based on a drill grid of 10m to 20m along strike, where grade continuity is confirmed
Indicated resources – belong to interpreted principal mineralised zone, based on a drill grid of 20m to 30m along strike; grade continuity can be considered to be confirmed
Inferred resources – can belong to main mineralised zones or peripheral zones but within defined mineralised solids and not estimated in the Measured and Indi-cated searches.
Bankable feasibility study update May 28th 2014 rev 03
48
Figure 22 The Silver Mine Deposit classified resource: 0 air, 1 measured, 2 indicated, 3 inferred
6.16 Mineral resource estimate
The resources of the Silver Mine Ag-Zn-Pb-Au deposit are classified in accordance with guidelines of the Australian Code for Reporting of Exploration Results, Mineral Re-sources and Ore Reserves [JORC Code (2012)]. The grades in the final resource block model were derived from surface and underground diamond drill hole sample composites based on Inverse Power Distance Squared (IPD2) estimation method for Ag, Au, Cu, Mn, Pb, S and Zn. A complete block model was built reflecting both the remaining in-situ parts, as well the parts which have already been mined out as part of the exploration decline and cross cut. The Mineral Resource Estimate is shown in Table below.
Table 14 Mineral Resource Estimate of the Silver Mine Deposit

Bankable feasibility study update May 28th 2014 rev 03
49
7 ORE RESERVE
The Ore Reserve Estimate has been audited by Outotec Mr Pekka Lovén, MAusIMM (CP), MSc (Mining), who is Competent Person in accordance with the JORC Code (2012). The audit report is presented in Appendix 4.
Table 15 Ore Reserve Estimate
The ore reserves have been estimated according to Australian JORC code (2012). Esti-mates are done with a “net smelter return cut-off” of 35 €/ton for underground-mining and 25 € /ton for open-pit mining. Ore recovery is estimated to be 90 %. A side-rock di-lution of 15 % in underground and 10 % in open-pit mining has been applied. Silver-content in diluting side-rock is estimated to be 31.3 g/ton Ag. During the first four planned production-years the silver-content will vary between 120 to 130 g/ton and gold-content will be about 0.4 g/ton. During the third planned produc-tion-year the plan-capacity is planned to increase from 350 000 tons to 450 000 tons/year. Planned production-time based on presently known reserves will be 8 to 9 years. Beside these ore reserves there are earlier published mineral resources of 1.33 million tons inferred resources with 75 g/ton silver and about 0.5 million tons containing more than 100 g/ton Ag. A substantial portion of these resources are expected to be converted
Bankable feasibility study update May 28th 2014 rev 03
50
to ore reserves in a cost-effective way, with reasonable amount of drilling from existing decline. The mineable deposit is approximately 450 m long, and extends presently approximately 500 m from top to bottom. Below the known deposit exists zone of exploration potential down to at least 1400 meters, this zone with low resistivity has been defined by geo-physical deep-penetrating Sampo-survey. This depth potential will be investigated and eventually developed for mining while production in upper parts has commenced. Below the present ore resource bottom level high silver content in drill cores have been found for example DH 106 23.4 meters at 148 g/t Ag; including 4 meters at 575 g/t Ag. Based on geophysical survey mineralised zone is wider in depth. Lower apparent resis-tivity of deep parts indicates larger amount of ore minerals.
Bankable feasibility study update May 28th 2014 rev 03
51
8 MINE DESIGN AND PLANNING
8.1 Introduction
In this study all existing information during exploration and mine planning history at Sotkamo Silver mine has been gathered in. Based on up-dated Mineral Resource a new mine plan has been prepared and has been reviewed by JORC-competent Mining Engi-neer. As parts of the mine plan new mine design, mining schedule and Ore Reserve Estimate have been prepared in accordance with the guidelines of the JORC Code (2012) for the Sotkamo Silver Mine. The mine design for the Silver Mine deposit was prepared using Surpac 6.5 software. It allows the user to design mine excavations such as development and stoping and the planner to prepare mining schedule and production rates for Life of Mine. The outcoming mining schedule and production plan includes tonnages, grade, and de-velopment metres over the Life of Mine. Factors which have been taken into account in-clude: Safety and schedule issues, deposit geometry, rock properties, shears and other weak structures, needed production rate, mine infrastructure.
8.2 Rock stability
8.2.1 Rock properties and stress status
Acid volcanic rock consisting mostly of quartz and sericite is clearly deformed and aver-age slightly weaker than Finnish bedrock average. Rock quality parameters (Report of Kajaani Oy 1986): Uniaxial Compress Strength 60 - 120 MPa Tensile strength (stress strength) 10-15 MPa Drilling index DRI 50 – 60 (average- fair good) Sharpening index of drill rigs aver. 145 m Stress strength value is low what is typical for foliated rocks, test direction defines entire-ly the result value. Lower than average Uniaxial Compress strength is explained by grain size properties of the rock, which in turn improves drill ability and sharpening index. Re-garding drill ability strong deviation/curving of drill holes in the tunnel is remarkable. Curving is caused mostly by drill pressure and rotating speed, but also weak/hard mineral combination (sericite/quartz) and strong foliation of the rock influence curving of holes. Rock bolts and generally reinforcement of the tunnel rock during tunnel mining in 1988-1990 was not done systematically while rock was seen stabile and need for reinforce-ment was seen low. During and after dewatering of the production tunnel down to 350 meters depth rock-falls have hardly been seen, and stability of tunnels and ventilation shaft is good.

Bankable feasibility study update May 28th 2014 rev 03
52
Wardell Armstrong International (2012) states that rock can be classified from good to fair where good is best estimate of the scale. Anyhow, in order to be conservative they use term fair. Based on tectonic observations three main joint directions can be defined: First main discontinuity 53/005 degrees (dip/direction)
Second main discontinuity 79/298 degrees
Third main discontinuity 23/177 degrees Rock quality designation figures describing the rock mass are following, these figures are based on observations from diamond drill holes during exploration of the deposit: RQD 87 -91 (best estimate) 50 – 60 (conservative estimate) Q-coefficient 87 (best estimate) 50 (conservative estimate) Stress survey performed by Suomen Malmi Oy (Finnexploration) in 1990 stress parame-ters of Silver Mine is typical for Finnish Bedrock in depth 0 to 300 meters. Stress can be estimated to increase linear while depth increases. (Horizontal stress average = 8,0 +0,06*depth). Results of survey by Suomen Malmi Oy are following: 1. main stress 7 – 27 MPa 2. main stress 3 -18 MPa 3. main stress 1 – 16 MPa
8.3 Stability and need for reinforcement
8.3.1 Open pit
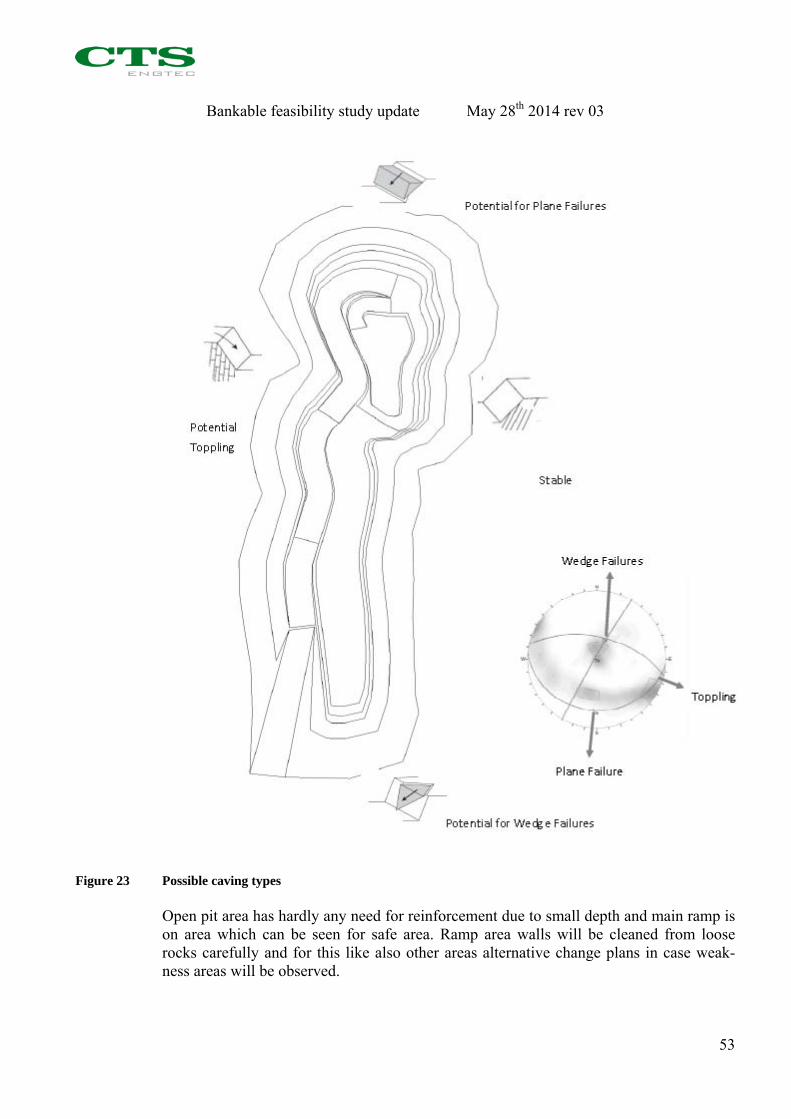
According to analysis by WAI possible caving types for open pit are described in the fol-lowing Figure 23.
Bankable feasibility study update May 28th 2014 rev 03
53
Figure 23 Possible caving types Open pit area has hardly any need for reinforcement due to small depth and main ramp is on area which can be seen for safe area. Ramp area walls will be cleaned from loose rocks carefully and for this like also other areas alternative change plans in case weak-ness areas will be observed.
Bankable feasibility study update May 28th 2014 rev 03
54
8.3.2 Underground Mine
Based on rock quality analysis and experience from tunnel need for rock support is small in the beginning of mining activity. Most likely is that tunnels showing weakness zones must be supported and areas with wider roof area will be supported systematically (mucking areas, crossings etc.). Need to support stopes is also probably low, but anyhow in certain areas like + 120 level cable bolting is required. Geology and especially biotite-sericite-schists will be mapped, this while their stability properties are expected to be lower than in other areas.
8.3.3 Risk assessment and working in risk areas
Based on existing rock mechanical information caving-in risk can be estimated to be small in open pit and also in the underground mine. This view is supported also by ob-servations in the existing tunnel: need for reinforcement is small and remarkable weak-ness zoned have not been seen. Normal rock jointing and discontinuities can be seen in the tunnel and in the ventilation rise, anyhow these can be managed with minor rein-forcement work. Discontinuities cause in places water leaking into the tunnel and rise. Open pit mining and topsoil removal while mining commences can possibly increase amount of incoming water for some time. Underground stopes will be at the begin small in size (20 000– 30 000 tons, 7 000 – 10 000 m3) and open stopes will be filled. Mining and production starts thus in small-scale and is expected to be easy to control. Empty spaces will be small (ca 10 000 m3) and thus also caving will be small. While making test stopes and collect-ing practical information stope sizes can be enlarged or modified to correspond observed rock behaviour. Empty stope spaces cause naturally stresses in nearby tunnels; these will be observed carefully during ore mining and other operations in area. Risk areas will be supported by necessary means after rock falls or caving-ins and area can be defined as non-go area. In certain areas ore stopes are next to present production tunnel; tunnel is secured for safe traffic and while mining next to tunnel by-pass tunnels have been planned.
8.3.4 Follow-up and simulation of rock mechanics
While underground mining proceeds stress filed in the area will also change. Stress simu-lation associated with experiences form mining gives good background for further mine planning. Systematic and regular surveys in open pit and underground mine give good background for forecasting of caving-ins or other risks
8.4 Underground mining methods
8.4.1 Development
Current development at the Silver Mine consists of a 5m wide by 5m high, 2 570m long decline extending from surface to a depth of 350m, and a 2.2m diameter vertical ventila-

Bankable feasibility study update May 28th 2014 rev 03
55
tion raise extending from circa 340 meters depth to surface, shaft is connected to decline at lowest level with a gently rising 70 meters long tunnel. The mine design has been done by JK-Kaivossuunnittelu using Surpac 6.5 mine planning tool. Lowest mining depth is planned to be -450 m which requires extending of the exist-ing tunnel during later production years. Mining method is planned to be longitudinal bench and fill stoping/sub-level stoping with 20 meters intervals, stopes are back-filled partly with cemented back-fill where necessary in order to give way mining of neigh-bouring stopes. The mine design also consists of level drifting, and other necessary asso-ciated development. Figure 24 shows the principle of underground development in area of first underground mining. The proposed development is shown in red, existing tunnel is shown brown.
Figure 24 Proposed Development (red) for mining in levels -180-120 Diversion loops will need to be constructed between 140-160 m and 280-320 m levels to replace the existing ramp where it is located in close proximity to proposed stoping on these levels. Anticipated by-pass tunnels are presented in Figure 25, shown green in the picture; also tunnel extension for mining of deeper parts is presented.
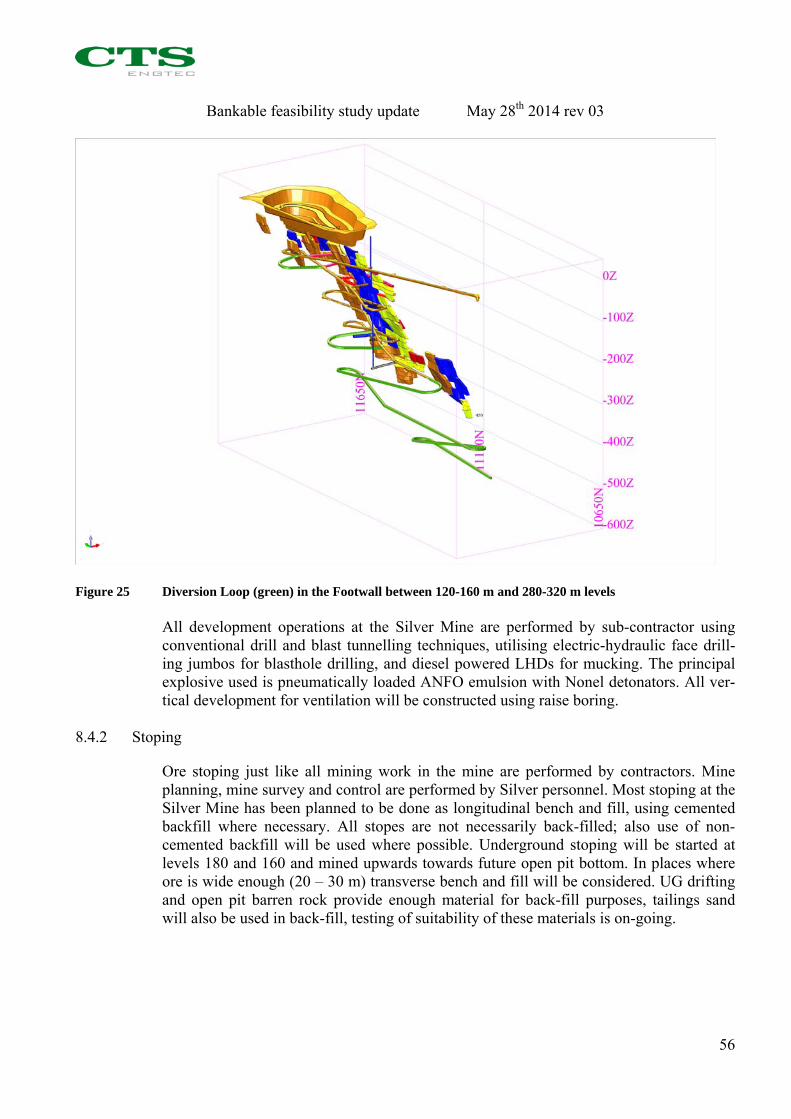
Bankable feasibility study update May 28th 2014 rev 03
56
Figure 25 Diversion Loop (green) in the Footwall between 120-160 m and 280-320 m levels All development operations at the Silver Mine are performed by sub-contractor using conventional drill and blast tunnelling techniques, utilising electric-hydraulic face drill-ing jumbos for blasthole drilling, and diesel powered LHDs for mucking. The principal explosive used is pneumatically loaded ANFO emulsion with Nonel detonators. All ver-tical development for ventilation will be constructed using raise boring.
8.4.2 Stoping
Ore stoping just like all mining work in the mine are performed by contractors. Mine planning, mine survey and control are performed by Silver personnel. Most stoping at the Silver Mine has been planned to be done as longitudinal bench and fill, using cemented backfill where necessary. All stopes are not necessarily back-filled; also use of non-cemented backfill will be used where possible. Underground stoping will be started at levels 180 and 160 and mined upwards towards future open pit bottom. In places where ore is wide enough (20 – 30 m) transverse bench and fill will be considered. UG drifting and open pit barren rock provide enough material for back-fill purposes, tailings sand will also be used in back-fill, testing of suitability of these materials is on-going.
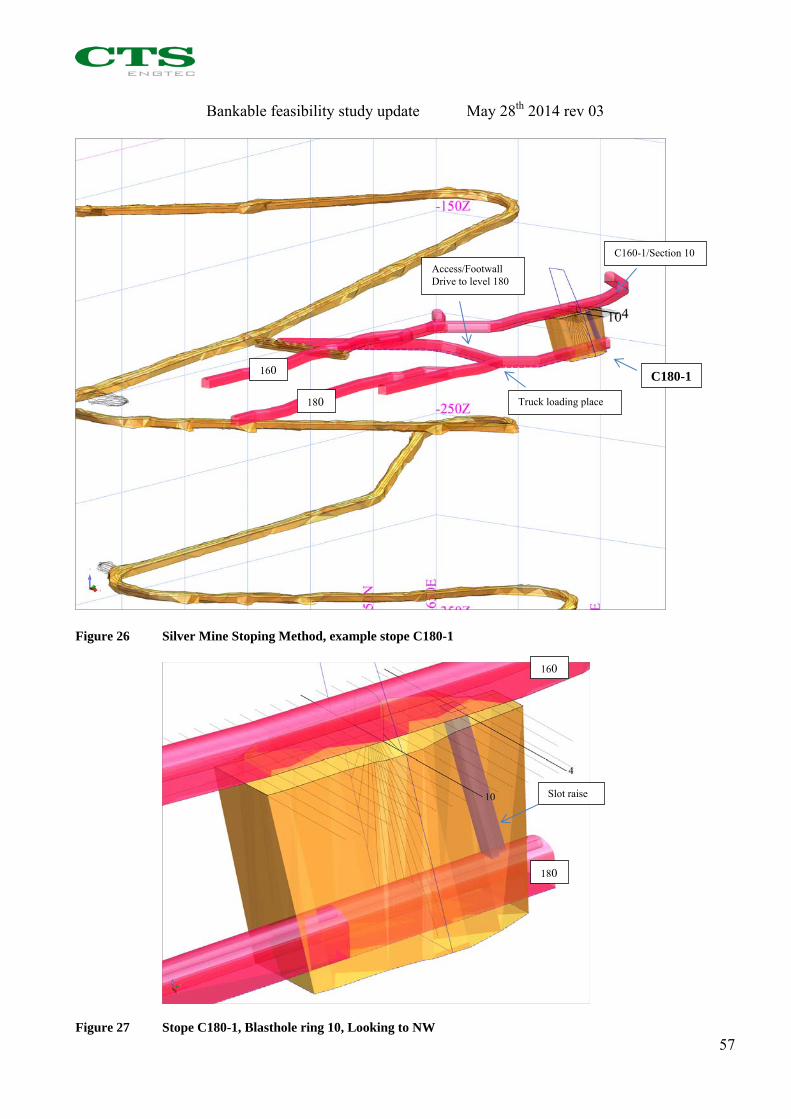
Bankable feasibility study update May 28th 2014 rev 03
57
Figure 26 Silver Mine Stoping Method, example stope C180-1
Figure 27 Stope C180-1, Blasthole ring 10, Looking to NW
160
180
Access/Footwall Drive to level 180
Truck loading place
C160-1/Section 10
C180-1
180
160
Slot raise
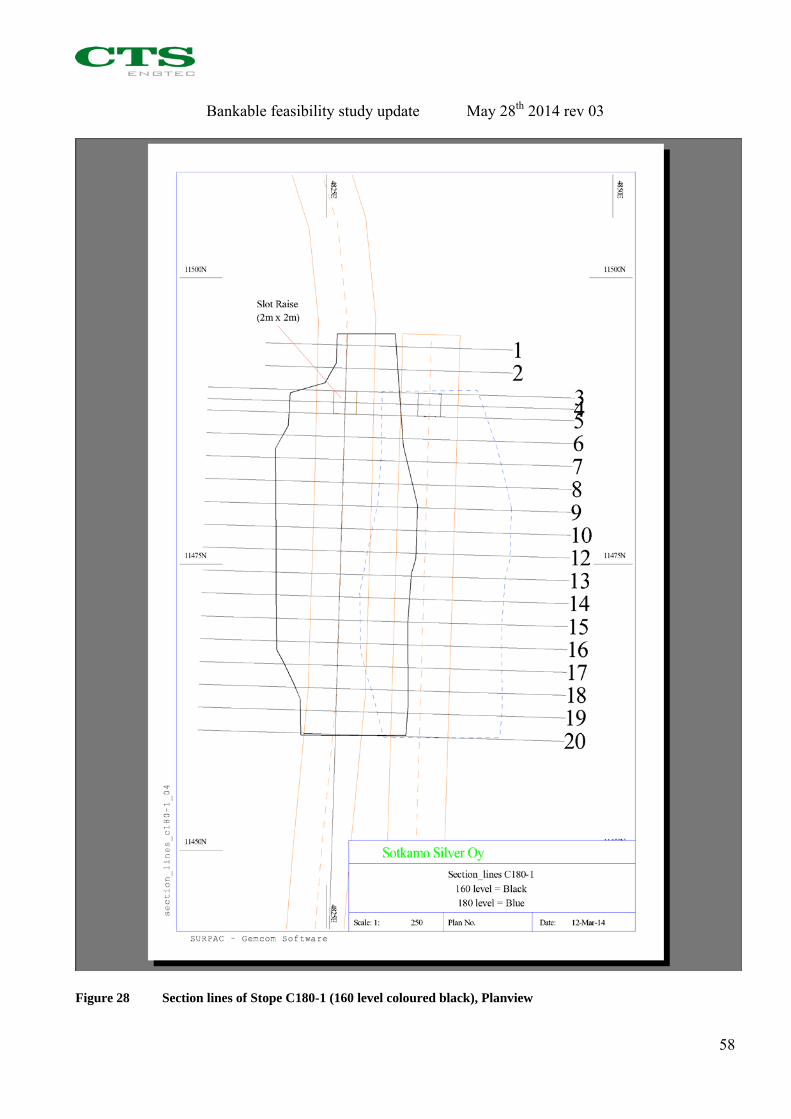
Bankable feasibility study update May 28th 2014 rev 03
58
Figure 28 Section lines of Stope C180-1 (160 level coloured black), Planview

Bankable feasibility study update May 28th 2014 rev 03
59
Figure 29 Section 4, Slot raise (coloured red) and widening blast holes

Bankable feasibility study update May 28th 2014 rev 03
60
Figure 30 Section 10, Blast hole ring

Bankable feasibility study update May 28th 2014 rev 03
61
The sequence of the mining operations is as follows: An access tunnel is driven from the footwall decline to the upper level of the orebody
(= drilling level) An access tunnel is driven from the footwall decline to the lower level of the ore-
body (= loading level, level interval appr. 20 m, drift gradient mainly 3% ) The drifts are expanded to full stope width if the width of orebody is 5 – 6 meters and af-ter this appropriate ground support is installed if seen necessary Blast holes are drilled mainly downwards from the upper level (upwards drilling only
when there is not any upper level or a better loading cone is needed at loading level) A slot-raise is developed between the levels (in example stope C180-1 slot raise and
widening blast holes are blasted leaving some 5 meters deck in first phase) Rings of blast holes are loaded and fired, starting at the slot-raise and retreating back
to mucking point (Figure 28, Figure 29 and Figure 30; C180-1 slot raise and rings 1 – 5 are blasted breakthrough altogether in one blast, next blast is for ex. rings 6 – 8)
Ore is mucked using LHDs (remote-controlled when needed) and loaded onto trucks for transport to the crusher
Primary stopes are backfilled mainly with cemented slurry mixed with barren rock and secondary stopes are backfilled only with barren rock. Backfill (cemented) is placed in the stope using drillholes and pipes from surface to the drilling level and waste rock is unloaded from drilling level or through the slot raise of overlaying stope
When the stope is completely backfilled the top of the fill forms the mucking floor of the overlying stope.
The maximum stope dimensions will be 20 m high, length some 60 -70 m along strike, and the width depending the orebody up to 30 meters. Production will follow basically a primary-secondary stope sequence. All operations are conducted using electric-hydraulic production drilling jumbos, diesel LHDs and diesel dump trucks.
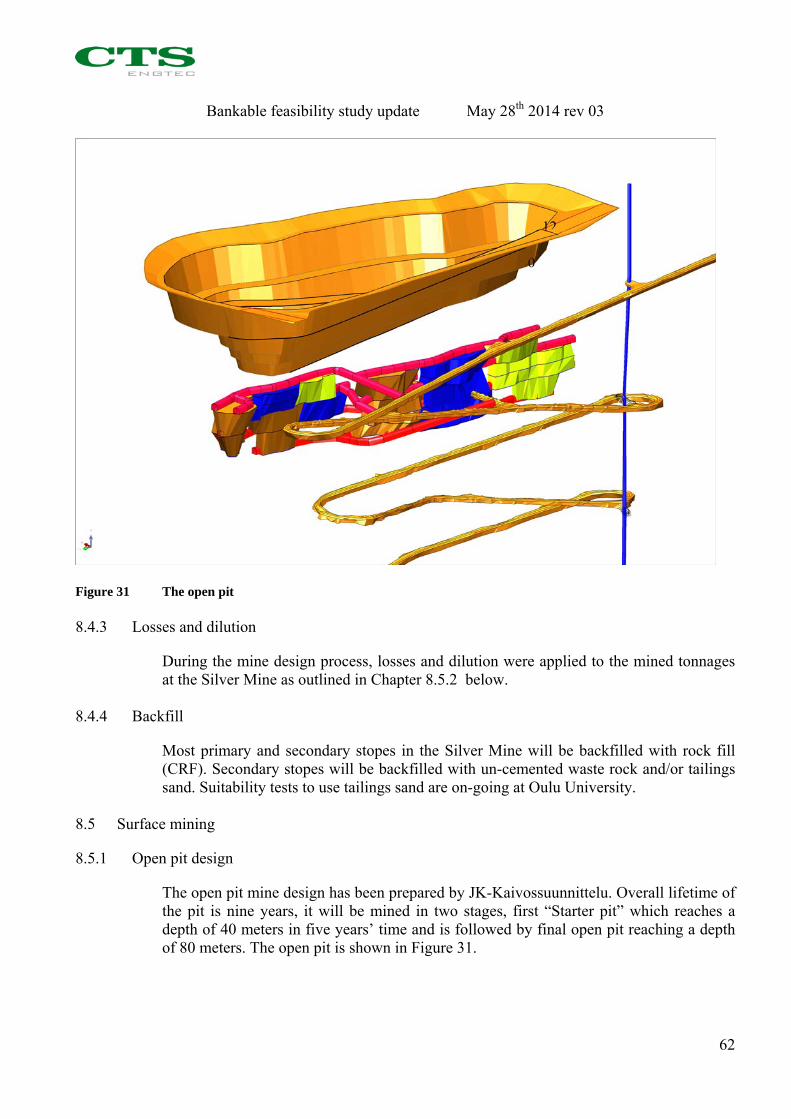
Bankable feasibility study update May 28th 2014 rev 03
62
Figure 31 The open pit
8.4.3 Losses and dilution
During the mine design process, losses and dilution were applied to the mined tonnages at the Silver Mine as outlined in Chapter 8.5.2 below.
8.4.4 Backfill
Most primary and secondary stopes in the Silver Mine will be backfilled with rock fill (CRF). Secondary stopes will be backfilled with un-cemented waste rock and/or tailings sand. Suitability tests to use tailings sand are on-going at Oulu University.
8.5 Surface mining
8.5.1 Open pit design
The open pit mine design has been prepared by JK-Kaivossuunnittelu. Overall lifetime of the pit is nine years, it will be mined in two stages, first “Starter pit” which reaches a depth of 40 meters in five years’ time and is followed by final open pit reaching a depth of 80 meters. The open pit is shown in Figure 31.
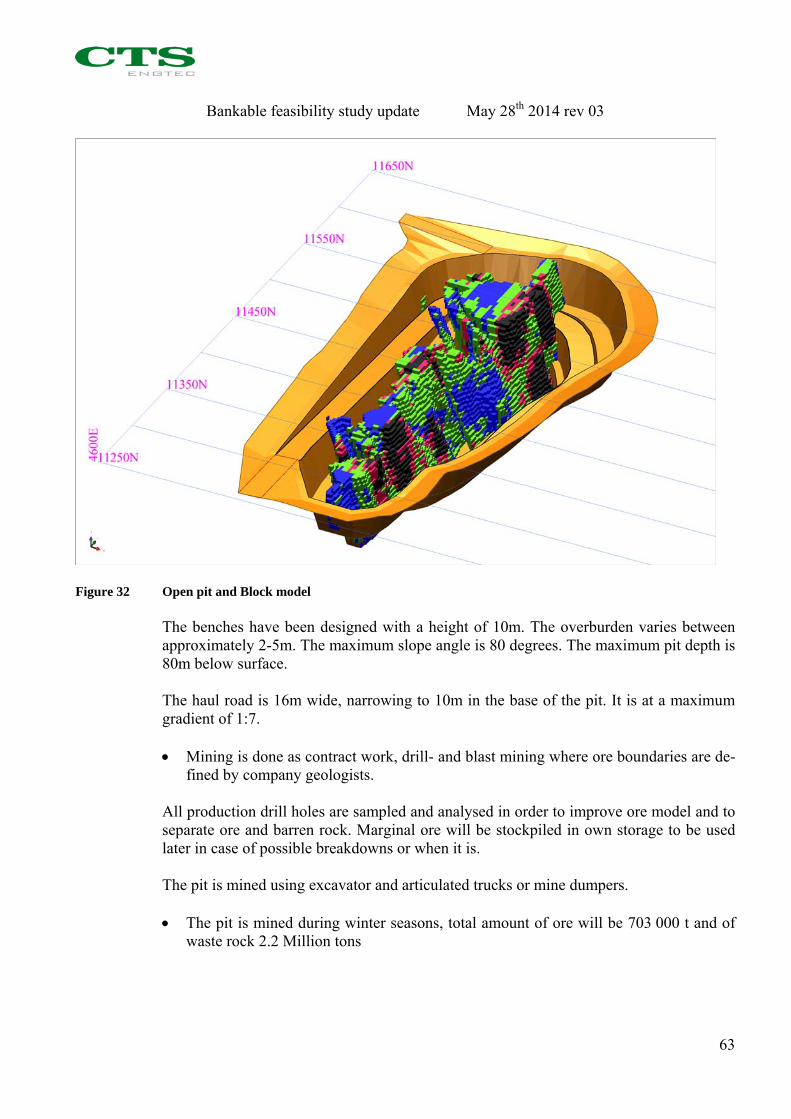
Bankable feasibility study update May 28th 2014 rev 03
63
Figure 32 Open pit and Block model The benches have been designed with a height of 10m. The overburden varies between approximately 2-5m. The maximum slope angle is 80 degrees. The maximum pit depth is 80m below surface. The haul road is 16m wide, narrowing to 10m in the base of the pit. It is at a maximum gradient of 1:7. Mining is done as contract work, drill- and blast mining where ore boundaries are de-
fined by company geologists.
All production drill holes are sampled and analysed in order to improve ore model and to separate ore and barren rock. Marginal ore will be stockpiled in own storage to be used later in case of possible breakdowns or when it is. The pit is mined using excavator and articulated trucks or mine dumpers. The pit is mined during winter seasons, total amount of ore will be 703 000 t and of
waste rock 2.2 Million tons
Bankable feasibility study update May 28th 2014 rev 03
64
8.5.2 Losses and dilution
During the mine design process, ore dilution factor was applied to the mined tonnages at the Silver Mine as outlined below. Mining Dilution: Underground mining: 15%, Open pit mining: 10%. Mining Recovery of planned stopes: 90%. Mine plans have been reviewed by an external expert. The review work has been done by Pekka Lovén, MSc(Mining), MAusIMM(CP) of Ou-totec (Finland) Oy, a Competent Person as defined by Joint Ore Reserves Committee (JORC, 2012). His review report is presented in Appendix 4.
8.6 Infrastructure
The location and specification of the surface infrastructure associated with the under-ground mine is presented in Chapter 10 and Appendix 5 Mine Area Layout.
8.6.1 Ore and barren rock extraction/transportation
Ore and barren rock extraction at the Silver Mine is carried out using trackless equip-ment, principally diesel powered dump trucks and LHDs, to transport ore up the decline to surface Run of Mine ore storage adjacent to the underground mine portal.
8.6.2 Ventilation
Primary ventilation incorporates a 2.2m diameter down-draft ventilation shaft, with the exhaust airflow exiting up the decline. A fan will be mounted on the shaft collar, and dur-ing normal operation will blow air down the shaft at 100 m3/s. In an emergency situation, the fan direction can be reversed to exhaust air up the shaft. The fan will also incorporate a heat exchanger in order to warm the air during the winter. Secondary ventilation will consist of secondary fans and flexible ventilation ducts in each active heading.
8.6.3 Electricity
Electrical power will be required underground for ventilation, pumping and drilling. The main power consumers will be the electro-hydraulic drilling jumbos and the primary ven-tilation fan. Other significant power consumers will include the other drilling equipment, water pumps, and secondary ventilation fans. Electrical power will be supplied through a single armoured 20kV cable, running through a drill hole from surface. At intervals along the decline, portable power transformers will be located, fed from the main HV cable. Portable switchgear will be located close to each active heading or stope to power the drills and the secondary ventilation fans.
Bankable feasibility study update May 28th 2014 rev 03
65
8.6.4 Pumping
Underground pumping stations will be located on the 335, 250, 165 and 75 levels. Each pumping station will be equipped with a raw water pool with sedimentation basin, and local level controls. Underground water will be pumped from the lower level pump sta-tion up to the next level, and so on until ground level. Mine head water will be pumped with immersion pumps to the nearest underground pumping station. Open pit and underground water will be pumped to the tailings pond using the open pit pump station.
8.6.5 Crushing and fine ore storage
The mine crushing and conveyors will operate at 250t/h. It will consist of a jaw crusher, a vibrating screen, and a cone crusher, linked with belt conveyors. The crushing plant will operate 8 hours per day, 5 days per week, which corresponds to an average of 168t/h crushed fine ore feed capacity, producing 350 000 – 450 000 t/a of 25 mm crushed fine ore storage. The crushed ore will be stored in a 6 000t silo with 6 days of buffer storage to allow the concentrator plant to run when the crushing plant is not operating.
8.6.6 Mining equipment
The mining production fleet will be provided by the contractor for the open pit and un-derground operations.
8.6.7 Technical services, personnel and contractors
Technical services and project management will be provided by Sotkamo Silver.
8.7 Mining plan and schedule
8.7.1 Open pit
Open pit mining will be done in two stages. Starter pit will be mined in four years, on top of that pit expansion into final pit four additional years down to +80 meters depth. Open pit mine is presented in Figure 33. Open pit mining plan is presented in Table below.
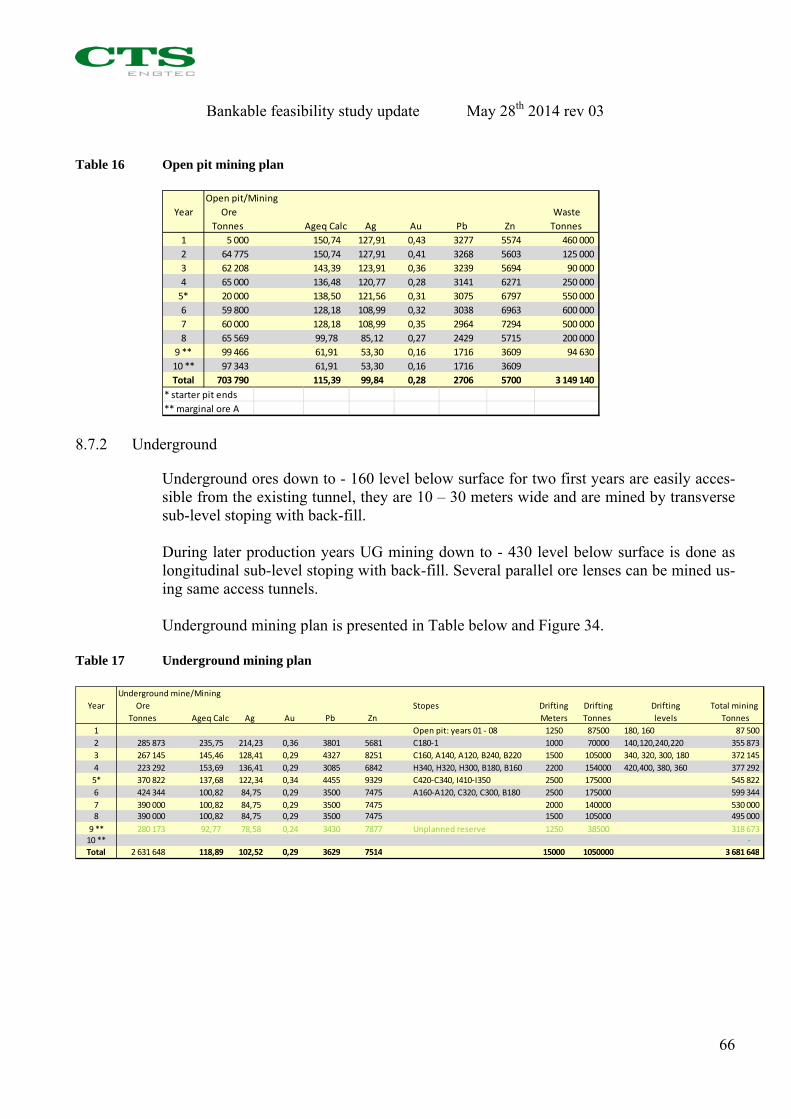
Bankable feasibility study update May 28th 2014 rev 03
66
Table 16 Open pit mining plan
Open pit/Mining
Year Ore Waste
Tonnes Ageq Calc Ag Au Pb Zn Tonnes
1 5 000 150,74 127,91 0,43 3277 5574 460 000
2 64 775 150,74 127,91 0,41 3268 5603 125 000
3 62 208 143,39 123,91 0,36 3239 5694 90 000
4 65 000 136,48 120,77 0,28 3141 6271 250 000
5* 20 000 138,50 121,56 0,31 3075 6797 550 000
6 59 800 128,18 108,99 0,32 3038 6963 600 000
7 60 000 128,18 108,99 0,35 2964 7294 500 000
8 65 569 99,78 85,12 0,27 2429 5715 200 000
9 ** 99 466 61,91 53,30 0,16 1716 3609 94 630
10 ** 97 343 61,91 53,30 0,16 1716 3609
Total 703 790 115,39 99,84 0,28 2706 5700 3 149 140
* starter pit ends
** marginal ore A
8.7.2 Underground
Underground ores down to - 160 level below surface for two first years are easily acces-sible from the existing tunnel, they are 10 – 30 meters wide and are mined by transverse sub-level stoping with back-fill. During later production years UG mining down to - 430 level below surface is done as longitudinal sub-level stoping with back-fill. Several parallel ore lenses can be mined us-ing same access tunnels. Underground mining plan is presented in Table below and Figure 34.
Table 17 Underground mining plan
Underground mine/Mining
Year Ore Stopes Drifting Drifting Drifting Total mining
Tonnes Ageq Calc Ag Au Pb Zn Meters Tonnes levels Tonnes
1 Open pit: years 01 ‐ 08 1250 87500 180, 160 87 500
2 285 873 235,75 214,23 0,36 3801 5681 C180‐1 1000 70000 140,120,240,220 355 873
3 267 145 145,46 128,41 0,29 4327 8251 C160, A140, A120, B240, B220 1500 105000 340, 320, 300, 180 372 145
4 223 292 153,69 136,41 0,29 3085 6842 H340, H320, H300, B180, B160 2200 154000 420,400, 380, 360 377 292
5* 370 822 137,68 122,34 0,34 4455 9329 C420‐C340, I410‐I350 2500 175000 545 822
6 424 344 100,82 84,75 0,29 3500 7475 A160‐A120, C320, C300, B180 2500 175000 599 344
7 390 000 100,82 84,75 0,29 3500 7475 2000 140000 530 000 8 390 000 100,82 84,75 0,29 3500 7475 1500 105000 495 000
9 ** 280 173 92,77 78,58 0,24 3430 7877 Unplanned reserve 1250 38500 318 673 10 ** ‐
Total 2 631 648 118,89 102,52 0,29 3629 7514 15000 1050000 3 681 648
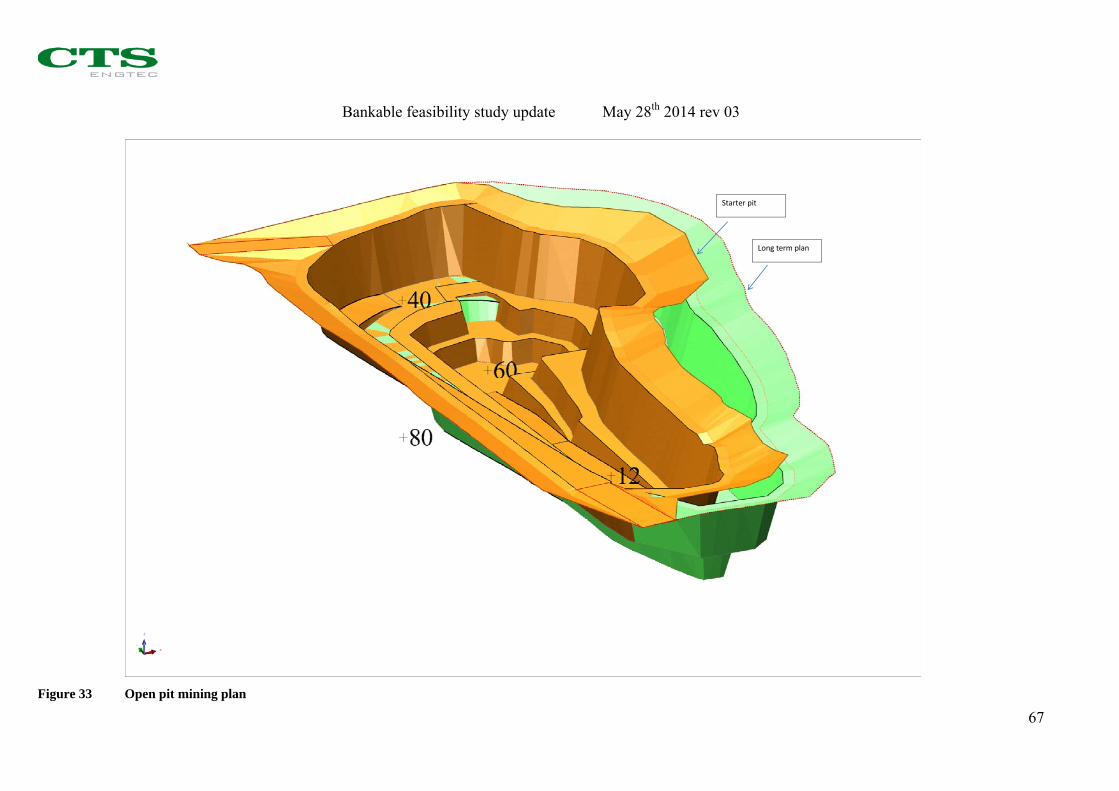
Bankable feasibility study update May 28th 2014 rev 03
67
Long term plan
Starter pit
Figure 33 Open pit mining plan

Bankable feasibility study update May 28th 2014 rev 03
68
Figure 34 Underground mining plan
Bankable feasibility study update May 28th 2014 rev 03
69
9 MINERAL PROCESSING AND METALLURGICAL TESTING
9.1 Introduction
The Silver Mine deposit, consisting of four ore bodies with different base metal and pre-cious metal ratios, has been categorised into three types of mineralisation. These are re-ferred to as: 1. Silver mineralisation; 2. Silver-zinc-lead mineralisation; and 3. Low-grade footwall mineralisation. In 2009 GTK commenced a programme of metallurgical testing to evaluate the pro-cessing requirements of the Silver Mine mineralisation, to produce saleable silver-lead and zinc concentrates. The programme consisted of bench scale batch and locked cycle testing, culminating in 2011 with pilot plant testing of 88 tn of ore. Based on the GTK investigation, a concentration plant was designed to treat 350 000 t/a of ore with average grading, 105 g/t silver, 0.4 g/t gold, 0.8% zinc and 0.4% lead. The ore will be processed using silver-lead flotation consisting of rougher, scavenger and cleaning stages. The silver-lead tailings will be further treated in a flotation circuit con-sisting of rougher, scavenger and cleaning stages for zinc recovery. Zinc tailings will pass to a pyrite flotation section prior to final tailings disposal. The average (dry) concentrate production is forecast to be: Ag-Au-Pb Concentrate 1 550 t/a Zn Concentrate 3 850 t/a Pyrite Concentrate 9 150 t/a
9.2 GTK metallurgical testing 2009
9.2.1 Test sample
In 2009 sample of site stockpile ore from the Silver Mine deposit was sent to GTK Min-eral Processing Laboratory for bench scale testing. The objective of the study was to in-vestigate if ageing of the ore in the stockpile had affected the beneficiation characteristics of the sample. The sample had been stored in open air at the Silver Mine site since 1991. The test performed consisted of crushing grinding and flotation. The regime utilised for the bench-scale test was said to follow the processes developed for the Silver Mine ore by VTT in the late 80’s.

Bankable feasibility study update May 28th 2014 rev 03
70
9.2.2 Bench scale test results
The results are summarised as follows: A lead recovery of 83.9% was obtained to a lead cleaner concentrate grading 60.1%
Pb; A silver recovery of 74.1% was achieved to the lead cleaner concentrate grading at
1.4% Ag; A gold recovery of 73.5% to the lead cleaner concentrate was achieved at a grade of
43.6 g/t; A zinc recovery into the zinc cleaner concentrate was 88% at a 52.6% zinc grade; and The calculated head grades of the sample are reported as 1.45% Pb, 3.52% Zn, 382g/t
Ag and 1.2g/t Au. GTK concluded that, based on the results, ageing had not affected the processing charac-teristics of the ore sample and that the results were comparable to the earlier tests.
9.3 GTK metallurgical testing 2011
9.3.1 Test samples
Three ore samples, 60kg each, were submitted to GTK Mineral Processing Laboratory in February 2011. The samples were labelled based on the silver grade and designated as follows: Ag 50; Ag 100; and Ag 150. Each sample was crushed to 100% passing 4mm, homogenised and split into representa-tive sub-samples for head assays and flotation testing. The crushed samples were stored in a freezer to avoid oxidation. A blend of the three composites was prepared and split into sub-samples for head assays and locked cycle testing. The flotation test programme consisted of bench-scale rougher and cleaner flotation tests, incorporating one stage of cleaning in the lead and zinc flotation circuits for Tests 1 and 2 and two stages of cleaning for Test 3. One locked cycle test was performed on the blend sample in order to investigate the effect of re-circulating streams on final concen-trates recoveries and grades. Two stages of cleaning were performed in each circuit. There was no regrinding prior to cleaner flotation. Rougher flotation was conducted using the primary grind size of 75% passing 75μm. The samples submitted for the test programme were expected to be representative of the production head grades. Each composite was analysed for silver and gold by Fire Assay,
Bankable feasibility study update May 28th 2014 rev 03
71
for lead, zinc and iron by nitric acid digestion and atomic adsorption spectrometer, for sulphur by Eltra and for about 40 elements by XRF.
9.3.2 Batch flotation tests results
Representative 5kg feed batches were milled to 75% passing 75μm and subjected to flo-tation testing. The reagents used in lead flotation were zinc sulphate (ZnSO4) and Aerophine 3418A in rougher flotation and sodium cyanide (NaCN) and Aerophine 3418A in the cleaner stag-es. Lead flotation was conducted at a nominal pH8.2. Reagents used in zinc flotation were copper sulphate (CuSO4) and sodium isobutyl xan-thate (SIBX). Zinc flotation was conducted at pH11.5. Methyl isobutyl carbinol (MIBC) was used as the frother and lime as the pH modifier in the lead cleaner flotation and zinc flotation.
9.3.3 Lead concentrates grades and recoveries
The results of the batch flotation tests are summarised as follows: Lead recoveries in the highest grade composite were significantly higher, with Ag150
achieving 60.7% lead recovery to a concentrate grading 67.2% Pb; The Ag50 and Ag100 samples were amenable to upgrading to a 50%Pb concentrate
grade after two cleans; and Lead flotation performance in the lower grade Ag50 sample was better than that of
the Ag100 sample, with potentially around 69% lead recovery to a concentrate grad-ing 50% Pb possible, when compared with the Ag100 sample, with around 57% lead recovery to a 50 %Pb concentrate.
9.3.4 Silver deportment to lead concentrate
Batch testing of the three ore types demonstrated that: Silver recoveries to the rougher concentrates were comparable for the lower grade ore
types at around 70%. Rougher recovery for the Ag150 sample was higher at 75%; Without regrinding prior to cleaner floatation, silver minerals in the Ag100 sample
appear to be more readily recoverable, suggesting a greater degree of locking in the Ag50 and Ag150 samples at the d75=75μm primary grind size; and
After two stages of cleaner flotation, silver recoveries ranged from 37.2% (Ag100) to 45.2% (Ag150) into lead concentrates grading from 1.1% Ag (Ag50) to 2.3% Ag (Ag100).

Bankable feasibility study update May 28th 2014 rev 03
72
9.3.5 Gold deportment to lead concentrate
Batch testing of the three ore types demonstrated that: The trend of gold grades and recoveries were similar to that of silver for each ore
type; Gold recoveries to the lead rougher concentrates were generally between 70 and
80%; and The highest gold grade was obtained in the Ag100 sample.
9.3.6 Zinc concentrates grades and recoveries
Batch testing of the three ore types demonstrated that: The best zinc rougher recoveries were obtained with the Ag50 and Ag150 samples; The 50% zinc grade target was achieved after two cleaning stages in the Ag100 and
Ag150 samples; and After two stages of cleaning the Ag50 sample achieved a 78.3% zinc recovery to a
concentrate grading 48.7% Zn.
9.3.7 Locked cycle flotation test results
The locked cycle test was carried out over five cycles. The cleaner tailings were returned to the previous stages on the next cycle as in a continuous flotation circuit. The second lead and zinc concentrates as well as the lead and zinc tailings from each cycle were as-sayed. The results of the locked cycle test, performed at a 75% passing 75 µm primary grind size without rougher concentrate regrind and two stages of cleaning are summarised as follows: 86.7% lead recovery to a concentrate grading 54.6% Pb was achieved; Silver grade in the lead concentrate was approximately 1.7% Ag at 69.5% recovery; Approximately 7% of the silver was recovered to the zinc concentrate grading 544 g/t
Ag; 90.8% zinc recovery was achieved to a concentrate 51% Zn; Using Test 3 conditions, reagent consumption in the locked cycle test was compara-
ble with that observed in the open circuit test.
9.3.8 Bench-scale tests conclusions
The results of the bench-scale flotation tests demonstrated that two cleaning stages, in both the lead and zinc circuits, were required to achieve the target 50% Pb and 50% Zn grades. The locked cycle test results showed that lead, zinc, silver and gold can be upgraded into saleable concentrates showing good recoveries and acceptable grades.

Bankable feasibility study update May 28th 2014 rev 03
73
The locked cycle calculated head grades for lead and zinc were higher than that of the single Ag100 sample and so cannot be scaled up directly. The lead and zinc open-circuit final grades are higher than the locked cycle test and, as expected, recoveries in the locked cycle test are higher. The lower locked cycle concen-trate grades may be as a consequence of the particular lead and zinc mineralisation style in the Ag50 component of the blend. Lead and silver recoveries into the lead concentrate were 87% and 70% respectively. Zinc recovery into the zinc concentrate was 91% and silver recovery 6.7%. The total silver recovery obtained to the two concentrates in the locked cycle test was 69.5% + 6.7% = 76.2 %. Payment terms for silver in zinc concentrate will be less favour-able than that for the lead concentrate.
9.4 Pilot plant test programme
9.4.1 Test samples
GTK conducted pilot plant testing on the Silver Mine Ag-Pb-Zn ore type over the period August 30 to October 2 2011. Sotkamo Silver provided a blend of higher and lower grade sub-ore samples totalling 88 tn for the test work programme. Metallurgical testing was divided into two campaigns consisting of: 1. 58t, August 30 – September 9; and 2. 30t, October 3 – October 7. The primary objective of the pilot plant was to generate data for the Silver Mine Mill de-sign and confirm the results of the earlier bench and mini-pilot (locked cycle) scale stud-ies on the ore. Metallurgical testing of the Feed 1 sample consisted of flotation-gravity and flotation on-ly regimes. Testing of the Feed 2 sample was confined to flotation only.
9.5 Pilot plant gravity and flotation results
The results of the pilot plant tests are summarised as follows: Gravity processing prior to flotation did not have any significant advantages over flo-
tation only. The lead grade of the gravity concentrate was very high but silver and gold grades were comparable to that obtained in flotation concentration;
Gravity and flotation concentration did not produce a precious metal concentrate; The finer grind produced higher grade silver-lead concentrates but the respective re-
coveries were higher at the coarser grind size; Silver and gold recoveries were independent of grind size; The Aerophine 3418A collector showed better flotation response than the Cheminova
Danafloat 271; and

Bankable feasibility study update May 28th 2014 rev 03
74
The sulphur content of the tails could be reduced from 0.7 – 1.1 % to 0.1 – 0.2 % S which is of benefit to tailings disposal. Silver grade in the sulphur (pyrite) concen-trate ranged from 200 – 300 g/t Ag.
9.6 Flowsheet description
9.6.1 General
Metallurgical testing of the Silver Mine ore has demonstrated that the silver, lead and zinc minerals are amenable to separation and concentration to produce saleable concen-trates. Pilot plant testing produced three concentrates; namely: 1. Ag-Au-Pb Concentrate; 2. Zinc Concentrate; and 3. Sulphur (pyrite) concentrate. The flotation process requires grinding of the ore, followed by silver-lead flotation con-sisting of rougher and scavenger stages followed by three-stage cleaning. The silver-lead flotation tailings are then transferred to the zinc flotation circuit consisting of rougher and scavenger stages and three stages of cleaning. Tailings from zinc flotation then un-dergo pyrite flotation, which consists of a rougher and cleaning stage. Silver Mine will have a concentration capacity of 350 000 - 450 000 t/a. The run of mine will be mined from the open pit and the underground mines. The crushing plant will have a capacity of 250 t/h and the concentration plant capacity of 45-55 t/h. The silver mine concentration process will produce Ag-Au-Pb concentrates (1 550 t/a), Zn concentrates (3 850 t/a) and pyrite concentrates (9 150 t/a). The total design concen-trator capacity is approximately 14 550 t/a.
9.6.2 Crushing
The ROM ore is transported from the underground mine and the open pit to the ROM ore storage area. The ROM ore is sorted to the ore and the barren rock piles from where the ore is transported to the ore crushing plant and the barren rock is transported to the barren rock storage area. The ROM ore is crushed and fed to the concentrator plant via crushed fine ore storage with conveyor belts.
9.6.3 Grinding and classification
A conventional Rod mill – Ball mill grinding circuit is used in the concentrator plant of the Silver Mine. The fine ore is fed to the rod mill via a mill feed conveyor which is loaded with four feeders. Feeders rotation speed is controlled by the mill feed conveyer weight control loop. The grinding circuit consists of a rod mill in an open circuit and a ball mill in a closed circuit with a vibrating screen and a hydro cyclone. The nominal ore feed rate is 40 t/h
Bankable feasibility study update May 28th 2014 rev 03
75
and maximum capacity is 45-55 t/h. The product grind size after rod milling is 4.76mm and, after ball milling, on average 73 μm. The rod mill is equipped with a trommel. The trommel oversize (pebbles and steel scats) will be collected from the rod mill to the container. The trommel undersize will be for-warded to the mills discharge sump and pumped to the vibrating screen. The main pur-pose of the screen is to prevent blockages in the hydro cyclone feed. The screen under-flow is pumped to a hydro cyclone and the overflow passes through a flow meter and a particle size analyzer to the flotation circuit. The size of the cyclone apex can be changed from 7 to 15mm, depending on the targeted grinding product particle size distribution. The screen overflow (O/F) and the cyclone underflow (U/F) are fed to the ball mill. The ball mill feed rate is 146.1 t/h. The net grinding energy was 10.1kWh/t for the coarse grind, 10.7 kWh/t for the middle grind and 12.2kWh/t for the fine grind. The work index for Silver Mine ore varied from 11.3kWh/t to 11.9kWh/t. The cyclone overflow is forwarded to the Ag-Au-Pb-flotation feed conditioner.
9.6.4 Ag-Au-Pb flotation
The silver-lead flotation circuit comprises rougher and scavenger stages, and three-stage cleaning. The cyclone overflow will be conditioned in the conditioning tank before trans-ferring to the bank of rougher/scavenger cells of the silver-lead flotation circuit. This bank will comprise 3 x 20m3 cells. The concentrate from the 1st and the 2nd rougher cells is transferred to the 1st cleaning cell. The concentrate from the 3rd rougher/scavenger cell is pumped back to the 1st rougher cell. The silver-lead flotation circuit includes three cleaning stages. This finishing bank will comprise 3 x 10m3 cells. The concentrate of the 1st cleaning cell of the silver-lead –flotation is transferred to the 2nd cleaning cell and tailings to the silver-lead flotation con-ditioner. The concentrate of the 2nd cleaning cell is transferred to the 3rd cleaning cell and tailings to the 1st cleaning cell. The concentrate of the 3rd cleaning cell is forwarded to the silver-lead concentrate thickener and tailing to the 2nd cleaning cell. Residence times for the roughing and scavenging duties is 27 minutes. Cell levels will be controlled by means of pinch valves and level transmitters installed in each tank cell and on each bank of trough cells. Air control in all cases will be automatic valves located on the air inlet line to each cell. Slurry pH will be measured on line by pH meters installed in the feed box of the first rougher cell and it will be used to control lime addition.
9.6.5 Zn flotation
The zinc flotation circuit comprises of rougher and scavenger stages and a three-stage cleaning. The rougher and scavenger cells of the zinc flotation circuit will comprise of 3 x 20m3 cells. The concentrate from the 1st rougher cell is forwarded to the 2nd cleaning cell. The concentrate from the 2nd and the 3rd rougher cells is forwarded to the 1st cleaning cell.
Bankable feasibility study update May 28th 2014 rev 03
76
The zinc flotation circuit also includes three stages of cleaning. This bank will comprise of 3 x 10m3 cells. The concentrate of the 1st cleaning cell of the zinc flotation is trans-ferred to the 2nd cleaning cell and tailings to the 2nd rougher cell. The concentrate of the 2nd cleaning cell is forwarded to the 3rd cleaning cell and tailings to the 1st cleaning cell. The concentrate of the 3rd cleaning cell is forwarded to the zinc concentrate thickener and tailing to the 2nd cleaning cell. Residence times for the roughing and scavenging duties is ca. 40 minutes. Cell levels will be controlled by means of pinch valves and level transmitters installed in each tank cell and on each bank of trough cells. Air control in all cases will be automatic valves located on the air inlet line to each cell. Slurry pH will be measured on line by pH meters in-stalled in the feed box of the first rougher cell and it will be used to control lime addition. Specialised froth pumps, designed according to the industry standard froth factors, will be used for all concentrate duties. Variable speed drives will be installed on appropriate flotation feed and tailings pumps to allow control of overall flow rates through the cir-cuit.
9.6.6 Pyrite flotation
The pyrite flotation circuit comprises a rougher stage and a cleaning stage. The pyrite flotation rougher stage comprises of 1 x 120m3 cell. The concentrate from the 1st rougher cell is forwarded to the 1st cleaning cell. The pyrite flotation circuit cleaning stage comprises 1 x 10m3 cell. The concentrate of the 1st cleaning cell of the pyrite -flotation is forwarded to the pyrite concentrate thickener and tailings to the 1st rougher cell. Residence times for the roughing and scavenging duties is 63 minutes. Cell levels will be controlled by means of pinch valves and level transmitters installed in each tank cell and on each bank of trough cells. Air control in all cases will be automatic valves located on the air inlet line to each cell. Specialised froth pumps, designed according to the industry standard froth factors, will be used for all concentrate duties. Variable speed drives will be installed on appropriate flotation feed and tailings pumps to allow control of overall flow rates through the cir-cuit. The pyrite flotation tailings will be directed at the rate of 130.43m3/h (24.7% solids) to the tailings sump from where they will be pumped to the Tailings Management Facility (TMF).

Bankable feasibility study update May 28th 2014 rev 03
77
9.6.7 Concentrate thickening and filtering
9.6.7.1 Lead-silver-gold concentrate
The silver-lead concentrate is pumped to the 15m3 batch operating silver-lead concentrate cone thickener equipped with a rake mixer. The thickener underflow at 55-60% solids is fed to the silver-lead concentrate tank and pumped to the vacuum filter. The silver-lead concentrate tank is equipped with an agitator. The thickener overflow reports to the cir-culation water tank. The thickened slurry is pumped by peristaltic pump to a drum vacuum filter. The filtrate water will be pumped to the circulation water tank. The filter cake with a moisture con-tent of about 10% will be discharged from the vacuum filter directly onto a conveyor, which will transport it to the silver-lead concentrate storage room. The silver-lead concentrate handling circuit will produce separate dewatered silver-lead concentrate with moisture levels suitable for road and rail transport. The silver-lead con-centrate handling circuit will operate in conjunction with the silver-lead flotation circuit.
9.6.7.2 Zinc concentrate
The zinc concentrate is pumped to the 15m3 batch operating zinc concentrate cone thick-ener equipped with a rake mixer. The thickener underflow at 55-60% solids is fed to the zinc concentrate tank and pumped to the vacuum filter. The zinc concentrate tank is equipped with an agitator. The thickener overflow is trans-ferred to the circulation water tank. The thickened slurry is pumped by peristaltic pump to a drum vacuum filter. The filtrate water will be pumped to the circulation water tank. The filter cake with a moisture content of about 10% will be discharged from the vacuum filter directly on to a conveyor which will carry it to the zinc concentrate storage room. The zinc concentrate handling circuit will produce separate dewatered zinc concentrate with moisture levels suitable for road and rail transport. The zinc concentrate handling circuit will operate in conjunction with the zinc flotation.
9.6.7.3 Pyrite concentrate
The pyrite concentrate is pumped to the 15m3 batch operating pyrite concentrate cone thickener equipped with a rake mixer. The thickener underflow at 55-60% solids is fed to the pyrite concentrate tank and pumped to the vacuum filter. The pyrite concentrate tank is equipped with an agitator. The thickener overflow is di-rected to the circulation water tank. The thickened slurry is pumped by peristaltic pump to a drum vacuum filter. The filtrate water will be pumped to the circulation water tank. The filter cake with a moisture content of about 10% will be discharged from the vacuum filter directly on to a conveyor which will transport it to the pyrite concentrate storage room.

Bankable feasibility study update May 28th 2014 rev 03
78
The pyrite concentrate handling circuit will produce separate dewatered pyrite concen-trate with moisture levels suitable for road and rail transport. The pyrite concentrate han-dling circuit will operate in conjunction with the pyrite flotation.
9.6.7.4 Concentrate storage and transportation
The silver-lead, zinc and pyrite concentrate will be conveyed to concentrate storage rooms from the vacuum filters with the moisture levels suitable for road transportation. The concentrates will be removed from the concentrate rooms by the wheel loader to the transporting truck.
9.6.7.5 Tailings disposal and water re-circulation
The pyrite flotation tailings (final tailings) will be transported at the rate of 130.43 m3/h (24.7% solids) to the tailings sump from where it is pumped directly to the TMF. The values are averages of the GTK pilot test samples.
Bankable feasibility study update May 28th 2014 rev 03
79
10 PROCESS INFRASTRUCTURE
10.1 General
The Process concept and production figures are based on GTK study presented in Chap-ter 8. The Crushing plant will use 2-stage crushing equipped with a Jaw crusher, vibrating screen and a Cone crusher. The process of the concentrator plant comprises grinding circuit equipped with rod mill and ball mill, classification circuit equipped with screen and cyclone and finally three flotation circuits followed by concentrate thickening and filtering. The ore crushing will be executed by a contract work which includes the ore crushing equipment (crushers, screen, conveyors to the crushed ore storage and crushers’ auxiliary systems), the dust collecting and cleaning system of the ore crushing. Electric power supply to the crushing plant is provided and installed by Sotkamo Silver. The crushing cost effect is included in operational cost calculation. The Grinding circuit ore goes through the 3-stage flotation. Nearly all noble metals and lead are separated in the first stage of Silver-lead flotation. In the second stage of the flo-tation, i.e. Zinc-flotation, zinc is separated from the ore slurry. And the third flotation stage is for the Pyrite-flotation separation. Flotation concentrates are dried in their own dewatering circuits equipped with a concen-trate thickener and vacuum filter equipment. Thickener and vacuum filter water are for-warded to the concentrator plant circulating water tank. Dried concentrates are conveyed to the concentrate storage rooms situated in the Process Plant Building (PPB). Concentrates will then be transported by trucks to the smelting plants.

Bankable feasibility study update May 28th 2014 rev 03
80
10.2 Mine
10.2.1 Mine design criteria
The Mine operation time is 16 h/d and 5 days per week, totally 80 h/week.
10.2.2 UG and Open pit water
UG mine consists of four UG mine pumping stations (1 – 4). Pumping stations are locat-ed at four levels of the UG mine: pumping station 4 at the level 75 pumping station 3 at the level 165 pumping station 2 at the level 250 pumping station 1 at the level 335 Pumping stations are equipped with raw water pools with sedimentation basin and local level controls. UG mine water is pumped from the lower level pumping station to the next level pumping station and so on and finally to the ground level. Mine head water is pumped with the immersion pumps to the nearest UG mine pumping stations. UG and open pit drainage waters will be pumped to the tailings pond. This is shown in Chapter 11.10.5 Figure 41 Water treatment and balance flow sheet. UG and open pit raw water pumping stations are equipped with level control switches, local control panels and reserve pumps and can be controlled from the pumping station’s local control panels.
10.2.3 Heating and ventilation
The UG mine ventilation and air heating design criteria is 100 m3/s. The ventilation fan is two directional. Normal blowing direction is to the UG mine and in the emergency case the blower can operate in the opposite direction. Mine head ventilation is done with flex-ible ducts and fans. UG mine is ventilated and ventilation air heated up to +5 ºC by the LPG propane con-tainer heating plant which is placed at the top of the ventilation shaft. Maximum capacity of the plant is 4.6 MW when the temperature difference is 37 ºC. This is also net energy demand situation. Estimated annual energy demand is 5 000 MWh and pressure difference 3 500 Pa. The UG mine potable water to the water containers, refuge and break rooms of the UG mine is transported by trucks. The UG mine sanitary water system is equipped with two sanitary water tanks at the UG mine levels 225 and 330 which are emptied regularly. UG mine sanitary water tanks are transported by trucks and purged to the sanitary water purifying tank of the mine area.
Bankable feasibility study update May 28th 2014 rev 03
81
10.2.4 Electricity and process control
Electrical power will be required underground for ventilation, pumping and drilling. The main consumers of the power are the electro-hydraulic drilling jumbo and ventilation fan. Other significant power demands will be at the other drilling equipment, water pumps, and mine head ventilation fans. Electrical power will be provided via a single armoured 20kV voltage cable that will run along the drilling hole. At intervals along the ramp, portable power centre (PPC) consist-ing of skid mounted transformer with all associated switching and safety equipment will be located and fed from the main HV cable. It is estimated that 1 PPC on the level 240 will be required to service the mine. As development and mining proceeds the PPCs can be relocated to (the most) optimal locations to suit the current mining activities. Portable switchgear will be located close to each working head or stope to enable the drills to plug in when working on a particular sub-level. Auxiliary ventilation fans will also be con-nected to these portable switches to provide adequate ventilation at the working faces. All pumping stations will be controlled from the DCS. The total estimated installed load of UG and OP mine will be 962 kW.
10.2.5 Ore transportation and crusher supply
The ore is transported from the UG and OP mine to the Run of Mine (ROM) ore storage. The ROM ore storage size will contain total 40 000 tons. Storage area foundation will be built leak-proof with 1.5 mm HDPE-liner and drainage water will be discharged to the settling pond 4. From the ROM ore storage the ore is transported to the jaw crusher by the wheel loaders.
10.3 Crushing plant
10.3.1 Crushing plant design criteria
Operating data for the mine crushing and conveying plant is 250 t/h and grain size for the crushed ore is initially P80 25 mm. Jaw crusher nominal product size is P80 with the close side setting (CSS) 100 mm and 250 t/h capacity. Belt conveyors’ feeding capacities are as follows: 250 t/h conveyor 1 250 t/h conveyor 2 and 450 t/h conveyor 3 (capacity of conv. 2&3 consists of the jaw and cone crusher ca-pacity). Vibrating Screen’s capacity is 450 t/h and screen under size (U/S) ore (P80 25 mm) is conveyed to the fine ore storage with the belt conveyor 6 and conveyor 7 with the capaci-ty of 250 t/h. Vibrating Screen over size (O/S) ore is conveyed to the cone crusher.

Bankable feasibility study update May 28th 2014 rev 03
82
Cone crusher nominal product size is P80 25 mm (CSS) and nominal capacity is 197 t/h (max.250 t/h). The feeding capacity of the cone crusher belt conveyor (conveyor 4) is 200 t/h. The crushing plant operating time will be 5 days per week and 16h/d which corresponds to average 168 t/h crushed ore feed capacity to fine ore storage (350 000 t/a). It has been assumed that the crushing equipment availability will be 90 %. The crushed ore (P80 25 mm) will be stored into the 3500 ton fine ore storage with 3 days buffer storage to enable the concentrator plant to run when the crushing plant is not oper-ating. Operating data for the mill feed is 350 000 – 450 000 t/a and grain size for the mill feed is P80 25 mm. The Ore feeders’ (2 pcs, later on 4 pcs) capacities (each) are 70 t/h and mill feed convey-or capacity is 100 t/h. The Mill feed operating time will be 7 days per week and 24 hours per day corresponding to 45 - 55 t/h crushed ore feed capacity to ball mill (350 000 – 450 000 t/a). It has been assumed that the mill feed equipment availability will be 95 %. Principle of the crushing and mill feed process is shown in Figure 36.
10.3.2 Crushing and Fine Ore Storage
The crushing plant comprises a complete mine handling with the following main equip-ment: receiving hopper and feeder (frequency converted), a jaw crusher (1-stage crusher), iron separation, vibrating screening (2-deck screen), a cone crusher (2-stage crusher) and belt conveyors, fine ore storage’s belt feeders and all auxiliary equipment. From the Jaw crusher ore is conveyed via belt conveyors and iron separation to the vi-brating screen. Two deck vibrating screen U/S ore (< 25 mm) is conveyed via belt con-veyors to the crushed fine ore storage. Vibrating screen O/S fraction (> 25 mm) is forwarded to the cone crusher. From the cone crusher ore is forwarded back to the vibrating screen. Jaw and Cone crusher are equipped with own emergency stops and local control panels. All conveyors are also equipped with own emergency stops, local control switches and the overhead covers. The system profile is presented in Appendix 6 Crushing and Con-veyor system profile. The following crushing plant equipment items are placed in crushing area for dust for-mation and noise minimization: a jaw crusher, vibrating screening and a cone crusher. Crushed ore will be conveyed to the fine ore storage, which is equipped with canopy to prevent the crushed ore storage from wetting and freezing.
Bankable feasibility study update May 28th 2014 rev 03
83
10.3.3 Mill feed
The crushed ore will be conveyed from fine ore storage to the concentrator plant rod mill. The concentrator plant rod mill feed comprises four crushed ore storages’ feeders (each frequency controlled), rod mill feed conveyor, belt conveyor weight meter and all auxil-iary equipment. Ore is conveyed to the rod and ball mill by the ore feeders and mill feed conveyor. The rod mill feed conveyor is equipped with a belt conveyor weight meter. Normally one or two feeders are running with the constant speed for the base load of the mill feed and one of the feeders is used for the control purpose. The ball mill product grind size is P80 85 µm. The ball mill is equipped with variable speed drive and the designed capacity is 45 - 55 t/h. All ore feeders and the rod mill feed conveyor are equipped with own emergency stops and local control switches. Ore feeders and rod mill feed conveyor maintenance run is performed from the local control switch and main control from the Concentrator plant DCS. Rod mill feed conveyor is equipped with an overhead cover.
10.3.4 Utilities
10.3.4.1 Compressed Air
A compressed air will be used for the process control and maintenance of the equipment. The service will be outsourced.
10.3.5 Electrification
Electric power supply to the crushing plant is provided and installed by Sotkamo Silver. The total estimated installed load will be 507 kW.
10.3.5.1 Variable Speed Drives for Ore storage and conveyor system
The drives would be either included in the MCC's for the smaller sizes or in free standing IP20 cabinets for inclusion in the electrical room. The units will be microprocessor based employing vector control without sensors, with the switched mode power supply fed from the DC link. There will be a keypad on the front of the cabinet for inverter function programming and a LED display.
10.3.5.2 Cables
Plant cables will be armoured with aluminium or copper XLPE/PVC insulated. Office, light power and lighting cable will run in conduit unarmoured.
Bankable feasibility study update May 28th 2014 rev 03
84
10.3.5.3 Control and instrumentation for crushed fine ore storage and conveyor system
The power for the control system hardware and the field instruments will be supplied from Uninterrupted Power Supplies (UPS) in the electrical room in the PPB. The UPSs will be supplied from 400V feeder compartments in the MCC. A distributed control system consisting of Distributed Control System (DCS) will be used. The status of the drives indicating MCC ready, emergency stops ready, field local start and drive running will be fed to the DCSs. A run signal will be transferred from the DCS to each drive. The instrumentation will be microprocessor based and will supply data to the control network for mass balance measurement, level, density, flow, pressure and temperature measurement. The operator interface to the plant will be at the control room located in the PPB. The system will have an Ethernet interface for connection to the plant control system net-work. All drives will be started and stopped from the DCS. Some drives will have a field start/stop station. All stops and emergency stops and personal protection devices, like conveyor pull-keys, will be hardwired into the MCC starter circuits. Conveyors, crushers, mills, agitators, etc. will only be started after the audio/visual start up warning has been activated for 15 seconds.
10.3.6 Process control
10.3.6.1 Crushing plant process control system
Jaw and Cone crusher and their auxiliary devices main process control is conducted from the local control panels from the field and alternative control panel from the Concentrator plant DCS. Crushing plant conveyors main control is conducted from the Concentrator plant DCS and maintenance run is conducted from the local control switches. The Crushing plant will be controlled from the Central Control Room (CCR) in the PPB. The control system will be designed for plant control. The control and instrumentation philosophy of the crushing plant is to provide minimum instrumentation as possible, if there is no other economically or process justified reasons requiring more sophisticated automation. The control system will be based on a proved and reliable Distributed Control System (DCS) hardware and software, which will be installed in the Automation Room of the PPB.

Bankable feasibility study update May 28th 2014 rev 03
85
The control system will interface with the plant instrumentation via DCSs and in-put/output (I/O) modules, which will be housed in remote I/O cabinets located in the plant. The control system will control the plant's motors via drive interface modules - Simo-codes or similar (Profibus) - installed in individual MCC compartments. The control system will communicate with the operator interfaces (computer screens & keyboards), the plant instrumentation (remote I/O cabinets) and the drives Micro Com-puter Control (MCC) via network cables on Profibus DP. The power for the control system hardware and the field instruments will be supplied from 2 uninterruptible power supplies (UPS) - the main one and a standby - in the CCR.
10.3.6.2 Main controllable process variables and instruments
Crushing plant Instruments will be provided to monitor, control and record the main pro-cess variables: Rod mill feed conveyor tonnages Crushers’ power draw DCS system software will be programmed to provide control for: Mill optimization - the tonnage to the ball mill will be measured with a weight meter
on the rod mill feed conveyor.
10.3.6.3 Manual control
The following activities and parameters will be manually controlled or measured: Mill feed samples for moisture determination
10.3.7 Crushing plant balance
Crushing plant feed curve, Ore stockpile output curve and estimated balance are shown in Figure 35.

Bankable feasibility study update May 28th 2014 rev 03
86
Figure 35 Crushing plant balance flow sheet
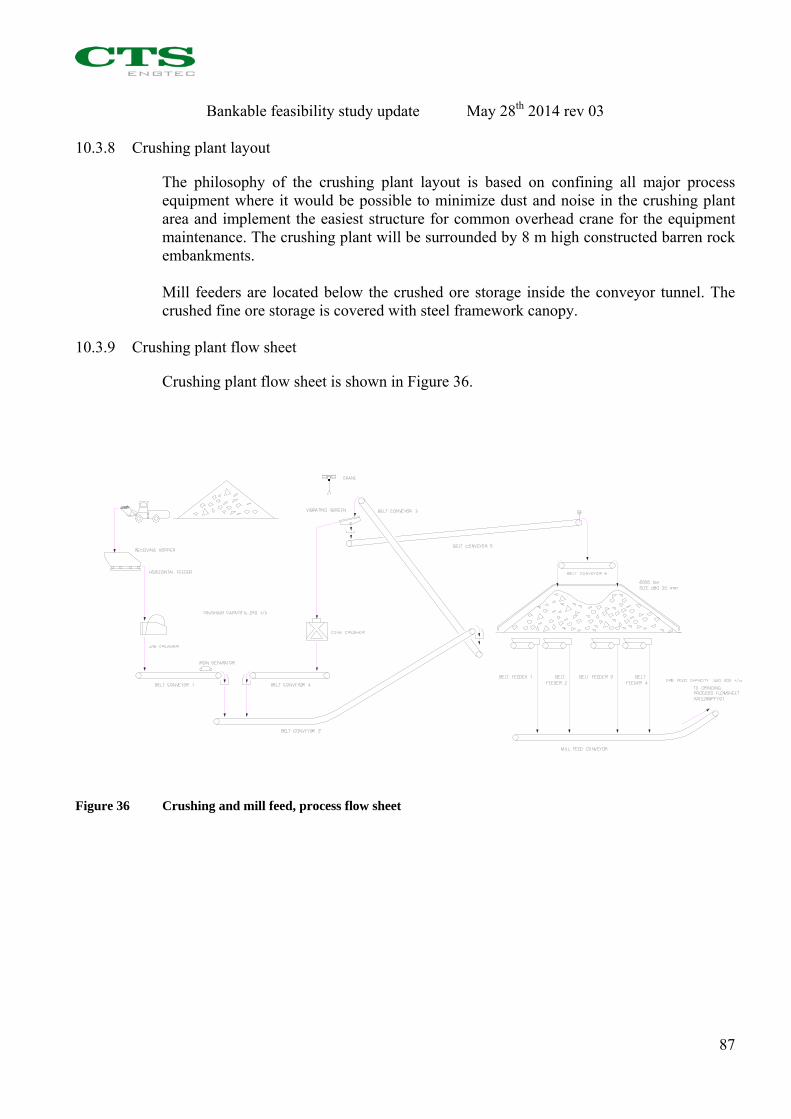
Bankable feasibility study update May 28th 2014 rev 03
87
10.3.8 Crushing plant layout
The philosophy of the crushing plant layout is based on confining all major process equipment where it would be possible to minimize dust and noise in the crushing plant area and implement the easiest structure for common overhead crane for the equipment maintenance. The crushing plant will be surrounded by 8 m high constructed barren rock embankments. Mill feeders are located below the crushed ore storage inside the conveyor tunnel. The crushed fine ore storage is covered with steel framework canopy.
10.3.9 Crushing plant flow sheet
Crushing plant flow sheet is shown in Figure 36.
Figure 36 Crushing and mill feed, process flow sheet
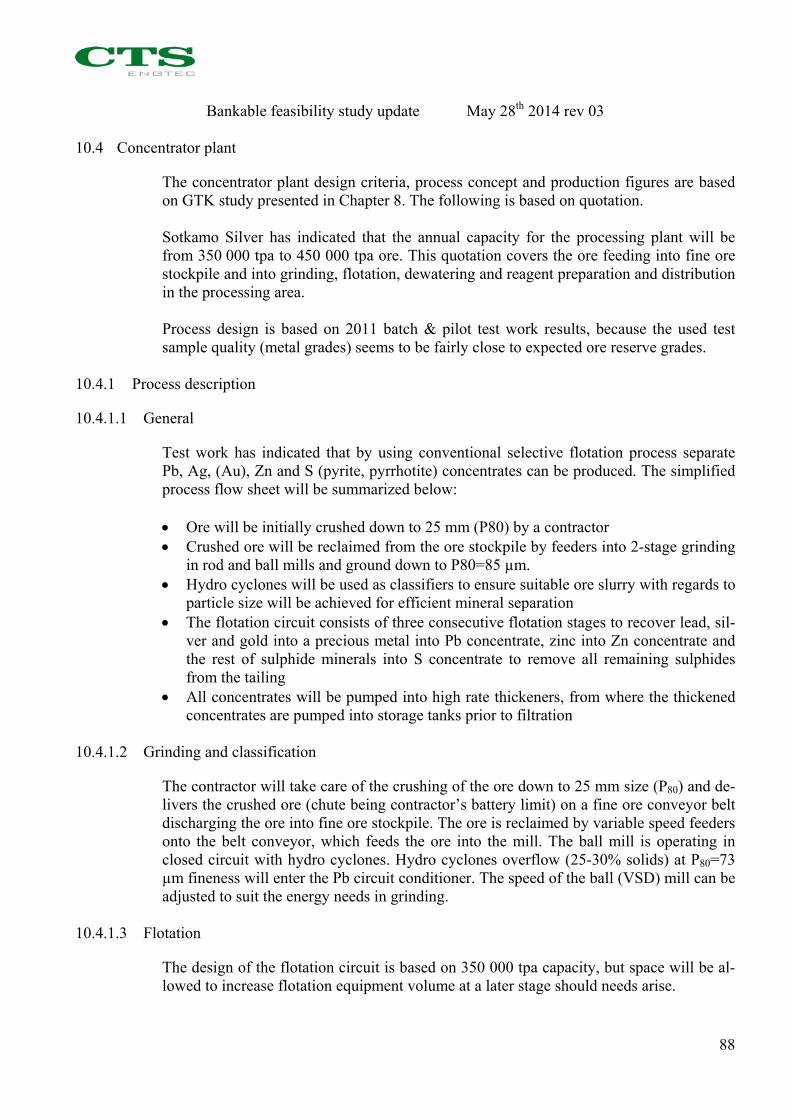
Bankable feasibility study update May 28th 2014 rev 03
88
10.4 Concentrator plant
The concentrator plant design criteria, process concept and production figures are based on GTK study presented in Chapter 8. The following is based on quotation. Sotkamo Silver has indicated that the annual capacity for the processing plant will be from 350 000 tpa to 450 000 tpa ore. This quotation covers the ore feeding into fine ore stockpile and into grinding, flotation, dewatering and reagent preparation and distribution in the processing area. Process design is based on 2011 batch & pilot test work results, because the used test sample quality (metal grades) seems to be fairly close to expected ore reserve grades.
10.4.1 Process description
10.4.1.1 General
Test work has indicated that by using conventional selective flotation process separate Pb, Ag, (Au), Zn and S (pyrite, pyrrhotite) concentrates can be produced. The simplified process flow sheet will be summarized below: Ore will be initially crushed down to 25 mm (P80) by a contractor Crushed ore will be reclaimed from the ore stockpile by feeders into 2-stage grinding
in rod and ball mills and ground down to P80=85 µm. Hydro cyclones will be used as classifiers to ensure suitable ore slurry with regards to
particle size will be achieved for efficient mineral separation The flotation circuit consists of three consecutive flotation stages to recover lead, sil-
ver and gold into a precious metal into Pb concentrate, zinc into Zn concentrate and the rest of sulphide minerals into S concentrate to remove all remaining sulphides from the tailing
All concentrates will be pumped into high rate thickeners, from where the thickened concentrates are pumped into storage tanks prior to filtration
10.4.1.2 Grinding and classification
The contractor will take care of the crushing of the ore down to 25 mm size (P80) and de-livers the crushed ore (chute being contractor’s battery limit) on a fine ore conveyor belt discharging the ore into fine ore stockpile. The ore is reclaimed by variable speed feeders onto the belt conveyor, which feeds the ore into the mill. The ball mill is operating in closed circuit with hydro cyclones. Hydro cyclones overflow (25-30% solids) at P80=73 µm fineness will enter the Pb circuit conditioner. The speed of the ball (VSD) mill can be adjusted to suit the energy needs in grinding.
10.4.1.3 Flotation
The design of the flotation circuit is based on 350 000 tpa capacity, but space will be al-lowed to increase flotation equipment volume at a later stage should needs arise.

Bankable feasibility study update May 28th 2014 rev 03
89
Pb flotation consists of a 20m3 conditioner and 4 x 20m3 tank cells for rougher and scav-enger flotation with residence time being 27 minutes. Pb rougher concentrate will be cleaned in three consecutive stages while cleaner tails are returned downstream. Scaven-ger concentrate and the 1st cleaner tails are returned to the head of Pb flotation circuit. All Pb cleaner circuit cells are 5 m3 tank cells and they allow long residence times in flota-tion. Pb flotation tailing is pumped into Zn circuit flotation conditioner (20 m3). Zn flotation circuit consists of rougher and scavenger flotation (5 x 20m3 tank cells). Zn rougher con-centrate is transferred into Zn 2nd cleaner flotation (1 x 5m3) and Zn scavenger concen-trate respectively into Zn 1st cleaner flotation (2 x 5m3). 3rd Zn cleaner is carried out in 1 x 5m3 tank cell. Zn cleaner circuit is configured by pumping concentrates upstream (similar to Pb cleaner circuit) and cleaner tails flow by gravity downstream. The tailing from Zn flotation is pumped into S flotation conditioner. S flotation circuit consists of a conditioner 20m3, 3 x 50m3 rougher, scavenger cells. S rougher concentrate is not cleaned, but pumped into thickener. The pilot test work ore sample had following grades: Pb 0.35% Ag 98 g/t Au 0.46 g/t Zn 0.79% S 1.24% GTK has studied Silver Mine mineralogy and based on those findings the silver minerals occur mostly liberated in flotation feed. Due to Ag-minerals occurrence mode they will report mostly into Pb concentrate; same comment applies to chalcopyrite. Ore contains also carbonates up to 5-9% (mostly ankerite Ca-Fe carbonate).
10.4.1.4 Dewatering
All concentrates will be pumped into thickeners. Thickener underflows, typically at least 60% solids, will be pumped into agitated storage tanks prior to filtration. Pb, Zn and S concentrates will be filtered in a joint Pressure Filter and conveyed into concentrate stor-age
10.4.1.5 Reagents
Flotation process requires following reagents: Aerophine 3418A (collector) Sodiumisobutylxanthate (SIBX) (collector) Frother, MIBC Frother, Dow 250 ZnSO4 (Zinc depressant) CuSO4 (Zinc activator)
Bankable feasibility study update May 28th 2014 rev 03
90
Dextrin (modifier in Pb flotation) Ca(OH)2 (Ph control)
Table 18 Flotation reagents dosage
The estimated consumption rates come from the GTK pilot test work. Flocculant addition is needed for the efficient thickening for the concentrates. The dosage rate for flocculant is 20 g/t feed into each concentrate thickener.
10.4.2 Concentrating process flow sheet
The Concentrating process flow sheet is presented in the Figure 37. The Process plant layout is presented in Appendix 7 and 8.
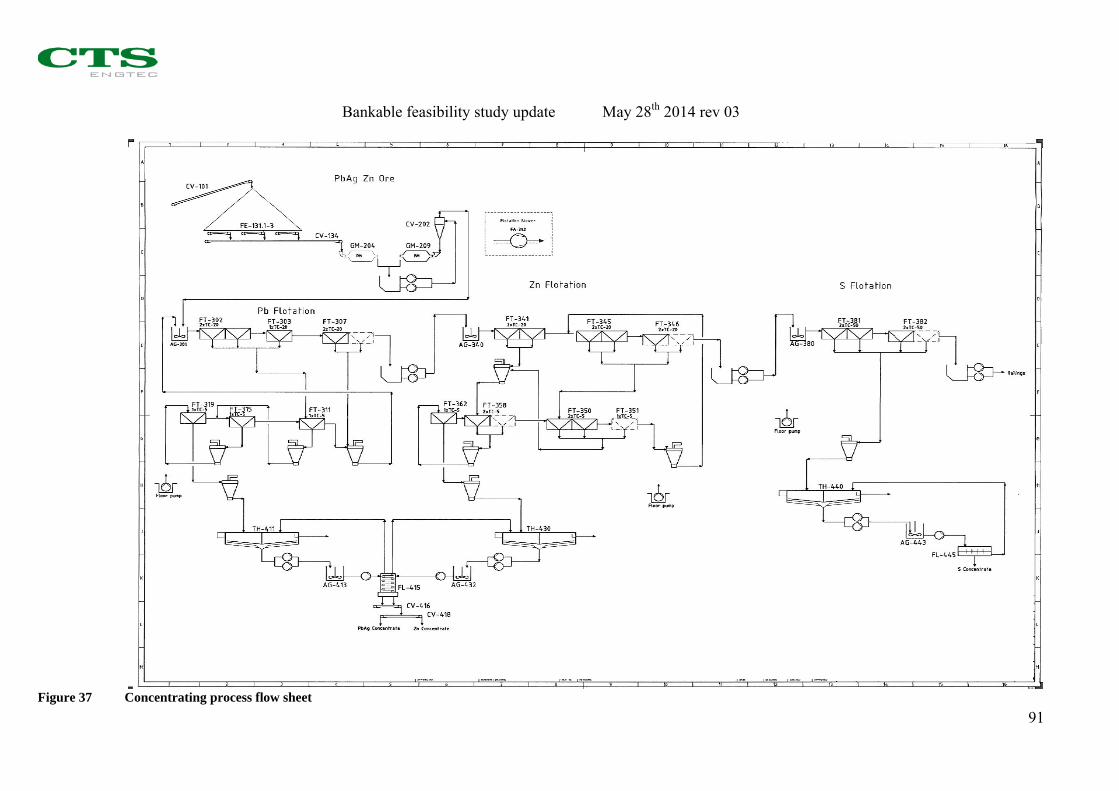
Bankable feasibility study update May 28th 2014 rev 03
91
Figure 37 Concentrating process flow sheet
Bankable feasibility study update May 28th 2014 rev 03
92
10.4.3 Utilities
10.4.3.1 Process Water
Process circulation water will be stored in a 45 m3 circulation water tank within the pro-cess plant building (PPB) and is serviced with an external line from the Tailings Man-agement Facility pump station 3 (PS 3). In the normal run all process water comes to the concentrator plant from settling pond 2’s circulation PS 3. Besides individual lines are di-rected to circulation water tank from the concentrate thickeners and concentrate vacuum filter. From Olkilahti pump station (PS 1) raw water is used for the circulation water tank feed, if the circulation water pump PS 3 is not in operation, for example, in maintenance situa-tions. Normally, Olkilahti PS 1 raw water is recommended to be used only for tailings pond start-up situations and settling pond circulation water reservoir water quality prob-lems. The circulation water tank’s circulation water is pumped to the concentrator plant circu-lation water network with the frequency controlled pump. Circulation water tank is equipped also with a fire water pump (diesel pump) serving as the plant fire water network and washing water pump serving as the plant washing water network. Circulation water is used for: Rod and ball mill dilutions and consistency control water Flotation cells chute washing Pump sumps level control Plant washing water posts Fire water
10.4.3.2 Raw Water
Raw water is pumped from the Olkilahti PS 1 or mine area PS 4 to 15 m3 Raw Water tank within the PPB. Normally, mine area raw water PS 4 is used for the raw water tank feed. If raw water PS 4 is not in operation, for exam-ple, in maintenance situations or poor water quality/reserve, Olkilahti raw water from PS 1 can be used as a raw water back-up pumping station. The raw water tank’s water is pumped to concentrator plant raw water net-work with the frequency controlled pump. The chemical system raw water pump of the raw water tank is serving chemical dilution only. Sealing water is made from the plant raw water with the sealing water filters. Sealing water is pumped to the plant sealing water network with the raw water tank sealing water pumps.
Bankable feasibility study update May 28th 2014 rev 03
93
Raw water is used for: Slurry and vacuum pumps sealing water (water after sealing water filters) Reagents dilutions Flotation cells chute washing (optional)
10.4.3.3 Compressed Air
Two compressors will be installed in the concentrator plant to supply instrument air to the concentrator plant automation valves and process equipment and mill air for mainte-nance use. Mill air and instrument air will be provided by means of duty and standby compressors. Air compressors’ are air cooled. All pressure air (instrument and mill air) will be filtered and dried. Pressure air centre is equipped also with 2 – 3 pressure air reservoir tanks. The concentrator plant laboratory will be connected to concentrator plant pressure air system. A small mobile air compressor can be also used in the workshop for maintenance of equipment.
10.4.3.4 Heating and ventilation
The Process plant building (PPB) will be heated electrically and equipped with mechani-cal ventilation with heat recovery. The maximum amount of ventilation is dimensioned according to heat generation of the process. The non-heated concentrate storage will be equipped with exhaust ventilation. The PPB is equipped also with several local exhaust ventilations, which are controlled locally when necessary. Electric equipment rooms and CCR is equipped with mechanical ventilation with heat recovery and cooling. The waste and chemical waters of the laboratory are collected to cesspit. The cesspit is equipped with level alarm. The waste and chemical waters of the laboratory are pumped to container and transported to hazardous disposal plant.
10.4.4 Electricity
10.4.4.1 Concentrator plant Load
The total installed load will be 2 215 kW.

Bankable feasibility study update May 28th 2014 rev 03
94
10.4.4.2 Motor Control Centres
The free standing sheet steel cabinets are to be protected up to IP30, front connected units arranged in vertical tiers with top and bottom cable ways. The units shall be of withdrawable or fixed type according to the rating. The MCCs will be mounted in elec-trical rooms with closed ventilation system. Intelligent motor controller and protection unit for each starter with link to DCS shall be included.
10.4.4.3 Variable Speed Drives
The drives would be either included in the MCCs for the smaller sizes or in free standing IP20 cabinets for inclusion in the electrical room. The units will be microprocessor based employing vector control without a sensor, with the switched mode power supply fed from the DC link. There will be a keypad on the front of the cabinet for inverter function programming and a LED display.
10.4.4.4 Mill Starter
There will be inverters to give 'soft starting' to the squirrel cage motors on the rod and ball mill drives. The inverters supplies will be taken directly from circuit breakers on the main switchboard.
10.4.4.5 Cables
Plant cables will be armoured with aluminium and copper XLPE/PVC insulated. Office, light power and lighting cable will be running in conduit unarmoured.
10.4.4.6 Control and instrumentation
The power for the control system hardware and the field instruments will be supplied from Uninterrupted Power Supplies (UPS) in the electrical room in the PPB. The UPSs will be supplied from 400V feeder compartments in the MCC. A distributed control system will be used consisting of Distributed Control System (DCS). The status of the drives indicating MCC ready, emergency stops ready, field local start and drive running will be fed to the DCSs. A run signal will be supplied from the DCS to each drive. The instrumentation will be microprocessor based and will supply data to the control network for mass balance measurement, level, density, flow, pressure and temperature. The operator interface to the plant will be at the control room located in the PPB. The system will have an Ethernet interface for connection to the plant control system net-work.
Bankable feasibility study update May 28th 2014 rev 03
95
All drives will be started and stopped from the DCS. Each drive will have a field start/stop station. All stops and emergency stops and personal protection devices, like conveyor pull keys, will be hardwired into the MCC starter circuits. Conveyors, crushers, mills, agitators etc. will only be started after the audio/visual start up warning has been activated for 15 seconds.
10.4.5 Process control
10.4.5.1 Concentrator plant process control system
Rod and Ball mills are controlled from the concentrator plant DCS and their auxiliary devices control is happening from the Mills’ local control panels and alternative control of the auxiliary devices of the Mills is done from the DCS. Concentrator plant slurry and water pumps, flotation machines’ rotors and equipment and all utilities’ systems’ main control is monitored from the Concentrator plant’s DCS. Local control panels and switches are used for the process controls of the equipment, on-ly if it’s the easiest and reasonable way to carry out process control. These kinds of pro-cess systems are, for example, pressure air centre, concentrate filtering and chemical sys-tems. The control and instrumentation philosophy of the concentrator plant will be to keep such instrumentation to a minimum, except for the cases where there is a valid economic or process-justified reason for more sophisticated automation. The plant will be controlled from a Central Control Room (CCR) in the PPB. The control system will be designed for plant control by 2 operators (the other operator station to-gether with engineering station). The control system will be based on proven and reliable Distributed Control System (DCS) hardware and software, which will be installed in the Automation Room of the PPB. The operator interface with the plant will be via Industrial PC, Keyboard, Mouse and LCD computer screens and printer. The control system will interface with the plant instrumentation via DCS's and in-put/output (I/O) modules, which will be housed in remote I/O cabinets located in the plant. The control system will control the plant's motors via drive interface modules - Simo-codes or similar (Profibus) - installed in the individual MCC compartments. The control system will communicate with the operator interfaces (computer screens & keyboards), the plant instrumentation (remote I/O cabinets) and the drives Micro Com-puter Control (MCC) via network cables on Profibus DP.

Bankable feasibility study update May 28th 2014 rev 03
96
The power for the control system hardware and the field instruments will be supplied from 2 uninterruptible power supplies (UPS) - one main and one standby - in the CCR.
10.4.5.2 Main controllable process variables and instruments
Instruments will be provided to monitor, control and record the main process variables: Mill power Cyclone feed density Water flows to the concentrator plant and to the Mills Cyclone pressure Main equipment power Courier analyzer Particle size analyser DCS system software will be programmed to provide control over the following: Water addition to the mill will be proportional to the ore feed rate to maintain a con-
stant slurry density in the mill. The level in the mill discharge sump will be maintained by dilution to prevent pump
cavitation. The speed of the cyclone feed will be variable to enable the feed to the cyclones to be
maintained at constant density and cyclone feed density will be measured for this purpose
The flotation cells will be provided with automatic control of slurry level and air ad-dition rate.
The Thickeners will be provided with slurry density measurement Courier analyser system will be used for process management, monitoring and control. The analyser contains following: Element concentrations measurement (XRF) Flash flotation control Primary rougher flotation control Rougher control Cleaner control Scavenger control Flotation circuit control
10.4.5.3 Manual control
The following activities and parameters will be manually controlled or measured: Collection of samples from the concentrate storages for the determination of moisture
and metal contents

Bankable feasibility study update May 28th 2014 rev 03
97
10.4.5.4 Process control system architecture
Plant automation system architecture is presented in Appendix 9 and shown in the Figure 38.
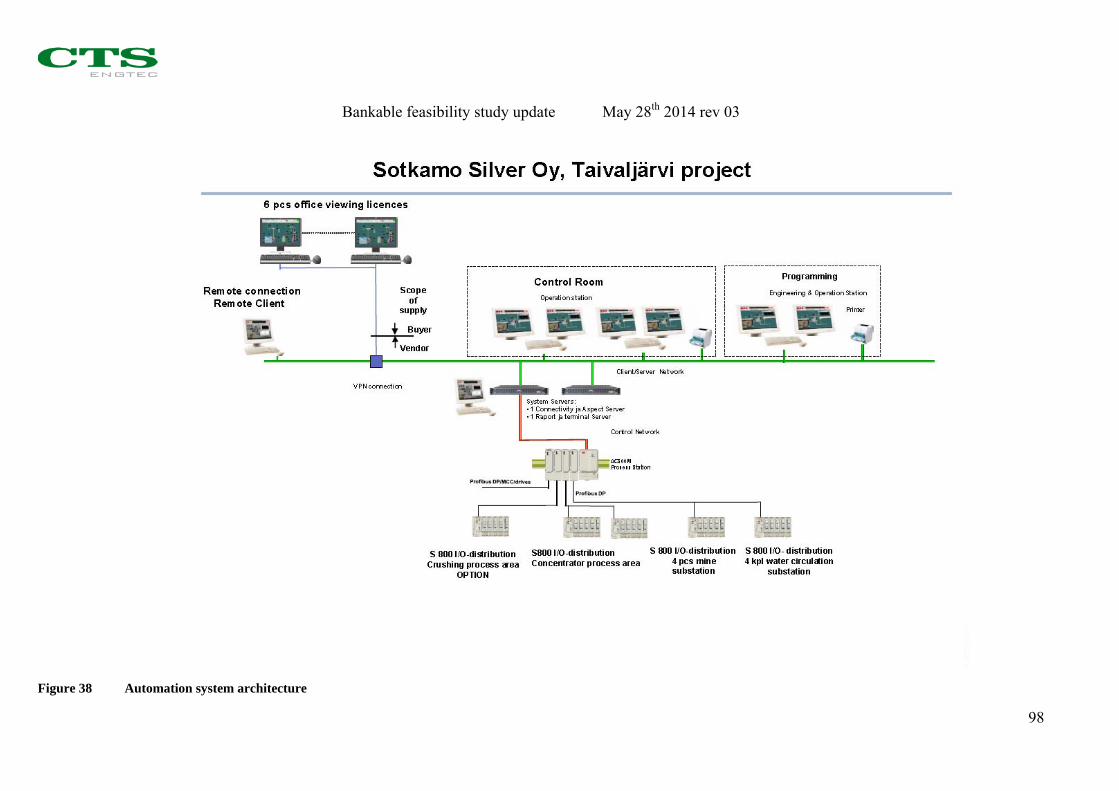
Bankable feasibility study update May 28th 2014 rev 03
98
Figure 38 Automation system architecture
Bankable feasibility study update May 28th 2014 rev 03
99
10.4.6 IT-Architecture
Local Area Network (Office network) will be built as star topology where the PPB is a central point. Optical fibre cables will be built from the PPB to the Crushing and Mine Area. Printers are centralized model. Office PCs consist of a required operation system and of-fice programs. Local server will be situated in the PPB.
10.4.7 Laboratory facilities
The geological sample handling laboratory (G-lab) is situated inside the drill core stor-age. The G-lab will be an enclosed, insulated and heated room inside the storage. Geo-logical samples include, for example, rock boulders, drill cores, RC- and chip samples. In the G-lab there has to be a saw for cutting the cores and also a jaw crusher and, for ex-ample, a ring mill for pulverizing the samples. Also equipment for drying the samples is needed. Riffle splitters are needed to split the pulverized samples. Roll tables are needed for drill core logging. There has to be also enough space for occasional drill core cases. General furnishing with tables, lockers and chairs, is also naturally needed. The process sample handling laboratory (P-lab) is situated inside the PPB adjacent to the sample analysing laboratory rooms. Process samples are mainly in the slurry form and are from different points of grinding and flotation processes. Also some other samples, for example, raw materials, chemicals, may be handled in this laboratory. In the P-lab there have to be vacuum filtration units for dewatering of slurry samples. Also heating plates and oven are needed for drying. Sieving machine, sieves and balances are needed for particle size analysis. Sample splitters and spinning riffles are needed for sample di-viding. Furnishing has to fit a normal wet laboratory style. Services including all labora-tory equipment of the P-lab will be outsourced. The sample analysing laboratory (A-lab) is situated inside the PPB adjacent to P-lab rooms. Samples for the analysing laboratory are pre-treated in G-lab or in P-lab. Also, some other samples (raw materials, environmental samples) arrive to A-lab. Analysis equipment includes AAS, XRF, ICP-OES and UV-VIS. Services including all laboratory equipment of the A-lab will be outsourced.
10.4.8 Mobile equipment
Mobile equipment in and around the plant area will comprise a 2t gas operated hydraulic forklift. The wheel loader will be used for the loading of the concentrates. The light vehicle will be required for the maintenance inspection of the Mine Area.
Bankable feasibility study update May 28th 2014 rev 03
100
11 PROJECT INFRASTRUCTURE
11.1 Mine area general infrastructure
Existing infrastructure considers 1.8 km long forest road as an access road from road 9005 to the decline access. From the decline access there is narrow, 3 m wide and 600 m long, side rock paved dumper road to the ventilation shaft. 20 kV back-up power line ac-cesses the ventilation shaft from NNE. The 110 kV/45 kV transmission line alongside the planned access road R1 to the 45/20 kV main substation is built. In the western side of decline access there is former side rock area holding approximately 80 000 m3 rock which will be levelled down to +211 ASL as substructure of the process plant area and excessive masses will be used to build the substructure of the new access road. Process plant area will be 5,5 ha large and will include process plant building (PPB), crushing plant, office/laboratory building, drill core storage with workshop, Run of Mine (ROM) ore storage, 45/20 kV main substation, bio-chemical sewage disposal, parking ar-ea and truck park. In the East of the decline there will be a 2 ha area for contractors. Plant area will be situated on 600 m SW of ventilation shaft. PPB will be 1 939 m2 heated and insulated building with steel framework, which in-cludes central control room (CCR) and all related process equipment. Concentrate ore storage will be 995 m2 and situated as an adjacent non-heated building with similar struc-ture. The primary crushing area is designed to be surrounded by 8 m high constructed side rock embankments. The primary crusher will be located approximately 100 m SE of the PPB next to the ROM. Crushing will be operated by the contractor. Major part of the existing access road operates as a public road and upgrading it can cause unexpected expenses due to fairly deep peat layers in its middle part. The new ac-cess road R1, 970 m, from north will be built straight from the road 9005. Tailings Management Facility (TMF) will consist of 28 ha tailings pond, 1.05 ha settling pond 1, 5.1 ha settling pond 2, 1.5 ha settling pond 3 and 2.3 ha wetland treatment area. TMF will be located SW from the process plant area. Settling pond 4 will be 810 m2 and situated 100 m NE from ROM. Bio-chemical sewage disposal will be located between process plant area and TMF. Explosives container will be located in 100 m SE from the ventilation shaft.
11.2 Power supply and distribution
Designing of the distribution of 20 kV and 690V network, transformers and frequency converters is based on the quotation.
Bankable feasibility study update May 28th 2014 rev 03
101
11.2.1 Total power consumption
Assumed total consumption will be about 4.1MW.
Underground Mine / kW 1 162 Mine area / kW 206 Crushing / kW 507 Concentrator (PPB) / kW 2 215 All “stand by loads” are separated, but rest loads are assumed to be running with electri-cal power equal than their mechanical rated power. Assumed loads have rather high margin. Mine is running with full load 947kW about 80h/week. Rest about 88h/week load is about 500kW lower. Some loads of Mine Area and Crushing plant may still have some changes on the final design, e.g. pumps and building electrification.
11.2.2 Recommended transformer capacities
Dimensioning of the main transformers will be based on maximum average power, in-cluding possible growth in the future.
Underground Mine 1.0 to 1.25 MVA PS 1 Olkilahti 0.1 to 0.2 MVA Mine area 0.5 to 0.63 MVA Crushing & Concentrator 2.5 to 3.15 MVA (combined)
For lighting and other building electrification purposes is required 230/400V voltage dis-tribution with 315…630kVA transformer.
11.2.3 Transmission line 110 kV/45kV, main incomer
Total length of the transmission line is 20.2 km and starting point is at UPM´s hydro-power-station in Katerma. The line ends up at the process plant area of the Silver Mine. The connection from Katerma to the UPM’s line is with earth cable 110 kV/45 kV to transformer station. In the Silver Mine area, there is a 45 kV/ 20 kV transformer station.
11.3 Electricity
The mine area total power for installed total load in mine area will be 206 kW.
11.3.1 Electric network layout
Main switchgear will be with main incomer and back-up incomer. Medium voltage main switchgear will be in the PPB because of the largest loads. Also MCC of building electrification will be located in the PPB.

Bankable feasibility study update May 28th 2014 rev 03
102
Distribution transformers located far from main medium voltage switchgear will be con-nected via RMUs as a chain. Closed ring connections are not required, but some cable routes to mine may have in-creased risk of damages and some routes might be critical due to difficulties in repairing possible damages on the cable. Incomers or incomers and a sectionalizer have to be equipped with interlocking which prevents parallel connection of these two lines. Lay-out of electric network is presented in Figure 39.
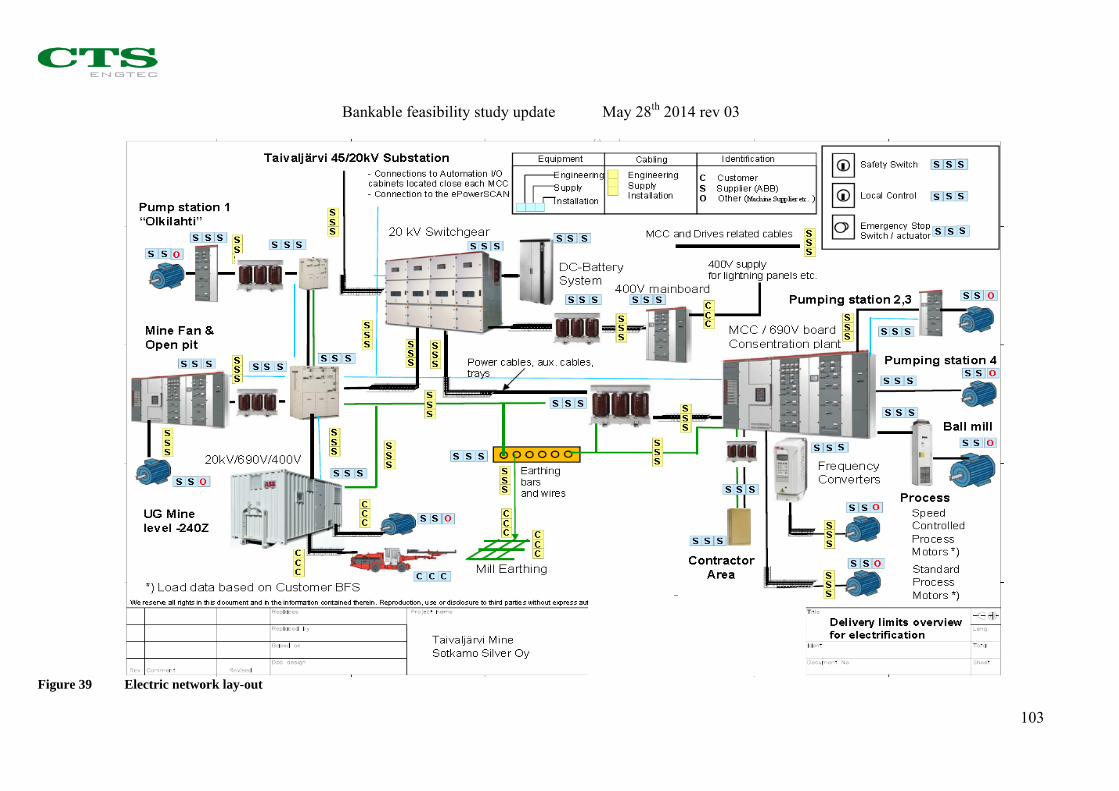
Bankable feasibility study update May 28th 2014 rev 03
103
Figure 39 Electric network lay-out

Bankable feasibility study update May 28th 2014 rev 03
104
11.3.2 Protection
Each part of the network has to be equipped with an independent short circuit and earth fault protections. For short-circuit protection three phase over current relays are needed. For earth fault protection either earth fault current protection or residual voltage protec-tion or both are needed. Both short-circuit and earth fault protections have to be coordinated with externally con-nected networks. Utility companies will give more accurate instructions or requirements.
11.3.3 Earth fault protection at 20kV
Both incoming feeders and all outgoing feeders at main switchgear will be equipped with sensitive directional earth fault protections. Feeders at RMUs don’t need earth fault pro-tection. Operation of earth fault protection depends on the magnitude of earth fault current. With very low current identification of the faulty feeder might be difficult or even impossible. Safety can still be guaranteed with residual voltage based protection, which trips incom-ing feeders. Earth fault current is received from system grounding or capacitances of wires. Shielded cables generate higher earth fault current than overhead lines. System grounding can be executed by grounding neutral point of main transformer or by grounding neutral point of separate grounding transformer. That current is preferred to be limited to 5-10A by a sep-arate resistor. Earth fault currents of 20kV wires: Overhead line 0.067 A/km PAS-wire 0.054 A/km Cables 1.3-2.1 A/km (typical cross sections)
Earth fault current is the lowest on isolated networks with short cable length. Protection would then be able to detect earth faults on all the other feeders but mine feeder. Residual voltage protection with two steps might be suitable for that feeder. With time delay, which is coordinated with earth fault protections of other feeders, it would first trip the mine feeder and after some delay the incomer. If both the mine and the pumping station have shielded cables, earth fault current would be high enough for pro-tection to operate properly. System grounding via 5-10A resistor would provide a lot of current for protection of all feeders to operate properly.
Bankable feasibility study update May 28th 2014 rev 03
105
11.3.4 Re-closing
Relaying of line will have re-closing operations. Re-closing will be activated on earth faults and on short circuits. Re-closings automatically connect voltage back to the line af-ter fault. Quite commonly insulation level of faulty overhead line will be restored during short breaks. Typical reason for this kind of faults is lightning and also some sticks or birds on the lines. Re-closing schemes have typically one to three fast auto re-closings shots with 300…1 000 ms dead time and 100…500 ms burning time and one long time shot with dead time of 30…60 s. It still should be noted that during the first dead time of auto re-closing all processes will be lost. Anyhow the line would automatically become available, if re-closings were suc-cessful. If the last re-closing fails, the line will be left dead and fault has to be localised by using fault patrol.
11.3.5 Cables
Because short-circuit current level are so low, also quite low cross sections can be used without jeopardising their thermal strength.
11.3.6 RMU’s disconnectors
Distribution transformers which are close to the main switchboard don’t need a separate disconnector in front of them. Anyhow distribution transformers on the pumping station and down on the mine would need a disconnector or load disconnector in front of them. Down on the mine RMU with a load disconnector is preferred. Gas insulated construc-tion is preferred. If connection line to pumping will be installed to poles, overhead line or pole mounted cable, disconnector on the pole would be acceptable. With underground cable RMU with a load disconnector is preferred.
11.3.7 Spare feeders
Reservation for additional loads in the future can be the base for spare capacity on MCCs, installed spare feeders on switch boards or for just empty space for additional equipment. On the cable network any cable which has enough capacity can be cut and can be divided to two or more distribution transformers by new RMU-unit.
11.3.8 Single line diagrams
Silver Mine 20kV single line diagram shown in the Figure 40.
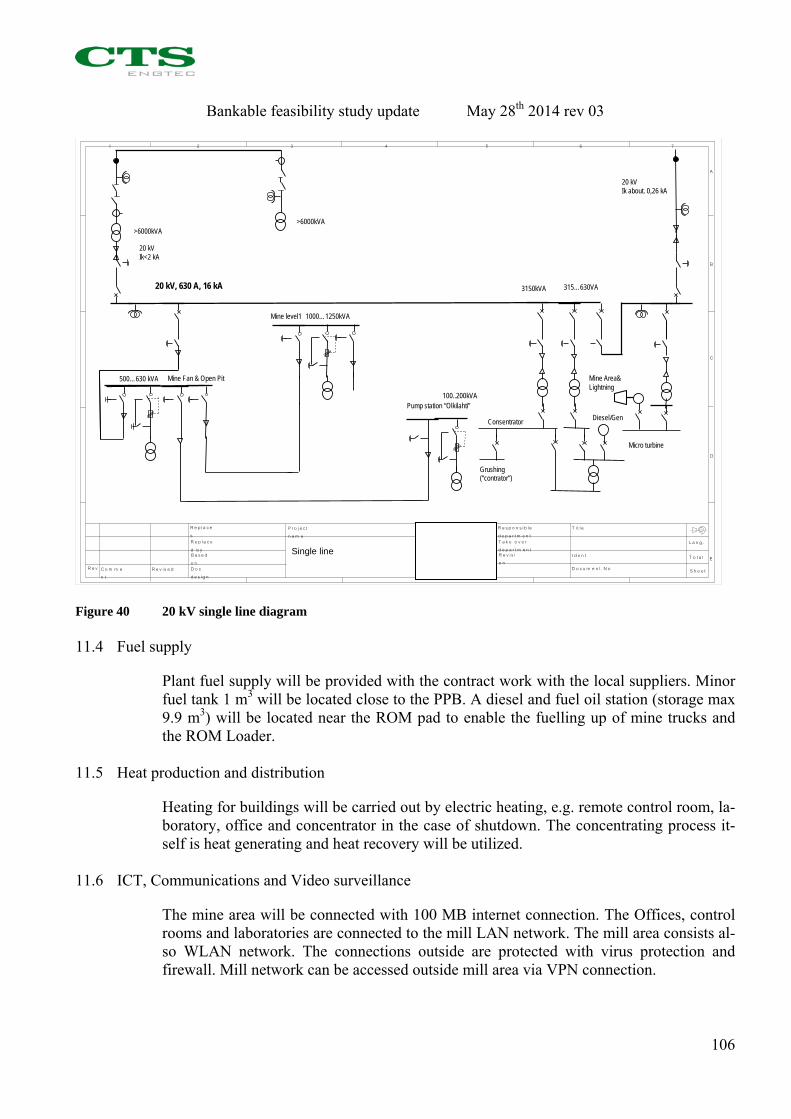
Bankable feasibility study update May 28th 2014 rev 03
106
L a n g .
T i t l e
T o t a l
S h e e t
EI d e n t
D o c u m e n t N o
R e s p o n s i b l ed e p a r t m e n tT a k e o v e rd e p a r t m e n tR e v i s io n
P r e p a re dC h e c ke d
P r o j e c t n a m e
R e p l a c esR e p l a c ed b yB a s e do nD o cd e s i g n
R e v i s e dC o m m en t
R e v
1 2 3 4 5 6 7
A
D
C
B
20 kVIk about. 0,26 kA
Single line
20 kV, 630 A, 16 kA
18.11.2011 J.Willman
20 kVIk<2 kA
Micro turbine
Consentrator
Mine level1
Grushing(“contrator”)
Diesel/Gen
1000…1250kVA
>6000kVA>6000kVA
500…630 kVA Mine Fan & Open Pit Mine Area&Lightning
Pump station “Olkilahti”
3150kVA 315…630VA
100..200kVA
Figure 40 20 kV single line diagram
11.4 Fuel supply
Plant fuel supply will be provided with the contract work with the local suppliers. Minor fuel tank 1 m3 will be located close to the PPB. A diesel and fuel oil station (storage max 9.9 m3) will be located near the ROM pad to enable the fuelling up of mine trucks and the ROM Loader.
11.5 Heat production and distribution
Heating for buildings will be carried out by electric heating, e.g. remote control room, la-boratory, office and concentrator in the case of shutdown. The concentrating process it-self is heat generating and heat recovery will be utilized.
11.6 ICT, Communications and Video surveillance
The mine area will be connected with 100 MB internet connection. The Offices, control rooms and laboratories are connected to the mill LAN network. The mill area consists al-so WLAN network. The connections outside are protected with virus protection and firewall. Mill network can be accessed outside mill area via VPN connection.
Bankable feasibility study update May 28th 2014 rev 03
107
The process surveillance and area monitoring will be done with CCTVs (which are main-ly remote controlled). The location of CCTV and monitored points are: main access gate process plant area camera open pit UG mine entrance crushed fine ore storage mill feed flotation cells, 3 pcs filters, 3 pcs concentrate rooms, 3 pcs tailings pond The telephone connections are based on mobile phones. A separate base station will be located to the area.
11.7 Access road R1 and other roads
The new access road will be 7 m wide paved with 150 mm thick crushed aggregate layer. Substructure will be constructed displacing the peat with coarse side rock. Peat thickness varies between 0 – 4.7 m. Peat thickness data is based on GTK peat report. Vertical alignment of the road from natural ground level will be 1.5 m and road slopes 1:2. All other roads R2 - R13 will be built with same principle and gradually at need with other construction. The location of roads is presented on Appendix 5 Mine area layout.
11.8 Process Plant Area Buildings
11.8.1 Crushed fine ore storage
The basement of the storage will consist of concrete bed and foundations. Foundations will consist of tunnel for feed conveyor to the PPB. Dimensions of the tunnel will be 40 m length, 4 m width and 3 m height. Fine ore storage will be covered by canopy with steel framework and PVC coated polyester fabric cladding.
11.8.2 Process plant building (PPB)
The PPB will include the concentrator and all other related process equipment. An ele-vated control room, electrical switch room and concentrate storage will be built inside the PPB. The plant office and reception with laboratory will be located adjacent to the PPB. The PPB will be serviced by a 15 t overhead maintenance crane extending the full length of the building. The PPB will be an insulated building with steel framework and PVC coated polyester fabric cladding.
Bankable feasibility study update May 28th 2014 rev 03
108
11.8.3 Office building with laboratory
Office building and facilities will consist of leased barrack with steel cladding. The la-boratory will be adjacent with office building.
11.8.4 Drill core storage and workshop
Core storage and workshop, total of 300 m2, will consist of leased building with steel framework and PVC coated polyester fabric cladding. The floor will be asphalt; core logging will be handled in the insulated and heated part of the storage total of 160 m2.
11.8.5 Explosives container
Explosive storage will be in an insulated 40 ft steel container by contractor.
11.8.6 Fencing
The 20/45 kV main substation will be fenced with 2 m high chain wire fence and will have locked gate.
11.8.7 Site safety and security
First aid facilities will be located in the office building. There will be basic wall mounted first aid kits through the PPB. The process plant area, mine area and the access control point will be well-lighted. The access road is monitored from the PPB control room and will be equipped with gate.
11.8.8 General maintenance
Security, cleaning service, snow removal, cesspit emptying and waste management will be done by local suppliers.

Bankable feasibility study update May 28th 2014 rev 03
109
11.9 Tailings management facility (TMF)
The Tailings Management Facility (TMF) will consist of a 28 ha tailings pond, 1.05 ha settling pond 1, 5.1 ha settling pond 2, 1.5 ha settling pond 3, approximately 810 m2 set-tling pond 4 and 2.3 ha wetland treatment area. TMF will be located in 500 m SW from the process plant area except SP 4 which is located in 100 m NE. The facility works as a settlement pond system to separate the tailings from the accom-panying water and also as a final storage of the majority of tailings. The TMF in its final size is designed to hold tailings of 9 years operation. At the lowest natural ground level of the TMF the pond dam is designed to be construct-ed from +210m ASL to an elevation of +218.90 m ASL. The tailings pond HW –level will be +217.40 ASL and +217.20 ASL in the settling pond. The TMF is designed according to the Environmental Permit and the Pond dam struc-tures have to fulfil the requirements of the Dam Safety Instructions. On the TMF area is located a few good building stone deposits which will be utilized for construction. TMF is presented in Appendix 10 Tailings Management Facility.
11.9.1 Tailings pond (TP)
The Tailings pond will be constructed in two stages. TP 1st stage will consist 14.7 ha (420 000 m3) and TP 2nd 10.3 ha (150 000 m3). The volumes are defined from HW-level. According to the Environmental Permit as large area as possible of the bed layer of the pond is to build up of natural compressed or constructed peat layer. Alternative compac-tion structure can be carried out e.g. bentonite mat to fulfil the standards of the Permit. The slopes of the dam will be 1:2.4-3.0 on the upstream and 1:2 on the downstream. The bentonite mat is required as the compaction structure of the upstream slope. The core of the dam will build up of till with the crest of 4m wide. The tailings in the tailings pond will be covered with water to prevent dust emissions. The tailings will be pumped from the plant as slurry via an overland pipeline. The pipe-line will be located around the dam and will beach tailings slurry through outlets. The tailings will be discharged from the perimeter wall through a spigot or equivalent deliv-ery system with multiple open-end delivery stations to form a beach that slopes towards the centre of the facility. Each of the open end delivery stations will comprise a slotted pipeline that extends down to the bottom of the facility and a valve to control the flow. Two standard structures of the dam are presented in the Appendix 11 Standard cross-section of TP and SP dam and Appendix 12 Standard cross-section of TP dam at till slope.

Bankable feasibility study update May 28th 2014 rev 03
110
11.9.2 Settling pond 1 (SP1)
The pond will be excavated on a till hill to ensure that purged water’s quality is accord-ing to environmental permit regulations. The pond area is 1.05 ha and volume 23 000 m3. The natural peat layer of the bottom of the pond will be replaced with bentonite mat which is also required as the compaction structure of the upstream slope of the dam. The dam will be built with similar structure as the tailings pond dam.
11.9.3 Settling pond 2 (SP2)
The pond 2 area is 5.1 ha and volume 190 000 m3. The natural peat layer of the bottom of the pond can be utilized but it has to be weighted e.g. geotextile/barren rock structure to prevent peat for rising or moving. The dam will be built with similar structure as the tailings pond dam.
11.9.4 Settling pond 3 (SP3)
The pond 3 area is 1.5 ha and volume 25 000 m3. The natural till layer of the bottom of the pond can be utilized and the structure of the dam can be completely constructed of till with water permeability not more than natural till at the pond area.
11.9.5 Settling pond 4 (SP4)
The pond 4 area is 810 m2 and volume 540 m3. SP 4 will be excavated on a till hill in the south of barren rock area along the road R4. At the SW end of the pond there will be built pump station 2.
11.9.6 Wetland treatment
Wetland treatment area is 2.3 ha and on natural state with thick peat layer. From Wetland treatment water will be discharged to a ditch leading to Koivupuro trickle.
11.9.7 Marginal ore storage
Marginal ore storage will be 0.8 ha large and locate along west side of R4. The bed layer of the area can be built up of natural compressed (or constructed) peat layer. The margin ore storage area drainage water will be discharged to SP 4.
11.9.8 Barren rock area
Barren rock area will be 1.2 ha large and locate along west side of R4. The requirements of the foundations of the area are similar to Margin ore storage. The barren rock area drainage water will be discharged to SP 4.
Bankable feasibility study update May 28th 2014 rev 03
111
11.9.9 Overburden disposal area
Overburden disposal area will be 2 ha large and located north of margin ore storage. Overburden can be built up on the natural peat.
11.9.10 Noise barrier
The noise barrier will be built on the NE side of the open pit. The most of the barrier ma-terial will be utilized overburden from the open pit.
11.9.11 Drainage
All drainage water from the process plant area, margin ore storage and barren rock area will be discharged to the SP 4 and then pumped to the tailings pond or SP 3. Drainage water from open pit and UG will be pumped to the tailings pond or SP 3.
11.10 Water circulation and supply
The plant area water system comprises Raw Water, Process Circulation Water and Pota-ble Water. There will be water pumping stations in five different locations: Olkilahti Settling Pond 4 UG mine Open pit Tailings Management Facility (SP 2) Water will be supplied also from smaller water sources: mine area raw water and potable water pumping stations, where water is collected from ground water. Raw Water will be supplied from the Tipasjärvi Lake. Process Water will be extracted from the plant and recycled. The water balance is made up of mostly process water and any deficit will be obtained from decanted tailings water. Potable water will be trucked in or pumped from an on-site well and stored in a tank within the PPB as required. Sanitary purified water is conducted to through the Wetland treatment to Koivupuro trickle. The plant area water system water circulation control will be implemented so that the concentrator plant internal water circulation is as effective as possible. Most of the con-centrator plant circulation water is pumped with solids to the tailings pond, where water is clarified from the solids. Tailings pond’s water is conducted through the settling ponds from where circulation wa-ter is pumped back to the concentrator plant. Most of the settling ponds’ water consists of the tailings pond’s decanted water and UG mine raw water.

Bankable feasibility study update May 28th 2014 rev 03
112
Tailing pond’s function is also to be long period settling pool for the extra water. Mine extra water is over flowed through the tailings and settling ponds to the wetland treat-ment and to Koivupuro trickle.
11.10.1 Process water
Process circulation water will be stored in a 45 m3 circulation water tank within the PPB. In the normal run the most of the process water comes to the concentrator plant from the settling pond 2’s circulation PS 3. Circulation water consists of the settling pond 2 and TP’s rainwater, UG mine raw water and tailing pond’s clarification water. Settling pond 4 pumping station’s water (PS 2) and open pit pumping station’s water pumped to the tailings pond or SP 3. Olkilahti PS 1 raw water for the circulation water tank feed is used, if circulation water PS 3 is not in operation, for example, in maintenance situations. Mine area process water pumping stations (1…3) are equipped with level control switch-es, local control panels and reserve pumps and pumps can be controlled from the PPB’s DCS or pumping station’s local control panels.
11.10.2 Raw water
Raw water is pumped from Olkilahti (PS 1) to Raw Water tank (15 m3) within the PPB. Normally Olkilahti PS 1 raw water is used only for TMF start-up situations and TMF cir-culation water quality problems. PS 1 equipped with level control switch, local control panel, reserve pump and pump can be controlled from the PPB’s DCS or pumping station’s local control panel.
11.10.3 Chemical feeding stations
Reservation for stations will be designed in following positions: TP → SP2 SP2 → SP1 SP3
11.10.4 Sewage disposal, bio-chemical
Solid waste will be transported to the municipal waste treatment. Purified sewage water will be discharged to the Wetland treatment.
11.10.5 Water treatment and balance flow sheet
Water treatment and balance flow sheet is presented in the Figure 41.

Bankable feasibility study update May 28th 2014 rev 03
113
Figure 41 Water treatment and balance flow sheet
Bankable feasibility study update May 28th 2014 rev 03
114
12 ENVIRONMENTAL STUDIES, LEGISLATION AND PERMITTING
12.1 Environmental Permit
Sotkamo Silver has received the Environmental Permit for Silver Mine in April 2013. The Environmental Permit concerns the following activities as applied: Total mining volume is under 550 000 t/a (ore, barren rock and building stone) Crushing ore, barren rock and building stone Concentrating Production of the metal and pyrite concentrates Discharging of the purified process and waste water to Koivupuro stream Mining waste treatment and piling and related auxiliary activities
12.1.1 General
The Permit holder has to sufficiently be aware of the environmental impacts and risks of the operation by monitoring the process, emissions and effects of the operation constant-ly.
12.1.2 Water supply and discharge
For Sotkamo Silver has been granted right for water supply from Olkilahti, Pieni Tipas-järvi Lake max 23 m3/h. Also ground water pumping from open pit and underground mine is allowed for drainage purpose. The water circulation control will be implemented so that the concentrator plant internal water circulation is as effective as possible. The purified process and waste water is allowed to discharge through Wetland treatment to a ditch leading to Koivupuro trickle.
12.1.3 Tailings Management Facility
At the operational stage there has to be constantly sufficient capacity of water reservation and purification for once every 20 years rainfall recurrence interval. The concentration of sulphur in tailing has to be as low as possible, annual average value < 0.3%. The requirements of the structure of the ponds and dams are presented in chapter 10.9.
12.1.4 Dust generation and emissions to air
The dust generation targets of the crusher and concentrator has to be equipped with local dust extraction and filtering system. In the open-air the crushed ore conveyors have to be covered and equipped with dust extraction system. At the open pit, piles and tailings pond the dust spreading to environment has to be pre-vented by watering. At the open pit the dust generation targets can also be covered.
Bankable feasibility study update May 28th 2014 rev 03
115
12.1.5 Noise and vibration
The open pit and building stone blasting has to be mainly executed at the day time with prior notice. Equivalent noise levels at the nearest households for day time (07:00 to 22:00) has to be <55dB and < 50dB for night time (22:00 to 07:00). It is recommended that at the summer-time 1.5. – 31.8. equivalent noise levels at the nearest leisure households for day time (07:00 to 22:00) would be <45dB and < 40dB for night time (22:00 to 07:00). The blasting vibration effect has to be minimized by blasting technical solutions. The vi-bration velocity at the nearest households for night time (22:00 to 07:00) has to be < 2 mm/s.
12.1.6 ROM and margin ore storage
On the ROM storage is allowed to store max 40 000 t at the time before crushing. On the margin ore storage is allowed to store max 100 000 t at the time.
12.1.7 Barren rock and overburden
Technically suitable barren rock is not waste, if it’s utilized for the mine area construc-tion immediately or after short period storing. The sulphur content has to be < 0.3% and without acidification potential. The barren rock with sulphur content < 0.8% can be utilized for the mine area construc-tion if it’s placed constantly under surface or groundwater level. Removed overburden is not waste, if it’s utilized for the mine area construction immedi-ately or after short period storing. The metal content of the overburden may not exceed the requirements of the law.
12.1.8 Chemicals and fuel
The chemical and fuel storages are to build to meet the standards and are inspected regu-larly to reduce risk of spillages.
12.1.9 Monitoring and reporting
The detailed monitoring program is to be prepared in accordance with the permit. The re-ports must be provided to Kainuu Centre for Economic Development, Transport and the Environment (ELY) at determinate times.
Bankable feasibility study update May 28th 2014 rev 03
116
12.1.10 Mine closure and rehabilitation plan
The detailed mine closure and rehabilitation plan is to be prepared in accordance with the principles and technical details of the permit and submitted to the Regional State Admin-istrative Agency (AVI) for acceptance.
12.1.11 Environmental Bond
The requirement of the environmental bonds is defined in the Environmental Permit: Construction of the Water treatment system 200 000 € Post-closure Water treatment and monitoring 500 000 € Ore storage areas as per 1. operational year plan 4 €/m2 Barren rock area as per 1. operational year plan 2 €/m2 Tailings pond area as per 1. operational year plan 4 €/m2 Rehabilitation in case of changing or cancelling the permit 200 000 € Expenses in case of changing or cancelling the permit 10 000 € (AVI)
12.2 Land Use and Building
Sotkamo Silver has purchased the whole mining concession and some adjacent areas, to-tal 428 ha. Land use and building development is controlled by Land Use and Building Act. The purchased areas are presented in Appendix 13 Map of Land Use and Appendix 14 Map of Real Estate.
12.3 Mine Safety Permit
Sotkamo Silver has received a Mine Safety Permit for the Silver Mine according to new safety requirements on 15th January 2014. The Company will be the first mining-company in Finland to start-up operation under the new mine-safety permit. All new mines have to seek authorisation and old mines will be forced to upgrade its op-erations to meet new requirements. This new permit is required along with a mining li-cense to be engaged in mining. It is approved by the Finnish Safety and Chemicals Agency (TUKES). The Mining Authority inspects mines regularly, usually once a year. The mining operator shall designate an authorised person who is in charge of safety. This person of the Silver Mine has been authorised by TUKES. The Mine Safety Permit includes the following activities: Information of activities provided by contractor Mine construction project plan and schedule Overall plan Operation’s risk assessment Operating principles for the prevention of accidents and documentation Internal emergency plan

Bankable feasibility study update May 28th 2014 rev 03
117
12.4 Equator Principles
The Equator Principles is a risk management framework, adopted by financial institu-tions, for determining, assessing and managing environmental and social risk in projects and is primarily intended to provide a minimum standard for due diligence to support re-sponsible risk decision-making. Sotkamo Silver is following instructions of the Equator Principles.
12.5 Social Licence to Operate
According to Fraser Institute: “The Social Licence to Operate (SLO) refers to the ac-ceptance within local communities of both mining companies and their projects. In order to obtain an SLO it is necessary to develop good relationships with all stakeholders, es-pecially with local communities. The credibility of mining companies is based on mutual respect, honesty, open dialogue, transparency, timely responses to community concerns, information disclosure, and constancy and predictability in the companies’ ethical be-haviour. Obtaining an SLO is essential for reducing the risks of social conflicts and for enhancing a company’s reputation.” Sotkamo Silver has developed SLO especially with local people and communities for several years and obtained good transparency and trust.

Bankable feasibility study update May 28th 2014 rev 03
118
13 PROJECT EXECUTION
Project execution section focuses on giving the reader brief information about the future project execution and contract strategy as well as the preliminary construction schedule.
13.1 Execution and contract strategy
Since Sotkamo Silver is a relatively small mining company with limited resources, EPCM (Engineering Procurement Contract Management) approach is chosen as the cur-rent execution strategy. EPC is possible approach to build up the beneficiation process plant excluding civil works. EPC is used in electrical and automation including financ-ing.
13.2 Preparation for execution phase
The target for the Preparation for Execution (Pre-Ex) phase is to improve the definition of the project to justify CAPEX and OPEX estimates at ±10% accuracy level and to have all required permits in place. Selected Long Lead Items (LLI) may have to be purchased or at least preparations for purchasing being completed during Pre-Ex.
13.2.1 Project management
In addition to planning and following-up the activities described in the following sub-sections, the Project Management must plan, recruit, establish and organize the Owner’s project team, both for the Pre-Ex phase itself and later for the Execution phase. Owner’s activities related to financing, potential partners, off-take agreements etc. are not discussed in this BFS Update.
13.2.2 Pre-engineering
The main technical and engineering activities in the Pre-Ex phase will be: Additional geotechnical and hydrological sampling, testing and engineering related to
the mine area, processing plant area and TMF area. Additional geological drilling to improve the understanding of the deposit, move re-
sources to a higher status of definition and possible increase the resource and reserve estimate.
Field work related to the environmental permitting process. Laboratory and pilot scale beneficiation tests in order to investigate the effects of var-
iations in ore quality and to optimize the chemical recipes and costs. Basic Engineering, in the first phase to support the preparation of ITB for the EPCM
contract and engineering of LLIs, and in the second phase to prepare for Detailed En-gineering.
Bankable feasibility study update May 28th 2014 rev 03
119
13.2.3 Permitting, land use plans and CSR activities
Efforts and activities to improve the local knowledge, understanding and support for the project must be substantially increased. A communication strategy must be developed and implemented. Mining Permit and Environmental Permit has been received as well as the Mining Safety Permit. In Pre-Ex phase the other permit applications will be prepared and handled to authorities.
13.2.4 Procurement
The main procurement activities during Pre-Ex will be: Preparation of ITB for the EPCM contract Bidding process and EPCM contract award RFQs, bid evaluation and possible contracts for LLIs.
13.3 Execution phase
Sotkamo Silver’s final investment decision is scheduled after securing the project financing. Execution planning will mostly be the responsibility of the EPCM contractor. However, there are certain elements that need to be considered by the Owner at an early stage. Scheduled duration of the construction phase including commissioning is 12 months. The first sections are scheduled to be ready for commissioning 10 months after start of construction.
13.4 Production start and ramp-up
After commissioning is completed the production will be started and the following ramp-up schedule is foreseen: The total ramp-up schedule is 4 months, based on mining company’s personnel own
experience and also on experience from other mining projects and process plant tun-ing time.
During the first four months it’s estimated that ore feed to crusher and mill will be 73 000 tn and Ag-Au-Pb concentrate production 470 tn.
During the first full year it’s estimated that after 8 months the average production level 2250 t/a of silver-lead concentrate production can be achieved.

Bankable feasibility study update May 28th 2014 rev 03
120
13.5 Implementation schedule
The preliminary main schedule for the project is shown below in Figure 42.
Figure 42 Silver Mine execution schedule

Bankable feasibility study update May 28th 2014 rev 03
121
14 MARKET STUDIES
Sotkamo Silver has valid long-term agreements for selling zinc and lead concentrate. For selling the lead concentrate Sotkamo Silver has contracted Letter of Intent (LOI) with the Smelter Company located in Central Europe. The commercial and legal terms of the LOI are legally binding. For selling the zinc concentrate Sotkamo Silver has contracted the Sales Agreement with Boliden Commercial AB, Sweden.

Bankable feasibility study update May 28th 2014 rev 03
122
15 CAPITAL AND OPERATIONAL COSTS
15.1 Capital cost estimate
The investment estimate of Silver Mine Bankable Feasibility Study Update is based on the quotations, the technical concept and scope presented in this report and on the corre-sponding layout drawings. The estimate covers Silver Mine with the following departments: Underground and Open pit (incl. water pumping, electrification, automation and
HVAC) Crushing plant Concentrator plant Mine Area, Environmental management and Utilities (Mine area i.e. roads and
earthwork, water pumping stations, potable water and sanitary water systems and all other mine area piping and cabling, platforms for the main transformers, Mine clo-sure costs etc.)
Indirect costs Contingency A detailed investment cost calculation for the Silver Mine has been prepared, presented in Appendix 15. The costs are based on enquiries and CTS’s cost file information. Main machinery costs are based on enquiries. The estimate on installation costs is based on the typical installation cost levels and price indication from machine suppliers and CTS reference information. The costs are com-plete contractor costs including installation material, wages, fringe benefits, insurance expenses, contractor's overhead and profit. The cost estimates of machinery and equipment correspond to the anticipated price level of the offers with fixed prices on the Q3/2013. All costs are specified in Euro’s without VAT. The total investment cost calculation summary is presented in the Table 19.
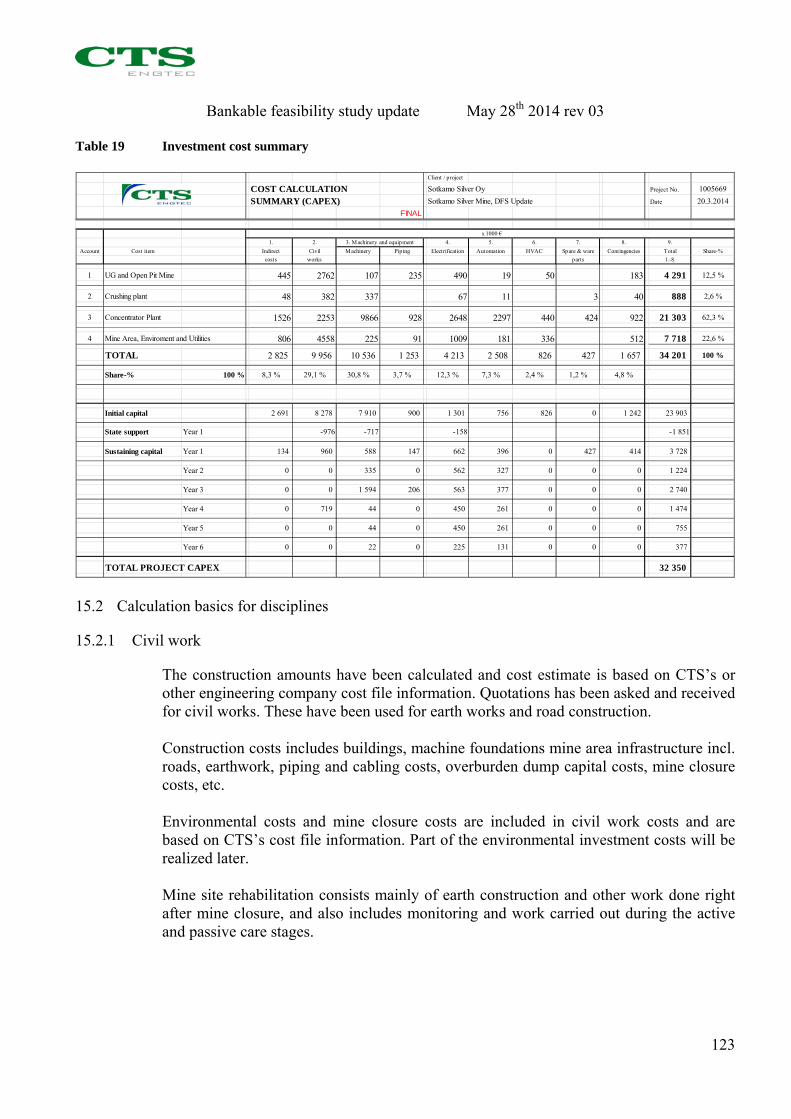
Bankable feasibility study update May 28th 2014 rev 03
123
Table 19 Investment cost summary
Client / project
COST CALCULATION Sotkamo Silver Oy Project No. 1005669
SUMMARY (CAPEX) Sotkamo Silver Mine, DFS Update Date 20.3.2014
FINAL
x 1000 €
1. 2. 4. 5. 6. 7. 8. 9.
Account Cost item Indirect Civil Machinery Piping Electrification Automation HVAC Spare & ware Contingencies Total Share-%
costs works parts 1.-8.
1 UG and Open Pit Mine 445 2762 107 235 490 19 50 183 4 291 12,5 %
2 Crushing plant 48 382 337 67 11 3 40 888 2,6 %
3 Concentrator Plant 1526 2253 9866 928 2648 2297 440 424 922 21 303 62,3 %
4 Mine Area, Enviroment and Utilities 806 4558 225 91 1009 181 336 512 7 718 22,6 %
TOTAL 2 825 9 956 10 536 1 253 4 213 2 508 826 427 1 657 34 201 100 %
Share-% 100 % 8,3 % 29,1 % 30,8 % 3,7 % 12,3 % 7,3 % 2,4 % 1,2 % 4,8 %
Initial capital 2 691 8 278 7 910 900 1 301 756 826 0 1 242 23 903
State support Year 1 -976 -717 -158 -1 851
Sustaining capital Year 1 134 960 588 147 662 396 0 427 414 3 728
Year 2 0 0 335 0 562 327 0 0 0 1 224
Year 3 0 0 1 594 206 563 377 0 0 0 2 740
Year 4 0 719 44 0 450 261 0 0 0 1 474
Year 5 0 0 44 0 450 261 0 0 0 755
Year 6 0 0 22 0 225 131 0 0 0 377
TOTAL PROJECT CAPEX 32 350
3. Machinery and equipment
15.2 Calculation basics for disciplines
15.2.1 Civil work
The construction amounts have been calculated and cost estimate is based on CTS’s or other engineering company cost file information. Quotations has been asked and received for civil works. These have been used for earth works and road construction. Construction costs includes buildings, machine foundations mine area infrastructure incl. roads, earthwork, piping and cabling costs, overburden dump capital costs, mine closure costs, etc. Environmental costs and mine closure costs are included in civil work costs and are based on CTS’s cost file information. Part of the environmental investment costs will be realized later. Mine site rehabilitation consists mainly of earth construction and other work done right after mine closure, and also includes monitoring and work carried out during the active and passive care stages.
Bankable feasibility study update May 28th 2014 rev 03
124
15.2.2 Machinery
Equipment costs for crushing plant, concentrator plant, water pumping stations and la-boratory equipment are based on enquiries and other equipment are based on CTS’s cost file information. Pumps, tanks, agitators, conveyors and steel structures as well as equipment insulation are presented under machinery costs.
15.2.3 Piping
The piping costs are based on the estimated piping lengths and are based on CTS’s cost file information. The costs include pipes, fittings, pipe supports and insulation.
15.2.4 Electrification
Equipment and materials for electrification have been specified. The cost estimate is based on CTS’s cost file information. Price indication for 45kV and 20kV voltage sys-tems is from ABB.
15.2.5 Automation
Equipment and materials for automation have been specified. The cost estimate is based on CTS’s cost file information or quotation. DCS cost is based on enquiry.
15.2.6 HVAC
Ventilation volumes are calculated by CTS and estimate is based on CTS’s cost file in-formation. Potable water and sanitary water systems, electric heating and fire protection facilities are included in HVAC costs.
15.2.7 Spare Parts
The spare part costs are estimated mainly on a percentage basis on the estimated material costs of process and auxiliary equipment, electrification, process control and HVAC. Main machinery spare part costs are based on enquiries.
15.3 Capital cost estimate per departments
15.3.1 Mining
Contracted outsourced mining is chosen as mining method for the Silver Mine. Therefore no investments will be spent to mining fleet. The investment cost of Open pit and Underground mine consist following items:

Bankable feasibility study update May 28th 2014 rev 03
125
Table 20 Capital cost breakdown, mining Cost break down Costs x 1 000 €
Civil work roads 98
Top soil and waste rock removal before start up 1 319
Drifting, before start up 1 346
Mine pumps and piping 342
UG mine electrification and automation (mostly for pumping) 509
UG mine HVAC 50
TOTAL 3 663
15.3.2 Crushing plant
The crushing itself is outsourced and therefore the cost of crusher is not included in Capi-tal cost. The cost covers the civil works of crushed ore storage, feeders and conveyors from stor-age to mill and electrical and automation of those.
Table 21 Capital cost breakdown, crushing plant Cost break down Costs x 1 000 €
Civil work of ore storage 382
Machinery 337
Electrification and automation 78
TOTAL 797
15.3.3 Concentrator plant
Beneficiation plant civil work is mainly building foundation and secondary structures of beneficiation building. The building itself is handled as leased equipment and included in OPEX except of installation. The main machinery includes the ball and rod mills with cyclones, flotation cells thick-eners, filtering equipment and other beneficiation process equipment. In the first phase the capacity is limited to 350 000 tpa mill feed due to EP requirements. It will be increased to 450 000 tpa in third production year after the update of EP. These costs are handled as sustaining capital cost and can been seen as a peak of investments in year three in the Table 19 Investment cost summary.
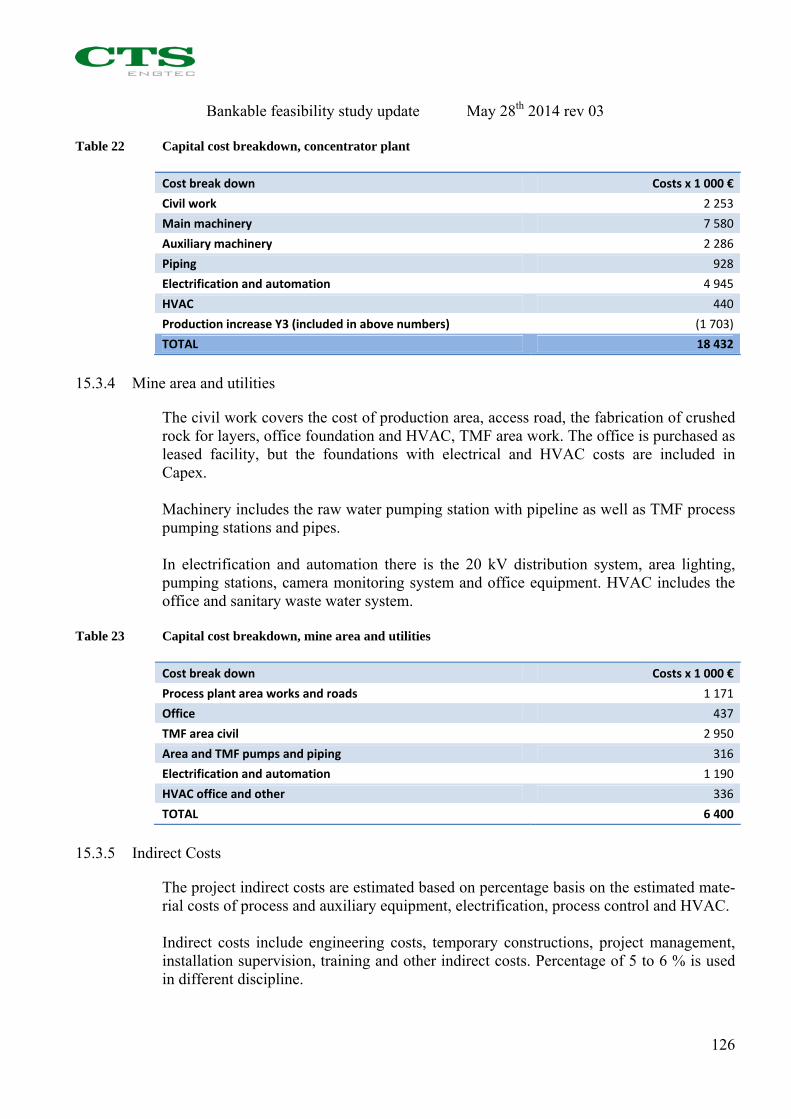
Bankable feasibility study update May 28th 2014 rev 03
126
Table 22 Capital cost breakdown, concentrator plant
Cost break down Costs x 1 000 €
Civil work 2 253
Main machinery 7 580
Auxiliary machinery 2 286
Piping 928
Electrification and automation 4 945
HVAC 440
Production increase Y3 (included in above numbers) (1 703)
TOTAL 18 432
15.3.4 Mine area and utilities
The civil work covers the cost of production area, access road, the fabrication of crushed rock for layers, office foundation and HVAC, TMF area work. The office is purchased as leased facility, but the foundations with electrical and HVAC costs are included in Capex. Machinery includes the raw water pumping station with pipeline as well as TMF process pumping stations and pipes. In electrification and automation there is the 20 kV distribution system, area lighting, pumping stations, camera monitoring system and office equipment. HVAC includes the office and sanitary waste water system.
Table 23 Capital cost breakdown, mine area and utilities Cost break down Costs x 1 000 €
Process plant area works and roads 1 171
Office 437
TMF area civil 2 950
Area and TMF pumps and piping 316
Electrification and automation 1 190
HVAC office and other 336
TOTAL 6 400
15.3.5 Indirect Costs
The project indirect costs are estimated based on percentage basis on the estimated mate-rial costs of process and auxiliary equipment, electrification, process control and HVAC. Indirect costs include engineering costs, temporary constructions, project management, installation supervision, training and other indirect costs. Percentage of 5 to 6 % is used in different discipline.
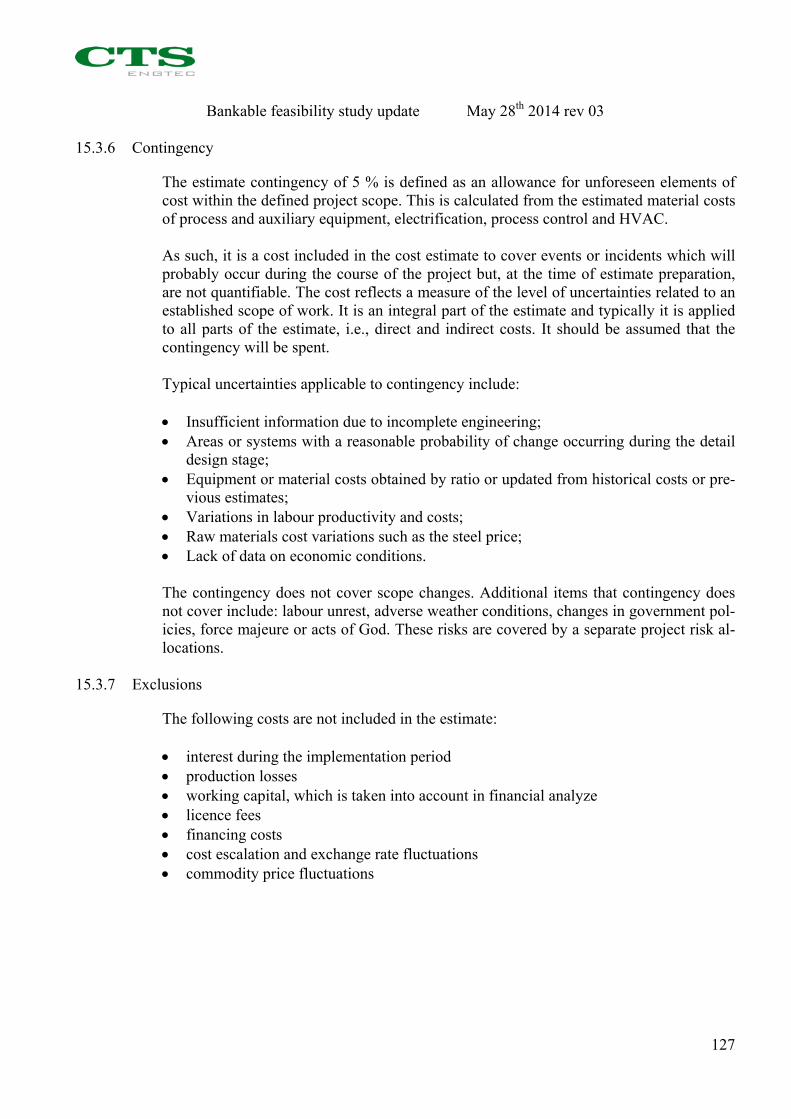
Bankable feasibility study update May 28th 2014 rev 03
127
15.3.6 Contingency
The estimate contingency of 5 % is defined as an allowance for unforeseen elements of cost within the defined project scope. This is calculated from the estimated material costs of process and auxiliary equipment, electrification, process control and HVAC. As such, it is a cost included in the cost estimate to cover events or incidents which will probably occur during the course of the project but, at the time of estimate preparation, are not quantifiable. The cost reflects a measure of the level of uncertainties related to an established scope of work. It is an integral part of the estimate and typically it is applied to all parts of the estimate, i.e., direct and indirect costs. It should be assumed that the contingency will be spent. Typical uncertainties applicable to contingency include: Insufficient information due to incomplete engineering; Areas or systems with a reasonable probability of change occurring during the detail
design stage; Equipment or material costs obtained by ratio or updated from historical costs or pre-
vious estimates; Variations in labour productivity and costs; Raw materials cost variations such as the steel price; Lack of data on economic conditions. The contingency does not cover scope changes. Additional items that contingency does not cover include: labour unrest, adverse weather conditions, changes in government pol-icies, force majeure or acts of God. These risks are covered by a separate project risk al-locations.
15.3.7 Exclusions
The following costs are not included in the estimate: interest during the implementation period production losses working capital, which is taken into account in financial analyze licence fees financing costs cost escalation and exchange rate fluctuations commodity price fluctuations

Bankable feasibility study update May 28th 2014 rev 03
128
15.4 Operation costs
The estimate covers Silver Mine with the following departments: Underground and Open pit (incl. water pumping, electrification, automation and
HVAC) Crushing plant Concentrator plant Mine Area, Environment and Utilities (Mine area i.e. roads and earthwork, water
pumping stations, potable water and sanitary water systems and all other mine area piping and cabling, platforms for the main transformers, Mine closure costs etc.)
Indirect costs An operational cost calculation for the Silver Mine has been prepared, presented in Ap-pendix 16. The costs are based on Quotations, CTS’s consumption calculations and SoSi infor-mation of the unit prices. All costs are specified in Euro’s without VAT. The inflation factor is not in use. The production cost through the various stages of production (mining, crushing, and con-centration) infrastructure and administration has been estimated at Euro 1 930 € per tonne of concentrate and 38.83 € per tonne of ore. No provisions are made in the estimate towards future escalation in costs. It is assumed that all the plant will operate 365 days/year and with 82% availability for crushing operation and 90% availability for rest of the plant. Mine and crusher are oper-ated 5 days per week. No provision was made for depreciation, financing expenses, royalties, directors’ and au-ditor’s fees, sales expenses such as discounts/rebates/sales commissions, etc.
15.4.1 Operation cost summary
A breakdown of operating costs by area is shown in Table 24. These costs, however, ex-clude depreciation, interest, sales and administrative expenses. The figures presented av-erage year 4.

Bankable feasibility study update May 28th 2014 rev 03
129
Table 24 Operation cost breakdown (year 4)
Cost break down Total 1 000 €/y €/tn of ore €/tn of products
Mining 10 210 22.48 1 117
Crusher 992 2.18 109
Beneficiation 4 399 9.68 481
Site general, environmental and utilities 2 038 4.49 223
TOTAL 17 639 38.83 1 930
The operation cost distribution for different cost items has been calculated and indicative factors, cost per ore and cost per total concentrate has been prepared, presented in Table 25.
Table 25 Operation cost per cost item (operation year 4 production 450 000 tpa)
Mine Crushing Beneficiation Site general Total 1000 € €/tn of ore
€/tn of product (AgAuPb)
Personnel 499.6 0.0 1 151.8 931.2 2 582.6 5.69 282.56
Electricity and heat
701.9 47.1 1 116.4 98.0 1 868.5 4.32 214.81
Contractor 8 833.2 908.5 0.0 425.0 10 163.3 22.38 1 112.33
Maintenance and spares
175.4 7.2 1 099.5 296.4 1 142.3 3.48 172.70
Consumables 0.0 0.0 823.6 10.1 830.7 1.84 91.21
Miscellaneous 0.0 29.6 207.3 277.6 514.5 1.13 56.29
Total 10 210.1 992.3 4 398.7 2 038.3 17 639.4 37.65 1 929.91
15.4.2 Open pit and underground mine
Quotation has been asked from several contractors for underground mining, overburden removal, drifting and open pit mining. The contractor is responsible of quarrying and haulage of ore to crusher. The used unit prices are presented in Table 26.
Table 26 Mining unit prices op mining ore
Cost break down Tonnage Y4 unit price €/tn Total €
Overburden removal 1.77
OP waste mining 550 000 1.7 935 000
OP ore mining 84 891 2.04 173 200
UG drifting 175 000 14.68 2 569 000
UG ore mining 369 344 13.96 5 156 000
TOTAL 1 179 235 avg 7.49 8 833 200
Overburden removal is included in Capex.
Bankable feasibility study update May 28th 2014 rev 03
130
In first two years the ore quarrying is limited to 350 000 tpa due to environmental permit regulations and will after that rise to 450 000 tpa after the environmental permit is updat-ed. Mining company is responsible of open pit and underground dewatering. The operation cost of these is included in energy price and maintenance.
15.4.3 Crushing plant
The ore crushing cost have been calculated based on quotation. Mining company is re-sponsible to supple the electricity. The superstructure of crushed ore storage is a leased building. The yearly cost of is based on quotation and are 29 600 €. Spare parts are calculated for conveyor and belt feeders from storage to mill.
15.4.4 Rental buildings
The superstructure of process plant building has a steel frame and light weight insulated claddings. A quotation of leased contract for this building has been received and used as operation cost. The yearly leasing cost is 130 600 €. The same solution is used for maintenance/core storage building and office. The yearly leasing cost for these are 83 600 €.
15.4.5 Electrification
Equipment and materials for electrification have been specified. The cost estimate is based on CTS’s cost file information or quotation. Price indication for 45kV and 20kV voltage systems is from ABB.
15.4.6 Electricity
The electricity amounts have been calculated and SoSi electricity price indication has been used in estimation. The mining company has made an agreement with UPM Kym-mene of the network connection fee and energy price. In the calculations the fixed fee for connection is 40 700 €/year. The energy charge is 43.00 €/MWh.
15.4.7 Heat
The necessary heat for underground mine is produced with LNG (liquid natural gas). Quotation has been asked for suppliers to invest for necessary storage and boiler unit to produce heat from LNG. This heated air is then blowed via shaft to UG. The yearly fixed fee of equipment is 119 600 €/year and energy production fee 63.49 €/MWh. Other buildings and facilities are heated with electrical heaters. The heat energy amounts have been calculated by CTS.

Bankable feasibility study update May 28th 2014 rev 03
131
15.4.8 Chemical consumptions
The chemical consumption has been calculated based on GTK report chemical consump-tions and chemical prices are based on price indication from supplier. The annual floatation chemical usage is 891.8 tn and cost 559 545 € for 350 000 tpa pro-duction level. For the 450 000 tpa production it is calculated that 720 000 € is used per year for these same chemicals. Minor part of chemicals is estimated to be used in TMF area annual cost of 10 100 €.
15.4.9 Beneficiation consumables
The ball and rod mill’s will use 5 kg of ball’s or rod bars per year per tn of ore feed to mill based on GTK test work. The annual cost of these are 72 900 € for smaller produc-tion and is increasing based on factor when the production level is changed.
15.4.10 Salaries and other personnel costs
The personnel costs have been calculated based on SoSi informed personnel amounts and salaries price indication. Mining company own personnel yearly salary cost are 2 582 600 €
15.4.11 Spare parts
The spare part costs has been calculated based on investment cost file information and the costs are estimated mainly on a percentage basis on the estimated material costs of process and auxiliary equipment, electrification, process control and HVAC. The yearly spare and wear part cost are 190 600 €.
15.4.12 Maintenance
The maintenance costs are evaluated and based on CTS cost file information estimates from equipment supplier. Total annual maintenance cost for whole operation is 1 170 000 €.
15.4.13 ICT and Telephone
The telephone and ICT costs are evaluated are based on CTS cost file information. The total annual cost are 45 000 €.
15.4.14 General Maintenance
The maintenance costs covering security, snow removal, cleaning, cesspit emptying and waste management are evaluated and based on CTS cost file information and are 44 000 €/year.
Bankable feasibility study update May 28th 2014 rev 03
132
15.4.15 Environment monitoring
The environment monitoring costs are evaluated and based on CTS cost file information.
15.4.16 Laboratory services
Silver Mine has asked quotation of total laboratory services. Based on this the annual fee of laboratory services is 309 600 €. The environmental monitoring is calculated as outsourced service as annual cost of 71 400 € based on CTS cost file information.
15.4.17 Mine closure
In the operation cost calculation Mine closure cost is calculated as yearly amount 150 000 €, which is collected to a bond to cover the mine closure cost.
15.4.18 Exclusions
The following costs are not included in the estimate: product transportation, included in product price land lease insurance costs
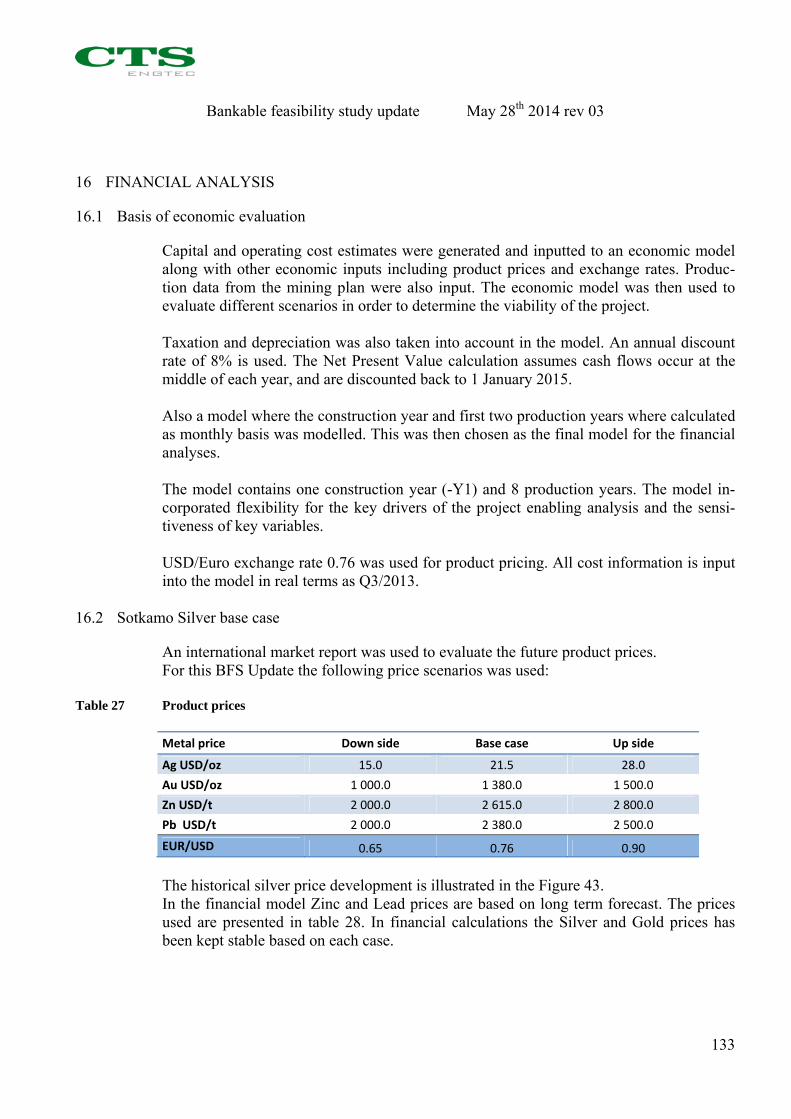
Bankable feasibility study update May 28th 2014 rev 03
133
16 FINANCIAL ANALYSIS
16.1 Basis of economic evaluation
Capital and operating cost estimates were generated and inputted to an economic model along with other economic inputs including product prices and exchange rates. Produc-tion data from the mining plan were also input. The economic model was then used to evaluate different scenarios in order to determine the viability of the project. Taxation and depreciation was also taken into account in the model. An annual discount rate of 8% is used. The Net Present Value calculation assumes cash flows occur at the middle of each year, and are discounted back to 1 January 2015. Also a model where the construction year and first two production years where calculated as monthly basis was modelled. This was then chosen as the final model for the financial analyses. The model contains one construction year (-Y1) and 8 production years. The model in-corporated flexibility for the key drivers of the project enabling analysis and the sensi-tiveness of key variables. USD/Euro exchange rate 0.76 was used for product pricing. All cost information is input into the model in real terms as Q3/2013.
16.2 Sotkamo Silver base case
An international market report was used to evaluate the future product prices. For this BFS Update the following price scenarios was used:
Table 27 Product prices Metal price Down side Base case Up side
Ag USD/oz 15.0 21.5 28.0
Au USD/oz 1 000.0 1 380.0 1 500.0
Zn USD/t 2 000.0 2 615.0 2 800.0
Pb USD/t 2 000.0 2 380.0 2 500.0
EUR/USD 0.65 0.76 0.90
The historical silver price development is illustrated in the Figure 43. In the financial model Zinc and Lead prices are based on long term forecast. The prices used are presented in table 28. In financial calculations the Silver and Gold prices has been kept stable based on each case.

Bankable feasibility study update May 28th 2014 rev 03
134
Table 28 Zinc and Lead price forecast
Metal 2014 2015 2016 2017 2018 2019 2020 2021 2022 2023
Zinc USD/t 2103 2248 2376 2466 2452 2615 2615 2615 2615 2615
Lead USD/t 2180 2258 2316 2326 2328 2380 2380 2380 2380 2380
The IRR/NPV sensitivity analyses were done only for Silver pricing and EUR/USD rate.
Figure 43 Silver price last 5 years (blue line is long-term average value)
16.3 Sensitivity analysis
The sensitivity analyses were performed for Silver pricing and EUR/USD exchange rate. Each variable was individually increased and lowered between “up-side” “down side” cases, whilst leaving the other base case parameters unchanged to test the sensitivity of the model to changing economic and operational conditions. The resulting effect on Net present value (NPV), internal rate of return (IRR) and investment payback time after tax is presented in Table 29. Same factors before tax are presented in table 30.

Bankable feasibility study update May 28th 2014 rev 03
135
Table 29 Resulting effects on NPV, IRR and payback time (tax included) Financial sensitivity NPV 1000 € IRR % Payback time (Y)
Base case 23 333 30.24 2.5
Down side Ag 15.0 392 8.39 ‐
Down side EUR/USD 0.65 12 510 20.10 3.4
Up side Ag 28.0 46 781 51.47 1.7
Up side EUR/USD 0.90 37 090 42.79 1.9
The payback time is calculated from the process start-up. In the EUR/USD cases Ag price 21.50 USD/oz was used.
Table 30 Resulting effects on NPV, IRR and payback time before tax Financial sensitivity NPV 1000 € IRR % Payback time (Y)
Base case 29 514 35.37 2.2
Down side Ag 15.0 1 012 9.01 7.6
Up side Ag 28.0 58 841 61.01 1.5
16.4 Cash flow
For Base Case an annualized cash flow position is shown in Figure 44 and a detailed cash flow analysis is given in Table 31.
Figure 44 Annualized cash flow, Base Case (after tax)
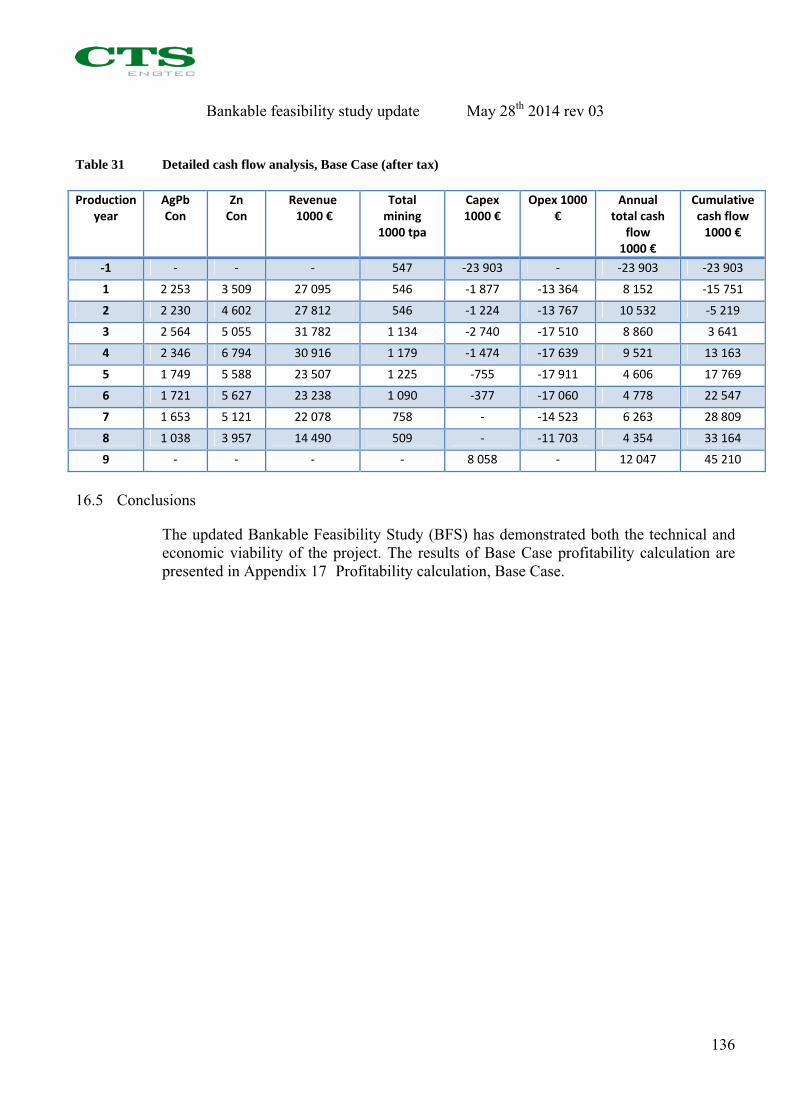
Bankable feasibility study update May 28th 2014 rev 03
136
Table 31 Detailed cash flow analysis, Base Case (after tax)
Production
year AgPb Con
ZnCon
Revenue 1000 €
Totalmining 1000 tpa
Capex1000 €
Opex 1000 €
Annualtotal cash
flow 1000 €
Cumulativecash flow 1000 €
‐1 ‐ ‐ ‐ 547 ‐23 903 ‐ ‐23 903 ‐23 903
1 2 253 3 509 27 095 546 ‐1 877 ‐13 364 8 152 ‐15 751
2 2 230 4 602 27 812 546 ‐1 224 ‐13 767 10 532 ‐5 219
3 2 564 5 055 31 782 1 134 ‐2 740 ‐17 510 8 860 3 641
4 2 346 6 794 30 916 1 179 ‐1 474 ‐17 639 9 521 13 163
5 1 749 5 588 23 507 1 225 ‐755 ‐17 911 4 606 17 769
6 1 721 5 627 23 238 1 090 ‐377 ‐17 060 4 778 22 547
7 1 653 5 121 22 078 758 ‐ ‐14 523 6 263 28 809
8 1 038 3 957 14 490 509 ‐ ‐11 703 4 354 33 164
9 ‐ ‐ ‐ ‐ 8 058 ‐ 12 047 45 210
16.5 Conclusions
The updated Bankable Feasibility Study (BFS) has demonstrated both the technical and economic viability of the project. The results of Base Case profitability calculation are presented in Appendix 17 Profitability calculation, Base Case.
Bankable feasibility study update May 28th 2014 rev 03
137
17 RISKS
17.1 Investment risk
The sensitivity analysis has been evaluated on five key variables within the cash flow: metal price (revenue), operating costs, capital expenditure, discount factor and exchange rate. The sensitivity analysis suggests that the Silver Mine operations are most sensitive to Ag price and USD/EUR currency volatility. The US Dollar/Euro exchange rate is an important factor at the Silver Mine as the ma-jority of costs are incurred in Euros whereas the majority of revenue is either generated in, or linked to the US Dollar.
17.2 Project risk
In the Silver Mine Project can be mentioned few identified risks: Appeals against Building Permit