beyond the reading wars: exploring the effect of child ...€¦ · and leslie e. katch university...
TRANSCRIPT

Beyond the Reading Wars: Exploring theEffect of Child–Instruction Interactions
on Growth in Early Reading
Carol McDonald Connor, Frederick J. Morrison,and Leslie E. KatchUniversity of Michigan
This study examined the influence of interactions between first graders’ fall lan-guage–literacy skills (vocabulary and decoding) and classroom instructional prac-tices on their spring decoding scores. Instructional activities were coded as teachermanaged or child managed and as explicit or implicit, as well as for change in amountof time spent in the activity over the school year. Findings revealed that specific pat-terns of instructional activities differentially predicted children’s decoding skillgrowth. Children with low initial decoding scores achieved greater decoding growthin classrooms with more time spent in teacher-managed explicit decoding (TME) in-struction. In contrast, for children with initially high decoding scores, amount ofTME had no effect. Children with low initial vocabulary scores achieved greater de-coding score growth in classrooms with less child-managed implicit (CMI) instruc-tion but with increasing amounts of CMI instruction as the school year progressed.However, children with high initial vocabulary scores achieved greater decodinggrowth in classrooms with more time spent in CMI activities and in consistentamounts throughout the school year. Children’s initial decoding and vocabularyscores also directly and positively affected their decoding score growth. These maineffects and interactions were independent and additive, thus children’s first-grade de-coding skill growth was affected by initial vocabulary and decoding skill as well astype of instruction received—but the effect of type of instruction (TME or CMIamount and change) depended on children’s initial vocabulary and decoding scores.Implications for research and educational practices are discussed.
SCIENTIFIC STUDIES OF READING, 8(4), 305–336Copyright © 2004, Lawrence Erlbaum Associates, Inc.
Requests for reprints should be sent to Carol McDonald Connor, Florida State University and theFlorida Center for Reading Research, City Centre Building, 227 North Bronough Street, Suite 7250,Tallahassee, FL 32301. E-mail: [email protected]
Do Not
Cop
y

There has been long-standing controversy regarding the best way to teach childrenhow to read (Ravitch, 2001). The debate has been fueled, in part, because each yearsignificant numbers of American children fail to reach functional levels of literacy(National Assessment of Educational Progress, 2000). In essence, the debate hascentered on the efficacy of phonics or code-based instruction versus whole lan-guage or meaning-based instruction (Rayner, Foorman, Perfetti, Pesetsky, &Seidenberg, 2001). Code-based instruction focuses on explicit and systematictraining in decoding including letter recognition, letter–sound correspondence,phonics, and phonological awareness. Meaning-based instruction views learningto read as a more natural process (Goodman, 1970) that requires consistent experi-ence with meaningful text within a literature-rich environment (Dahl & Freppon,1995). Unfortunately, as Rayner et al. noted, “the continued dichotomy of readingphilosophies produces fragmented instruction in classrooms rather than the inte-grated balance of skills and meaningful applications that research suggests areneeded to produce successful readers” (p. 61). Evidence accumulating systemati-cally over the past 20 years has documented that a combination of methods maybetter support children’s developing literacy. Most children appear to developstronger reading skills when provided explicit decoding instruction in combinationwith meaningful reading activities (Guthrie, Schafer, & Huang, 2001; Rayner etal., 2001; Taylor, Pearson, Clark, & Walpole, 2000). Consequently, there is a grow-ing trend toward “balanced” instruction in early reading instruction (see also P.Cunningham & Hall, 1998; Hiebert & Raphael, 1998; Pressley, 1998).
Yet, thepromotionofbalanced instruction leavesopen thequestionofwhatmightbe the best combination of basic skills instruction and meaningful reading activities.Animplicit and largelyuntestedassumption inmuch literacyresearch is that specificinstructional practices will be equally effective for all children. This universalisticview can be found in the literature supporting meaning-based instruction (e.g., Dahl& Freppon, 1995) as well as that promoting code-based instruction (National Read-ingPanel, 2000).However,ChildAptitude×Treatment interaction research, first in-troduced in the 1970s, revealed that these interactions may be important (Sternberg,1996). Some recent research has begun to explore the possibility that the efficacy ofinstructional practices may vary with the skill level of the student. For example,Foorman, Francis, Fletcher, Schatschneider, and Mehta (1998) found that childrenwith weaker phonological awareness at the beginning of the school year demon-strated greater growth in decoding skills in the code-based classrooms than did chil-dren with stronger phonological awareness. Juel and Minden-Cupp (2000) found ananalogous Reading Group × Classroom Type interaction. In their study, childrenwho started first grade with weaker reading skills (i.e., low-reading group) mademore progress in classrooms where there was greater emphasis on word recognitioninstruction. In contrast, children with stronger reading skills at the beginning of firstgrade (i.e., middle or high group) achieved greater reading progress in the classroomwhere the teacher emphasized a literature-rich environment with less emphasis on
306 CONNOR, MORRISON, KATCH
Do Not
Cop
y

code-based instruction. A major goal of our study was to further explore the impactof various instructional practices for children entering first grade with different lan-guage and reading skill levels.
CHILD CHARACTERISTICS
Children begin school with widely varying abilities in skills that support early lit-eracy development, such as phonological awareness, word decoding, and vocabu-lary, and these differences emerge surprisingly early (Stevenson, Parker,Wilkinson, Hegion, & Fish, 1976). For example Stipek and Ryan (1997) uncov-ered large social class differences in both cognitive and early literacy skills amonga sample of preschoolers and kindergartners. A recent observational study docu-mented meaningful social class differences in children’s acquisition of expressivevocabulary as early as 18 months of age (Hart & Risley, 1995).
Further, these individual differences appear to be largely sustained throughoutchildren’s school careers (Entwisle & Alexander, 1988). Scores on decoding, al-phabet recognition, and vocabulary tasks at kindergarten entry consistently pre-dicted academic performance throughout the first 3 years of formal schooling ex-perience (Dickinson & Tabors, 2001; Hart & Risley, 1995; Morrison & Cooney,2002; Stevenson et al., 1976). Additional research has revealed stability for1st-grade reading skill through 11th-grade reading experience and performance,even after accounting for children’s cognitive abilities (A. Cunningham &Stanovich, 1997; A. Cunningham, Stanovich, & West, 1994). Altogether, a grow-ing body of evidence testifies to the very early emergence and stability of variabil-ity among children in important literacy and literacy-related skills.
This study attempted to identify and incorporate two important child character-istics—decoding and vocabulary—as they interacted with instructional practice.Decoding skill, specifically alphabet recognition, letter-sound correspondence,and single word decoding, was selected because it is a foundational skill critical tothe development of proficient reading (Snow, Burns, & Griffin, 1998) and its in-struction is both salient and important in first-grade classrooms (Adams, 1990;Neuman & Dickinson, 2001; Rayner et al., 2001). Children’s vocabulary, an inte-gral aspect of language development (Locke, 1997, 1993), varies significantlyamong children at school entry, and individual differences appear to be relativelystable throughout childhood (Hart & Risley, 1995) and beyond (Nippold, 1988).Further, in two separate studies, there were no significant schooling effects on chil-dren’s kindergarten or first-grade vocabulary growth (Christian, Morrison, Frazier,& Masseti, 2000; Morrison, Smith, & Dow-Ehrensberger, 1995), yet it is an impor-tant predictor of later reading success (Anderson & Freebody, 1981; Catts, Fey,Zhang, & Tomblin, 2001).
BEYOND THE READING WARS 307
Do Not
Cop
y

INSTRUCTIONAL FACTORS
There is also appreciable variability in amount and type of language arts instructionprovided to children across classrooms (Juel & Minden-Cupp, 2000; Taylor et al.,2000; Wharton-McDonald, Pressley, & Hampston, 1998). For instance, Juel andMinden-Cupp (2000) described four classrooms that varied substantially in amountsofmeaningandcode-basedinstructionprovidedover thecourseof theschoolyear.
Teachers have been observed using elements of both code-based and mean-ing-based instruction while varying the amount of each type during the school year(Juel & Minden-Cupp, 1998; Rayner et al., 2001; Taylor et al., 2000). Dichoto-mous or categorical comparisons of classroom instructional practices may be inad-equate to describe fully teachers’ literacy practices. Grouping teachers by their pri-mary focus (e.g., code- vs. meaning-based) may oversimplify what is actuallyhappening in classrooms and undermine our ability to examine the complex effectsof both the amount and types of reading instruction teachers provide. Although in-struction has been defined using a number of methods, we wanted to describe in-struction in a way that could be used with a range of child outcomes including de-coding, comprehension, fluency, and so forth across a variety of classroom gradesand settings. Further, we wanted to capture the complexity of instruction whilerepresenting it in measurable variables. To this end, and relying on recent studiesof children’s reading skill development, we selected three specific dimensions ofinstruction: (a) explicit versus implicit instruction, (b) teacher-managed versuschild-managed instruction, and (c) change in type and amount of instruction overtime. Each of these dimensions is discussed more fully in the rest of this article. Afourth dimension, word level versus higher order, was not included in this studybecause it overlapped with the explicit versus implicit dimension. This would nothave been the case if our outcome had been, for example, reading comprehension,which might be differentially impacted by implicit word level (e.g., alphabet activ-ities vs. higher order activities—sustained silent reading).
Explicit Versus Implicit Instruction
The first dimension focuses on whether instruction is explicit or implicit in promot-ing growth of a particular skill, such as word decoding. For example, Foorman andher colleagues (see Foorman et al., 1998) grouped classrooms along the explicit–im-plicit continuumfocusingondecodingskill instruction (i.e.,Direct code,Embeddedcode, Implicit code). In our coding scheme, if, as in this study, word decoding is thetargeted skill, then instructional activities such as blending onsets and rhymes orteaching letter-sound correspondence would be considered explicit because thechildren’sattention isprimarilydirected tocomponentsofworddecodingstrategies.In contrast, activities like teacher-led discussions, in which the child’s attention ismore explicitly focused on comprehension (i.e., extracting meaning from text),
308 CONNOR, MORRISON, KATCH
Do Not
Cop
y

could still influence word-decoding skills in an implicit or incidental fashion. At anintermediate point would be implicit phonics (e.g., Torgesen et al., 2001) whereteachers expose children to word lists that contain similar spelling–sound corre-spondences but do not explicitly teach spelling–sound correspondences. Note that ifreading comprehension had been the outcome of interest, different sets of instruc-tional activities would have been defined as explicit or implicit.
As defined, explicit decoding instruction encompasses much of what has beendescribed as code-based instruction including teaching of phoneme–graphemecorrespondences, phonological awareness (e.g., onset-rime segmentation, blend-ing phoneme, segmenting phonemes), and letter names and sounds. Implicit de-coding instruction includes meaning-based activities like teachers reading to stu-dents, discussions about books, teachers and students reading together, andstudents reading and writing independently.
Teacher-Managed Versus Child-Managed Instruction
The second dimension refers to the degree that instructional activity and the child’sattention are primarily under the direction of the teacher (e.g., when the teacher isexplicitly instructing the children in word decoding strategies) or primarily con-trolled by the child (e.g., in sustained silent reading). This dimension is quite simi-lar to methods of instruction such as prescriptive (teacher-managed) andresponsive (teacher-managed moving to child-managed) (see Rayner et al., 2001)as well as “child-centered” and “teacher-directed” (Bredekemp & Copple, 1997).However, there are some important differences because the activity is coded ac-cording to whether the teacher or the child is responsible for directing attention toor “managing” the learning. Thus, activities that might be considered child-cen-tered activities, such as discussions about books, would be consideredteacher-managed because the teacher is managing the learning. However,teacher-directed activities, such as completing worksheets, would be consideredchild-managed because the child is responsible for his or her own learning.
Change in Amount of Instructional ActivitiesOver the School Year
One provocative finding in the Juel and Minden-Cupp (2000) study was that someteachers changed their instructional emphasis over the course of the school year.For example, one teacher began the year with a strong focus on explicit,teacher-managed decoding instruction that tapered off as the year progressed andas children mastered basic skills. In this class, children with weaker fall readingskills (i.e., children in the low reading group) achieved stronger spring decodingscores than did children in the low reading group in other classrooms. Thus, howmuch time the class spends in particular activities at certain times of the school
BEYOND THE READING WARS 309
Do Not
Cop
y

year may be important to consider. In this study, we observed first-grade class-rooms three times during the school year (i.e., fall, winter, and spring). Hence, wewere able to examine the impact of changes in amount of instructional activitiesover the course of the school year.
HYPOTHESIS
This study examined first-grade students’ decoding skill growth and how it was af-fected by classroom instructional practices, the skills with which the children be-gan school, and the interactions between instruction and child characteristics. Wepredicted that children with stronger fall vocabulary or decoding skills wouldachieve stronger decoding skill growth in classrooms that provided morechild-managed implicit decoding instruction and less teacher- managed explicitdecoding instruction. In contrast, we expected children with weaker fall vocabu-lary or decoding scores to achieve stronger decoding skill growth in classroomsthat provided more teacher-managed explicit decoding instruction and lesschild-managed implicit decoding instruction. Finally, we anticipated that changesin amount of different types of decoding instruction over the course of the schoolyear would affect children’s decoding growth.
METHODS
Participants
One hundred eight first-grade children taught by 42 teachers participated in thisstudy as part of a larger longitudinal study of schooling conducted in a large mid-western city. Children who were English proficient and had no identified disabilitywere recruited from schools in the participating school district. Children were re-cruitedover3consecutiveyears,withmostentering thestudyduringYears1and2.
Descriptive information is provided in Table 1. Of the participants in this study,44% of the children were girls, 65% were White, 28% were African American, 3%were Hispanic, 2% were Asian, and 2% belonged to other ethnic groups or werenot identified. Children’s race–ethnicity did not contribute significantly to our out-come in preliminary hierarchical linear models, t(41) = .27, p = .32, and so was notincluded in our final model. Children’s cognitive abilities were assessed at the be-ginning of the study using the Stanford-Binet Intelligence Scale–4th Edition(Thorndike, Hagen, & Sattler, 1986), which provides a full-scale intelligence quo-tient (IQ). On average, this sample demonstrated IQs within normal limits. Further,IQ did not significantly contribute to our outcome in preliminary hierarchical lin-ear models, t(90) = –.44, p = .66, and so was not included in the final model.
310 CONNOR, MORRISON, KATCH
Do Not
Cop
y

Measures
Individual child assessment. Children were assessed using a battery of testsand tasks in the fall and spring of their first-grade year. These tests included the Pea-body Picture Vocabulary Test–Revised (Dunn & Dunn, 1987), which assesses re-ceptive vocabulary (Vocabulary), and the Reading Recognition subtest of the Pea-body Individual Achievement Tests–Revised (Markwardt, 1989), which assessesletter identification, letter-soundcorrespondence,andsinglewordrecognitionskills(Decoding). Raw scores were used for statistical analyses. When reported as gradeequivalents, raw or fitted scores were converted to grade equivalent scores using thetables provided in the examiners’ manual.
Parent questionnaire: Mother’s educational level and home literacy. Par-ents completed questionnaires during their 1st year in the study, which provided de-scriptive information about the family, including mothers’ educational levels, ex-pressed in years. Home literacy environment scores (Home Literacy) were alsobased on the results of parents’responses on a questionnaire. Home Literacy, a com-posite measure that ranged from 3 (low) to 18 (high), was derived from parents’ re-sponses regarding how frequently they used a library card, number of adult and childmagazine subscriptions, number of newspaper subscriptions, how often the familyread together, number of children’s books, hours of television the child watched perweek, and how frequently parents read to themselves (Griffin & Morrison, 1997).Reliability of the measure was adequate (Cronbach’s α = .72). These parent andhome variables were included in the models because of their well-documented asso-ciation with children’s academic and reading success (Snow et al., 1998).
School district, teachers, and classroom observation—Instructionalvariables. As noted previously, all children and teachers were recruited from thesame school district in a large midwestern city. The school district in this study re-
BEYOND THE READING WARS 311
TABLE 1Descriptive Statistics for Student Participants
White/Asian African American Total
M SD M SD M SD
Decoding fall 26.0 13.5 18.8 11.42 23.27 13.14Decoding spring 43.7 15.0 33.0 13.3 39.63 15.22Vocabulary fall 90.6 14.0 73.0 12.2 83.85 15.79Vocabulary spring 99.1 12.0 80.2 13.8 91.91 15.68Home literacy score 14.5 2.1 10.1 3.1 12.93 3.29Mother’s educational level (years) 17.4 2.2 13.2 2.7 15.98 3.10IQ (full-scale standard score) 107.5 13.5 90.9 11.0 101.21 14.95
Note. All reported values are raw scores unless otherwise indicated.
Do Not
Cop
y

ported that they supported a whole-language approach to literacy instruction andencouraged teachers to provide significant amounts of student-initiated readingand writing activities. Teachers were recruited for the study if a target child at-tended their classroom. Classroom instruction was observed over the course of theschool year during three all-day sessions in the fall, winter, and spring (Connor,Morrison, & Griffin, 2002). Trained observers recorded a narrative description ofthe school day and the amount of time spent on specific instructional activities. Re-searchers then coded the activities described in the narratives for type of instruc-tion and length of time the type of activity lasted (in minutes). Descriptions of theactivities are provided in the Appendix. For approximately 10% of the observa-tions, two observers observed the same classroom and independently recorded anarrative of the classroom activities. Agreement was calculated by time and de-scription of activity with the number of minutes the observers were in agreementdivided by minutes in agreement plus minutes where the observers disagreed.Interobserver agreement for the narrative was 95%. Interrater reliability for thecoded activities was calculated in much the same way. The number of minutes thetwo independent raters coded a description using the same activity code divided byagreements plus disagreements. Interrater reliability was 86%. For this study, onlylanguage arts activities were included.
Dimensions of instruction. Instructional activities were coded using the firsttwo dimensions of instruction described previously: explicit versus implicit andteacher-managed versus child-managed (see Table 2). The third dimension, changein amount of instruction over time, is described more fully in the next section.
312 CONNOR, MORRISON, KATCH
TABLE 2Instructional Activities Comprising Each Dimension of Instruction: Teacher-
Versus Child-Managed and Explicit Versus Implicit
Teacher Managed Child Managed
Explicit Alphabet activity SpellingLetter sight–soundInitial consonant strippingWord segmentation
Implicit Vocabulary Student read aloud, individualTeacher read aloud Sustained silent readingStudent read aloud, choral Reading comprehension activityTeacher-managed group writing Student independent writingWriting instruction Student group writingDiscussionConventions of printListening comprehension
Note. Descriptions of activities are provided in the Appendix.
Do Not
Cop
y

Instructional activities were coded as explicit or implicit as they pertained to worddecoding. Hence instructional activities that taught letters, letter-sound association,phonological awareness, spelling, or decoding words were defined as explicit decod-ing instructional activities. Other language arts activities were defined as implicitlyteaching decoding. For example, the opportunity to read independently while explic-itly focusing on fluency implicitly supported children’s decoding skills.
Teacher-managed instruction included those activities in which the teacher wasthe primary director of the children’s attention—for example, teacher and studentdiscussions surrounding a particular book or teacher scaffolding–coaching. Otherteacher-managed activities included teachers reading aloud and direct instructionin letter-sound relations. Child-managed instruction included those instructionalactivities where the student was primarily controlling his or her focus of atten-tion—for example, reading independently (e.g., sustained silent reading) and com-pleting worksheets independently.
Computing classroom variables and change over time. Because weobserved every classroom three times over the course of the school year (therewere no missing classroom observations), variables representing types of instruc-tion were expressed as both the number of minutes for amount of instruction(amount centered at winter observation) as well as change in the amount of instruc-tion over the school year (i.e., slope, which is the third dimension of instruction).Variables were computed using the following method. For each observation, theamount of time, in minutes, spent in each type of instructional activity was com-puted. Using Hierarchical Linear Modeling (HLM; Raudenbush & Bryk, 2002),instructional growth curves for each classroom were modeled at Level 1 usingmonth of the observation centered at the winter evaluation, with the individualclassroom modeled at Level 2. Empirical Bayes residuals were calculated for eachclassroom using the HLM software (Version 5.0). This provided an instructionamount score and an instruction slope score for each classroom teacher based onthe observations in his or her classroom.
Each classroom amount score represents the amount of time in minutes that aparticular teacher spent in one type of activity, which was above or below the fittedmean for all teachers, centered at the winter observation. As an illustration, sup-pose Teacher A’s instruction amount score in teacher-managed explicit (TME) in-struction was 3.4. This means that, on average, she spent 3.4 min more than the av-erage number of minutes teachers in the study spent in this type of instruction,which was 7.4 min. In other words, she spent a total of 10.8 min (7.4 + 3.4) per dayin TME instruction. In contrast, hypothetical Teacher B’s instruction amount scorewas –2.5. This means that she spent 2.5 min less than the average time spent on thistype of instruction compared to the mean of all teachers, or 5.1 min (7.4–2.5) perday. Instruction slope score was calculated in the same way, but using the sloperather than the intercept. Thus, there was a fitted mean slope for all of the class-
BEYOND THE READING WARS 313
Do Not
Cop
y

rooms (fitted slope TME instruction = –.58) and an individual teacher slope score,which represented his or her difference from the mean slope. This procedure wasfollowed for each dimension of instruction variable (see Table 2). These variableswere then used in the final model at Level 2, as described next. To recap, theseamount and slope variables included TME, child-managed explicit (CME),teacher-managed implicit (TMI) and child-managed implicit (CMI).
Analytic Strategy
HLM (Raudenbush & Bryk, 2002) was used to control for the nested nature of thedata: Children nested in classrooms. On average, there were more than two chil-dren per classroom. However three classrooms had as many as six children,whereas a few had only one. Had we used regression instead of HLM, we mighthave overestimated the effect of instruction on children’s outcomes because wewould not have accounted for the shared classroom variance (Raudenbush & Bryk,2002). Child-level variables were entered at Level 1; classroom variables were en-tered at Level 2 (see Equation 1).
Level 1
Yij = β0j + β1j(Mother’s Education)ij + β2j(Home Literacy)ij +β3j(fall Vocabulary)ij + β4j(fall Decoding)ij + rij
Level 2
β0j = γ00 + γ10(Classroom instruction variables)j + u0j
β1j = γ10 + u1j
β2j = γ20
β3j = γ30 + γ31(Classroom instruction variables)j
β4j = γ40 + γ41(Classroom instruction variables)j
Yij, which is the Decoding score for Child i in Class j, is a function of the respec-tive coefficients (β) at Level 1 as they pertain to Mothers’ Educational Levels,Home Literacy, fall Vocabulary, and fall Decoding, as well as a residual (rij). β0j is afunction of the fitted mean for the group of students (γ00) plus the effect of theclassroom instruction variables for Classroom j, plus error (u). γ10 represents theeffect of mother’s education on spring Decoding. γ20 represents the effect of HomeLiteracy environment on spring Decoding score. γ30 represents the effect of fall Vo-cabulary, and γ40 represents the effect of fall Decoding on spring Decoding. γ31 rep-resents the interaction between instruction variables and fall Decoding. γ41 is theinteraction between fall Vocabulary and instruction variables. The error at the level
314 CONNOR, MORRISON, KATCH
Do Not
Cop
y

of the classroom is represented by uj. For all models presented, residuals were as-sumed to be normally distributed with means of zero.
RESULTS
Variation in Classroom Instruction
Results revealedsignificantdifferences inamountandchange(i.e., slope)of instruc-tion type provided in classrooms over the course of the school year. As depicted inTable 3 and Figure 1, overall, teachers provided significant amounts of each type ofinstruction—TME, CME, TMI, and CMI. They also significantly changed theamount of TME, CME, and CMI (but not TMI) instruction they provided over thecourse of the school year. In general, teachers provided more TME and CME at thebeginning of the school year and significantly less as the year progressed (see Figure1), as indicated by significant and negative slope coefficients (see Table 3). In con-trast, teachers increased the overall amount of CMI instruction over the course of theschool year, as demonstrated by the significant positive slope coefficient.
Teachers differed substantially in the total amount of language arts instructionthey provided (i.e., sum of TME, CME, TMI, and CMI) ranging from 5 to 134 min oflanguage arts instruction per day on the actual days observed (M = 63.5, SD = 26.5).Table 3 provides means (centered at the winter observation) and standard deviationsfor each type of instruction calculated using HLM. The length of the school day didnotdifferacrossclassroomsbecauseallof the teachers taughtwithin thesameschooldistrict.
BEYOND THE READING WARS 315
TABLE 3Descriptive Information for Instructional Variables
M SD SELevel 2
Variance (u)Level 1
Variance (r)
Total Language Arts amount 63.50 10.27 NA NA NATME amount 7.43*** 3.53 1.04 24.39*** 69.77TME slope –.82* .58 .32 .83CME amount 4.27*** 2.52 .62 9.61*** 23.49CME slope –.58** .62 .19 .58TMI amount 23.26*** 3.52 1.52 32.29* 211.63TMI slope –.72 1.56 .62 5.40*CMI amount 28.54*** 9.45 2.11 130.12*** 200.20CMI slope 2.26** 1.99 .67 8.61**
Note. Fitted means (in minutes) and slopes (in minutes per month) computed using HierarchicalLinear Modeling. NA = data not applicable; TME = teacher-managed explicit; CME = child-managedexplicit; TMI = teacher-managed implicit; CMI = child-managed implicit.
*p < .05. **p < .01. ***p < .001.
Do Not
Cop
y
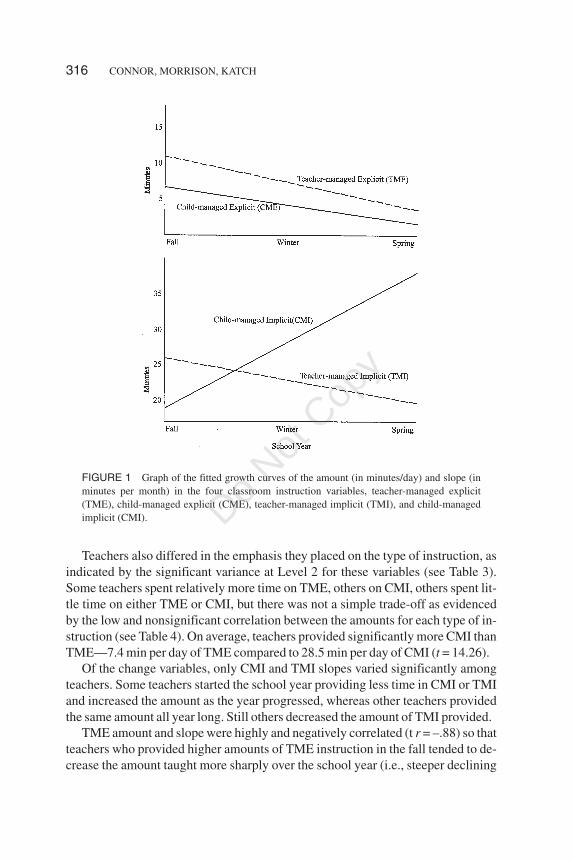
Teachers also differed in the emphasis they placed on the type of instruction, asindicated by the significant variance at Level 2 for these variables (see Table 3).Some teachers spent relatively more time on TME, others on CMI, others spent lit-tle time on either TME or CMI, but there was not a simple trade-off as evidencedby the low and nonsignificant correlation between the amounts for each type of in-struction (see Table 4). On average, teachers provided significantly more CMI thanTME—7.4 min per day of TME compared to 28.5 min per day of CMI (t = 14.26).
Of the change variables, only CMI and TMI slopes varied significantly amongteachers. Some teachers started the school year providing less time in CMI or TMIand increased the amount as the year progressed, whereas other teachers providedthe same amount all year long. Still others decreased the amount of TMI provided.
TME amount and slope were highly and negatively correlated (t r = –.88) so thatteachers who provided higher amounts of TME instruction in the fall tended to de-crease the amount taught more sharply over the school year (i.e., steeper declining
316 CONNOR, MORRISON, KATCH
FIGURE 1 Graph of the fitted growth curves of the amount (in minutes/day) and slope (inminutes per month) in the four classroom instruction variables, teacher-managed explicit(TME), child-managed explicit (CME), teacher-managed implicit (TMI), and child-managedimplicit (CMI). Do
Not C
opy

slopes), whereas teachers who provided smaller amounts of TME in the fall tendedto provide smaller amounts all year long (i.e., flat slope). In contrast, there was noappreciable correlation between CMI instruction amount and slope (r = .27); therewas no prevailing systematic pattern of CMI instruction among teachers over theschool year. Some teachers provided higher or lower amounts of CMI all year long,some provided less as the year progressed, and others provided more.
Classroom Instruction Effects
Overall, classroom instruction had a complex effect on students’ decoding skillgrowth. The results of hierarchical linear modeling are presented in Table 5. Itshould be noted that causal claims are beyond the scope of this study because wedid not experimentally manipulate the type of instruction children received.
All instructional amount variables were included in the model at Level 2 for theintercept (β0) to control for the total amount of language arts instruction provided.As noted previously, the length of the school day was the same for all classrooms,thus our model controlled for the total amount of language arts instruction (vs. otherclassroom activities). In other words, the effect of a particular type of instruction iscontrolling for the amount of all other types of instruction provided. Because all con-tinuous variables were centered at the grand mean, the effect of a particular variableholds all other variables constant at their grand mean for the sample.
CMI slope was included in the model because it varied significantly by class-room. The fall Decoding × TME Amount, Decoding × CMI Amount, and De-coding × CMI Slope interactions were entered into the model at Level 2. The fall
BEYOND THE READING WARS 317
TABLE 4Correlation Between Teacher Variable Amounts and Slopes
TMEa TMEsl TMIa TMIsl CMEa CMEsl CMIa CMIsl
TMEa —TMEsl –.88** —TMIa .062 –.068 —TMIsl –.039 .045 –.99** —CMEa –.047 .069 –.053 .051 —CMEsl .047 –.070 .053 –.051 –.99** —CMIa –.148 .137 –.026 .002 –.131 .131 —CMIsl –.024 .020 .039 –.049 –.217 .217 .270 —totLA .235 –.234 .365* –.378* .084 –.084 .824* .448*
Note. Hierarchical Linear Model Tau r provided for each variable’s intercept/slope correlation.All others are Pearson correlations. a = teacher variable amounts; sl = slopes; TME = teacher-managedexplicit; TMI = teacher-managed implicit; CME = child-managed explicit; CMI = child-managed im-plicit; totLA = total amount of Language Arts instruction.
*p < .05. **p < .01.
Do Not
Cop
y

Vocabulary × TME Amount, Vocabulary × CMI Amount, and Vocabulary × CMISlope interactions were also entered into the model at Level 2.
Results of Hierarchical Linear Modeling
Type of instruction had a significant but complex effect on children’s achievement,which was dependent on children’s fall Vocabulary and Decoding scores (see Ta-ble 5). Overall, this model accounted for approximately 70% of the variance inchildren’s spring reading decoding scores (Level 1 r variance in unconditionalmodel = 231.60). There were significant main effects for children’s fall vocabularyand fall decoding scores. Overall, children who began the school year with highervocabulary and decoding scores tended to achieve higher spring decoding scores.
318 CONNOR, MORRISON, KATCH
TABLE 5Hierarchical Linear Model Results for the Instructional Variables’ Effect onSpring Decoding Scores, Controlling for Mother’s Educational Level andHome Literacy Environment Centered at the Grand Mean of the Sample
Fixed Effects Coefficient SE t-ratio Approximate df
For Intercept β0
Spring decoding, γ00 39.71 .74 53.40 36TME amount, γ01 .06 .21 .30CME amount, γ02 .60 .42 1.42TMI amount, γ03 .20 .26 .77CMI amount, γ04 .03 .11 .25CMI slope, γ05 .52 .44 1.20
MomEd, β1, γ10 .50 .37 1.34 41Litscore, β2, γ20 –.01 .35 –.01 90Fall decoding, β3, γ30 .88 .05 16.86*** 90
TME Amount × Decoding, γ31 –.02 .01 –2.08*CMI Amount × Decoding, γ32 –.002 .01 –.17CMI Slope × Decoding, γ33 .06 .05 1.27
Fall vocabulary, β4, γ40 .14 .07 1.98* 90TME Amount × Vocabulary, γ41 –.002 .01 –.19CMI Amount × Vocabulary, γ42 .02 .01 3.23**CMI Slope × Vocabulary, γ43 –.11 .04 –2.64**
Random Effects Variance df χ2
Intercept, U0 1.0 17 25.51****MomEd, U1 .57 22 33.95*Level 1, r 69.40
Note. Deviance = 758.75. Amount is in minutes/day and change over the course of the schoolyear. Slope is in minutes change per month, centered at the mean. TME = teacher-managed explicit;CME = child-managed explicit; TMI = teacher-=managed implicit; CMI = child-managed implicit;MomEd = mother’s educational level; Litscore = home literacy environment,
*p < .05. **p < .01. ***p < .001. ****p < .10.
Do Not
Cop
y

There were no significant main effects for TME, TMI, CME, or CMI amounts orCMI slope on spring decoding scores (i.e., nonsignificant coefficients γ01, γ02, γ03,γ04, γ05). However, there were significant interactions between type of instructionand fall vocabulary and decoding scores. TME interacted negatively and signifi-cantly with children’s fall decoding score (i.e., coefficient γ31), controlling for theother variables. CMI amount interacted positively and CMI slope interacted nega-tively with children’s fall vocabulary scores (i.e., coefficients γ42 and γ43, respec-tively). These interactions are presented in Figure 2. Mother’s educational leveland home literacy score did not significantly affect spring decoding scores (i.e., co-efficients γ10 and γ20, respectively).
BEYOND THE READING WARS 319
FIGURE 2 Child Skill × Instruction Type interaction effect for spring decoding raw scores.Top: Child fall decoding raw score (25th, 50th, and 75th percentiles of the sample) by TMEamount holding child fall vocabulary raw score constant at the mean for the sample. Middle:Child fall vocabulary raw score (25th, 50th, and 75th percentiles of the sample) by CMI amount.Bottom: CMI slope holding child fall decoding raw score constant at the mean for the sample.
Do Not
Cop
y

The results of our model generally supported our hypotheses. As noted, wefound significant interactions between children’s fall decoding score and TMEamount but not for CMI. The reverse was the case for children’s fall Vocabulary;interactions were significant for CMI amount and CMI slope but not for TME. Wehad expected parallel patterns because of the documented association betweenchildren’s vocabulary and decoding skills (Anderson & Freebody, 1981;Scarborough, 1990). To investigate further, we computed the correlation betweenfall decoding and vocabulary and found it surprisingly low (r = .26, p = .008).
Our model indicated that instructional effects varied with both fall vocabulary anddecodinglevelssimultaneouslyandindependently;plus therewasamaineffect forfallvocabularyandfalldecodingonspringdecodingscores.Thus theassociationbetweenamount of TME and CMI provided and children’s decoding growth, according to ourmodel, was independently affected by both their fall decoding and vocabulary skills.Therefore, we decided to investigate these complex effects further by computing thepatterns of instruction associated with more versus less decoding skill growth for chil-dren with different patterns of fall vocabulary and decoding skill levels.
Because all of the variables in our model were continuous, there was an almostinfinite number of potential child skill patterns and corresponding effects of pat-terns of instruction. To illustrate these interactions, we used our model to computethe effect of these interactions for four distinct child patterns of skills: (a) childrenwith low fall vocabulary and decoding scores, which fell at the 25th percentile ac-cording to published norms (the raw scores representing the respective percentileswere selected using tables provided in the examiners’ manuals); (b) children withhigh fall vocabulary and decoding scores, which fell at the 90th percentile; (c) chil-dren with low fall vocabulary (25th percentile) but high fall decoding (90th percen-tile); and (d) children with high fall vocabulary (90th percentile) but low fall de-coding (25th percentile). The 25th and 90th percentiles were selected because theyfell within the range of the data. Very few children in our sample had scores fallingat the 10th percentile for either decoding or vocabulary. To do this, we used the rawscore that, according to the norms, corresponded with the 25th and 90th percentilefor first-grade students and entered it in to the model to compute the fitted springDecoding outcome scores based on the varying patterns of instruction. These re-sults are presented in Figures 3 through 6 and described next.
Low vocabulary/low decoding skills. For children whose fall vocabularyand decoding scores fell at the 25th percentile for published test norms (n = 12within 1 standard error of measurement [SEM]), the model predicted significantmain effects and interaction effects as displayed in Figure 3. For these children, fit-ted results demonstrated that they achieved greater growth in decoding scores inclassrooms with more TME, whereas they achieved less growth in decoding scoreswith less TME (Figure 3). In addition, the more CMI instruction these children re-
320 CONNOR, MORRISON, KATCH
Do Not
Cop
y

ceived in first grade, the less growth in Decoding they demonstrated. Yet the lessCMI they received, the more growth in decoding they exhibited (Figure 3).
There was also a significant interaction with CMI slope for children with lowfall vocabulary and decoding scores (Figure 3). Fitted results demonstrated thatchildren achieved stronger growth in decoding in classrooms with less CMI in thefall but with increasing amounts through the spring of the school year (i.e., steeppositive slope). In contrast, children achieved less growth in spring decodingscores in classrooms with steady amounts of CMI all year long (i.e., flat slope).Note that CMI amount and CMI slope were independent effects and so these ef-fects were evident for classrooms with either high or low amounts of CMI. Never-theless, fitted results indicated that low amounts of CMI in combination with asteep CMI slope (increasing amounts) was the pattern of instruction associatedwith greater decoding skill growth for these children.
High vocabulary/high decoding. For children whose fall vocabulary anddecoding scores fell at the 90th percentile using published norms (n = 8 within 1SEM plus 8 whose scores fell above the 90th percentiles for vocabulary and decod-ing), a contrasting pattern emerged, as displayed in Figure 4. For these children, fit-
BEYOND THE READING WARS 321
FIGURE 3 Effect of instruction (teacher-managed explicit [TME] and child-managed im-plicit [CMI] amount and slope [CMI change]) on children’s spring decoding raw scores for chil-dren who began the school year with scores falling at the 25th percentile of standardized normsfor fall vocabulary and decoding.
Do Not
Cop
y

ted results revealed virtually no effect for amount of TME on their fall decodingscores (see Figure 4). However, when in classrooms with higher amounts of CMI,these children achieved greater growth in decoding scores by spring, whereas withlower amounts of CMI, they achieved less growth in decoding scores (see Figure 4).Here too, the effect of CMI slope had to be considered. For these children, a steadydose of more CMI all year long (i.e., flat slope) yielded more growth in decoding,whereas a steeper positive slope (i.e., less CMI in the fall increasing over the courseof the school year) yielded less growth in decoding scores (see Figure 4).
Low vocabulary/high decoding. Only one child in our sample demon-strated scores that fit this profile—fall vocabulary scores at the 25th percentile butdecoding scores at the 90th percentile (n = 1 within 1 SEM). Another child demon-strated observed scores that fell above the 90th percentile for decoding and belowthe 25th percentile for vocabulary. Thus, these results should be interpreted cau-tiously. Fitted results indicated that amount of TME had little effect on spring de-coding scores (see Figure 5). Fitted results also demonstrated that when childrenreceived smaller amounts of CMI, they achieved stronger growth in spring decod-ing scores, whereas when they received higher amounts of CMI, they achieved lessgrowth in spring decoding scores (see Figure 5). Further, children receiving in-
322 CONNOR, MORRISON, KATCH
FIGURE 4 Effect of instruction (teacher-managed explicit [TME] and child-managed im-plicit [CMI] amount and slope [CMI change]) on children’s spring decoding raw scores for chil-dren who began the school year with scores falling at the 90th percentile for fall vocabulary anddecoding using standardized norms.
Do Not
Cop
y

creasing amounts of CMI over the school year (i.e., steep positive slope) achievedstronger growth in decoding scores by the spring. However, when they receivedsteady amounts of CMI over the school year (i.e., flat slope) they achieved lessgrowth in decoding scores (see Figure 5).
High vocabulary/low decoding. For children with fall vocabulary scoresfalling at the 90th percentile for published norms but decoding at the 25th percen-tile (n = 10 within 1 SEM), fitted results indicated that children in classrooms withhigher amounts of TME achieved more growth in decoding scores. When theywere in classrooms with lower amounts of TME, children achieved less growth indecoding scores (see Figure 6). Further, with higher amounts of CMI, childrenachieved stronger growth in decoding scores and with lower amounts of CMI, theyachieved less growth (see Figure 6). For these children, a steady amount of CMI allyear long (i.e., flat slope) yielded greater decoding score growth whereas loweramounts in the fall increasing over the school year yielded less growth in decodingscores (see Figure 6).
BEYOND THE READING WARS 323
FIGURE 5 Effect of instruction (teacher-managed explicit [TME] and child-managed im-plicit [CMI] amount and slope [CMI change]) on children’s spring decoding raw scores for chil-dren who began the school year with fall decoding scores falling at the 90th percentile but fallvocabulary falling at the 25th percentile using standardized norms.
Do Not
Cop
y

Cumulative Impact of Instructional Variables:Instruction Associated With Stronger Decoding Growth
The model can be used to elucidate the complex associations between child char-acteristics (i.e., fall vocabulary and decoding) and dimensions of instruction (i.e.,TME amount, CMI amount, and CMI slope) and their combined effect on chil-dren’s spring decoding scores. To this end, we estimated the patterns of instructionassociated with stronger and weaker decoding growth for children in each of thefour patterns of skills (i.e., low vocabulary/low decoding, etc.). Again, because theinstructional variables were continuous, we chose values within the actual range ofour data for amounts of TME and CMI as well as CMI slope—the 10th percentileand 90th percentiles of the sample (see Figures 7–10). Thus, meaningful values forboth child characteristics and types of instruction (amount and slope) were enteredinto our model and the fitted spring decoding scores were computed. Note that al-though we use the term more effective instruction to describe patterns of instruc-tion associated with stronger decoding score growth, we do not intend to implycausality. Moreover, the “causal effect” may go both ways—students respond toinstruction and teachers modify instruction to accommodate the skills of their stu-dents. Addressing these issues is beyond the scope of this study.
324 CONNOR, MORRISON, KATCH
FIGURE 6 Effect of instruction (teacher-managed explicit [TME] and child-managed im-plicit [CMI] amount and slope [CMI change]) on children’s spring Decoding raw scores forchildren who began the school year with fall decoding raw scores falling at the 25th percentileand fall vocabulary raw scores falling at the 90th percentile of standardized norms.
Do Not
Cop
y

For children with low fall vocabulary and decoding scores, the model indicatedthat a more effective pattern of instruction included higher amounts of TME (90thpercentile for our sample) and smaller amounts of CMI (10th percentile for our sam-ple) that increased over the school year (90th percentile for our sample). A less effec-tive pattern of instruction included smaller amounts of TME (10th percentile for oursample) and greater amounts of CMI (90th percentile for our sample) all year long(slope at 10th percentile for our sample). As depicted in Figure 7, two children whostarted first grade with identical decoding scores (½ year below grade level, n = 12withinoneSEM)showeddramaticallydifferent ratesofdecodinggrowthdepending
BEYOND THE READING WARS 325
FIGURE 7 Effects of more and less effective patterns of instruction on spring decoding gradeequivalent score for children who began the school year with low fall vocabulary raw scores(25th percentile standardized norms) and low fall decoding raw scores (25th percentile stan-dardized norms).
FIGURE 8 Effects of more and less effective patterns of instruction on spring decoding gradeequivalent score for children who began the school year with high fall vocabulary (90th percen-tile standardized norms) and high fall decoding scores (90th percentile standardized norms).
Do Not
Cop
y

on whether they received a more or less effective instructional pattern. As can beseen, one child exposed to a more effective instructional regime achieved a decodingscore increase of almost two fitted grade equivalents. In contrast, the other child, re-ceiving a less effective instructional pattern, demonstrated only limited growth indecoding scores or less than half a grade-equivalent. The children’s fitted spring de-coding scores differed by more than two grade-equivalents.
A contrasting pattern of effective instruction was revealed for children who hadhigh fall vocabulary and decoding scores (see Figure 8, n = 8 within 1 SEM). Forthese children, instruction had a smaller effect overall; the difference betweenmore and less effective patterns of instruction on children’s spring decoding scores
326 CONNOR, MORRISON, KATCH
FIGURE 9 Effects of more and less effective patterns of instruction on spring decoding gradeequivalent score for children who began the school year with low fall vocabulary (25th percen-tile standardized norms) and high fall decoding scores (90th percentile standardized norms).
FIGURE 10 Effects of more and less effective patterns of instruction on spring decodinggrade equivalent score for children who began the school year with high fall vocabulary (90thpercentile standardized norms) and low fall decoding scores (25th percentile standardizednorms).
Do Not
Cop
y

was less than half a grade-equivalent and children’s scores improved over theschool year even with the less effective pattern of instruction.
The model predicts substantial differences in achievement for more and less ef-fective patterns of instruction for the other two groups of children (see Figures 9 and10).Moreeffective instruction forchildrenwhohad lowvocabularyandhighdecod-ing scores (n = 2) included lower amounts of TME and higher amounts of CMI allyear long (i.e., flat slope). Contrasting more and less effective patterns of instructionrevealed more than one grade equivalent difference in spring decoding (see Figure9).Forchildrenwhohadhighvocabularyand lowdecodingscores (n=10withinoneSEM), more effective instruction included higher amounts of TME and loweramounts of CMI that increased over the school year (i.e., steep positive slope). Com-paring more and less effective patterns of instruction yielded a fitted grade equiva-lent difference of about one grade (see Figure 10).
DISCUSSION
The results of this study demonstrated that the effects of specific first-grade instruc-tionalpracticesonchildren’sdecodingskillsdepended in largepartonchildren’sen-tering vocabulary and decoding skills. Children came to first grade with varying lan-guageand literacyskills.Classroominstructionalsovaried inamountand includedamixture of code-based and meaning-based activities in differing proportions acrossclassrooms, which were encompassed in three dimensions of instruction (explicitvs. implicit, teacher- vs. child-managed, and change).
Not surprisingly, children with weaker fall decoding skills achieved greater decod-ing skill growth in classrooms with more teacher-managed explicit decoding instruc-tion(i.e.,TME),whereaschildrenwithstrongerdecodingskillsattained lessdecodingskill growth in the same classrooms. Children with stronger vocabularies achievedstrongerdecodingskillgrowthinclassroomswithmanyopportunitiesfor independentreading and writing activities (i.e., CMI) throughout the school year, whereas childrenwith weaker vocabulary skills achieved stronger decoding skills when opportunitiesfor independent reading and writing were kept to a minimum in the fall but were in-creasedas theschoolyearprogressed. It is important tonote that theseeffectsoccurredsimultaneously. Because the correlation between fall vocabulary and decoding wasweak, there were appreciable numbers of children with low decoding and high vocab-ulary skills, as well as a few children with high decoding and low vocabulary, in addi-tion to those with high vocabulary and high decoding, or low vocabulary and low de-coding. Fitted results indicated that depending on children’s decoding and vocabularyskills, different but predictable patterns of instruction were associated with strongerdecodingskillgrowth.Forexample,childrenwith lowfalldecodingskillsandhighfallvocabularyskillsachievedgreaterdecodingskillgrowthinclassroomswithmoretimespent in TME and high amounts of CMI all year long.
BEYOND THE READING WARS 327
Do Not
Cop
y

Dimensions of Instruction
Overall, the coding scheme used in this study proved fruitful in identifying dimen-sions of instruction (explicit vs. implicit, teacher- vs. child-managed, and change inamount over time) that varied among classrooms and that predicted growth in decod-ing. The variables appeared to capture important elements of literacy instructionwithin both code-based and meaning-based philosophies and provided a way toquantify and compare them. In general, the pattern of findings supported aspects ofboth sides in the reading wars, but instructional effects differed for children with dif-fering skills.
It is notable that systematic changes in focus of instruction over the course ofthe school year were apparent for this group of teachers. Overall, teachers focusedmore on directly instructing basic decoding skills (i.e., TME instruction) at the be-ginning of the year but decreased this emphasis as the year progressed and, pre-sumably, as children’s decoding skills improved. This pattern of decreasingamounts of TME over time was consistent among teachers. In contrast, overall,CMI instruction increased in amount over the school year but varied significantlyamong teachers. This suggests that teachers may have been responding to chil-dren’s increasing independence as they learned classroom routines and better man-aged their own learning as the school year progressed.
Two types of instruction, teacher-managed implicit decoding instruction (TMI) andchild-managed explicit decoding instruction (CME), had no significant effect on chil-dren’s decoding skill growth. Overall, in the observed classrooms, there was little lan-guage arts time devoted to CME activities, such as phonics workbooks or alphabetworksheets. Thus this study cannot speak to the effect of such activities on children’sdecoding skill growth. TMI activities, such as discussions about books and teachersreading to the students, did not appear to have a systematic effect on children’s decod-ing skill growth. However, such activities may be important for children’s readingcomprehension growth and emerging attitudes toward reading; more study is needed.
Conceptualizing instructional practices using dimensions of instruction pro-vided flexibility coupled with a fine-grained yet quantifiable view of classroom ac-tivities.Thisallowedus tomodel thecomplex instructionalpatternsobservedaswellas their interaction with child characteristics as they affected child outcomes. Thiswould not have been possible had we defined instruction one-dimensionally. Fur-ther, dimensions of instruction were specific to the outcome of interest. Had readingcomprehension rather than decoding been the outcome of interest, the dimension ofexplicit versus implicit would have changed substantially. Given the high degree ofspecificity observed for schooling effects (Christian et al., 2000) it is reasonable toinfer that explicit decoding instruction would have had an indirect impact on chil-dren’s reading comprehension growth. Rather, instructional activities explicitly fo-cusing on reading comprehension (Palincsar & Brown, 1984; Wixson, 1983) mightbe expected to have a greater effect.
328 CONNOR, MORRISON, KATCH
Do Not
Cop
y

Child Factors
The skills with which children began first grade had a direct and important effecton their decoding skill growth. Overall, the effect of these child factors was greaterthan the effect of classroom instruction practices and directly influenced thestrength of the instruction effects. Classroom instruction had a much greater influ-ence, either positively or negatively, for children who began first grade withweaker vocabulary and decoding skills than it did for children with stronger skills.As can be seen by comparing Figures 7 and 8, the potential difference in decodinggrowth between more and less effective patterns of instruction was about half agrade equivalent for children with high fall vocabulary and decoding skills butmore than two full grade equivalents for children with low fall vocabulary and de-coding skills. Children who began the year with stronger vocabulary and decodingskills achieved some decoding skill growth almost regardless of classroom instruc-tional practices. Strong decoding and vocabulary skills may have acted to offsetthe negative effects of less effective instructional practices and provided a path ofresilience (Werner, 2000) not available for children with weaker skills. Teacher’sinstructional practices had a greater effect—both positive and negative—for thechildren who lacked these apparent protective factors. Children whose decodingskills were below grade level remained below grade level in the face of poorly fit-ting instructional patterns.
The interaction between children’s fall vocabulary and CMI amount and slopeunderscore the association between oral language and reading skills. The relationbetween vocabulary and reading skills has been well documented (Anderson &Freebody, 1981; Scarborough, 1990). However, the interaction between vocabu-lary and CMI instruction is intriguing and deserves further study. We speculate thatstronger vocabulary skills may support children’s implicit decoding learning be-cause they have a greater repertoire of words to rely on when they encounter un-known words. Further, there is a documented association between vocabulary andphonological awareness (Foy & Mann, 2001; Gathercole & Baddeley, 1989;Metsala, 1991). Thus children with strong vocabularies may have greater access tomore effective word-attack strategies (Stanovich, 1980).
Although this study focuses on vocabulary and decoding, there are clearly otherchild characteristics that may influence children’s achievement and interact with in-structional activities, including phonological awareness skills, other oral languageskills, and self-regulation. In addition, the child factors of interest may vary when theliteracy outcome is fluency, comprehension, or writing skills. All merit further study.
Research Implications
From the foregoing discussion, it is evident that at the level of the individual child,instructional activities and patterns that are considered high quality for one child
BEYOND THE READING WARS 329
Do Not
Cop
y

may be considered poor quality for another. Substantial amounts of CMI (or mean-ing-based instruction) for a child with strong vocabulary skills may be associatedwith stronger decoding gains, whereas the same amount of CMI for a child withweaker vocabulary skills may be associated with substantially less progress. On abroader level, our findings suggest that the effort to define and search for “quality”in instructional environments may be somewhat misdirected. By focusing our ef-forts toward identifying those instructional variables that emerge as causally rele-vant in the classroom environment (amount, type, and change) and how they inter-act with child characteristics, we can more accurately identify “high-quality” or,rather, effective instruction for individual children.
This study demonstrated the usefulness of classroom observation and the cod-ing system utilized for quantifying the nature and specificity of instructional ef-fects. Transcription and coding of the classroom observations yielded indices ofthe absolute and proportional amounts of instructional time devoted to various lan-guage arts activities (e.g., word decoding, initial consonant stripping, sustained si-lent reading for language arts) as well as changes in amount provided over theschool year. These continuous multidimensional variables provided a more infor-mative view of classroom instructional activities than would have been availableusing categorical or one-dimensional variables. However, there are clearly otherdimensions of instruction that may be important to consider. For example,teacher-managed instruction may be whole-class, small group, or individual, andour dimensions did not capture this difference. Further, there may be differences inoutcomes for child-managed instruction that encompasses working with peerscompared to children working individually. In addition, there is a documented as-sociation between teacher warmth and responsiveness to their students and studentachievement (deKruif, McWilliam, & Ridley, 2000; Mahoney & Wheeden, 1999).Further, teachers’ ability to manage their classrooms is associated with children’slearning (Brophy & Good, 1986; Taylor et al., 2000). Teacher warmth-responsivityand teacher control-discipline are dimensions that should be studied further.
The interaction between child characteristics and patterns of instruction sug-gests that classroom instruction may be more effectively studied at multiple levelsconsidering both classroom practices and the characteristics of the children in theclassroom. Further, more distal sources of influence, such as school district policyand community expectations, may well affect classroom instruction efficacy. Tay-lor et al. (2000) observed that school policies, atmosphere, beliefs, and reform ef-forts affected what happened in the classroom. This effect was apparent in thisstudy as well. Overall, as noted previously the school district in this study sup-ported a whole-language approach to teaching reading and encouraged teachers toprovide significant amounts of sustained silent reading time for their students. Theeffect was evident when we compared the mean amount of TME provided (7.4 minper day) with the mean amount of CMI provided (28.5 min per day). The ramifica-tion for children who began school with low decoding and vocabulary skills was
330 CONNOR, MORRISON, KATCH
Do Not
Cop
y

that they were less likely to be in classrooms with patterns of instruction that wereeffective for them. However, children with high fall decoding and vocabulary skillswere more likely to be in classrooms that were effective for them. Not surprisingly,the school district had a documented achievement gap that increased as childrenprogressed through school (i.e., a Mathew Effect; Stanovich, 1986).
These results highlight the value of bringing an ecological approach to the studyof children’s development and the multiple sources of influence—proximal, distal,and chronological—that directly and indirectly impact children’s literacy learning(Bronfenbrenner, 1986). Observing and modeling classrooms as complex systemssubject to proximal (children, teachers, and instructional practices) and distalsources of influence (home, school, and community) and changes in these influ-ences over time, may better inform our understanding of instruction and how bestto serve all students.
Implications for Classroom Practice
A central implication of these findings is that appropriate amounts of individual-ized instruction can lead to significant decoding skill growth. Indeed, in other stud-ies of instruction, researchers observed that the most effective teachers providedadditional explicit instruction in basic decoding skills to those children whoneeded it (Wharton-McDonald et al., 1998). The dilemma, of course, is that indi-vidualizing instruction inserts a level of complexity into designing and implement-ing effective classroom practices, especially if teachers’ classrooms include manystudents with very different skill levels. Yet, by understanding which instructionalactivities are most effective in promoting children’s skill growth and in whatamounts over the school year, teachers can become more mindful of the effect oftheir instructional practices. For example, early in the school year, teachers mayask their students with strong vocabulary and decoding skills to read or write inde-pendently (CMI) while they provide explicit decoding instruction (TME) to chil-dren with weaker decoding and vocabulary skills.
Although a thorough discussion of specific classroom strategies is beyond thescope of this article, use of flexible small student groups based on such assessmentsof student abilities may approximate the kind of individualized instruction that willoptimize each child’s learning. Further, there is good evidence that how teachers in-teract with their students affects student achievement (e.g., scaffolding–coachingvs. telling; Taylor et al., 2000). Clearly, to provide individualized instruction, teach-ers need to have some idea of the initial skill level of their students. Here another im-portant educational implication of our findings is that systematic assessment of chil-dren’s ability levels in important language and literacy skills should be a routine partof each year’s classroom practices. Initial assessments during early fall should becomplemented by ongoing testing during the school year to monitor progress and
BEYOND THE READING WARS 331
Do Not
Cop
y

adjust instruction accordingly (Juel & Minden-Cupp, 2000; Rayner et al., 2001;Taylor et al., 2000; Westat, 2001; Wharton-McDonald et al., 1998).
In summary, the results of this study highlight the importance of understandinginteractions between the skills that children bring to school and the instructionalstrategies they encounter in the classroom. These findings indicate that appropri-ately targeted instructional strategies can have a dramatic impact on growth of chil-dren’s early reading skills and their prospects for academic success.
ACKNOWLEDGMENTS
Carol McDonald Connor is now with the College of Education at Florida StateUniversity and the Florida Center for Reading Research. Funding for this studywas provided by the National Institute of Child Health and Human DevelopmentGrant R01 HD27176.
We thank Steve Raudenbush for his consultation regarding the analyses used inthisstudy.Wealso thankSeung-HeeSon,ElizabethGriffin,andmembersof theUni-versity of Michigan and Loyola projects as well as the parents, children, teachers,andschooldistrictpersonnelwithoutwhomthisstudywouldnothavebeenpossible.
REFERENCES
Adams,M.J. (1990).Beginningtoread:Thinkingandlearningaboutprint.Cambridge,MA:MITPress.Anderson, R. C., & Freebody, P. (1981). Vocabulary knowledge. In J. T. Guthrie (Ed.), Comprehension
and teaching: Research reviews (pp. 77–117). Newark, DE: International Reading Association.Bredekemp, S., & Copple, C. (Eds.). (1997). Developmentally appropriate practice in early childhood
programs. Washington, DC: National Association for the Education of Young Children.Bronfenbrenner, U. (1986). Ecology of the family as a context for human development: Research per-
spectives. Developmental Psychology, 22, 723–742.Brophy, J. E., & Good, T. L. (1986). Teacher behavior and student achievement. In M. C. Wittrock
(Ed.), Handbook of research on teaching (3rd ed., pp. 328–375). New York: Macmillan.Catts, H. W., Fey, M. E., Zhang, X., & Tomblin, J. B. (2001). Estimating the risk of future reading diffi-
culties in kindergarten children: A research-based model and its clinical implementation. Language,Speech, and Hearing Services in Schools, 32, 38–50.
Christian, K., Morrison, F. J., Frazier, J., & Masseti, G. (2000). Specificity in the nature and timing ofcognitive growth in kindergarten and first grade. Journal of Cognition and Development, 1, 429–449.
Connor, C. M., Morrison, F. J., & Griffin, E. (2002). Measuring classroom instruction. Unpublishedtechnical report, University of Michigan Pathways to Literacy Project, Ann Arbor, MI. (Availablefrom [email protected])
Cunningham, A., & Stanovich, K. (1997). Early reading acquisition and its relation to reading experi-ence and ability 10 years later. Developmental Psychology, 33, 934–945.
Cunningham, A., Stanovich, K., & West, R. (1994). Literacy environment and the development of chil-dren’s cognitive skills. In E. Assink (Ed.), Literacy acquisition and social context. (pp. 70–90). Lon-don: Wheatsheaf/Prentice Hall.
332 CONNOR, MORRISON, KATCH
Do Not
Cop
y

Cunningham, P., & Hall, D. (1998). The four blocks: A balanced framework for literacy in primaryclassrooms. In K. R. Harris, S. Graham & D. Deshler (Eds.), Teaching every child every day:Learning in diverse schools and classrooms (pp. 32–76). Cambridge, MA: Brookline.
Dahl, K. L., & Freppon, P. A. (1995). A comparison of innercity children’s interpretations of readingand writing instruction in the early grades in skills-based and whole language classrooms. ReadingResearch Quarterly, 30(1), 50–74.
deKruif, R. E. L., McWilliam, R. A., & Ridley, S. M. (2000). Classification of teachers’ interaction be-haviors in early childhood classrooms. Early Childhood Research Quarterly, 15, 247–268.
Dickinson, D. K., & Tabors, P. O. (2001). Beginning literacy with language. Baltimore: Brookes.Dunn, L., & Dunn, L. (1987). Peabody Picture Vocabulary Test–Revised. Circle Pines, MN: American
Guidance Service.Entwisle, D. R., & Alexander, K. L. (1988). Factors affecting achievement test scores and marks of
black and white first graders. The Elementary School Journal, 88, 449–472.Foorman, B. R., Francis, D. J., Fletcher, J. M., Schatschneider, C., & Mehta, P. (1998). The role of in-
struction in learning to read: Preventing reading failure in at risk children. Journal of EducationalPsychology, 90, 37–55.
Foy, J. G., & Mann, V. (2001). Does strength of phonological representations predict phonologicalawareness in preschool children? Applied Psycholinguistics, 22, 301–325.
Gathercole, S. E., & Baddeley, A. D. (1989). Evaluation of the role of phonological STM in the develop-mentofvocabulary inchildren:Alongitudinalstudy.JournalofMemoryandLanguage,28,200–213.
Goodman,K. (1970).Reading:Apsycholinguisticguessinggame. InH.Singer&R.B.Ruddell (Eds.),Theo-reticalmodelsandprocessesofreading(pp.259–272).Newark,DE:InternationalReadingAssociation.
Griffin, E., & Morrison, F. J. (1997). The unique contribution of home literacy environment to differ-ences in early literacy skills. Early Child Development and Care, 127–128, 233–243.
Guthrie, J. T., Schafer, W. D., & Huang, C.-w. (2001). Benefits of opportunity to read and balanced in-struction on the NAEP. Journal of Educational Research, 94(3), 145–162.
Hart, B., & Risley, T. R. (1995). Meaningful differences in the everyday experience of young Americanchildren. Baltimore: Brookes.
Hiebert, E. H., & Raphael, T. E. (1998). Early reading instruction. New York: Harcourt Brace.Juel, C., & Minden-Cupp, C. (1998). Learning to read words: Linguistic units and strategies. Ann Ar-
bor, MI: Center for the Improvement of Early Reading Achievement.Juel, C., & Minden-Cupp, C. (2000). Learning to read words: Linguistic units and instructional strate-
gies. Reading Research Quarterly, 35, 498–492.Locke, J. L. (1993). The child’s path to spoken language. Cambridge, MA: Harvard University Press.Locke, J. (1997). A theory of neurolinguistic development. Brain and Language, 58, 265–326.Mahoney, G., & Wheeden, A. C. (1999). The effect of teacher style on interactive engagement of pre-
school-agedchildrenwithspecial learningneeds.EarlyChildhoodResearchQuarterly,14(1),51–68.Markwardt, F. C. (1989). Peabody Individual Achievement Test–Revised. Circle Pines, MN: American
Guidance Service.Metsala, J. (1991). Young children’s phonological awareness and nonword repetition as a function of
vocabulary development. Journal of Educational Psychology, 91(1), 3–19.Morrison, F., & Cooney, R. (2002). Parenting and academic achievement: Multiple paths to early literacy.
In M. Bristol-Power (Ed.), Parenting and the child’s world: Influences on academic, intellectual, andsocial-emotional development (pp. 141–160). Mahwah, NJ: Lawrence Erlbaum Associates, Inc.
Morrison, F. J., Smith, L., & Dow-Ehrensberger, M. (1995). Education and cognitive development: Anatural experiment. Developmental Psychology, 31, 789–799.
National Assessment of Educational Progress. (2000). U.S. Department of Education. Washington,DC: National Center for Educational Statistics.
Neuman, S. B., & Dickinson, D. K. (2001). Handbook of early literacy research. New York: Guilford.Nippold, M. (Ed.). (1988). Later Language Development. Boston: College Hill.
BEYOND THE READING WARS 333
Do Not
Cop
y

NationalReadingPanel. (2000).Teachingchildren toread:Anevidence-basedassessmentof thescientific lit-erature on reading and its implications for reading instruction (Summary). Washington, DC: Author.
Palincsar, A. S., & Brown, A. L. (1984). Reciprocal teaching of comprehension-fostering and monitor-ing activities. Cognition and Instruction, 1, 117–175.
Pressley,M.(1998).Readinginstructionthatworks:Thecaseforbalancedteaching.NewYork:Guilford.Raudenbush, S. W., & Bryk, A. S. (2002). Hierarchical linear models: Applications and data analysis
methods (2nd ed.). Thousand Oaks, CA: Sage.Ravitch, D. (2001). It is time to stop the war. In T. Loveless (Ed.), The great curriculum debate: How
should we teach reading and math (pp. 210–228). Washington, DC: Brookings Institutional Press.Rayner, K., Foorman, B. R., Perfetti, C. A., Pesetsky, D., & Seidenberg, M. S. (2001). How psychological
science informs the teaching of reading. Psychological Science in the Public Interest, 2(2), 31–74.Scarborough, H. S. (1990). Very early language deficits in dyslexic children. Child Development, 61,
1728–1743.Snow, C. E., Burns, M. S., & Griffin, P. (Eds.). (1998). Preventing reading difficulties in young children.
Washington, DC: National Academy Press.Stanovich, K. E. (1980). Towards an interactive-compensatory model of individual differences in the
development of reading fluency. Reading Research Quarterly, XVI, 32–71.Stanovich, K. E. (1986). Matthew effects in reading: some consequences of individual differences in
the acquisition of literacy. Reading Research Quarterly, 21, 360–407.Sternberg, R. J. (1996). Matching abilities, instruction, and assessment: Reawakening the sleeping gi-
ant of ATI. In I. Dennis (Ed.), Human abilities: Their nature and measurement (pp. 167–181).Hillsdale, NJ: Lawrence Erlbaum Associates, Inc.
Stevenson, H., Parker, T., Wilkinson, A., Hegion, A., & Fish, E. (1976). Longitudinal study of individ-ual differences in cognitive development and scholastic achievement. Journal of Educational Psy-chology, 68, 377–400.
Stipek, D. J., & Ryan, R. H. (1997). Economically disadvantaged preschoolers: Ready to learn but fur-ther to go. Developmental Psychology, 33, 711–723.
Taylor, B. M., Pearson, D. P., Clark, K., & Walpole, S. (2000). Effective schools and accomplishedteachers: lessons about primary-grade reading instruction in low-income schools. The ElementarySchool Journal, 101(2), 121–165.
Thorndike, R. L., Hagen, E. P., & Sattler, J. M. (1986). Stanford-Binet Intelligence Scale (4th ed.). Chi-cago: Riverside.
Torgesen, J. K., Alexander, A. W., Wagner, R. K., Rashotte, C. A., Voelier, K. K. S., & Conway, T.(2001). Intensive remedial instruction for children with severe reading disabilities: Immediate andlong-term outcomes from two instructional approaches. Journal of Learning Disabilities, 34, 33–58.
Werner, E. E. (2000). Protective factors and individual resilience. In J. P. Shonkoff & S. J. Meisels (Eds.),Handbook of early childhood intervention: 2nd edition. New York: Cambridge University Press.
Westat. (2001). The longitudinal evaluation of school change and performance in Title 1 schools: Finalreport (No. 2001–20). Washington, DC: U.S. Department of Education.
Wharton-McDonald, R., Pressley, M., & Hampston, J. M. (1998). Literacy instruction in ninefirst-grade classrooms: Teacher characteristics and student achievement. The Elementary SchoolJournal, 99(2), 101–128.
Wixson, K. K. (1983). Postreading question-answer interactions and children’s learning from text.Journal of Educational Psychology, 30, 413–423.
Manuscript received November 7, 2002Accepted August 22, 2003
334 CONNOR, MORRISON, KATCH
Do Not
Cop
y

APPENDIX
Coding Scheme for Classroom Observations
Language Arts: Time spent (number of minutes) engaged in activities that requirereading,writing,or reading/writing related thingsbut that arenot focusedongaininginformationaboutanothercontentarea(science, social studies,math,drama,etc.).
a. Teacher read aloud: The teacher reads from a picture book, a chapter book,or magazine, etc.; provides a book-on-tape for the children to listen to; orshows a video wherein a story is presented.
b. Student read aloud, individual: A single child reads aloud, in a small groupor whole class, from a picture book, chapter book, magazine, or own writing.
c. Student read aloud, choral: More than one child reads aloud from picturebook, chapter book, magazine, poster, etc.
d. SSR (silent sustained reading): Children sit quietly and read to themselvese. Teacher-managed group writing: The teacher is at blackboard–easel, work-
ing with children on a group writing activity. Children offer the content ofthe written piece but the teacher puts the ideas into complete sentences,with appropriate punctuation, etc.
f. Writing instruction: The teacher tells the children how to do things thatwill help them to become independent writers, such as how to engage in ad-vanced organizing (e.g., webbing, outlining), how to move from outline towritten product, how to proofread, and edit. This also includes instructionin the different forms of writing (expository versus demonstration, etc.).
g. Teacher model writing: The teacher, without input from the children,stands at the blackboard–easel and produces some sort of written product(depending on the level of the students, it could be as small as a sentence).The intent of the writing must be to model the act of writing and an appro-priate product.
h. Student group writing: The children are working in pairs or small groups toproduce a written product (such as a story). Not all of the children will ac-tually be doing the writing, but should be engaged in discussions aboutwhat will be written.
i. Student independent writing: Children are quietly writing a story, poem, orjournal entry by themselves.
j. Spelling: Children are taking a spelling test or copying or practicing spell-ing words.
k. Discussion: Children are reviewing a storyline from a book the teacher hasbeen reading aloud (just prior to the teacher continuing with her reading),or previewing a book the teacher is about to read. Children are respondingto questions that go beyond simple comprehension.
BEYOND THE READING WARS 335
Do Not
Cop
y

l. Reading comprehension activity: Children are completing worksheets re-lated to material they have read, or are writing in response to somethingthey have read.
m. Listening comprehension: Children respond to questions about materialteacher is reading to them presently, such as who is the main character, orwhat just happened.
n. Alphabet activity: Children are engaged in work that focuses their attentionon a particular letter of the alphabet. For example, they might have to makea letter out of clay, color a paper that shows a particular letter and items thatbegin with that letter, or put their body in the shape of a letter.
o. Letter sight–sound: Children are engaged in activities that focus their at-tention on the relationship between written form of individual letters andthe sound those letters represent. Included here are activities such as “signsfor sounds” wherein the teacher orally produces a single letter sound, andthe children circle the letter (from an array of letters on a prepared paper)that represents that sound. This subactivity must combine the written formand oral sounds that represent the written form. If no written form is used,then the activity is more appropriately coded as initial consonant strippingor word segmentation.
p. Initial consonant stripping: Children are identifying the beginning (initial)consonant sound of words, aurally and not visually. If the activity is visualand aural, then code the activity as letter sight–sound. Additionally, if theinitial sound is a vowel and only orally presented, then code the activity asword segmentation.
q. Word segmentation: Children are engaged in activities wherein they breakwords into subcomponents (syllables, sub-syllables or phonemes), orally; orthey are charged with constructing whole words from orally presented wordsegments. Included here are activities such as learning word families (childrenare presented with a rime, and must find onsets that make real words; this is of-ten an oral–written activity, but the initial response is oral). For an activity tobe coded as word segmentation rather than letter sight–sound, the intent of theactivity should be at the word level and not the letter level.
r. Vocabulary: The teacher and/or children are discussing the meaning of aword or a phrase. This is a rarely used code, primarily because word-defi-nition discussions rarely last the minimum 1-min interval.
s. Conventions of print: The children are engaged in activities focused ongrammar or punctuation. Included here are activities such as “Daily OralLanguage” wherein children have to correct the errors in a sentence that theteacher has written on the blackboard.
336 CONNOR, MORRISON, KATCH
Do Not
Cop
y